Post Syndicated from xkcd.com original https://xkcd.com/3207/
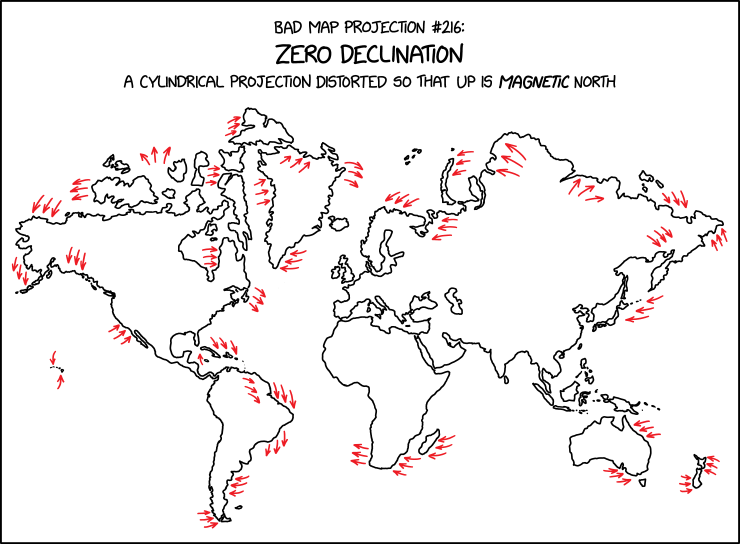
Post Syndicated from xkcd.com original https://xkcd.com/3207/
Post Syndicated from Rakan Kandah original https://aws.amazon.com/blogs/big-data/matching-your-ingestion-strategy-with-your-opensearch-query-patterns/
Choosing the right indexing strategy for your Amazon OpenSearch Service clusters helps deliver low-latency, accurate results while maintaining efficiency. If your access patterns require complex queries, it’s best to re-evaluate your indexing strategy.
In this post, we demonstrate how you can create a custom index analyzer in OpenSearch to implement autocomplete functionality efficiently by using the Edge n-gram tokenizer to match prefix queries without using wildcards.
Index analyzers are used to analyze text fields during ingestion of a document. The analyzer outputs the terms you can use to match queries
By default, OpenSearch indexes your data using the standard index analyzer. The standard index analyzer splits tokens on spaces, converts tokens to lowercase, and removes most punctuation. For some use cases (like log analytics), the standard index analyzer might be all you need.
Let’s look at what the standard index analyzer does. We’ll use the _analyze API to test how the standard index analyzer tokenizes the sentence “Standard Index Analyzer.”
Note: You can run all the commands in this post using OpenSearch DevTools in the OpenSearch Dashboard.
Notice how each word was lowercased and the period (punctuation) was removed.
OpenSearch offers a large number of built in analyzers that you can use for different access patterns. It also lets you build your own custom analyzer, configured for your specific search needs. In the following example, we are going to configure a custom analyzer that returns partial word matches for a list of addresses. The analyzer is specifically designed for autocomplete functionality, enabling end users to quickly find addresses without having to type out (or remember) an entire address. Autocomplete allows OpenSearch to effectively complete the search term based off matched prefixes.
First, create an index called standard_index_test:
Specifying the analyzer as standard is not required because the standard analyzer is the default analyzer.
To test, bulk add some data to our standard_index_test that we created.
Query this data using the text “ope”.
When searching for the term “ope”, we don’t get any matches. To see why, we can dive a little deeper into the standard index analyzer and see how our text is being tokenized. Test the standard index analyzer with the address “456 OpenSearch Drive Anytown, Ny 78910”.
The standard index analyzer has tokenized the address into individual terms: 456, opensearch, drive and so on. That means, unless you search for an individual token (like 456 or opensearch) o, op, ope , and even open won’t yield any results. One option is to use wildcards while still using the standard index analyzer for indexing:
The wildcard query would match “456 OpenSearch Drive Anytown, Ny 78910” but wildcard queries can be resource intensive and slow. Querying for ope* in OpenSearch results in iterating over each term in the index, bypassing optimizations of inverted index lookups. This results in higher memory usage and slower performance. To improve the performance of our query execution and search experience, we can use an index analyzer that better suits our access patterns.
The Edge n-gram tokenizer helps you find partial matches and avoids the use of wildcards by tokenizing prefixes of a single word. For example, the input word coffee is expanded into all its prefixes, c, co , cof, and so on. It can limit the prefixes to those between a minimum (min_gram) and maximum (max_gram) length. So with min_gram=3 and max_gram=5, it will expand “coffee” to cof, coff, and coffe.
Create a new index called custom_index with our own custom index analyzer that uses Edge n-grams. Set the minimum token length (min_gram) to 3 characters, and the maximum token length (max_gram) to 20 characters. The min_gram and max_gram sets the minimum and maximum returned token length respectively. You should select the min_gram and max_gram based off your access patterns. In this example, we’re searching for the term “ope” so we don’t need to set the minimum length to anything less than 3 since we’re not searching for terms like o or op. Setting the min_gram too low can lead to high latency. Likewise, we don’t need to set the maximum length to anything greater than 20 as no individual token will exceed the length of 20. Setting the maximum length to 20 gives us room to spare in case we do eventually ingest an address with a longer token length. Note, the index we are creating here is specifically for autocomplete functionality and is likely unnecessary for a general search index.
In the above code, we created an index called custom_index with a custom analyzer named autocomplete. The analyzer performs the following:
The search analyzer is configured to use the standard analyzer to reduce query processing required at search time. We have already applied our custom analyzer to split the text for us upon ingestion, and we do not need to repeat this process when searching. Test how the custom analyzer analyzes the text Lexington Avenue:
Notice how the tokens are lowercase and now support partial matches. Now that we’ve seen how our analyzer tokenizes our text, bulk add some data:
And test!
You have configured a custom n-gram analyzer to find partial words matches within our list of addresses.
Note, there is a tradeoff between using non-standard index analyzers and writing compute intensive queries. Analyzers can affect indexing throughput and increase the overall index size, especially if used inefficiently. For example, when creating the custom_index, the search analyzer was set to use the standard analyzer. Using n_grams for analysis upon ingestion and search would have impacted cluster performance unnecessarily. Additionally, we set the min_gram and max_gram to values that matched our access patterns, ensuring we didn’t create more n_grams than we needed to for our search use case. This allowed us to gain the benefits of optimizing search without impacting our ingestion throughput.
In this post, we changed how OpenSearch indexed our data to simplify and speed up autocomplete queries. In our case, using the Edge n-grams allowed OpenSearch to match parts of an address and yield precise results without compromising cluster performance with a wildcard query.
It’s always important to test your cluster before deploying in a production environment. Understanding your access patterns is essential to optimizing your cluster from both an indexing and searching perspective. Use the guidelines in this post as a starting point. Confirm your access patterns before creating an index, then begin experimenting with different index analyzers in a test environment to see how they can simplify your queries and improve overall cluster performance. For more reading on general OpenSearch cluster optimization techniques, refer to the Get started with Amazon OpenSearch Service: T-shirt-size your domain post.
Post Syndicated from Rohit Kumar original https://www.servethehome.com/yuanley-aqc113-x1-10gbase-t-marvell-pcie-network-card-review/
In our YuanLey AQC113-X1 10Gbase-T review, we see how this Marvell AQC113-based NIC performs and what it offers
The post YuanLey AQC113-X1 10Gbase-T PCIe Network Card Review appeared first on ServeTheHome.
Post Syndicated from daroc original https://lwn.net/Articles/1056953/
Web sites are being increasingly beset by AI scraperbots — a problem that we have
written about before, and which has slowly
ramped up to an occasional de-facto DDoS attack. This has not gone
uncontested, however: web site operators from around the world have been working on
inventive countermeasures. These solutions target the problem posed by scraperbots in different ways;
iocaine, a MIT-licensed nonsense generator, is designed
to make scraped text less useful by poisoning it with fake data. The hope is to
make running scraperbots not economically viable, and thereby address the
problem at its root instead of playing an eternal game of Whac-A-Mole.
Post Syndicated from corbet original https://lwn.net/Articles/1058041/
Transient devices pose a special challenge for an operating-system kernel.
They can disappear at any time, leaving behind kernel data structures that
no longer refer to an existing device, but which may still be in use by
unknown kernel code. Managing the resulting lifecycle issues has
frustrated kernel developers for years. In September 2025, the revocable resource-management patch series
from Tzung-Bi Shih appeared to offer a partial solution to this problem.
Since then, though, other problems have arisen, and the planned merging of
this series into the 7.0 release has been called off.
Post Syndicated from Katharine Childs original https://www.raspberrypi.org/blog/embodied-machine-learning-from-research-ideas-to-classroom-activities/
Where do great research ideas come from in computer science education? We might think of research breakthroughs as a single moment of genius, but in reality impactful research is often the result of many years of iterative development. In November’s research seminar, we heard from Karl-Emil Kjær Bilstrup, a researcher at the University of Copenhagen, about his work to develop ML-Machine. This work uses embodied learning principles and the BBC micro:bit to introduce learners to machine learning concepts. Findings from this research have been used to develop the micro:bit CreateAI resources, and in this blog, we will explain the research journey from initial small-scale work to educational resources used by many young learners around the world.

In Karl-Emil’s first research study, students used prompt cards to develop ideas for machine learning applications that could solve real-world problems, and to discuss the ethical dilemmas associated with their solutions. Students found it difficult to address these ethical dilemmas in their designs; for example, their ideas often featured a trade-off of user privacy. The findings from this research informed Karl-Emil’s next study, which moved from hypothetical scenarios to implementing machine learning in real-world settings.
The ‘Machine Learning Machine’ study made machine learning processes tangible for students through the use of two physical boxes, shown in the picture below. Students created drawings and fed them into the first box to train a model, and then tested the model by placing new drawings under a camera in the second box and having the model produce predictions of what the drawings showed. For example, students could draw pictures of the sun to represent daytime and the moon to represent nighttime to train a model to predict whether new drawings represented day or night. The machine was built for slow interaction, giving students time to think about the concepts and practices that they were developing. In a follow-up study, a new version of the Machine Learning Machine had been designed, which was controlled using a graphical user interface (GUI). This allowed users to “unbox” and influence parts of the machine learning process. For example, students could adjust the number of complete passes (called ‘epochs’) through the training data to improve the model’s accuracy.

The two studies with the Machine Learning Machines provided many useful findings for teaching about machine learning with K–12 (primary and secondary) learners. However, two constraints remained: firstly, there were limited opportunities for whole-class work because there was only one Machine Learning Machine, and secondly, learning experiences needed to be better connected to examples from students’ daily lives. As a result, the next iteration in Karl-Emil’s research involved using the micro:bit, which ensured access to a tangible device for every student, and a new graphical platform called ML-Machine that students could interact with.
The micro:bit is a small, programmable computing device that features sensors to gather data from the immediate environment. For example, the accelerometer is a motion sensor that can detect when the micro:bit is tilted from left to right, backwards and forwards, and up and down. Using the micro:bit with ML-Machine and some common household objects, students can create simple machine learning models that use data from the micro:bit’s accelerometer to detect whether the micro:bit is moving. This is a very different approach from rule-based programs on the micro:bit, where students might use programming constructs such as if statements to detect movement if the numerical reading from the accelerometer is above a certain value. Here, a machine learning model trained using a set of 20 examples is used to analyse live data readings and produce predictions about whether the micro:bit is moving.
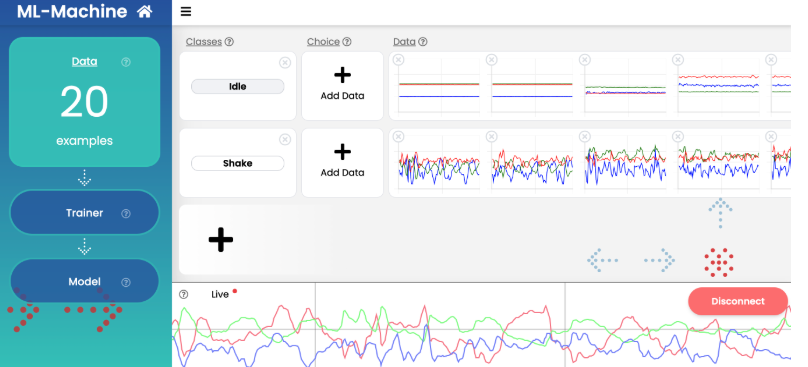
In our seminar, Karl-Emil gave a live demonstration of the ML-Machine toolkit, so we highly recommend watching the recording to see how this toolkit brings machine learning concepts to life.
ML-Machine is the precursor to the micro:bit CreateAI resources, and the software is fully open-source. However, the innovation doesn’t stop there: Karl-Emil also explained that he is currently developing a new tool called math.ml-machine.org, where students can train a neural network and see a visualised k-nearest neighbour model to explore how a model makes predictions. The research journey is continuing, with new possibilities for educational opportunities to teach about machine learning.
The idea of embodied learning is interwoven throughout all of Karl-Emil’s research projects and is a cornerstone of all of his work. Embodied learning suggests that we learn more effectively when our whole body is involved in the learning process, not just our minds. For example, in the work described in this seminar, the Machine Learning Machines and the micro:bit were all tangible devices that students could touch and see.
Embodied learning is particularly important in activities that involve working with data-driven systems. In traditional programming activities, the flow of code can be traced transparently through a program. However, machine learning models are more opaque, and their outputs cannot be traced step by step. Students can benefit from using bodily movements and sensorimotor information to help understand machine learning concepts.
The ML-Machine toolkit was designed to support students to learn through embodied learning in three different ways:

Embodied learning helped students grasp concepts such as data quality. They could see how their bodily movements were being translated into digital data, and could spot when movements that appeared different to them were being classified as similar by the ML-Machine model. One case study participant described that the immediate feedback on screen made the concept of machine learning feel as if it were “coming to life as they [the students] manipulate something themselves and they’ve got control over it”.
Karl-Emil’s work shows how research ideas can be used in the classroom through a cycle of discovery, design, and reflection. From prompt cards exploring ethics to tangible machines and the micro:bit-based ML-Machine, his research shows how embodied learning can make complex ideas like machine learning not only understandable, but deeply engaging for young learners. The micro:bit CreateAI resources are a great example of how research findings can evolve into accessible, hands-on tools that empower educators and students alike. As this work continues to grow, it invites us to imagine new ways for learners to experience machine learning not as abstract theory, but as something they can see, feel, and shape with their own hands.
If you’d like to try out some of the ideas from this seminar, here are some useful resources:
Join us at our next seminar on Tuesday 17 March from 17:00 to 18:30 GMT to hear Rebecca Fiebrink (University of the Arts London speak about teaching AI for creative practitioners. This will be the second seminar in our new series on how to teach about AI across disciplines. We hope to see you there!
To sign up and take part in our research seminars, click below:
You can also view the schedule of our upcoming seminars, and catch up on past seminars on our previous seminars page.
The post Embodied machine learning: From research ideas to classroom activities appeared first on Raspberry Pi Foundation.
Post Syndicated from jzb original https://lwn.net/Articles/1058480/
Reinhard Tartler of Debian’s new DFSG,
Licensing & New Packages Team, or simply “DFSG Team”, has announced
that the team is now operational and is deploying new tooling to
improve the NEW queue experience for Debian developers and
maintainers.
Our primary and immediate goal is simple: get the queue down.
We are currently settling in and refining our processes to ensure
stability and consistency. While our focus right now is on clearing
the backlog, our long-term vision is to enable all Debian Developers
to meaningfully contribute to DFSG reviewing activities, distributing
the workload and knowledge more effectively across the project.
The announcement includes information on the new dashboard for
packages in the NEW queue, the rationale for the new tooling, and
an introduction to the members of the team.
Post Syndicated from jzb original https://lwn.net/Articles/1058478/
Greg Kroah-Hartman has released the 6.12.71 stable kernel. He writes,
“All users of the 6.12 kernel series that had issues with 6.12.69
“
or 6.12.70 should upgrade, as some regressions are fixed
here.
Post Syndicated from jzb original https://lwn.net/Articles/1058473/
Security updates have been issued by AlmaLinux (brotli, git-lfs, image-builder, kernel, keylime, libsoup3, and pcs), Fedora (chromium, gnutls, osslsigncode, and p11-kit), Mageia (golang, libpng, thunderbird, and xrdp), Red Hat (git-lfs, go-toolset:rhel8, golang, golang-github-openprinting-ipp-usb, osbuild-composer, and toolbox), Slackware (gnutls and libpng), SUSE (apptainer, cockpit, cockpit-packages, cockpit-subscriptions, freerdp2, gimp, glib2, go, go1.24, go1.25, gpg2, ImageMagick, java-1_8_0-openjdk, kernel, keylime-config, keylime-ima-policy, lemon, libp11-kit0, libsoup, libsoup-2_4-1, libxml2, libxml2-16, munge, nodejs20, nvidia-modprobe.cuda, nvidia-open-driver-G06-signed, nvidia-persistenced.cuda, openQA, orthanc, gdcm, orthanc-authorization,, python-brotlipy, python-Django, python-maturin, python-pyasn1, python-urllib3, python-wheel, python313-wheel, qemu, rust-keylime, sqlite3, uriparser, wicked2nm, and xrdp), and Ubuntu (libtasn1-6, libwebsockets, libxmltok, linux, linux-aws, linux-gcp, linux-gke, linux-gkeop, linux-hwe-5.15, linux-ibm, linux-ibm-5.15, linux-lowlatency, linux-lowlatency-hwe-5.15, linux, linux-raspi, linux, linux-raspi, linux-realtime, linux-aws, linux-aws-6.8, linux-gcp, linux-gcp-6.8, linux-ibm,
linux-ibm-6.8, linux-lowlatency-hwe-6.8, linux-aws-5.15, linux-gcp-5.15, linux-nvidia-tegra-igx, linux-oracle-5.15,
linux-xilinx-zynqmp, linux-aws-fips, linux-fips, linux-gcp-fips, linux-gcp, linux-gcp-6.8, linux-gcp-fips, linux-intel-iot-realtime, linux-realtime, linux-nvidia-tegra, linux-nvidia-tegra-5.15, linux-realtime-6.8, linux-xilinx-zynqmp, and python-multipart).
Post Syndicated from Netflix Technology Blog original https://netflixtechblog.com/automating-rds-postgres-to-aurora-postgres-migration-261ca045447f
Ram Srivasta Kannan, Wale Akintayo, Jay Bharadwaj, John Crimmins, Shengwei Wang, Zhitaou Zhu
In 2024, the Online Data Stores team at Netflix conducted a comprehensive review of the relational database technologies used across the company. This evaluation examined functionality, performance, and total cost of ownership across our database ecosystem. Based on this analysis, we decided to standardize on Amazon Aurora PostgreSQL as the primary relational database offering for Netflix teams.
Several key factors influenced this decision:
As part of this strategic shift, one of our key initiatives for 2024/2025 was migrating existing users to Aurora PostgreSQL. This effort began with RDS PostgreSQL migrations and will expand to include migrations from other relational systems in subsequent phases.
As a data platform organization, our goal is to make this evolution predictable, well-supported, and minimally disruptive. This allows teams to adopt Aurora PostgreSQL at a pace that aligns with their product and operational roadmaps, while we move toward a unified and scalable relational data platform across the organization.
Migrating a database involves far more than copying rows from one system to another. It is a coordinated process of transitioning both data and database functionality while preserving correctness, availability, and performance. At scale, a well-designed migration must minimize disruption to applications and ensure a clean, deterministic handoff from the old system to the new one.
Most database migrations follow a common set of high-level steps:
Migrating to a new relational database at Netflix scale presents substantial operational challenges. With a fleet approaching 400 PostgreSQL clusters, manually migrating each one is simply not scalable for the data platform team. Such an approach would require a significant amount of time, introduce the risk of human error, and necessitate considerable hands-on engineering effort. Compounding the problem, coordinating downtime across the many interconnected services that depend on each database is extremely cumbersome at this scale.
To address these challenges, we designed a self-service migration workflow that enables service owners to run their own RDS PostgreSQL to Aurora PostgreSQL migrations. The workflow automatically handles orchestration, safety checks, and correctness guarantees end-to-end, resulting in lower operational overhead and a predictable, reliable migration experience.
Minimal User Effort — Since we rely on teams who are not database experts to perform migrations, the process must be simple, intuitive, and fully self-guided.
One of the simplest AWS-recommended approaches for migrating from RDS PostgreSQL to Aurora PostgreSQL is based on snapshots. In this model, write traffic to the source PostgreSQL database is first stopped. A manual snapshot of the RDS PostgreSQL instance is then taken and migrated to Aurora, where AWS converts it into an Aurora-compatible format.
Once the conversion completes, a new Aurora PostgreSQL cluster is created from the snapshot. After the cluster is brought online and validated, application traffic is redirected to the Aurora endpoint, completing the migration.
In the read-replica–based approach, an Aurora PostgreSQL read replica is created from an existing RDS PostgreSQL instance. AWS establishes continuous, asynchronous replication from the RDS source to the Aurora replica, allowing ongoing changes to be streamed in near real time.
Because replication runs continuously, the Aurora replica remains closely synchronized with the source database. This enables teams to provision and validate the Aurora environment — including configuration, connectivity, and performance characteristics — while production traffic continues to flow to the source.
When the replication lag is sufficiently low, write traffic is briefly paused to allow the replica to fully catch up. The Aurora read replica is then promoted to a standalone Aurora PostgreSQL cluster, and application traffic is redirected to the new Aurora endpoint. This approach significantly reduces downtime compared to snapshot-based migrations and is well-suited for production systems that require minimal disruption.
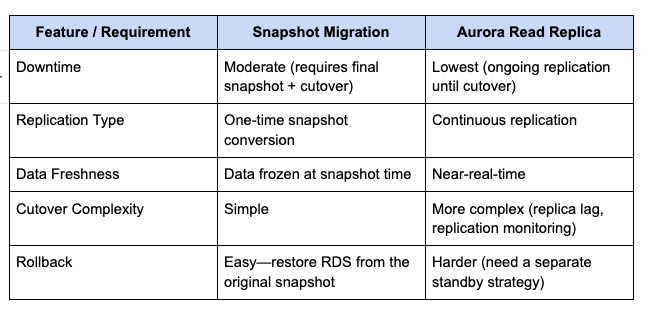
These differences represent the key considerations when choosing a migration strategy from RDS PostgreSQL to Aurora PostgreSQL. For our automation, we opted for the Aurora Read Replica approach, trading increased implementation complexity for a significantly shorter downtime window for client applications.
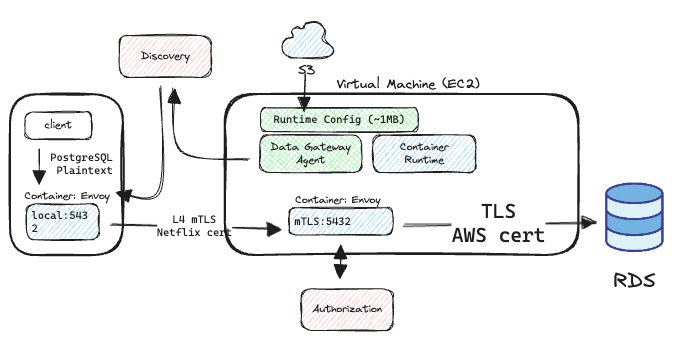
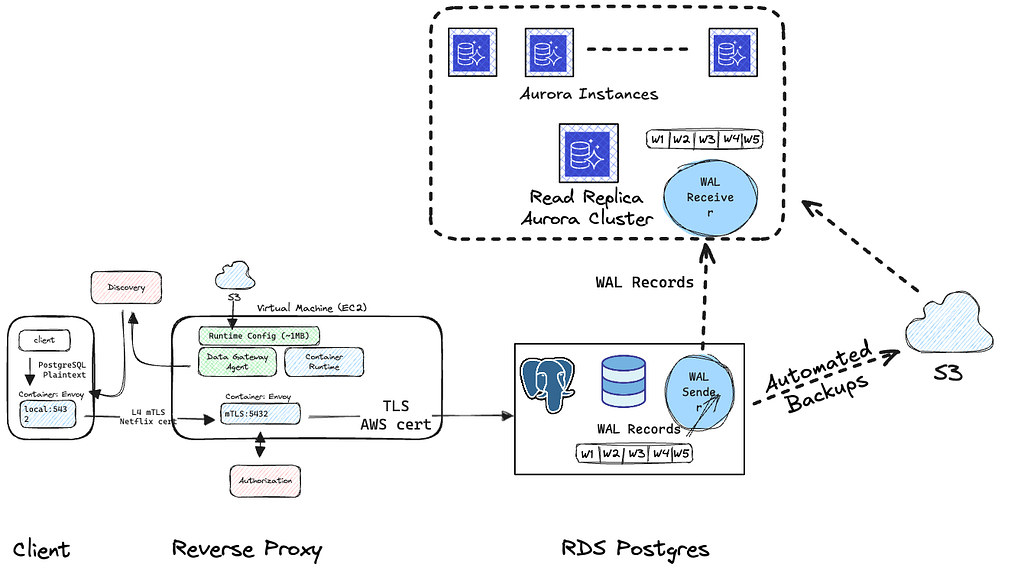
In Netflix’s RDS setup, a Data Access Layer (DAL) sits between applications and backend databases, acting as middleware that centralizes database connectivity, security, and traffic routing on behalf of client applications.
On the client side, applications connect through a forward proxy that manages mutual TLS (mTLS) authentication and establishes a secure tunnel to the Data Gateway service. The Data Gateway, acting as a reverse proxy for database servers, terminates client connections, enforces centralized authentication and authorization, and forwards traffic to the appropriate RDS PostgreSQL instance.
This layered design ensures that applications never handle raw database credentials, provides a consistent and secure access pattern across all datastore types, and delivers isolated, transparent connectivity to managed PostgreSQL clusters. While the primary goal of this architecture is to enforce strong security controls and standardize how applications access external AWS data stores, it also allows backend databases to be switched transparently via configuration, enabling controlled, low-downtime migrations.
The Platform team’s goal is to deliver a fully automated, self-service workflow that helps with the migration of customer RDS PostgreSQL instances to Aurora PostgreSQL clusters. This migration tool orchestrates the entire process — from preparing the source environment, initializing the Aurora read replica, and maintaining continuous synchronization, all the way through to cutover — without requiring any database credentials or manual intervention from the customer.
Designed for minimal downtime and seamless user experience, the workflow ensures full ecosystem parity between RDS and Aurora, preserving performance characteristics and operational behavior while enabling customers to benefit from Aurora’s improved scalability, resilience, and cost efficiency.
Automated backups must be enabled on the source database because the Aurora read replica is initialized from a consistent snapshot of the source and then kept in sync through continuous replication. Automated backups provide the stable snapshot required to bootstrap the replica, along with the continuous streaming of write-ahead log (WAL) records needed to keep the read replica closely synchronized with the source.
We create a dedicated Aurora parameter group for each cluster and migrate all RDS-compatible parameters from the source RDS instance. This ensures that the Aurora cluster inherits the same configuration settings — such as memory configuration, connection limits, query planner behavior, and other PostgreSQL engine parameters that have equivalents in Aurora. Parameters that are unsupported or behave differently in Aurora are either omitted or adjusted according to Aurora best practices.
Creating an Aurora read replica cluster is a critical step in migrating from RDS PostgreSQL to Aurora PostgreSQL. At this stage, the Aurora cluster is created and attached to the RDS PostgreSQL primary as a replica, establishing continuous replication from the source RDS PostgreSQL instance. These Aurora read replicas stay nearly in sync with ongoing changes by streaming write-ahead logs (WAL) from the source, enabling minimal downtime during cutover. The cluster is fully operational for validation and performance testing, but it is not yet writable — RDS remains the authoritative primary.
The goal of the quiescence phase is to transition client applications from the source RDS PostgreSQL instance to the Aurora PostgreSQL cluster as the new primary database, while preserving data consistency during cutover.
The first step in this process is to stop all write traffic to the source RDS PostgreSQL instance to guarantee consistency. To achieve this, we instruct users to halt application-level traffic, which helps prevent issues such as retry storms, queue backlogs, or unnecessary resource consumption when connectivity changes during cutover. This coordination also gives teams time to prepare operationally, for example, by suppressing alerts, notifying downstream consumers, or communicating planned maintenance to their customers.
However, relying solely on application-side controls is unreliable. Operational gaps, misconfigurations, or lingering connections can still modify the source database state, potentially resulting in changes that are not replicated to the destination and leading to data inconsistency or loss. To enforce a clean and deterministic cutover, we also block traffic at the infrastructure layer. This is done by detaching the RDS instance’s security groups to prevent new inbound connections, followed by a reboot of the instance. With security groups removed, no new SQL sessions can be established, and the reboot forcibly terminates any existing connections.
This approach intentionally avoids requiring database credentials or logging into the PostgreSQL server to manually terminate connections. While it may be slower than application- or database-level intervention, it provides a reliably automated and repeatable mechanism to fully quiesce the source RDS PostgreSQL instance before Aurora promotion, eliminating the risk of divergent writes or an inconsistent WAL state.
To determine whether the Aurora read replica has fully caught up with the source RDS PostgreSQL instance, we track replication progress using Aurora’s OldestReplicationSlotLag metric. This metric represents how far the Aurora replica is behind the source in applying write-ahead log (WAL) records.
Once client traffic is halted during quiescence, the source RDS PostgreSQL instance stops producing meaningful WAL entries. At that point, the replication lag should converge to zero, indicating that all WAL records corresponding to real writes have been fully replayed on Aurora.
However, in practice, our experiments show that the metric never settles at a steady zero. Instead, it briefly drops to 0, then quickly returns to 64 MB, repeating this pattern every few minutes as shown in the figure below.
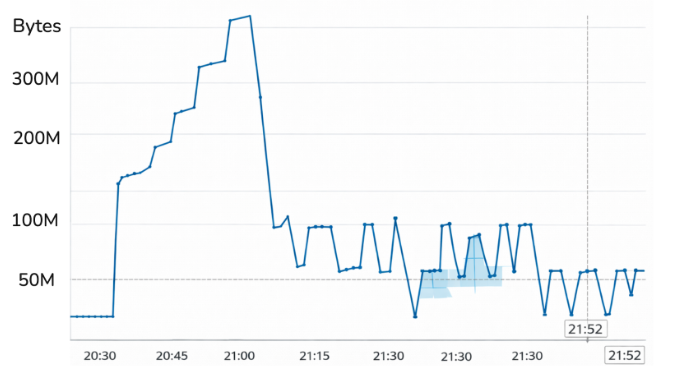
This behavior stems from how OldestReplicationSlotLag is calculated. Internally, the lag is derived using the following query:
SELECT
  slot_name,
  pg_wal_lsn_diff(pg_current_wal_lsn(), restart_lsn) AS slot_lag_bytes
FROM pg_replication_slots;
Conceptually, this translates to:
OldestReplicationSlotLag = current_WAL_position_on_RDS
                           – restart_lsn
See AWS references here and here.
The restart_lsn represents the oldest write-ahead log (WAL) record that PostgreSQL must retain to ensure a replication consumer can safely resume replication.
When PostgreSQL performs a WAL segment switch, Aurora typically catches up almost immediately. At that moment, the restart_lsn briefly matches the source’s current WAL position, causing the reported lag to drop to 0. During idle periods, PostgreSQL performs an empty WAL segment rotation approximately every five minutes, driven by the archive_timeout = 300s setting in the database parameter group.
Immediately afterward, PostgreSQL begins writing to the new WAL segment. Since this new segment has not yet been fully flushed or consumed by Aurora, the WAL position in source RDS PostgreSQL advances ahead of the restart_lsn of Aurora PostgreSQL by exactly one segment. As a result, OldestReplicationSlotLag jumps to 64 MB, which corresponds to the configured WAL segment size at database initialization, and remains there until the next segment switch occurs.
Because idle PostgreSQL performs an empty WAL rotation approximately every five minutes, this zero-then-64 MB oscillation is expected. Importantly, the moment when the lag drops to 0 indicates that all meaningful WAL records have been fully replicated, and the Aurora read replica is fully caught up with the source.
Once the Aurora read replica has fully caught up with the source RDS PostgreSQL instance — as confirmed through replication lag analysis — the final step is to promote the replica and redirect application traffic. Promoting the Aurora read replica converts it into an independent, writable Aurora PostgreSQL cluster with its own writer and reader endpoints. At this point, the source RDS PostgreSQL instance is no longer the authoritative primary and is made inaccessible.
Because Netflix’s RDS ecosystem is fronted by a Data Access Layer (DAL), consisting of client-side forward proxies and a centralized Data Gateway, switching databases does not require application code changes or database credential access. Instead, traffic redirection is handled entirely through configuration updates in the reverse-proxy layer. Specifically, we update the runtime configuration of the Envoy-based Data Gateway to route traffic to the newly promoted Aurora cluster. Once this configuration change propagates, all client-initiated database connections are transparently routed through the DAL to the Aurora writer endpoint, completing the migration without requiring any application changes.
This proxy-level cutover, combined with Aurora promotion, enables a seamless transition for service owners, minimizes downtime, and preserves data consistency throughout the migration process.
One of the critical teams to adopt the RDS PostgreSQL to Aurora PostgreSQL migration workflow was the Enablement Applications team. This team owns a set of databases that model Netflix’s entire ecosystem of partner integrations, including device manufacturers, discovery platforms, and distribution partners. These databases power a suite of enterprise applications that partners worldwide rely on to build, test, certify, and launch Netflix experiences on their devices and services.
Because these databases sit at the center of Netflix’s partner enablement and certification workflows, they are consumed by a diverse set of client applications across both internal and external organizations. Internally, reliability teams use this data to identify streaming failures for specific devices and configurations, supporting quality improvements across the device ecosystem. At the same time, these databases directly serve external partners operating across many regions. Device manufacturers rely on them to configure, test, and certify new hardware, while payment partners use them to set up and launch bundled offerings with Netflix.

Device Lifecycle Management
Netflix works with a wide range of device partners to ensure Netflix streams seamlessly across a diverse ecosystem of consumer devices. A core responsibility of Device Lifecycle Management is to provide tools and workflows that allow partners to develop, test, and certify Netflix integrations on their devices.
As part of the device lifecycle, partners run Netflix-provided test suites against their NRDP implementation. We store signals that represent the current stage for each device in the certification process. This certification data forms the backbone of Netflix’s device enablement program, ensuring that only validated devices can launch Netflix experiences.
Partner Billed Integrations
In addition to device enablement, the same partner metadata is also consumed by Netflix’s Partner Billed Integrations organization. This group enables external partners to offer Netflix as part of bundled subscription and billing experiences.
Any disruption in these databases affects partner integration workflows. If the database is unavailable, partners may be unable to configure or launch service bundles with Netflix. Maintaining high availability and data correctness is essential to preserving smooth integration operations.
The global nature of these workflows makes it difficult to schedule downtime windows. Any disruption would impact partner productivity and risk eroding trust in Netflix’s integration and certification processes.
Given the criticality of the Enablement Applications databases, thorough preparation was essential before initiating the migration. The team invested significant effort upfront to understand traffic patterns, identify all consumers, and establish clear communication channels.
Understand Client Fan-Out and Traffic Patterns
The first step was to gain a complete view of how the databases were being used in production. Using observability tools like CloudWatch metrics, the team analyzed PostgreSQL connection counts, read and write patterns, and overall load characteristics. This helped establish a baseline for normal behavior and ensured there were no unexpected traffic spikes or hidden dependencies that could complicate the migration.
Just as importantly, this baseline gave the Enablement Applications team a rough idea of the post-migration behavior on Aurora. For example, they expected to see a similar number of active database connections and comparable traffic patterns after cutover, making it easier to validate that the migration had preserved operational characteristics.
Identify and Enumerate All Database Consumers
Unlike most databases, where the set of consumers is well known to the owning team, these databases were accessed by a wide range of internal services and external-facing systems that were not fully enumerated upfront. To address this, we leveraged a tool called flowlogs, an eBPF-based network attribution tooling was used to capture TCP flow data to identify the services and applications establishing connections to the database(link).
This approach allowed the team to enumerate active consumers, including those that were not previously documented, ensuring no clients were missed during migration planning.
Establish Dedicated Communication Channels
Once all consumers were identified, a dedicated communication channel was created to provide continuous updates throughout the migration process. This channel was used to share timelines, readiness checks, status updates, and cutover notifications, ensuring that all stakeholders remained aligned and could respond quickly if issues arose.
After completing application-side preparation, the Enablement Applications team initiated the data replication phase of the migration workflow. The automation successfully provisioned the Aurora read replica cluster and ported the RDS PostgreSQL parameter group to a corresponding Aurora parameter group, bringing the destination environment up with equivalent configuration.
However, shortly after replication began, we observed that the OldestReplicationSlotLag metric was unexpectedly high. This was counterintuitive, as Aurora read replicas are designed to remain closely synchronized with the source database by continuously streaming write-ahead logs (WAL).
Further investigation revealed the presence of an inactive logical replication slot on the source RDS PostgreSQL instance. An inactive replication slot can cause elevated OldestReplicationSlotLag because PostgreSQL must retain all WAL records required by the slot’s last known position (restart_lsn), even if no client is actively consuming data from it. Replication slots are intentionally designed to prevent data loss by ensuring that a consumer can resume replication from where it left off. As a result, PostgreSQL will not recycle or delete WAL segments needed by a replication slot until the slot advances. When a slot becomes inactive — such as when a client migration task is stopped or abandoned — the slot’s position no longer moves forward. Meanwhile, the database continues to generate WAL, forcing PostgreSQL to retain increasingly older WAL files. This growing gap between the current WAL position and the slot’s restart_lsn manifests as a high OldestReplicationSlotLag.
Identifying and addressing these inactive replication slots was a critical prerequisite to proceeding safely with the migration and ensuring accurate replication state during cutover.
Successful Migration After Remediation
After identifying the inactive logical replication slot, the team safely cleaned it up on the source RDS PostgreSQL instance and resumed the migration workflow. With the stale slot removed, replication progressed as expected, and the Aurora read replica quickly converged with the source. The migration then proceeded smoothly through the quiescence phase, with no unexpected behavior or replication anomalies observed.
Following promotion, application traffic transitioned seamlessly to the newly writable Aurora PostgreSQL cluster. Through the Data Access Layer, new client connections were automatically routed to Aurora, and observability metrics confirmed healthy behavior — connection counts, read/write patterns, and overall load closely matched pre-migration baselines. From the application and partner perspective, the cutover was transparent, validating both the correctness of the migration workflow and the effectiveness of the preparation steps.
When selecting the target Aurora PostgreSQL instance type for a production migration, our guidance is intentionally conservative. We prioritize stability and performance first, and optimize for cost only after observing real workload behavior on Aurora.
In practice, the recommended approach is to adopt Graviton2-based instances (particularly the r6g family) whenever possible, maintain the same instance family and size where feasible, and — at minimum — preserve the memory footprint of the existing RDS instance.
Unlike RDS PostgreSQL, Aurora does not support the m-series, making a direct family match impossible for those instances. In such cases, simply keeping the same “size” (e.g., 2xlarge → 2xlarge) is not meaningful because the memory profiles differ across families. Instead, we map instances by memory equivalence. For example, an Aurora r6g.xlarge provides a memory footprint comparable to an RDS m5.2xlarge, making it a practical replacement. This memory-aligned strategy offers a safer and more predictable baseline for production migrations.
To achieve minimal downtime during an RDS PostgreSQL → Aurora PostgreSQL migration, we front-load as much work as possible into the preparation phase. By the time we reach cutover, the Aurora read replica is already provisioned and continuously replicating WAL from the source RDS instance. Before initiating downtime, we ensure that the replication lag between Aurora and RDS has stabilized within an acceptable threshold. If the lag is large or fluctuating significantly, forcing a cutover will only inflate downtime.
Downtime begins the moment we remove the security groups from the source RDS instance, blocking all inbound traffic. We then reboot the instance to forcibly terminate existing connections, which typically takes up to a minute. From this point forward, no writes can be performed.
After traffic is halted, the next objective is to verify that Aurora has fully replayed all meaningful WAL records from RDS. We track this using OldestReplicationSlotLag. We first wait for the metric to drop to 0, indicating that Aurora has consumed all WAL with real writes. Under normal idle behavior, PostgreSQL triggers an empty WAL switch every five minutes. After observing one data point at 0, we wait for an additional idle WAL rotation and confirm that the lag oscillates within the expected 0 → 64 MB pattern — signifying that the only remaining WAL segments are empty ones produced during idle time. At this point, we know the Aurora replica is fully caught up and can be safely promoted.
While these validation steps run, we perform the configuration updates on the Envoy reverse proxy in parallel. Once promotion completes and Envoy is restarted with the new runtime configuration, all client-initiated connections begin routing to the Aurora cluster. In practice, the total write-downtime observed across services averages around 10 minutes, dominated largely by the RDS reboot and the idle WAL switch interval.
Optimization: Reducing Idle-Time Wait
For services requiring stricter downtime budgets, waiting the full five minutes for an idle WAL switch can be prohibitively expensive. In such cases, we can force a WAL rotation immediately after traffic is cut off by issuing:
SELECT pg_switch_wal();
Once the switch occurs, OldestReplicationSlotLag will drop to 0 again as Aurora consumes the new (empty) WAL segment. This approach eliminates the need to wait for the default archive_timeout interval, which can significantly reduce overall downtime.
As part of the data platform organization in Netflix, we provide a managed Change Data Capture (CDC) service across a variety of datastores. For PostgreSQL, logical replication slots is the way of implementing change data capture. At Netflix, we build a managed abstraction on top of these replication slots called datamesh to manage customers who are leveraging them (link).
Each logical replication slot tracks a consumer’s position in the write-ahead log (WAL), ensuring that WAL records are retained until the consumer has successfully processed them. This guarantees ordered and reliable delivery of row-level changes to downstream systems. At the same time, it tightly couples the lifecycle of replication slots to database operations, making their management a critical consideration during database migrations.
A key challenge in migrating from RDS PostgreSQL to Aurora PostgreSQL is transitioning these CDC consumers safely — without data loss, stalled replication, or extended downtime — while ensuring that replication slots are correctly managed throughout the cutover process.
Each row-level change in PostgreSQL is emitted as a CDC event with an operation type of INSERT, UPDATE, DELETE, or REFRESH. REFRESH events are generated during backfills by querying the database directly and emitting the current state of rows in chunks. Downstream consumers are designed to be idempotent and eventually consistent, allowing them to safely process retries, replays, and backfills.
Handling Replication Slots During Migration
Before initiating database cutover, we temporarily pause CDC consumption by stopping the infrastructure responsible for consuming from PostgreSQL replication slots and writing into datamesh source. This also drops the replication slot from the database and cleans up our internal state around replication slot offsets. This essentially resets the state of the connector to one of a brand new one.
This step is critical for two reasons. First, it prevents replication slots from blocking WAL recycling during migration. Second, it ensures that no CDC consumers are left pointing at the source database once traffic is quiesced and cutover begins. While CDC consumers are paused, downstream systems temporarily stop receiving new change events, but remain stable. Once CDC consumers are paused, we proceed with stopping other client traffic and executing the RDS-to-Aurora cutover.
Reinitializing CDC After Cutover
After the Aurora PostgreSQL cluster has been promoted and traffic has been redirected, CDC consumers are reconfigured to point to the Aurora endpoint and restarted. Because their previous state was intentionally cleared, consumers initialize as if they are starting fresh.
On startup, new logical replication slots are created on Aurora, and a full backfill is performed by querying the database and emitting REFRESH events for all existing rows. These events let the consumer know that a manual refresh was done from Aurora and to treat this as an upsert operation. This establishes a clean and consistent baseline from which ongoing CDC can resume. Consumers are expected to handle these refresh events correctly as part of normal operation.
By explicitly managing PostgreSQL replication slots as part of the migration workflow, we are able to migrate CDC consumers safely and predictably, without leaving behind stalled slots, retained WAL, or consumers pointing to the wrong database. This approach allows CDC pipelines to be cleanly re-established on Aurora while preserving correctness and operational simplicity.
Pre-quiescence
Rolling back before the pre-quienscence phase is quite easy. Your primary RDS database is still the source. Rolling back before the quiescence phase is straightforward. At this stage, the primary RDS PostgreSQL instance continues to serve as the sole source of truth, and no client traffic has been redirected.
If a rollback is required, the migration can be safely aborted by deleting the newly created Aurora PostgreSQL cluster along with its associated parameter groups. No changes are needed on the application side, and normal operations on RDS PostgreSQL can continue without impact.
During-quiescence
Rolling back during the quiescence phase is more involved. At this point, client traffic to the source RDS PostgreSQL instance has already been stopped by detaching its security groups. To roll back safely, access must first be restored by reattaching the original security groups to the RDS instance, allowing client connections to resume. In addition, any logical replication slots removed during the migration must be recreated so that CDC consumers can continue processing changes from the source database.
Once connectivity and replication slots are restored, the RDS PostgreSQL instance can safely resume its role as the primary source of truth.
Post-quiescence
Rolling back after cutover, once the Aurora PostgreSQL cluster is serving production traffic, is significantly more complex. At this stage, Aurora has become the primary source of truth, and client applications may already have written new data to it.
In this scenario, rollback requires setting up replication in the opposite direction, with Aurora as the source and RDS PostgreSQL as the destination. This can be achieved using a service such as AWS Database Migration Service (DMS). AWS provides detailed guidance for setting up this reverse replication flow, which can be followed to migrate data back to RDS if necessary.
Standardizing and reducing the surface area of data technologies is crucial for any large-scale platform. For the Netflix platform team, this strategy allows us to concentrate engineering effort, deliver deeper value on a smaller set of well-understood systems, and significantly cut the operational overhead of running multiple database technologies that serve similar purposes. Within the relational database ecosystem, Aurora PostgreSQL has become the paved-path datastore — offering strong scalability, resilience, and consistent operational patterns across the fleet.
Migrations of this scale demand solutions that are reliable, low-touch, and minimally disruptive for service owners. Our automated RDS PostgreSQL → Aurora PostgreSQL workflow represents a major step forward, providing predictable cutovers, strong correctness guarantees, and a migration experience that works uniformly across diverse workloads.
As we continue this journey, the Relational Data Platform team is building higher-level abstractions and capabilities on top of Aurora, enabling service owners to focus less on the complexities of database internals and more on delivering product value. More to come — stay tuned.
Special thanks to our other stunning colleagues/customers who contributed to the success of the RDS PostgreSQL to Aurora PostgreSQL migration. Sumanth Pasupuleti, Cole Perez, Ammar Khaku

Automating RDS Postgres to Aurora Postgres Migration was originally published in Netflix TechBlog on Medium, where people are continuing the conversation by highlighting and responding to this story.
Post Syndicated from Celso Martinho original https://blog.cloudflare.com/markdown-for-agents/
The way content and businesses are discovered online is changing rapidly. In the past, traffic originated from traditional search engines, and SEO determined who got found first. Now the traffic is increasingly coming from AI crawlers and agents that demand structured data within the often-unstructured Web that was built for humans.
As a business, to continue to stay ahead, now is the time to consider not just human visitors, or traditional wisdom for SEO-optimization, but start to treat agents as first-class citizens.
Feeding raw HTML to an AI is like paying by the word to read packaging instead of the letter inside. A simple ## About Us on a page in markdown costs roughly 3 tokens; its HTML equivalent – <h2 class="section-title" id="about">About Us</h2> – burns 12-15, and that’s before you account for the <div> wrappers, nav bars, and script tags that pad every real web page and have zero semantic value.
This blog post you’re reading takes 16,180 tokens in HTML and 3,150 tokens when converted to markdown. That’s a 80% reduction in token usage.
Markdown has quickly become the lingua franca for agents and AI systems as a whole. The format’s explicit structure makes it ideal for AI processing, ultimately resulting in better results while minimizing token waste.
The problem is that the Web is made of HTML, not markdown, and page weight has been steadily increasing over the years, making pages hard to parse. For agents, their goal is to filter out all non-essential elements and scan the relevant content.
The conversion of HTML to markdown is now a common step for any AI pipeline. Still, this process is far from ideal: it wastes computation, adds costs and processing complexity, and above all, it may not be how the content creator intended their content to be used in the first place.
What if AI agents could bypass the complexities of intent analysis and document conversion, and instead receive structured markdown directly from the source?
Cloudflare’s network now supports real-time content conversion at the source, for enabled zones using content negotiation headers. Now when AI systems request pages from any website that uses Cloudflare and has Markdown for Agents enabled, they can express the preference for text/markdown in the request. Our network will automatically and efficiently convert the HTML to markdown, when possible, on the fly.
Here’s how it works. To fetch the markdown version of any page from a zone with Markdown for Agents enabled, the client needs to add the Accept negotiation header with text/markdown as one of the options. Cloudflare will detect this, fetch the original HTML version from the origin, and convert it to markdown before serving it to the client.
Here’s a curl example with the Accept negotiation header requesting a page from our developer documentation:
curl https://developers.cloudflare.com/fundamentals/reference/markdown-for-agents/ \
  -H "Accept: text/markdown"
Or if you’re building an AI Agent using Workers, you can use TypeScript:
const r = await fetch(
  `https://developers.cloudflare.com/fundamentals/reference/markdown-for-agents/`,
  {
    headers: {
      Accept: "text/markdown, text/html",
    },
  },
);
const tokenCount = r.headers.get("x-markdown-tokens");
const markdown = await r.text();
We already see some of the most popular coding agents today – like Claude Code and OpenCode – send these accept headers with their requests for content. Now, the response to this request is formatted in markdown. It’s that simple.
HTTP/2 200
date: Wed, 11 Feb 2026 11:44:48 GMT
content-type: text/markdown; charset=utf-8
content-length: 2899
vary: accept
x-markdown-tokens: 725
content-signal: ai-train=yes, search=yes, ai-input=yes

---
title: Markdown for Agents · Cloudflare Agents docs
---

## What is Markdown for Agents

The ability to parse and convert HTML to Markdown has become foundational for AI.
...
Note that we include an x-markdown-tokens header with the converted response that indicates the estimated number of tokens in the markdown document. You can use this value in your flow, for example to calculate the size of a context window or to decide on your chunking strategy.
Here’s a diagram of how it works:

During our last Birthday Week, Cloudflare announced Content Signals — a framework that allows anyone to express their preferences for how their content can be used after it has been accessed.
When you return markdown, you want to make sure your content is being used by the Agent or AI crawler. That’s why Markdown for Agents converted responses include the Content-Signal: ai-train=yes, search=yes, ai-input=yes header signaling that indicates content can be used for AI Training, Search results and AI Input, which includes agentic use. Markdown for Agents will provide options to define custom Content Signal policies in the future.
Check our dedicated Content Signals page for more information on this framework.
We enabled this feature in our Developer Documentation and our Blog, inviting all AI crawlers and agents to consume our content using markdown instead of HTML.
Try it out now by requesting this blog with Accept: text/markdown.
curl https://blog.cloudflare.com/markdown-for-agents/ \
  -H "Accept: text/markdown"
The result is:
---
description: The way content is discovered online is shifting, from traditional search engines to AI agents that need structured data from a Web built for humans. It’s time to consider not just human visitors, but start to treat agents as first-class citizens. Markdown for Agents automatically converts any HTML page requested from our network to markdown.
title: Introducing Markdown for Agents
image: https://blog.cloudflare.com/images/markdown-for-agents.png
---

# Introducing Markdown for Agents

The way content and businesses are discovered online is changing rapidly. In the past, traffic originated from traditional search engines and SEO determined who got found first. Now the traffic is increasingly coming from AI crawlers and agents that demand structured data within the often-unstructured Web that was built for humans.

...If you’re building AI systems that require arbitrary document conversion from outside Cloudflare or Markdown for Agents is not available from the content source, we provide other ways to convert documents to Markdown for your applications:
Workers AI AI.toMarkdown() supports multiple document types, not just HTML, and summarization.
Browser Rendering /markdown REST API supports markdown conversion if you need to render a dynamic page or application in a real browser before converting it.
Anticipating a shift in how AI systems browse the Web, Cloudflare Radar now includes content type insights for AI bot and crawler traffic, both globally on the AI Insights page and in the individual bot information pages.
The new content_type dimension and filter shows the distribution of content types returned to AI agents and crawlers, grouped by MIME type category.

You can also see the requests for markdown filtered by a specific agent or crawler. Here are the requests that return markdown to OAI-Searchbot, the crawler used by OpenAI to power ChatGPT’s search:

This new data will allow us to track the evolution of how AI bots, crawlers, and agents are consuming Web content over time. As always, everything on Radar is freely accessible via the public APIs and the Data Explorer.
To enable Markdown for Agents for your zone, log into the Cloudflare dashboard, select your account, select the zone, look for Quick Actions and toggle the Markdown for Agents button to enable. This feature is available today in Beta at no cost for Pro, Business and Enterprise plans, as well as SSL for SaaS customers.

You can find more information about Markdown for Agents on our Developer Docs. We welcome your feedback as we continue to refine and enhance this feature. We’re curious to see how AI crawlers and agents navigate and adapt to the unstructured nature of the Web as it evolves.
Post Syndicated from Alexandra Blia original https://www.rapid7.com/blog/post/tr-carding-as-a-service-stolen-credit-cards-fraud
Rapid7 software engineer Eliran Alon also contributed to this post.
Despite sustained efforts by the global banking and payments industry, credit card fraud continues to affect consumers and organizations on a large scale. Underground “dump shops” play a central role in this activity, selling stolen credit and debit card data to criminals who use it to conduct unauthorized transactions and broader fraud campaigns. Rather than fading under increased scrutiny, this illicit trade has evolved into a structured, service-like economy that mirrors legitimate online marketplaces in both scale and sophistication.
This evolution has given rise to what can be described as carding-as-a-service (CaaS): a resilient underground market that wraps together stolen payment card data, tools, and support into easily accessible offerings. These stolen credit cards are also often bundled with sensitive personal information, substantially elevating the potential damage to both individuals and organizations, and making the financial loss the least harmful consequence.
While numerous dump shops have been disrupted or shut down over time, several high-profile marketplaces, including Findsome, UltimateShop, and Brian’s Club, continue to shape the market and influence criminal activity. This blog explores these illegal marketplaces and their operations, shedding light on the modern carding economy and highlighting why stronger detection and prevention efforts remain critical.
Credit card information available on the black market is generally categorized into three types: credit card numbers, dumps, and ‘fullz’.
Credit card numbers (also known as “CVV”) minimally include the data printed on the card: the credit card number itself, cardholder name, expiration date, and the CCV2 security code (found on the back, not to be confused with CVV). This group may also include the associated billing address and phone number.
Dumps consist of the raw data from the magnetic stripe tracks. This information is essential for cloning physical credit cards.
Fullz offers a more complete profile of the cardholder, containing additional personal information such as the date of birth or Social Security Number (SSN).
The exact origin of the information available on the different marketplaces is unclear and is being obfuscated by the admins and resellers; however, further investigation across different cybercrime forums revealed the common methods through which cards get leaked.
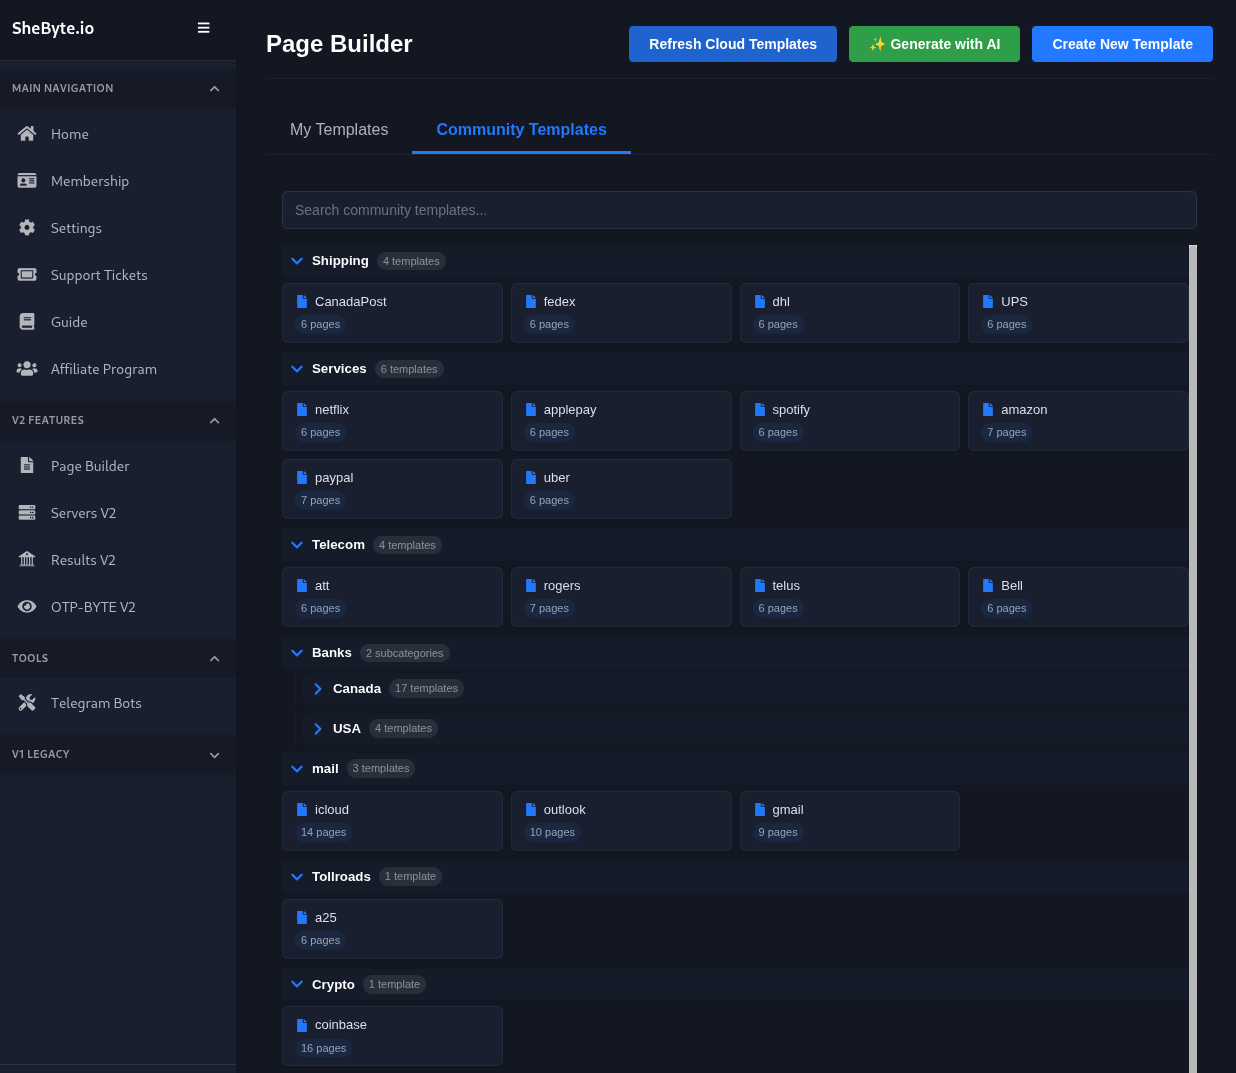
Technological improvements have made phishing campaigns much easier to execute. Today, there are phishing-as-a-service (PhaaS) platforms and fraud-as-a-service (FaaS) modules allowing easy setup for new phishing campaigns, along with the infrastructure, page design, and even the collection of credentials or other stolen information (Figure 1). Phishing pages, tricking customers into providing personal financial information (PFI), are still an efficient source for stolen credit information.
⠀
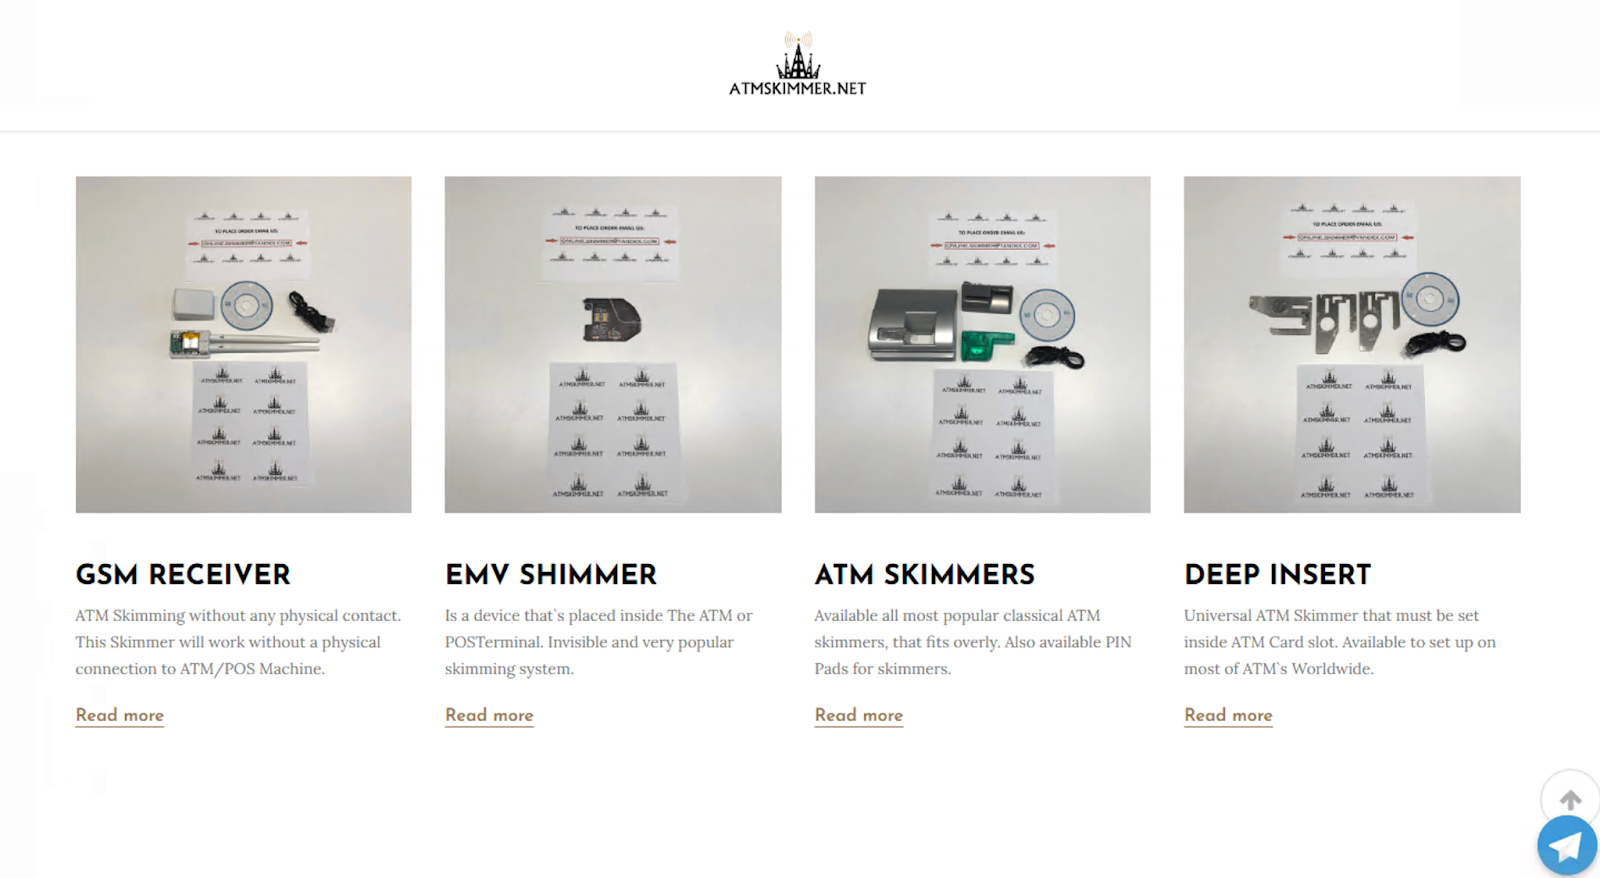
Physical hacking tools, and other devices that could be attached to different payment devices or ATMs, are used to transmit information into the hands of a malicious actor. Different specialized stores offer to sell such devices and ship them, once again allowing even a novice to start stealing credit information for future use. Threat actors attempt to stay as up-to-date as possible, adjusting themselves to industry trends. These include “Shimming,” which focuses on modern EMV chips, instead of old “Skimming” devices, which require scanning the entire card (Figure 2). The hacking tools target not only ATMs, but also additional devices with daily credit card use, including gas pumps and point-of-sale (POS) machines.
⠀
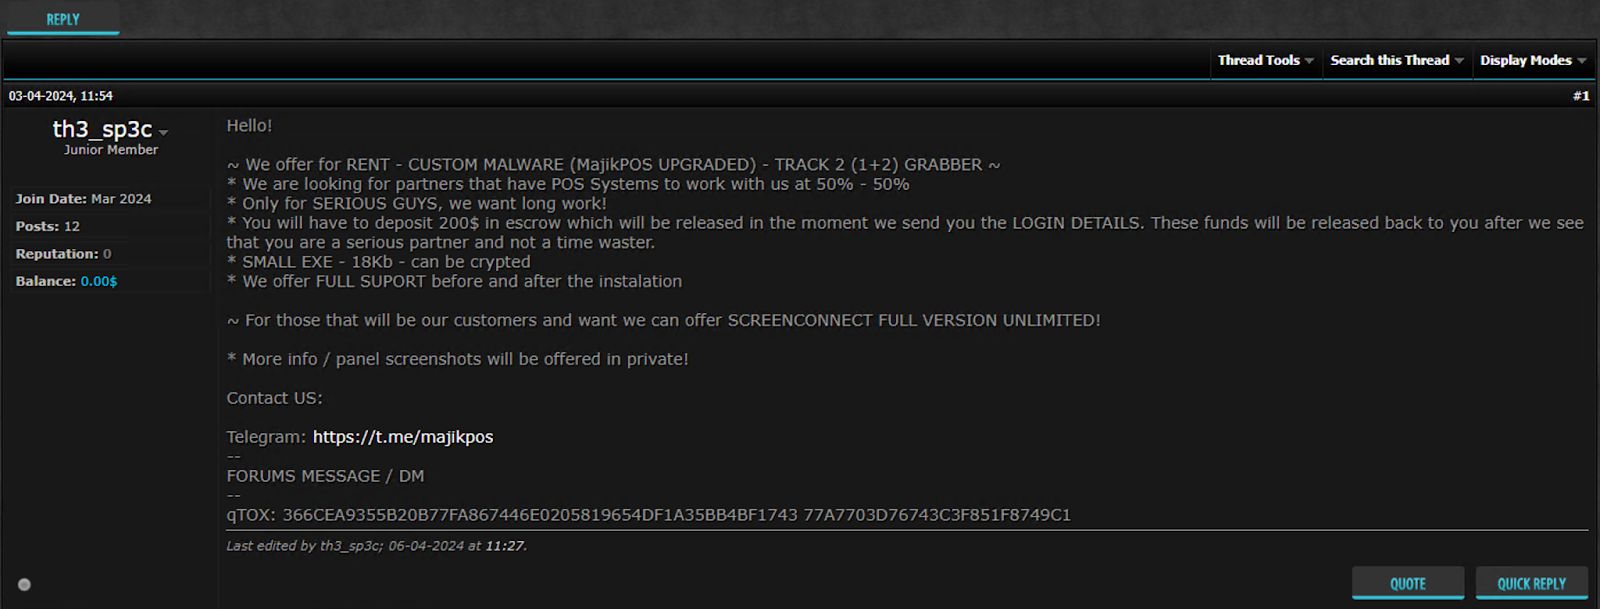
Since the large-scale Target breach in 2013, which resulted in the compromise of millions of credit card records, threat actors have steadily evolved point-of-sale (POS) malware variants such as BlackPOS and MajikPOS (Figure 3). In parallel, the widespread adoption of information-stealing malware (“infostealers”) has enabled attackers to harvest credit card data from a broad range of systems, typically alongside additional personally identifiable information (PII) and user credentials.
⠀
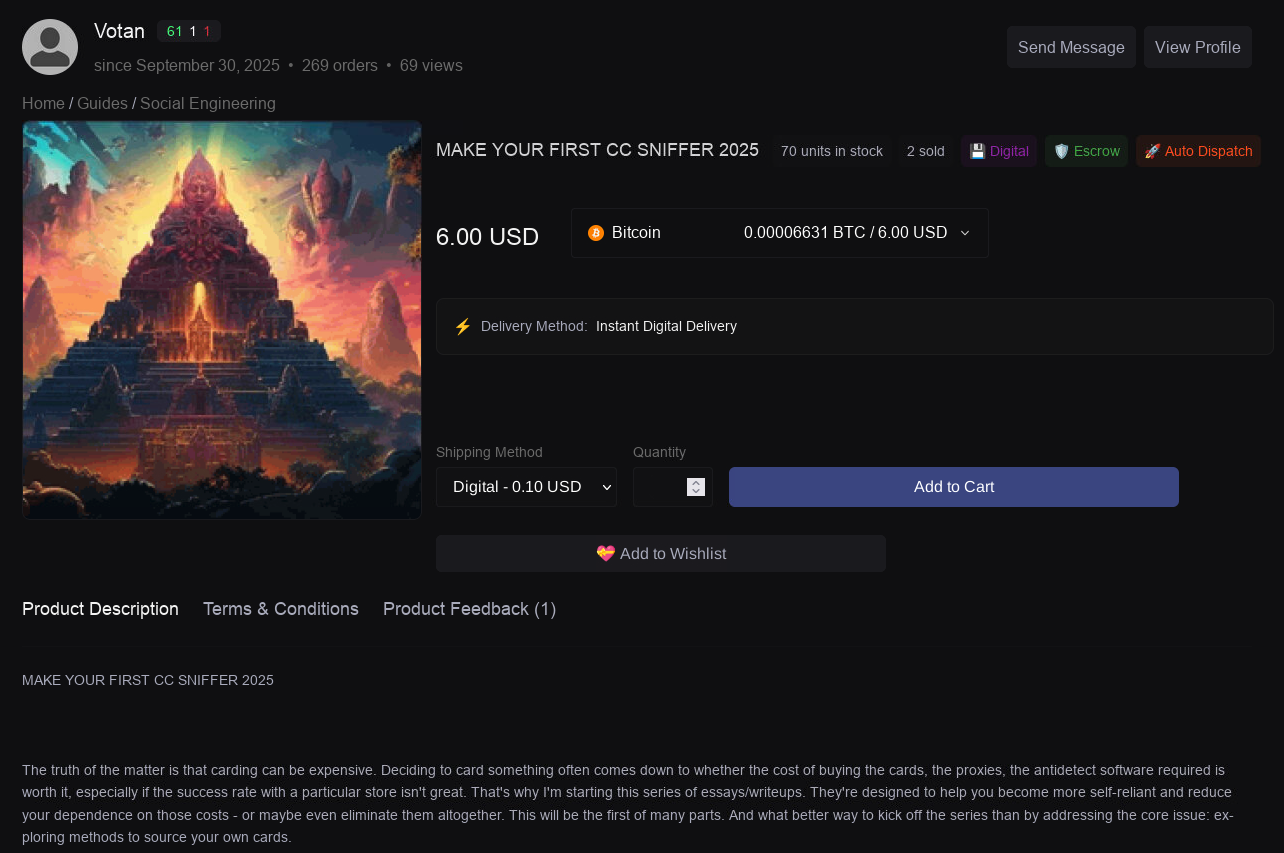
Many posts found on different cybercrime forums provide carders with tips about how to exploit web security flaws. In some cases, there are actual examples and guides, including code samples for conducting XSS, i.e., redirecting network traffic into the threat actor’s hands through an injected code (usually JavaScript). Malicious actors inject the “sniffer” in the payment page itself, which later copies the inserted payment information and transfers it to them for future use (Figure 4).
⠀
Through ongoing changes within the carding ecosystem and the developments made in fraud detection and prevention, the industry of stolen credit card trading continues to flourish. Banks and credit card companies might be fairly good at monitoring individual transactions, but not at disrupting the broader fraud supply chain. CaaS exploits gaps between payment security, identity security, and organizational visibility, monetizing stolen data upstream before fraud ever reaches issuer models. In addition, fraudsters feed on the ever-lasting weakness of the human factor, acting carelessly with personal information and ignoring security warnings.
These factors, in conjunction with constant market demand, have kept several carding marketplaces, led by Findsome, UltimateShop, and Brian’s Club, in action for a lengthy period. While the design and branding of these marketplaces differ, their core offerings and functionality are largely similar. As a result, their administrators frequently promote their services across dedicated carding marketplaces and broader cybercrime communities.
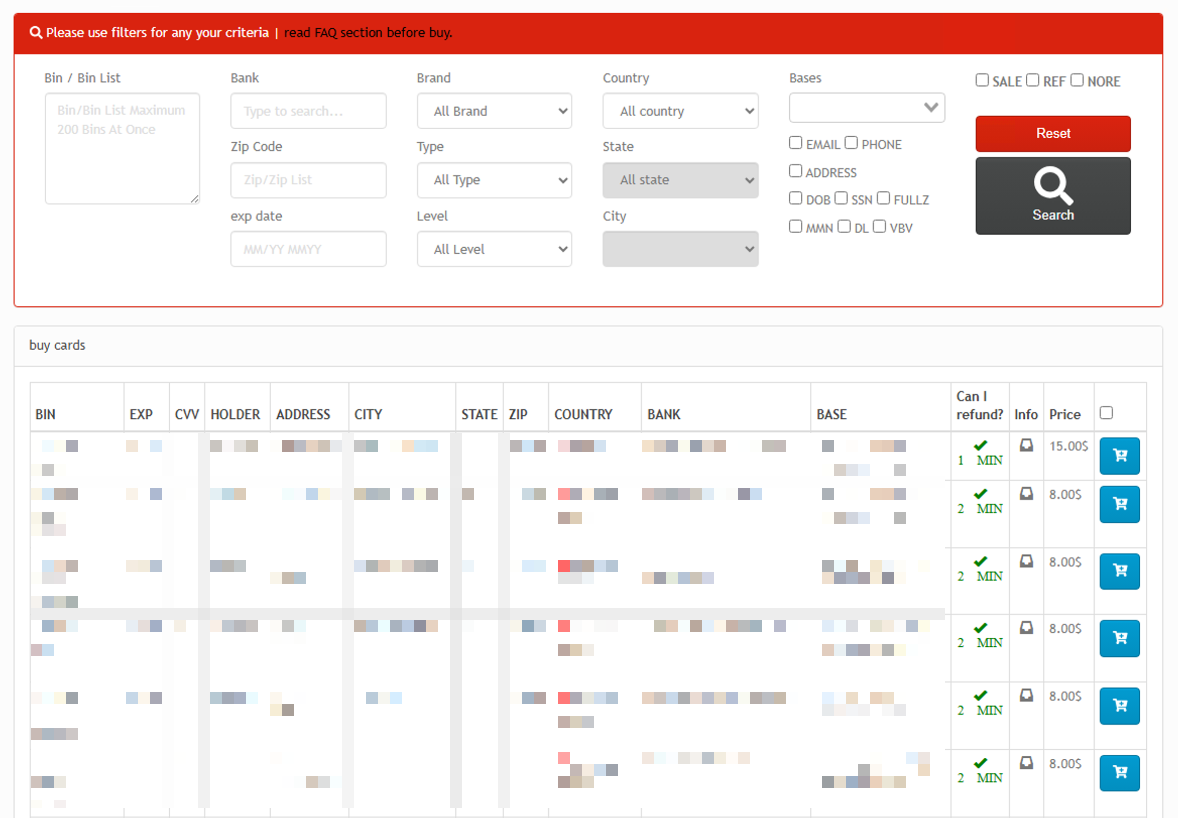
The main interface of these marketplaces features a streamlined search function that allows users to filter available listings using several parameters, including Bank Identification Number (BIN), country, and “base” – a collection of card records linked to the same issuing bank, card brand (e.g., Visa or Mastercard), and card type, typically compromised within a similar time frame. Filtering options vary slightly between platforms and may include additional criteria such as price range or the availability of supplemental PII, including SSNs.
Search results generally display the card’s expiration date, issuing bank, cardholder name, and approximate geographic location. Each listing also indicates its price and whether it is eligible for a refund. Refund functionality is a critical feature in the carding ecosystem, as it enables buyers to recover funds for cards that later prove invalid. This capability often serves as a differentiating factor between marketplaces, as user complaints on carding marketplaces frequently center on invalid cards, denied refunds, or the resale of outdated card data.
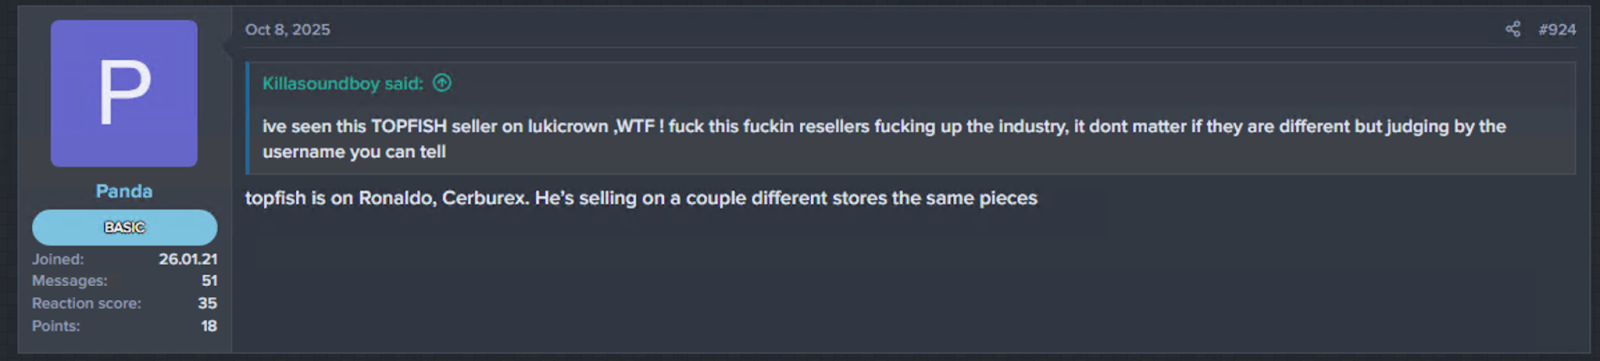
These carding marketplaces do not disclose the sources of their stolen credit card data and appear to rely primarily on third-party vendors offering previously compromised records. This suggests that they operate as aggregators, reselling data obtained from multiple external suppliers after conducting their own quality assessments. While this model enables platforms to increase both the volume and diversity of their listings, it can also lead to inconsistencies in data quality. Additionally, some resellers appear to offer identical datasets across multiple marketplaces to maximize profits, resulting in overlapping bases between platforms (Figure 5).
⠀
⠀
All three marketplaces support Bitcoin payments, while Findsome is currently the only platform that accepts additional cryptocurrencies, including Litecoin and Zcash. Minimum deposit requirements are generally low, ranging from $0 on UltimateShop to $20 on Brian’s Club, likely to reduce barriers to entry and attract new users. In parallel, Findsome and UltimateShop offer deposit bonuses, typically between 5% and 12%, to incentivize larger payments and encourage long-term user engagement.
These marketplaces are hosted on the dark web, with mirrored versions accessible via the surface web. To mitigate the risk of takedowns or law enforcement action, administrators frequently rotate their surface-web domains. This practice has likely contributed to the proliferation of fraudulent domains impersonating legitimate marketplaces, such as findsome[.]ink and findsomes[.]ru for Findsome, and ultimateshops[.]to for UltimateShop. These sites are designed to leverage brand recognition to deceive users and steal funds. In response, the marketplaces publish lists of their official domains and warn users about potential scams in an effort to maintain trust and protect their reputations.
Findsome is a deep and dark web carding marketplace that has reportedly been active since 2019. The platform, whose administrators are likely of Russian origin, appears to specialize in the sale of stolen CVV, as well as Fullz. Listings are typically priced between $4 and $25 per record, depending on the perceived “quality” of the data.
Under its “Shop” tab, Findsome enables users to browse and filter available credit card listings of interest (Figure 6). Each listing specifies whether a refund is available should the card prove to be invalid, along with a defined “check time.” The check time refers to a limited window following purchase during which the buyer may attempt to verify the card’s validity and request a refund if necessary.
⠀
⠀
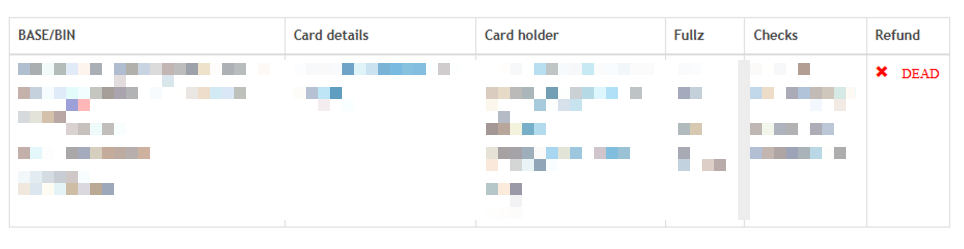
During the designated check-time window, users may attempt to validate the purchased record. The marketplace claims to integrate third-party checker services, such as Luxchecker, which it describes as commonly used across comparable platforms. If the validation process indicates that the card is not valid, a refund is reportedly issued (Figure 7).
⠀
⠀
Actors associated with the marketplace have been observed seeking “resellers” offering large bases on cybercrime forums (Figure 8). Although Findsome does not explicitly disclose information about its resellers, their aliases appear to be embedded in the naming conventions of the databases. For instance, a database titled “NOV 23 _#(KOJO***) GOOD US JP SE” suggests that it was supplied by a reseller operating under the alias “KOJO***.”
⠀

⠀
An analysis of the databases published during the second half of 2025 identified the five most frequent resellers in that period (Table 1). These resellers largely dominated Findsome’s inventory, collectively accounting for more than 50% of its offerings. Overall, 51 resellers were active on the platform during this timeframe, with an average market share of approximately 2% per reseller. This distribution suggests that Findsome relies on a broad network of resellers, likely to diversify its listings and reduce dependence on a small number of dominant suppliers.
⠀
|
Reseller |
Records |
Share |
|
tian***** |
303,818 |
13% |
|
vygg******* |
266,382 |
11% |
|
mapk** |
231,797 |
10% |
|
atla**** |
231,757 |
10% |
|
find***** |
217,846 |
9% |
Table 1 – Reseller market share
⠀
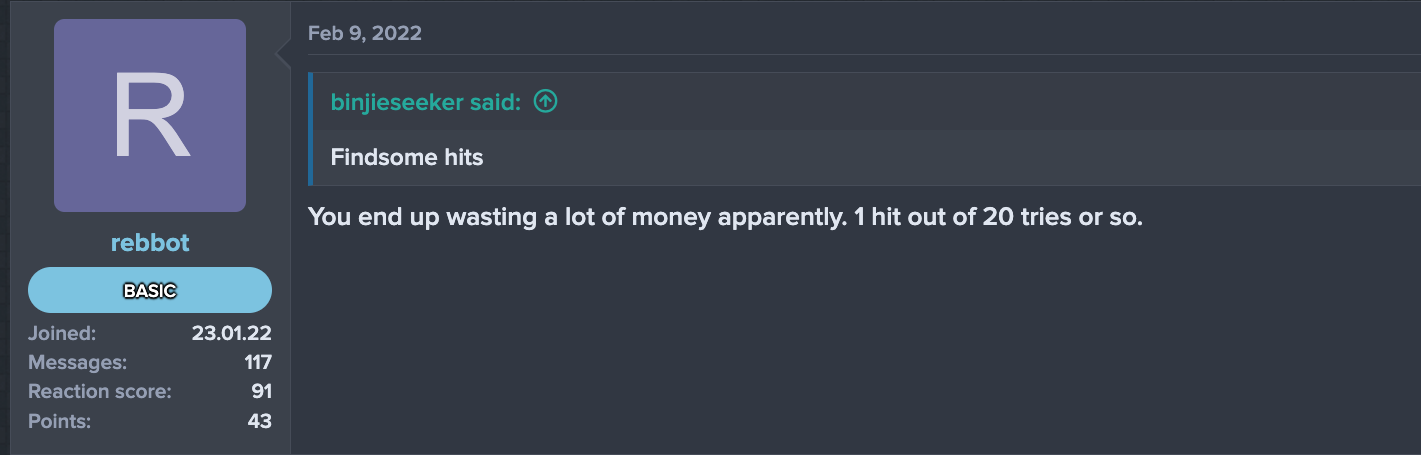
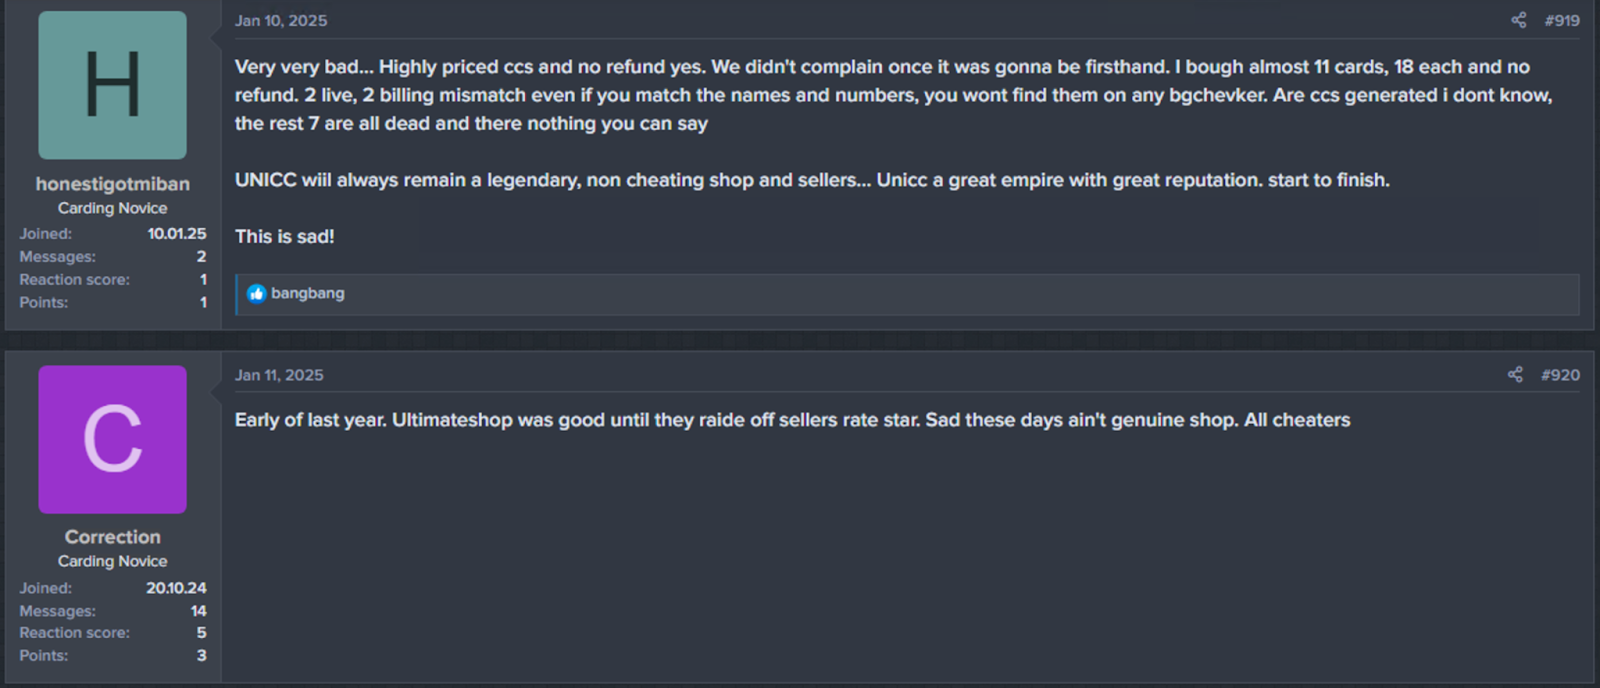
Despite its prominence, Findsome appears to face competition from smaller, emerging platforms. While it is sometimes described within cybercrime communities as relatively “reliable,” discussions on underground forums reveal dissatisfaction with its pricing model. Some actors have criticized the marketplace for charging high prices for data that is frequently invalid (Figure 9), while others view the $100 account activation fee for new users as a significant barrier to entry.
⠀
UltimateShop is a deep and dark web carding marketplace that has been active since at least 2022. Its administrators appear to be of Russian origin and offer mainly CVV and Fullz. The stolen credit cards are priced between $10 and $30 per record, depending on the assessed “quality” of the data.
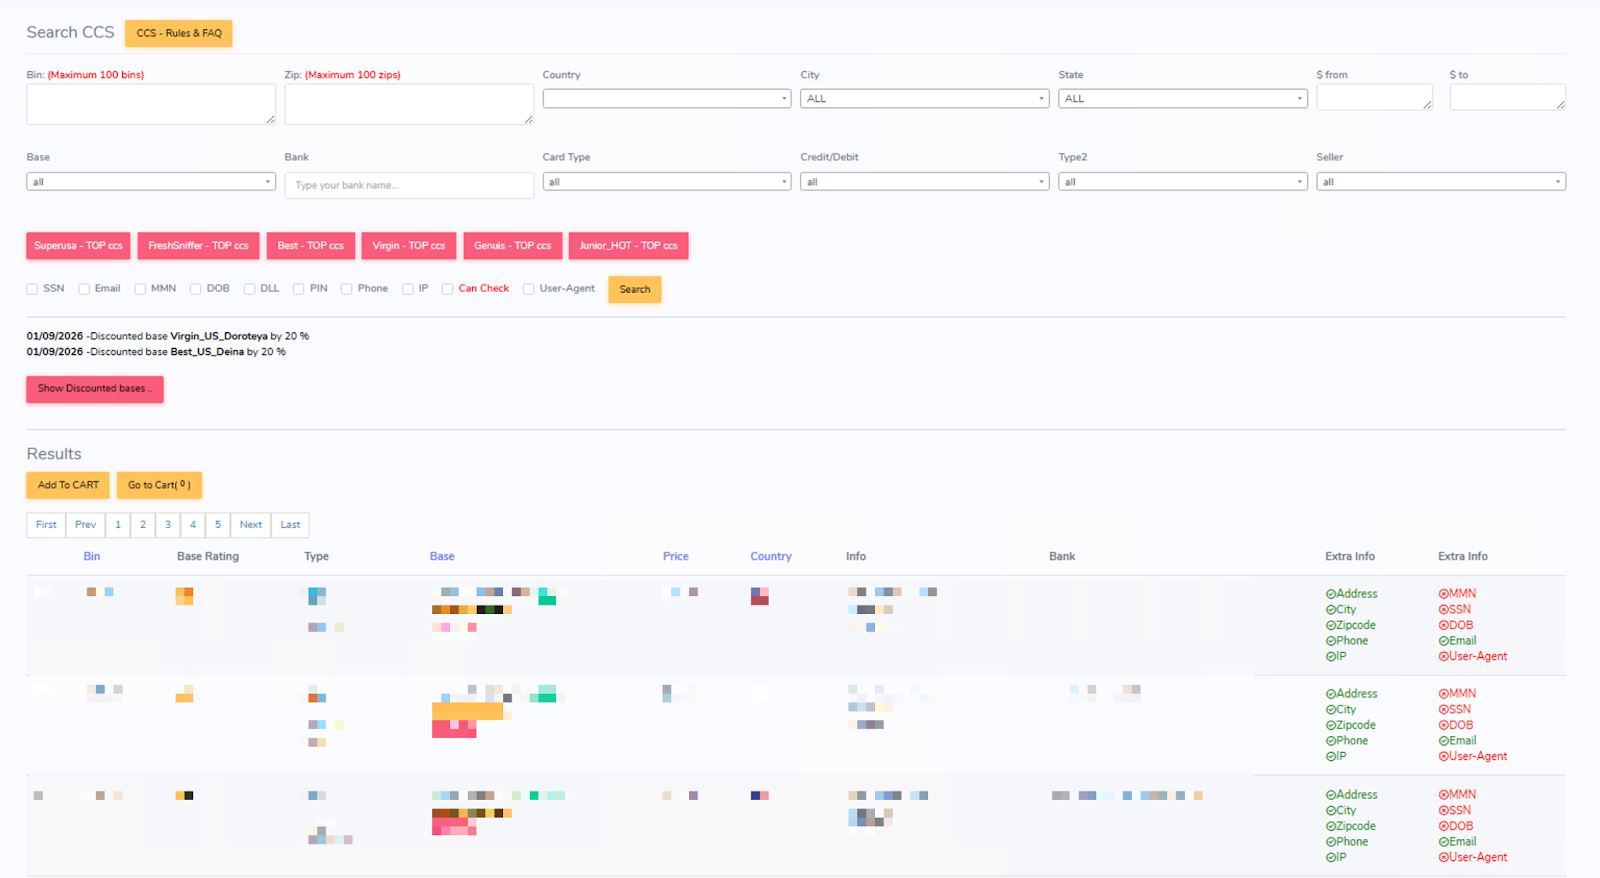
Under its “Search CCS” tab, UltimateShop allows users to filter and browse available credit card listings (Figure 10). In addition to standard filters such as BIN and issuing bank, the platform enables users to specify a price range, select individual sellers, and limit results to listings for which validation is available. The results section displays key details about the issuing bank and cardholder, as well as the seller’s name, an assessed validity percentage, and refund eligibility. It should be noted that certain BINs and issuing banks are excluded from validation checks on UltimateShop.
⠀
⠀
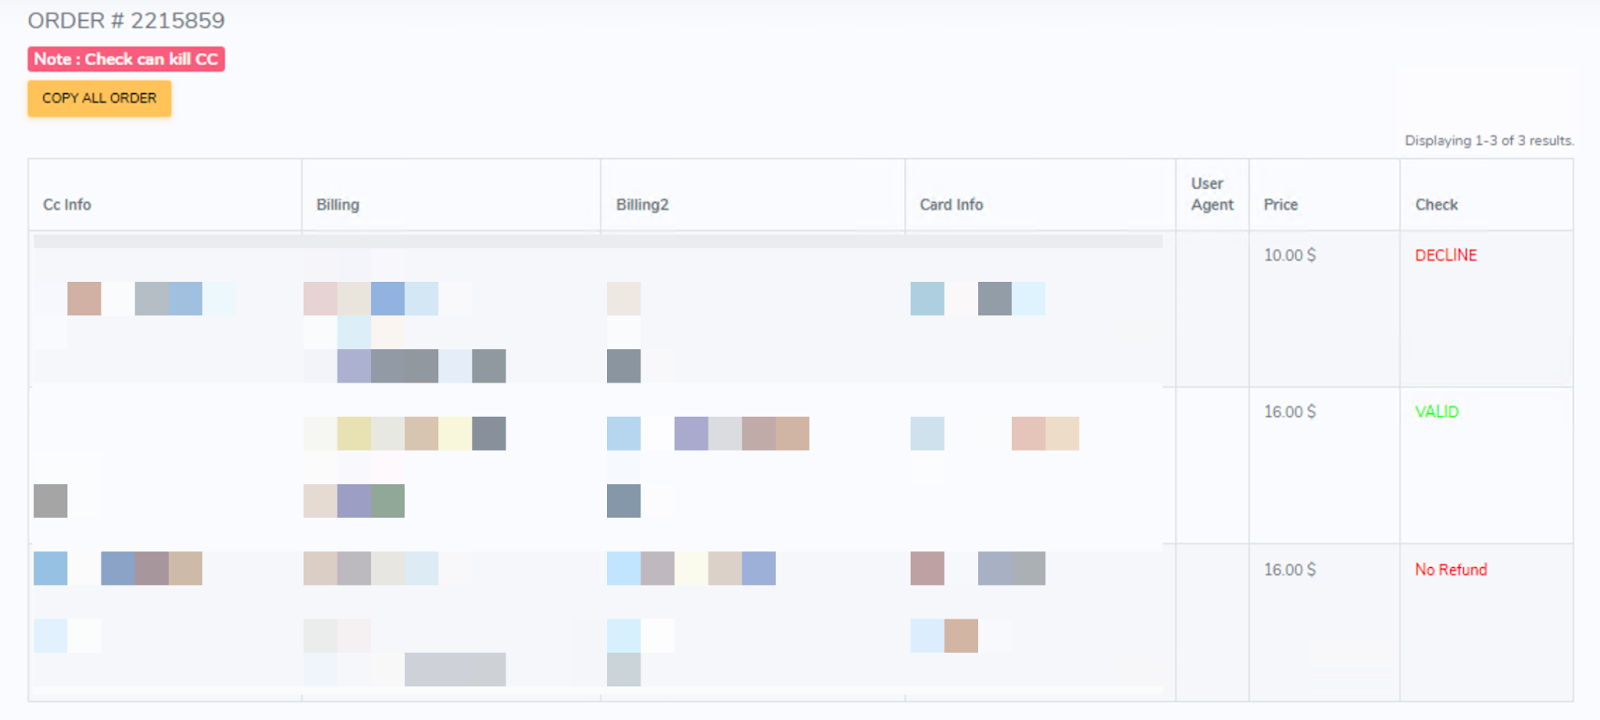
While purchasing a record, users may initiate a validation check where applicable (Figure 11). UltimateShop does not impose a strict timeframe for this process and does not disclose the checker or validation mechanism used. If the card is deemed invalid (e.g., marked as “Decline”), the user is eligible for a refund.
⠀
⠀
UltimateShop’s inventory is largely dominated by a small number of resellers, which collectively accounted for 76% of the platform’s largest offerings during the second half of 2025 (Table 2). SuperUSA appears to be the most prominent seller, contributing approximately 35% of all available records. This concentration indicates a higher reliance on a limited set of resellers and comparatively lower diversification than competing marketplaces such as Findsome. In total, 22 primary resellers were identified on UltimateShop, with an average market share of approximately 5% per reseller.
⠀
|
Reseller |
Records |
Share |
|
superusa |
293,931 |
35% |
|
best |
116,464 |
14% |
|
virgin |
82,672 |
10% |
|
sanji |
79,110 |
9% |
|
freshsniffer |
62,760 |
8% |
Table 2 – Reseller market share on UltimateShop
⠀
While UltimateShop remains a well-established platform within the carding ecosystem, its reputation is increasingly being challenged by negative user feedback. Complaints frequently cite high prices and a significant proportion of invalid records, issues that may stem from the platform’s reliance on a small number of potentially unreliable sellers (Figure 12).
⠀
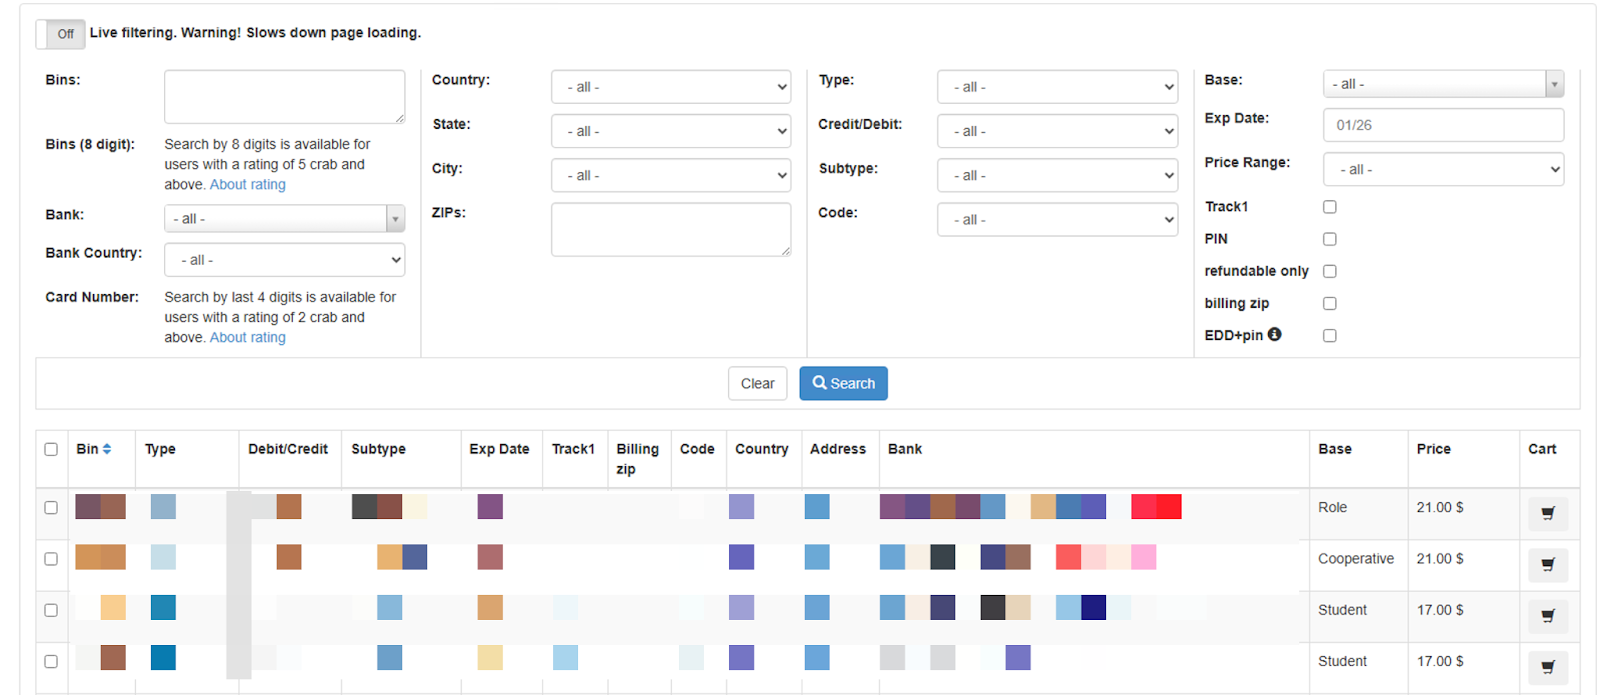
Active since 2014, Brian’s Club is a well-established player within the carding ecosystem that was originally created to “troll” security researcher and reporter Brian Krebs and his work. Like other marketplaces, it offers a wide range of listings, categorized as “CVV2,” “Dumps,” and “Fullz” (Figure 13). Prices typically range from $17 to $49, though higher prices are often observed for records that include PINs, an uncommon feature among carding marketplaces.
⠀
⠀
Another key point of differentiation for Brian’s Club is its extensive offering of dumps, suggesting explicit support for credit card cloning. This is further reinforced by the availability of a “Track1 Generator” tool, which facilitates the creation of physical copies of compromised cards (Figure 14). Together, these features represent a relatively unique value proposition within the carding market and indicate that Brian’s Club administrators have deliberately positioned the platform to address specific customer needs and prevailing market dynamics.
Note: The data in this section, specifically the numerical figures, comes directly from the marketplaces and, therefore, its precision cannot be independently verified or guaranteed.
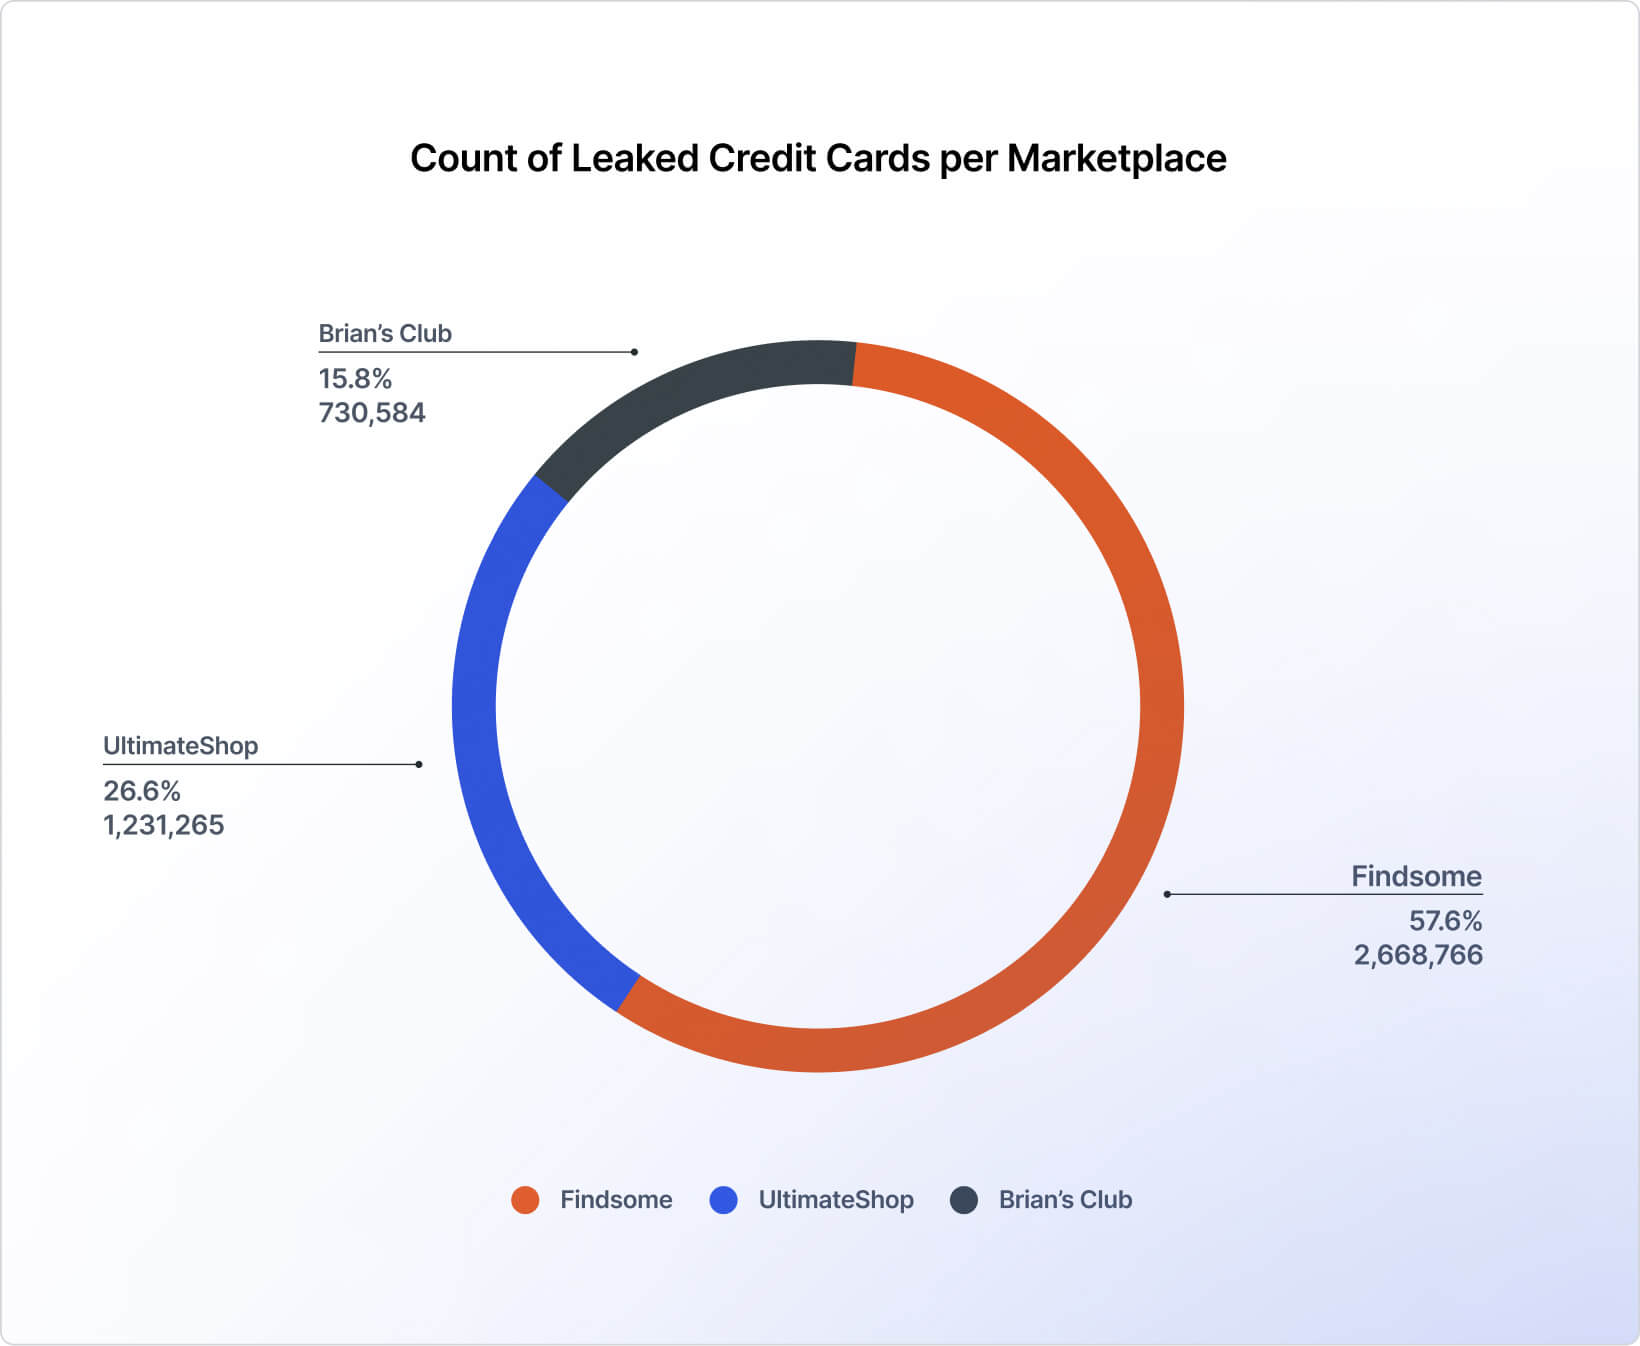
Out of the examined marketplaces, Findsome has the largest market size with 57.6%, followed by UltimateShop (26.6%) and Brian’s Club (15.8%) (Figure 14).
⠀
⠀
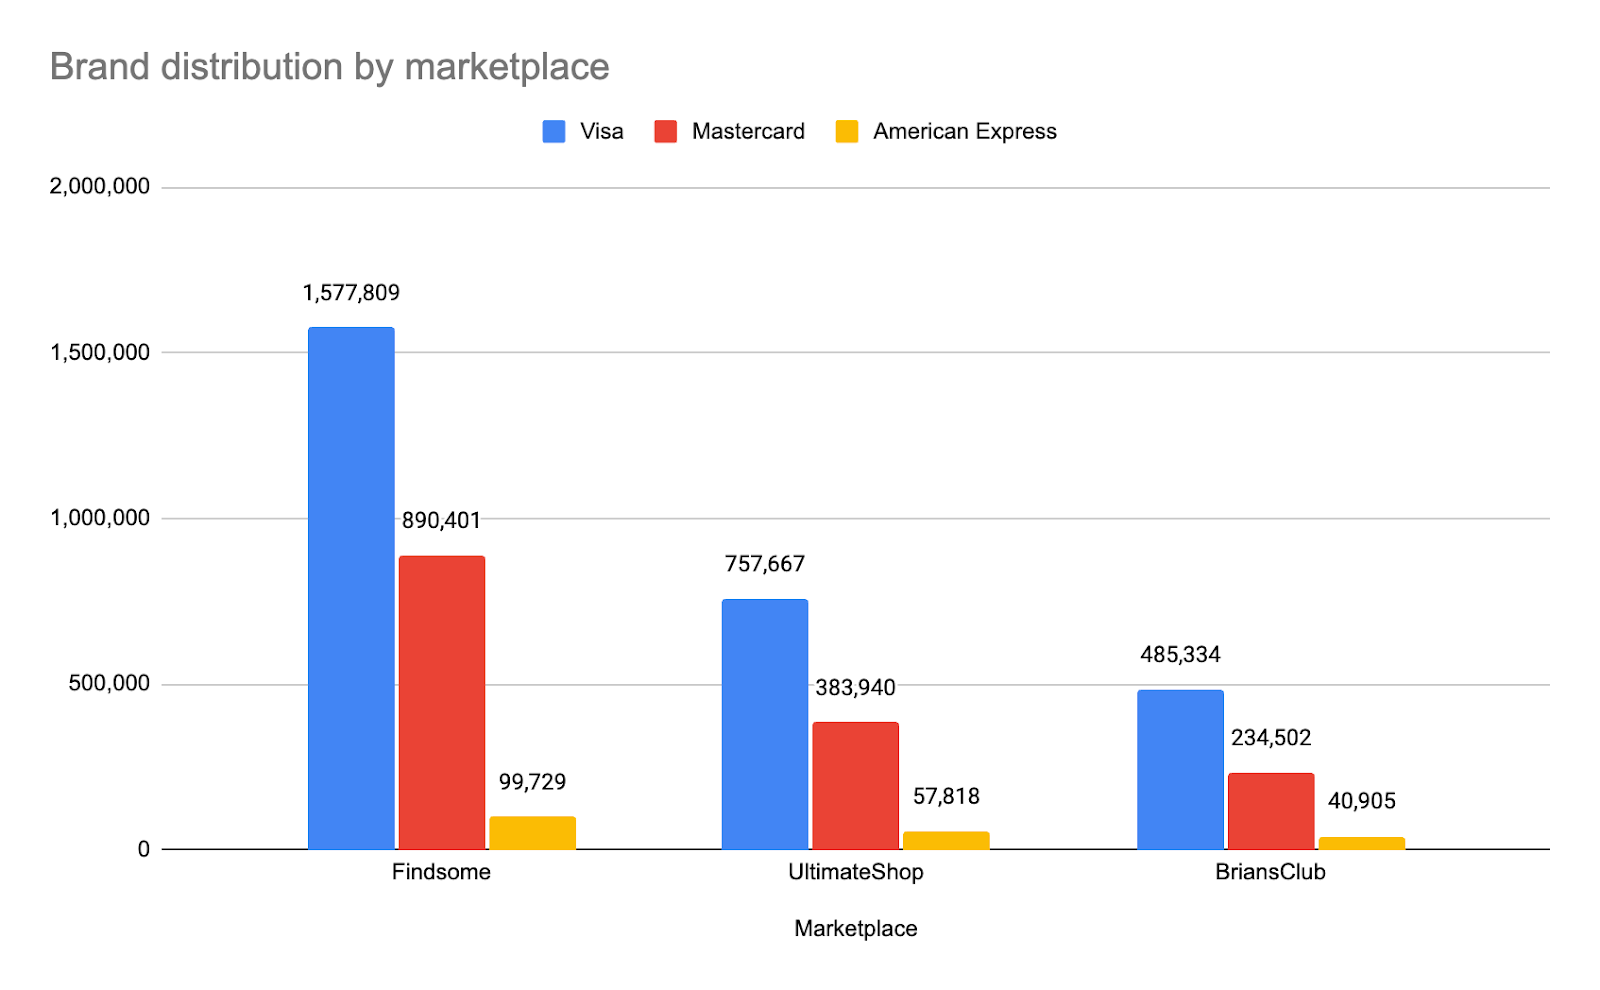
The vast majority of leaked credit cards are Visa cards (60.4%), followed by Mastercard (32.3%), American Express (4.3%), and Discover (3%), with this distribution remaining consistent across the three examined marketplaces (Figure 15). These numbers, however, do not reflect the actual market size of each brand, as according to the 2025 Nilson Report, Visa and Mastercard control relatively similar market sizes, with 32% and 24%, respectively, and American Express and Discover are far behind with 6% and 0.9%. In addition, the most popular credit card brand, Union Pay, with 36% of the market, is not even among the top 4 most leaked brands, probably due to its relatively unique target audience (China), which is not typically targeted by carders in these marketplaces.
However, the leaked credit cards’ brand distribution more closely resembles their market share in the United States (Visa – 52%, Mastercard – 24%, American Express – 19%, Discover – 5%), which is where most of the victims originate.
⠀
⠀
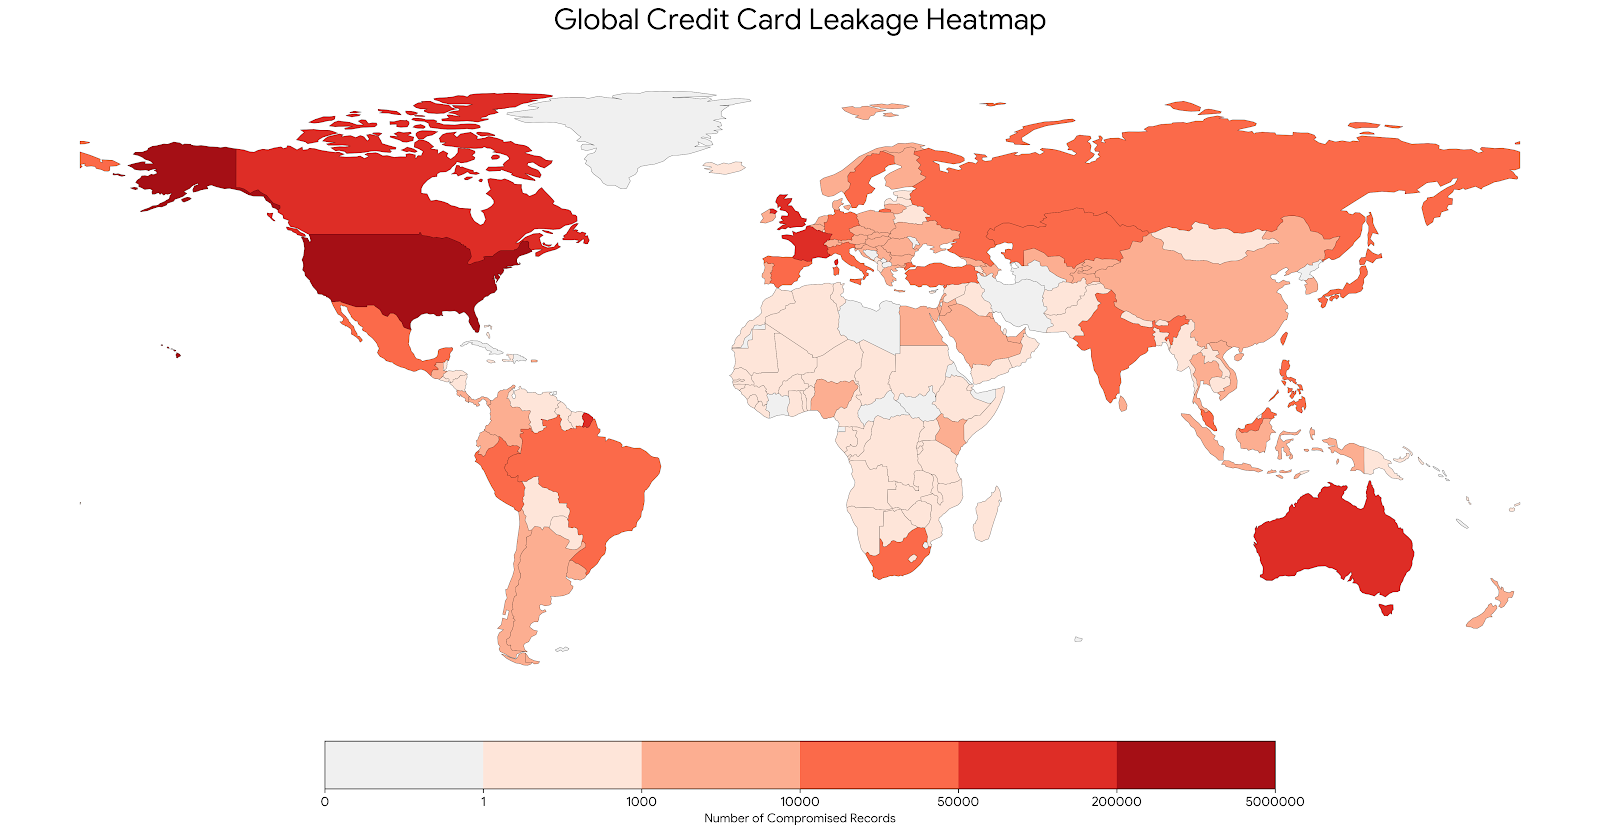
Most of the leaked credit cards we observed in H2 2025 belong to US customers, followed by ones from Canada (by a large margin) and the United Kingdom (Figure 16).
⠀
⠀
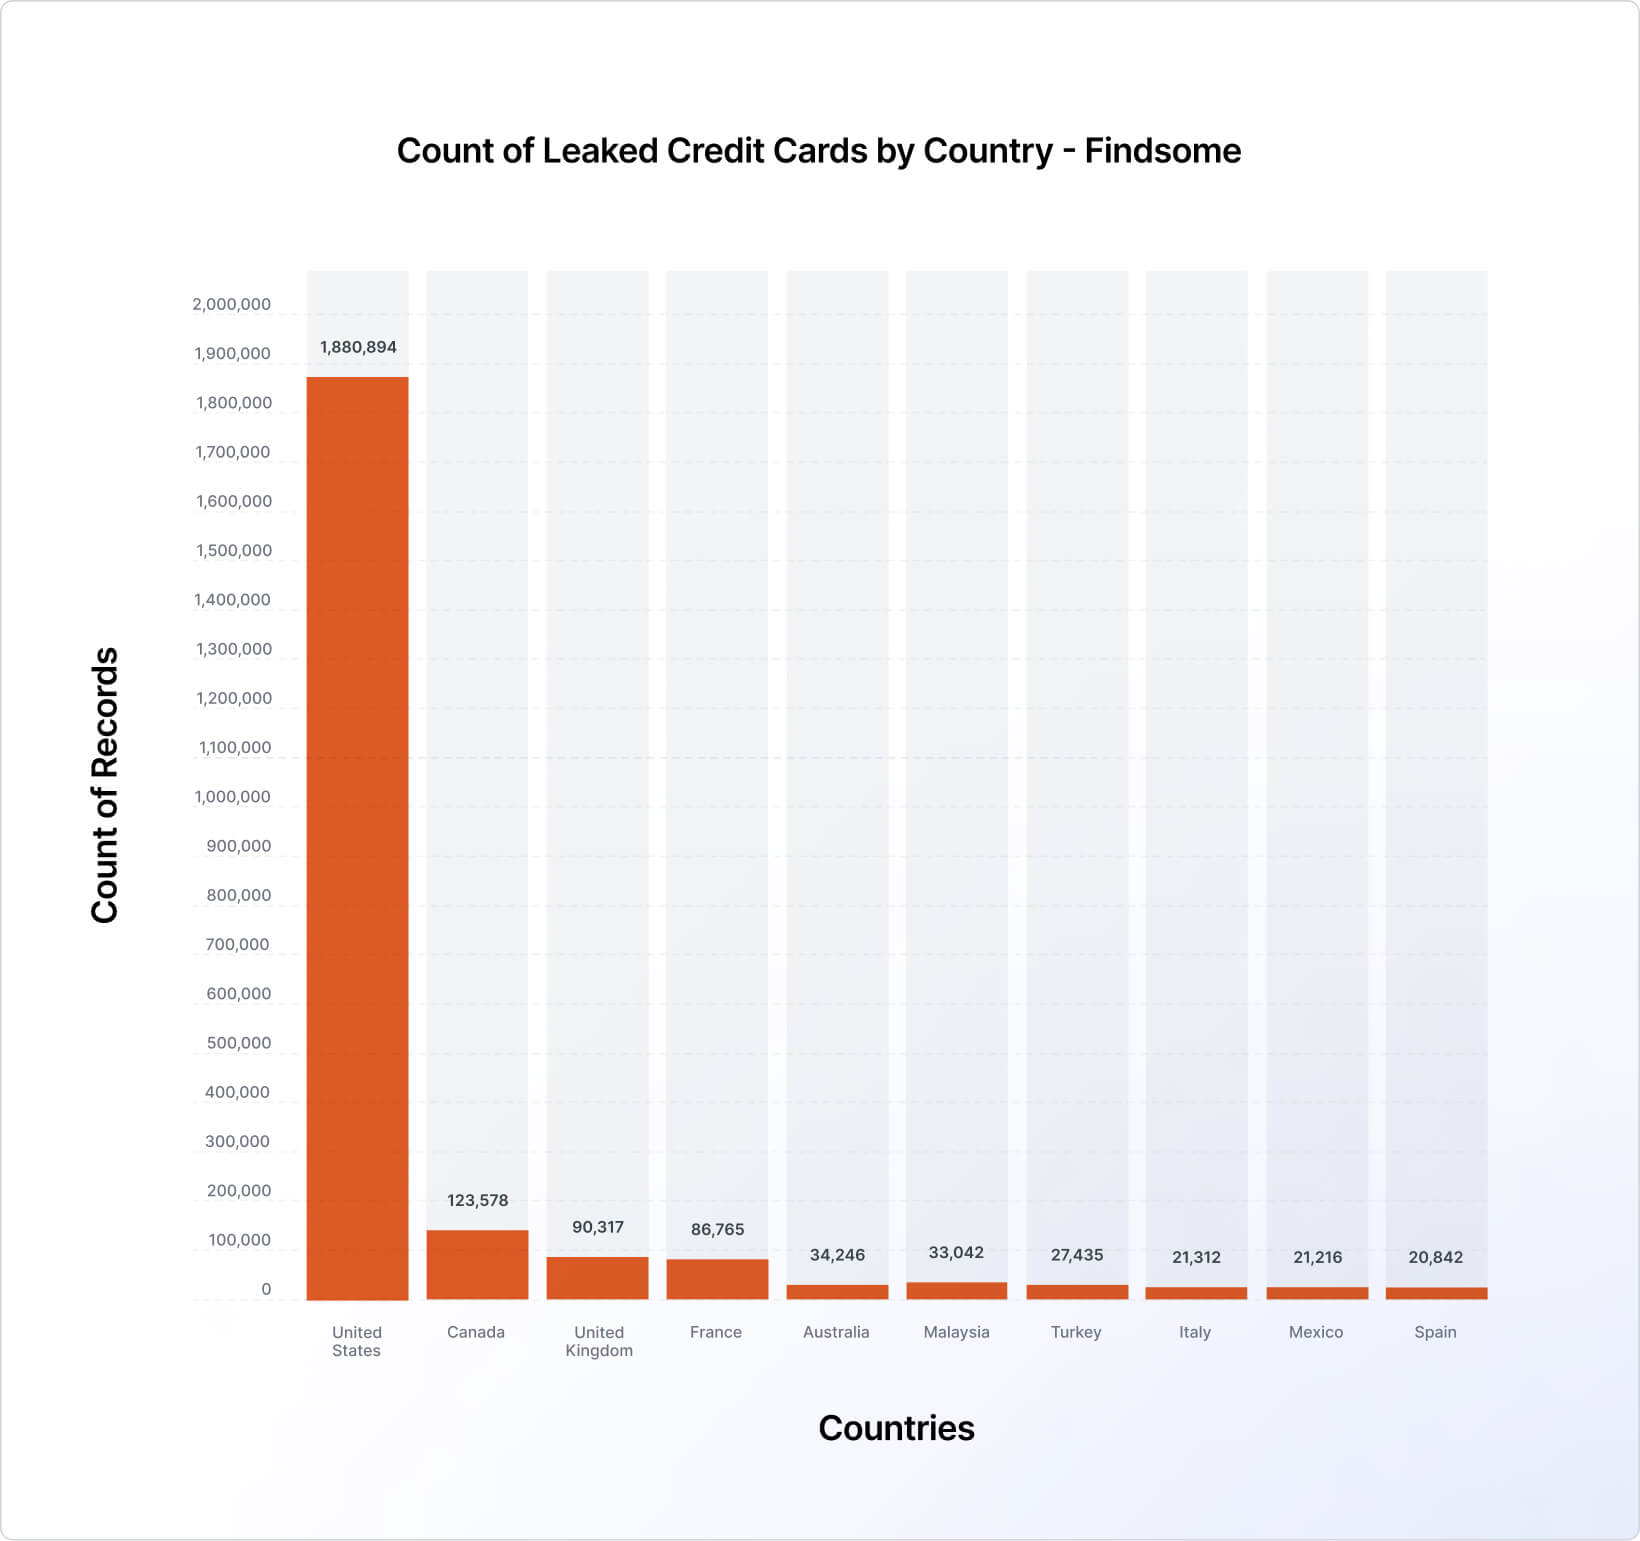
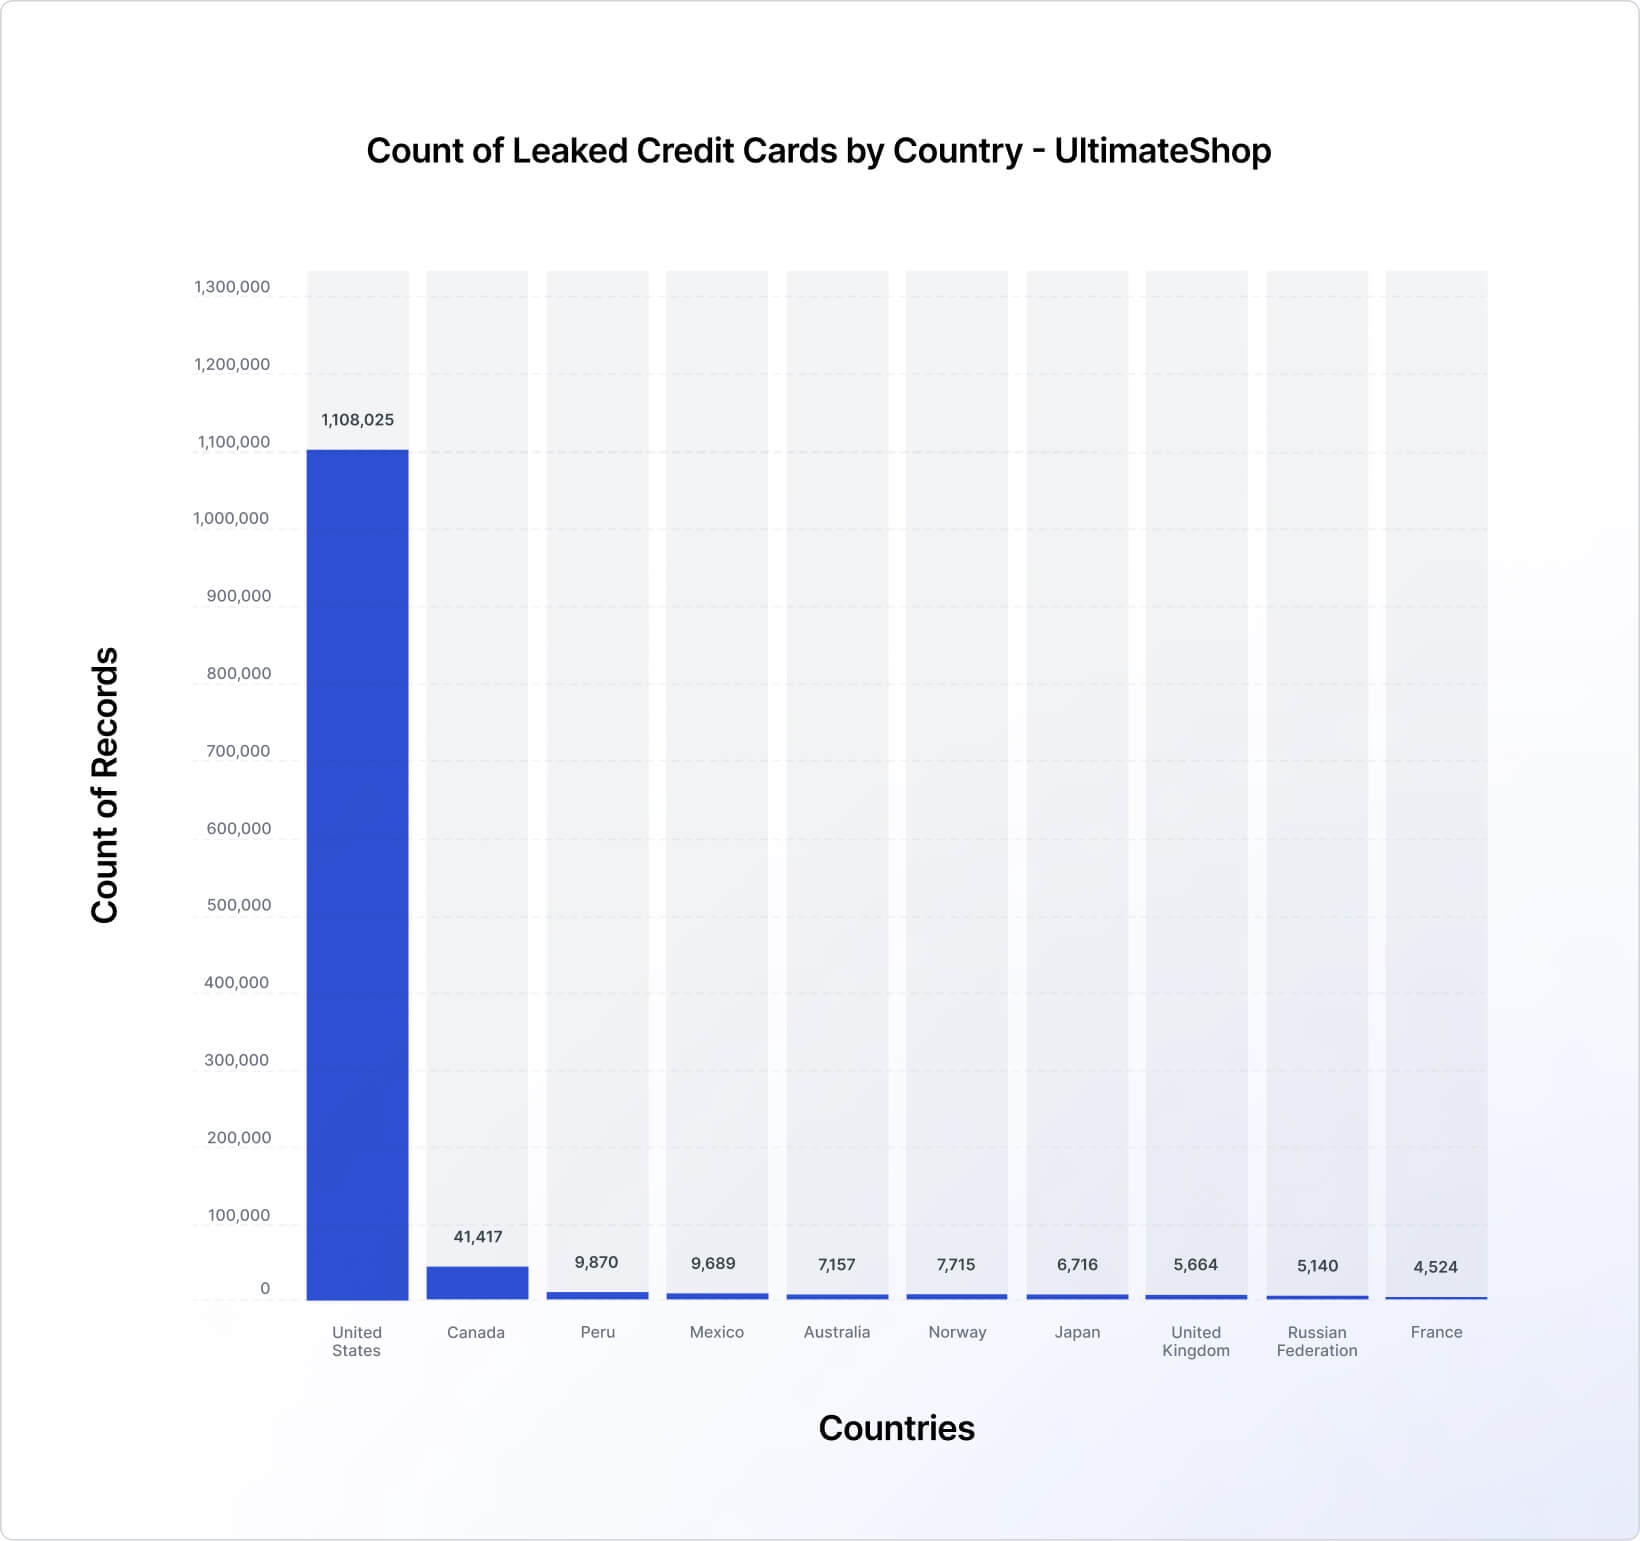
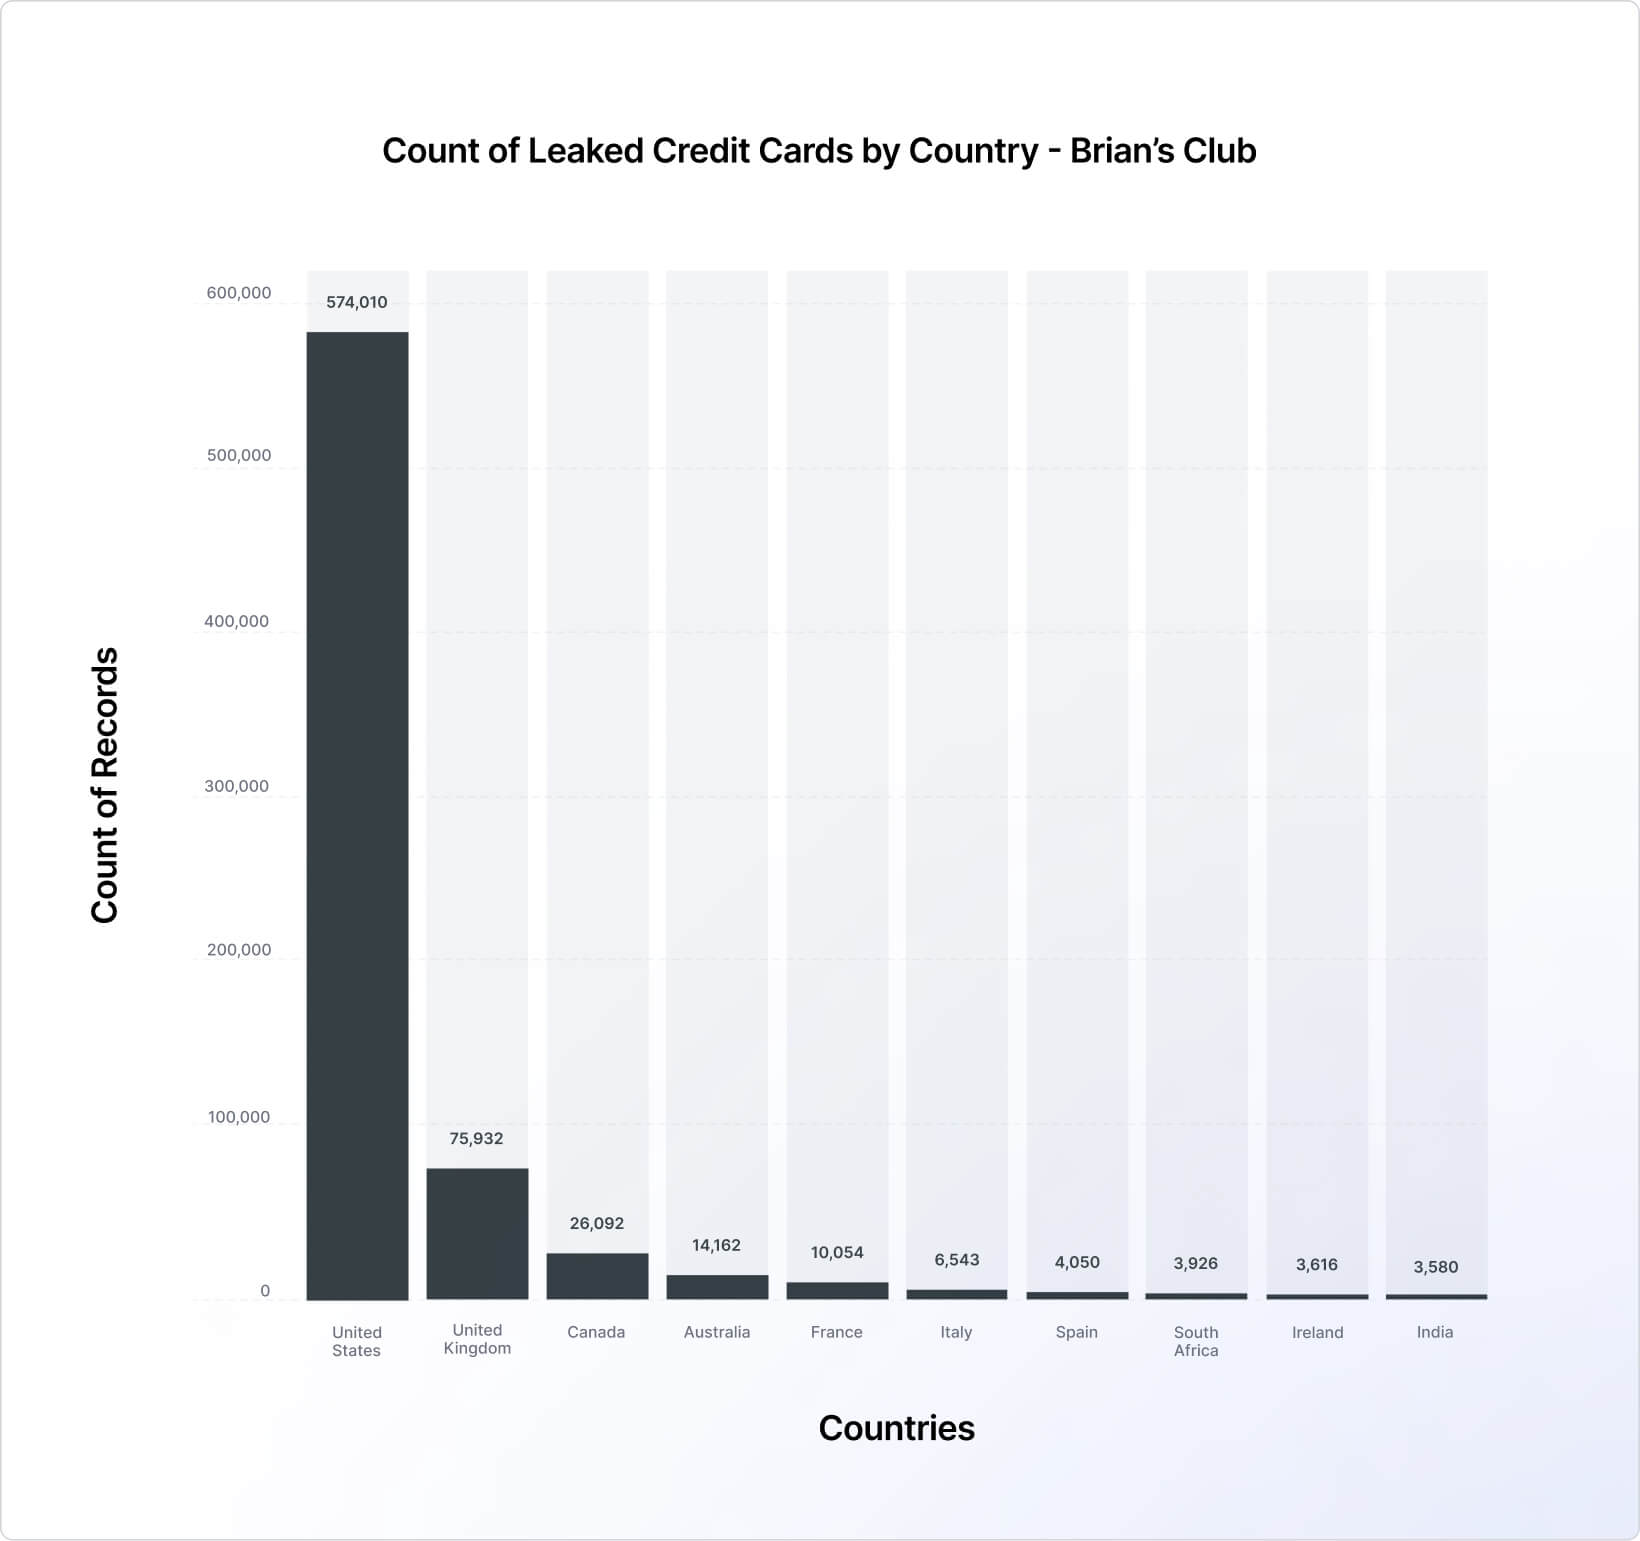
When comparing the top 10 countries list of each of the examined marketplaces (Figures 17, 18, and 19), we can see that UltimateShop’s list is somewhat unusual, with rarely targeted countries, like Peru and Norway, making the Top 10 list while surpassing very populated and highly targeted countries, such as the United Kingdom and France. In this sense, it should be noted that the geographic data sourced from UltimateShop contained numerous inconsistencies. Thus, it may not be a reliable indicator of the actual distribution of victims.
⠀
⠀
⠀
⠀
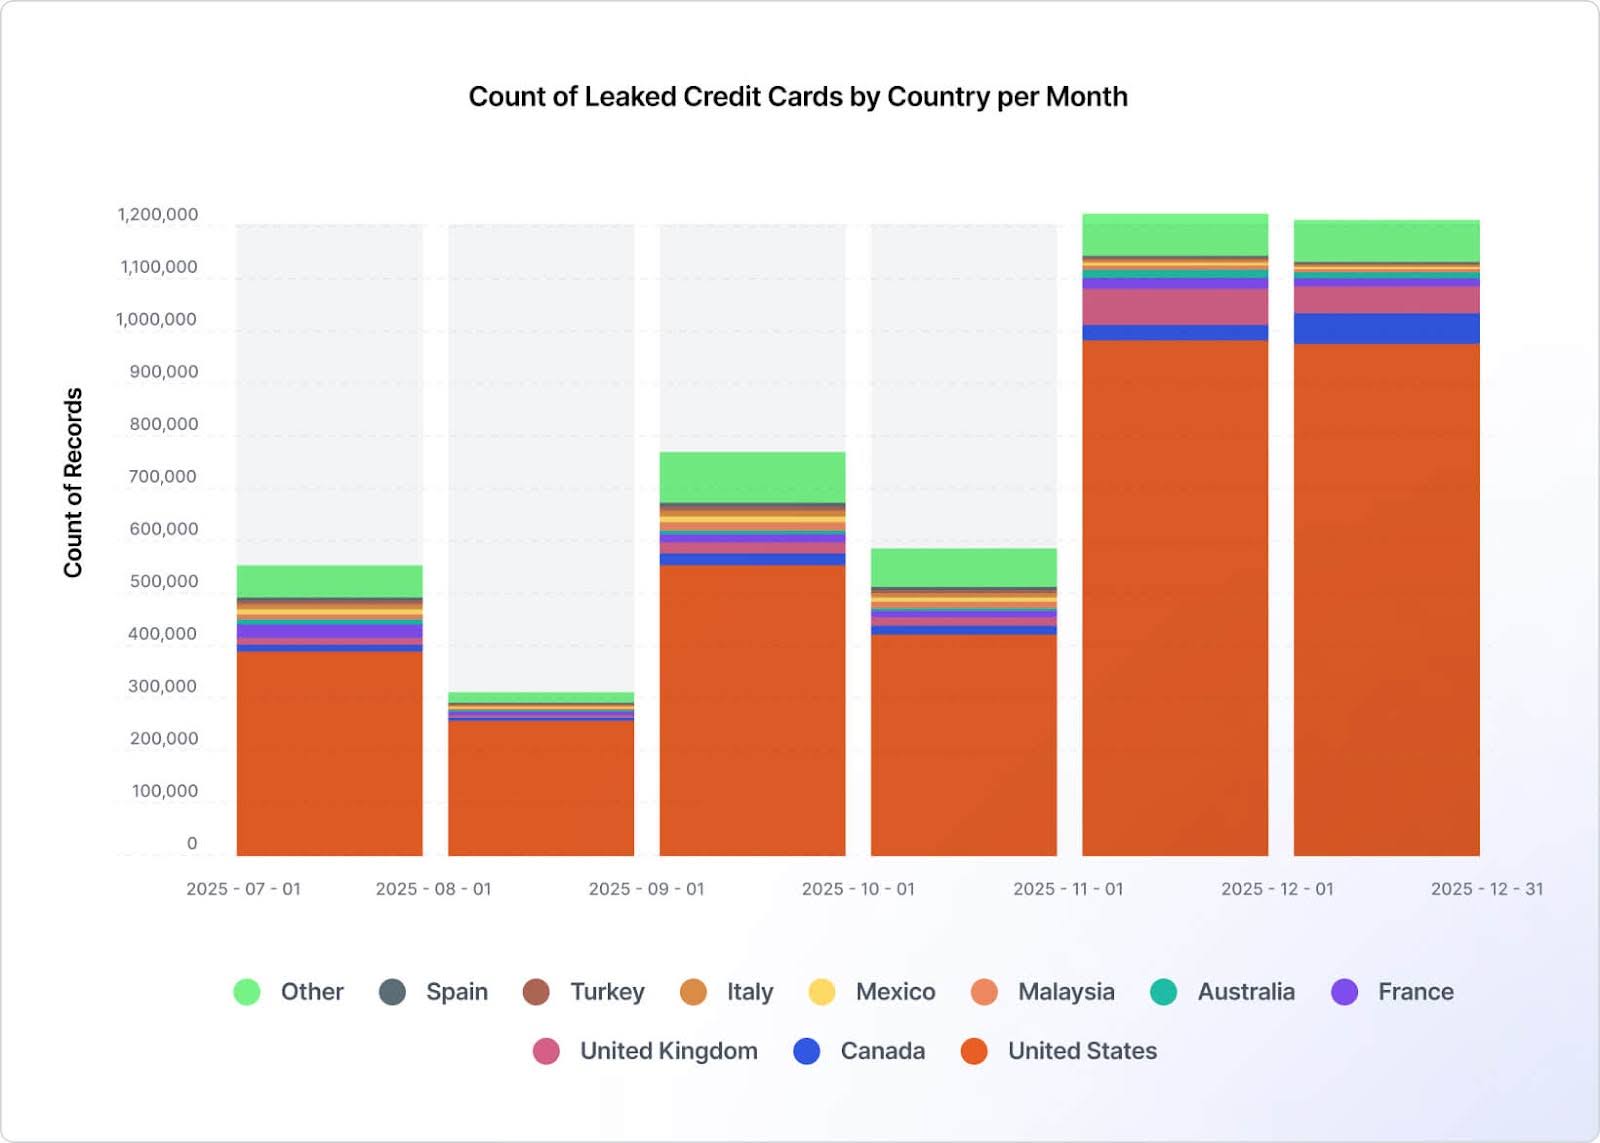
When examining the monthly distribution of leaked credit cards (Figure 20), we observe that the largest volume was recorded in November and December, likely due to the shopping season (e.g., Black Friday and Cyber Monday) that occurs around that time.
⠀
⠀
When examining the types of personal information being exposed along with the leaked credit card, we saw that most of the credit cards are also attached with an email address or a phone number (or both), with the highest percentages recorded in UltimateShop (99.4% of the cases), followed by Findsome (87.7%), and Brian’s Club (75.7%). This means that the leakage of a credit card not only poses a risk for financial scams resulting in monetary losses, but also exposes PII, which may lead to identity theft and impersonation attempts.
The carding ecosystem is gradually moving away from large-scale magnetic stripe (“dump”) fraud as EMV adoption makes card cloning harder and less reliable. While shimming and the capture of PINs allow criminals to continue card-present fraud, this approach is riskier, more expensive, and usually limited to specific regions or devices. As a result, EMV-based fraud is unlikely to fully replace the dump economy at scale. Instead, it is expected to support smaller, localized operations rather than the global, highly automated carding marketplaces that dominated in the past.
At the same time, carding marketplaces are increasingly focused on selling richer data sets that include personal and contact information (“Fullz”), not just card details. This shift enables a wider range of fraud, including account takeover, wallet abuse, phishing, and identity-based scams, which are less dependent on the underlying payment technology. Rather than disappearing, carding-as-a-service is evolving into a broader identity-driven ecosystem, where marketplaces supply raw data, and buyers use automation and AI to decide how and where to exploit it.
The continued growth of carding marketplaces highlights how credit card theft has evolved into a resilient, service-based criminal economy that is difficult to disrupt through takedowns alone. In addition, as stolen cards are increasingly bundled with credentials and personal data, the potential damage inflicted by the CaaS economy has ceased to be purely financial. The impact extends beyond isolated fraud events to long-term identity abuse and account compromise affecting both organizations and consumers.
To cope with the growing threat of stolen credit cards and leaked credentials, organizations should adopt a defense-in-depth approach that combines prevention, detection, and rapid response. This includes strengthening protections against common compromise vectors such as phishing, malware, and web application vulnerabilities by enforcing multi-factor authentication, regularly patching systems, hardening payment pages against client-side attacks, and conducting ongoing security awareness training. At the same time, organizations should invest in continuous monitoring capabilities to detect early signs of exposure, including visibility into dark web and underground marketplaces where stolen card data and credentials are traded.
By proactively identifying leaked assets, correlating them to their own environments (for example, through BIN monitoring), and responding quickly through card reissuance, credential resets, and fraud monitoring, organizations can significantly reduce both financial losses and downstream risks such as identity theft and account takeover.
There are multiple detections in place for Threat Command and MDRP customers to identify and alert on the threat actor behaviors described in this blog. Specifically, Threat Command monitors dark web activity, including exposed credit card details that are being sold on carding marketplaces. Relevant incidents are flagged based on the customer’s assets, specifically their BIN. When a listing containing these assets is identified, a “Credit Cards For Sale” alert is issued (Figure 21). In addition to notifying customers, these alerts enable them to quickly and securely acquire the detected bot through the “Ask an Analyst” service.
⠀
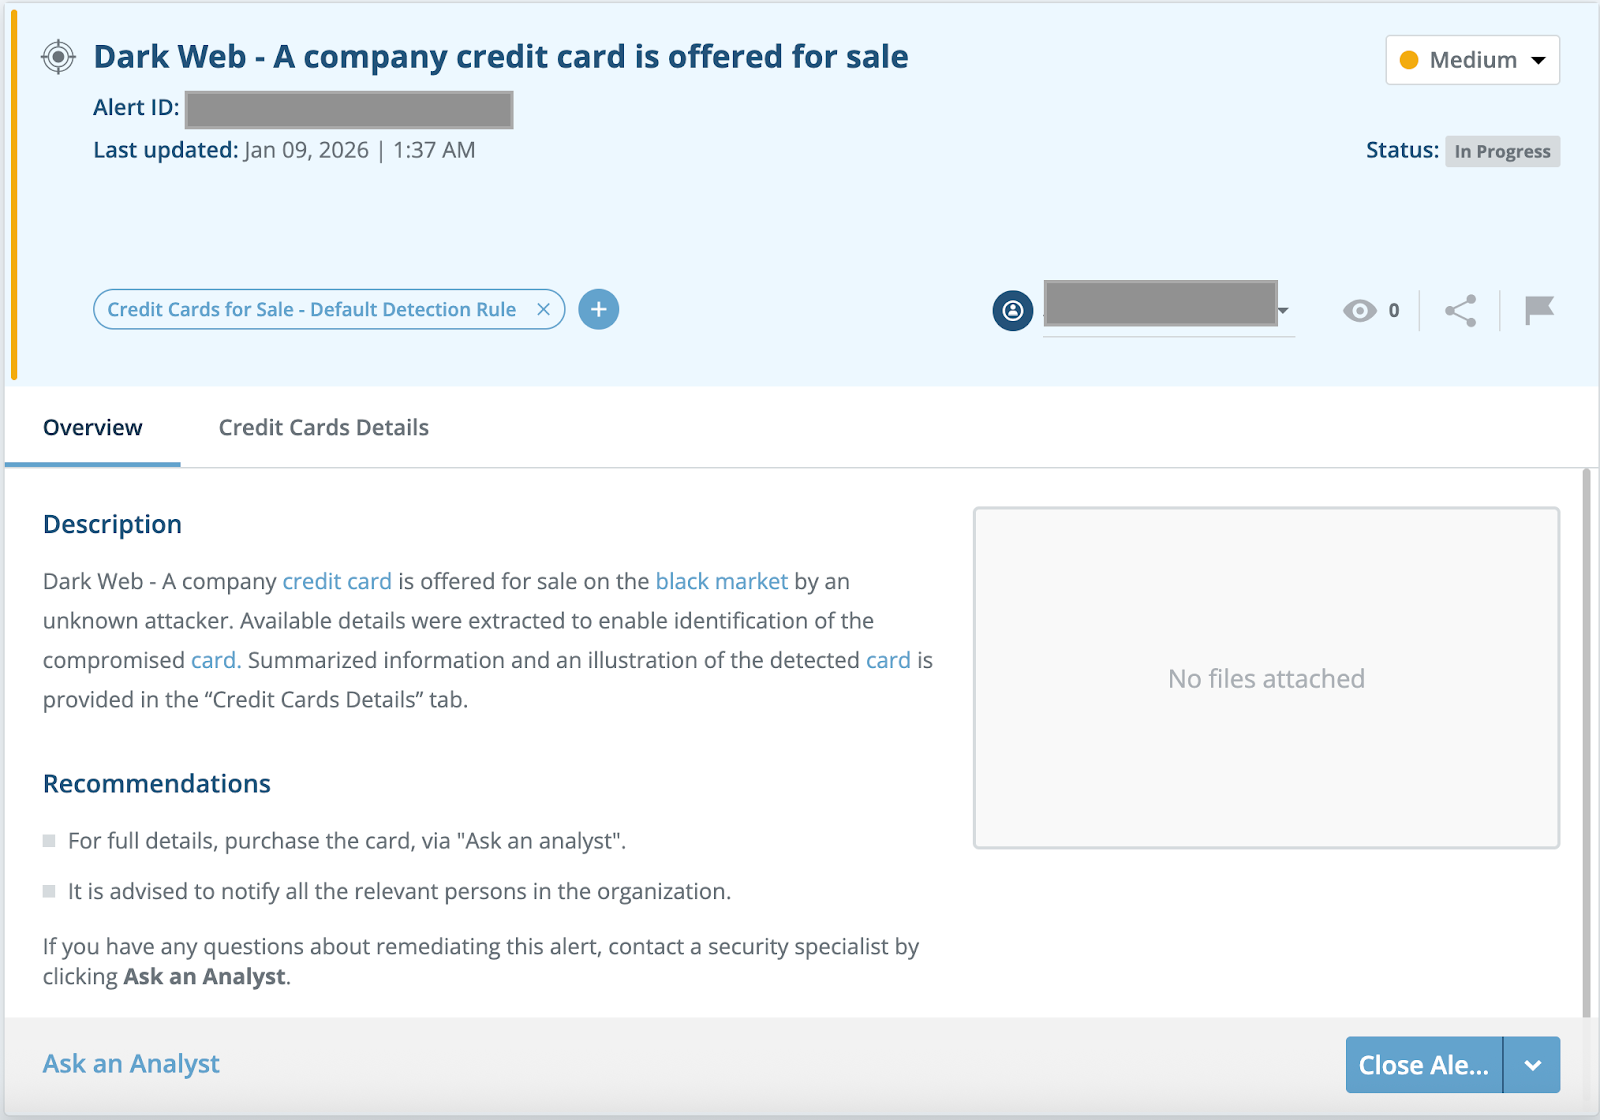
Post Syndicated from Drive Stats Team original https://www.backblaze.com/blog/backblaze-drive-stats-for-2025/
This year marks 13 years of collecting Drive Stats data. Thirteen is an unlucky number (to some), but we count our lucky stars (or perhaps our lucky stats?) that we’ve had 13 years of this experiment.
The traditional 13-year anniversary gift is lace—intricate, impressive, and vulnerable to a snag if you don’t plan ahead to protect the pattern. Systems, like lace, don’t survive by pretending there are no points of vulnerability. When it comes to our infrastructure, we want to build with the snags in mind to create something durable, and the Drive Stats series is always seeking to publish and provide data so that you, too, can go the distance with your drives.
This year-end Drive Stats report looks at Q4 2025, the full year, and the lifetime view with that in mind. I think you’ll find the same things we do: over time, the patterns matter more than any single strand (or drive, to run this lace metaphor into the ground once and for all). Let’s look at the stats.
Drive Stats is not a situationship. We’re a conversation and a relationship—to the data. Join the Drive Stats team for our regularly scheduled webinar to walk through the 2025 annualized failure rates, break down the data for interesting trends, and get the latest from the Backblaze drive fleet happenings.

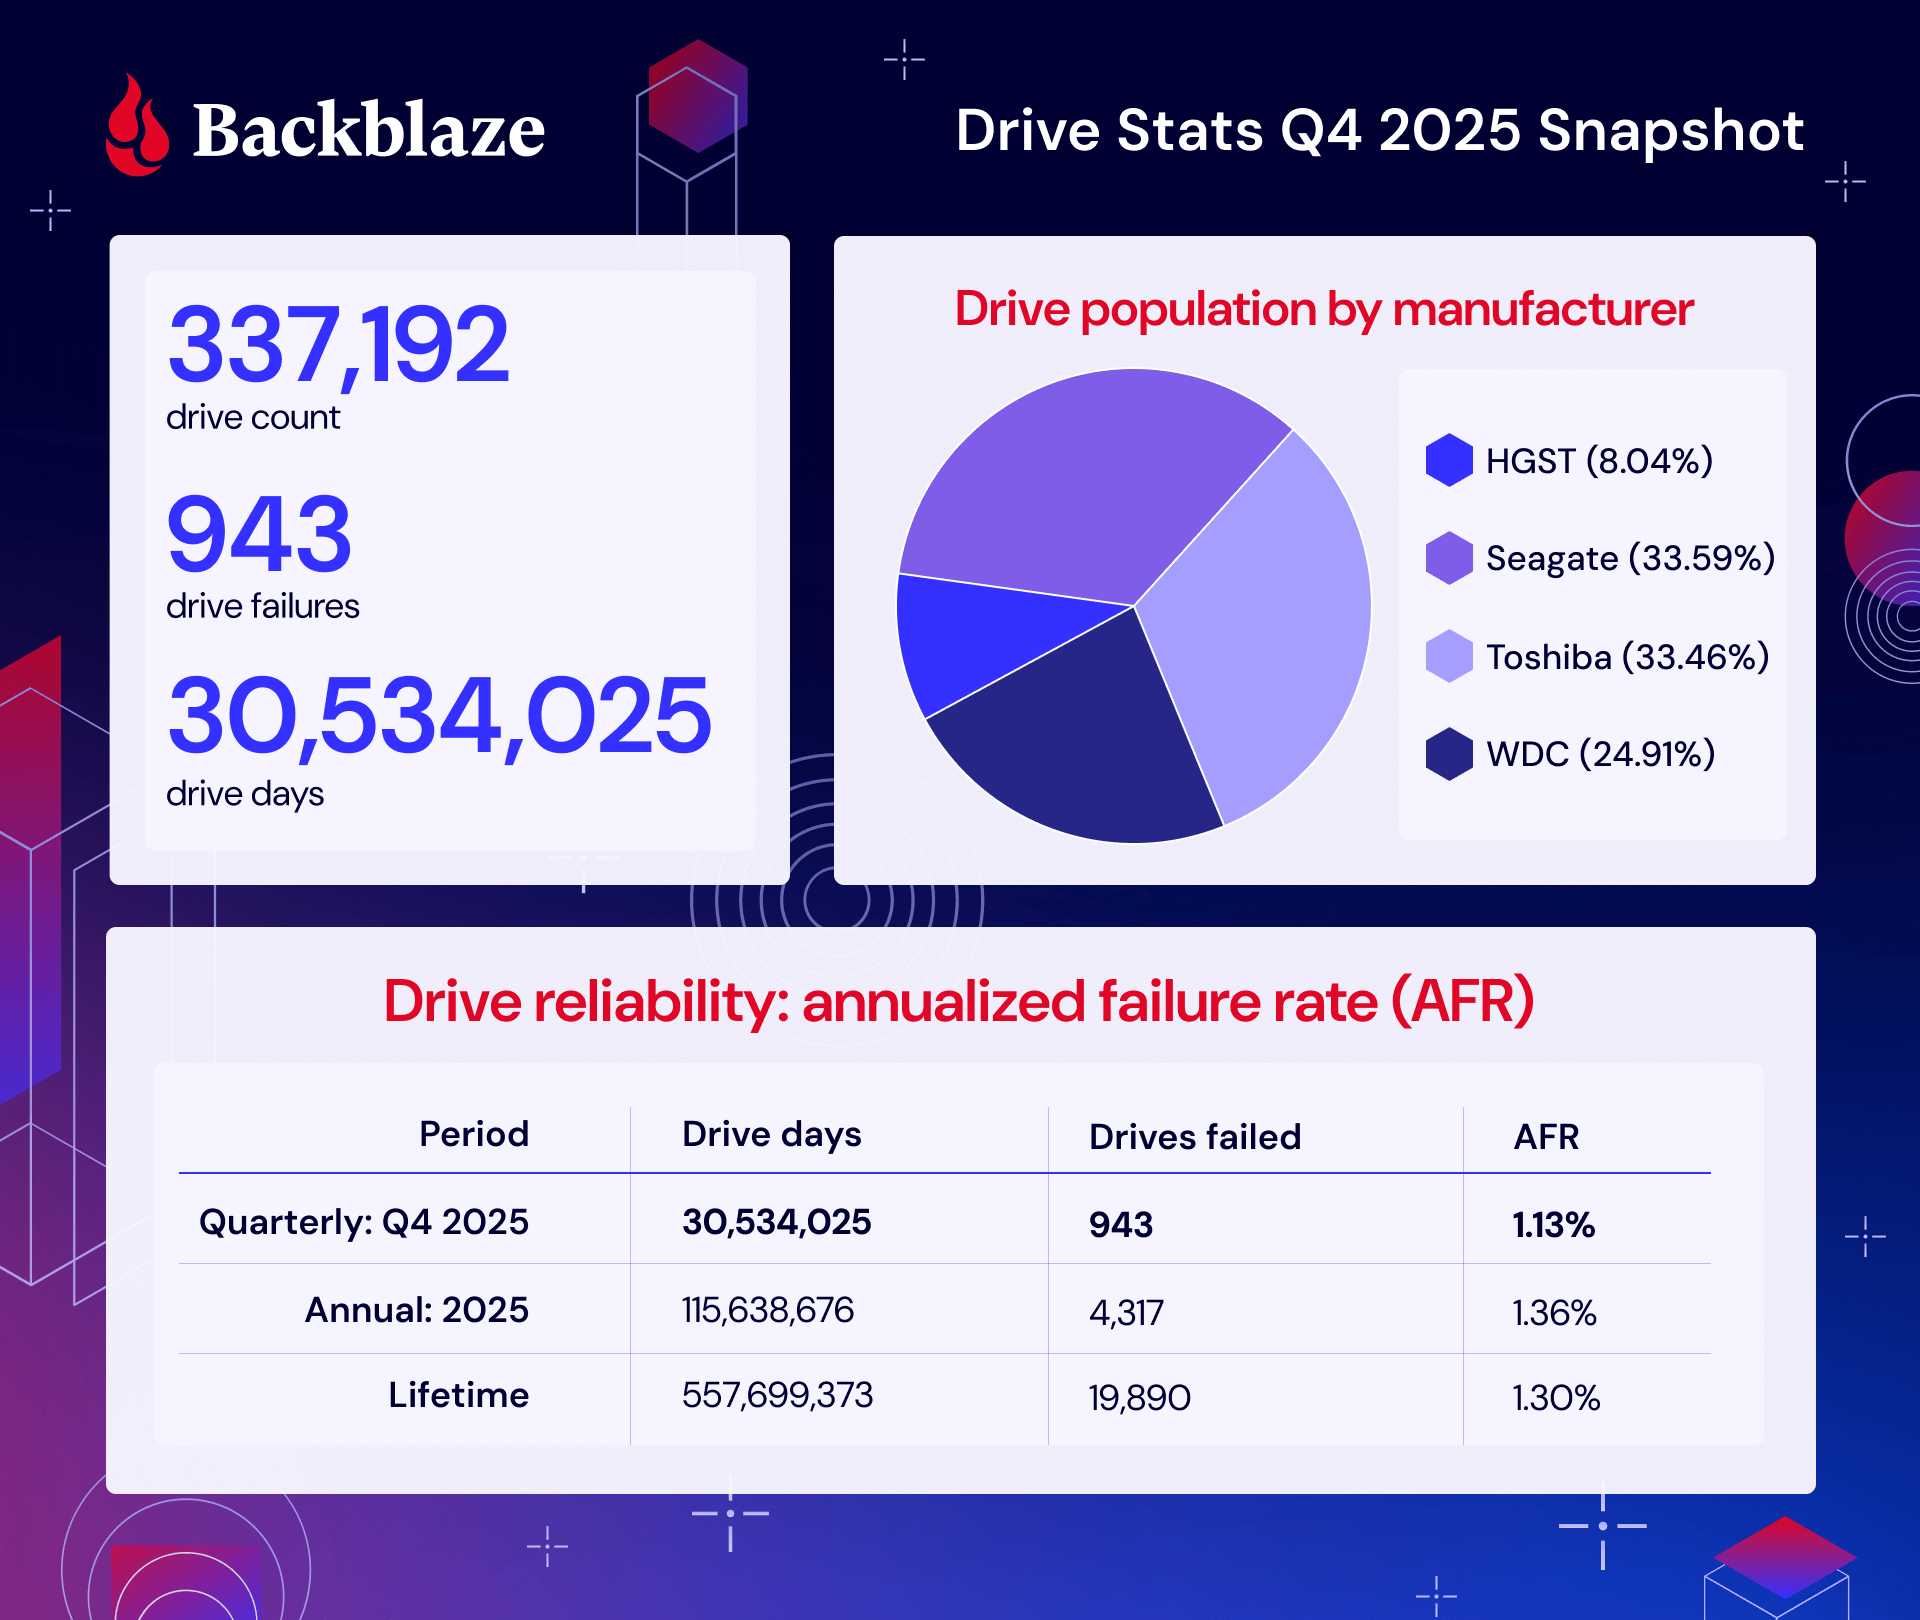
As of the end of 2025, Backblaze was monitoring 341,664 drives used to store data. For our evaluation, we removed from consideration 4,013 boot drives and 459 hard drives, as they did not meet the criteria to be included. We’ll discuss the criteria we used in the next section of this report. Removing these drives leaves us with 337,192 hard drives to analyze. The table below shows the annualized failure rates for Q4 2025 for this collection of drives.
Backblaze Hard Drive Failure Rates for Q4 2025
Reporting period October 1, 2025–December 31, 2025 inclusive
Drive models with drive count > 100 as of December 31, 2025 and drive days > 10,000 in Q4 2025.

We talked about two of these drives last quarter, and what we said about the Seagate still holds true—we’re seeing end of life activity with this drive. But, let’s dig in on the 8TB HGST and 16TB Toshiba and see what’s going on.
There’s always some digging to be done when we see a double digit failure rate, especially on a drive that, in the past year, hasn’t had terrible failure rates (despite the fact that it’s about 7.5 years old).
It’s worth contextualizing, first, that the total drive count of this model is 1,073, which equates to less than one Vault. (A standard Vault has 1,200 drives.) While Vaults aren’t always the same drive model, especially with older drives, in an ideal world, those Vaults would be uniform. So, in this case, we’re dealing with drives that are all hanging out in the same location in a data center, which means we could be working with environmental factors like a change in temperature or airflow.
By the time Drive Stats data gets to me, of course, lots of smart people have already seen the disturbances in the force, so to speak. When I dug into the data center work tickets, it turned turned out that folks had already ruled out temperature as a factor—the working theory at the moment is that the drive could be sensitive to vibration, but given the age of these drives, we decided to just flag them for our normal CVT migration process.
We talked about this model last quarter because it clocked in at a 16.95% AFR (!!). Our investigation turned up some collaborative (and routine) firmware work with Toshiba, and at that time, we predicted that these failure rates would normalize once again. We’re still a little high, but that’s likely a function of rolling out the work. As predicted, this is a healthy normalization.
We’ve covered the reasons that we’ve designed these exclusions in past reports, but here’s the quick and dirty:
| Period | Drive Count | Drive Days |
|---|---|---|
| Quarterly | > 100 | > 10,000 |
| Annual | > 250 | > 50,000 |
| Lifetime | > 500 | >100,000 |
Regardless of whether or not a given drive model is included in this article’s charts and tables, all of the line item data is included in our Drive Stats dataset which you can download by visiting our Drive Stats page.

As of the end of 2025, Backblaze was monitoring 349,462 hard drives used to store data. We removed 4,176 boot drives and 1,090 hard drives from consideration as they did not meet the annual criteria we have defined. This leaves us with 344,196 drives divided across 30 different drive models. The table below shows the AFRs for 2025 for this collection of drives.
Backblaze Hard Drive Failure Rates for 2025
Reporting period January 1, 2025–December 31, 2025 inclusive
Drive models with drive count > 250 and drive days > 50,000 in 2025

And, all those drive tickets and models mean lots and lots of work—we wrote a whole article on that front, but here’s a breakdown of hours spent in each data center.

And here’s an even more interesting slice, from a drive perspective:
Yes, you’ll see some funky drive sizes on that list; it’s inclusive of all of our drives, not just the hard drives we include in this report.
Let’s take a look back at the previous years’ annual AFRs to get a sense of how 2025 compares:
Three Year Comparison of Annual Backblaze Hard Drive Failure Rates
For drive models with > 250 drives as of 12/31/25 and drive models with > 50,000 drive days in 2025
Data for each year is inclusive of that year.

This is an already long report, so in the interest of time, we’ll just say this: There are multiple factors that go into how and why things are changing, including the average age of drives within our cohort, how much drive technology has improved over the years, how drives on the market have gotten bigger over time while the cost per GB has also dropped, and how the current demand for drives has been changing some of those things.
If that sentence sounds confusing, welcome to the world of enterprise drive buying. But, as always, we have to contextualize the real data we see with the way we source and use drives.
Backblaze Lifetime Hard Drive Failure Rates
Reporting period ending December 31, 2025 inclusive
Drive models with > 500 drives and > 100,000 lifetime drive days
Thank you, as always, for making it through ~2,500 or so words to examine the fun side of data. Here’s our standard fine print:
The complete dataset used to create the tables and charts in this report is available on our Hard Drive Test Data page. You can download and use this data for free for your own purpose. All we ask are three things:
If you’re a new Drive Stats fan, consider signing up for the newsletter. If you’re not ready for that kind of commitment, sound off in the comments section below or reach out directly to us to let us know what you’re working on. Happy investigating!
The post Backblaze Drive Stats for 2025 appeared first on Backblaze Blog | Cloud Storage & Cloud Backup
Post Syndicated from Bruce Schneier original https://www.schneier.com/blog/archives/2026/02/3d-printer-surveillance.html
New York is contemplating a bill that adds surveillance to 3D printers:
New York’s 20262027 executive budget bill (S.9005 / A.10005) includes language that should alarm every maker, educator, and small manufacturer in the state. Buried in Part C is a provision requiring all 3D printers sold or delivered in New York to include “blocking technology.” This is defined as software or firmware that scans every print file through a “firearms blueprint detection algorithm” and refuses to print anything it flags as a potential firearm or firearm component.
I get the policy goals here, but the solution just won’t work. It’s the same problem as DRM: trying to prevent general-purpose computers from doing specific things. Cory Doctorow wrote about it in 2018 and—more generally—spoke about it in 2011.
Post Syndicated from The Atlantic original https://www.youtube.com/watch?v=IA_GlhWrQkA
Post Syndicated from corbet original https://lwn.net/Articles/1057382/
Inside this week’s LWN.net Weekly Edition:
Post Syndicated from Manan Nayar original https://aws.amazon.com/blogs/big-data/amazon-athena-adds-1-minute-reservations-and-new-capacity-control-features/
Many of you choose serverless services for your analytics workloads because of its simplicity and elasticity. But many of you running mission-critical queries face a common challenge: ensuring your high-priority workloads run when needed and without interference from other queries in your account.
Amazon Athena is a serverless interactive query service that makes it simple to analyze data using SQL. Capacity Reservations is a feature of Athena that addresses the need to run critical workloads by providing dedicated serverless capacity for the workloads you specify. With Capacity Reservations, you request capacity in the form of Data Processing Units (DPU) and you assign them to your workloads.
In this post, we highlight three new capabilities that make Capacity Reservations more flexible and easier to manage: reduced minimums for fine-grained capacity adjustments, an autoscaling solution for dynamic workloads, and capacity cost and performance controls.
Yesterday, we announced a big change for Capacity Reservations: you can now reserve as few as 4 DPU (down from 24 DPU) for as little as 1 minute (down from 60 minutes). This update lets you make frequent, fine-grained capacity adjustments to closely match your workload patterns and hold less capacity, with savings up to 95% for workloads that complete in under an hour.
We’ve optimized Athena for interactive queries that need a quick response, but many of you use Athena for non-interactive queries as well. For example, you may have queries that run on a schedule to prepare data for downstream analysis or perform updates to Apache Iceberg tables. These queries often process larger volumes of data and run for longer than interactive queries. If you’re using Athena’s scan-based pricing option, all your queries count towards your account-level quota. This means that your latency sensitive interactive queries can sometimes end up queued behind non-interactive queries that are running in your account.
Capacity Reservations addresses prioritization problems like this by making it possible to assign dedicated capacity to Athena workgroups. For example, Twilio operates a query platform that serves 1,500+ users who run over 2.5 million queries per month. They use Capacity Reservations for important workloads that need to have dedicated capacity to run optimally and avoid competing with other workloads.
Capacity Reservations have worked well when your workloads have been large and predictable. For example, users accessing dashboards at the start of the workday, or data processing jobs that run continuously 24/7. However, you’ve told us that you wanted more flexibility to update your reservations more frequently, to better match changes in demand.
With Athena’s new 4 DPU and 1-minute minimums, you’re now able to adjust capacity more frequently and match demand more closely than before. We’re excited to see how these updates benefit your mission-critical query workloads.
The reduced minimums enable frequent capacity adjustments, but making those adjustments requires effort. Consider a business intelligence workload that peaks in the morning as executives review dashboards but decreases throughout the day. You want this workload isolated so that high-priority queries aren’t queued behind less important queries.
With 1-minute minimums, you can now adjust capacity to closely track these patterns. However, manually adjusting capacity this frequently is tedious—you need to monitor utilization, decide when to scale, and periodically adjust DPU.
We recently launched an autoscaling solution that uses AWS Step Functions to orchestrate capacity adjustments. It monitors capacity utilization metrics that Athena emits to Amazon CloudWatch at 1-minute granularity, analyzes utilization signal over configurable intervals, then conditionally adds or removes DPU so you can maintain consistent performance even during traffic spikes.
We have made this available as a 1-click deployment from the Athena console: just click Set up autoscaling on the details page for your reservation. When you do, a AWS CloudFormation template sets up all the resources you need. Among the resources set up is the Step Functions state machine, which you can view by opening Athena’s left-side navigation menu and clicking Workflows.
You can also find the template and information on the configurable autoscaling parameters in our documentation. See Automatically adjust capacity in the Athena User Guide.
We chose Step Functions for this solution to enable extensibility and customization. Step Functions integrates tightly with AWS services and allows you to define sophisticated state machines in Amazon States Language, a JSON-based language for serverless workflows. This makes it straightforward to add conditional logic, integrate additional services, or modify the workflow to match your specific requirements.
Part of the ease of use and simplicity of Athena is that it allocates capacity to queries automatically based on their complexity. However, sometimes preventing a single query from using too much capacity or operating at a required level of concurrency is more important than individual query performance. We recently released new DPU cost and performance controls so you can set constraints on Athena’s capacity allocation behavior when you’re using Capacity Reservations.
You can control DPU allocation in two places: workgroup-level controls that apply to all queries in that workgroup, or per query using the StartQueryExecution API. Both approaches set a type of budget that Athena adheres to when planning queries and determining how much capacity to allocate.
You can set minimum and maximum DPU limits from 4 to 124 DPU in increments of 4. Setting a maximum prevents Athena from allocating more DPU than specified. When you set a minimum, you instruct Athena to allocate at least the specified DPU. This can be beneficial when you know that a specific query requires a specific number of DPU to run optimally for your use case. Set both to create a range. For example, a minimum of 4 and maximum of 16 lets Athena start with 4 DPU and scale to 16 if needed. Setting them to the same value forces queries to run on an exact number of DPU.
Controls that you set at the workgroup-level are visible in the workgroup details page and the reservation that the workgroup has been added to.
Last but not least: every query you run on reserved capacity now reports its DPU usage in the Athena console and GetQueryExecution / BatchGetQueryExecution APIs, giving you complete visibility into capacity utilization.
Getting started with Capacity Reservations involves creating a reservation with your desired DPU count, then assigning workgroups to that reservation. For end users, nothing changes. You continue running queries as usual and no SQL changes are needed. For administrators, you create a Capacity Reservation with your desired DPU count, then assign workgroups to that reservation. Athena automatically routes queries from assigned workgroups to your reserved capacity, isolated from other queries in your account and no impact to your account-level concurrency quota.
These updates to Capacity Reservations give you greater flexibility and control over your Athena workloads. The reduced minimums let you adjust capacity in smaller increments and shorter time windows, allowing you to match your usage patterns more closely than before. Autoscaling eliminates the work of making those adjustments manually. And DPU controls give you fine-grained influence over how individual queries consume capacity. Together, these capabilities help you optimize costs, manage concurrency, and deliver predictable performance for your most critical workloads—all while preserving Athena’s serverless benefits.
To learn more, see Athena Capacity Reservations in the Athena User Guide, Athena pricing page, or create your first Capacity Reservation in the Athena console.
Post Syndicated from Matt Granger original https://www.youtube.com/shorts/BU9VTOslpgE
Post Syndicated from corbet original https://lwn.net/Articles/1058323/
Version 6.17 of the Linux
manual-page collection has been released. Along with a long list of
updates to the man pages themselves, it includes some new utility programs
of interest.
The grepc(1) program is something that originated in this project,
as it helped me find code quickly in glibc and the Linux kernel.
However, I’ve found it incredibly useful outside of this project.
I’ll take some space to announce it, as it’s much more than just a
tool for writing manual pages, and I expect it to be useful to most
–if not all– C programmers.It is a command-line tool that finds C source code (for example, a
function definition) in arbitrary projects. It doesn’t use any
indexing mechanism (unlike ctags and similar tools). This means
that it can be used right after cloning some repository, without
having to first generate an index.
Post Syndicated from Franco Abregu original https://aws.amazon.com/blogs/devops/choosing-between-amazon-ecs-blue-green-native-or-aws-codedeploy-in-aws-cdk/
Blue/green deployments on Amazon Elastic Container Service (Amazon ECS) have long been a go-to pattern for shipping zero-downtime deployments. Historically, the recommended approach in the AWS Cloud Development Kit (AWS CDK) was to wire ECS to AWS CodeDeploy for traffic shifting, lifecycle hooks, and tight integration with AWS CodePipeline.
In July 2025, Amazon ECS launched built-in blue/green deployments. This allows you to operate directly within the ECS service, without requiring the use of Amazon CodeDeploy.
This post explains what changed, how the new ECS-native blue/green model compares to CodeDeploy, and how to decide which path to take in your CDK projects.
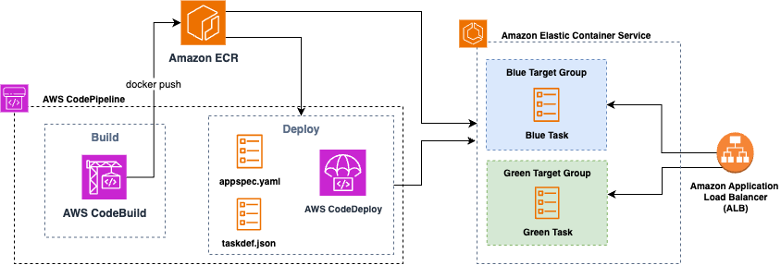
Figure1: Amazon ECS blue/green deployment with AWS CodeDeploy
In a blue/green deployment, two production environments are maintained: blue, the current environment, and green, the new environment. This strategy allows you to validate the new version of your environment before it receives production traffic.
The ECS service team saw an opportunity to simplify the deployment process by creating lifecycle hooks, bake time, and managed rollback directly within ECS. With this shift, the complexity of coordinating blue/green deployments through CodeDeploy is consolidated into a single service. This consolidation not only simplifies the deployment pipeline but also reduces the number of moving parts, making it easier to maintain and troubleshoot over time.
Conceptually, ECS-native blue/green provisions a replacement task set registered to a separate target group (blue target group in figure 2) behind your Elastic Load Balancing listener. When you approve the cutover, ECS performs an all-at-once traffic shift to the green revision (green target group in figure 2), then holds both revisions during a configurable bake period before retiring blue or rolling back if alarms or hooks fail.
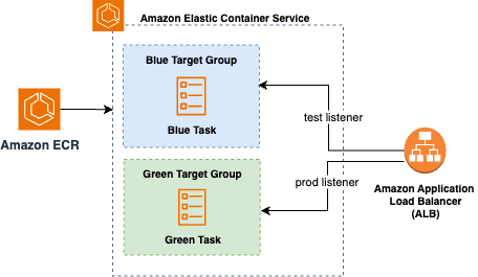 Figure 2: Amazon ECS Native Blue Green Deployment
Unlike CodeDeploy, which requires fine-grained configuration of traffic shifting strategies, ECS native deployments are intentionally simpler, designed to cover the most common blue/green use cases without the operational overhead of managing a multi-phase canary.
With CDK, you now have two ways to achieve blue/green on ECS. One is the ECS-native path that keeps deployment configuration on the CDK ECS module and its related load balancer resources. You configure lifecycle hooks that invoke AWS Lambda functions at specific deployment stages, you set a bake time, and you optionally use a test listener or Amazon ECS Service Connect header rules to validate traffic to the green revision before production cutover. The CodeDeploy path creates a CodeDeploy application and deployment group bound to your ECS service and Application Load Balancer (ALB), lets you choose canary, linear, or all-at-once policies, and typically plugs into AWS CodePipeline for orchestration.
A key functional difference is how the traffic shifts. ECS-native blue/green performs an immediate all-at-once switch to green, followed by a bake period; CodeDeploy supports canary and linear shifting in addition to all-at-once. If you require progressive exposure by percentage, CodeDeploy remains the way to go. If you want a simpler, service-centric model with fewer moving parts, ECS-native is now the default choice.
Currently, the AWS CDK includes L2 support for ECS-native blue/green so that you can model these settings directly without custom CloudFormation or escape hatches. If your stack already uses the Deployment Controller Type. CODE_DEPLOY path, you can continue to do so; migration options exist (outlined later in this post).
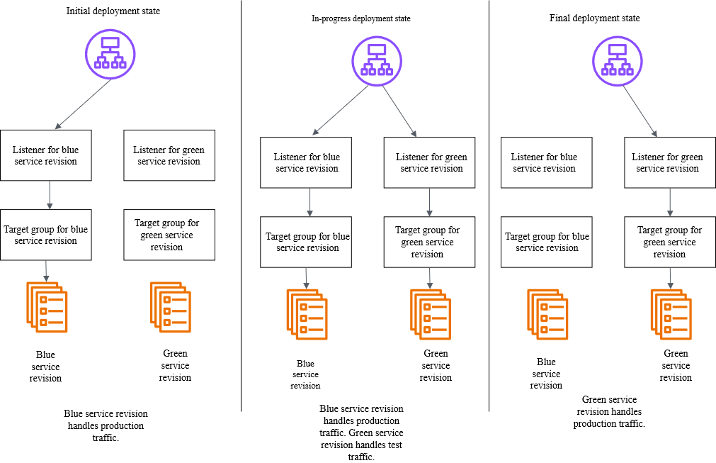
Figure 3: Amazon CodeDeploy blue/green deployment traffic shift
AWS CodeDeploy offers more refined functionality for managing deployments through its integration with AWS CodePipeline to support multi-stage workflows across services, regions, and accounts, and provides a clear audit trail for change management. AWS CodeDeploy offers policies that can shift traffic in defined increments (for example, 5% or 10%) with automated metric checks and optional approvals. This deployment pattern supports coordinating multiple environments with formal governance, or teams that want data-driven promotions based on alarms and checkpoints. Because of its integration with AWS CodePipeline, you can have several stages for different services for ECS Blue/Green (CodeDeploy) and coordinate the deployment of multiple dependent services in a single release.
Utilize ECS-native to achieve a compact operational footprint by consolidating deployments and operations into a single service. The ECS service supports zero-downtime deployments through Blue/Green deployment (shifting the traffic all at one time) and enables quick rollbacks with configurable settings for minimumHealthyPercent and maximumPercent. Application Load Balancer (ALB) draining and task health checks ensure a balance between speed and safety. Additionally, the built-in deployment circuit breaker automatically halts and reverts problematic rollouts, minimizing operational issues.
To utilize ECS-native blue/green in CDK, start with an Amazon ECS service (Fargate or EC2), an Application Load Balancer, and two target groups managed by ECS during deployments. In your service definition, you’ll opt into the blue/green deployment type, set a bake time, and attach lifecycle hooks. Hooks can run Lambda functions at stages such as before scale-up or after production traffic shift, letting you run synthetic tests, warm caches, or gate on external checks. If you’re using Amazon ECS Service Connect, you can route “dark” test traffic to green by sending requests with a specific header during the pre-cutover phase.
const service = new ecs.FargateService(this, "Service", {
      cluster,
      taskDefinition,
      desiredCount: 3,
      securityGroups: [serviceSG],
      vpcSubnets: {
        subnetType: ec2.SubnetType.PRIVATE_WITH_EGRESS,
      },
      deploymentStrategy: ecs.DeploymentStrategy.BLUE_GREEN,
      bakeTime: Duration.minutes(30),
      propagateTags: ecs.PropagatedTagSource.SERVICE,
      deploymentAlarms: {
        alarmNames: [
          this.stackName + "-Http-500-Blue",
          this.stackName + "-Http-500-Green",
          "Synthetics-Alarm-trivia-game-" + props.stage,
        ],
        behavior: ecs.AlarmBehavior.ROLLBACK_ON_ALARM,
      },
      lifecycleHooks: [
        new ecs.DeploymentLifecycleLambdaTarget(
          preTrafficHook,
          "PreTrafficHook",
          {
            lifecycleStages: [
              ecs.DeploymentLifecycleStage.POST_TEST_TRAFFIC_SHIFT,
            ],
          }
        ),
      ],
      minHealthyPercent: 100,
      maxHealthyPercent: 200,
    });
Code Snipped: Amazon ECS service with AWS Fargate and AWS CodeDeploy
Using ECS-native blue/green deployments is now the recommended default for most teams. This approach provides zero-downtime cutovers, lifecycle hooks, bake time, and rollback capabilities without requiring the management of an additional service.
Choose CodeDeploy only if you need advanced traffic shifting options, such as canary or linear deployments, or if you have other dependencies with AWS CodePipeline workflows.
Bring your ECS deployments to the next level by enabling Blue/Green deployment with the strategy that best fits for your use case. For step-by-step instructions for migrating from CodeDeploy to ECS-Native refer to this migration guide.