Post Syndicated from The History Guy: History Deserves to Be Remembered original https://www.youtube.com/shorts/GNT3Rl8KN2A
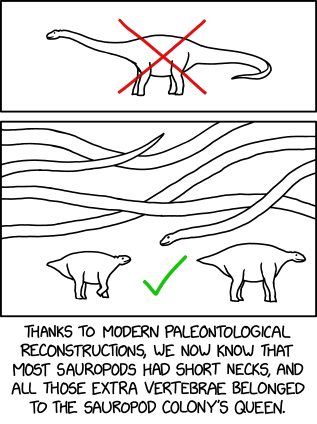
Sauropods
Post Syndicated from xkcd.com original https://xkcd.com/3185/
DJI has been BANNED
Post Syndicated from Crosstalk Solutions original https://www.youtube.com/shorts/hCMO9x03Jfw
ASRock Rack AMPONED8-2T BCM Motherboard Review with Ampere AmpereOne A192-32X Arm CPU
Post Syndicated from Patrick Kennedy original https://www.servethehome.com/asrock-rack-amponed8-2t-bcm-motherboard-review-with-ampere-ampereone-a192-32x-arm-cpu/
In our AMPONED8-2T/BCM review, we see how this motherboard fares with plenty of PCIe Gen5 connectivity and up to 192 AmpereOne Arm cores
The post ASRock Rack AMPONED8-2T BCM Motherboard Review with Ampere AmpereOne A192-32X Arm CPU appeared first on ServeTheHome.
2025: That’s a Wrap and Here Are the Stats
Post Syndicated from Stephanie Doyle original https://www.backblaze.com/blog/2025-thats-a-wrap-and-here-are-the-stats/

When most people think about year-end work, they think in terms of deadlines, retrospectives, and a well-earned break. Data centers have other ideas because, well, the internet still needs to work on holidays in order to power those digital fireplaces and Spotify playlists.
Backblaze runs year-round, around the clock, which means that even the holidays are business as usual in a data center. And many customers who use Backblaze to store their AI models, applications, media, and critical business data need that data storage to be more reliable than ever, especially around the holidays. Every drive swap, rack adjustment, alert investigation, and routine fix leaves a trace in our work tickets, and we’ve discussed in our Drive Stats reports how we use those work tickets to do things like define a failure. They’re also evidence of what it takes to keep an always-on service humming, even when the rest of the company is offline.
So, as the year comes to a close, we wanted to shout out to our awesome data center, cloud ops, and on-call team members—we couldn’t do it without you. And here’s a little retrospective on what this past year looked like.
Total time spent working in each data center
Backblaze has four data regions and six data centers. Here’s the breakdown of where we spent our time this year, inclusive of everything from entropy-fighting maintenance tasks to all the normal network and performance upgrades that keep us ahead of changing data patterns to good ol’ scaling and expansion of our data center footprint::
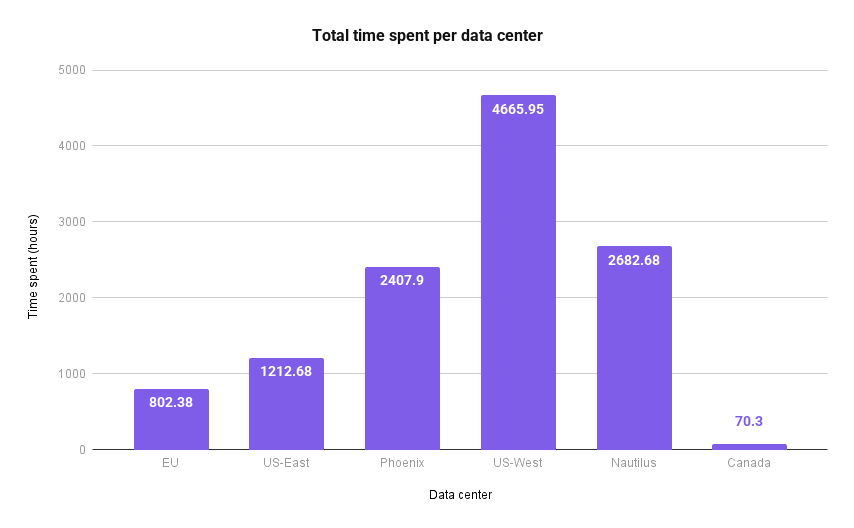
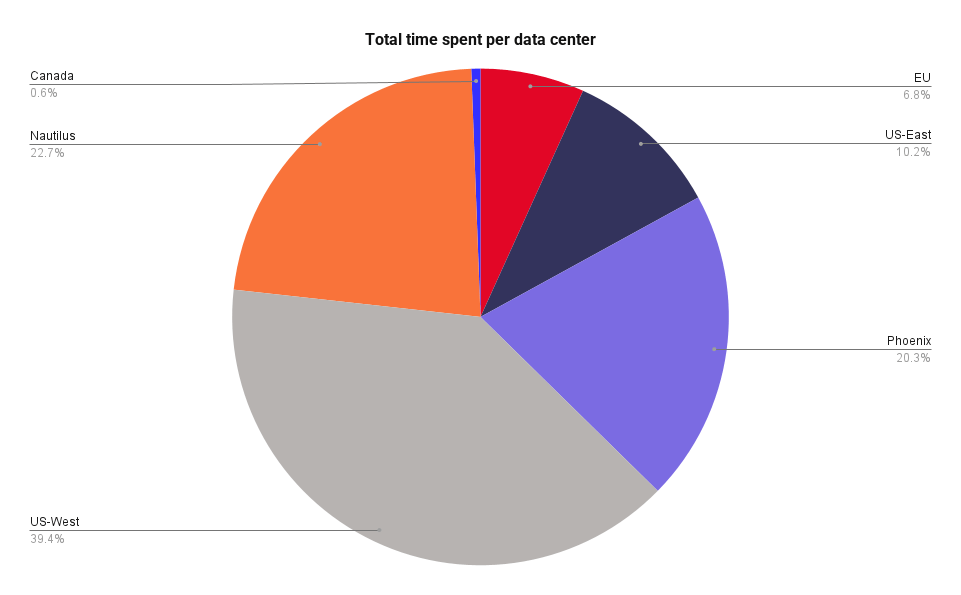
In total across data centers, we spent 3,112.43 hours replacing hard drives. (If those hours don’t square up with the charts above, it’s because the total view includes other types of work, like upgrading our systems.) On average, it took about 0.74 hours per hard drive.
Here’s a breakdown of the drives replaced by capacity:
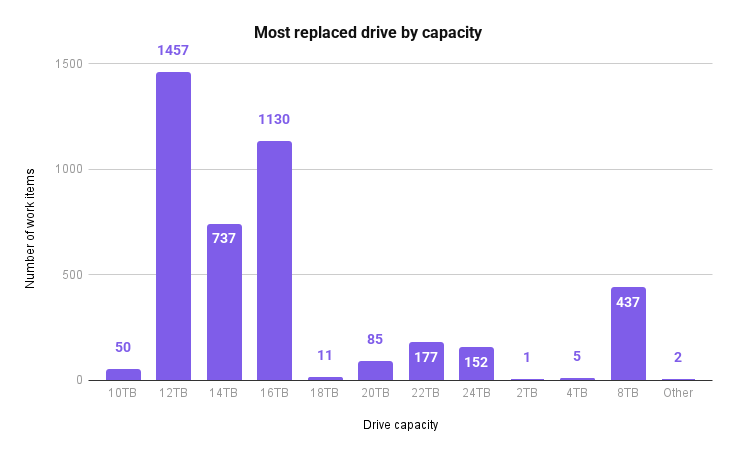
If you’re a Drive Stats fan, you may notice there are some funky drive sizes on there based on our other reporting data. (A 2TB drive? Where does that one even come from?) The drives above are inclusive of our whole fleet, including boot drives and non-production drives, and some of those are sized differently than based for whatever reason—history, job in the data center, etc.
Vault deployments
We also deploy new Vaults fairly regularly. This year, we added the following Vaults (per data center):
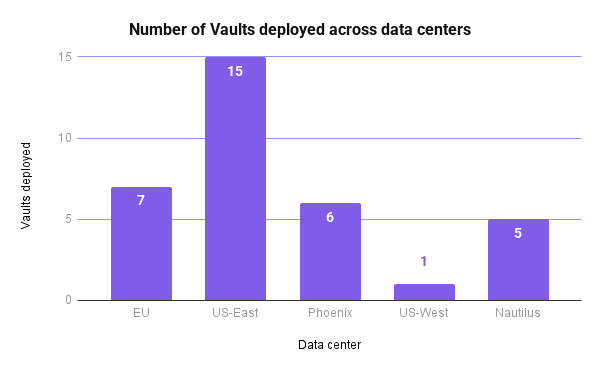
And, here’s a breakdown of the number of Vaults broken down by drive size:
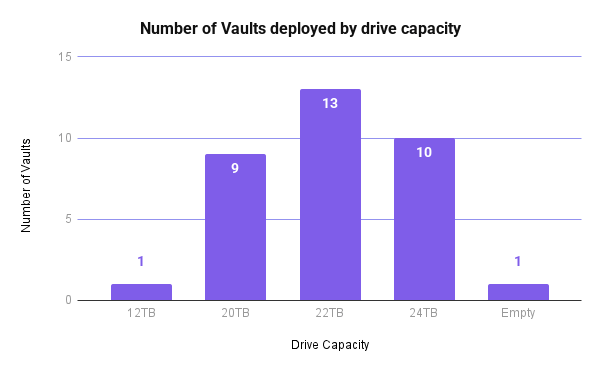
In total, we spent 1043.23 hours on Vault deployment which is about 31.61 hours on average per Vault.
Numbers, as always, tell the story
Taken together, the data shows every hour logged, every drive replaced, every Vault added, and every ticket closed. It adds up to a year’s worth of hands-on infrastructure care; in short, it’s the steady investment required to operate storage at scale.
Whether you’re on call monitoring your own systems, planning for growth in the year ahead, or fully offline over the holidays, your data is here for you. Cheers to another great year!
The post 2025: That’s a Wrap and Here Are the Stats appeared first on Backblaze Blog | Cloud Storage & Cloud Backup
Selecting the Top 25 Photos for 2025
Post Syndicated from The Atlantic original https://www.youtube.com/shorts/4E2dan3tAA8
Elementary OS 8.1 released
Post Syndicated from jzb original https://lwn.net/Articles/1051773/
Version
8.1 of elementary OS has been released. Notable changes in this
release include making the Wayland session the default, changes to
window management and multitasking, as well as a number of
accessibility improvements. The 8.1 release is the first to be made
available for Arm64 devices, which should allow users to run
elementary on Apple M-series hardware or other Arm devices that can
load UEFI-supporting firmware, such as some Raspberry Pi models. See
the blog post for a full list of changes.
[$] A high-memory elimination timeline for the kernel
Post Syndicated from corbet original https://lwn.net/Articles/1051010/
Arnd Bergmann began his 2025 Linux
Plumbers Conference session on the future of 32-bit support in the
Linux kernel by saying that it was to be a followup to his September talk on the same topic. The
focus this time, though, was on the kernel’s “high memory” abstraction, and
when it could be removed. It seems that the kernel community will need to
support 32-bit systems for some time yet, even if it might be possible to
remove some functionality, including support for large amounts of memory on
those systems, more quickly.
[$] Verifier-state pruning in BPF
Post Syndicated from daroc original https://lwn.net/Articles/1050779/
The BPF verifier works, on a theoretical level, by considering every possible
path that a BPF program could take. As a practical matter, however, it needs to
do that in a reasonable amount of time. At the
2025 Linux Plumbers Conference, Mahé Tardy and Paul Chaignon
gave a detailed explanation
(slides;
video) of
the main mechanism that it uses to accomplish that: state pruning. They focused
on two optimizations that help reduce the number of paths the verifier needs to
check, and discussed some of the complications the optimizations introduced to the verifier’s
code.
Security updates for Tuesday
Post Syndicated from jzb original https://lwn.net/Articles/1051758/
Security updates have been issued by AlmaLinux (binutils, curl, gcc-toolset-13-binutils, git-lfs, httpd, httpd:2.4, keylime, libssh, mod_md, openssh, php:8.3, podman, python3.12, python3.9, python39:3.9, skopeo, tomcat, tomcat9, and webkit2gtk3), Fedora (mingw-glib2, mingw-libsoup, and mingw-python3), Mageia (roundcubemail), Oracle (git-lfs and mod_md), and SUSE (glib2, kernel, mariadb, and qemu).
2025
Post Syndicated from Йовко Ламбрев original https://yovko.net/2025/

Отмина цяла година без да напиша и думичка тук. Ако не броим една засега не особено видима публикация, свързана с едно от наскоро възпалените ми отново хобита.
В същия момент е настанало време, в което трябва да се пише (и чете) повече, защото сякаш твърде много се говори… най-често на вятъра. Настанало е време и за ясно изразени, аргументирани позиции. Защото моето поколение скоро ще излезе от активната си възраст, а дебелокожите и дебелогъзите са се запънали да провалят живота и усилията на поне още едно поколение българи.
А конформизмът трябва да стане неуютен. Даже нелицеприятен. Той не е път за сближаване. Той често е прикритие за предателства.
Иначе за добро или лошо, моите позиции по актуалните теми се преместиха от тук в редакционните ми материали в „Тоест“, където съм дежурен веднъж месечно. Но въпреки това, мисля да опитам да пиша по-честичко и тук. Отново.
В тази връзка, честно е да „прослушам“ списъка си с абонати, които получаваха всяка нова публикация тук досега под заглавието yovko in a nutshell. Сайтът ми ще продължи да се нарича така, защото след 23 години да го преименувам ще е престъпление, но абонатите ми ще получават бъдещите публикации тук под ново заглавие, а именно „Кафе, винил и технологии“, което някак е по-конкретно и близо до мен и темите, които ме вълнуват.
Ще попитате къде ще са тогава позициите и политиката… ами на същото място, с други думи навсякъде. Защото всичко е позиция и политика. Дори, когато ги няма в заглавието. Дори когато мълчим.
Затова, ако този текст се е намърдал в електронната ви пощенска кутия, понеже преди сте имали неблагоразумието да се абонирате за публикациите от този блог, но вече искате да ви е тихо и ви се мълчи… моля, отпишете се като щракнете на линка малко по-долу.
На останалите… до скоро!
P.S. Иначе, във връзка с четенето, ако по някаква причина трябва да прочетете само един текст тази година, аз бих препоръчал да не пропускате това есе на James Marriott – колумнист в The Times.
The dawn of the post-literate society
And the end of civilisation
 James Marriott
Manfrotto One Tripod: Functional, Limited & Expensive
Post Syndicated from Matt Granger original https://www.youtube.com/watch?v=QS7_Cf8Ea_8
THG Podcast – Counterfactuals: 732 – The End of Christian Europe?
Post Syndicated from The History Guy: History Deserves to Be Remembered original https://www.youtube.com/watch?v=WGxgVEXL2Ck
Denmark Accuses Russia of Conducting Two Cyberattacks
Post Syndicated from Bruce Schneier original https://www.schneier.com/blog/archives/2025/12/denmark-accuses-russia-of-conducting-two-cyberattacks.html
News:
The Danish Defence Intelligence Service (DDIS) announced on Thursday that Moscow was behind a cyber-attack on a Danish water utility in 2024 and a series of distributed denial-of-service (DDoS) attacks on Danish websites in the lead-up to the municipal and regional council elections in November.
The first, it said, was carried out by the pro-Russian group known as Z-Pentest and the second by NoName057(16), which has links to the Russian state.
Slashdot thread.
Keep Your Printers Happy with Zabbix and PaperCut NG
Post Syndicated from Patrik Uytterhoeven original https://blog.zabbix.com/keep-your-printers-happy-with-zabbix-and-papercut-ng/31705/

We all know the panic when the print system goes down. As I’ve written about before, PaperCut NG is a fantastic tool for managing printing, but even the best software needs a watchful eye to prevent unexpected downtime.
That’s why I’m excited to share a Zabbix template I developed that keeps a close, proactive check on your PaperCut environment. This isn’t about diving into complicated server logs, it’s about making your IT life easier by giving you clear, actionable alerts when printers start to go sideways.
The power of proactive monitoring
Why monitor your print server? It boils down to a few key points:
- Stop Downtime Before It Starts: Imagine getting an alert that your database connection is shaky before users start complaining they can’t print. That’s the power of proactive monitoring.
- Ensure Service Availability: PaperCut is critical for tracking costs, enforcing policies, and keeping things running smoothly. This template ensures the core service is always running smoothly.
- Peace of Mind: Instead of manually checking system status pages, Zabbix becomes your automated, tireless assistant, ready to notify you instantly if there’s an issue.
What does the template monitor?
We have designed this template to focus on the key components that keep PaperCut NG running smoothly, using its built-in HTTP health checks to gather simple ‘yes/no’ answers about the system’s state.
Think of it as an automated checklist that runs every few minutes, reporting back on the most crucial parts of the service:
- Application health: Is the main PaperCut service actually running and responding? (The most critical check!)
- Database connectivity: PaperCut relies entirely on its database. We monitor to make sure the connection is solid and ready to log print jobs.
- Printer status checks: We keep an eye on the printers themselves to ensure they are online and ready to accept print jobs, preventing user frustration from offline devices.
If any of these essential checks fail, Zabbix immediately raises a problem, allowing you or your team to jump in and fix the issue before the print queues fill up or staff can’t release their documents. Of course these are only some of the checks we have added.
Getting started is simpler than you think
You don’t need to be a Zabbix expert to start using this. The entire setup is focused on leveraging Zabbix’s powerful HTTP Agent capabilities, meaning you don’t need to install any extra software on your PaperCut server – just configure the right settings.
Here’s the high-level, non-technical process, fully detailed in the provided documentation:
- Import the template: Download the template-papercut-http.yaml file and import it directly into your Zabbix server.
- Add your PaperCut server: Create a new host in Zabbix representing your PaperCut server.
- Link the template: Attach the newly imported PaperCut template to your host.
- Configure access: The final step involves setting a simple, secure URL and a few configuration macros in Zabbix to tell the template where to check the PaperCut health status.
For step-by-step guidance on this process, you can refer to the full documentation: Monitoring PaperCut NG system health using Zabbix.
Try it out!
This template is open source and ready for you to implement, starting from Zabbix 7.0. It’s a great example of how simple, focused monitoring can save significant time and stress in a busy IT environment.
This project is a contribution from me, developed and made available through OpenSource ICT Solutions (OICTS). We believe in sharing simple, effective solutions to common IT challenges.
You can find the template and documentation on GitHub: OpensourceICTSolutions/ZabbixPapercutNG. Download it, test it, and let us know how it helps keep your printing infrastructure running smoothly!
If you need assistance with the migration or want to ensure best practices for scaling and optimizing Zabbix, don’t hesitate to reach out to OICTS. We are a Zabbix Premium Partner operating globally, with offices in the USA, UK, the Netherlands, and Belgium, and we’re ready to help you every step of the way.
The post Keep Your Printers Happy with Zabbix and PaperCut NG appeared first on Zabbix Blog.
Demystifying user journeys: Revolutionizing troubleshooting with auto tracking
Post Syndicated from Grab Tech original https://engineering.grab.com/auto-track-sdk
Introduction
Troubleshooting critical issues by deciphering a user’s journey on the Grab app is an extremely challenging task. With countless user journeys and multiple paths through the User Interface (UI), it’s akin to searching for a needle in a vast haystack. This challenge frequently resonates with us, the dedicated developers at Grab, as we strive to understand user behaviors, views, and interactions.
The challenge
The distinction between resolving an issue effectively versus spending hours on a wild goose chase is understanding our user journey in real-time.
The development team initially attempted to address the issue of the incomplete user journey tracking by implementing a system where a click stream event would be sent with every user interaction. However, this approach presented significant challenges due to the sheer volume of UI components—often numbering in the hundreds—and the reliance on individual developers to correctly instrument each one.
A common pitfall was that developers would occasionally overlook or forget to instrument certain user interactions, leading to breaks in the recorded user journey. This created a highly frustrating situation for both the development and product teams, as the integrity of the user journey data was consistently compromised. Despite continuous efforts to patch these bugs and address the omissions, the team found themselves in a perpetual state of reaction, constantly trying to catch up with newly discovered breaches rather than proactively preventing them. This reactive approach consumed valuable resources and hindered the ability to gain a complete and accurate understanding of user behavior.
Diagnosing system failures, application bugs, or poor user experiences in complex applications becomes inefficient without real-time performance metrics and detailed session tracking. When engineering teams rely on outdated or fragmented data, they are forced to piece together issue narratives reactively, long after the issues occur. This significantly delays the Mean Time To Resolution (MTTR). Such a reactive approach leads to increased downtime, higher operational costs, customer dissatisfaction, and a waste of developers’ time, as they spend more time “hunting” for clues rather than deploying solutions or new features.
Our ‘Eureka’ moment: AutoTrack SDK
The pivotal breakthrough that provides our unique advantage was the creation of auto tracking user journeys—our “Eureka” moment. To deliver this, we developed the new Software Development Kit (SDK) called AutoTrack.
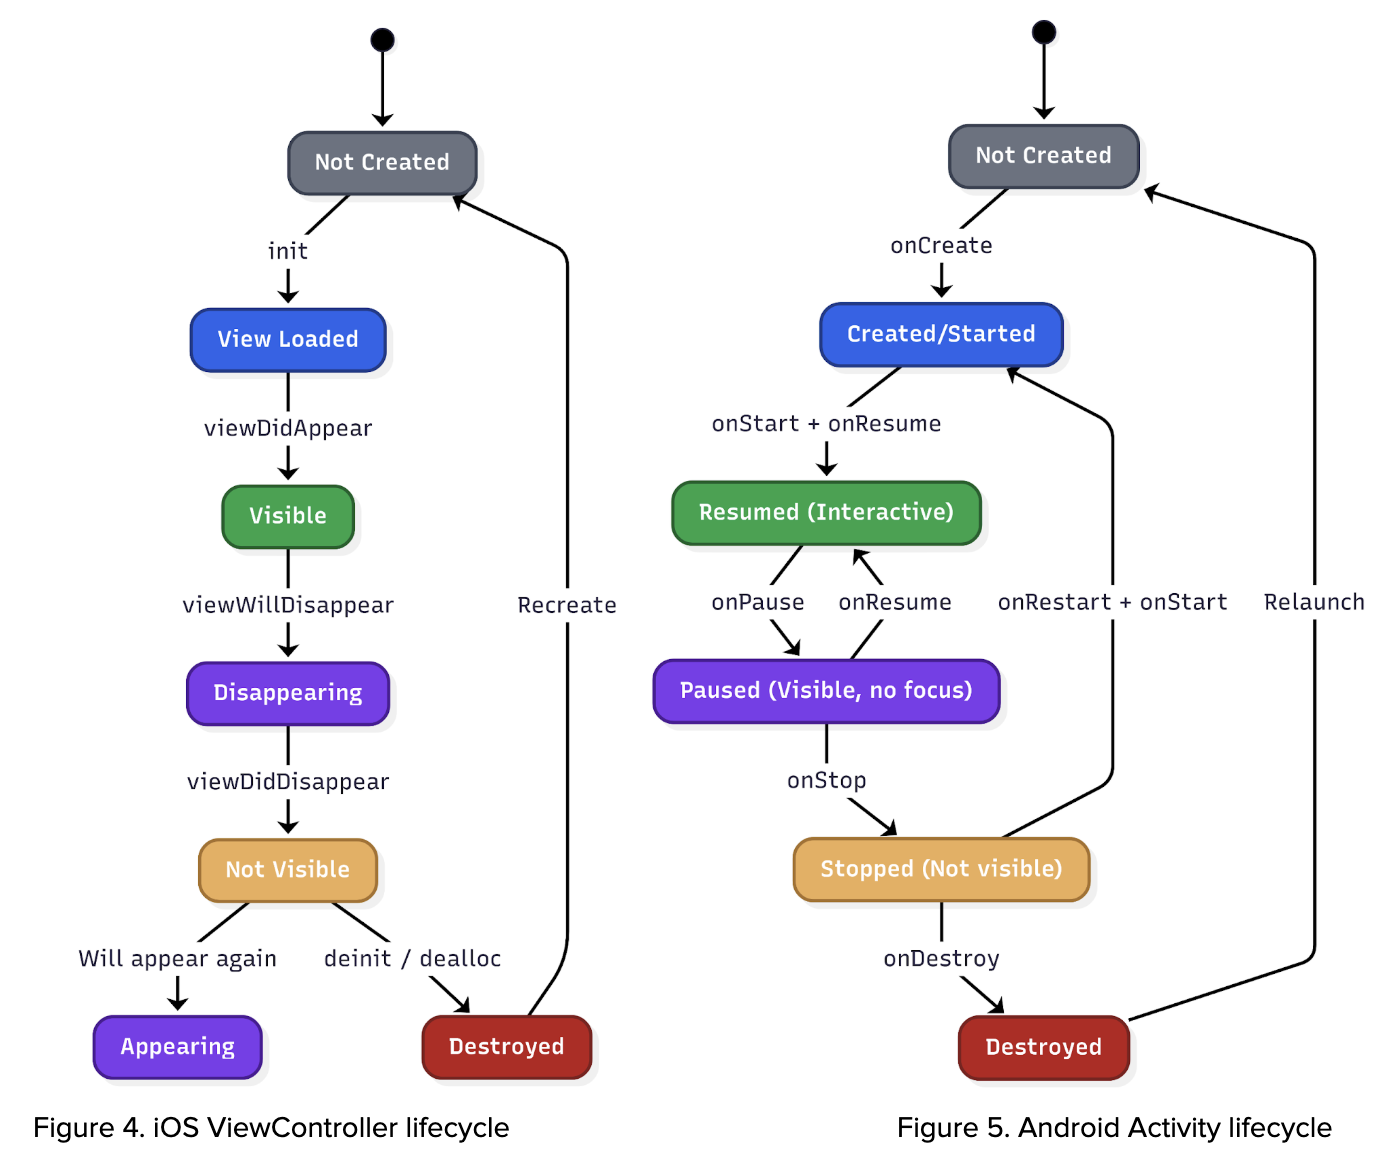
AutoTrack is system that comprehensively records application state, UI view state, as well as user interactions – a solution that pieces together a chronicle of the user journey, from launch to interactions, as they navigate through the screens. AutoTrack SDK is built on the three core pillars:
- Application state
- User interactions
- UI screens
Let’s delve deeper into the mechanics of how this operates.
Application state
Understanding the application state is fundamental to comprehending user behavior and, consequently, executing effective troubleshooting. The application state provides crucial insights into how a user interacts with the app, particularly concerning its visibility and how it was initiated. This encompasses tracking when the app moves between the background and foreground, as well as the various launch mechanisms.
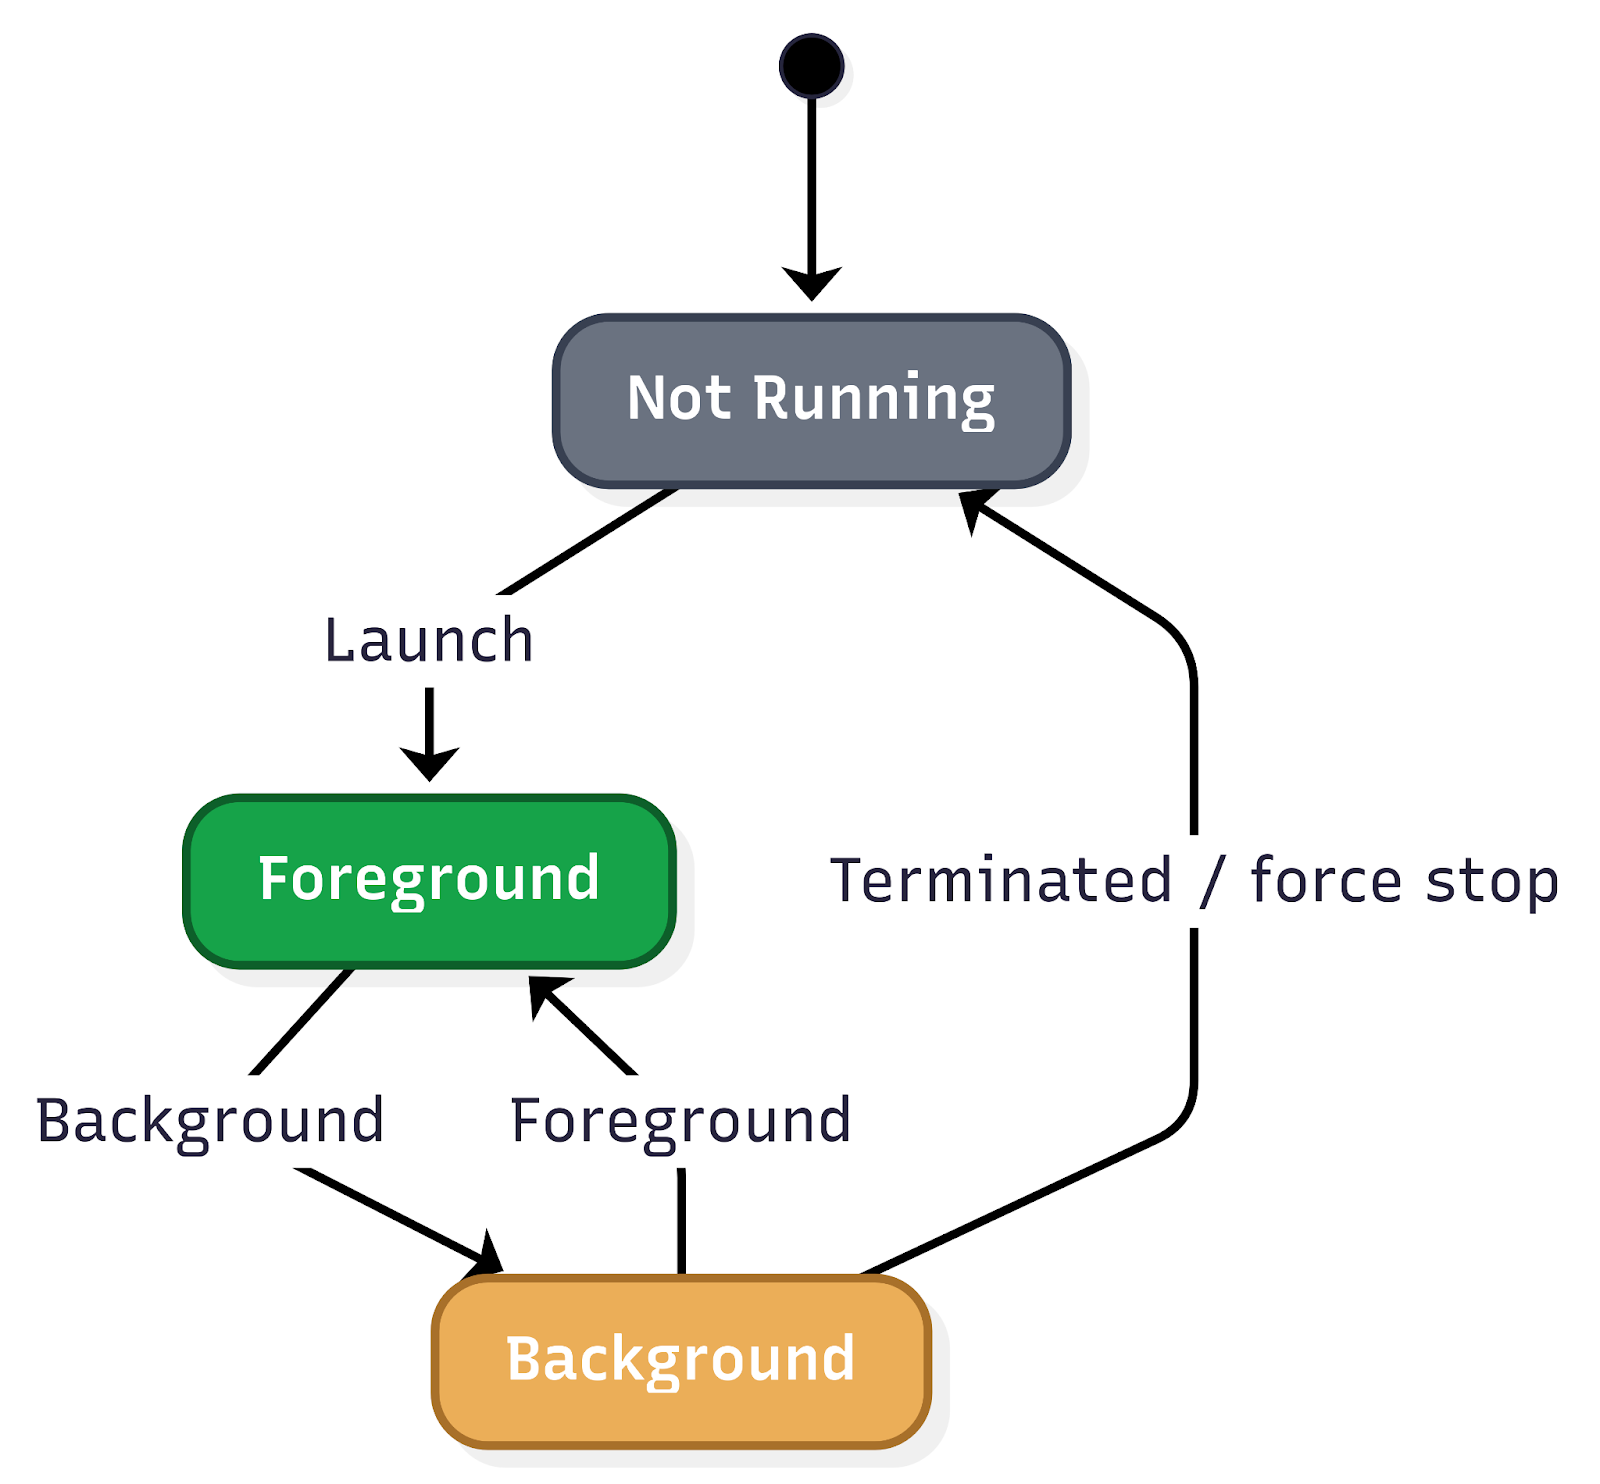
Key aspects of application state that are vital to monitor include:
Application lifecycle transitions:
- Background state: When the app is running but not actively displayed to the user (e.g., the user switches to another app, or the device is locked). Understanding how frequently and for how long an app resides in the background can inform power consumption analysis and the effectiveness of background tasks.
- Foreground state: When the app is actively in use and displayed to the user. Monitoring transitions into and out of the foreground provides a real-time view of user engagement.
- Inactive state: A temporary state where the app is in the foreground but not receiving events (e.g., an incoming call temporarily interrupts the app).
- Suspended state: An app that is in the background and has been explicitly suspended by the operating system to free up resources.
- Terminated state: When the app has been completely closed or crashed. Differentiating between intentional termination and crashes is critical for identifying stability issues.
Application launch mechanisms:
The way an app is launched significantly impacts the initial user experience and can influence subsequent interactions. Tracking these different launch types is essential for understanding user entry points and for debugging issues that might be specific to a particular launch method.
- Explicit user launch: This is the most straightforward launch mechanism, where the user directly taps on the app icon from their device’s home screen or app drawer. This indicates a deliberate intent to use the app and often signifies a primary entry point for regular users.
- Deeplinks: Deeplinks are URLs that, when clicked, open a specific page or section within a mobile app rather than a web page. They are powerful tools for enhancing user experience and engagement by providing direct access to relevant content.
- Push notifications: Push notifications are messages sent by an app to a user’s device even when the app is not actively in use. Tapping on a push notification often launches the app and directs the user to a specific context related to the notification’s content.
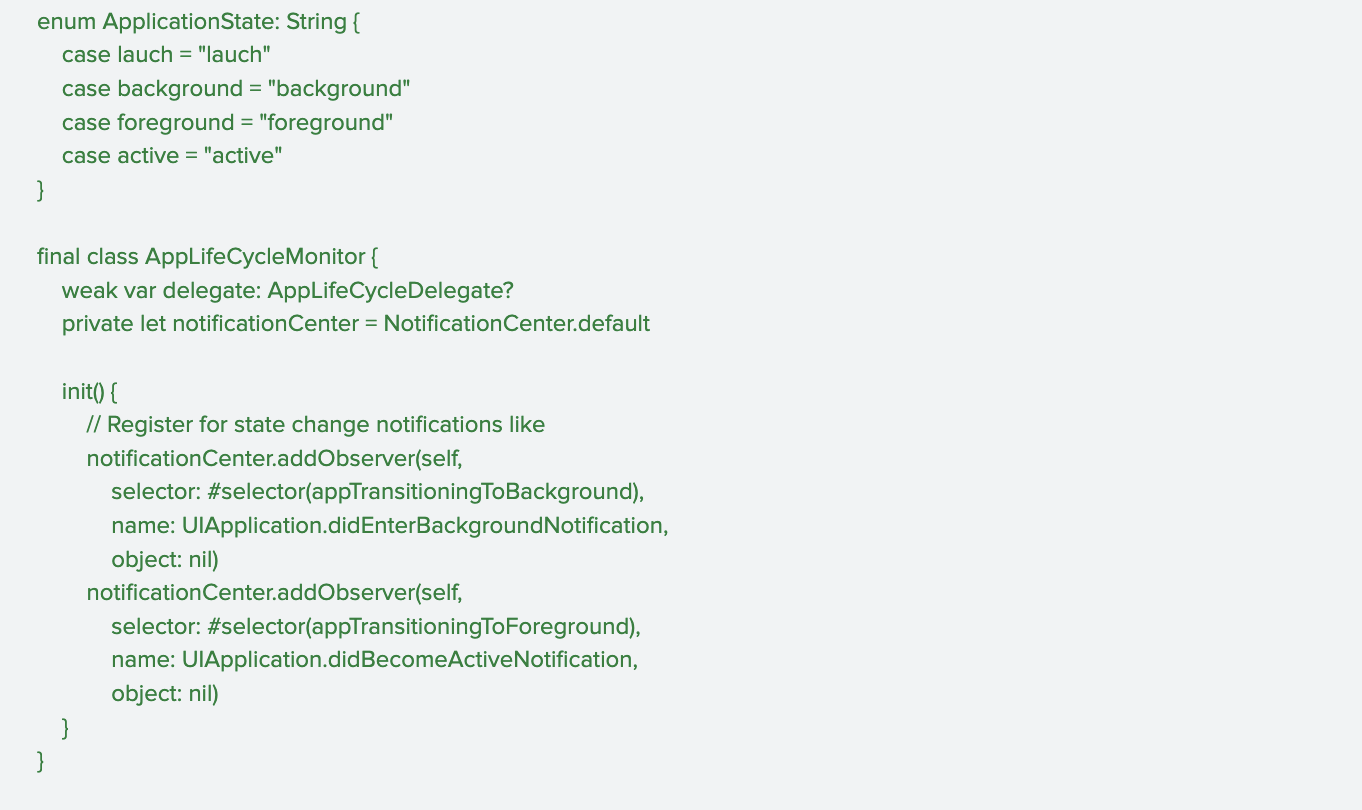
User interactions
Real-time session tracking is a crucial component in understanding user behavior and optimizing app performance. By meticulously tracking a wide array of user interactions, the system provides invaluable insights into how users navigate and engage with the app. This granular data forms the bedrock for constructing comprehensive user journeys, allowing development teams to visualise the path a user takes from their initial entry point to achieving their goals within the app.
This deep understanding of user interactions is the most important pillar in creating accurate and insightful user journey maps. These maps, in turn, are instrumental in identifying patterns of user behavior, both positive and negative. For instance, tracking helps to identify pain points, bugs, or areas of confusion that might lead to user frustration or abandonment.

UI screen
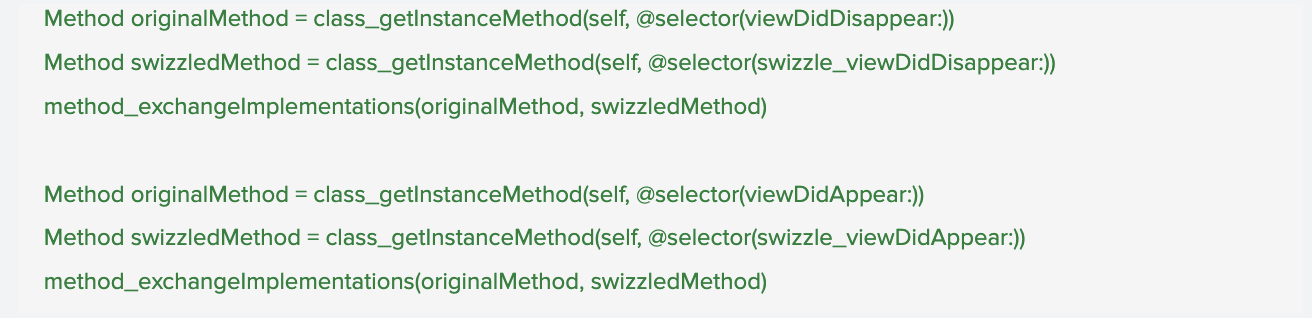
The system leverages lifecycle events from UIViewController (iOS), Activity (Android), and Fragments (Android) to accurately identify and track which specific screen is currently displayed to the user. This granular level of screen tracking is crucial because it significantly enriches the contextual information available to us. By understanding the precise UI that users are interacting with, we can account for the dynamic nature of our app. Different geographical regions, diverse user segments, and varying operational scenarios can lead to distinct user interfaces being presented. This capability ensures that our analysis and troubleshooting efforts are always based on the actual user experience, allowing for more precise problem identification and more effective solutions.
UI screen data
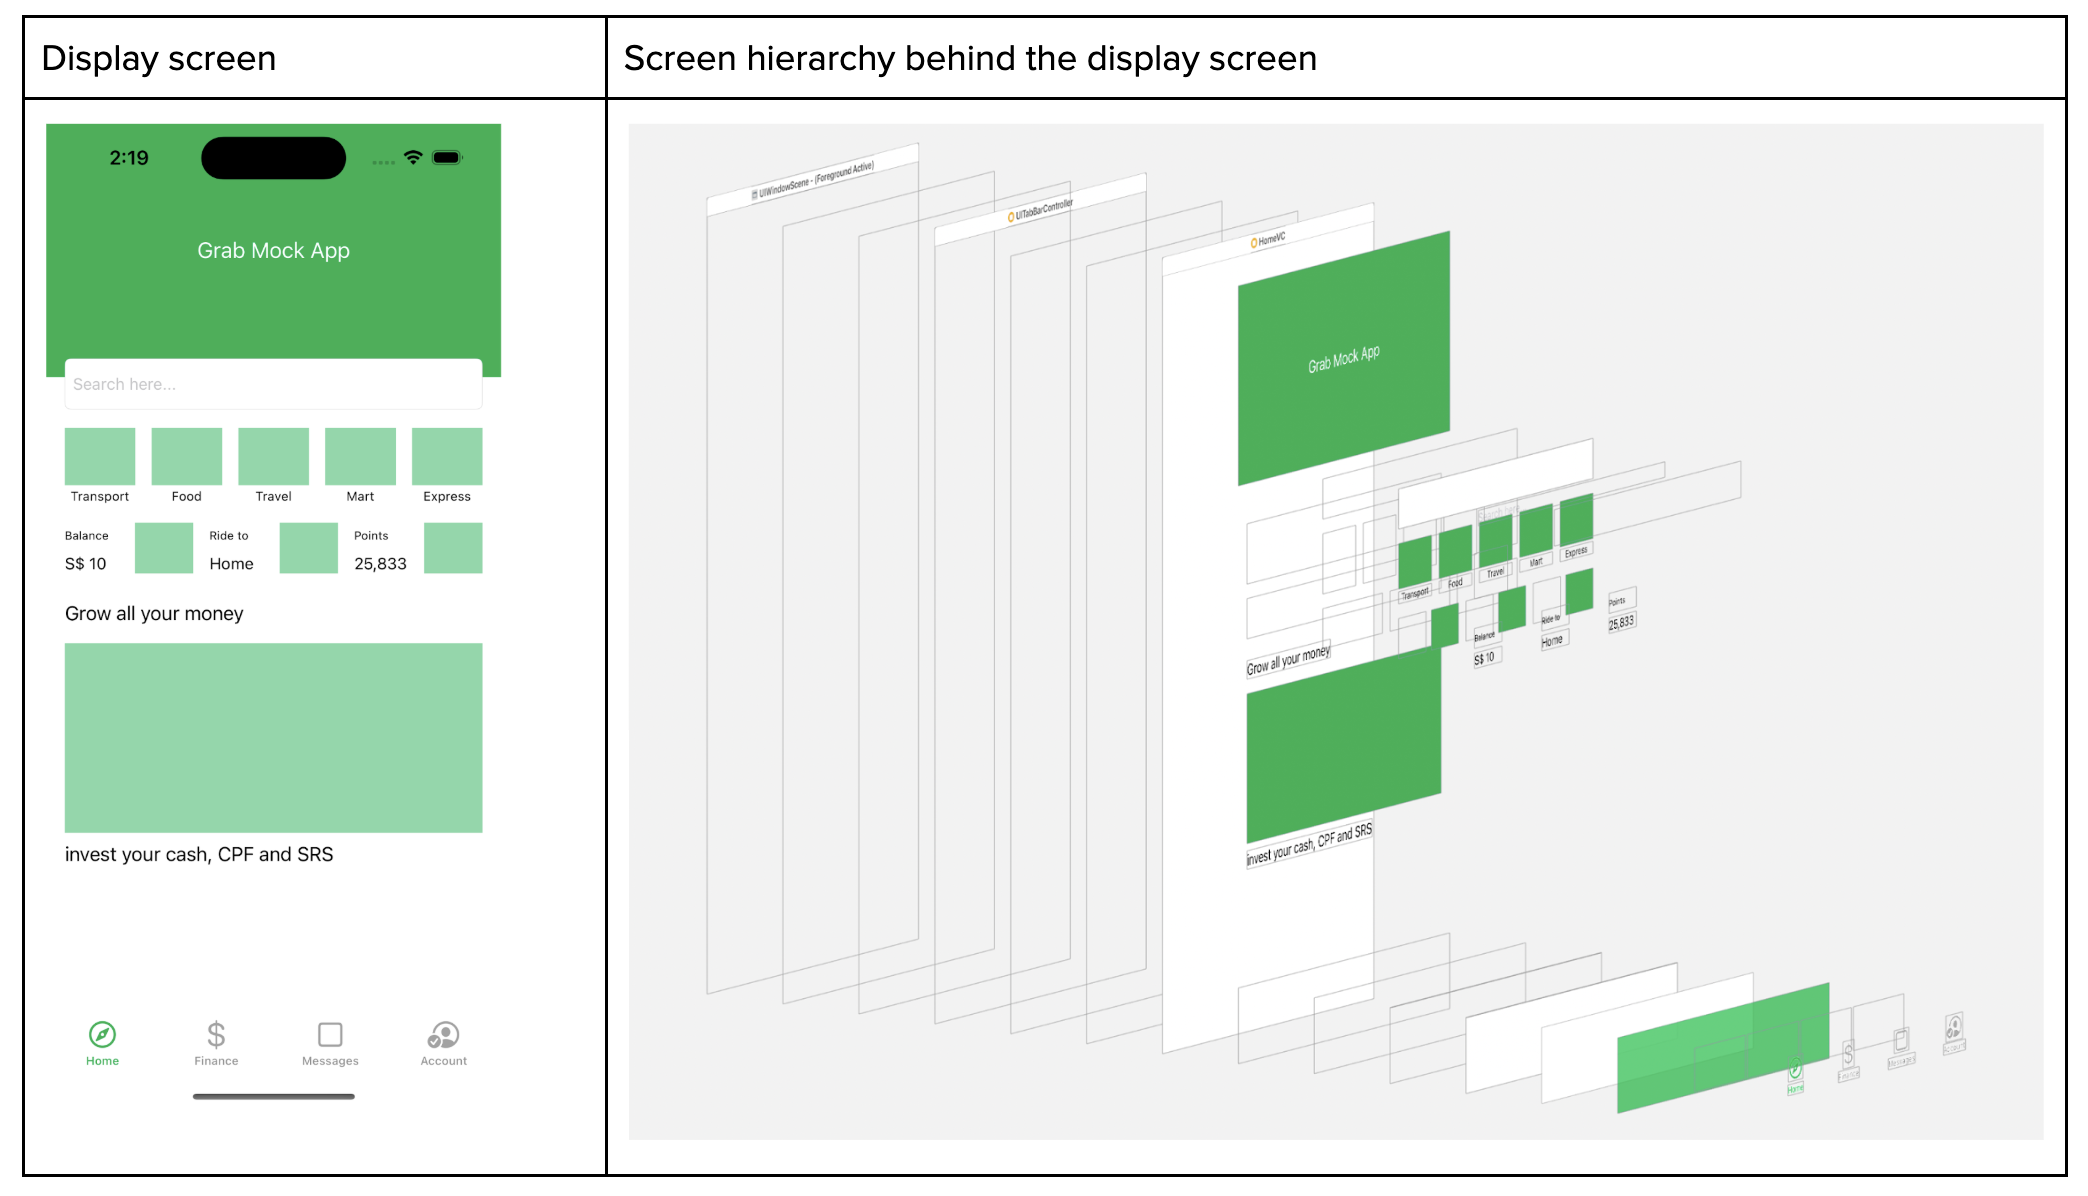
On top of that, whenever the screen appears, we capture the screen metadata where we read the full screen hierarchy. With the Screen hierarchy JSON data at hand, we employ it to train an AI model. This model, consequently, can generate an HTML file, which mirrors the user’s screen and interaction.
Disclaimer: information is redacted in compliance with GDPR/PDPA, personal data protection laws.
Applications of AutoTrack
Key applications of AutoTrack data:
- Reconstructing user journeys and reproducing elusive bugs: One of the most significant benefits of AutoTrack is its ability to meticulously record user interactions within the app. This detailed session data allows our teams to precisely recreate the user journey that led to a reported issue. For bugs that are notoriously difficult to reproduce, this capability is a game-changer, eliminating hours of manual guesswork and dramatically accelerating the identification and resolution of underlying problems.
- Automated issue assignment: When an issue is reported, AutoTrack data can be leveraged to automatically assign it to the most relevant team. By analysing the context of the issue within the recorded session, including the specific features or modules involved, the system can intelligently route the problem to the engineers best equipped to address it. This automation reduces triage time, ensures issues are handled by subject matter experts, and improves overall response efficiency.
- Automating UI test case generation: The rich dataset provided by AutoTrack offers a powerful foundation for automating the creation of UI test cases. By observing how users interact with the interface, we can automatically generate test scripts that mimic real-world usage patterns. This not only speeds up the testing phase but also leads to more comprehensive test coverage, identifying edge cases and user flows that might otherwise be missed by manually written tests.
- Understanding analytics event triggers: AutoTrack data provides a granular view into when and why specific analytics events are triggered within the application. This allows us to validate the accuracy of our analytics instrumentation, ensure that events are firing as expected, and gain deeper insights into user behavior. By understanding the precise context surrounding event triggers, we can refine our data collection strategies and derive more meaningful insights from our analytics.
Key takeaways and what’s next
AutoTrack replaces fragile manual instrumentation with a unified, real-time view of application state, screen context, and user interactions. That end-to-end trace makes elusive bugs reproducible, routes issues to the right owners, and seeds reliable UI tests—turning guesswork into grounded evidence so teams can ship fixes faster and with greater confidence.
Looking ahead, we are expanding AutoTrack across surfaces and deepening the context it captures—pairing sessions with network and performance signals, strengthening privacy guardrails, and integrating with automated triage and test generation. Look forward to reading more of our deep dives on auto-generated UI tests and how these journeys will power proactive quality across Grab’s app.
Join us
Grab is a leading superapp in Southeast Asia, operating across the deliveries, mobility and digital financial services sectors. Serving over 800 cities in eight Southeast Asian countries, Grab enables millions of people everyday to order food or groceries, send packages, hail a ride or taxi, pay for online purchases or access services such as lending and insurance, all through a single app. Grab was founded in 2012 with the mission to drive Southeast Asia forward by creating economic empowerment for everyone. Grab strives to serve a triple bottom line – we aim to simultaneously deliver financial performance for our shareholders and have a positive social impact, which includes economic empowerment for millions of people in the region, while mitigating our environmental footprint.
Powered by technology and driven by heart, our mission is to drive Southeast Asia forward by creating economic empowerment for everyone. If this mission speaks to you, join our team today!
The Rare UniFi Switch You Can’t Buy Anymore
Post Syndicated from Crosstalk Solutions original https://www.youtube.com/shorts/apCneV4SsGk
Beelink GTi15 Ultra Review A Dual 10GbE Mini PC with a PCIe GPU Dock Option
Post Syndicated from Ryan Smith original https://www.servethehome.com/beelink-gti15-ultra-review-a-dual-10gbe-mini-pc-with-a-pcie-gpu-dock-option-intel-amd/
In our Beelink GTi15 Ultra review, we see how this dual 10GbE mini PC has so many features including the option for an external PCIe GPU dock
The post Beelink GTi15 Ultra Review A Dual 10GbE Mini PC with a PCIe GPU Dock Option appeared first on ServeTheHome.
Unifying governance and metadata across Amazon SageMaker Unified Studio and Atlan
Post Syndicated from Karan Singh Thakur, Satabrata Paul original https://aws.amazon.com/blogs/big-data/unifying-governance-and-metadata-across-amazon-sagemaker-unified-studio-and-atlan/
This post was cowritten with Satabrata Paul and Karan Singh Thakur from Atlan
In this post, we show you how to unify governance and metadata across Amazon SageMaker Unified Studio and Atlan through a comprehensive bidirectional integration. You’ll learn how to deploy the necessary Amazon Web Services (AWS) infrastructure, configure secure connections, and set up automated synchronization to maintain consistent metadata across both platforms.
As organizations scale their data and AI programs, teams often work across distributed tools such as governance solutions for business users and analytics or machine learning (ML) environments for technical teams. Without tight integration between these systems, metadata becomes fragmented. A single asset can appear under different names, documentation might drift out of sync, and governance signals can become inconsistent across systems.
To address these challenges, Atlan, a modern data workspace that makes collaboration among diverse users like business, analysts, and engineers easier, increasing efficiency and agility in data projects, and AWS have built a bidirectional integration between Atlan and Amazon SageMaker Unified Studio. This integration creates a continuous connection between both environments so every team within the enterprise can work with a single, trusted, and synchronized view of metadata for their data and AI assets. By bridging the gap between diverse users collaborating in Atlan and technical teams working within Amazon SageMaker Unified Studio for analytics and ML, this integration maintains consistency across both platforms without requiring teams to switch contexts or manually reconcile metadata differences.
Why unified metadata governance matters
Enterprises today operate in hybrid environments. Business users rely on Atlan as an active metadata solution to manage, govern, and collaborate on data assets across the modern data stack. Atlan helps teams find, understand, and trust their data so they can use it effectively to drive business outcomes.
Organizations also use Amazon SageMaker Catalog to simplify the discovery, governance, and collaboration for both business and technical data across structured and unstructured sources. Teams can use the catalog to organize data products, capture context, and apply governance policies consistently within Amazon SageMaker Unified Studio.
This new integration synchronizes metadata between SageMaker Catalog and Atlan, maintaining consistency and keeping content current across both environments. With a unified view, every team within the enterprise can work confidently with a single, trusted representation of their data and AI assets.
Solution overview
The solution follows a phased rollout strategy to provide you with immediate value while progressively expanding toward comprehensive data and AI governance capabilities. The current phase focuses on establishing secure, scalable, and reliable metadata synchronization between Atlan and Amazon SageMaker Unified Studio.
The Phase 1 integration between Amazon SageMaker Catalog and Atlan enables both on-demand and scheduled bidirectional metadata synchronization across the two solutions. It uses the standard APIs of Amazon SageMaker Unified Studio and Atlan to create a scalable and configurable mechanism for metadata exchange. Key capabilities include:
- Secure connection using IAM roles – The integration is established through a controlled AWS Identity and Access Management (IAM) based handshake. A predefined AWS CloudFormation template automatically provisions the IAM role and policies required to enable a secure, least-privilege connection between Amazon SageMaker Catalog and the Atlan application.
- On-demand and scheduled synchronization – The integration supports both manual and automated metadata synchronization. API-driven workflows manage the exchange of glossary terms, asset descriptions, and classifications in both directions, keeping metadata consistent across systems.
After you’ve implemented Phase 1, you can perform bidirectional synchronization of glossary terms and descriptions between Amazon SageMaker Unified Studio and Atlan. This keeps your terminology consistent across both platforms, and your teams can maintain a single source of truth for business definitions. The integration also preserves your glossary structures, including parent-child relationships, so your carefully organized taxonomy remains intact during the sync process. Additionally, glossary terms are automatically associated with related data assets, saving you the manual effort of linking terms to the appropriate datasets and reducing the risk of inconsistencies.
Beyond glossary management, Phase 1 enables comprehensive ingestion of assets and metadata from Amazon SageMaker Unified Studio into Atlan. This includes your projects, both published and subscribed assets, domains and data products, glossaries and terms, metadata forms, and column descriptions. By bringing this information into Atlan, you create a unified view of your data landscape that makes it easier for data consumers to discover, understand, and trust the data they’re working with.
Prerequisites
To follow along with this integration setup, you must have the following resources already configured in your environment:
- An Atlan tenant
- A Node group IAM role
- An Amazon SageMaker Unified Studio domain.
- At least one Amazon SageMaker Unified Studio project with assets created and glossary terms defined.
- Atlan API Token. You can generate this by navigating to API access under the Atlan’s Admin center.
- Atlan top-level glossary. You can create this glossary container on Atlan to ingest SageMaker Unified Studio glossaries and terms.
The next section offers a step-by-step walkthrough of the integration, from initial setup to full operation. It demonstrates how you can establish the trust handshake between Amazon SageMaker Unified Studio and Atlan and how bidirectional synchronization functions in practice.
Setup on AWS
To begin the integration, you need Atlan’s Account Node Instance IAM role. This role allows the Atlan SageMaker Unified Studio application to securely assume the IAM role that you will create in your AWS account using an AWS CloudFormation template. The trust relationship between these two roles authorizes Atlan to publish metadata to Amazon SageMaker Catalog and to perform reverse synchronization from AWS back into Atlan.
The IAM policy follows the principle of least privilege, granting Atlan access only to the resources necessary for cataloging and governance. This approach maintains accurate metadata synchronization while preserving your existing cloud security and compliance controls.
Follow AWS best practices when configuring trust relationships. These cross-account access mechanisms require careful management and monitoring, particularly during security incidents. For comprehensive guidance on securing IAM roles and trust policies, refer to the Security best practices in IAM and Require workloads to use temporary credentials with IAM roles to access AWS.
Contact your Atlan administrator to obtain the Amazon Resource Name (ARN) of the Atlan Account Node Instance IAM role. You will need this value when configuring the CloudFormation stack in AWS.
The next step is to create an AWS IAM role using the provided CloudFormation template. This role establishes the trust relationship between your Amazon SageMaker Unified Studio environment and your Atlan tenant. Follow these steps:
- Access the CloudFormation template. The CloudFormation template is currently available as a YAML file.
- On the AWS Management Console, navigate to CloudFormation and choose Create stack, then choose With new resources (standard), as shown in the following screenshot.

- Choose the provided CloudFormation template and choose Next.
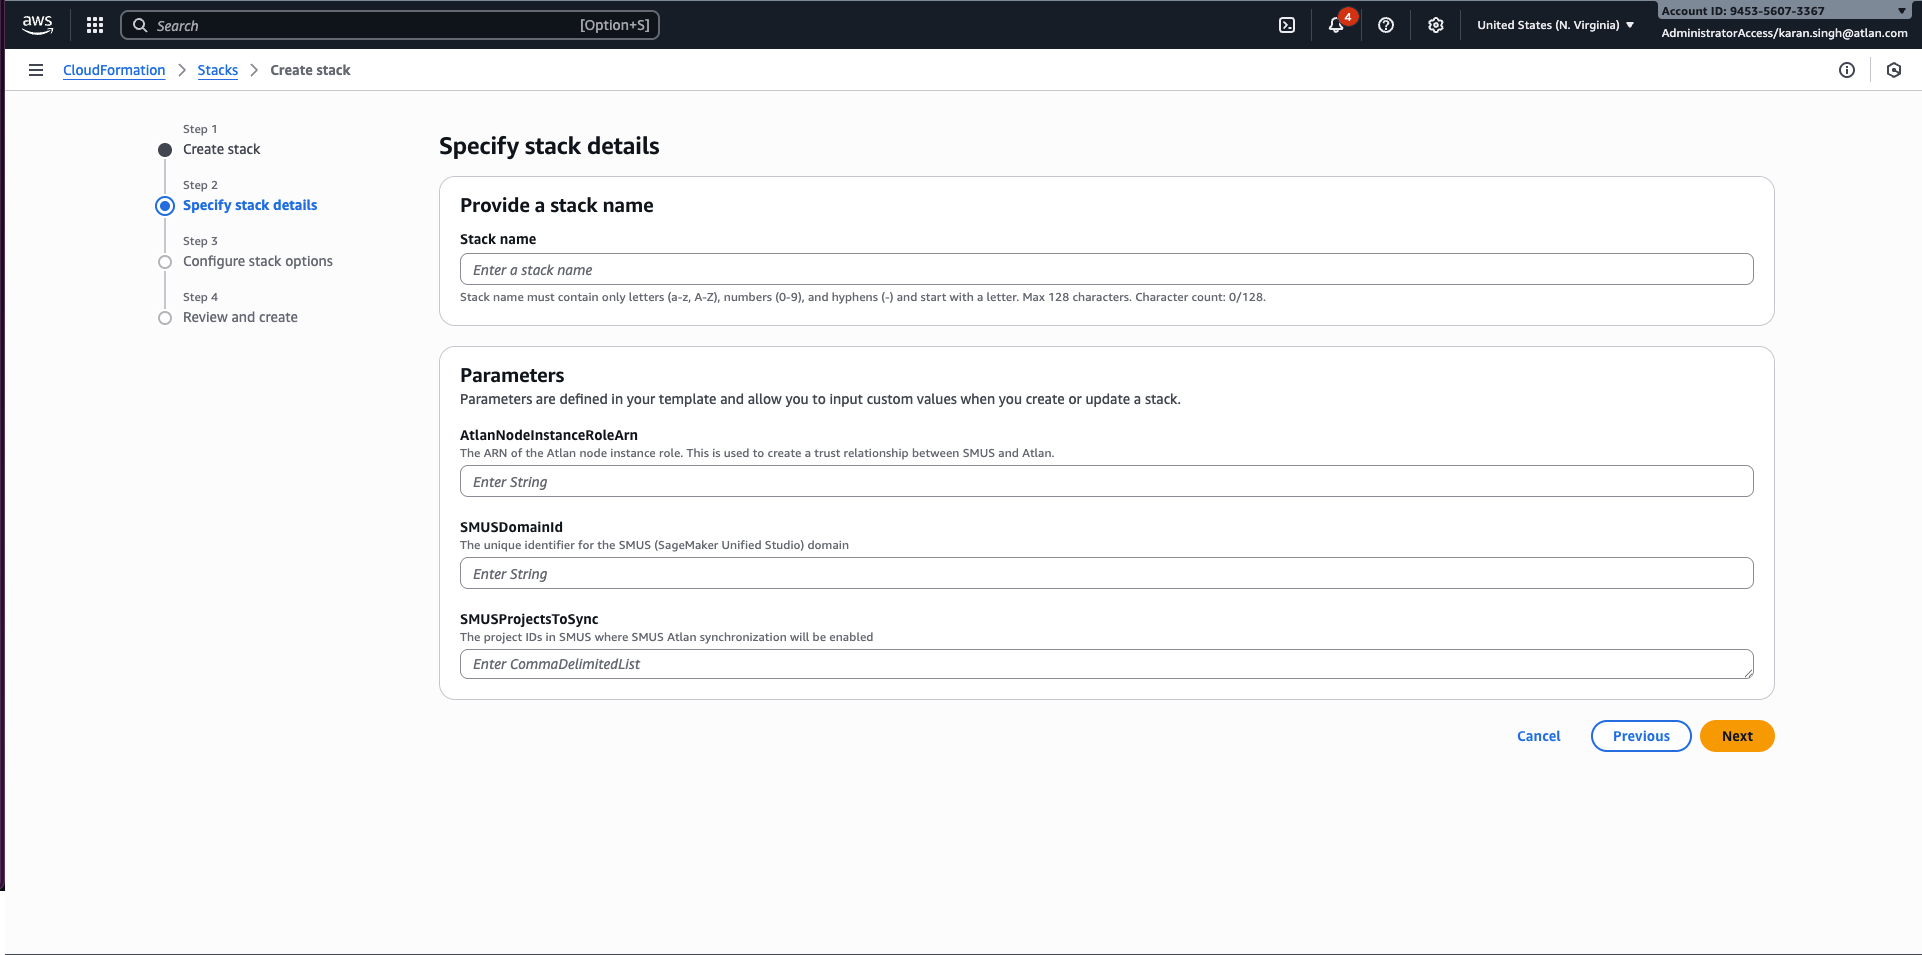
- Enter a name for the stack and complete the required parameters, as shown in the following screenshot:
- AtlanNodeInstanceRoleArn – The ARN of the Atlan node instance role.
- SMUSDomainId – The unique identifier for the SageMaker Unified Studio domain.
- SMUSProjectsToSync – The project IDs where SageMaker Unified Studio and Atlan synchronization will be enabled. You can choose to either add the project IDs and keep updating this stack every time a Project is added or add the created IAM role to each project as owner.
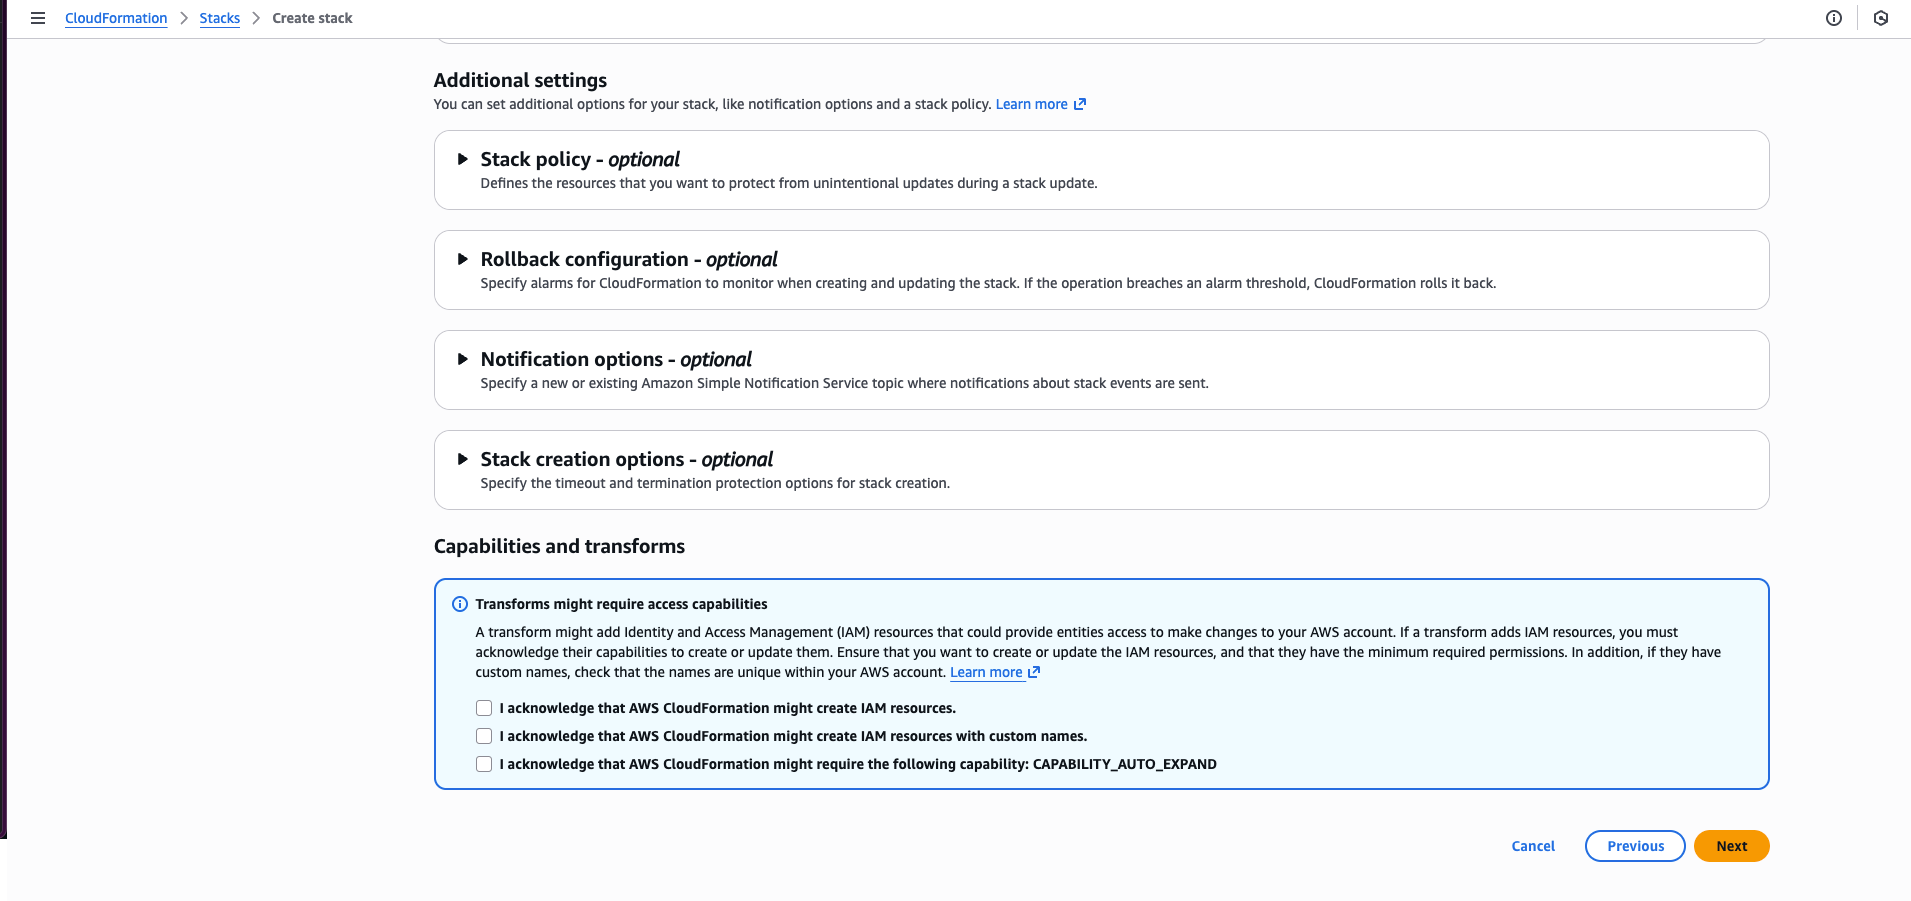
- Select the acknowledgement checkbox and choose Next, as shown in the following screenshot.
- Choose Submit to start the stack deployment. When the process is complete, the stack status will update to
CREATE_COMPLETE. - Note the IAM role ARN
- After the CloudFormation stack has been deployed and the IAM role has been created, copy the IAM Role ARN from the CloudFormation output. You will need this value during the configuration process on the Atlan side to establish the secure connection between your Amazon SageMaker Unified Studio environment and your Atlan tenant.


Setup on Atlan
Now that you’ve deployed the necessary AWS resources, you’ll configure Atlan to establish the connection with Amazon SageMaker Unified Studio. This involves setting up the API token, configuring the IAM role, and creating the glossary container that will receive your synchronized metadata. Follow these steps:
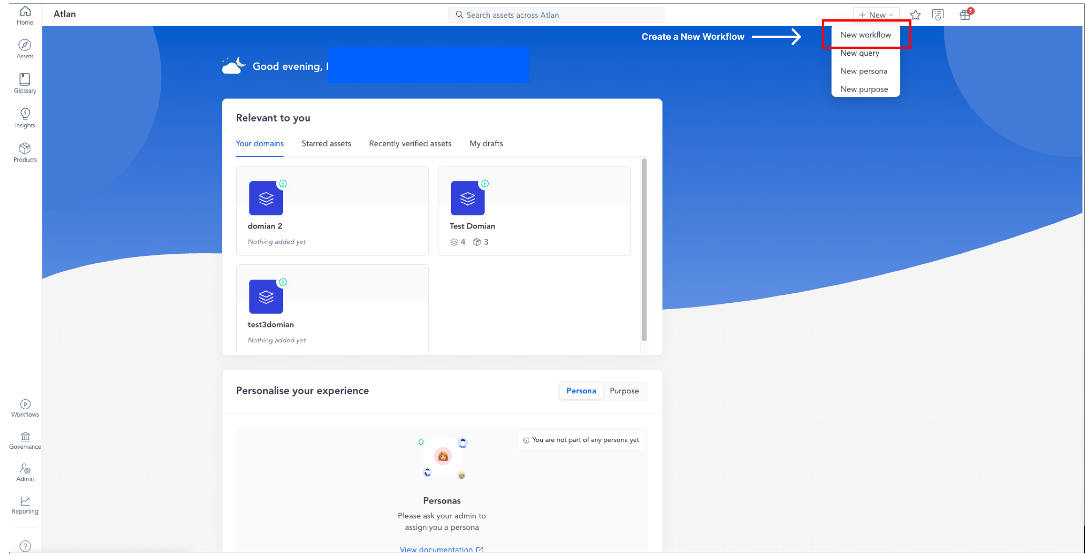
- Sign in to your Atlan tenant, as shown in the following screenshot.
- On the New dropdown menu, choose New workflow.
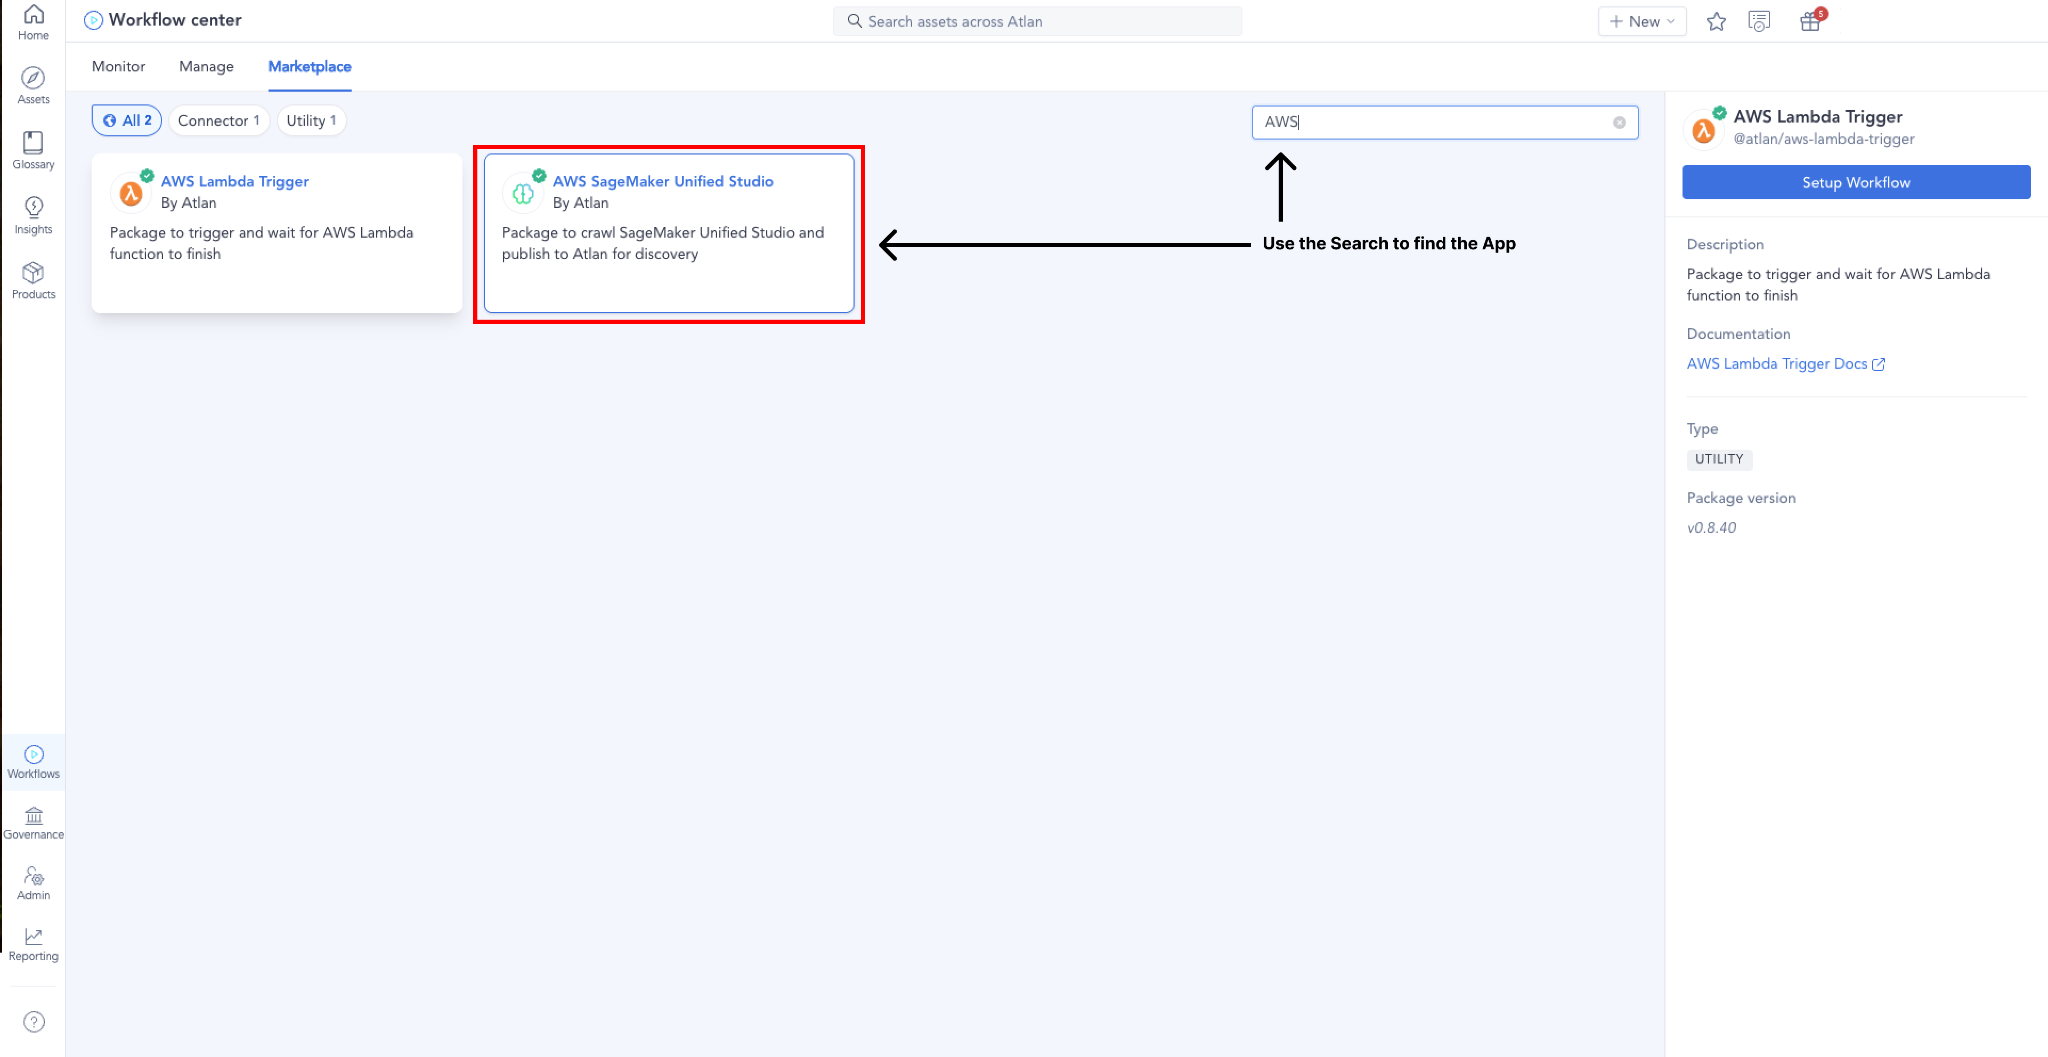
- On the Marketplace tab, search for and select the AWS SageMaker Unified Studio app, as shown in the following screenshot.
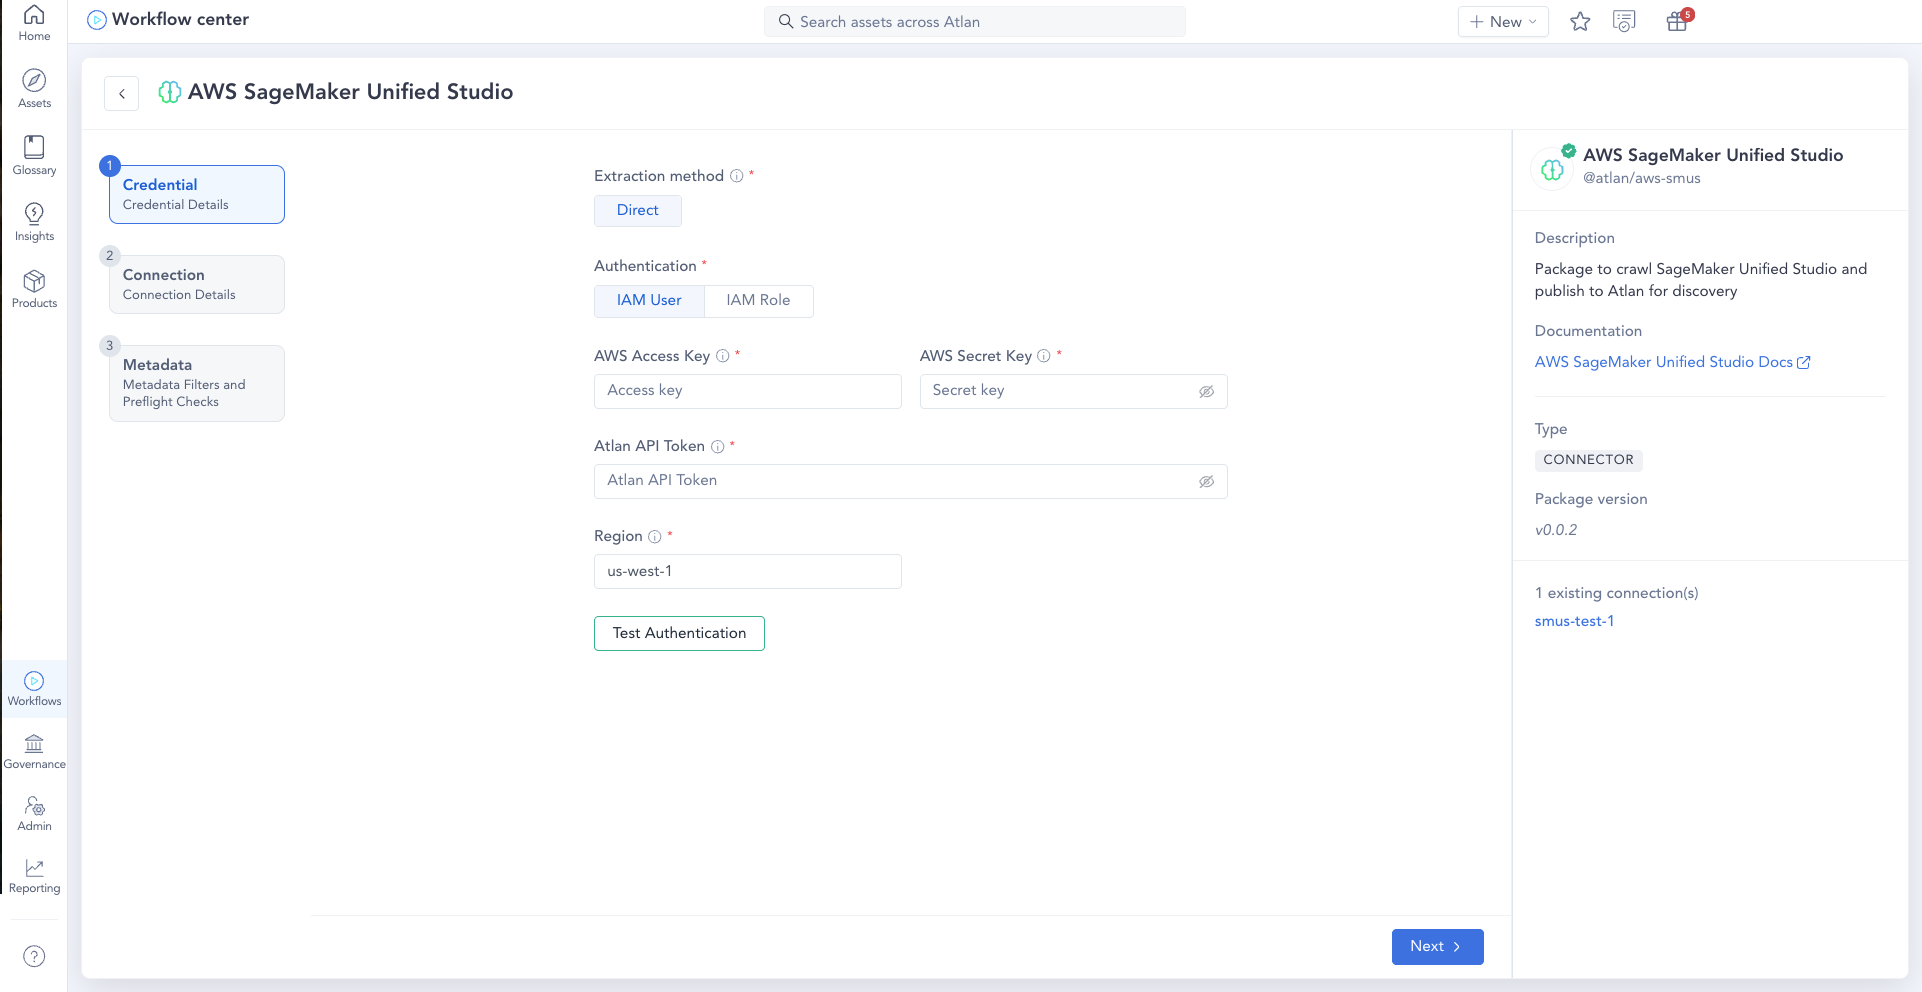
- Enter credential details. Use the IAM role or user created by the CloudFormation template before, enter an API token, and choose your AWS Region, as shown in the following screenshot.
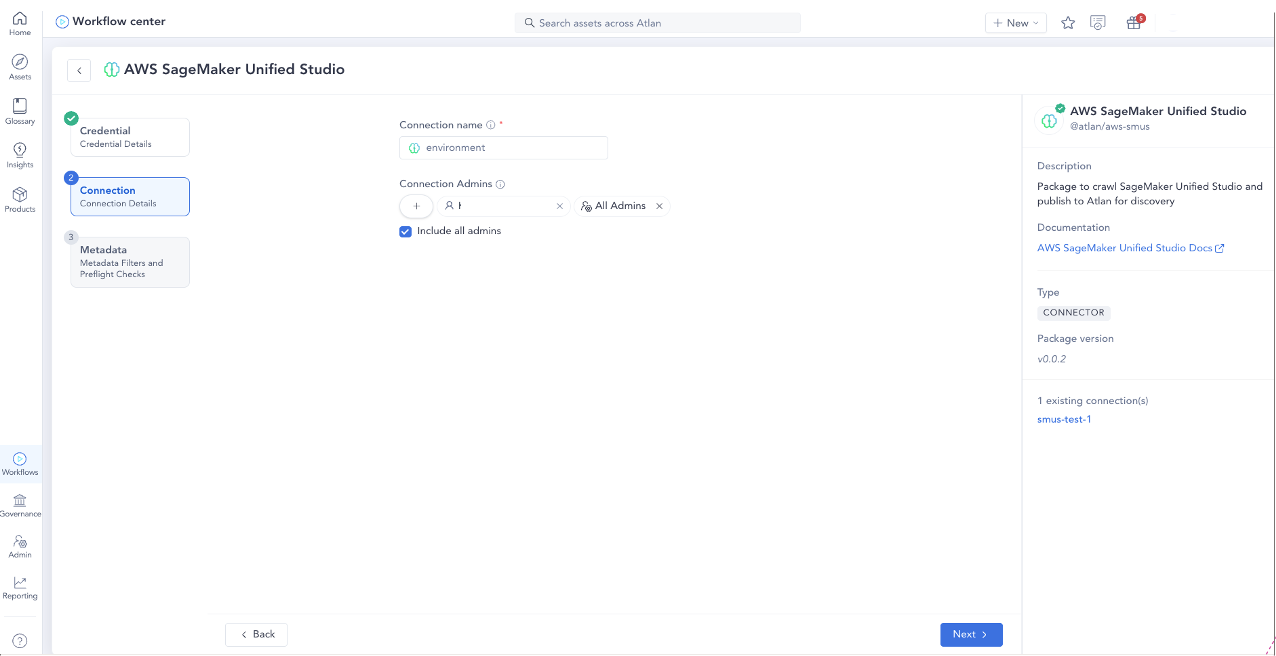
- Enter connection details. In Connection name, enter a name. Under Connection Admins, choose the plus icon to add members (other users) to the connectors as admins. Assigning admin permissions to the connection allows these users to:
- View and edit the assets in the connection.
- Edit connection preferences.
- Edit persona-based policies for the connection.
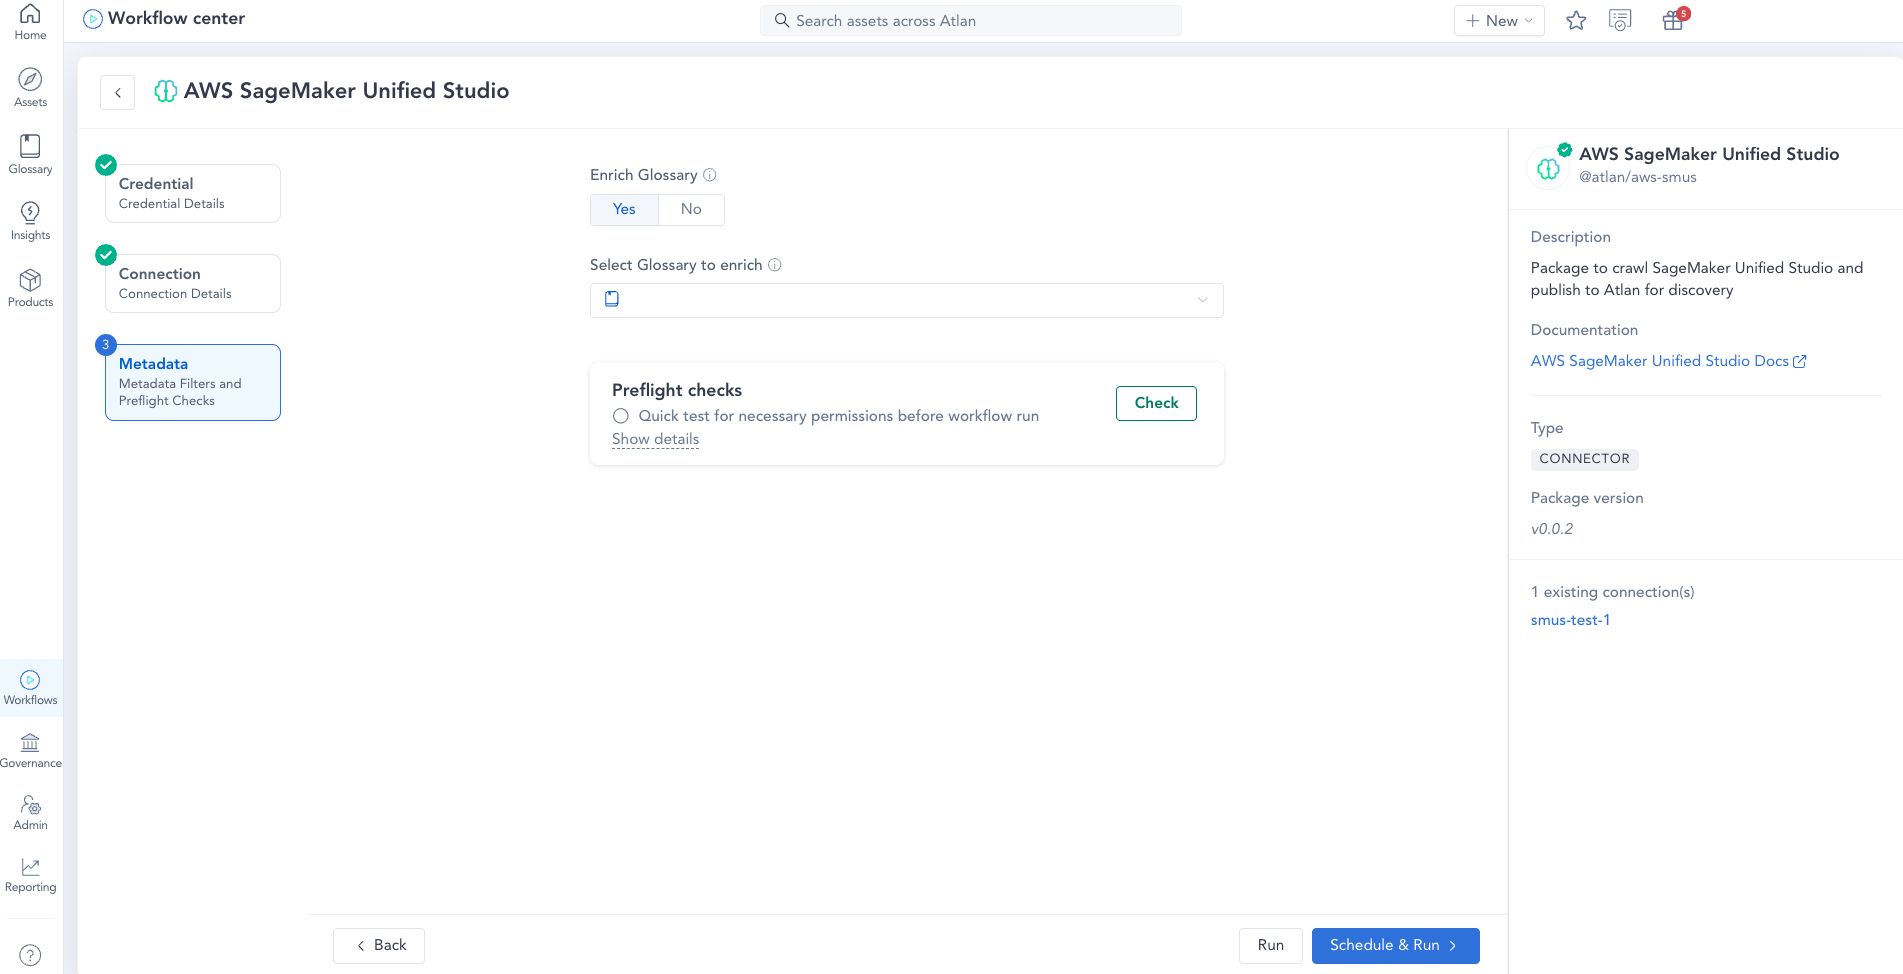
- Choose metadata filters and preflight checks, as shown in the following screenshot:
- In the Select Glossary to enrich dropdown menu, choose the glossary container in Atlan to be enriched with glossaries and terms from Atlan.
- To check for necessary permissions required to run the workflow, select Quick test for necessary permissions before workflow run.
- To run the workflow, choose Run. To schedule it to run later, choose Schedule & Run.

Synchronization of metadata
Now that you’ve configured the integration between Atlan and Amazon SageMaker Unified Studio, let’s explore how metadata flows bidirectionally between both platforms to maintain consistency and governance across your data landscape.
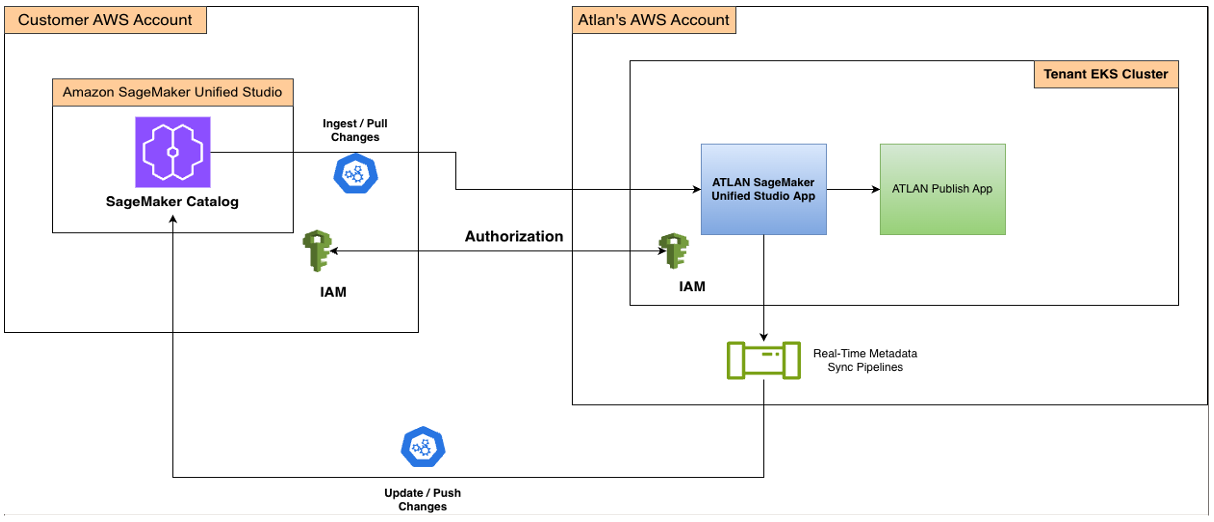
The Atlan SageMaker Unified Studio connector uses a bidirectional synchronization model that keeps business context and technical metadata consistent across both solutions. The process delivers reliability, traceability, and governance-safe updates, regardless of where changes originate. The following diagram illustrates the solution architecture.
Sequential workflow for the SageMaker Unified Studio Atlan integration
The integration between SageMaker Unified Studio and Atlan follows a carefully orchestrated sequential workflow that enables seamless metadata synchronization across both platforms.
The process begins with connection setup through IAM, where authentication and authorization are configured to establish secure access between the customer’s AWS account and Atlan’s AWS environment. This foundational security layer allows subsequent data exchanges to occur within a trusted framework.
After the connection is established, the metadata sync workflow can be triggered either on a defined schedule or manually by the user, providing flexibility based on organizational needs. When triggered, the Atlan SageMaker Unified Studio app calls the SageMaker Unified Studio APIs to ingest assets and metadata from the source system.
The ingested assets then undergo processing and transformation within Atlan, where they are converted into Atlan’s metadata model. This processing step is crucial because it makes the assets discoverable, searchable, and governable inside the Atlan platform, which means teams can use Atlan’s full governance capabilities.
A key capability of this integration is its real-time reverse sync for metadata updates. When a user modifies metadata for the assets inside Atlan (such as adding tags or updating descriptions), Atlan’s real-time reverse sync pipelines immediately detect these changes and push the updates back to SageMaker Unified Studio. This keeps SageMaker Unified Studio reflecting the most up-to-date metadata entered by users in Atlan, eliminating the risk of metadata drift between systems.
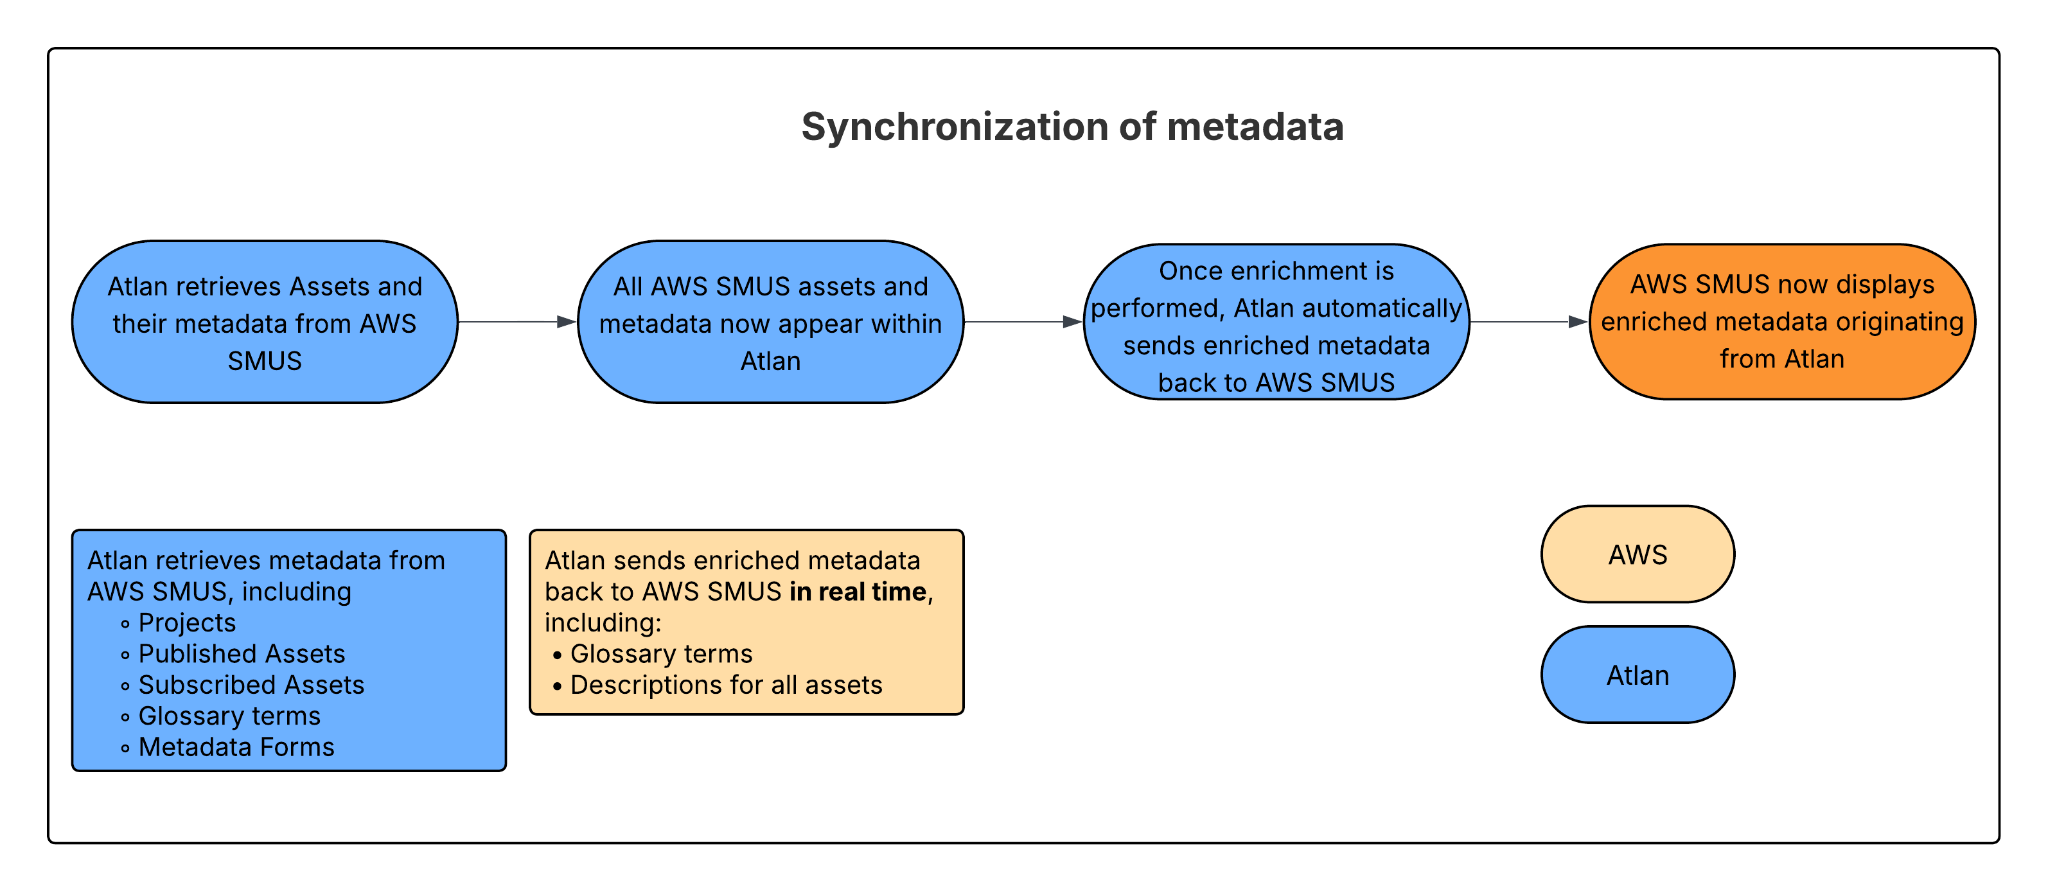
This bidirectional sync creates a continuous loop where metadata flows from SageMaker Unified Studio to Atlan for ingestion and publication, simultaneously flowing back from Atlan to SageMaker Unified Studio through real-time reverse sync. The result is a consistent, bidirectional metadata flow that keeps both platforms synchronized. Teams can work confidently knowing that their metadata governance efforts are reflected across their data.
The following diagram illustrates this complete workflow, showing how metadata moves through each stage of the integration from initial IAM authentication through the continuous bidirectional sync loop that maintains metadata consistency across both platforms.
SageMaker Unified Studio to Atlan: Ingestion of metadata
The Atlan-SageMaker Unified Studio App periodically connects to SageMaker Unified Studio using secure API calls to ingest metadata. This metadata is transformed and mapped into Atlan’s metadata model, then published through the Atlan publish app as new or updated assets.
Each ingestion cycle is fully logged by Atlan’s audit service, which captures timestamps, correlation IDs, and the full change record. These logs support deduplication, troubleshooting, and replay in the event of partial failures.
Atlan to SageMaker Unified Studio: Synchronizing enriched business context
When users enrich assets inside Atlan, for example by updating descriptions or attaching glossary terms, the integration detects these changes and selectively pushes them back to SageMaker Unified Studio.
The reverse sync control plane is a pipeline that automatically detects changes made to assets and then triggers SageMaker Unified Studio Update API calls in the background to keep everything synchronized.
What’s next?
Phase 1 delivers core metadata synchronization and principal catalog selection for immediate consistency across your data governance platforms. Phase 2 will synchronize lineage and data quality, so teams see the same data flows and quality signals in both Atlan and SageMaker Catalog, enabling end-to-end visibility into how data moves through your pipelines and maintaining quality metrics consistently tracked across both systems. Phase 3 will add integrated approval workflows to streamline how access is requested and granted across solutions, reducing friction for data consumers while maintaining robust governance controls. These upcoming phases build toward a fully connected governance experience, keeping metadata, lineage, quality, and access policies aligned across the modern data stack.
Cleanup
If you no longer need the SageMaker Unified Studio connector integration, complete the following steps to clean up your environment and avoid unintended resource usage:
- Delete the CloudFormation stack. Navigate to the AWS CloudFormation console, locate the stack deployed for this solution, and choose Delete. This action removes the AWS resources provisioned by the stack, including IAM roles, policies, and supporting components.
- Remove the connection in Atlan. Visit Delete a connection to follow the steps outlined in Atlan’s documentation to delete the associated connection.
Cleaning up these components keeps your AWS and Atlan environments streamlined, secure, and cost-efficient.
Conclusion
In this post, you learned how to establish a bidirectional integration between Atlan and Amazon SageMaker Unified Studio that unifies metadata governance across your data and AI environments. You walked through deploying the necessary AWS infrastructure using CloudFormation, configuring the secure IAM based connection, and setting up bidirectional synchronization to keep glossary terms, descriptions, and governance context aligned across both platforms.
Organizations can use this integration to connect business and technical users within a single governance framework, creating a consistent, trusted view of data across the enterprise. With one secure configuration, teams can synchronize metadata between Atlan and Amazon SageMaker Unified Studio, establishing a reliable foundation for innovation, collaboration, and responsible AI at scale.
About the authors
Incus 6.20 released
Post Syndicated from jzb original https://lwn.net/Articles/1051664/
Version
6.20 of the Incus container and virtual-machine management system
has been released. Notable changes in this release include a new
standalone
command to add IncusOS servers to a cluster,
qcow2-formatted
volumes for clustered LVM, and reverse
DNS records in OVN. See the announcement for a full list of
changes.