Security updates have been issued by Debian (freetype and rails), Fedora (mosquitto and python-django4.2), Mageia (libarchive, libreoffice, php, and quictls), Red Hat (webkit2gtk3), SUSE (erlang, nethack, python312, and wpa_supplicant), and Ubuntu (freetype and plantuml).
Security and attacks continues to be a very active environment, and the visibility that Cloudflare Radar provides on this dynamic landscape has evolved and expanded over time. To that end, during 2023’s Security Week, we launched our URL Scanner, which enables users to safely scan any URL to determine if it is safe to view or interact with. During 2024’s Security Week, we launched an Email Security page, which provides a unique perspective on the threats posed by malicious emails, spam volume, the adoption of email authentication methods like SPF, DMARC, and DKIM, and the use of IPv4/IPv6 and TLS by email servers. For Security Week 2025, we are adding several new DDoS-focused graphs, new insights into leaked credential trends, and a new Bots page to Cloudflare Radar. We are also taking this opportunity to refactor Radar’s Security & Attacks page, breaking it out into Application Layer and Network Layer sections.
Below, we review all of these changes and additions to Radar.
Layered security
Since Cloudflare Radar launched in 2020, it has included both network layer (Layers 3 & 4) and application layer (Layer 7) attack traffic insights on a single Security & Attacks page. Over the last four-plus years, we have evolved some of the existing data sets on the page, as well as adding new ones. As the page has grown and improved over time, it risked becoming unwieldy to navigate, making it hard to find the graphs and data of interest. To help address that, the Security section on Radar now features separate Application Layer and Network Layer pages. The Application Layer page is the default, and includes insights from analysis of HTTP-based malicious and attack traffic. The Network Layer page includes insights from analysis of network and transport layer attacks, as well as observed TCP resets and timeouts. Future security and attack-related data sets will be added to the relevant page. Email Security remains on its own dedicated page.
A geographic and network view of application layer DDoS attacks
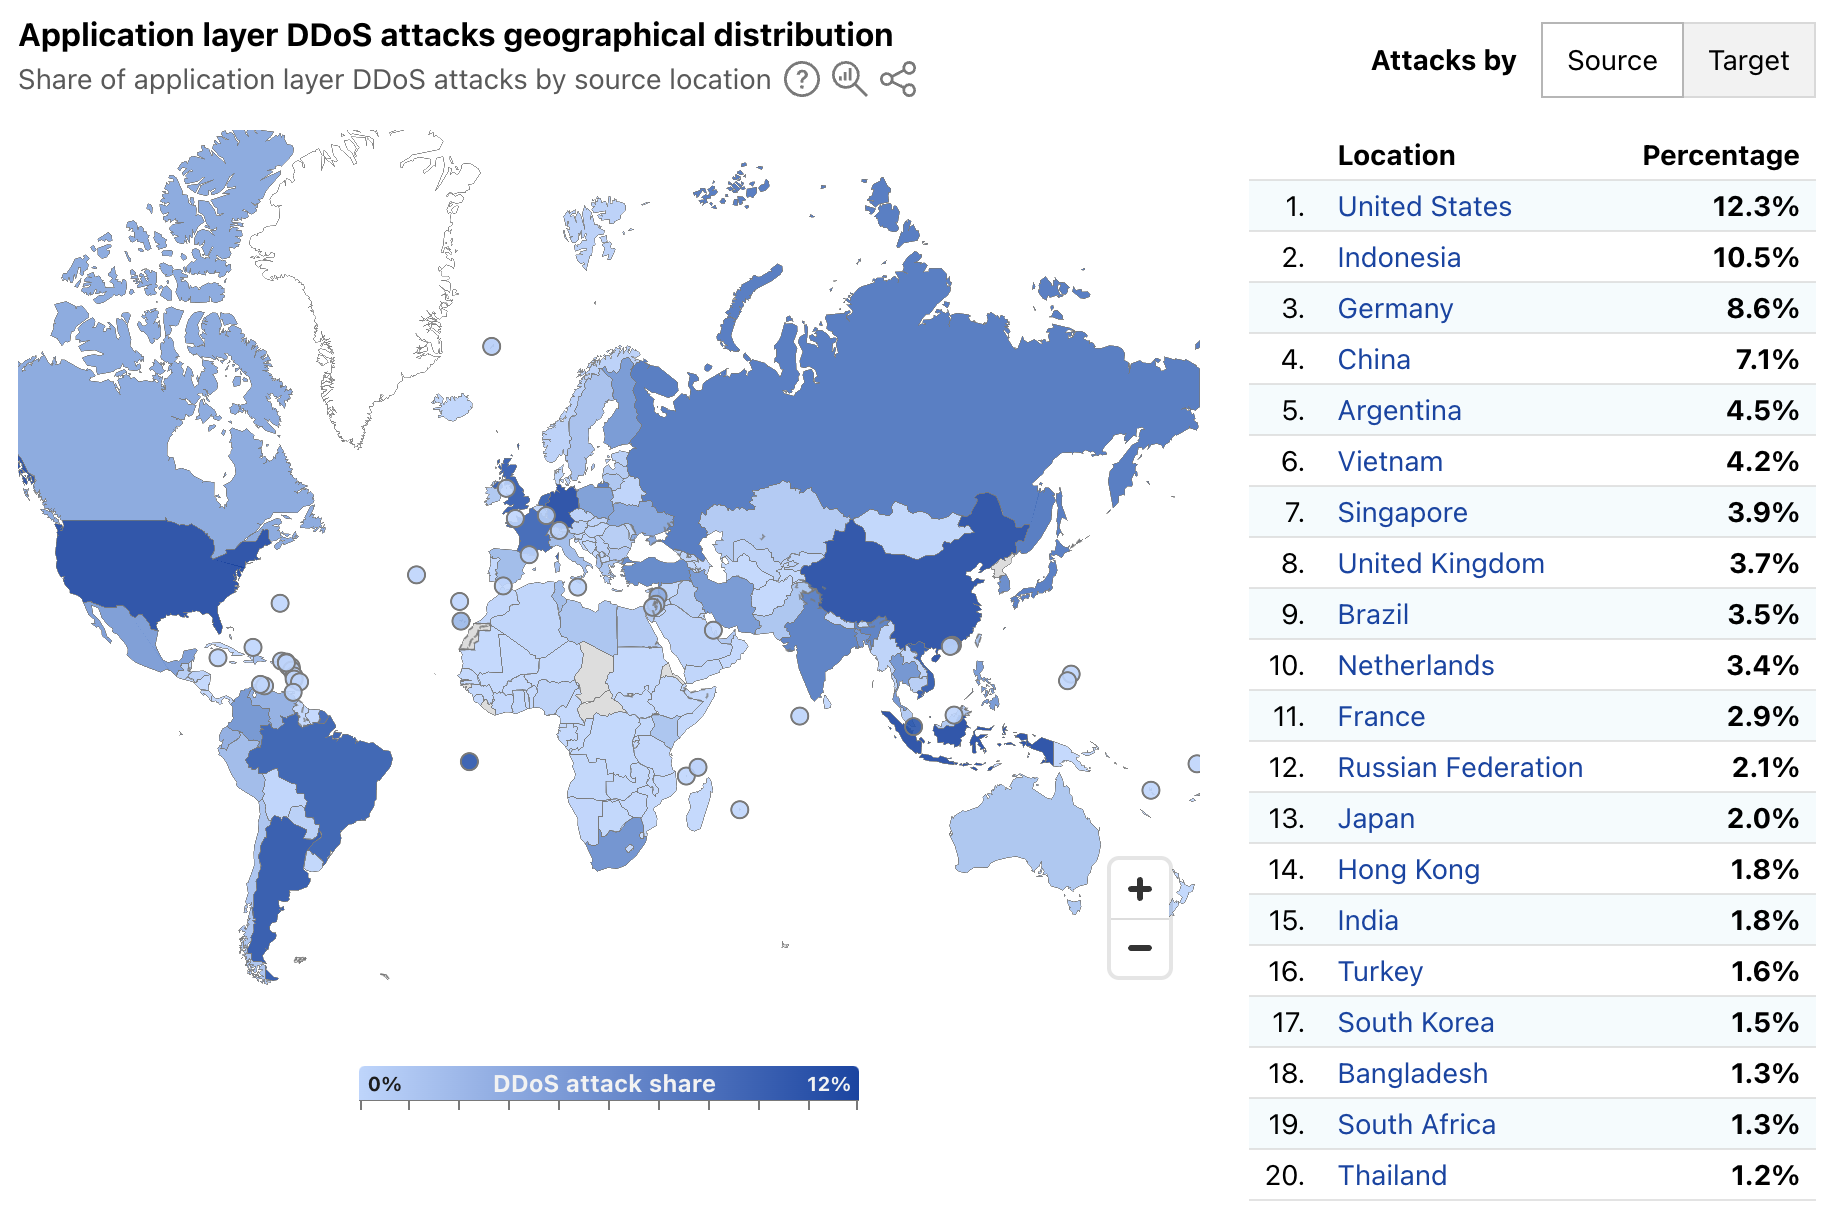
Radar’s quarterly DDoS threat reports have historically provided insights, aggregated on a quarterly basis, into the top source and target locations of application layer DDoS attacks. A new map and table on Radar’s Application Layer Security page now provide more timely insights, with a global choropleth map showing a geographical distribution of source and target locations, and an accompanying list of the top 20 locations by share of all DDoS requests. Source location attribution continues to rely on the geolocation of the IP address originating the blocked request, while target location remains the billing location of the account that owns the site being attacked.
Over the first week of March 2025, the United States, Indonesia, and Germany were the top sources of application layer DDoS attacks, together accounting for over 30% of such attacks as shown below. The concentration across the top targeted locations was quite different, with customers from Canada, the United States, and Singapore attracting 56% of application layer DDoS attacks.
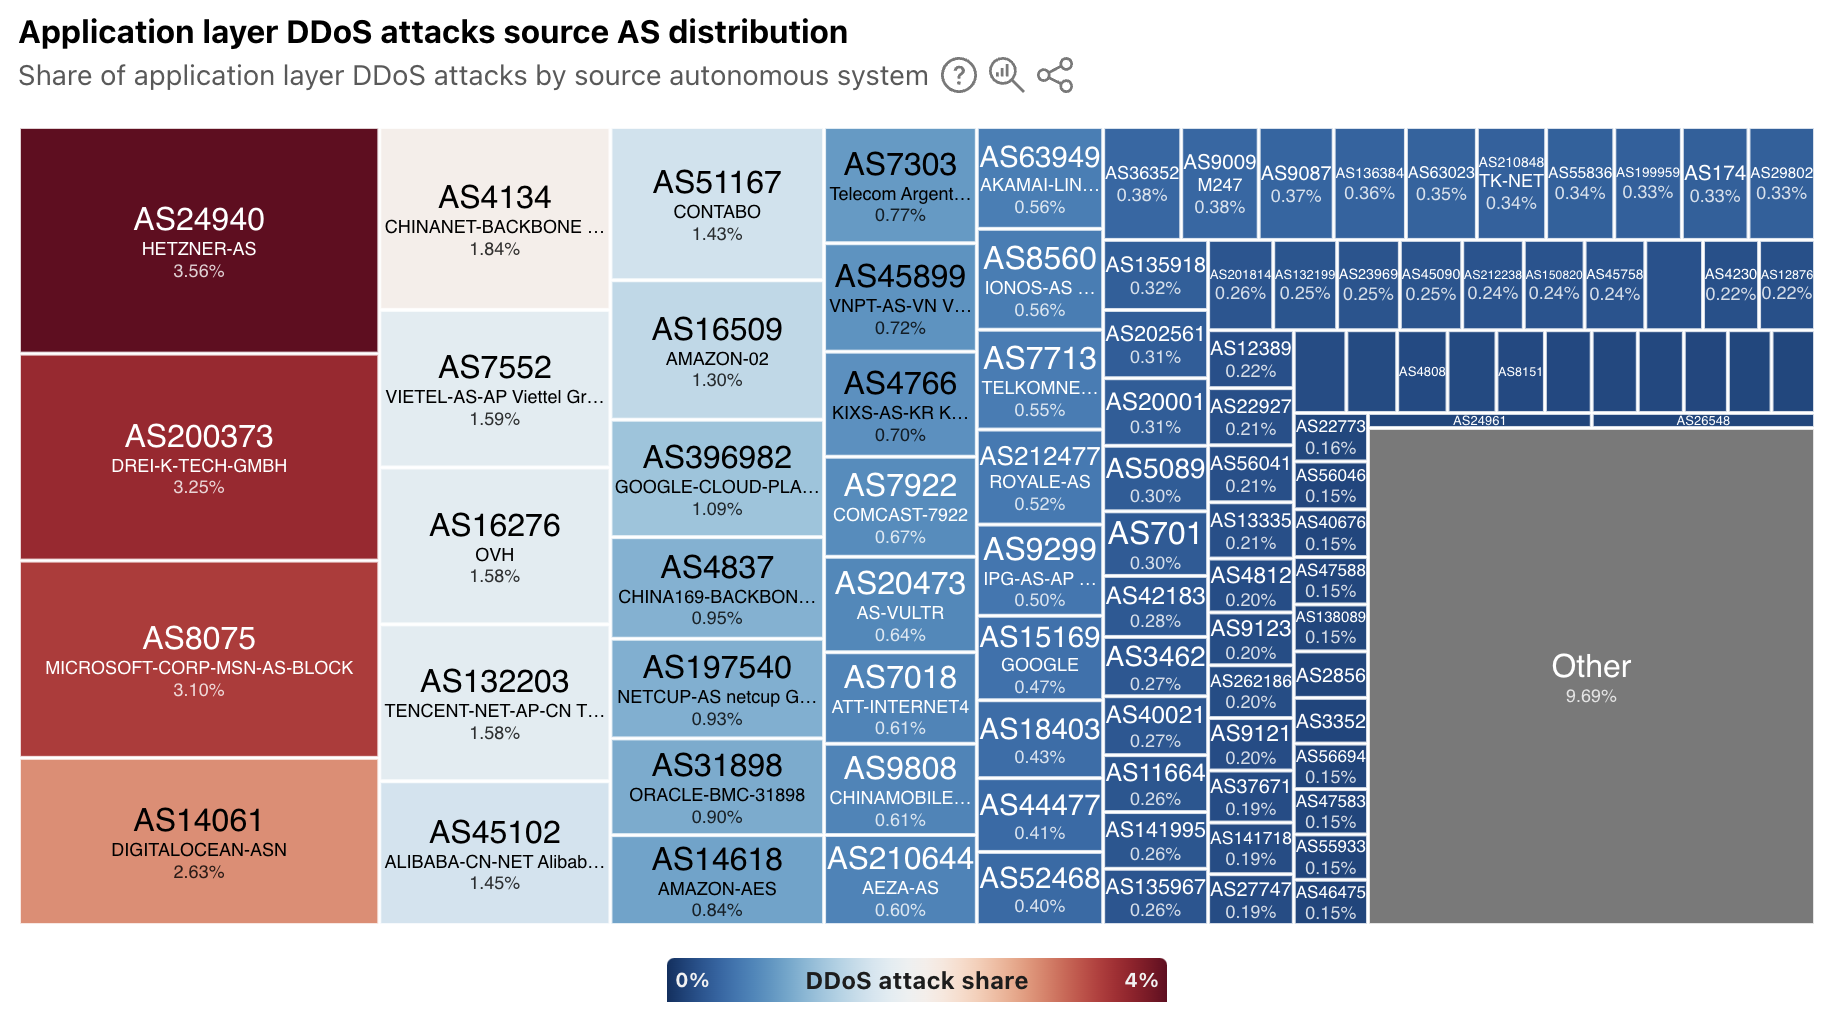
In addition to extended visibility into the geographic source of application layer DDoS attacks, we have also added autonomous system (AS)-level visibility. A new treemap view shows the distribution of these attacks by source AS. At a global level, the largest sources include cloud/hosting providers in Germany, the United States, China, and Vietnam.
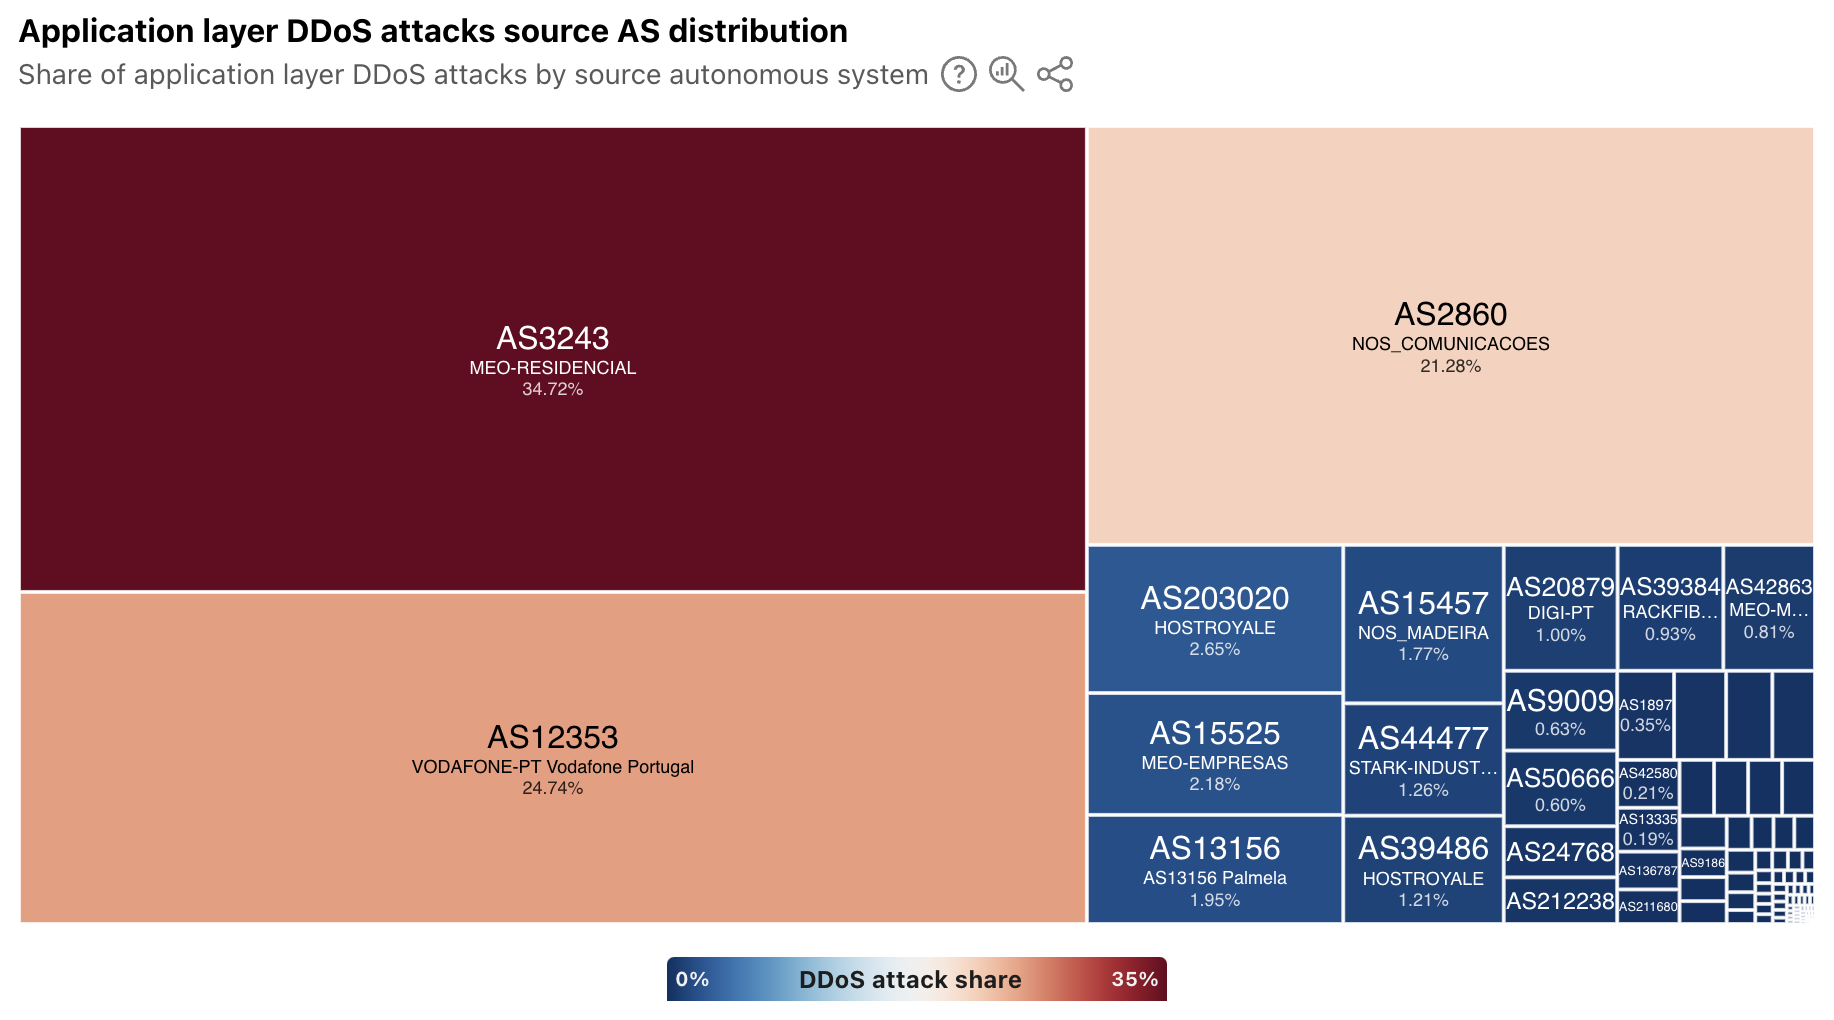
For a selected country/region, the treemap displays a source AS distribution for attacks observed to be originating from that location. In some, the sources of attack traffic are heavily concentrated in consumer/business network providers, such as in Portugal, shown below. However, in other countries/regions that have a large cloud provider presence, such as Ireland, Singapore, and the United States, ASNs associated with these types of providers are the dominant sources. To that end, Singapore was listed as being among the top sources of application layer DDoS attacks in each of the quarterly DDoS threat reports in 2024.
Have you been pwned?
Every week, it seems like there’s another headline about a data breach, talking about thousands or millions of usernames and passwords being stolen. Or maybe you get an email from an identity monitoring service that your username and password were found on the “dark web”. (Of course, you’re getting those alerts thanks to a complementary subscription to the service offered as penance from another data breach…)
This credential theft is especially problematic because people often reuse passwords, despite best practices advising the use of strong, unique passwords for each site or application. To help mitigate this risk, starting in 2024, Cloudflare began enabling customers to scan authentication requests for their websites and applications using a privacy-preserving compromised credential checker implementation to detect known-leaked usernames and passwords. Today, we’re using aggregated data to display trends in how often these leaked and stolen credentials are observed across Cloudflare’s network. (Here, we are defining “leaked credentials” as usernames or passwords being found in a public dataset, or the username and password detected as being similar.)
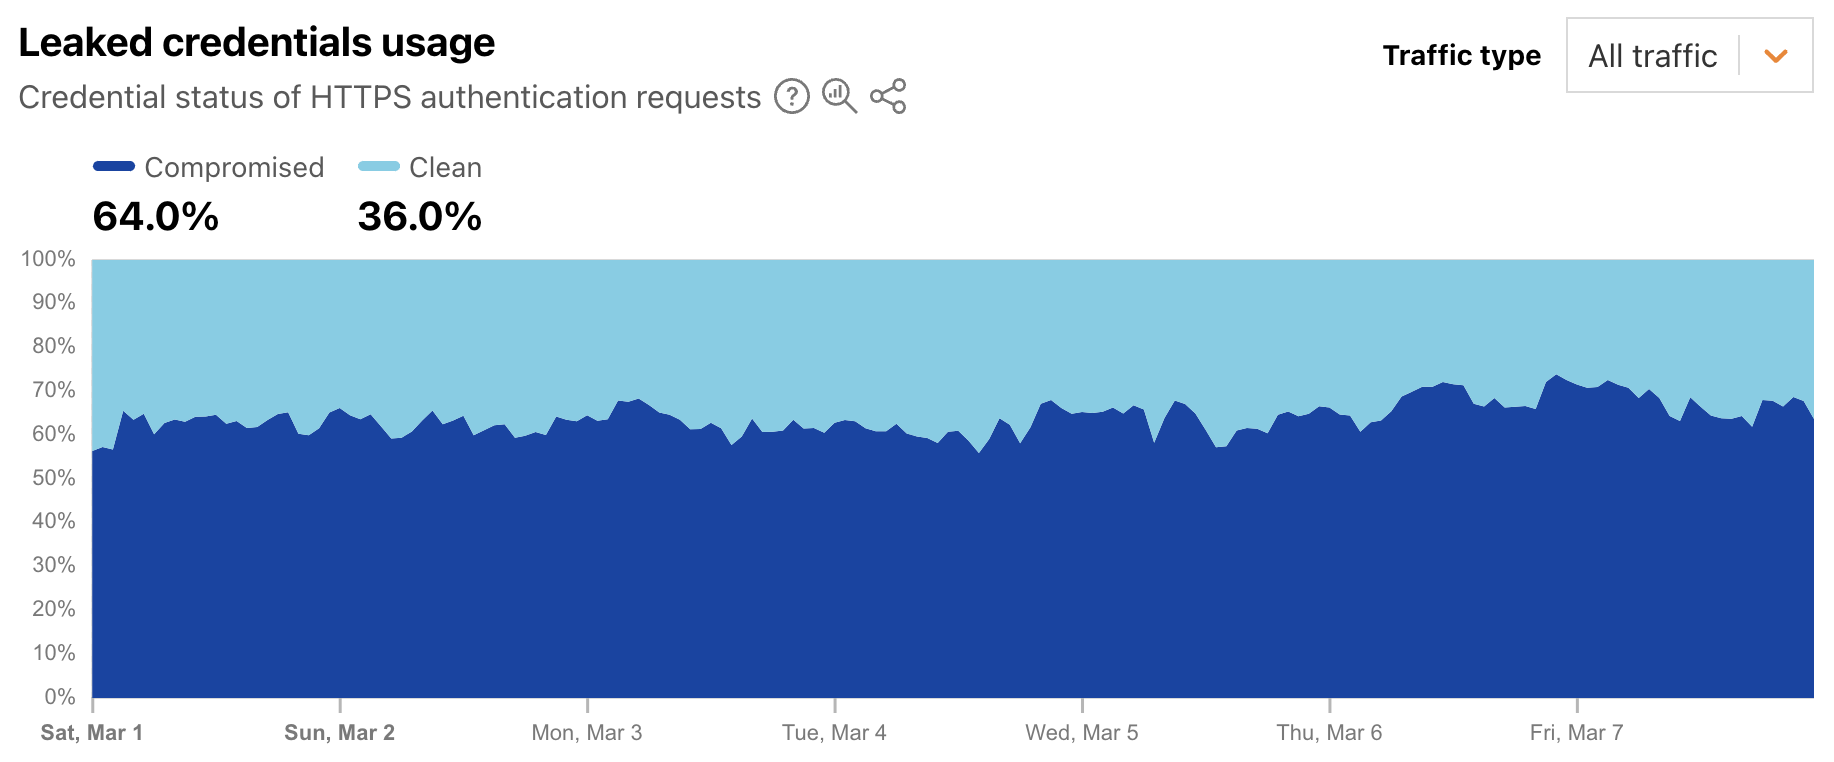
Leaked credentials detection scans incoming HTTP requests for known authentication patterns from common web apps and any custom detection locations that were configured. The service uses a privacy-preserving compromised credential checking protocol to compare a hash of the detected passwords to hashes of compromised passwords found in databases of leaked credentials. A new Radar graph on the worldwide Application Layer Security page provides visibility into aggregate trends around the detection of leaked credentials in authentication requests. Filterable by authentication requests from human users, bots, or all (human + bot), the graph shows the distribution requests classified as “clean” (no leaked credentials detected) and “compromised” (leaked credentials, as defined above, were used). At a worldwide level, we found that for the first week of March 2025, leaked credentials were used in 64% of all, over 65% of bot, and over 44% of human authorization requests.
This suggests that from a human perspective, password reuse is still a problem, as is users not taking immediate actions to change passwords when notified of a breach. And from a bot perspective, this suggests that attackers know that there is a good chance that leaked credentials for one website or application will enable them to access that same user’s account elsewhere.
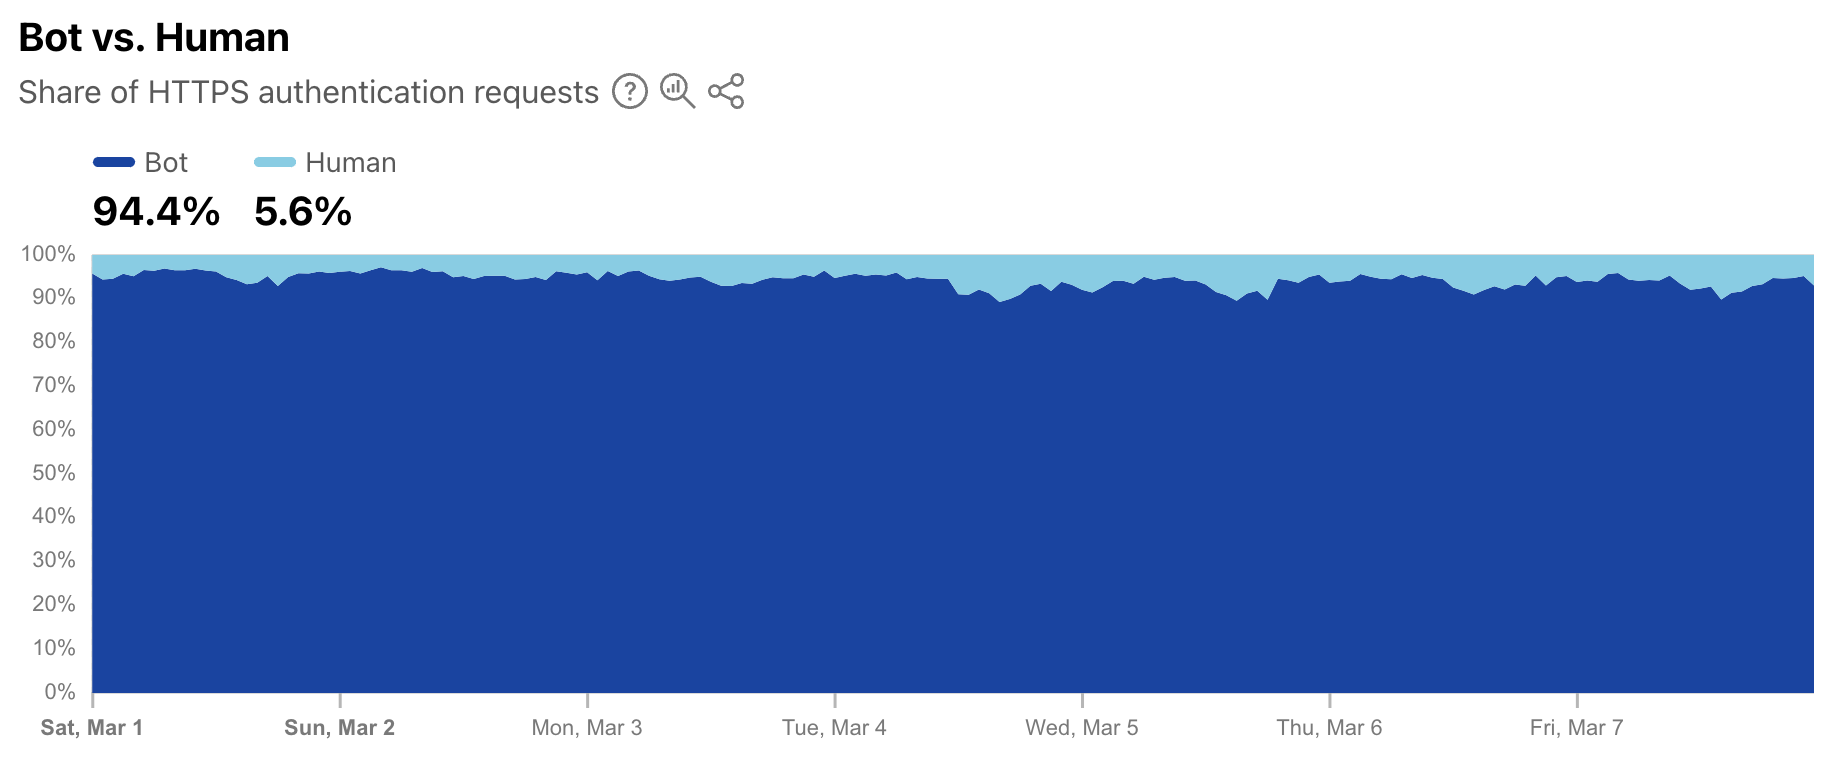
As a complement to the leaked credentials data, Radar is also now providing a worldwide view into the share of authentication requests originating from bots. Note that not all of these requests are necessarily malicious — while some may be associated with credential stuffing-style attacks, others may be from automated scripts or other benign applications accessing an authentication endpoint. (Having said that, automated malicious attack request volume far exceeds legitimate automated login attempts.) During the first week of March 2025, we found that over 94% of authentication requests came from bots (were automated), with the balance coming from humans. Over that same period, bot traffic only accounted for 30% of overall requests. So although bots don’t represent a majority of request traffic, authentication requests appear to comprise a significant portion of their activity.
Bots get a dedicated page
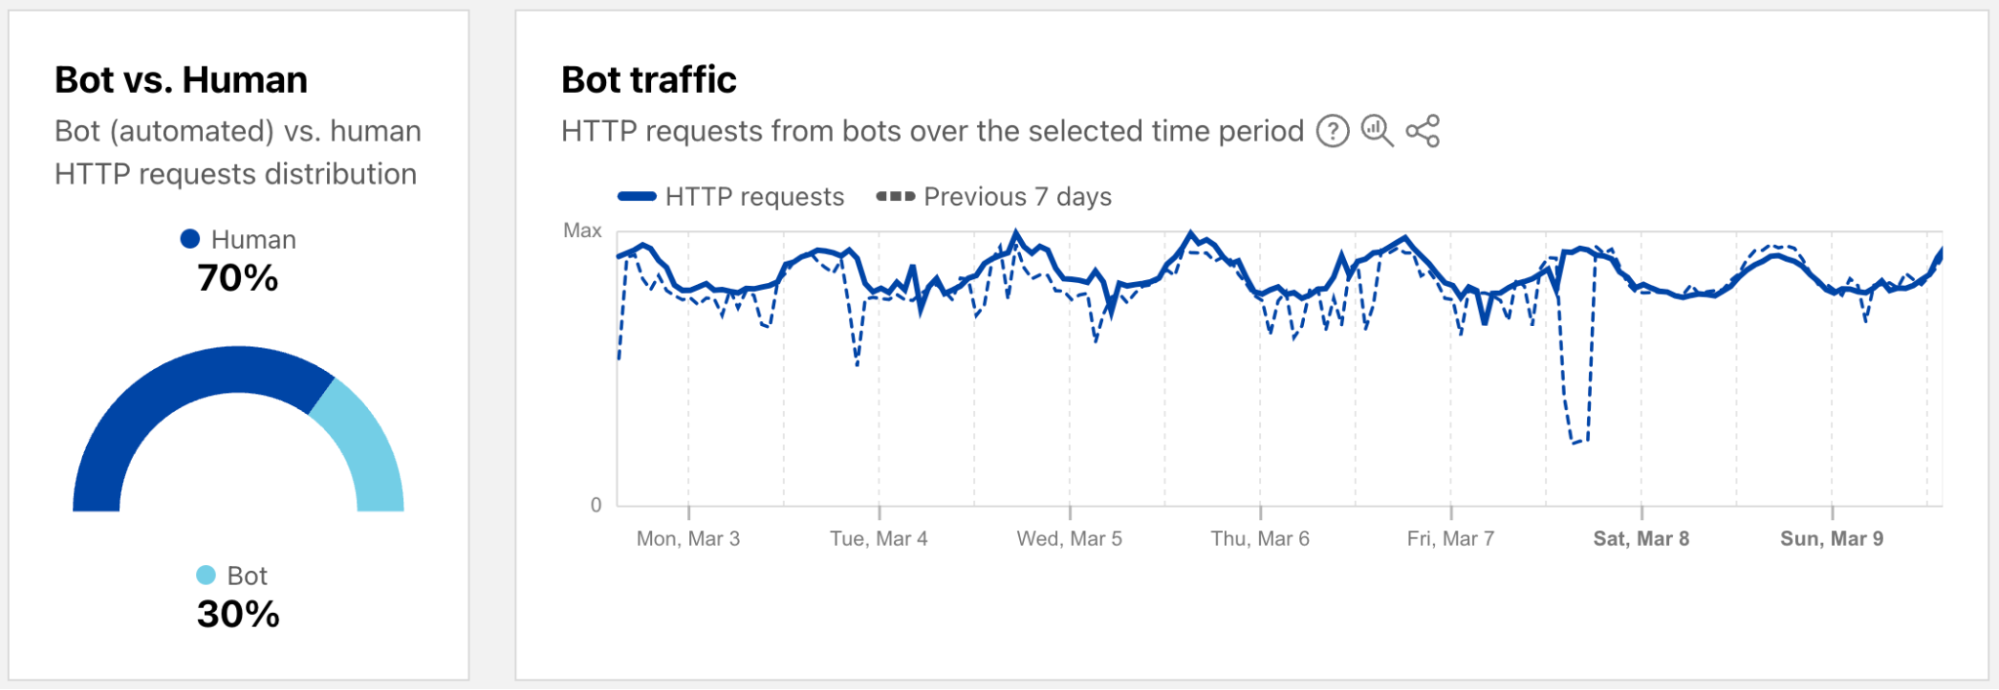
As a reminder, bot traffic describes any non-human Internet traffic, and monitoring bot levels can help spot potential malicious activities. Of course, bots can be helpful too, and Cloudflare maintains a list of verified bots to help keep the Internet healthy. Given the importance of monitoring bot activity, we have launched a new dedicated Bots page in the Traffic section of Cloudflare Radar to support these efforts. For both worldwide and location views over the selected time period, the page shows the distribution of bot (automated) vs. human HTTP requests, as well as a graph showing bot traffic trends. (Our bot score, combining machine learning, heuristics, and other techniques, is used to identify automated requests likely to be coming from bots.)
Both the 2023 and 2024 Cloudflare Radar Year in Review microsites included a “Bot Traffic Sources” section, showing the locations and networks that Cloudflare determined that the largest shares of automated/likely automated traffic was originating from. However, these traffic shares were published just once a year, aggregating traffic from January through the end of November.
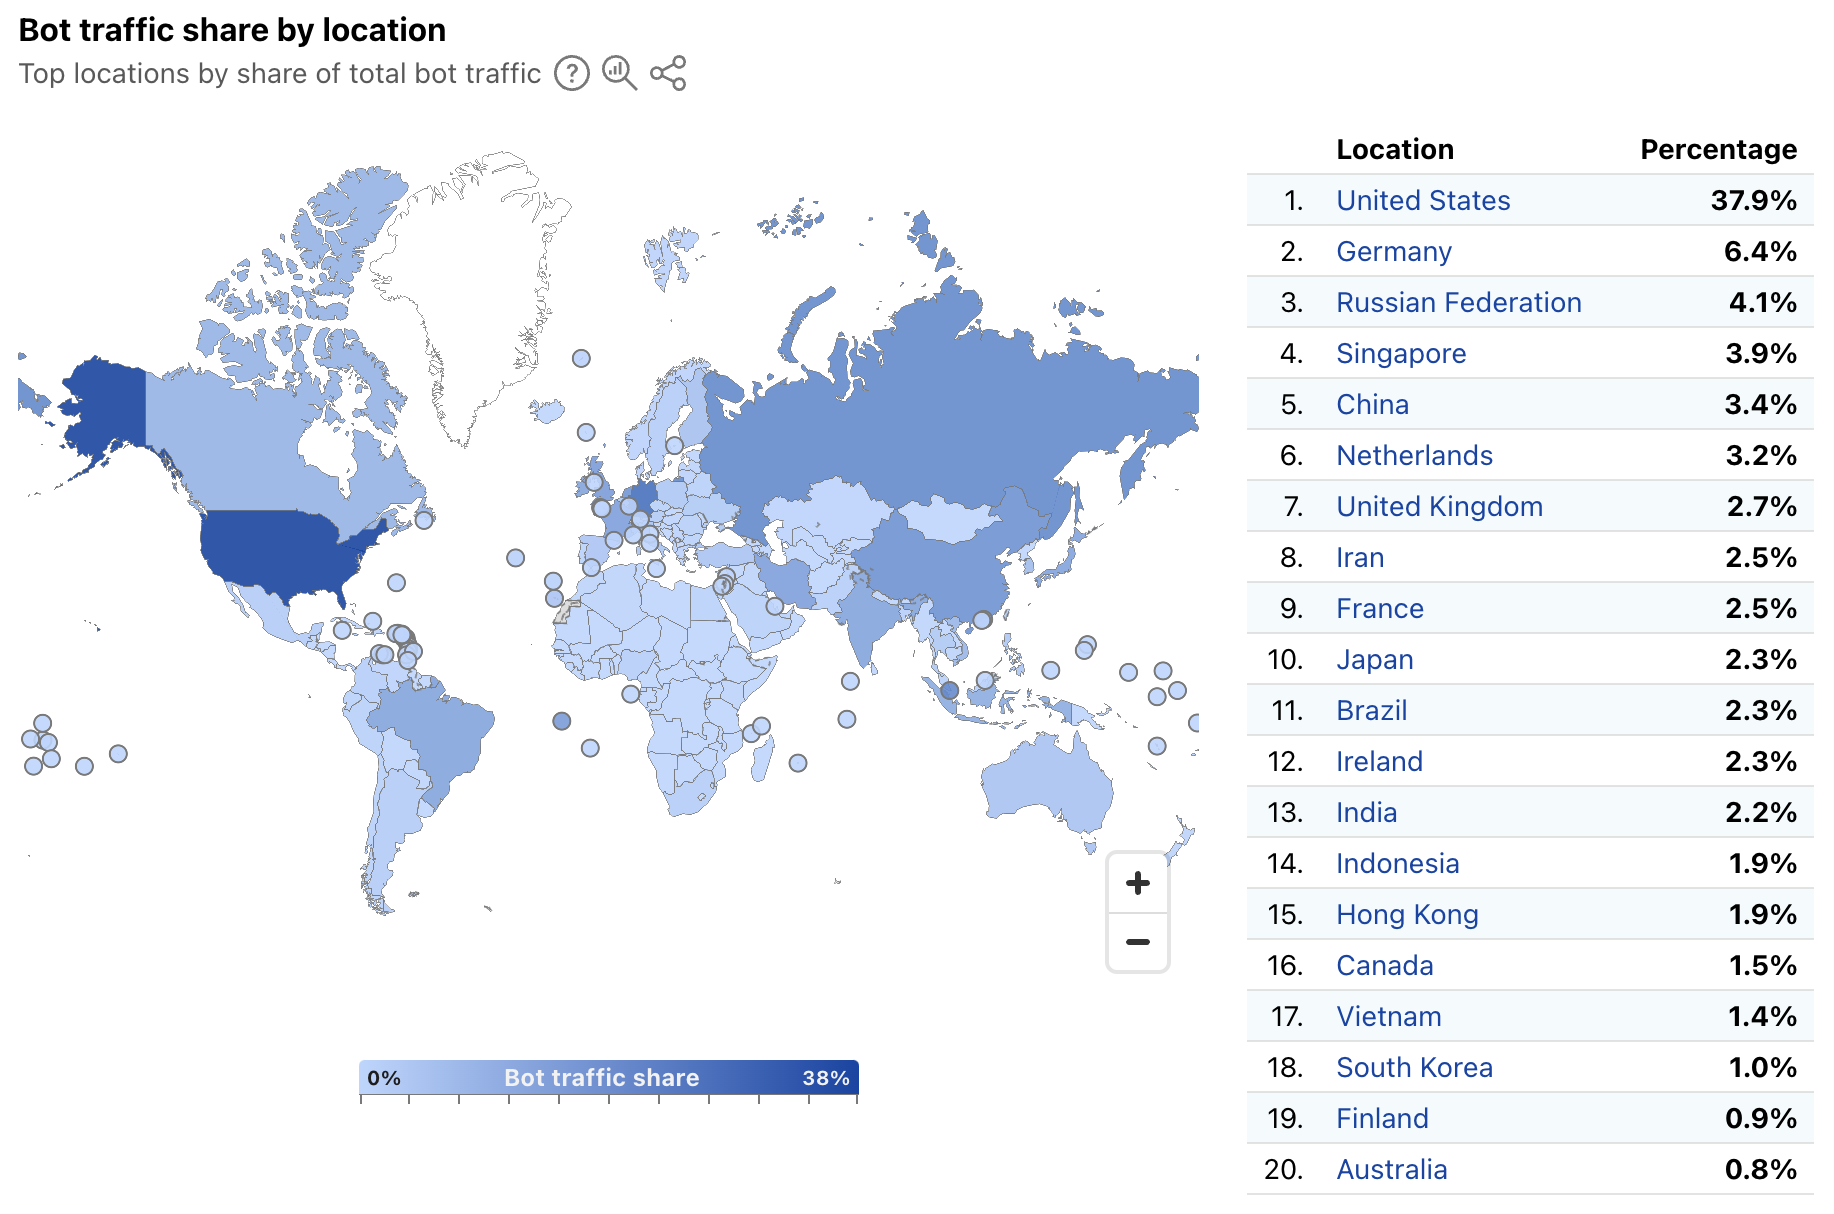
In order to provide a more timely perspective, these insights are now available on the new Radar Bots page. Similar to the new DDoS attacks content discussed above, the worldwide view includes a choropleth map and table illustrating the locations originating the largest shares of all bot traffic. (Note that a similar Traffic Characteristics map and table on the Traffic Overview page ranks locations by the bot traffic share of the location’s total traffic.) Similar to Year in Review data linked above, the United States continues to originate the largest share of bot traffic.
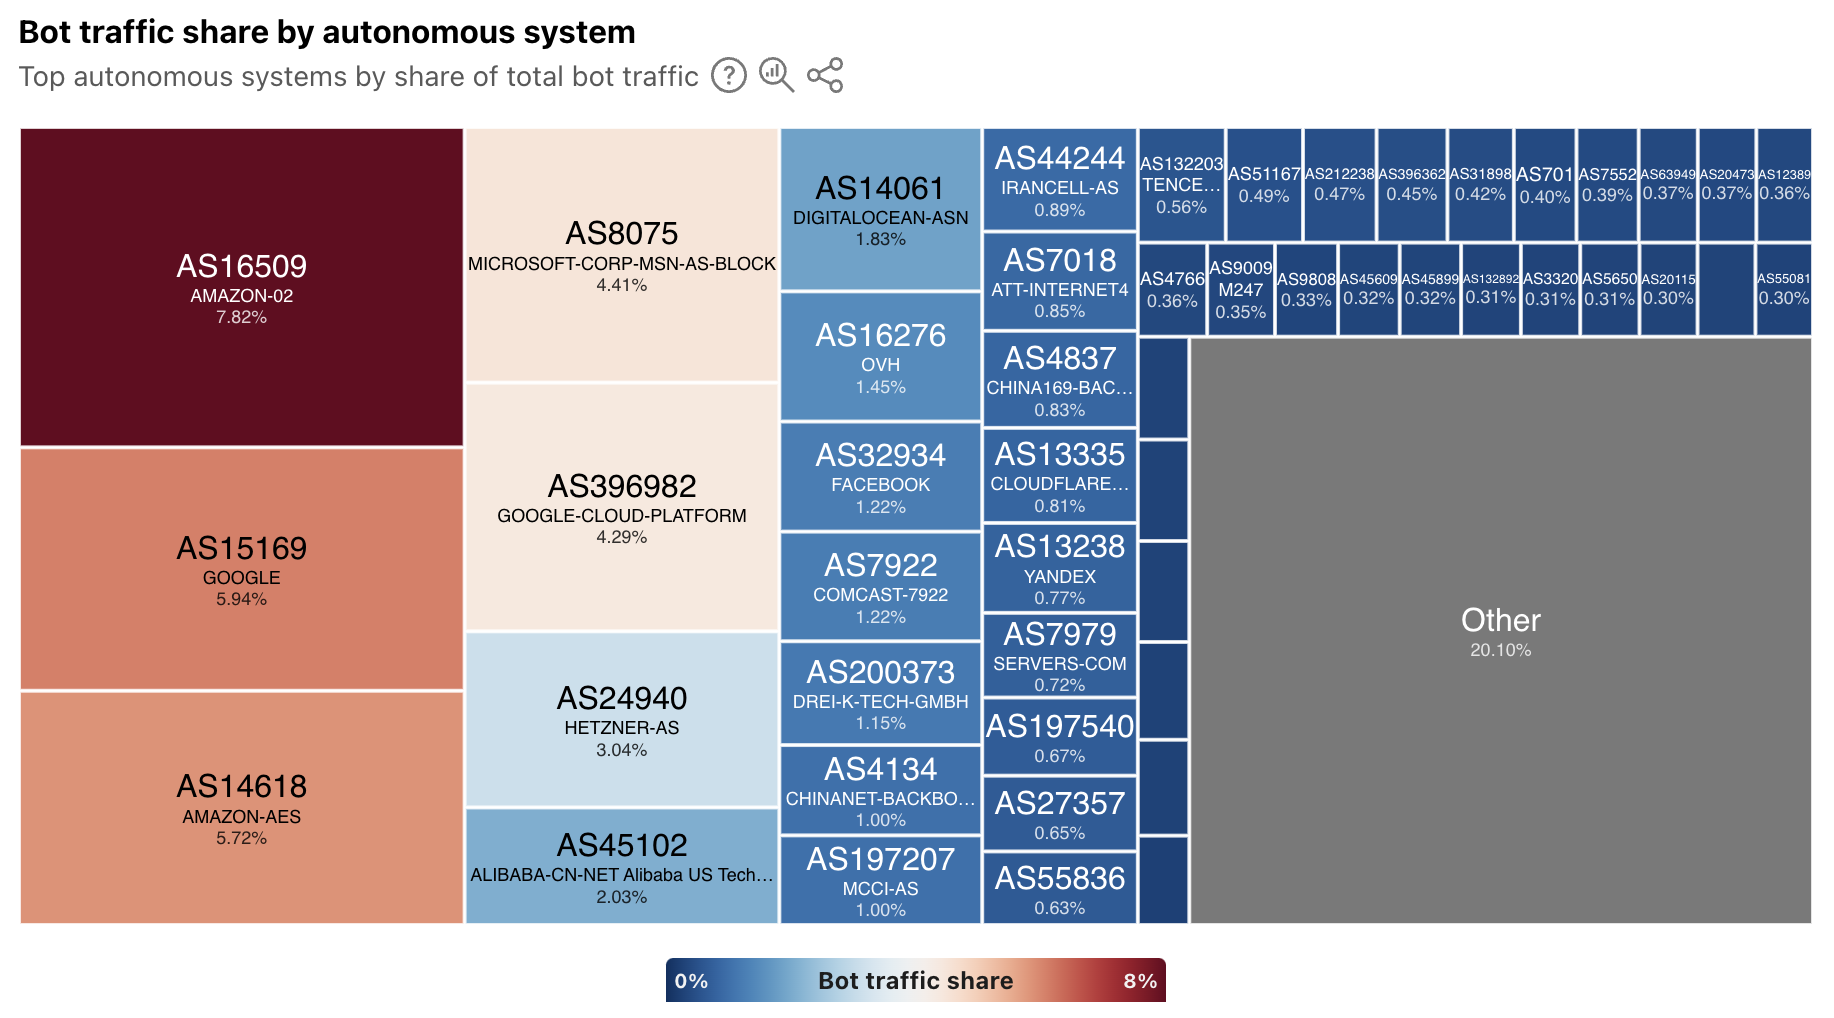
In addition, the worldwide view also breaks out bot traffic share by AS, mirroring the treemap shown in the Year in Review. As we have noted previously, cloud platform providers account for a significant amount of bot traffic.
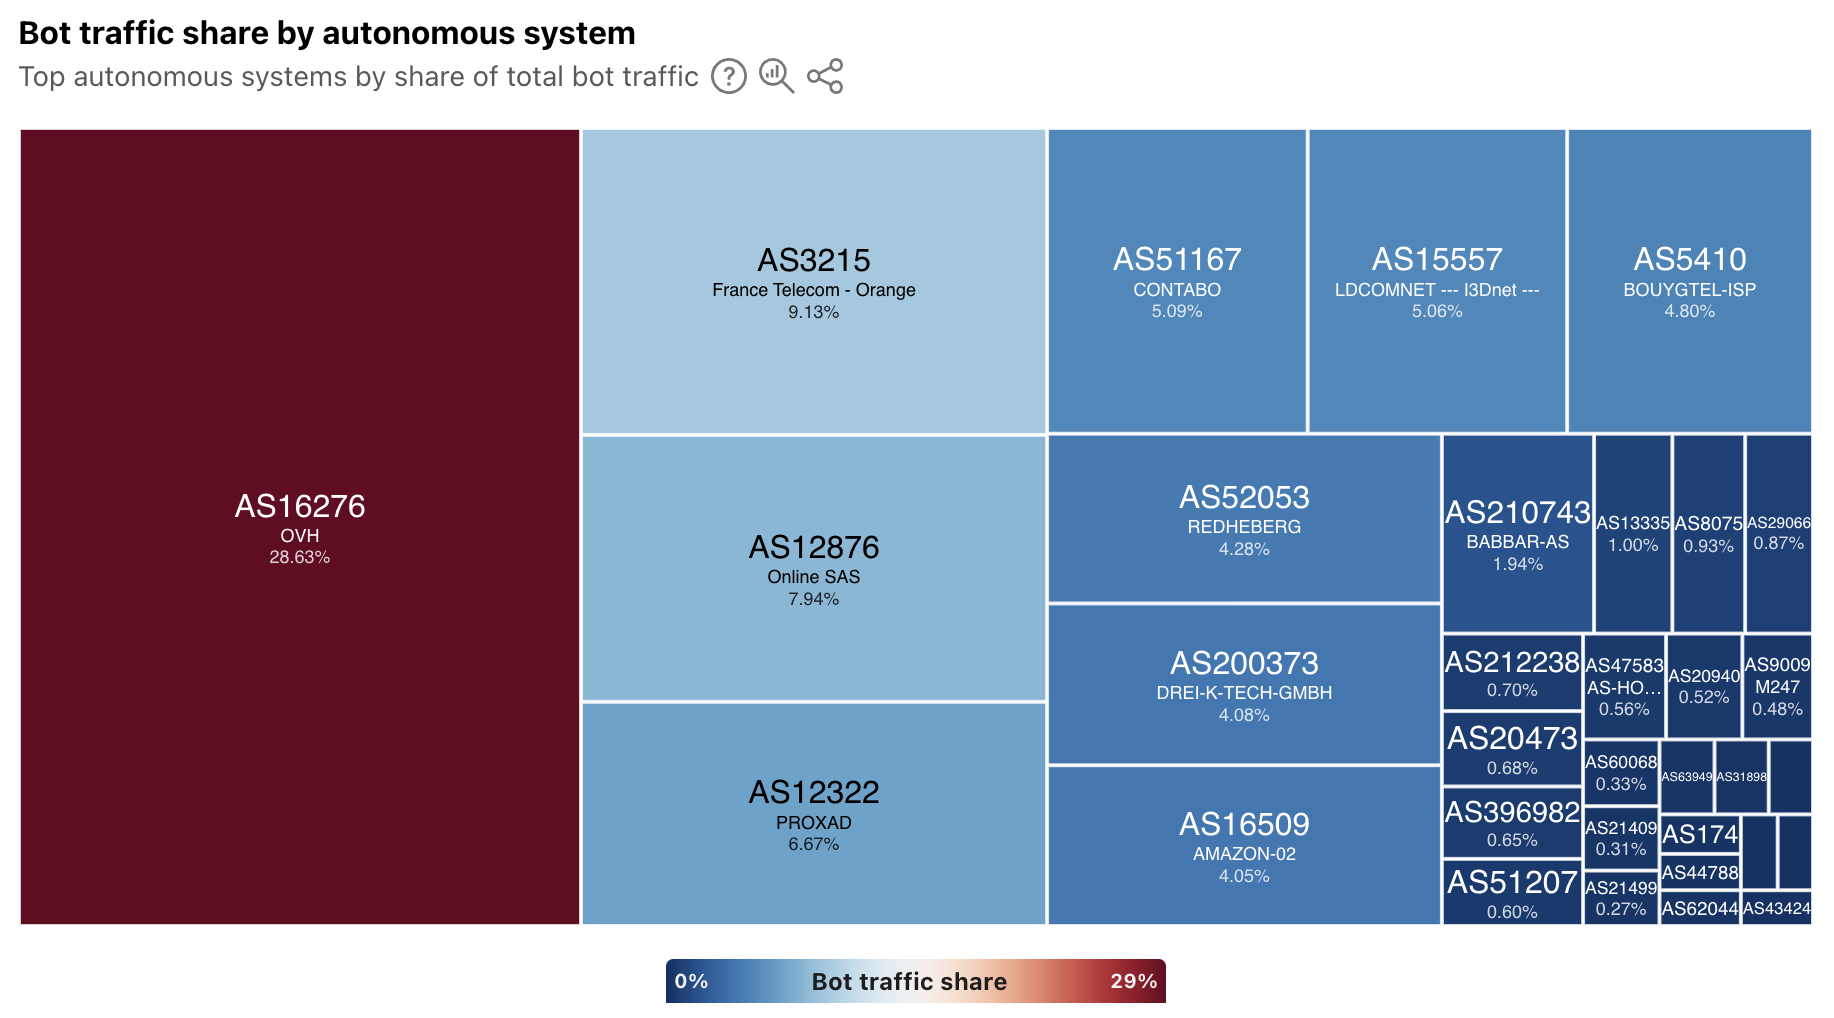
At a location level, depending on the country/region selected, the top sources of bot traffic may be cloud/hosting providers, consumer/business network providers, or a mix. For instance, France’s distribution is shown below, and four ASNs account for just over half of the country’s bot traffic. Of these ASNs, two (AS16276 and AS12876) belong to cloud/hosting providers, and two (AS3215 and AS12322) belong to network providers.
In addition, the Verified Bots list has been moved to the new Bots page on Radar. The data shown and functionality remains unchanged, and links to the old location will automatically be redirected to the new one.
Summary
The Cloudflare dashboard provides customers with specific views of security trends, application and network layer attacks, and bot activity across their sites and applications. While these views are useful at an individual customer level, aggregated views at a worldwide, location, and network level provide a macro-level perspective on trends and activity. These aggregated views available on Cloudflare Radar not only help customers understand how their observations compare to the larger whole, but they also help the industry understand emerging threats that may require action.
The underlying data for the graphs and data discussed above is available via the Radar API (Application Layer, Network Layer, Bots, Leaked Credentials). The data can also be interactively explored in more detail across locations, networks, and time periods using Radar’s Data Explorer and AI Assistant. And as always, Radar and Data Explorer charts and graphs are downloadable for sharing, and embeddable for use in your own blog posts, websites, or dashboards.
Attackers are increasingly using more sophisticated methods to not just brute force their way into your sites but also simulate real user behavior for targeted harmful activity like account takeovers, credential stuffing, fake account creation, content scraping, and fraudulent transactions. They are no longer trying to simply take your website down or gain access to it, but rather cause actual business harm. There is also the increasing complexity added by attackers rotating IP addresses, routing through proxies, and using VPNs. In this evolving security landscape, meaningful analytics matter. Many traditional CAPTCHA solutions provide simplistic pass or fail trends on challenges without insights into traffic patterns or behavior. Cloudflare Turnstile aims to equip you with more than just basic trends, so you can make informed decisions and stay ahead of the attackers.
We are excited to introduce a major upgrade to Turnstile Analytics. With these upgraded analytics, you can identify harder-to-detect bots faster, and fine-tune your bot security posture with less manual log analysis than before. Turnstile, our privacy-first CAPTCHA alternative, has been helping you protect your applications from automated abuse while ensuring a seamless experience for legitimate users. Now, using enhanced analytics, you can gain deeper insights into your visitor traffic, challenge effectiveness, and potential security threats.
Previously, Turnstile users had limited visibility into what types of bots were being blocked, what specific characteristics were exhibited by bots that were attacking your website, and what identifiable behavior they had. Customers had to manually sift through limited analytics, correlate Siteverify API responses, and cross-reference multiple sources to identify trends. The previous Turnstile analytics dashboard made it difficult to get a bird’s eye view of Turnstile efficacy, identify any patterns of abuse, and drill down on the specifics of an attack to create additional rules and safeguards.
The new Turnstile Analytics surfaces all of this information in one place, making it easier than before to assess your visitor traffic patterns through Turnstile and take immediate action against suspicious activity.
What’s new with Turnstile Analytics?
The main motivation behind this release is to provide actionable insights that further strengthen the layers of protection and to give customers the ability to dissect visitor traffic by the most relevant attributes, so that identifying bot behavior patterns becomes easier. New features of Turnstile Analytics include:
Top statistics
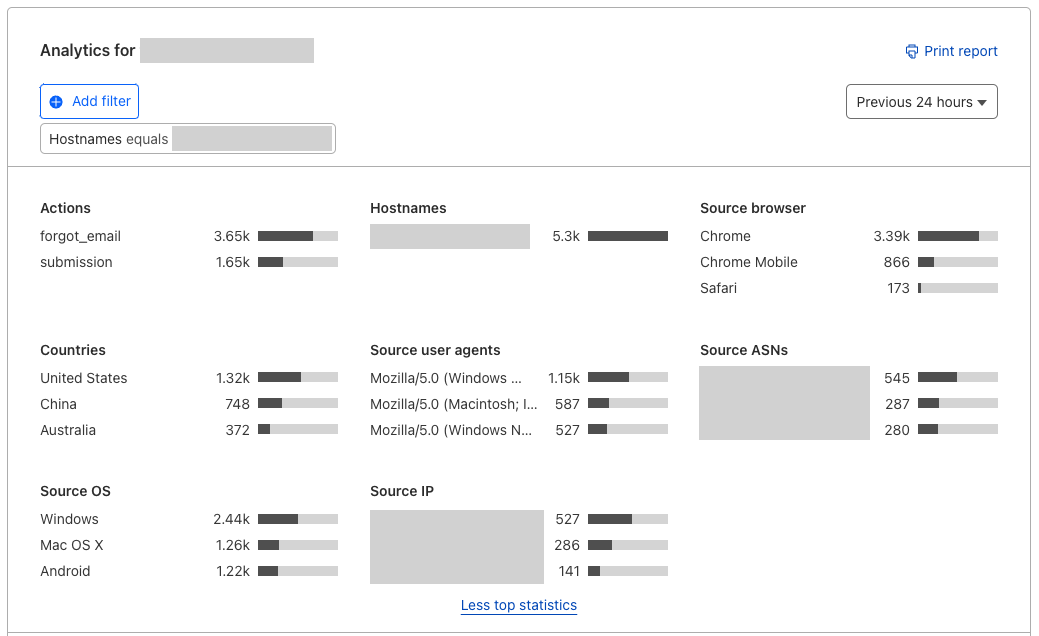
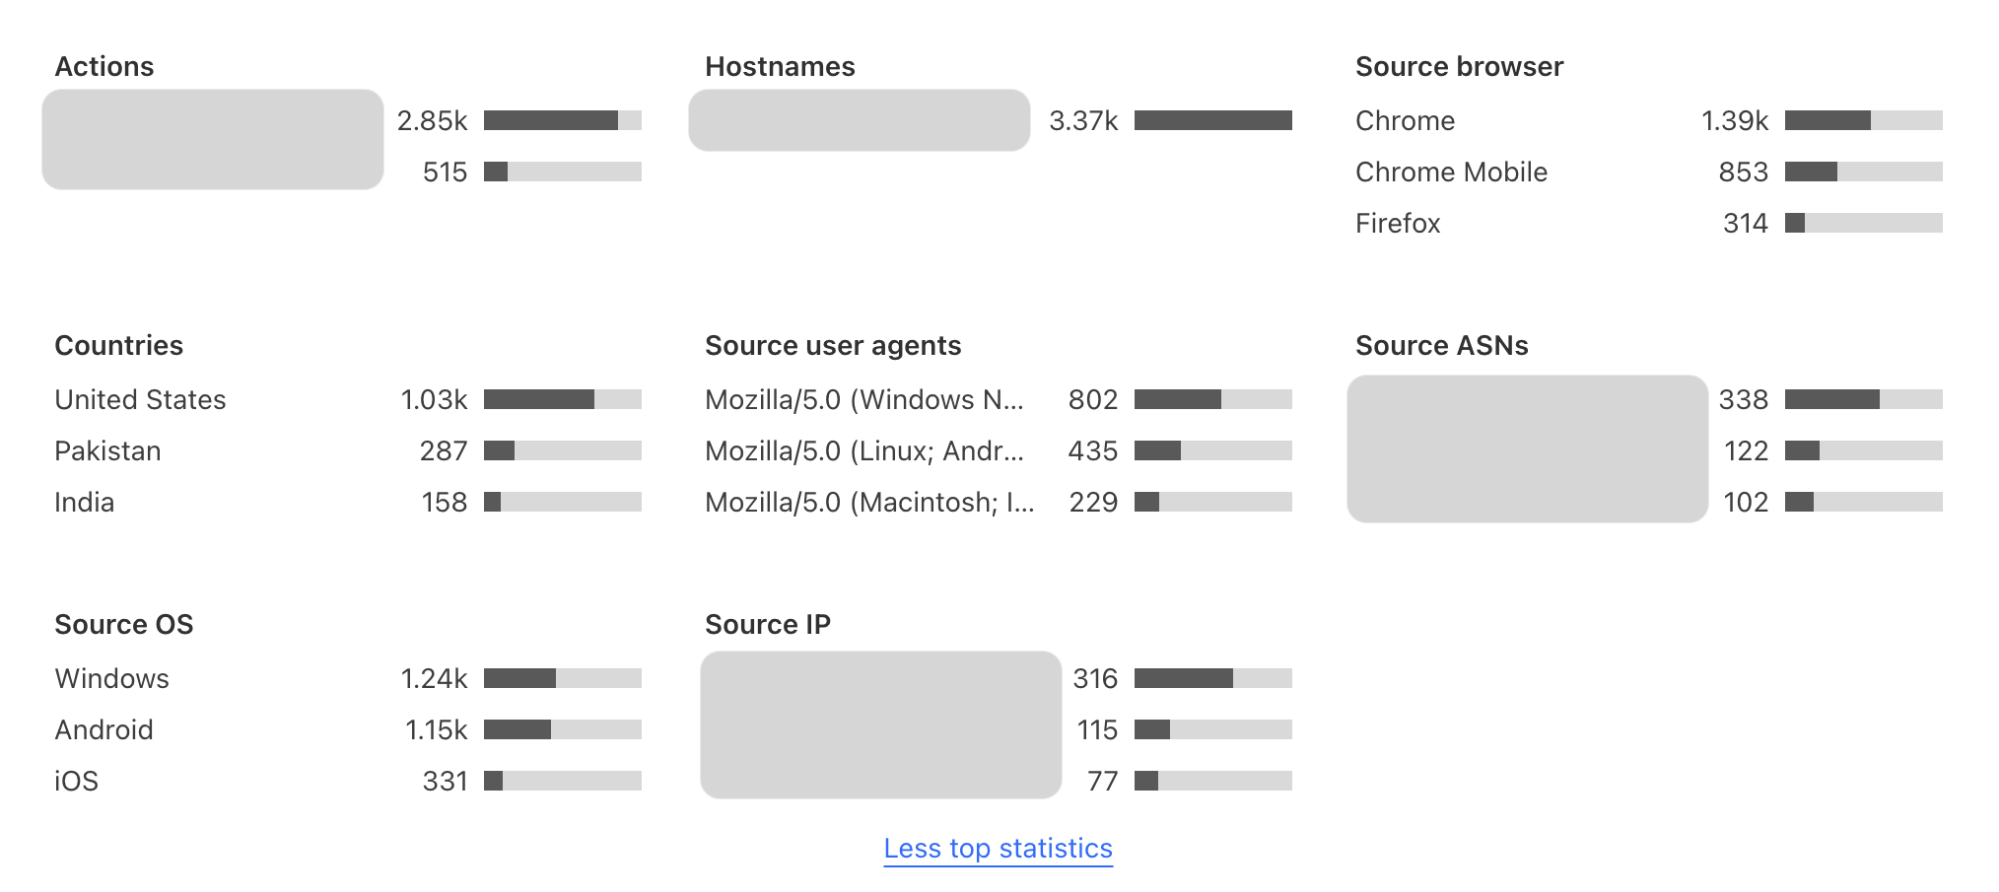
When you click into widget analytics under Turnstile in the Cloudflare Dashboard, you now have enhanced visibility of TopN statistics, and granular views of your traffic. The new TopN section is where you can view the top statistics of attributes such as hostname, autonomous system (ASN), user agent, browser, source IP address, country, and OS. This allows customers to analyze traffic at a more granular level and detect potential anomalies or patterns. You can analyze which browsers, user agents, ASNs, and locations generated the most failed challenges, making it easier to detect bot behavior patterns and anomalies in your visitor traffic. Suspicious IP addresses that have a high challenge failure rate can be proactively mitigated through additional security measures. For instance, if you have WAF custom rules in place based on suspicious IP addresses, you can in turn adjust your WAF custom rules based on the trends you see in Turnstile, strengthening your other layers of security even further.
TopN section of Turnstile Analytics
Challenge outcomes
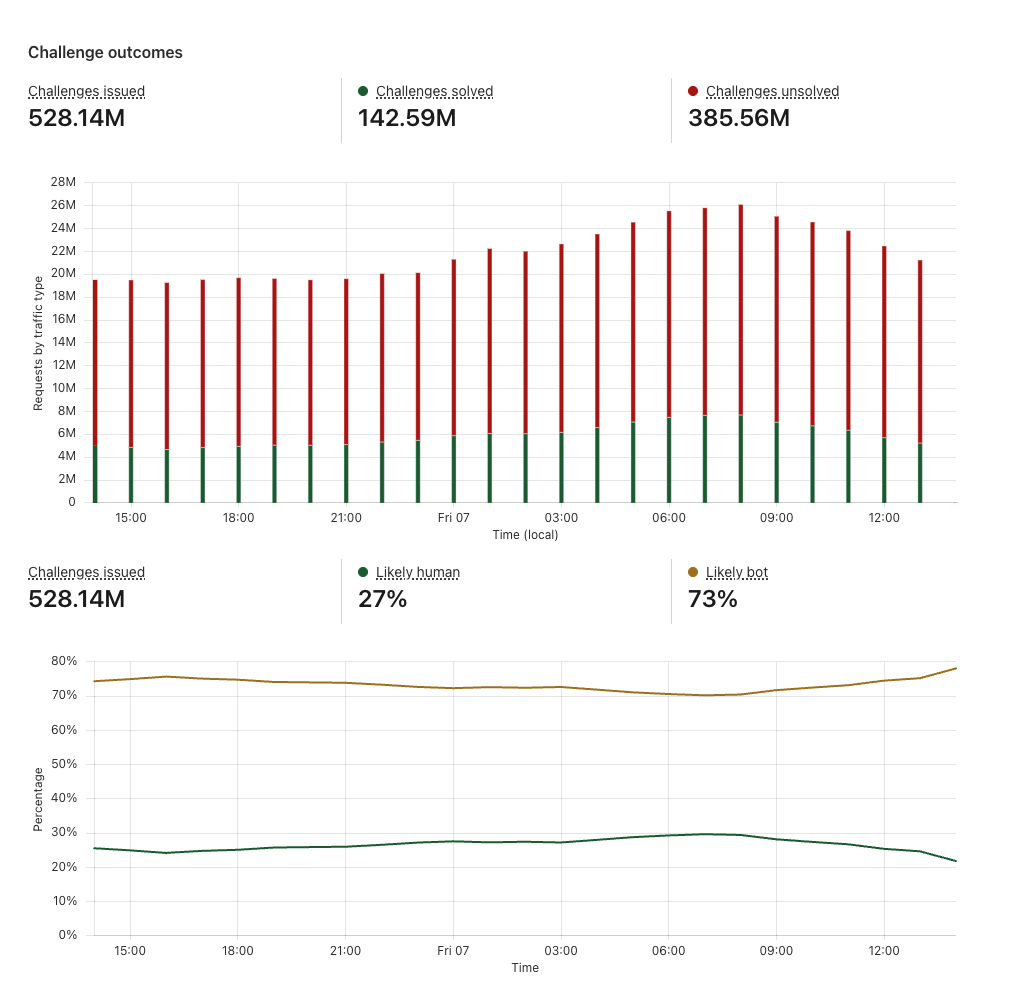
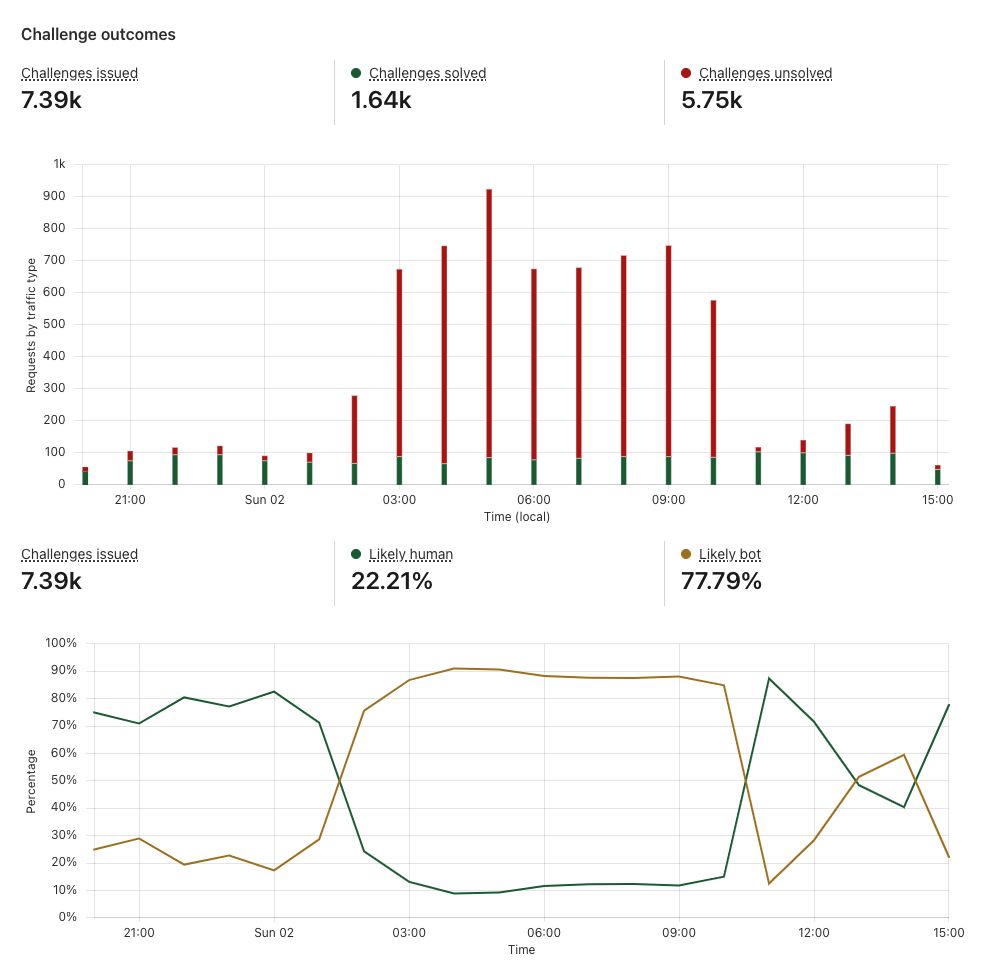
When a visitor encounters Turnstile, it issues a challenge to assess whether the visitor is a human or a bot, based on various signals. The Challenge outcomes section helps you evaluate what portion of your traffic is likely human or likely bots.
The ability to easily monitor the effectiveness of Turnstile by looking at trends of Likely Human and Likely Bot metrics is important for peace of mind, knowing that the bots are being blocked and Turnstile is protecting your sites. But it’s also important to track changes in bot activity over time by monitoring challenge success and failure trends and across different attributes. You can detect anomalies in your traffic pattern and solve rates. For example, a sudden drop in solve rate overlaid with a surge in challenge attempts may indicate an attack. It is crucial to monitor bot behaviors and attacks that may be specific to your industry or to your business through Turnstile Analytics and correlate them with your internal security logs to keep your security rules up to date, to easily investigate any attacks, and to find areas of vulnerability.
Challenge outcomes section of Turnstile Analytics
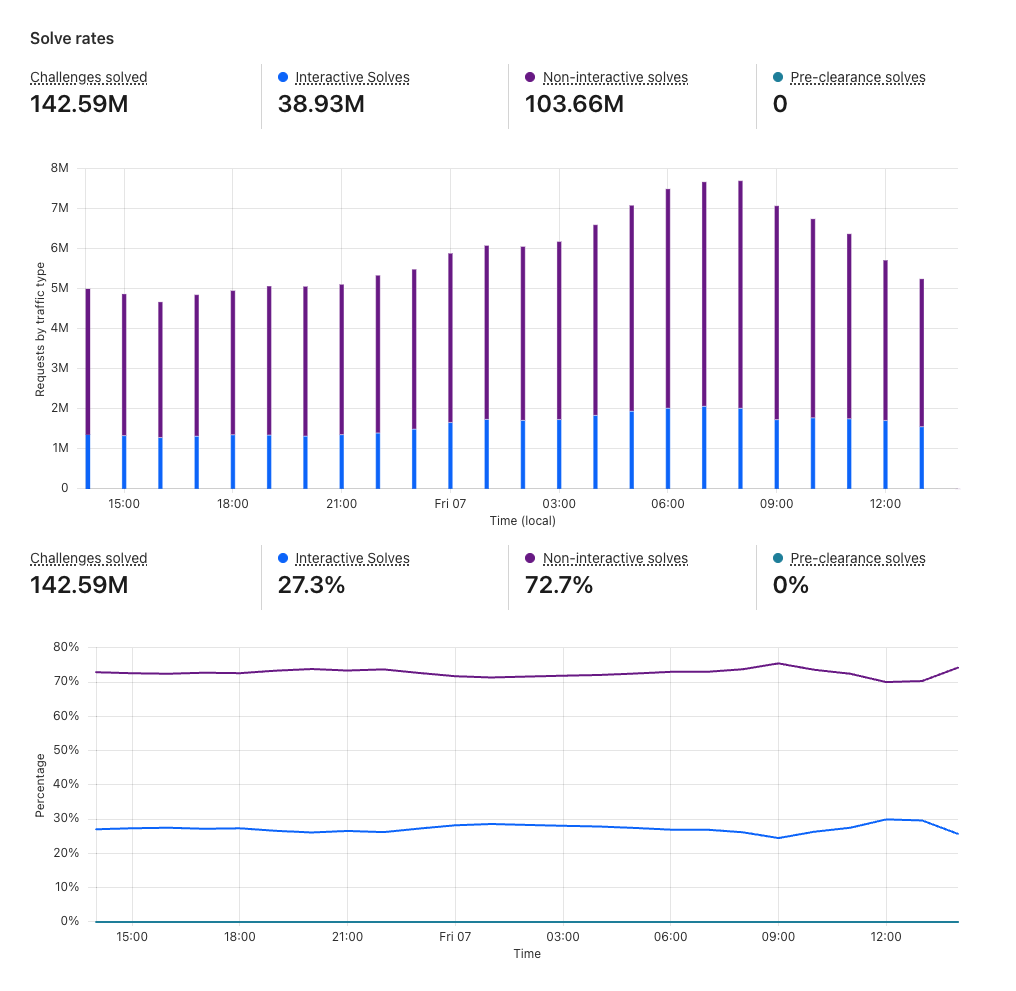
Solve rates
When the visitor successfully solves the challenge, the Solve rates section shows how the visitors have solved the challenge. Solve rates can be broken down into interactive solves, non-interactive solves, and pre-clearance solves. If you are using the managed mode, for example, you can see how many of your visitors required interaction with the widget and were prompted to check the box for Turnstile to verify that they are human.
Solve rates section of Turnstile Analytics
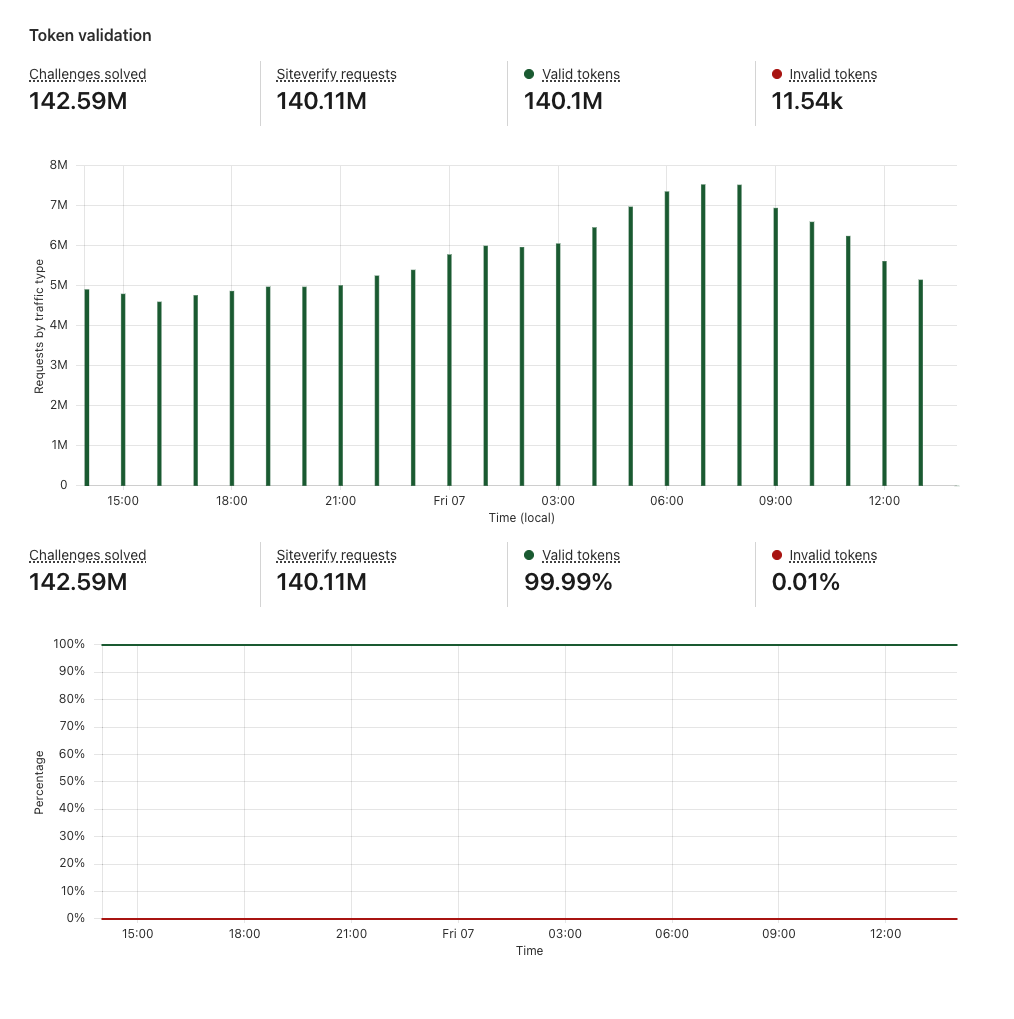
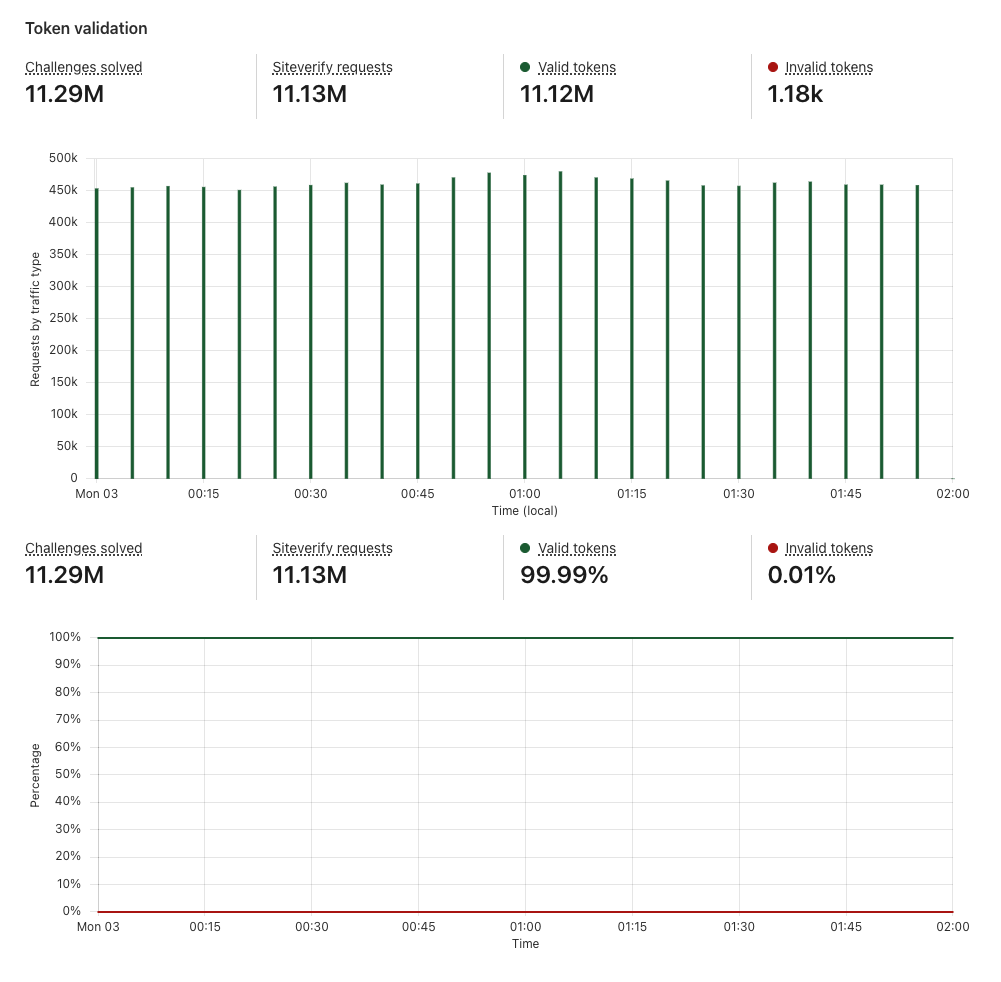
Token validations
After a visitor successfully completes a Turnstile challenge, a token is generated that must be validated via the Siteverify API. The API response provides the ultimate outcome of our bot determination. Only rendering the widget on the client side without calling the Siteverify API for token validation is an incomplete implementation of Turnstile, and your site will not be protected. The Turnstile token that is returned from the challenge stage must be validated via the Siteverify API as we check if the token is valid, whether it has been redeemed already (a single token can only be redeemed once), and whether it has expired.
Token validation section of Turnstile Analytics
Let’s walk through a real world example
Common use cases of Turnstile include protecting login and sign up pages from credential stuffing, account takeover, and fraudulent account creation attacks. Let’s walk through how you can best set up Turnstile on your login pages and interpret your traffic with the new Turnstile analytics.
You can set up two separate widgets for your login and sign up page, or you can set up one widget and use the ‘action‘ field to distinguish traffic between these pages. The ‘cData’ field can be used to pass along custom data to keep track of each individual attempt. This field is useful to track any pertinent information from your business logic such as account ID, session ID, etc. In this case, let’s assume we are passing along a session ID along with the login attempt. This is helpful if you are trying to protect and monitor against account takeover attacks or credential stuffing attacks. cData is a custom data field that is not stored in Cloudflare systems at any time.
Validating the Turnstile token with the Siteverify API
At this point, you have placed the Turnstile widget in your login page. When a visitor visits this page, a Turnstile challenge will be issued and when the visitor completes the challenge, you will receive a Turnstile token that contains the outcome of the challenge. This must be validated via the Siteverify API like below:
// This is the demo secret key.
// In production, we recommend you store your secret key(s) safely.
const SECRET_KEY = "1x0000000000000000000000000000000AA";

async function handlePost(request) {
  const body = await request.formData();
  // Turnstile injects a token in "cf-turnstile-response".
  const token = body.get("cf-turnstile-response");
  const ip = request.headers.get("CF-Connecting-IP");

  // Validate the token by calling the
  // "/Siteverify" API endpoint.
  let formData = new FormData();
  formData.append("secret", SECRET_KEY);
  formData.append("response", token);
  formData.append("remoteip", ip);

  const url = "https://challenges.cloudflare.com/turnstile/v0/siteverify";
  const result = await fetch(url, {
    body: formData,
    method: "POST",
  });

  const outcome = await result.json();
  if (outcome.success) {
    // happy path: let the visitor continue with login/signup
  } else {
    // option 1: custom error page directing the visitor to reach out to support
    // option 2: same as happy path but flag as potential bot
  }
}
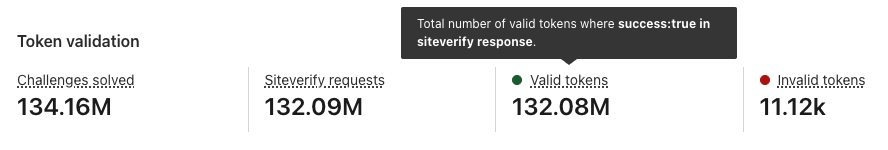
As you can see in the code example above, you can control the visitor experience based on the Siteverify outcome. In the case where Siteverify API said the token is valid, it’s straightforward — let the visitor continue to log in and sign up. This can be monitored by the Valid tokens metric in the Token validation section in the new Turnstile Analytics.
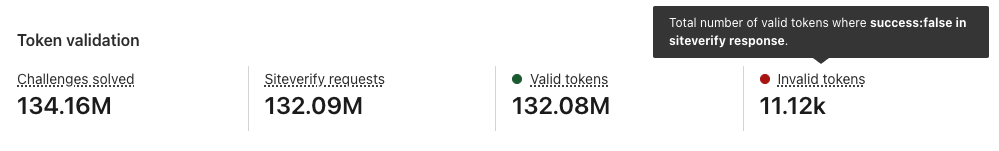
If Siteverify returns "success": false, this means that the token was invalid and Turnstile determined the visitor to be a bot. In this case, you have control over what you want the experience to be, such as redirecting the user to a custom error page where they can reach out to support.
You can also flag that session (in this case, “session123”) as suspicious and require the account owner to take action. You can implement the UI so that it seems like the bot was successful in logging in to an account, but block any important actions, such as account changes or purchases. Likewise, you can alert the account owner that there has been a suspicious login attempt.
Turnstile is a building block to help you build out your security defenses, and you can design your logic to fit your priorities across UI, UX, and security.
Interpreting login page analytics
The very first thing to monitor is the Top Statistics section to look out for any anomalous traffic characteristics in the “countries”, “source ASN”, and “source user agents” metrics. By seeing the traffic distribution, you can have a better understanding of your visitors and potentially spot any anomalies. At this point, you can also take a look at “Source browsers”, “Source OS”, and “Countries” to see if that aligns with your visitor demographics. If you have a list of suspicious IP addresses that you maintain, you can cross-reference them to see their success and failure rates.
Example TopN Section
Let’s say you suspect there has been a credential stuffing attack where bots were brute forcing their way into accounts. Below is mock data of what your analytics may look like where the time window is zoomed into the time of the attack.
Example Challenge outcomes section
You can see that time period where the number of challenges unsolved started spiking and the “likely bot” metric shot up. This shows an increase in bot traffic, indicating an attack. However, you can also see that Turnstile was able to catch these bots as they were unable to solve or even complete the challenge.
Let’s look at another example.
Example Token validation section
In this case, of the 11.13M tokens issued in the timeframe, 0.01% of them were invalid. This means that 0.01% of the traffic is considered to be non-legitimate visitors, despite the fact that they received the Turnstile tokens. This is why it is crucial to always validate your tokens through the Siteverify API. What becomes more interesting is if the login credentials these suspicious visitors provided were correct credentials, which could indicate that this is a potential account takeover attack or the accounts in question have been compromised. If the login credentials were incorrect, but the attempts were in a burst, that could indicate credential stuffing attack. By correlating Turnstile analytics with your internal application data such as whether the login attempt had a correct or incorrect password, you can further identify the nature and behavior of the attacker and build out the defenses or mitigate accordingly.
This was an example showing how Turnstile can protect and provide insights on just your login page. Imagine how this could be expanded to other use cases such as your sign-up pages, submit form pages, contact pages, checkout pages, and more.
Looking ahead
We are not planning on stopping here with Turnstile Analytics. Next on our roadmap is to expand Turnstile Analytics to give you more insights around client side and server side errors, so that you can further break down the traffic beyond just the challenge outcomes. We will also be incorporating Ephemeral IDs into the analytics, so that you can filter by Ephemeral ID, see top Ephemeral IDs, and the frequency of their solve attempts.
We have many more exciting things in store for Turnstile for 2025! There is no prerequisite with Turnstile, and our free tier is unlimited in volume, so there is no barrier to get started today. Let’s help make the Internet a more secure, better place, together!
In 2024, we announced Log Explorer, giving customers the ability to store and query their HTTP and security event logs natively within the Cloudflare network. Today, we are excited to announce that Log Explorer now supports logs from our Zero Trust product suite. In addition, customers can create custom dashboards to monitor suspicious or unusual activity.
Every day, Cloudflare detects and protects customers against billions of threats, including DDoS attacks, bots, web application exploits, and more. SOC analysts, who are charged with keeping their companies safe from the growing spectre of Internet threats, may want to investigate these threats to gain additional insights on attacker behavior and protect against future attacks. Log Explorer, by collecting logs from various Cloudflare products, provides a single starting point for investigations. As a result, analysts can avoid forwarding logs to other tools, maximizing productivity and minimizing costs. Further, analysts can monitor signals specific to their organizations using custom dashboards.
Zero Trust dataset support in Log Explorer
Log Explorer stores your Cloudflare logs for a 30-day retention period so that you can analyze them natively and in a single interface, within the Cloudflare Dashboard. Cloudflare log data is diverse, reflecting the breadth of capabilities available. For example, HTTP requests contain information about the client such as their IP address, request method, autonomous system (ASN), request paths, and TLS versions used. Additionally, Cloudflare’s Application Security WAF Detections enrich these HTTP request logs with additional context, such as the WAF attack score, to identify threats.
Today we are announcing that seven additional Cloudflare product datasets are now available in Log Explorer. These seven datasets are the logs generated from our Zero Trust product suite, and include logs from Access, Gateway DNS, Gateway HTTP, Gateway Network, CASB, Zero
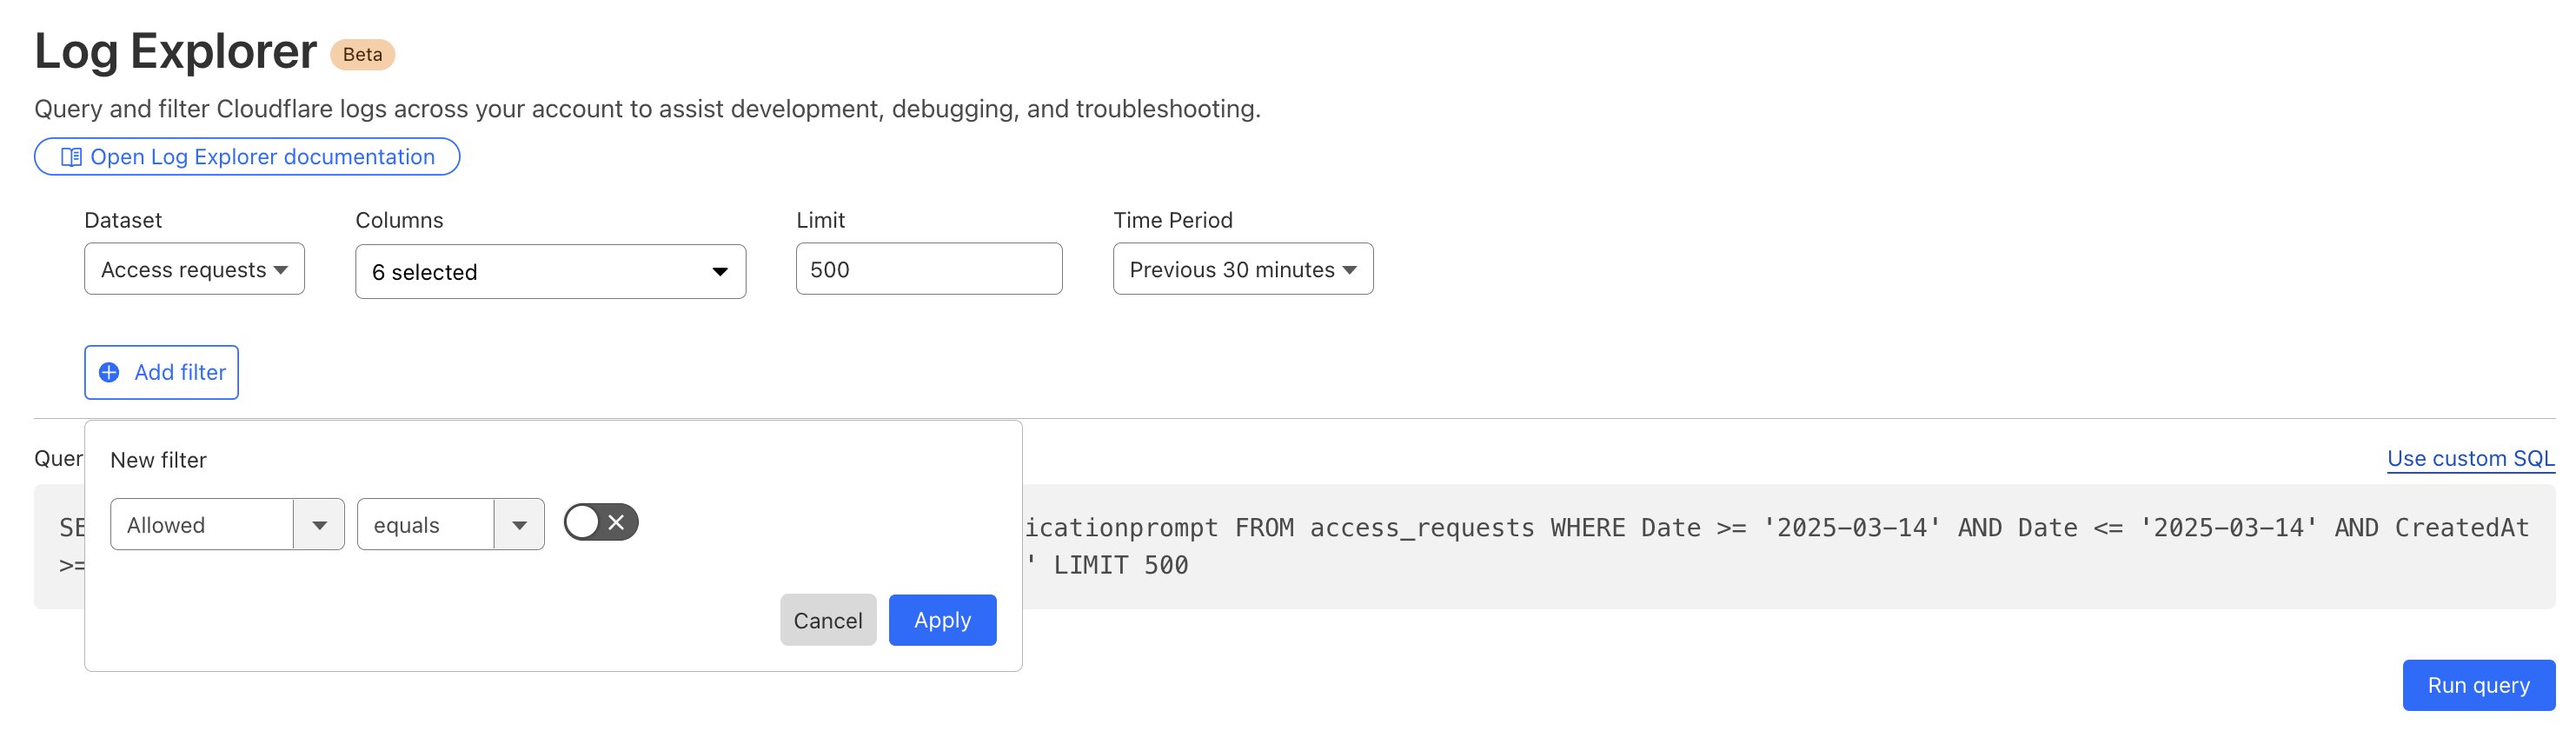
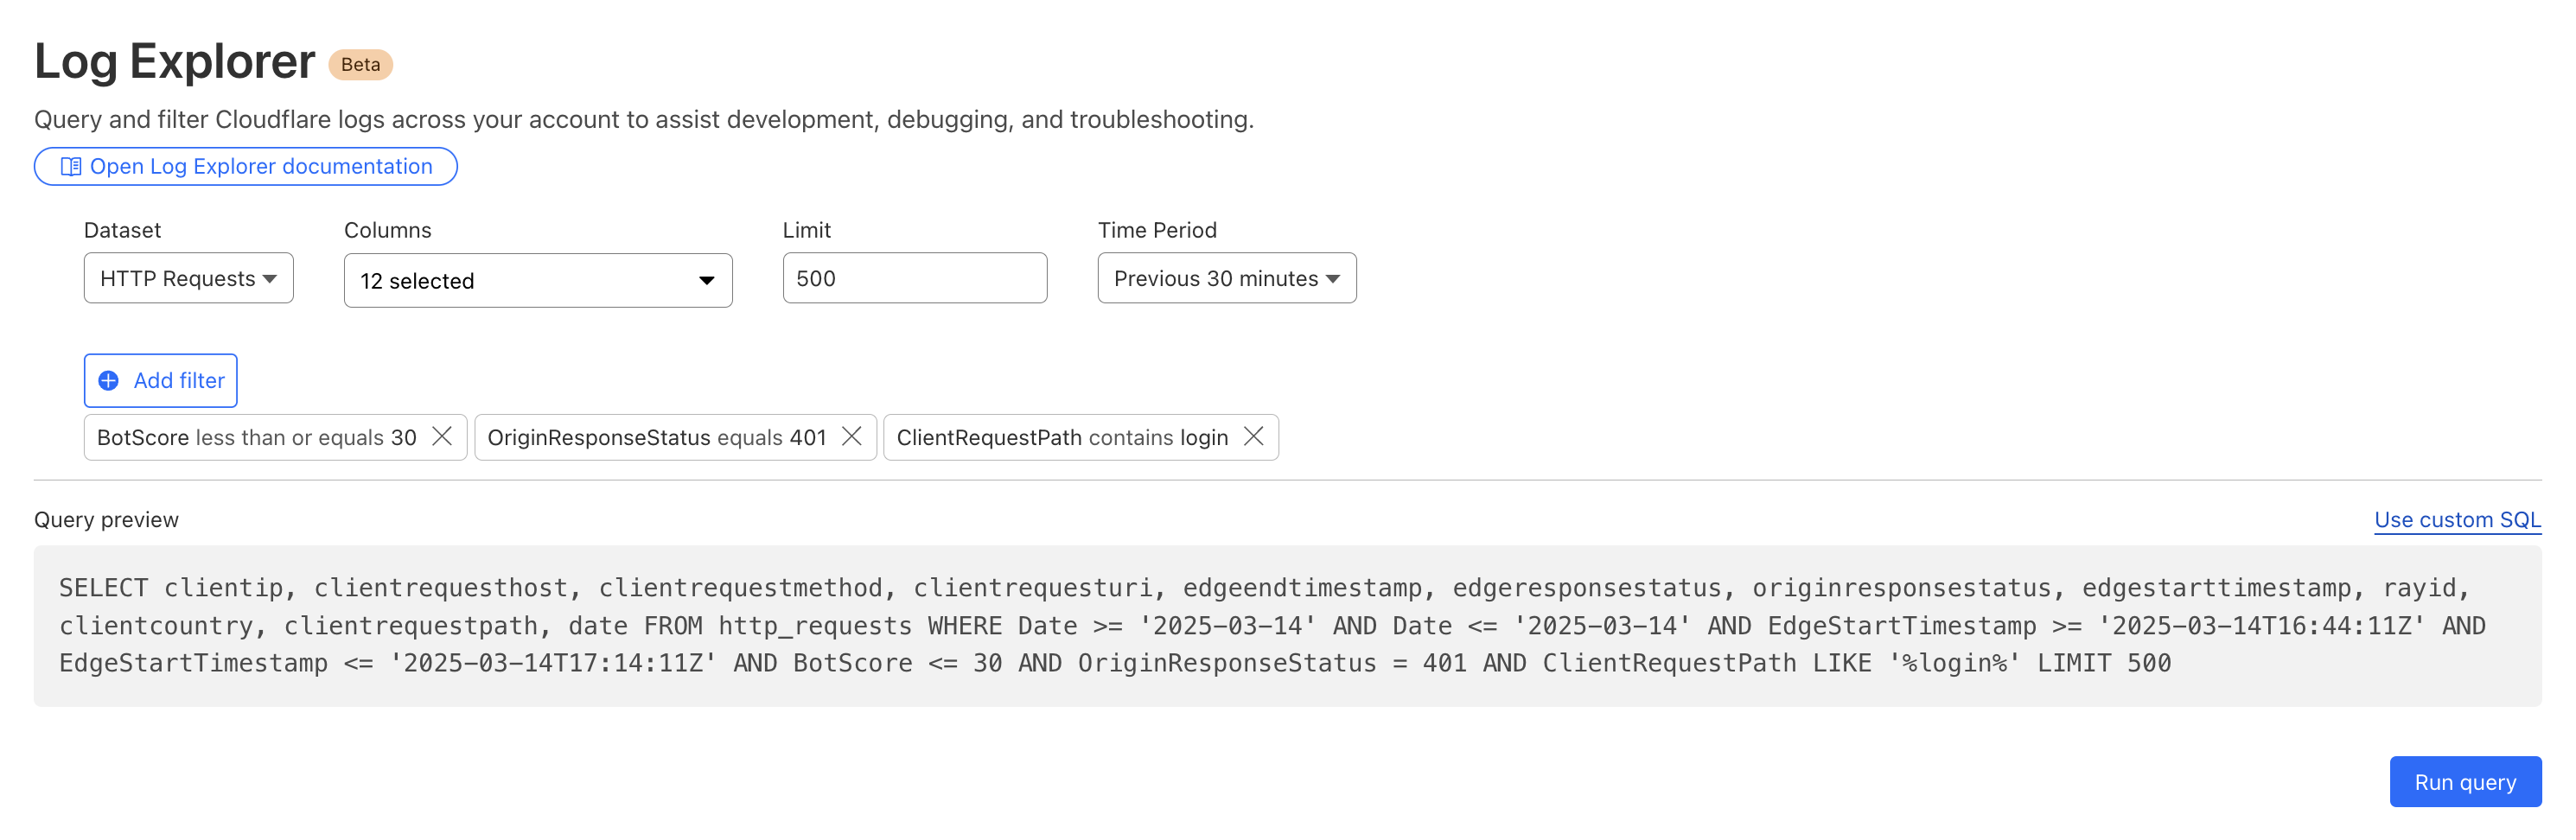
By reviewing Access logs and HTTP request logs, we can reveal attempts to access resources or systems without proper permissions, including brute force password attacks, indicating potential security breaches or malicious activity.
Below, we filter Access Logs on the Allowed field, to see activity related to unauthorized access.
By then reviewing the HTTP logs for the requests identified in the previous query, we can assess if bot networks are the source of unauthorized activity.
With this information, you can craft targeted Custom Rules to block the offending traffic.
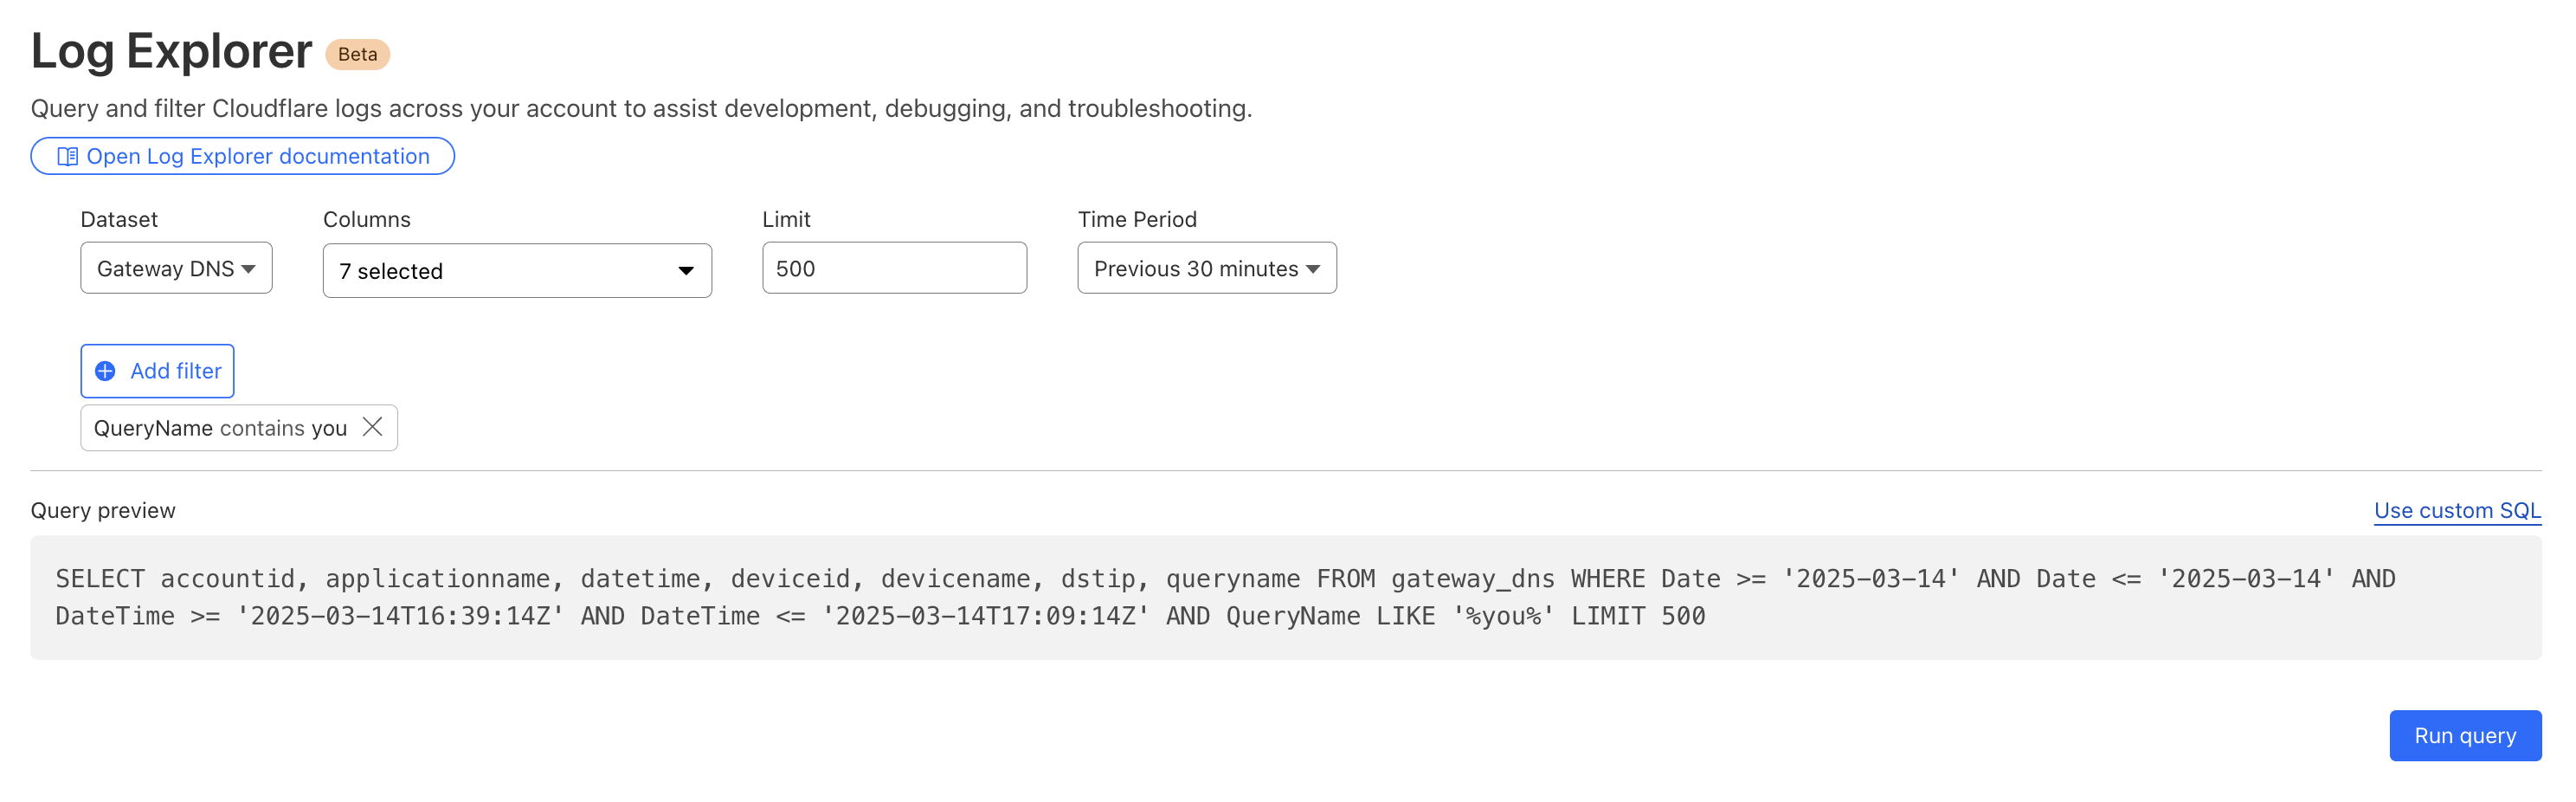
Detecting malware
Cloudflare’s Web Gateway can track which websites users are accessing, allowing administrators to identify and block access to malicious or inappropriate sites. These logs can be used to detect if a user’s machine or account is compromised by malware attacks. When reviewing logs, this may become apparent when we look for records that show a rapid succession of attempts to browse known malicious sites, such as hostnames that have long strings of seemingly random characters that hide their true destination. In this example, we can query logs looking for requests to a spoofed YouTube URL.
Monitoring what matters using custom dashboards
Security monitoring is not one size fits all. For instance, companies in the retail or financial industries worry about fraud, while every company is concerned about data exfiltration, of information like trade secrets. And any form of personally identifiable information (PII) is a target for data breaches or ransomware attacks.
While log exploration helps you react to threats, our new custom dashboards allow you to define the specific metrics you need in order to monitor threats you are concerned about.
Getting started is easy, with the ability to create a chart using natural language. A natural language interface is integrated into the chart create/edit experience, enabling you to describe in your own words the chart you want to create. Similar to the AI Assistant we announced during Security Week 2024, the prompt translates your language to the appropriate chart configuration, which can then be added to a new or existing custom dashboard.
Use a prompt: Enter a query like “Compare status code ranges over time”. The AI model decides the most appropriate visualization and constructs your chart configuration.
Customize your chart: Select the chart elements manually, including the chart type, title, dataset to query, metrics, and filters. This option gives you full control over your chart’s structure.
Video shows entering a natural language description of desired metric “compare status code ranges over time”, preview chart shown is a time series grouped by error code ranges, selects “add chart” to save to dashboard.
For more help getting started, we have some pre-built templates that you can use for monitoring specific uses. Available templates currently include:
Bot monitoring: Identify automated traffic accessing your website
API Security: Monitor the data transfer and exceptions of API endpoints within your application
API Performance: See timing data for API endpoints in your application, along with error rates
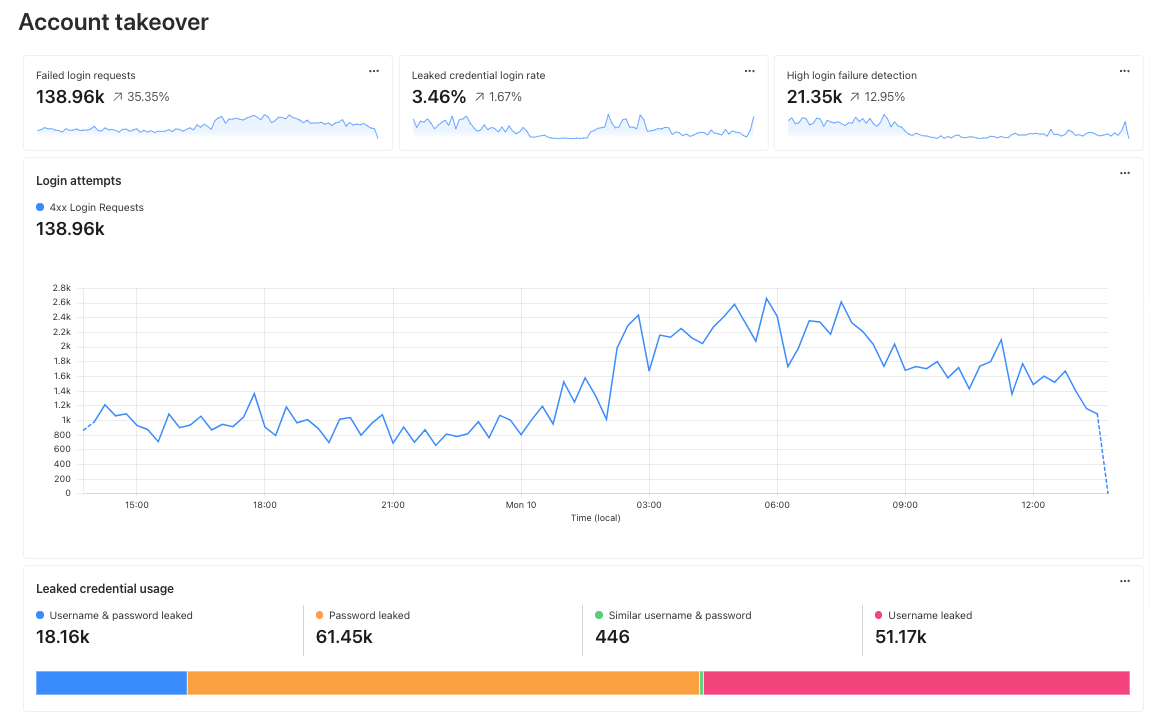
Account Takeover: View login attempts, usage of leaked credentials, and identify account takeover attacks
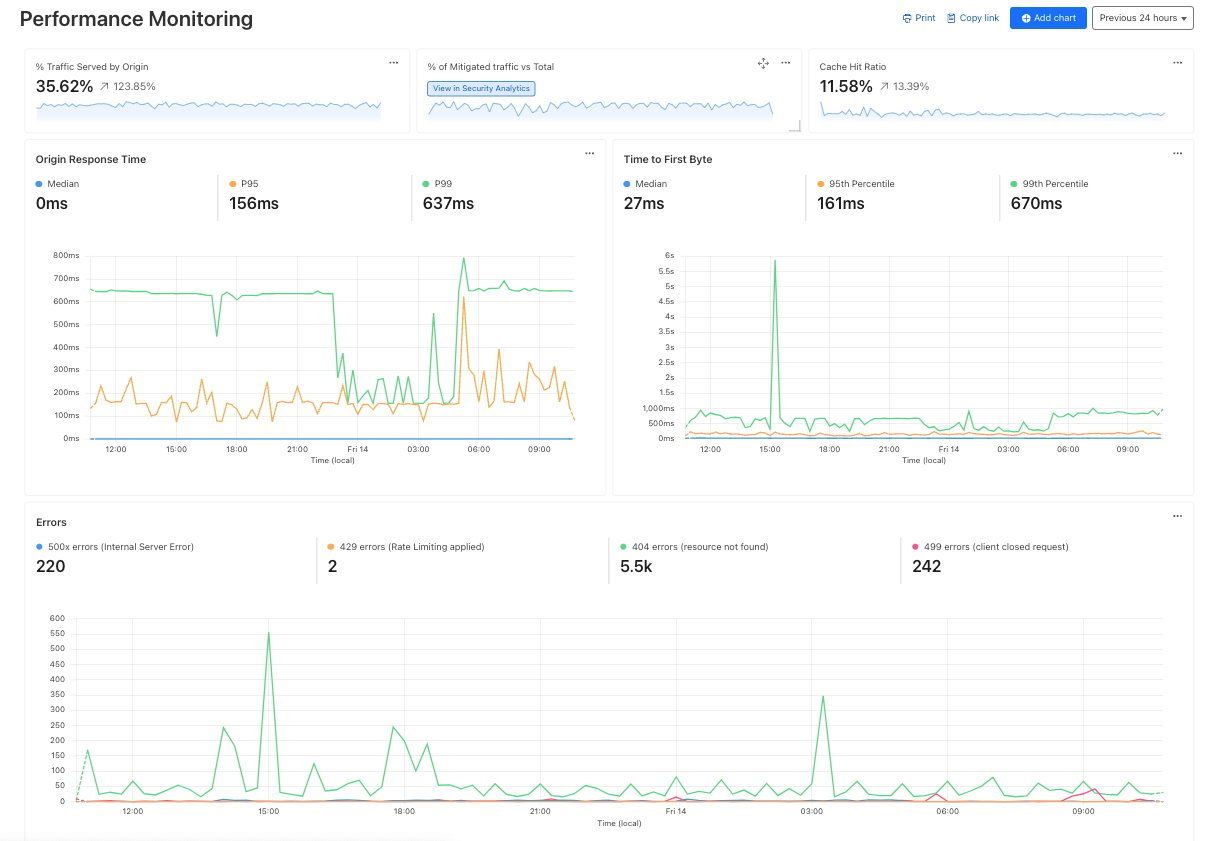
Performance Monitoring: Identify slow hosts and paths on your origin server, and view time to first byte (TTFB) metrics over time
Templates provide a good starting point, and once you create your dashboard, you can add or remove individual charts using the same natural language chart creator.
Video shows editing chart from an existing dashboard and moving individual charts via drag and drop.
Example use cases
Custom dashboards can be used to monitor for suspicious activity, or to keep an eye on performance and errors for your domains. Let’s explore some examples of suspicious activity that we can monitor using custom dashboards.
Take, for example, our use case from above: investigating unauthorized access. With custom dashboards, you can create a dashboard using the Account takeover template to monitor for suspicious login activity related to your domain.
As another example, spikes in requests or errors are common indicators that something is wrong, and they can sometimes be signals of suspicious activity. With the Performance Monitoring template, you can view origin response time and time to first byte metrics as well as monitor for common errors. For example, in this chart, the spikes in 404 errors could be an indication of an unauthorized scan of your endpoints.
Seamlessly integrated into the Cloudflare platform
When using custom dashboards, if you observe a traffic pattern or spike in errors that you would like to further investigate, you can click the button to “View in Security Analytics” in order to drill down further into the data and craft custom WAF rules to mitigate the threat.
These tools, seamlessly integrated into the Cloudflare platform, will enable users to discover, investigate, and mitigate threats all in one place, reducing time to resolution and overall cost of ownership by eliminating the need to forward logs to third party security analysis tools. And because it is a native part of Cloudflare, you can immediately use the data from your investigation to craft targeted rules that will block these threats.
What’s next
Stay tuned as we continue to develop more capabilities in the areas of observability and forensics, with additional features including:
Custom alerts: create alerts based on specific metrics or anomalies
Scheduled query detections: craft log queries and run them on a schedule to detect malicious activity
More integration: further streamlining the journey between detect, investigate, and mitigate across the full Cloudflare platform.
How to get it
Current Log Explorer beta users get immediate access to the new custom dashboards feature. Pricing will be made available to everyone during Q2 2025. Between now and then, these features continue to be available at no cost.
Let us know if you are interested in joining our Beta program by completing this form, and a member of our team will contact you.
In today’s fast-paced digital landscape, companies are managing an increasingly complex mix of environments — from SaaS applications and public cloud platforms to on-prem data centers and hybrid setups. This diverse infrastructure offers flexibility and scalability, but also opens up new attack surfaces.
To support both business continuity and security needs, “security must evolve from being reactive to predictive”. Maintaining a healthy security posture entails monitoring and strengthening your security defenses to identify risks, ensure compliance, and protect against evolving threats. With our newest capabilities, you can now use Cloudflare to achieve a healthy posture across your SaaS and web applications. This addresses any security team’s ultimate (daily) question: How well are our assets and documents protected?
A predictive security posture relies on the following key components:
Real-time discovery and inventory of all your assets and documents
Continuous asset-aware threat detection and risk assessment
Prioritised remediation suggestions to increase your protection
Today, we are sharing how we have built these key components across SaaS and web applications, and how you can use them to manage your business’s security posture.
Your security posture at a glance
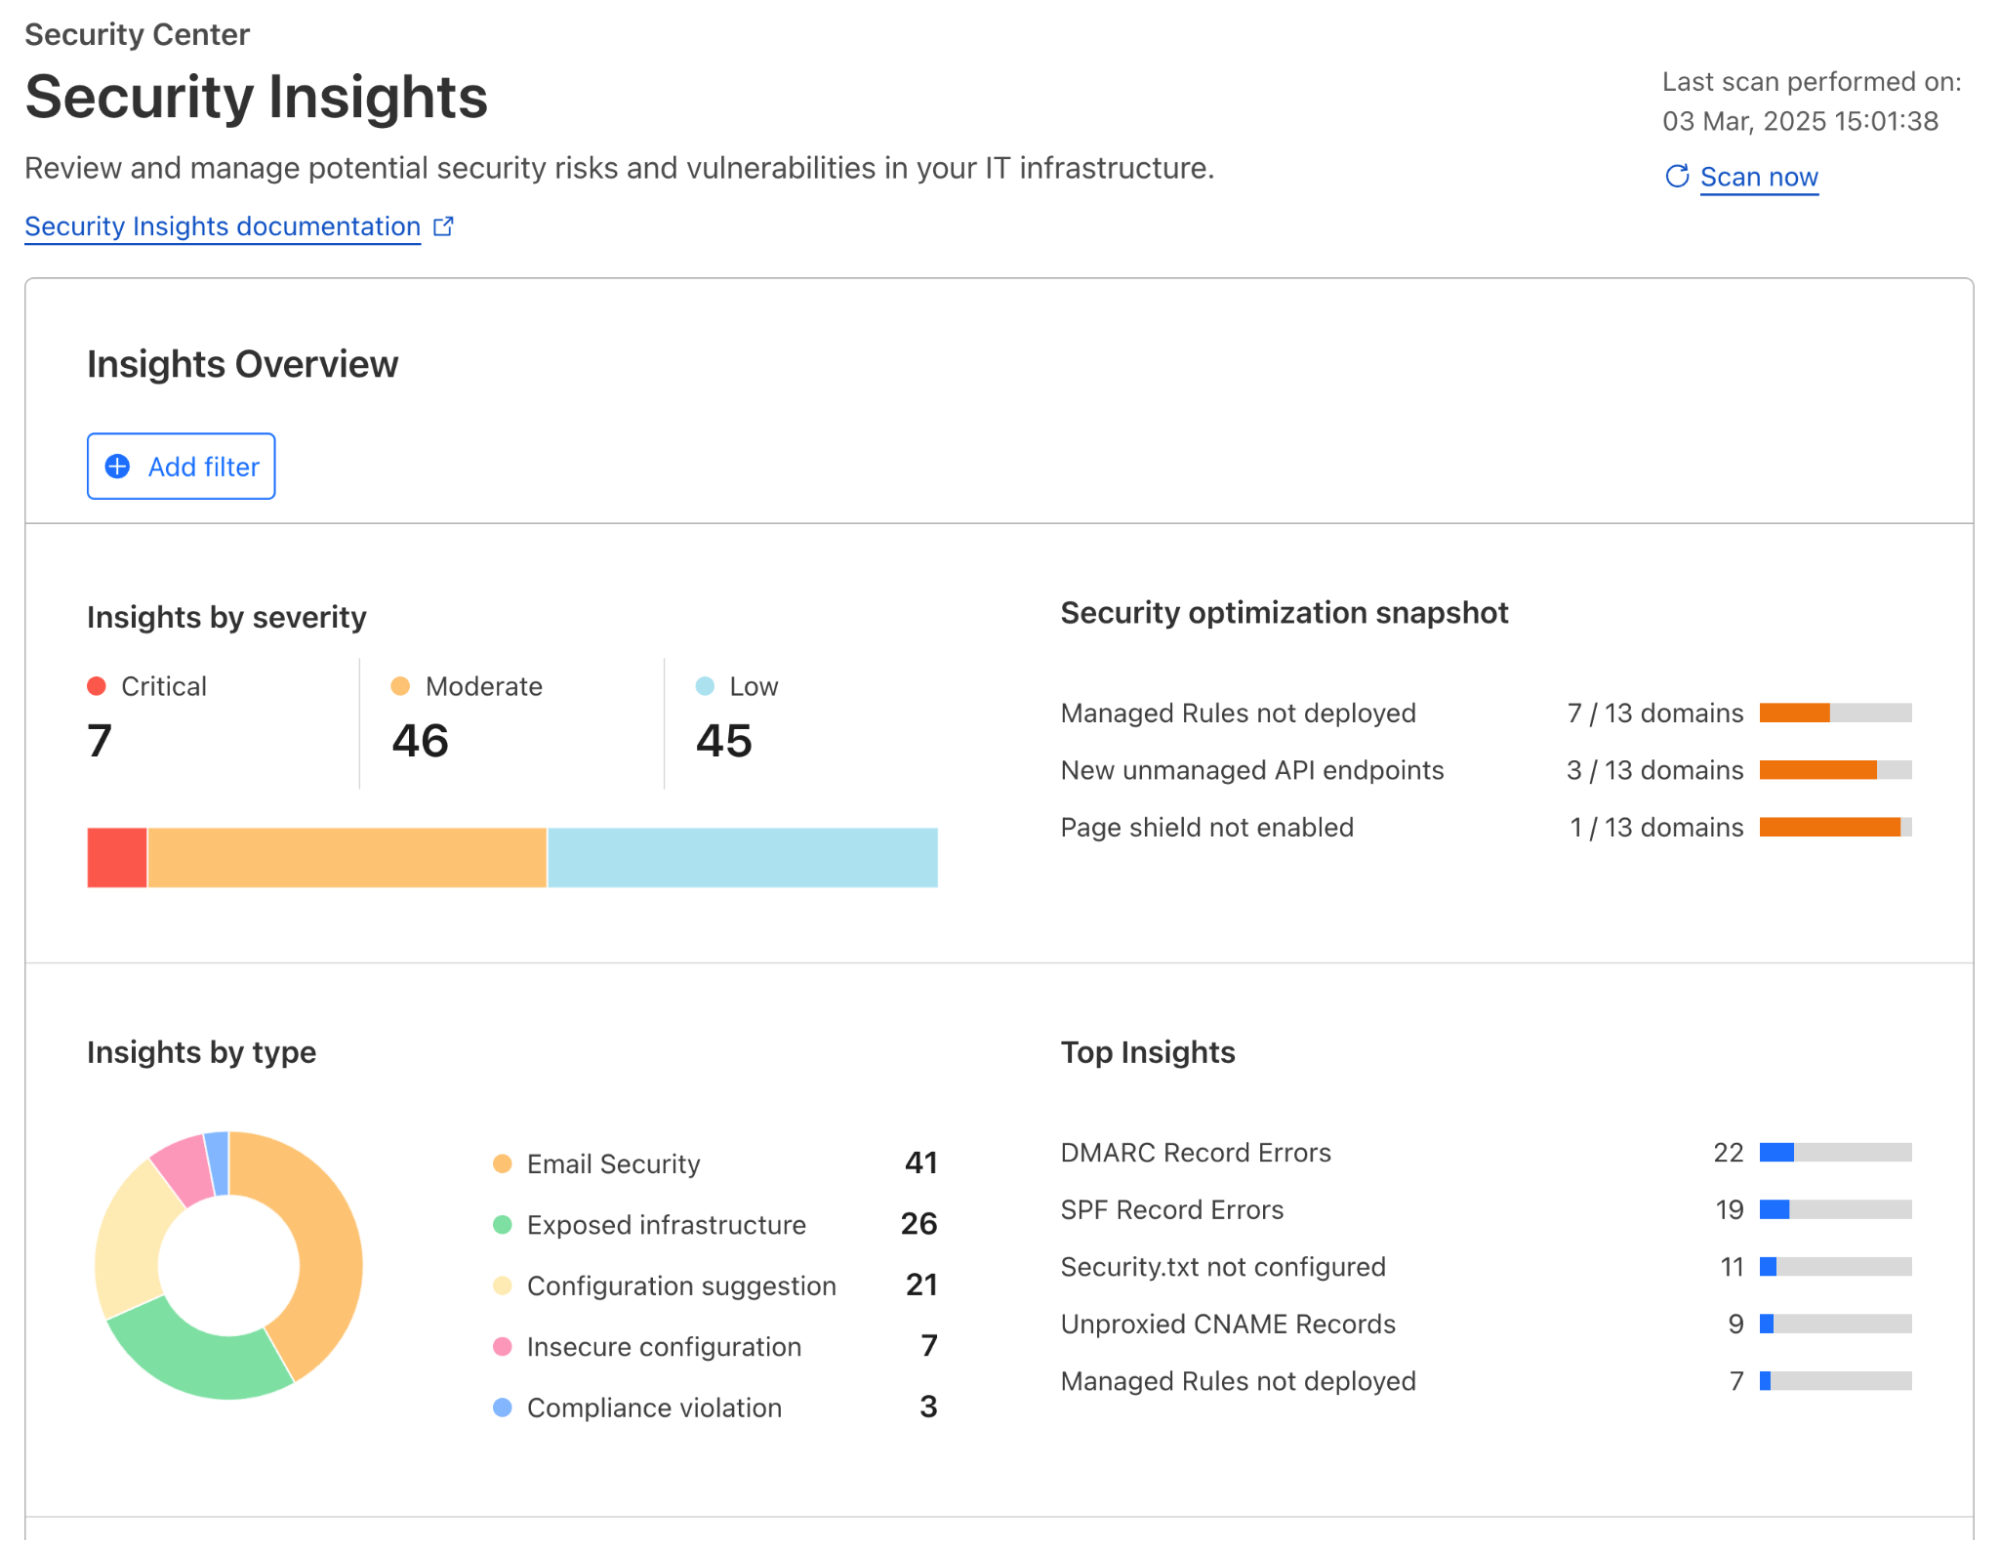
Regardless of the applications you have connected to Cloudflare’s global network, Cloudflare actively scans for risks and misconfigurations associated with each one of them on a regular cadence. Identified risks and misconfigurations are surfaced in the dashboard under Security Center as insights.
Insights are grouped by their severity, type of risks, and corresponding Cloudflare solution, providing various angles for you to zoom in to what you want to focus on. When applicable, a one-click resolution is provided for selected insight types, such as setting minimum TLS version to 1.2 which is recommended by PCI DSS. This simplicity is highly appreciated by customers that are managing a growing set of assets being deployed across the organization.
To help shorten the time to resolution even further, we have recently added role-based access control (RBAC) to Security Insights in the Cloudflare dashboard. Now for individual security practitioners, they have access to a distilled view of the insights that are relevant for their role. A user with an administrator role (a CSO, for example) has access to, and visibility into, all insights.
In addition to account-wide Security Insights, we also provide posture overviews that are closer to the corresponding security configurations of your SaaS and web applications. Let’s dive into each of them.
Securing your SaaS applications
Without centralized posture management, SaaS applications can feel like the security wild west. They contain a wealth of sensitive information – files, databases, workspaces, designs, invoices, or anything your company needs to operate, but control is limited to the vendor’s settings, leaving you with less visibility and fewer customization options. Moreover, team members are constantly creating, updating, and deleting content that can cause configuration drift and data exposure, such as sharing files publicly, adding PII to non-compliant databases, or giving access to third party integrations. With Cloudflare, you have visibility across your SaaS application fleet in one dashboard.
Posture findings across your SaaS fleet
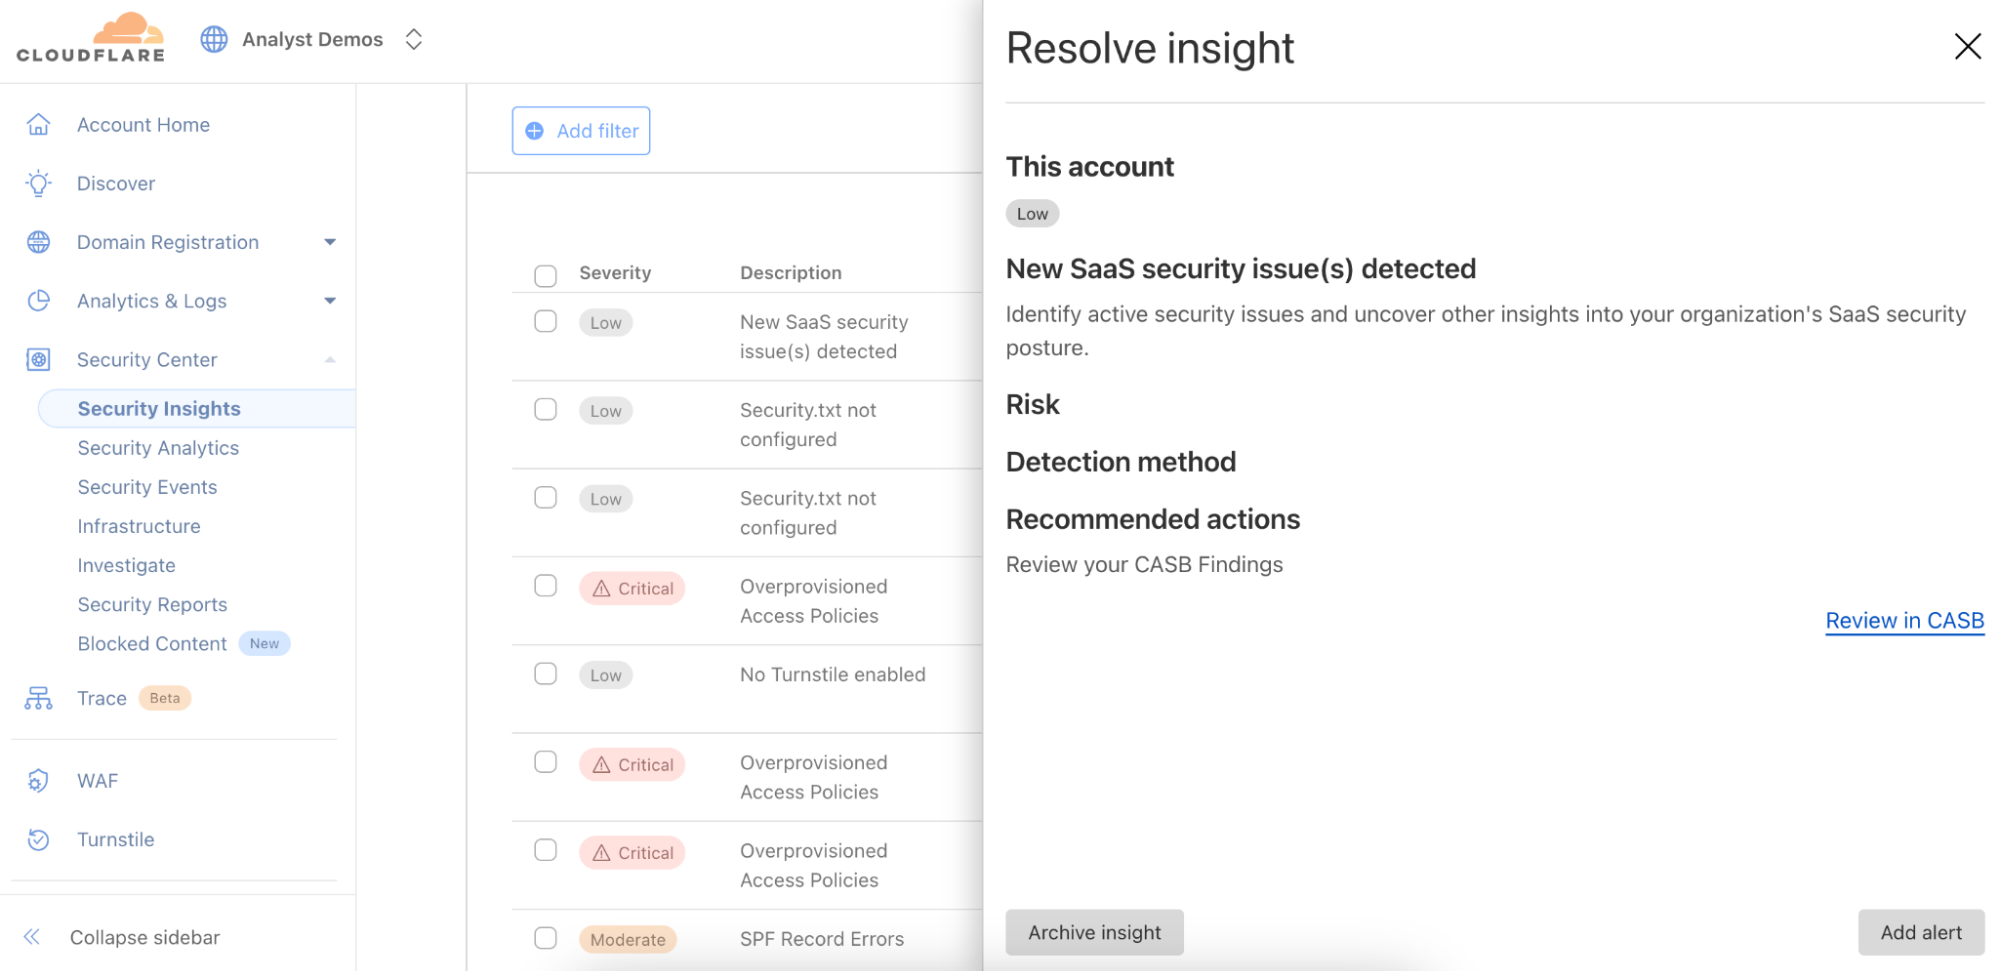
From the account-wide Security Insights, you can review insights for potential SaaS security issues:
You can choose to dig further with Cloud Access Security Broker (CASB) for a thorough review of the misconfigurations, risks, and failures to meet best practices across your SaaS fleet. You can identify a wealth of security information including, but not limited to:
Publicly available or externally shared files
Third-party applications with read or edit access
Unknown or anonymous user access
Databases with exposed credentials
Users without two-factor authentication
Inactive user accounts
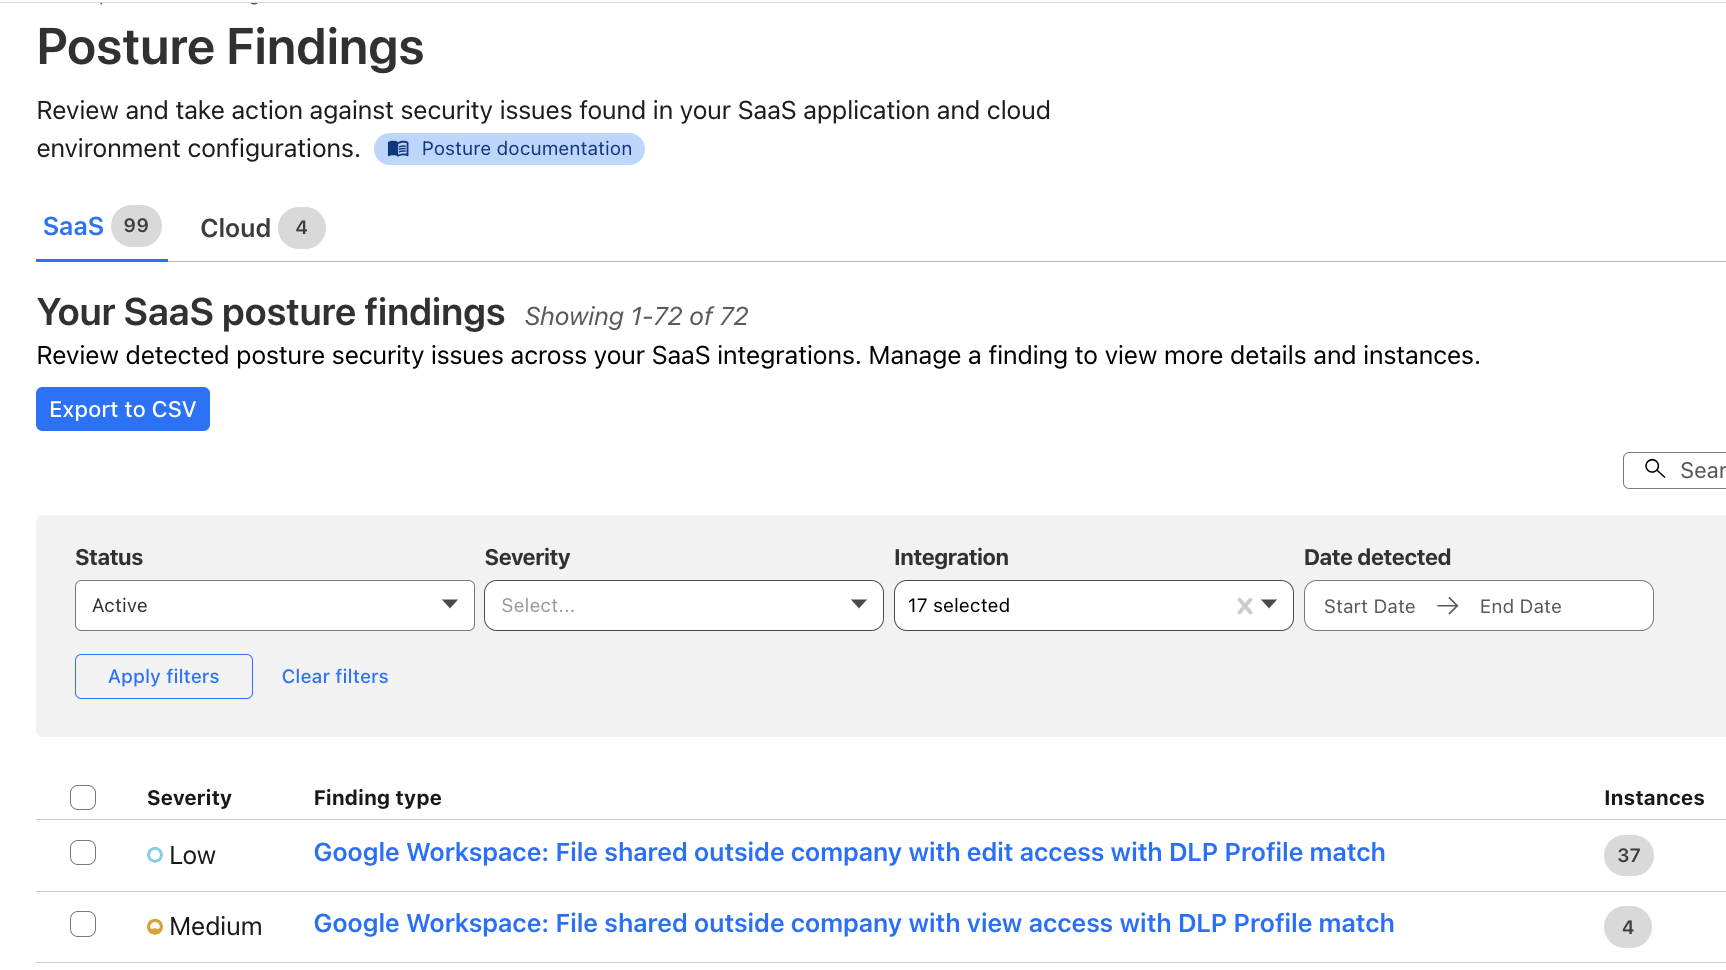
You can also explore the Posture Findings page, which provides easy searching and navigation across documents that are stored within the SaaS applications.
Additionally, you can create policies to prevent configuration drift in your environment. Prevention-based policies help maintain a secure configuration and compliance standards, while reducing alert fatigue for Security Operations teams, and these policies can prevent the inappropriate movement or exfiltration of sensitive data. Unifying controls and visibility across environments makes it easier to lock down regulated data classes, maintain detailed audit trails via logs, and improve your security posture to reduce the risk of breaches.
How it works: new, real-time SaaS documents discovery
Delivering SaaS security posture information to our customers requires collecting vast amounts of data from a wide range of platforms. In order to ensure that all the documents living in your SaaS apps (files, designs, etc.) are secure, we need to collect information about their configuration — are they publicly shared, do third-party apps have access, is multi-factor authentication (MFA) enabled?
We previously did this with crawlers, which would pull data from the SaaS APIs. However, we were plagued with rate limits from the SaaS vendors when working with larger datasets. This forced us to work in batches and ramp scanning up and down as the vendors permitted. This led to stale findings and would make remediation cumbersome and unclear – for example, Cloudflare would be reporting that a file is still shared publicly for a short period after the permissions were removed, leading to customer confusion.
To fix this, we upgraded our data collection pipeline to be dynamic and real-time, reacting to changes in your environment as they occur, whether it’s a new security finding, an updated asset, or a critical alert from a vendor. We started with our Microsoft asset discovery and posture findings, providing you real-time insight into your Microsoft Admin Center, OneDrive, Outlook, and SharePoint configurations. We will be rapidly expanding support to additional SaaS vendors going forward.
Listening for update events from Cloudflare Workers
Cloudflare Workers serve as the entry point for vendor webhooks, handling asset change notifications from external services. The workflow unfolds as follows:
Webhook listener: An initial Worker acts as the webhook listener, receiving asset change messages from vendors.
Data storage & queuing: Upon receiving a message, the Worker uploads the raw payload of the change notification to Cloudflare R2 for persistence, and publishes it to a Cloudflare Queue dedicated to raw asset changes.
Transformation Worker: A second Worker, bound as a consumer to the raw asset change queue, processes the incoming messages. This Worker transforms the raw vendor-specific data into a generic format suitable for CASB. The transformed data is then:
Stored in Cloudflare R2 for future reference.
Published on another Cloudflare Queue, designated for transformed messages.
CASB Processing: Consumers & Crawlers
Once the transformed messages reach the CASB layer, they undergo further processing:
Polling consumer: CASB has a consumer that polls the transformed message queue. Upon receiving a message, it determines the relevant handler required for processing.
Crawler execution: The handler then maps the message to an appropriate crawler, which interacts with the vendor API to fetch the most up-to-date asset details.
Data storage: The retrieved asset data is stored in the CASB database, ensuring it is accessible for security and compliance checks.
With this improvement, we are now processing 10 to 20 Microsoft updates per second, or 864,000 to 1.72 million updates daily, giving customers incredibly fast visibility into their environment. Look out for expansion to other SaaS vendors in the coming months.
Securing your web applications
A unique challenge of securing web applications is that no one size fits all. An asset-aware posture management bridges the gap between a universal security solution and unique business needs, offering tailored recommendations for security teams to protect what matters.
Posture overview from attacks to threats and risks
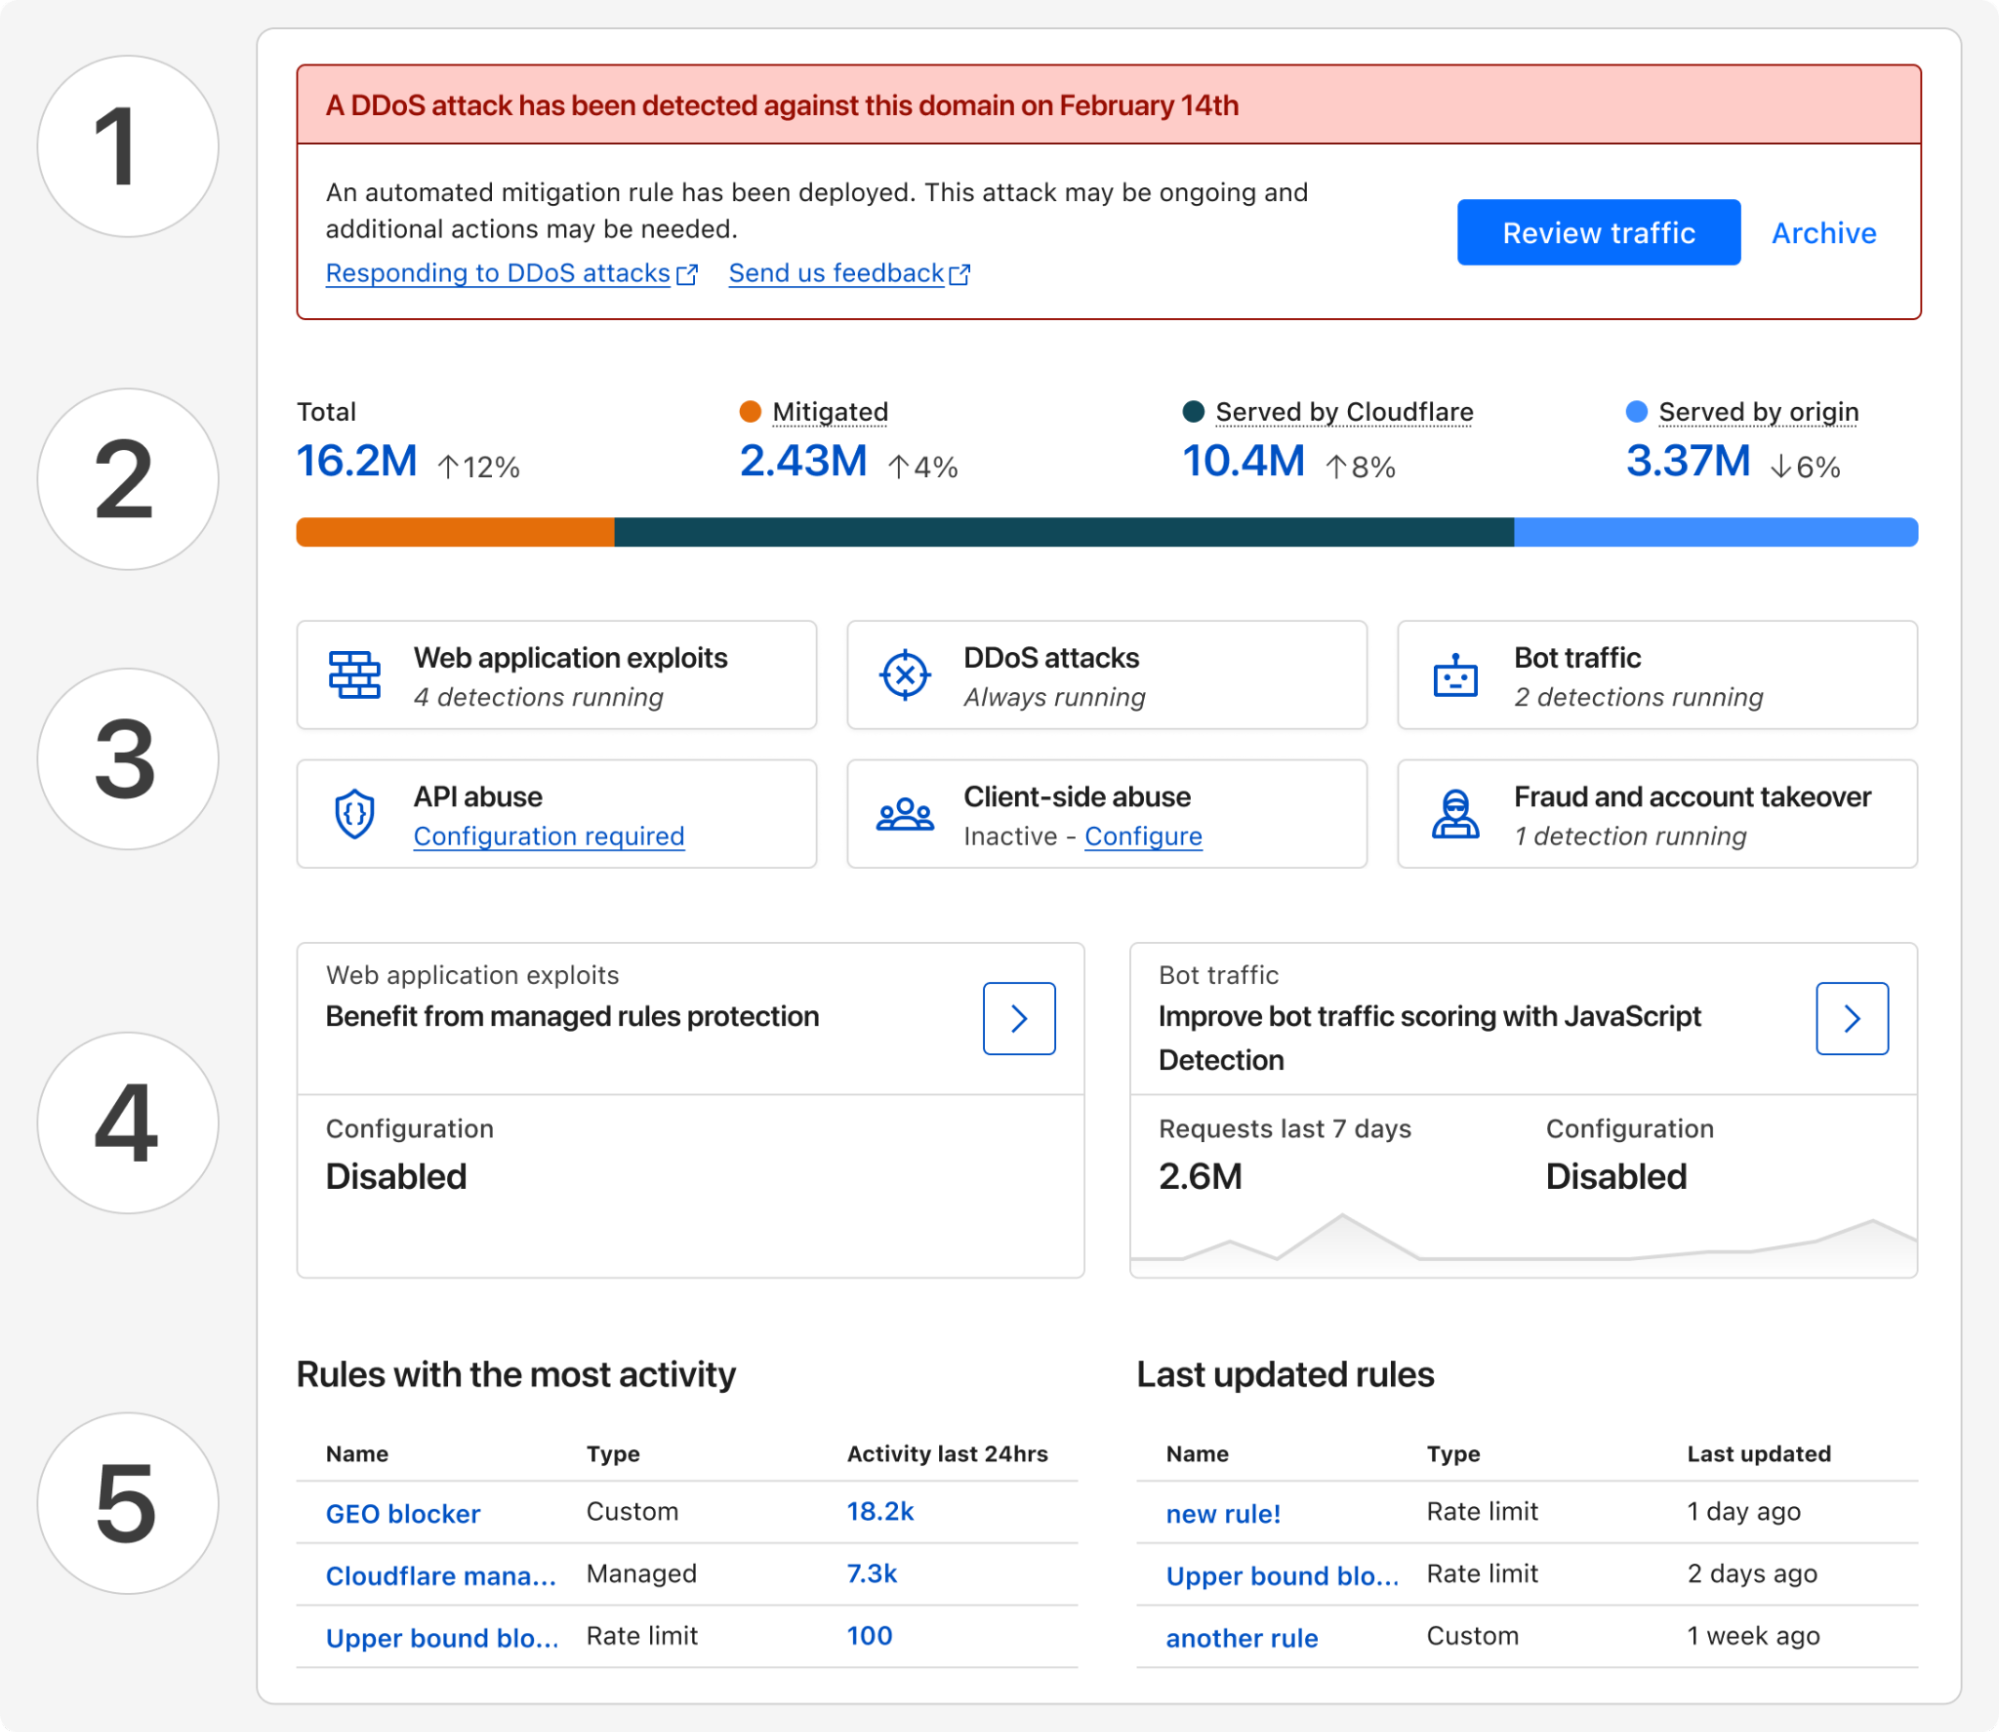
Starting today, all Cloudflare customers have access to Security Overview, a new landing page customized for each of your onboarded domains. This page aggregates and prioritizes security suggestions across all your web applications:
Any (ongoing) attacks detected that require immediate attention
Disposition (mitigated, served by Cloudflare, served by origin) of all proxied traffic over the last 7 days
Summary of currently active security modules that are detecting threats
Suggestions of how to improve your security posture with a step-by-step guide
And a glimpse of your most active and lately updated security rules
These tailored security suggestions are surfaced based on your traffic profile and business needs, which is made possible by discovering your proxied web assets.
Discovery of web assets
Many web applications, regardless of their industry or use case, require similar functionality: user identification, accepting payment information, etc. By discovering the assets serving this functionality, we can build and run targeted threat detection to protect them in depth.
As an example, bot traffic towards marketing pages versus login pages have different business impacts. Content scraping may be happening targeting your marketing materials, which you may or may not want to allow, while credential stuffing on your login page deserves immediate attention.
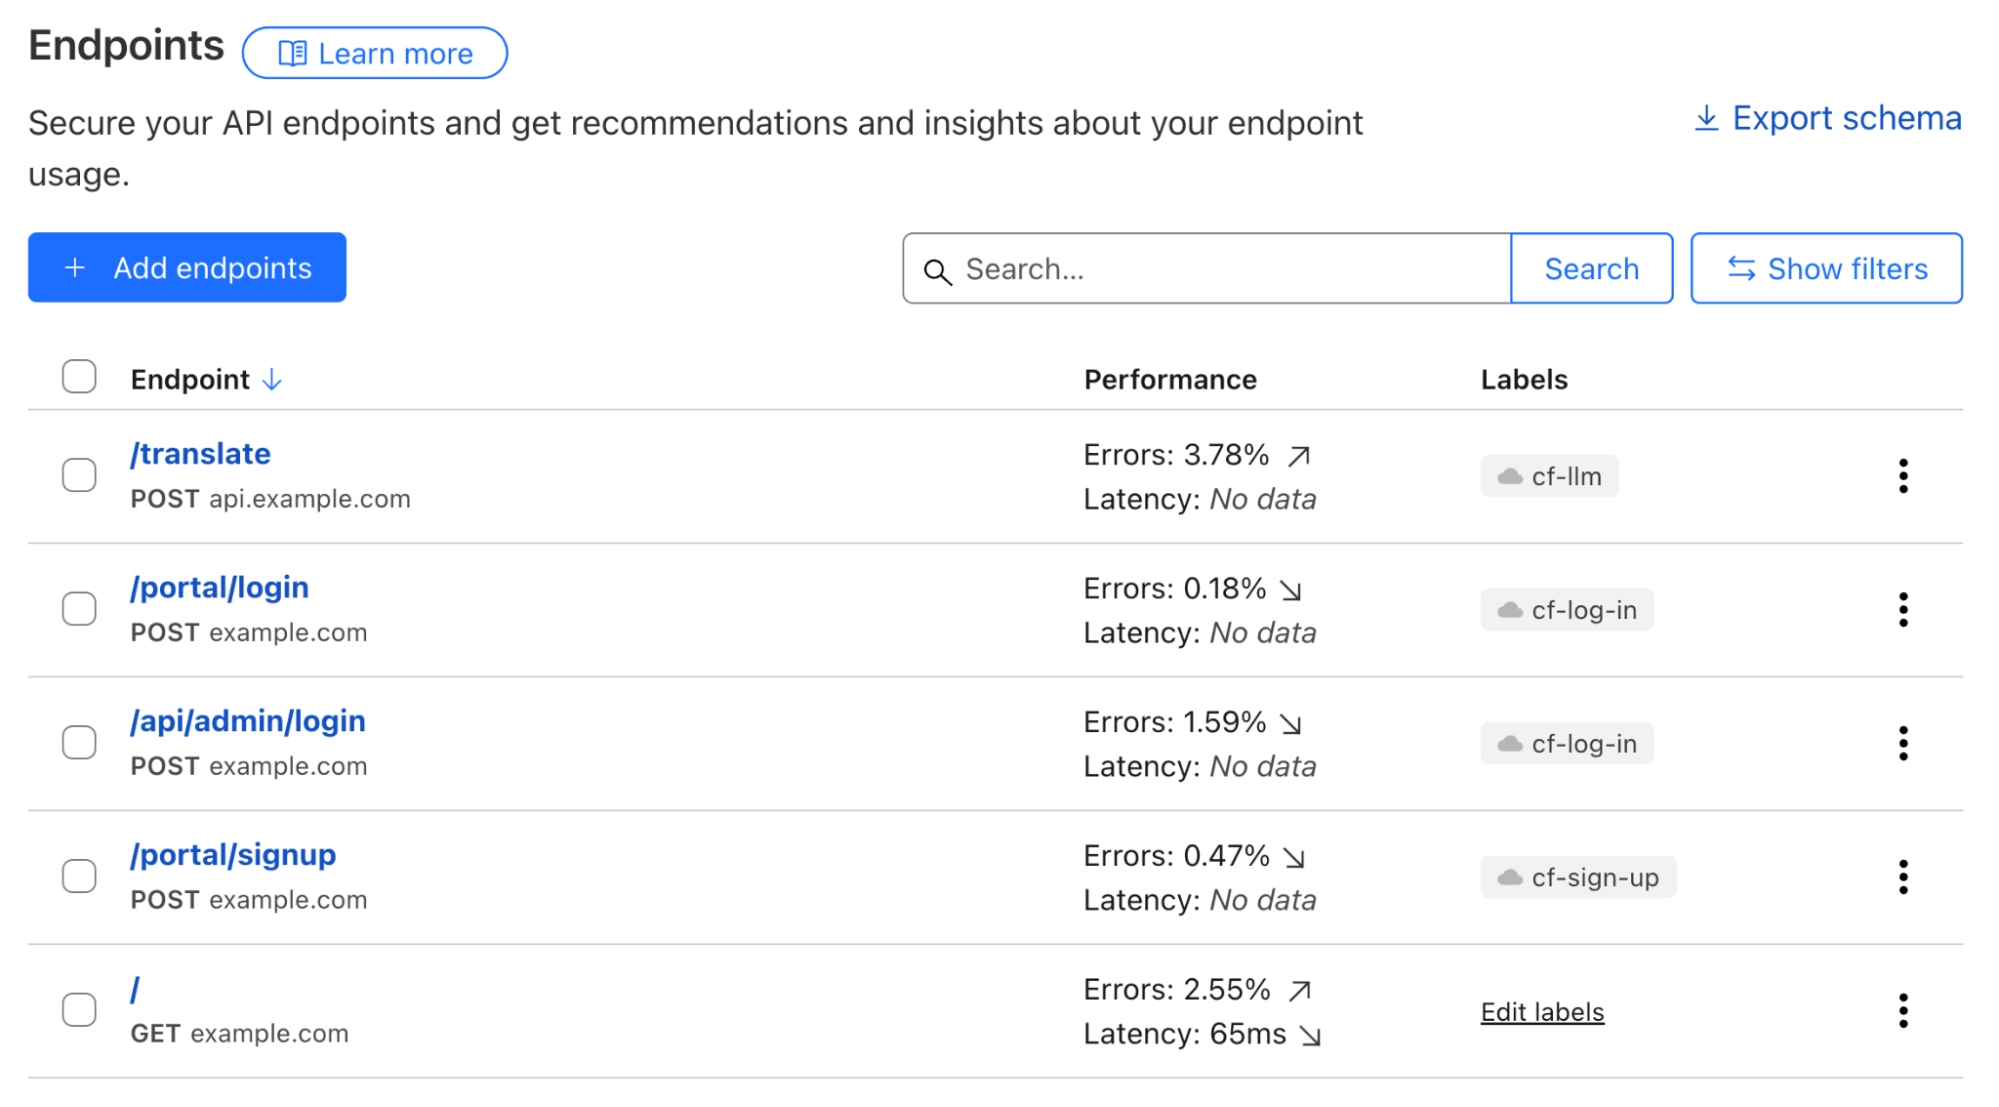
Web assets are described by a list of endpoints; and labelling each of them defines their business goals. A simple example can be POST requests to path /portal/login, which likely describes an API for user authentication. While the GET requests to path /portal/login denote the actual login webpage.
To describe business goals of endpoints, labels come into play. POST requests to the /portal/login endpoint serving end users and to the /api/admin/login endpoint used by employees can both can be labelled using the same cf-log-inmanaged label, letting Cloudflare know that usernames and passwords would be expected to be sent to these endpoints.
API Shield customers can already make use of endpoint labelling. In early Q2 2025, we are adding label discovery and suggestion capabilities, starting with three labels, cf-log-in, cf-sign-up, and cf-rss-feed. All other customers can manually add these labels to the saved endpoints. One example, explained below, is preventing disposable emails from being used during sign-ups.
Always-on threat detection and risk assessment
Use-case driven threat detection
Customers told us that, with the growing excitement around generative AI, they need support to secure this new technology while not hindering innovation. Being able to discover LLM-powered services allows fine-tuning security controls that are relevant for this particular technology, such as inspecting prompts, limit prompting rates based on token usage, etc. In a separate Security Week blog post, we will share how we build Cloudflare Firewall for AI, and how you can easily protect your generative AI workloads.
Account fraud detection, which encompasses multiple attack vectors, is another key area that we are focusing on in 2025.
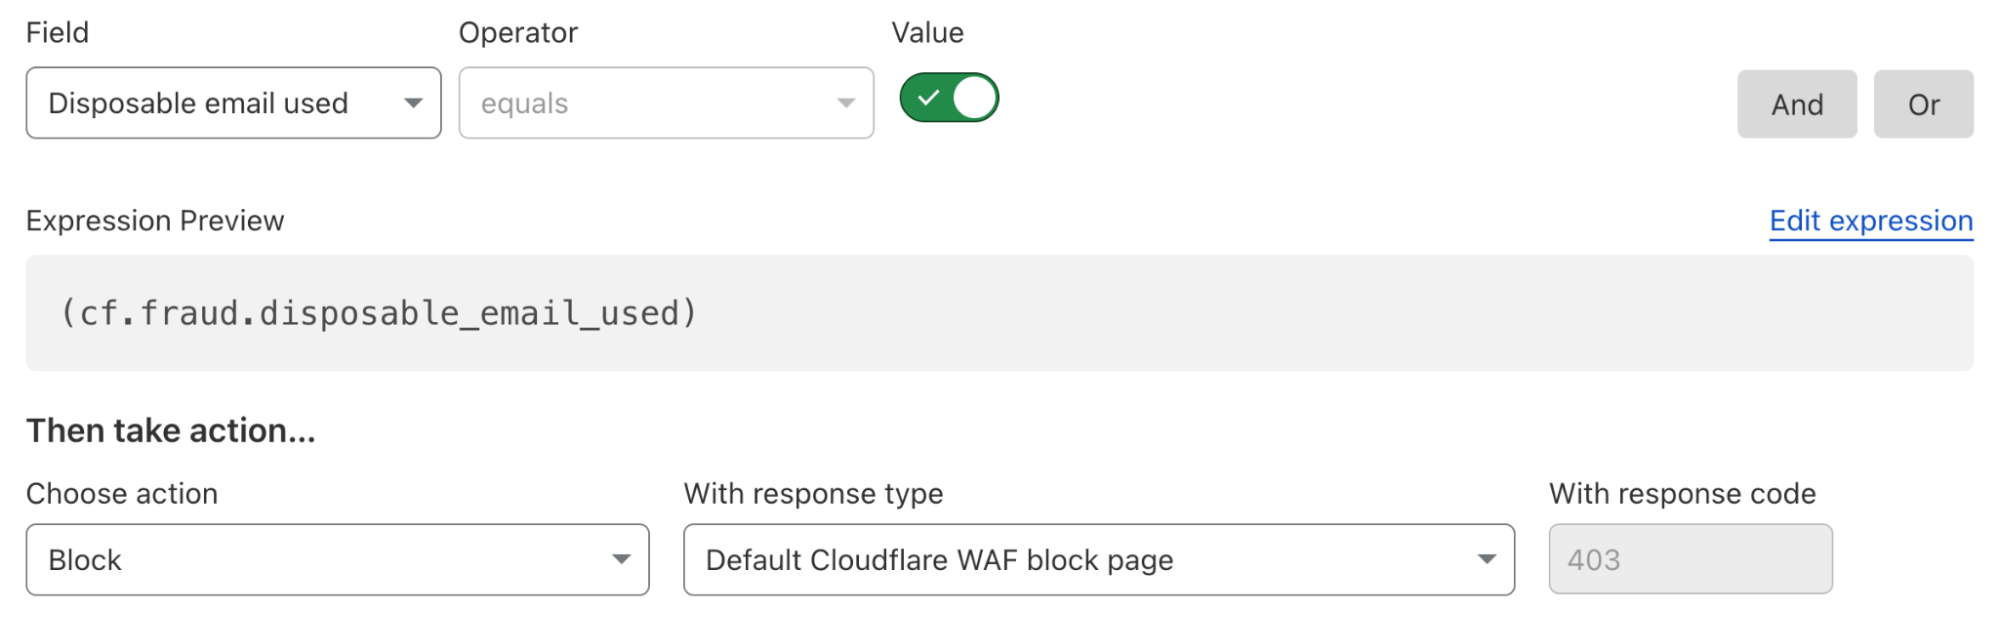
On many login and signup pages, a CAPTCHA solution is commonly used to only allow human beings through, assuming only bots perform undesirable actions. Put aside that most visual CAPTCHA puzzles can be easily solved by AI nowadays, such an approach cannot effectively solve the root cause of most account fraud vectors. For example, human beings using disposable emails to sign up single-use accounts to take advantage of signup promotions.
To solve this fraudulent sign up issue, a security rule currently under development could be deployed as below to block all attempts that use disposable emails as a user identifier, regardless of whether the requester was automated or not. All existing or future cf-log-in and cf-sign-up labelled endpoints are protected by this single rule, as they both require user identification.
Our fast expanding use-case driven threat detections are all running by default, from the first moment you onboarded your traffic to Cloudflare. The instant available detection results can be reviewed through security analytics, helping you make swift informed decisions.
API endpoint risk assessment
APIs have their own set of risks and vulnerabilities, and today Cloudflare is delivering seven new risk scans through API Posture Management. This new capability of API Shield helps reduce risk by identifying security issues and fixing them early, before APIs are attacked. Because APIs are typically made up of many different backend services, security teams need to pinpoint which backend service is vulnerable so that development teams may remediate the identified issues.
Our new API posture management risk scans do exactly that: users can quickly identify which API endpoints are at risk to a number of vulnerabilities, including sensitive data exposure, authentication status, Broken Object Level Authorization (BOLA) attacks, and more.
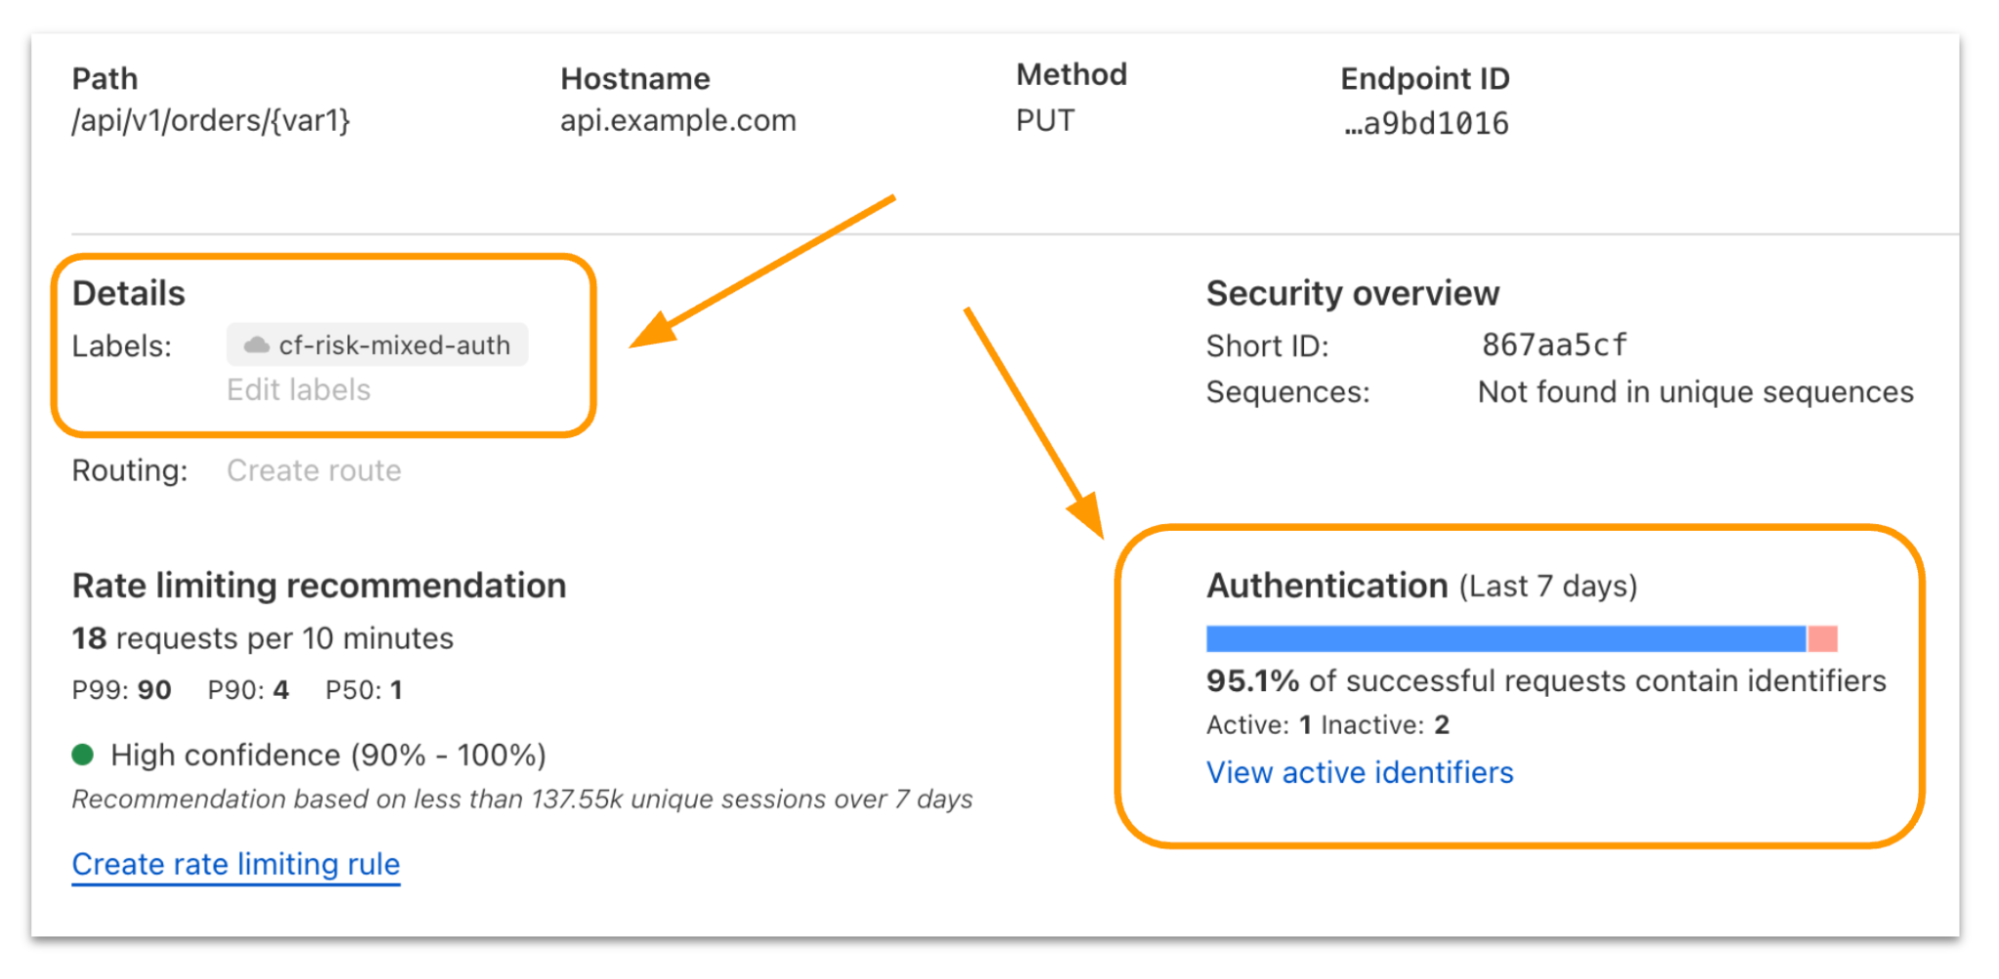
Authentication Posture is one risk scan you’ll see in the new system. We focused on it to start with because sensitive data is at risk when API authentication is assumed to be enforced but is actually broken. Authentication Posture helps customers identify authentication misconfigurations for APIs and alerts of their presence. This is achieved by scanning for successful requests against the API and noting their authentication status. API Shield scans traffic daily and labels API endpoints that have missing and mixed authentication for further review.
For customers that have configured session IDs in API Shield, you can find the new risk scan labels and authentication details per endpoint in API Shield. Security teams can take this detail to their development teams to fix the broken authentication.
We’re launching today with scans for authentication posture, sensitive data, underprotected APIs, BOLA attacks, and anomaly scanning for API performance across errors, latency, and response size.
Simplify maintaining a good security posture with Cloudflare
Achieving a good security posture in a fast-moving environment requires innovative solutions that can transform complexity into simplicity. Bringing together the ability to continuously assess threats and risks across both public and private IT environments through a single platform is our first step in supporting our customers’ efforts to maintain a healthy security posture.
To further enhance the relevance of security insights and suggestions provided and help you better prioritize your actions, we are looking into integrating Cloudflare’s global view of threat landscapes. With this, you gain additional perspectives, such as what the biggest threats to your industry are, and what attackers are targeting at the current moment. Stay tuned for more updates later this year.
If you haven’t done so yet, onboard your SaaS and web applications to Cloudflare today to gain instant insights into how to improve your business’s security posture.
Today, one of the greatest challenges that cyber defenders face is analyzing detection hits from indicator feeds, which provide metadata about specific indicators of compromise (IOCs), like IP addresses, ASNs, domains, URLs, and hashes. While indicator feeds have proliferated across the threat intelligence industry, most feeds contain no contextual information about why an indicator was placed on the feed. Another limitation of most feeds today is that they focus solely on blockable indicators and cannot easily accommodate more complex cases, such as a threat actor exploiting a CVE or an insider threat. Instead, this sort of complex threat intelligence is left for long form reporting. However, long-form reporting comes with its own challenges, such as the time required for writing and editing, which can lead to significant delays in releasing timely threat intelligence.
To help address these challenges, we are excited to launch our threat events platform for Cloudforce One customers. Every day, Cloudflare blocks billions of cyber threats. This new platform contains contextual data about the threats we monitor and mitigate on the Cloudflare network and is designed to empower security practitioners and decision makers with actionable insights from a global perspective.
On average, we process 71 million HTTP requests per second and 44 million DNS queries per second. This volume of traffic provides us with valuable insights and a comprehensive view of current (real-time) threats. The new threat events platform leverages the insights from this traffic to offer a comprehensive, real-time view of threat activity occurring on the Internet, enabling Cloudforce One customers to better protect their assets and respond to emerging threats.
How we built the threat events platform leveraging Cloudflare’s traffic insights
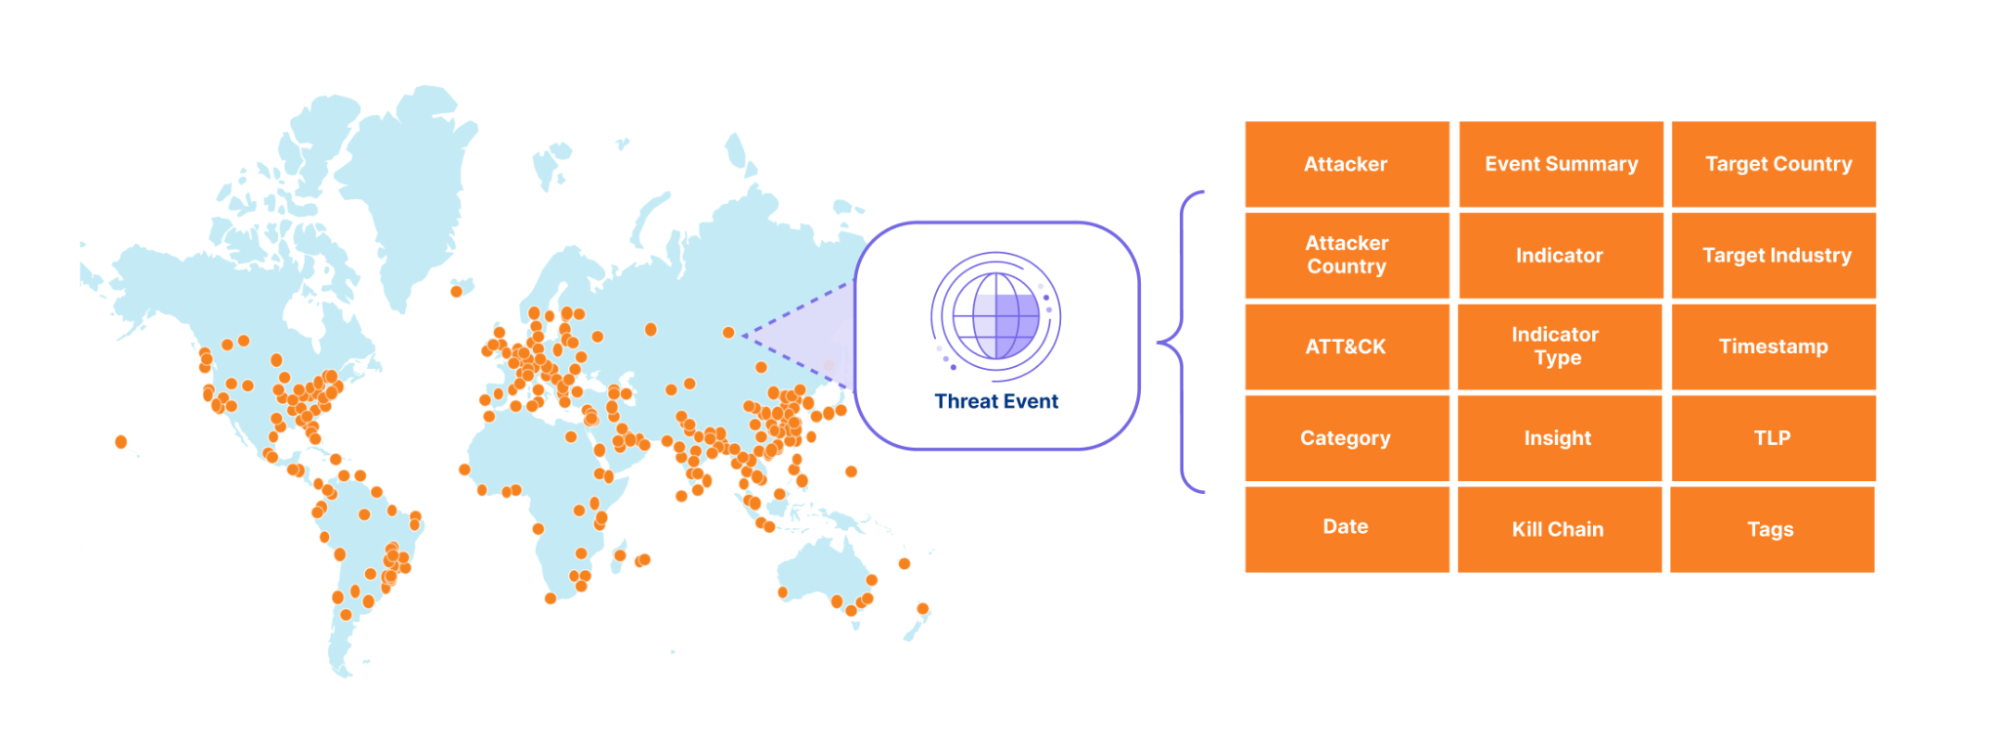
The sheer volume of threat activity observed across Cloudflare’s network would overwhelm any system or SOC analyst. So instead, we curate this activity into a stream of events that include not only indicators of compromise (IOCs) but also context, making it easier to take action based on Cloudflare’s unique data. To start off, we expose events related to denial of service (DOS) attacks observed across our network, along with the advanced threat operations tracked by our Cloudforce One Intelligence team, like the various tools, techniques, and procedures used by the threat actors we are tracking. We mapped the events to the MITRE ATT&CK framework and to the cyber kill chain stages. In the future, we will add events related to traffic blocked by our Web Application Firewall (WAF), Zero Trust Gateway, Zero Trust Email Security Business Email Compromise, and many other Cloudflare-proprietary datasets. Together, these events will provide our customers with a detailed view of threat activity occurring across the Internet.
Each event in our threat events summarizes specific threat activity we have observed, similar to a STIX2 sighting object and provides contextual information in its summary, detailed view and via the mapping to the MITRE ATT&Ck and KillChain stages. For an example entry, please see the API documentation.
Our goal is to empower customers to better understand the threat landscape by providing key information that allows them to investigate and address both broad and specific questions about threats targeting their organization. For example:
Who is targeting my industry vertical?
Who is targeting my country?
What indicators can I use to block attacks targeting my verticals?
What has an adversary done across the kill chain over some period of time?
Each event has a unique identifier that links it to the identified threat activity, enabling our Cloudforce One threat intelligence analysts to provide additional context in follow-on investigations.
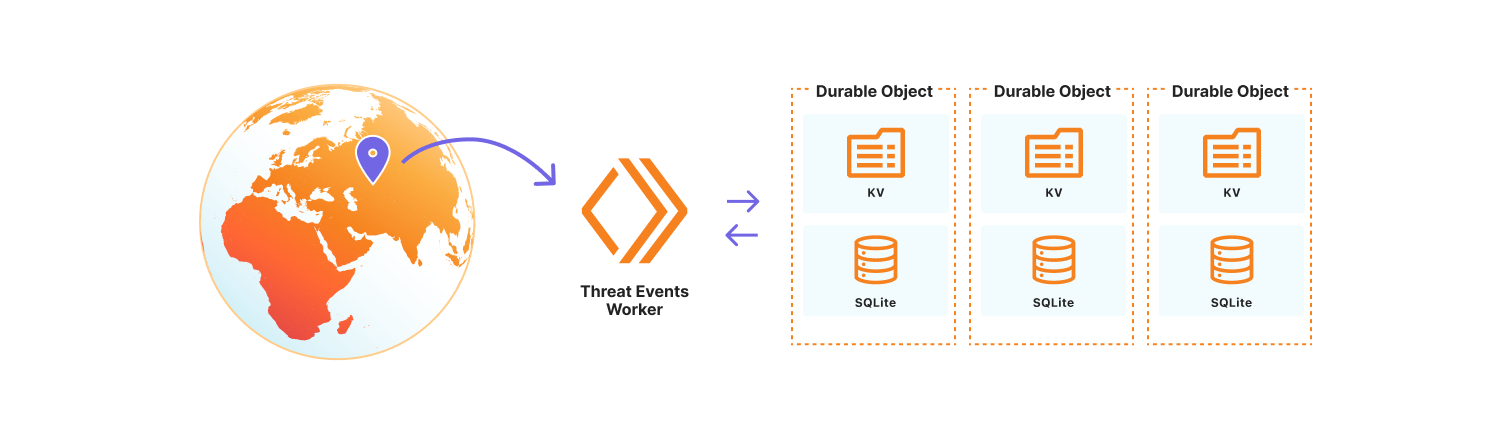
How we built the threat events platform using Cloudflare Workers
We chose to use the Cloudflare Developer Platform to build out the threat events platform, as it allowed us to leverage the versatility and seamless integration of Cloudflare Workers. At its core, the platform is a Cloudflare Worker that uses SQLite-backed Durable Objects to store events observed on the Cloudflare network. We opted to use Durable Objects over D1, Cloudflare’s serverless SQL database solution, because it permits us to dynamically create SQL tables to store uniquely customizable datasets. Storing datasets this way allows threat events to scale across our network, so we are resilient to surges in data that might correlate with the unpredictable nature of attacks on the Internet. It also permits us to control events by data source, share a subset of datasets with trusted partners, or restrict access to only authorized users. Lastly, the metadata for each individual threat event is stored in the Durable Object KV so that we may store contextual data beyond our fixed, searchable fields. This data may be in the form of requests-per-second for our denial of service events, or sourcing information so Cloudforce One analysts can tie the event to the exact threat activity for further investigation.
How to use threat events
Cloudforce One customers can access threat events through the Cloudflare Dashboard in Security Center or via the Cloudforce One threat events API. Each exposes the stream of threat activity occurring across the Internet as seen by Cloudflare, and are customizable by user-defined filters.
In the Cloudflare Dashboard, users have access to an Attacker Timelapse view, designed to answer strategic questions, as well as a more granular events table for drilling down into attack details. This approach ensures that users have the most relevant information at their fingertips.
Events Table
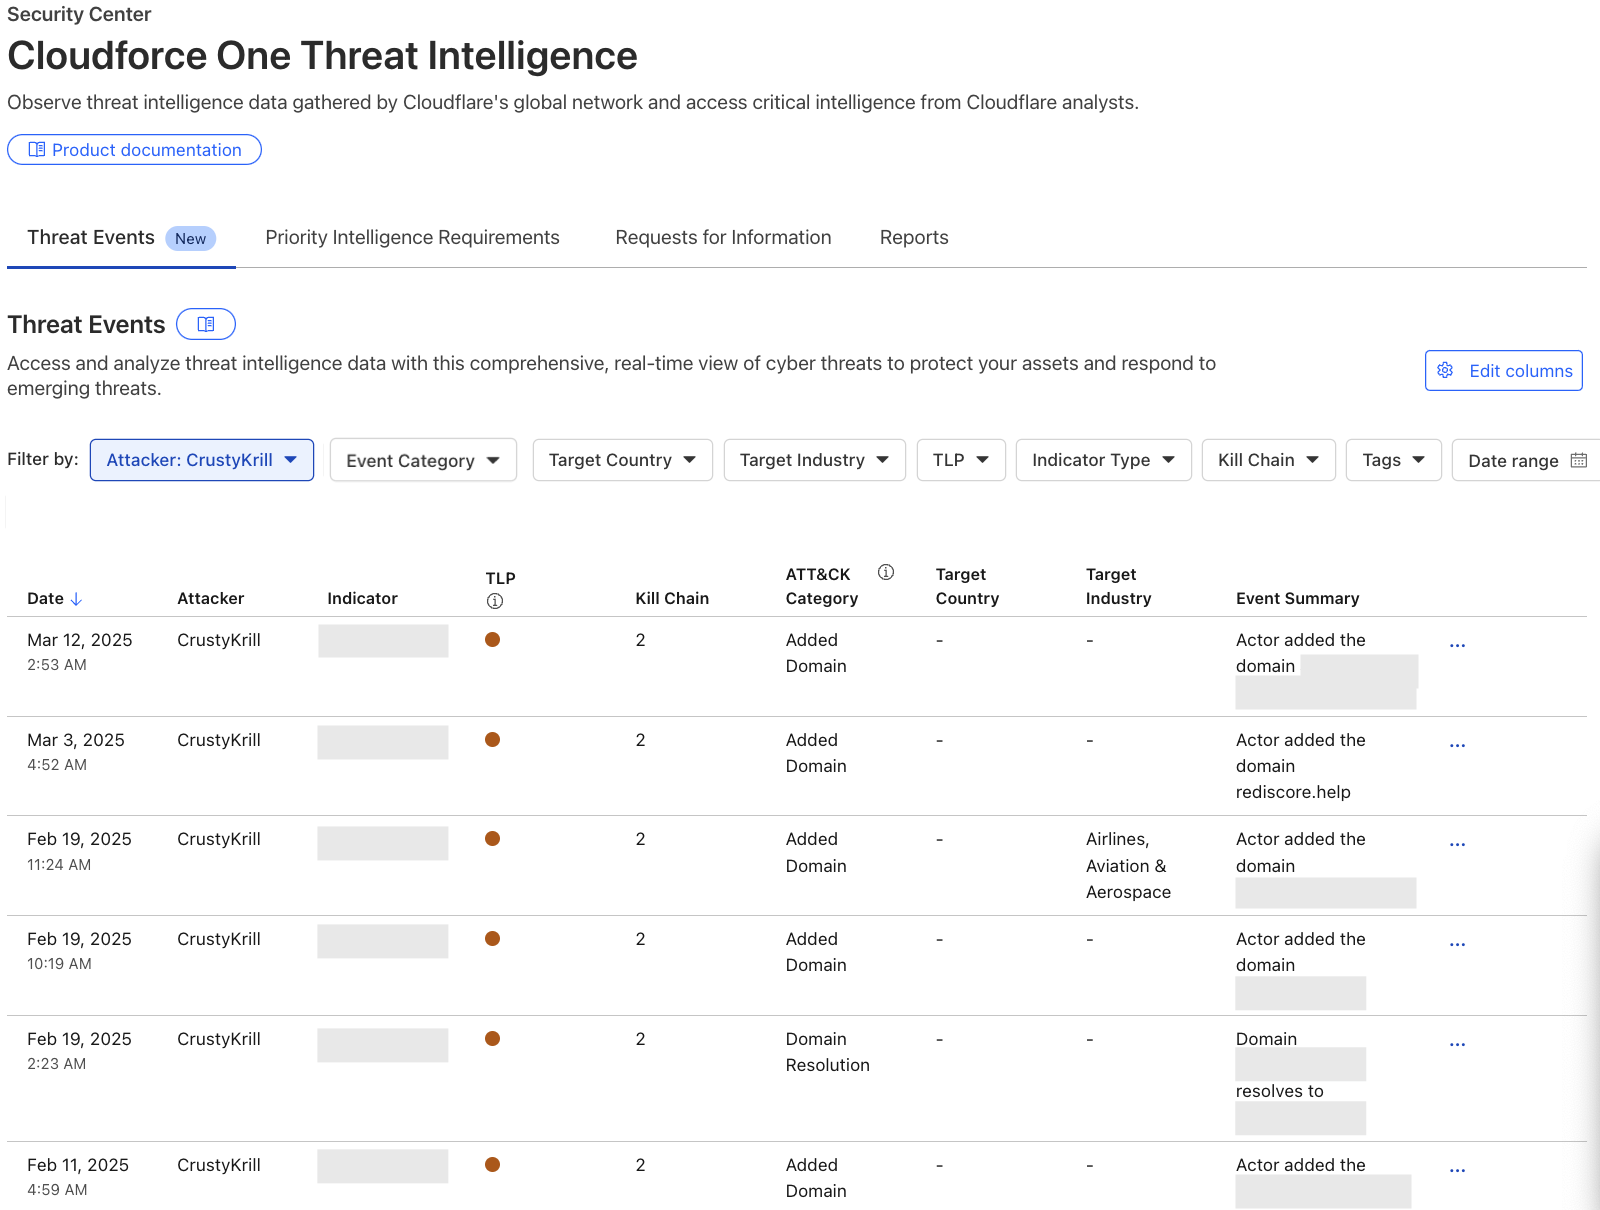
The events table is a detailed view in the Security Center where users can drill down into specific threat activity filtered by various criteria. It is here that users can explore specific threat events and adversary campaigns using Cloudflare’s traffic insights. Most importantly, this table will provide our users with actionable Indicators of Compromise and an event summary so that they can properly defend their services. All of the data available in our events table is equally accessible via the Cloudforce One threat events API.
To showcase the power of threat events, let’s explore a real-world case:
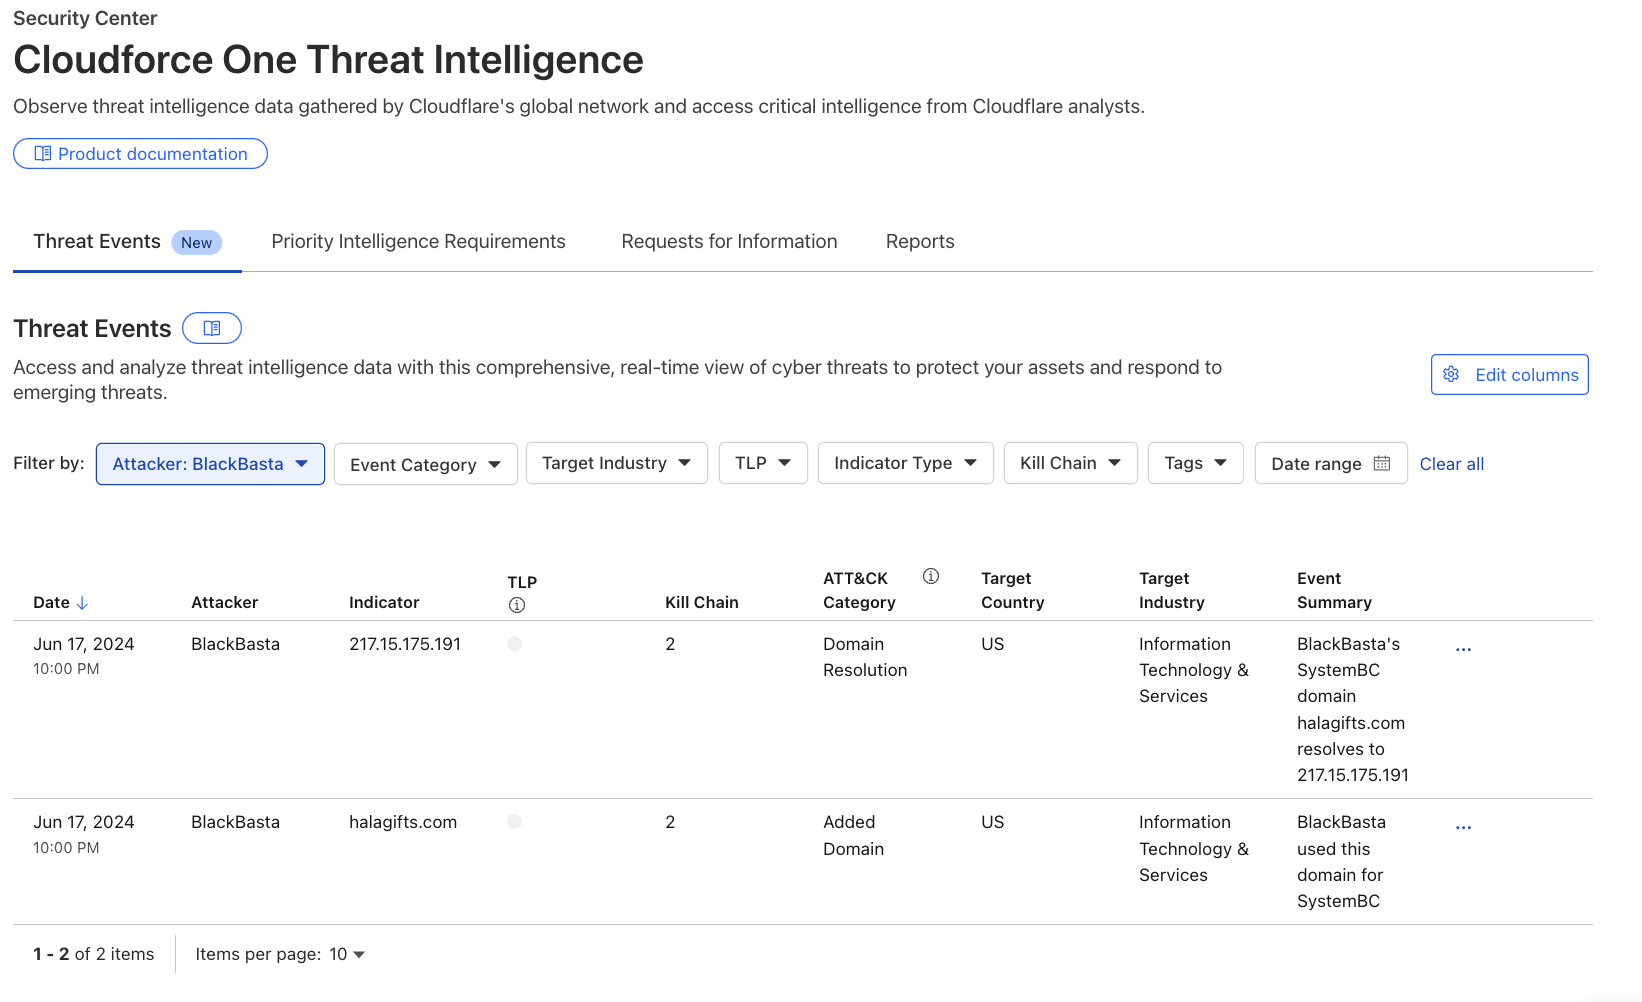
Recently leaked chats of the Black Basta criminal enterprise exposed details about their victims, methods, and infrastructure purchases. Although we can’t confirm whether the leaked chats were manipulated in any way, the infrastructure discussed in the chats was simple to verify. As a result, this threat intelligence is now available as events in the threat events, along with additional unique Cloudflare context.
Analysts searching for domains, hosts, and file samples used by Black Basta can leverage the threat events to gain valuable insight into this threat actor’s operations. For example, in the threat events UI, a user can filter the “Attacker” column by selecting ‘BlackBasta’ in the dropdown, as shown in the image below. This provides a curated list of verified IP addresses, domains, and file hashes for further investigation. For more detailed information on Cloudflare’s unique visibility into Black Basta threat activity see Black Basta’s blunder: exploiting the gang’s leaked chats.
Why we are publishing threat events
Our customers face a myriad of cyber threats that can disrupt operations and compromise sensitive data. As adversaries become increasingly sophisticated, the need for timely and relevant threat intelligence has never been more critical. This is why we are introducing threat events, which provides deeper insights into these threats.
The threat events platform aims to fill this gap by offering a more detailed and contextualized view of ongoing threat activity. This feature allows analysts to self-serve and explore incidents through customizable filters, enabling them to identify patterns and respond effectively. By providing access to real-time threat data, we empower organizations to make informed decisions about their security strategies.
To validate the value of our threat events platform, we had a Fortune 20 threat intelligence team put it to the test. They conducted an analysis against 110 other sources, and we ranked as their #1 threat intelligence source. They found us “very much a unicorn” in the threat intelligence space. It’s early days, but the initial feedback confirms that our intelligence is not only unique but also delivering exceptional value to defenders.
What’s next
While Cloudforce One customers now have access to our API and dashboard, allowing for seamless integration of threat intelligence into their existing systems, they will also soon have access to more visualisations and analytics for the threat events in order to better understand and report back on their findings. This upcoming UI will include enhanced visualizations of attacker timelines, campaign overviews, and attack graphs, providing even deeper insights into the threats facing your organization. Moreover, we’ll add the ability to integrate with existing SIEM platforms and share indicators across systems.
Read more about the threat intelligence research our team publishes here or reach out to your account team about how to leverage our new threat events to enhance your cybersecurity posture.
Abstract: In human factor fields such as human-computer interaction (HCI) and psychology, researchers have been concerned that participants mostly come from WEIRD (Western, Educated, Industrialized, Rich, and Democratic) countries. This WEIRD skew may hinder understanding of diverse populations and their cultural differences. The usable privacy and security (UPS) field has inherited many research methodologies from research on human factor fields. We conducted a literature review to understand the extent to which participant samples in UPS papers were from WEIRD countries and the characteristics of the methodologies and research topics in each user study recruiting Western or non-Western participants. We found that the skew toward WEIRD countries in UPS is greater than that in HCI. Geographic and linguistic barriers in the study methods and recruitment methods may cause researchers to conduct user studies locally. In addition, many papers did not report participant demographics, which could hinder the replication of the reported studies, leading to low reproducibility. To improve geographic diversity, we provide the suggestions including facilitate replication studies, address geographic and linguistic issues of study/recruitment methods, and facilitate research on the topics for non-WEIRD populations.
The moral may be that human factors and usability needs to be localized.
As we touched on in our first blog post highlighting ten years of Let’s Encrypt: Just as remarkable to us as the technical innovations behind proliferating TLS at scale is, so too is the sustained generosity we have benefited from throughout our first decade.
With that sense of gratitude top of mind, we are proud to announce a contribution of $1,000,000 from Jeff Atwood. Jeff has been a longtime supporter of our work, beginning many years ago with Discourse providing our community forum pro bono; something Discourse still provides to this day. As best we can tell, our forum has helped hundreds of thousands of people get up and running with Let’s Encrypt—an impact that has helped billions of people use an Internet that’s more secure and privacy-respecting thanks to widely adopted TLS.
When we first spoke with Jeff about the road ahead for Let’s Encrypt back in 2023, we knew a few things wouldn’t change no matter how the Internet changes over the next decade:
Free TLS is the only way to ensure it is and remains accessible to as many people as possible.
Let’s Encrypt is here to provide a reliable, trusted, and sound service no matter the scale.
Generosity from our global community of supporters will be how we sustain our work.
We’re proud that Jeff not only agrees, but has chosen to support us in such a meaningful way. In discussing how Jeff might want us to best celebrate his generosity and recognize his commitment to our work, he shared:
Let’s Encrypt is a golden example of how creating inalienable good is possible with the right approach and the right values. And while I’m excited about the work Let’s Encrypt has done, I am eager to see their work continue to keep up with the growing Web; to sustain encryption for everybody at Internet scale. To do so is going to take more than me—it’s going to take a community of people committed to this work. I am confident Let’s Encrypt is a project that deserves all of our support, in ways both large and small.
Indeed, this contribution is significant because of its scale, but more importantly because of its signal: a signal that supporting the not-so-glamorous but oh-so-nerdy work of encryption at scale matters to the lives of billions of people every day; a signal that supporting free privacy and security afforded by TLS for all of the Internet’s five billion users just makes sense.
Ten years ago we set out to build a better Internet through easy to use TLS. If you or your organization have supported us throughout the years, thank you for joining Jeff in believing in the work of Let’s Encrypt. For a deeper dive into the impact of Let’s Encrypt and ISRG’s other projects, take a look at our most recent annual report.
Let’s Encrypt is a project of the nonprofit Internet Security Research Group, a 501(c)(3) nonprofit committed to protecting Internet users by lowering monetary, technological, and informational barriers to a more secure and privacy-respecting Internet. For more, visit abetterinternet.org. Press inquiries can be sent to [email protected]
The long-awaited GIMP
3.0 release is now available. Major changes in 3.0 include non‑destructive
editing for most commonly‑used filters, improved text creation,
better color space management, and an update to GTK 3.
This is the end result of seven years of hard work by volunteer
developers, designers, artists, and community members (for reference,
GIMP 2.10 was first published in 2018 and the initial development
version of GIMP 3.0 was released
in 2020).
See the release
notes and NEWS
file for more details about this release. LWN covered a near-final
release of GIMP 3.0 in November last year.
Developers face numerous challenges when building telephony applications: managing unpredictable user responses, handling disconnections, processing incorrect inputs, and addressing errors. These challenges extend development cycles and create unstable applications that fail to meet user expectations.
This blog demonstrates how Amazon Web Services (AWS) Step Functions, combined with Amazon Chime SDK Public Switched Telephone Network (PSTN) audio service, offers a solution to overcome these challenges.
Overview of the solution
To demonstrate our solution, we built a sample telephony application that lets business owners manage customer calls through a dedicated business phone number. This solution helps small business owners separate personal and business communications, while managing all calls from their existing phone.
The beta version of this sample application delivers these six core call flows:
During business hours: Routes incoming customer calls to the business owner
After hours: Enables customers to leave voice messages
Message retrieval: Allows owner to access customer voice messages
Business caller ID: Enables owner to call customers using the business number
Call scheduling: Permits owner to schedule customer calls for later in the day
Automated calling: Initiates scheduled calls between owner and customer automatically
Using Workflow Studio, we built a Step Functions workflow (Figure 1) that processes all six call flows and handles unexpected scenarios.
Figure 1 – Step Functions telephony workflow designed in Workflow Studio
How it works
AWS Step Functions enable agile visual workflow design, through pre-built components and error handling rules. This creates workflows composed of event-driven states that input, process, and output JavaScript Object Notation (JSON)-formatted messages. The PSTN audio service streamlines telephony applications through its serverless approach using a request/response programming model. It invokes AWS Lambda functions with Events and waits for Actions responses, both in predefined JSON formats. This shared JSON format enables seamless integration between the PSTN audio service and Step Functions, leading us to design a serverless architecture (Figure 2) that allows for bidirectional JSON message exchange between the two services.
Figure 2 – Serverless architecture for Step Functions and PSTN audio service integration
Main components:
eventRouter: Lambda function managing JSON message exchange
Update the eventRouter Lambda function’s “CallFlowsDIDMap” environment variable to map phone numbers to their workflow Amazon Resource Name (ARN)
Set workflow variables in the “Init” state Variables tab (Figure 3). The eventRouter function automatically sets “QueueUrl”, and adding other variables here removes the need for external storage
Figure 3 – Step Functions “Init” state Variables tab showing workflow data configuration
Configure Choice state rules to route calls based on conditions. Rules one through three (Figure 4) handle call routing based on inbound/outbound direction, owner/customer identification, while the default rule manages unexpected scenarios.
Figure 4 – Step Functions Choice state defines rules for call routing decisions
Configure the SQS: SendMessage state (Figure 5) to instruct the next action to the PSTN audio service by:
Formatting the message content to match supported actions for the PSTN audio service
Setting TransactionAttributes to pass back and forth the values of the “WaitToken” and “QueueUrl” throughout the call duration
Enabling the Wait for Callback with a Task Token integration pattern
Figure 5 – SQS: SendMessage state configuration for PSTN audio service callback integration
Example: Use a DynamoDB PutItem state (Figure 6) to store Amazon Simple Storage Service (Amazon S3) recording files, including bucket name and key, in Amazon DynamoDB.
Figure 6 – AWS service integration states enable direct service connections without custom code
Utilize JSONata expressions (Figure 7) to minimize the number of Lambda functions.
Example: For Amazon EventBridge scheduling, compute time expressions using JSONata functions [$fromMillis(), $millis(), number()] and string concatenation to handle customer call scheduling.
Figure 7 – JSONata expressions for direct data transformation without Lambda functions
Use Step Functions error handling with success and fail states (Figure 8) to manage error paths and call termination results.
Figure 8 – Call error handling and termination setup
Key benefits
This approach for building telephony applications offers multiple advantages:
Visual workflow-based designer
Self-document call flow logic
Managed versioning and publishing
Native integration with AWS Services
Visual log and inspection for each call
Auto-scalable
Pay-per-use pricing
Deploying the solution
The following steps allows you to deploy the sample telephony application together with the serverless architecture (Figure 2).
AWS Command Line Interface (AWS CLI) installed and configured
Walkthrough:
The Cloud Development Kit (CDK) project on the AWS GitHub repository will deploy the following resources:
phoneNumberBusiness – Provisioned phone number for the sample application
sipMediaApp – SIP media application that routes calls to lambdaProcessPSTNAudioServiceCalls
sipRule – SIP rule that directs calls from phoneNumberBusiness to sipMediaApp.
stepfunctionBusinessProxyWorkflow – Step Functions workflow for the sample application
roleStepfuntionBusinessProxyWorkflow – IAM Role for stepfunctionBusinessProxyWorkflow
lambdaProcessPSTNAudioServiceCalls – Lambda function for call processing
roleLambdaProcessPSTNAudioServiceCalls – IAM Role for lambdaProcessPSTNAudioServiceCalls
dynamoDBTableBusinessVoicemails – DynamoDB table to store customer voicemails
s3BucketApp –S3 bucket for storing system recordings and customer voicemails
s3BucketPolicy – IAM Policy granting PSTN audio service access to s3BucketApp
lambdaOutboundCall – Lambda function for placing scheduled customer calls
roleLambdaOutboundCall – IAM Role for lambdaOutboundCall
roleEventBridgeLambdaCall – IAM Role to allow the EventBridge service to execute lambdaOutboundCall
Follow these steps to deploy the CDK stack:
Clone the repository
git clone https://github.com/aws-samples/amazon-chime-sdk-visual-media-applications

cd amazon-chime-sdk-visual-media-applications

npm install
Bootstrap the stack
#default AWS CLI credentials are used, otherwise use the –-profile parameter
#provide the <account-id> and <region> to deploy this stack
cdk bootstrap aws://<account-id>/<region>
Deploy the stack
#default AWS CLI credentials are used, otherwise use the –-profile parameter
#personalNumber: the personal phone number of the business owner in E.164 format
#businessAreaCode: the United States area code used to provision the business number
cdk deploy –-context personalNumber=+1NPAXXXXXXX –-context businessAreaCode=NPA
Call the provisioned phone number to test the sample application. Optionally, edit the workflow to update the business name and working hours on the “Init” Task state, in the Variables tab.
Cleaning up:
To clean up this demo, execute:
cdk destroy
Conclusion
This blog demonstrates how combining AWS Step Functions and Amazon Chime SDK PSTN audio service streamlines the development of reliable telephony applications through visual workflow design and managed error handling. We provided a sample application, implementing six core business phone features, showcasing how the solution effectively manages multiple conditional paths and edge cases like disconnections and invalid inputs.
The serverless architecture created enables seamless integration between the two services through JSON-based communication, while providing automatic scaling and pay-per-use pricing. Together, these components create a robust foundation for building sophisticated telephony applications that reduce maintenance costs and enhance reliability.
Contact an AWS Representative to know how we can help accelerate your business.
Thanks for participating in the OSI community polls which are now
closed. Your name was proposed by community members as a candidate for the
OSI board of directors. Functioning of the board of directors is critically
dependent on all the directors committing to collaborative
practices.
For your name to be considered by the board as we compute and review the
outcomes of the polls,you must sign the board agreement
before Wednesday March 19, 2025 at 1700 UTC
(check times in your
timezone).
You’ll receive another email with the link to the agreement.
TIME SENSITIVE AND IMPORTANT: this is a hard deadline.
Please return the signed agreement asap, don’t wait.
Thanks
OSI Elections team
(The link email did arrived too, with a link to a proprietary service called
DocuSign. Fontana downloaded the PDF out of
DocuSign and
it appears to match the document found here. This document includes a
clause that Fontana and I explicitly indicated in
our OSI
Reform Platform should be rewritten. )
All the (non-incumbent) candidates are surprised by this. OSI told us
during the mandatory orientation meetings (on WED 2025-02-19 & again on
TUE 2025-02-25) that the Board Agreement needed to be signed only by the
election winners who were seated as Directors. No one mentioned (before or
after the election) that all candidates, regardless of whether they won or
lost, needed to sign the agreement. I’ve also served o many other 501(c)(3)
Boards, and I’ve never before been asked to sign anything official for
service until I was formally offered the seat.
Can someone more familiar with the OSI election process explain this? Specifically, why
are all candidates (even those who lose) required to sign the Board Agreement before
election results are published? Can folks who ran before confirm for us that this seems to vary
from procedures in past years?
Please reply on the fediverse thread if you have
information. Richard Fontana also reached out to OSI on their
discussion board on the same matter.
Thanks for participating in the OSI community polls which are now
closed. Your name was proposed by community members as a candidate for the
OSI board of directors. Functioning of the board of directors is critically
dependent on all the directors committing to collaborative
practices.
For your name to be considered by the board as we compute and review the
outcomes of the polls,you must sign the board agreement
before Wednesday March 19, 2025 at 1700 UTC
(check times in your
timezone).
You’ll receive another email with the link to the agreement.
TIME SENSITIVE AND IMPORTANT: this is a hard deadline.
Please return the signed agreement asap, don’t wait.
Thanks
OSI Elections team
(The link email did arrived too, with a link to a proprietary service called
DocuSign. Fontana downloaded the PDF out of
DocuSign and
it appears to match the document found here. This document includes a
clause that Fontana and I explicitly indicated in
our OSI
Reform Platform should be rewritten. )
All the (non-incumbent) candidates are now confused. OSI told us during
the mandatory orientation meetings (on WED 2025-02-19 & again on TUE
2025-02-25) that the Board Agreement needed to be signed only by the election
winners who were seated as Directors. No one mentioned (before or after the
election) that all candidates, regardless of whether they won or lost, needed
to sign the agreement. I’ve also served o many other 501(c)(3) Boards, and
I’ve never before been asked to sign anything official for service until I
was formally offered the seat.
Can someone more familiar with the OSI election process explain this? Specifically, why
are all candidates (even those who lose) required to sign the Board Agreement before
election results are published? Can folks who ran before confirm for us that this seems to vary
from procedures in past years?
Please reply on the fediverse thread if you have
information. Richard Fontana also reached out to OSI on their
discussion board on the same matter.
Version
12.00 of the SystemRescue live Linux
system has been released. SystemRescue is an Arch Linux based
bootable toolkit for repairing systems in the event of a
crash. Notable changes in this release include an update to Linux
6.12.19, support for bcachefs, and a number of updated disk
utilities. See the package
list for a complete list of software included in this release.
AWS Key Management Service (AWS KMS) is pleased to launch key-level filtering for AWS KMS API usage in Amazon CloudWatch metrics, providing enhanced visibility to help customers improve their operational efficiency and aid in security and compliance risk management.
AWS KMS currently publishes account-level AWS KMS API usage metrics to Amazon CloudWatch, enabling you to monitor and manage your API usage. However, if you’re using numerous KMS keys, pinpointing the ones with the highest request rate quota usage or significant API costs becomes challenging. For example, if you have more than 10 active KMS keys in your account, prior to this launch you would have needed to build a custom CloudTrail and Amazon Athena based solution to locate which specific keys are driving the majority of API usage and costs. With the new CloudWatch metrics, which are available under the AWS/KMS namespace in CloudWatch, you can track, understand, and set alerts on detailed API usage at the individual KMS key level without building a costly customized solution.
This blog post explores several use cases to help you better take advantage of these newly introduced CloudWatch metrics to manage your AWS KMS API usage and costs. The use cases cover viewing and understanding your API usage at the key level, and creating CloudWatch alerts to detect unintentional runaway usage.
Overview of new CloudWatch metrics for KMS keys
With CloudWatch metrics for KMS keys, you can now do the following:
View the API usage for a specific KMS key, filtered by individual API operations (for example, Encrypt, Decrypt, or GenerateDataKey).
See the aggregated usage across cryptographic operations for a given KMS key.
Set up an alarm if a specific KMS key exceeds a specified threshold on a single API operation, or a set of API operations.
This streamlined approach allows you to quickly monitor, understand, and troubleshoot the API usage patterns of your KMS keys, without the overhead of the previous multi-step process. Let’s detail how these key-level API usage metrics can be used in two real-world examples.
Example 1: How to locate the KMS keys that consume the most API usage quota or contribute the most API charges
When you surpass your AWS KMS API request rate quotas, you can view your AWS KMS API utilization within the Service Quotas console. However, you might still find it cumbersome to identify the KMS keys that consume the largest amount of your request quota. When you receive the AWS KMS API charges that exceed your expectation, you can check the detailed billing usage in each AWS Region in Cost Explorer, but you cannot easily locate the KMS keys with the most API charges. This process becomes even more challenging when you manage a large number of KMS keys.
With the key-level API usage CloudWatch metrics, you can use the advanced metric query option to query CloudWatch Metrics Insights data with a user-friendly dialect of SQL to locate the KMS keys that consume the largest portion of the API usage quota or contribute the most API charges.
Walkthrough
To use Amazon CloudWatch Metrics Insights to identify the top 20 KMS keys that have the most cryptographic API usage up to the last 3 hours, complete the following steps:
In the navigation pane, choose Metrics, and then choose All metrics.
Choose the Multi source query tab.
For the data source, choose CloudWatch Metrics Insights.
You can enter the following example query in Editor view:
Note: In Builder view, the metric namespace, metric name, filter by, group by, order by, and limit options are shown. In Editor view, the same options as in Builder view are shown in query format.
	SELECT SUM(SuccessfulRequest)
	FROM SCHEMA("AWS/KMS", KeyArn, Operation)
	GROUP BY KeyArn
	ORDER BY MAX () DESC
	LIMIT 20
Choose Run in the Editor view or Graph query in the Builder view.
Example 2: How to set a new detailed alarm on unintentional runaway AWS KMS API usage
Running big data processing workflows that read Amazon Simple Storage Service (Amazon S3) files encrypted by KMS keys is a common scenario for analytics, business reporting, or machine learning projects. Typically, these workflows read a limited number of files from S3 on each invocation. However, misconfigured workflows could unintentionally read a large number of S3 files, which could result in exceeding your AWS KMS API request rate quotas or incurring undesirable charges due to spiky AWS KMS API usage. Historically, to address this issue, you would have had to build a customized alarm system by following these steps: 1) send AWS CloudTrail events generated by AWS KMS to Amazon CloudWatch Logs; 2) write queries in Amazon CloudWatch Logs Insights to track your API request usage; and 3) enable anomaly detection on the corresponding CloudWatch Log Insights math expression.
Now, with key-level API usage CloudWatch metrics, you can directly enable anomaly detection on these metrics to set up alarms for anomalous AWS KMS API usage patterns. This provides a more streamlined and efficient way to monitor and detect potential runaway workflows. By using these CloudWatch metrics and anomaly detection capabilities, you can proactively identify and address unintended increases in AWS KMS API usage, helping to avoid unexpected charges or service disruptions in your analytics, reporting, or machine learning pipelines.
Walkthrough
Consider a scenario where you have an analytics workflow that runs frequently, which uses the Decrypt AWS KMS API operation on a KMS key to decrypt and read data from S3. You would like to enable anomaly detection on the KMS key to trigger an alarm when the Decrypt call volume to the specific KMS key sees a discernible trend or pattern. To do so, complete the following steps:
In the navigation pane, choose Metrics, and then choose All metrics.
Choose KMS, and then choose KeyArn, Operation.
In the search bar, enter the Amazon Resource Name (ARN) of the key, and then choose Search. Select the CloudWatch metric you would like to enable anomaly detection for.
Navigate to Graphed metrics, and using the Statistic and Period drop-down lists, choose the statistic and period that you would like to monitor. Then you can enable anomaly detection by selecting the Pulse icon.
Figure 1: How to enable anomaly detection on a SuccessfulRequest metric
Figure 2: Anomaly detection is enabled on the SuccessfulRequest metric. The gray band illustrates the expected range of values and the anomaly is in red
Conclusion
This blog post highlighted the newly introduced key-level filtering capability for the AWS KMS API usage in CloudWatch. We showed two real-world use cases to demonstrate how you can use the new CloudWatch metrics. These use cases include improving operational visibility, setting up proactive alarms on anomalies in KMS API usage patterns, and potentially tracking detailed key usage for compliance purposes.
If you have feedback about this blog post, submit comments in the Comments section below. If you have questions about this blog post, start a new thread in the AWS Key Management Service re:Post.
The collective thoughts of the interwebz
Manage Consent
To provide the best experiences, we use technologies like cookies to store and/or access device information. Consenting to these technologies will allow us to process data such as browsing behavior or unique IDs on this site. Not consenting or withdrawing consent, may adversely affect certain features and functions.
Functional
Always active
The technical storage or access is strictly necessary for the legitimate purpose of enabling the use of a specific service explicitly requested by the subscriber or user, or for the sole purpose of carrying out the transmission of a communication over an electronic communications network.
Preferences
The technical storage or access is necessary for the legitimate purpose of storing preferences that are not requested by the subscriber or user.
Statistics
The technical storage or access that is used exclusively for statistical purposes.The technical storage or access that is used exclusively for anonymous statistical purposes. Without a subpoena, voluntary compliance on the part of your Internet Service Provider, or additional records from a third party, information stored or retrieved for this purpose alone cannot usually be used to identify you.
Marketing
The technical storage or access is required to create user profiles to send advertising, or to track the user on a website or across several websites for similar marketing purposes.