The last year has been a rocky one for the WordPress community. Matt
Mullenweg—WordPress co-founder and
CEO of WordPress hosting company Automattic—started a messy public spat with WP Engine in September and
has proceeded to use his control of the project’s WordPress.org
infrastructure as weapons against the company, with the community
caught in the crossfire. It is not surprising, then, that on
June 6 a group of WordPress community participants announced the Federated
and Independent Repositories Package Manager (FAIR.pm) project. It
is designed to be a decentralized alternative to WordPress.org with a
goal of building “public digital infrastructure that is both
resilient and fair“.
Today, Amazon Web Service (AWS) introduces the Security Champion Knowledge Path on AWS Skill Builder, featuring training and a digital badge. The Security Champion Knowledge path is a comprehensive educational framework designed to empower developers and software engineers with essential AWS cloud security knowledge and best practices. The structured learning path enables development teams to accelerate their delivery while maintaining robust security standards in cloud environments, addressing customers’ need for a structured curriculum to develop and validate security expertise across their organizations.
A new era of security education
The AWS Security Champion Knowledge Path complements the existing AWS security training offerings, providing a structured, self-paced journey to security expertise. Hart Rossman, Vice President of Global Services Security at AWS, emphasizes the program’s significance: “Security in the cloud isn’t a destination; it’s an ongoing journey. The AWS Security Champion Knowledge Path equips our customers with the tools and knowledge to navigate this journey confidently, fostering a culture where security is woven into every aspect of cloud operations.”
Designed for a diverse audience including software developers, solutions architects, technical leaders, and cloud practitioners, the training plan covers a wide range of topics that are critical for a strong security posture in the cloud. This AWS security learning journey begins with essential fundamentals and progressively builds toward advanced concepts across a well-structured curriculum. Starting with AWS Security Fundamentals and the AWS Shared Responsibility Model, learners establish core principles before diving into AWS Identity and Access Management (IAM), including detailed troubleshooting scenarios. The curriculum advances to critical security elements such as encryption and comprehensive threat modeling through the AWS Builders Workshop. Security governance and auditing form the next tier, followed by practical implementations of monitoring, alerting, and network infrastructure best practices. The learning path then covers specialized areas including web-facing workload protection, network control, and incident response procedures. The knowledge path culminates with deep dives into container security and core security concepts through AWS SimuLearn, providing hands-on experience with real-world scenarios. This carefully orchestrated progression helps facilitate a thorough understanding of AWS security principles while maintaining a practical, implementation-focused approach.
What is a Security Champion?
A Security Champion is a bridge between security teams and development teams, promoting security best practices and making sure that security is embedded into every stage of the development lifecycle. However, Security Champion isn’t just a role—it’s a mindset. In today’s distributed and agile cloud environments, having Security Champions across different teams provides a competitive advantage for releasing products quickly and securely.
This distributed ownership of security brings numerous benefits: faster development cycles because teams can address security requirements proactively, reduced security incidents through early detection, and improved collaboration between security and development teams. Most importantly, it creates a culture of security where every team member understands their role in protecting the organization’s assets and data.
By becoming a Security Champion, you’ll gain valuable expertise, earn recognized credentials, and develop leadership skills that can accelerate your career growth. Most importantly, you’ll be empowered to make meaningful contributions to your organization’s security posture by promoting best practices, identifying potential vulnerabilities early in the development cycle, and fostering collaboration between teams—ultimately helping your organization deliver products that are both innovative and secure.
How can I become an AWS Security Champion?
Security enthusiasts can enroll into the AWS Security Champion Knowledge Badge Readiness Path on AWS Skill Builder and complete the assessment successfully to earn the AWS Security Champion digital badge available on Credly.
AWS Security Champion training is a self-paced, hands-on, and interactive approach to upskilling on security concepts. As a participant, you’re introduced to security best practices, performing basic audits, planning for governance at scale, incident response concepts and more. You can engage with real-world scenarios through hands-on labs, interactive game-based learning, gain access to AWS sandbox environments, and conduct practical security assessments. This applied learning helps make sure that knowledge isn’t just acquired, but truly internalized and ready for immediate application.
“The AWS Security Champion Knowledge Path represents a significant milestone in democratizing security expertise. We’ve designed this program to transform how organizations approach security training, making it accessible, practical, and immediately applicable. This isn’t just about learning security concepts—it’s about creating a culture where security becomes second nature to every team member.” – Jenni Troutman, Training and Certification Director at AWS
Recognition and community
Upon successfully completing the assessment in this training path, participants earn the prestigious AWS Security Champion knowledge badge in Credly to showcase their accomplishment, such as on LinkedIn, and join a growing community of security professionals. This recognition not only validates individual expertise but also signals an organization’s commitment to security excellence, and helps organizations identify qualified security champions within their team.
Getting started
To begin your journey to becoming an AWS Security Champion, log in or create an account with AWS Skill Builder and enroll in the Security Champion Knowledge Badge Readiness Path. The training plan is available through flexible pricing options, including individual subscriptions at $29 per month and team subscriptions at $449 per month with enterprise volume pricing available.
Rossman concludes, “The AWS Security Champion Knowledge Path represents a paradigm shift in how organizations approach security education. It’s about creating a shared language of security across teams, enabling faster, more secure development cycles, and ultimately, delivering better outcomes for our customers.”
Ready to elevate your organization’s security capabilities? Visit AWS Skill Builder to enroll and start your journey towards becoming an AWS Security Champion. For enterprise inquiries, reach out to your AWS account team.
Stay tuned to the AWS Security Blog for more updates on AWS Security services, features, and best practices. Together, we’re building a more secure cloud for all.
If you have feedback about this post, submit comments in the Comments section below.
The Python Language Summit 2025 occurred on May 14th in Pittsburgh,
Pennsylvania. Core developers and special guests from around the
world gathered in one room for an entire day of presentations and
discussions about the future of the Python programming language.
Topics covered include making breaking changes less painful, free-threaded
Python, interaction with Rust, and challenges faced by the Steering
Council.
Version
10.0 of the Rocky Linux distribution has been released. As with
the AlmaLinux 10.0
release, Rocky Linux 10.0 is based on Red Hat Enterprise Linux (RHEL)
10. See the
release notes for details.
Validating input payloads is an important aspect of building secure and reliable applications. This ensures that data that an application receives can gracefully handle unexpected or malicious inputs and prevent harmful downstream processing. When writing AWS Lambda functions, developers need to validate and verify the payload and ensure that specific fields and values are correct and safe to process.
Powertools for AWS Lambda is a developer toolkit available in Python, NodeJS/TypeScript, Java and .NET. It helps implement serverless best practices and increase developer velocity. Powertools for AWS Lambda (TypeScript) is introducing a new Parser utility to help developers more easily implement validation in their Lambda functions.
Why payload validation matters
Validating payloads can make your Lambda functions more resilient. Payloads that combine both technical and business information can also be challenging to validate. This requires writing validation logic inside your Lambda function code.This could range from a few if-statements to check payload values to a complex series of validation steps based on custom business logic. You may need to separate the validation of the technical information of payload like AWS Region, accountId, event source and business information inside the event such as productId and payment details.
It can be challenging to know the structure and the values of the event object and how to extract the relevant information. For example, an Amazon SQS event has a body field with a string value, which can be a JSON document. Amazon EventBridge has an object in the detail field that you can read directly without further transformation. You may need to decompress, decode, transform, and validate the payload inside a specific field. Understanding the many transformation layers can be complex, especially if your event object is a result of multiple service invocations.
Using the Powertools for AWS Lambda (TypeScript) Parser Utility
Powertools for AWS Lambda (TypeScript) is a modular library. You can selectively install features such as Logger, Tracer, Metrics, Batch Processing, Idempotency, and more. You can use Powertools for AWS Lambda in both TypeScript and JavaScript code bases. The new Parser utility simplifies validation and uses the popular validation library, Zod.
You can use parser as method decorator, with middyjs middleware or manually in all Lambda provided NodeJS runtimes
To use the utility, install the Powertools parser utility and Zod (<v3.x) using NPM or any package manager of your choice:
npm install @aws-lambda-powertools/parser zod@~3
You can define your schema using Zod. Here is an example of a simple order schema for validating events:
This order schema defines id, description and a list of items. You can specify the value types from simple numeric, narrow it down to positive or literal, or more complex like unition, array or even other schema. Zod offers an extensive list of value types that you can use.
Add the parser decorator to your handler function and set the schema parameter and use this schema to parse the event object.
import type {Context} from 'aws-lambda';
import type {LambdaInterface} from '@aws-lambda-powertools/commons/types';
import {parser} from '@aws-lambda-powertools/parser';
import {z} from 'zod';
import {Logger} from '@aws-lambda-powertools/logger';

const logger = new Logger();

const orderSchema = z.object({
    id: z.number().positive(),
	description: z.string(),
	items: z.array(
	    z.object({
		    id: z.number().positive(),
			quantity: z.number(),
			description: z.string(),
		})
	),
});

type Order = z.infer<typeof orderSchema>;

class Lambda implements LambdaInterface {
    @parser({schema: orderSchema})
	public async handler(event: Order, _context: Context): Promise<void> {
	    // event is now typed as Order
		for (const item of event.items) {
		    logger.info('Processing item', {item});
			// process order item from the event
		}
	}
}

const myFunction = new Lambda();

export const handler = myFunction.handler.bind(myFunction);
Note that z.infer helps to extract the Order type from the schema, which improves development experience with autocomplete when using TypeScript. Zod parses the entire object, including nested fields, and reports all the errors combined, instead of returning only the first error.
Using built-in schema for AWS services
A more common scenario is to validate events from AWS Services that trigger Lambda functions, including Amazon SQS, Amazon EventBridge and many more. To make this easier Powertools includes pre-built schema for AWS events that you can use.
To parse an incoming Amazon EventBridge event, set the built-in schema in your parser configuration:
import {LambdaInterface} from '@aws-lambda-powertools/commons/types';
import {Context} from 'aws-lambda';
import {parser} from '@aws-lambda-powertools/parser';
import {EventBridgeSchema} from '@aws-lambda-powertools/parser/schemas';
import type {EventBridgeEvent} from '@aws-lambda-powertools/parser/types';

class Lambda implements LambdaInterface {
    @parser({schema: EventBridgeSchema})
	public async handler(event: EventBridgeEvent, _context: Context): Promise<void> {
	    // event is parsed but the detail field is not specified
	}
}

const myFunction = new Lambda();

export const handler = myFunction.handler.bind(myFunction);
The event object is parsed and validated during runtime and the TypeScript type EventBridgeEvent helps you understand the structure and access the fields during development. In this example, you only parse the EventBridge event object, so the detail field can be an arbitrary object.
You can also extend the built-in EventBridge schema and override the detail field with your custom oderSchema.
import {LambdaInterface} from '@aws-lambda-powertools/commons/types';
import {Context} from 'aws-lambda';
import {parser} from '@aws-lambda-powertools/parser';
import {EventBridgeSchema} from '@aws-lambda-powertools/parser/schemas';
import {z} from 'zod';

const orderSchema = z.object({
    id: z.number().positive(),
	description: z.string(),
	items: z.array(
	    z.object({
		    id: z.number().positive(),
			quantity: z.number(),
			description: z.string(),
		}),
	),
});

const eventBridgeOrderSchema = EventBridgeSchema.extend({  detail: orderSchema,});

type EventBridgeOrder = z.infer<typeof eventBridgeOrderSchema>;

class Lambda implements LambdaInterface {
    @parser({schema: eventBridgeOrderSchema})  public async handler(event: EventBridgeOrder, _context: Context): Promise<void> {
	    // event.detail is now parsed as orderSchema
	}
}

const myFunction = new Lambda();

export const handler = myFunction.handler.bind(myFunction);
The parser validates the full structure of the entire EventBridge event including the custom business object. Use .extend or other Zod schema functions to change any field of the built-in schema and customize the payload validation.
Using envelopes with custom schema
In some cases, you only need the custom portion of the payload, for example, the detail field of the EventBridge event or the body of SQS records. This requires you to parse the event schema manually, extract the required field, and then parse it again with the custom schema. This is complex as you must know the exact payload field and how to transform and parse it.
Powertools Parser utility helps solve this problem with Envelopes. Envelopes are schema objects with built-in logic to extract custom payloads.
Here is an example of the EventBridgeEnvelope of how it works:
import {LambdaInterface} from '@aws-lambda-powertools/commons/types';
import {Context} from 'aws-lambda';
import {parser} from '@aws-lambda-powertools/parser';
import {EventBridgeEnvelope} from '@aws-lambda-powertools/parser/envelopes';
import {z} from 'zod';

const orderSchema = z.object({
    id: z.number().positive(),
	description: z.string(),
	items: z.array(
	    z.object({
		    id: z.number().positive(),
			quantity: z.number(),
			description: z.string(),
		}),
	),
});

type Order = z.infer<typeof orderSchema>;

class Lambda implements LambdaInterface {
    @parser({schema: orderSchema, envelope: EventBridgeEnvelope})  public async handler(event: Order, _context: Context): Promise<void> {
        // event is now typed as Order inferred from the orderSchema
    }
}

const myFunction = new Lambda();

export const handler = myFunction.handler.bind(myFunction);
By setting schema and envelope, the parser utility knows how to combine both parameters, extract, and validate the custom payload from the event. Powertools Parser transforms the event object according to the schema definition so you can focus on your business-critical part of the code inside the handler function.
Safe parsing
If the object does not match the provided Zod schema, by default, the parser throws ParserError. If you require control over validation errors and need to implement custom error handling, use the safeParse option.
Here is an example how to capture failed validations as a metric in your handler function:
import {Logger} from "@aws-lambda-powertools/logger";
import {LambdaInterface} from "@aws-lambda-powertools/commons/types";
import {parser} from "@aws-lambda-powertools/parser";
import {orderSchema} from "../app/schema";import {z} from "zod";
import {EventBridgeEnvelope} from "@aws-lambda-powertools/parser/envelopes";
import {Metrics, MetricUnit} from "@aws-lambda-powertools/metrics";
import {ParsedResult, EventBridgeEvent} from "@aws-lambda-powertools/parser/types";

const logger = new Logger();

const metrics = new Metrics();

type Order = z.infer<typeof orderSchema>;

class Lambda implements LambdaInterface {

    @metrics.logMetrics()
	@parser({schema: orderSchema, envelope: EventBridgeEnvelope, safeParse: true})
	public async handler(event: ParsedResult<EventBridgeEvent, Order>, _context: unknown): Promise<void> {
	    if (!event.success) {
		    // failed validation
			metrics.addMetric('InvalidPayload', MetricUnit.Count, 1);
			logger.error('Invalid payload', event.originalEvent);
		} else {
		    // successful validation
			for (const item of event.data.items) {
			    logger.info('Processing item', item);
				// event.data is typed as Order
			}
		}
	}
}

const myFunction = new Lambda();

export const handler = myFunction.handler.bind(myFunction);
Setting safeParse option to true does not throw an error, but returns a modified event object that has a success flag and either error or data fields, depending on the validation result. You can then create custom error handling, for example incrementing InvalidPayload metric and access the originalEvent to log an error.
For successful validations, you can access the data field and process the payload. Note that the event object type is now ParsedResult with the EventBridgeEvent as input and Order as output types.
Custom validations
Sometimes you may require more complex business rules for your validation. Because Parser built-in schemas are Zod objects, you can customize the validation by applying .extend, .refine , .transform and other Zod operators. Here is an example of complex rules for the orderSchema:
import {z} from 'zod';

const orderSchema = z.object({
    id: z.number().positive(),
	description: z.string(),
	items: z.array(z.object({
	    id: z.number().positive(),
		quantity: z.number(),
		description: z.string(),
	})).refine((items) => items.length > 0, {
	    message: 'Order must have at least one item',
	}),
})
    .refine((order) => order.id > 100 && order.items.length > 100, {
	    message:      'All orders with more than 100 items must have an id greater than 100',
	});
Use .refine on items field to check if there is at least one item in the order. You can also combine multiple fields, here order.id and order.items.length, to have a specific rule for orders with more than 100 items. Keep in mind that .refine runs during the validation step and .transform will be applied after the validation. This allows you to change the shape of the data to normalize the output.
Conclusion
Powertools for AWS Lambda (TypeScript) is introducing a new Parser utility that makes it easier to add validation to your Lambda functions. By relying on the popular validation library Zod, Powertools offers an extensive set of built-in schemas for popular AWS service integrations including Amazon SQS, Amazon DynamoDB, Amazon EventBridge. Developers can use these schemas to validate their event payloads and also customize them according to their business needs.
A data broker owned by the country’s major airlines, including Delta, American Airlines, and United, collected U.S. travellers’ domestic flight records, sold access to them to Customs and Border Protection (CBP), and then as part of the contract told CBP to not reveal where the data came from, according to internal CBP documents obtained by 404 Media. The data includes passenger names, their full flight itineraries, and financial details.
Мъжете умират първи. С тази си формулировка се беше загнездило в ума ми още като дете житейското знание, че мъжете имат по-малка средна продължителност на живота от жените. Някак знаех, дори не помнех кога са ми разказали за първи път, че единият ми дядо е получил първия си инфаркт още на 37 години. Имах приятели, на които им бяха останали само баби, но не помня да съм имала такива само с дядовци. С порастването закономерно изпратих първо собствените си дядовци и дойде ред на мъжете (уж в разцвета на силите си) на приятелки и познати жени. Макар модерната медицина в развитите държави да успява да намали разликите, те все още не са заличени никъде по света.
Заравяйки се в опитите на науката да обясни този феномен, човек преформулира представите си за „силен“ пол.
Смъртността при мъжете е по-висока, отколкото при жените, но жените се представят по-зле по отношение на физическа сила, увреждания и други здравни резултати. Учените наричат това „Парадокс на здравето и оцеляването при мъжете и жените“. Парадоксът вероятно се дължи на множество причини, които включват биологични, поведенчески и социални различия между половете. Въпреки десетилетията изследвания все още не може да се каже с точност каква е тежестта на тези фактори за половите различия в здравето и смъртността.
Status quo
Според данните, публикувани в рамките на проекта Our World in Data, през 2021 г. средната продължителност на живота в световен мащаб е била 73,8 години за жените и 68,4 години за мъжете, което представлява разлика от 5,4 години в полза на жените. Тази разлика обаче варира значително между различните държави. Например в Русия, Беларус и Украйна жените живеят с повече от 10 години по-дълго от мъжете, докато в Нигерия разликата е под 2 години. Драстичните разминавания са ясен знак, че не става дума само за биология. И все пак
„Винаги имаме едно наум“
… когато се ражда момче, сподели веднъж един анестезиолог.
През 2018 г. малък екип антрополози от Дания и Германия търси исторически доказателства за биологичните корени на женското дълголетие. В статията, публикувана в Proceedings of the National Academy of Sciences, групата описва своето проучване, което включва анализ на данни за оцеляване от няколко периода в историята, когато групи от хора са били подложени на изключителен натиск. Изследователите се фокусирали върху период на търговия с роби в Тринидад; друг, през който роби, освободени в Америка, са се опитвали да оцелеят; епидемия от морбили в Исландия; и глад в Украйна, Швеция и Ирландия. Във всички тези случаи с изключение на Тринидад, съобщават изследователите, жените са живели по-дълго от мъжете. Тринидад е изключение вероятно защото търговците на роби са ценели мъжете повече и са полагали по-големи усилия, за да ги поддържат живи.
Особено забележителни са данните за глада. Например в периода, познат като Ирландския картофен глад или Големия глад от средата на XIX в., мъжете са имали средна очаквана продължителност на живота само около 18 години, докато за жените тя е била около 22. Изследователите отбелязват също, че разликите в очакваната продължителност на живота се дължали най-вече на детската смъртност. Данните от други периоди на гладуване на големи популации са приблизително сходни, което според изследователите е косвено доказателство, че разликите в продължителността на живота имат биологични корени. Съмнително е, отбелязват те, че поведенческите разлики при кърмачетата биха могли да повлияят на смъртността, оставяйки биологичния източник като единствената разумна възможност.
Скорошно проучване, публикувано в престижното списание The Lancet, потвърждава, че половите различия в смъртността могат да разкрият важни биологични, генетични и социокултурни фактори, допринасящи за здравето и заболяванията и на двата пола. При децата под 5 години смъртността е по-висока при момчетата. При тях има по-голяма вероятност да се родят преждевременно, а тежестта на вродените малформации и респираторните заболявания е по-голяма. Например смъртността при кърмачета, засегнати от някои респираторни заболявания, в развитите държави е с близо 50% повече при момчетата, отколкото при момичетата.
Някои от най-цитираните изследвания в сферата обясняват по-високата смъртност при бебетата момчета с биологичната им уязвимост още от ембрионалния етап. Мъжките ембриони се развиват по-бързо, но и по-рисково – те са по-податливи на усложнения при имплантация, хормонални дисбаланси и кислороден стрес. Освен това липсата на втора Х-хромозома (с каквато разполагат бебетата момичета) означава, че нямат „резервен“ генетичен механизъм в случай на увредени гени, което ги прави по-уязвими на вродени аномалии и имунни дефицити. Изследвания показват също, че момчетата са по-застрашени от белодробна незрялост при преждевременно раждане, по-често са недоносени и страдат от тежки форми на неонатален дистрес. В комбинация с повишената чувствителност към инфекции, тази генетично и физиологично предопределена „крехкост“ обяснява защо и сега в много държави още от първите дни на живота смъртността при момчетата е по-висока, отколкото при момичетата.
В държавите с развита медицина и равнопоставен достъп до грижи за момичетата и момчетата обаче
значимостта на биологичния фактор намалява
Доказателства по темата събира същият екип антрополози, изследвал устойчивостта на мъжете и жените при кризи. Авторите анализират подробни демографски данни и установяват, че причините за по-голямата продължителност на живота при жените се променят с времето. До средата на XX в. основният фактор за разликата е свързан с по-високата смъртност на новородени момчета. След това обаче и особено след 1950 г. ключова роля започват да играят разликите в смъртността сред хората на възраст над 60 години. Изследователите отбелязват, че макар в активна възраст – между 15 и 40 години – смъртността при мъжете в някои държави да надвишава тази при жените в пъти, все пак това влияе върху общата средна продължителност на живота с под 25%, на места дори с под 10%. Авторите подчертават, че именно смъртността сред възрастните хора над 60 години е основният двигател на сегашната разлика в продължителността на живота между половете.
Точно в активна възраст обаче се проявяват
разликите в начина на живот, които предопределят по-дългия живот на жените
В този период мъжете много по-често (2 до 4 пъти) загиват при инциденти (катастрофи, насилие) или самоубийства и формират начин на живот, предразполагащ към развитие на хронични заболявания в по-късен етап. Множество изследвания, проведени през последните две десетилетия в различни държави, потвърждават, че жените от своя страна по-често търсят медицинска помощ за състояния, засягащи и двата пола, което влияе значително върху продължителността на живота им. Нещо повече, оказва се, че жените са по-склонни да следват предписаното им лечение (когато то е финансово достъпно за тях).
За показателно може да се приеме изследване на склонността към използване на превантивни здравни услуги, публикувано през 2012 г. в американското списание Journal of Women’s Health. То установява, че жените в САЩ по-често ходят на профилактични прегледи, дори когато се вземат предвид фактори като възраст, доход, здравно осигуряване и самооценка на здравето. Анализът се позовава и на данни от ежегодното допитване относно здравето, проведено през 2009 г., в което 12% от жените и над два пъти повече – 25%, от мъжете, споделят, че не са посещавали лекар през последните 12 месеца. В анализа са включени измерване на кръвното налягане, изследване на холестерола, стоматологичен преглед, противогрипна ваксинация и колоноскопия. Жените по-често се възползват от всички прегледи с изключение на колоноскопията, където разликата не е статистически значима. Например около 92% от жените срещу 82% от мъжете измерват кръвното си налягане; 42% от жените посещават зъболекар срещу 38% от мъжете; противогрипна ваксина си слагат над 41% от жените спрямо под 35% от мъжете и т.н. Авторите посочват, че жените по-често влизат в контакт със здравната система поради гинекологични грижи, бременност и майчинство, както и поради по-високата честота на хронични заболявания и по-голямата загриженост за здравето на семейството.
Не на последно място учените отбелязват склонността на жените да се свързват, да създават общности, да търсят и дават подкрепа като фактори, които могат да влияят положително върху продължителността на живота им. През цялото това време ключов физиологичен фактор за женската устойчивост и податливост към по-жизнеутвърждаващо поведение е
естрогенът
Според редица изследвания естрогенът играе съществена роля за по-голямата средна продължителност на живота при жените, като осигурява широка физиологична защита в няколко ключови системи на организма. Установено е например, че той има кардиопротективен ефект – повишава нивата на „добрия“ HDL холестерол, понижава „лошия“ LDL, подпомага разширението на кръвоносните съдове и потиска възпалителни процеси, с което намалява риска от сърдечносъдови заболявания преди менопаузата. Освен това естрогенът активира антиоксидантни гени и спомага за поддържането на клетъчната регенерация, като така ограничава уврежданията от свободни радикали – процес, свързан с общото стареене на организма.
Хормонът има и имуномодулиращ ефект – стимулира балансирана имунна реакция, която намалява възпаленията и подобрява устойчивостта на организма на хронични заболявания. Тези ефекти влияят върху повишената устойчивост в репродуктивна възраст на множество заболявания при мнозинството жени, при които женските хормони естроген и прогестерон са в норма и поддържат необходимия баланс. В същото време обаче и обуславят защо нарушаването на този баланс може да има сериозни последици за здравето – ефектите на естрогена са контекстно зависими: в някои случаи той има противовъзпалително действие (например в черния дроб), а в други има стимулативен ефект (примерно при автоимунни заболявания) и води до повишен риск от заболявания на развитието, психични болести и други, включително рак. Загубата на естроген с възрастта пък е съществен фактор за здравни рискове в процеса на стареене при жените.
Жените в България (и техните мъже)
Голяма част от процесите, описани дотук, се отнасят за всички жени по света, макар че балансът между биологични, социални и поведенчески фактори е различен при всяка жена. Според последния отчет на НСИ очакваната средна продължителност на предстоящия живот общо за населението на страната е 75,6 години, като спрямо предходния период (2021–2023 г.) се увеличава с 2,1 години. Средната продължителност на живота при мъжете е 71,9 години, докато при жените е със 7,4 години по-висока – 79,3. Според НСИ тази разлика е значително по-голяма от европейските тенденции и говори за системни социални и поведенчески различия, които не се преодоляват дори когато общите условия за живот се подобряват. Разбивката с данни за Умирания по причини, по пол и възраст показва, че след навършване на 10 г. момчетата, а впоследствие мъжете в активна възраст (до 65 г.), умират до 6,5 пъти по-често от злополуки, катастрофи, насилие или други външни фактори.
„Анатомия на пола: Жена“ разглежда здравето на жените като неразривна част от обществото, историята и културата. В поредицата изследваме как са се променяли нагласите към женското здраве, как медицината е възприемала специфичните потребности на жените и какви процеси са повлияли на достъпа им до качествени здравни грижи. Вглеждаме се в научните открития, но и в културните митове; в официалните политики, но и в личните истории на жени, борещи се за правото си на здраве и достойнство.
Amazon OpenSearch Service recently introduced a new Transport Layer Security (TLS) policy Policy-Min-TLS-1-2-PFS-2023-10, which supports the latest TLS 1.3 protocol and TLS 1.2 with Perfect Forward Secrecy (PFS) cipher suites. This new policy improves security and enhances OpenSearch performance.
OpenSearch Service previously offered predefined TLS policies for domain endpoint security, making it possible to encrypt your traffic end-to-end by enforcing HTTPS. However, these policies were limited to older versions of TLS, such as TLS 1.0 and TLS 1.2, without any PFS offerings.
In this post, we discuss the benefits of this new policy and how to enable it using the AWS Command Line Interface (AWS CLI).
Solution overview
The new TLS security policy provides an upgraded security posture for OpenSearch Service domains by implementing TLS 1.3 and PFS. This makes it possible to enhance the confidentiality and integrity of traffic between clients and your OpenSearch Service domains, providing a more secure and efficient communication channel for your sensitive data. TLS 1.3 is the latest version of the Transport Layer Security protocol, designed to prevent certain attacks targeting legacy TLS ciphers and provide improvements like 0-RTT resumption for faster connection times. TLS 1.3 can establish secure connections faster than TLS 1.2, resulting in reduced latency for your applications. PFS is an important security enhancement that makes sure past communications remain secure, even if the server’s long-term secret key is compromised in the future. By using a unique, randomly generated session key for each connection, PFS adds an extra layer of protection against potential eavesdropping or decryption of encrypted data. Compared to the older TLS 1.2 policy Policy-Min-TLS-1-2-2019-07, TLS 1.2 with PFS offers stronger security by protecting against potential key compromises, while still maintaining compatibility with older clients that don’t support TLS 1.3.
Prerequisites
To start using this new policy, you need the following prerequisites:
To create new domains with the new TLS policy enabled, add --domain-endpoint-options '{"TLSSecurityPolicy": "Policy-Min-TLS-1-2-PFS-2023-10"}' to the create-domain AWS CLI command:
Most modern clients and libraries should support TLS 1.3 and TLS 1.2 with PFS out of the box. However, if you encounter issues or compatibility concerns, you might need to update your client libraries or configurations to enable support for the new TLS policy.
Conclusion
The new Policy-Min-TLS-1-2-PFS-2023-10 security policy for OpenSearch Service offers significant improvements in security and performance. By supporting TLS 1.3 and TLS 1.2 with PFS, this policy helps protect your data in transit and provides faster connection times. We recommend that you start using this new TLS security policy for improved security posture and performance when connecting to your OpenSearch Service domains. To get started, follow the steps outlined in this post to enable the new policy on your existing or new domains.
At Amazon, security is our top priority, and we are continuously working to enhance the security and performance of our services. Stay tuned for more exciting updates!
About the authors
Shubham Kumar is a Software Development Engineer at Amazon OpenSearch Service, specializing in the security domain. He is passionate about developing robust security features to enhance the protection of customer data and infrastructure.
Sachet Alva is a Software Development Manager at Amazon OpenSearch Service, overseeing the infrastructure security and custom package initiatives. His team’s innovations contribute to the enhanced security and flexibility of Amazon OpenSearch Service deployments.
Naveen Negi is a Senior Tech Product Manager for Amazon OpenSearch Service. He works closely with engineering teams and customers to shape the future of OpenSearch Service, making sure it meets evolving security and performance needs.
As Netflix’s offerings grow — across films, series, games, live events, and ads — so does the complexity of the systems that support it. Core business concepts like ‘actor’ or ‘movie’ are modeled in many places: in our Enterprise GraphQL Gateway powering internal apps, in our asset management platform storing media assets, in our media computing platform that powers encoding pipelines, to name a few. Each system models these concepts differently and in isolation, with little coordination or shared understanding. While they often operate on the same concepts, these systems remain largely unaware of that fact, and of each other.
As a result, several challenges emerge:
Duplicated and Inconsistent Models — Teams re-model the same business entities in different systems, leading to conflicting definitions that are hard to reconcile.
Inconsistent Terminology — Even within a single system, teams may use different terms for the same concept, or the same term for different concepts, making collaboration harder.
Data Quality Issues — Discrepancies and broken references are hard to detect across our many microservices. While identifiers and foreign keys exist, they are inconsistently modeled and poorly documented, requiring manual work from domain experts to find and fix any data issues.
Limited Connectivity — Within systems, relationships between data are constrained by what each system supports. Across systems, they are effectively non-existent.
To address these challenges, we need new foundations that allow us to define a model once, at the conceptual level, and reuse those definitions everywhere. But it isn’t enough to just document concepts; we need to connect them to real systems and data. And more than just connect, we have to project those definitions outward, generating schemas and enforcing consistency across systems. The conceptual model must become part of the control plane.
These were the core ideas that led us to build UDA.
Introducing UDA
UDA (Unified Data Architecture) is the foundation for connected data in Content Engineering. It enables teams to model domains once and represent them consistently across systems — powering automation, discoverability, and semantic interoperability.
Using UDA, users and systems can:
Register and connect domain models — formal conceptualizations of federated business domains expressed as data.
Why? So everyone uses the same official definitions for business concepts, which avoids confusion and stops different teams from rebuilding similar models in conflicting ways.
Catalog and map domain models to data containers, such as GraphQL type resolvers served by a Domain Graph Service, Data Mesh sources, or Iceberg tables, through their representation as a graph.
Why? To make it easy to find where the actual data for these business concepts lives (e.g., in which specific database, table, or service) and understand how it’s structured there.
Transpile domain models into schema definition languages like GraphQL, Avro, SQL, RDF, and Java, while preserving semantics.
Why? To automatically create consistent technical data structures (schemas) for various systems directly from the domain models, saving developers manual effort and reducing errors caused by out-of-sync definitions.
Move data faithfully between data containers, such as from federated GraphQL entities to Data Mesh (a general purpose data movement and processing platform for moving data between Netflix systems at scale), Change Data Capture (CDC) sources to joinable Iceberg Data Products.
Why? To save developer time by automatically handling how data is moved and correctly transformed between different systems. This means less manual work to configure data movement, ensuring data shows up consistently and accurately wherever it’s needed.
Discover and explore domain concepts via search and graph traversal.
Why? So anyone can more easily find the specific business information they’re looking for, understand how different concepts and data are related, and be confident they are accessing the correct information.
Programmatically introspect the knowledge graph using Java, GraphQL, or SPARQL.
Why? So developers can build smarter applications that leverage this connected business information, automate more complex data-dependent workflows, and help uncover new insights from the relationships in the data.
This post introduces the foundations of UDA as a knowledge graph, connecting domain models to data containers through mappings, and grounded in an in-house metamodel, or model of models, called Upper. Upper defines the language for domain modeling in UDA and enables projections that automatically generate schemas and pipelines across systems.
The same domain model can be connected to semantically equivalent data containers in the UDA knowledge graph.
This post also highlights two systems that leverage UDA in production:
Primary Data Management (PDM) is our platform for managing authoritative reference data and taxonomies. PDM turns domain models into flat or hierarchical taxonomies that drive a generated UI for business users. These taxonomy models are projected into Avro and GraphQL schemas, automatically provisioning data products in the Warehouse and GraphQL APIs in the Enterprise Gateway.
Sphere is our self-service operational reporting tool for business users. Sphere uses UDA to catalog and relate business concepts across systems, enabling discovery through familiar terms like ‘actor’ or ‘movie.’ Once concepts are selected, Sphere walks the knowledge graph and generates SQL queries to retrieve data from the warehouse, no manual joins or technical mediation required.
UDA is a Knowledge Graph
UDA needs to solve the data integration problem. We needed a data catalog unified with a schema registry, but with a hard requirement for semantic integration. Connecting business concepts to schemas and data containers in a graph-like structure, grounded in strong semantic foundations, naturally led us to consider a knowledge graph approach.
We chose RDF and SHACL as the foundation for UDA’s knowledge graph. But operationalizing them at enterprise scale surfaced several challenges:
RDF lacked a usable information model. While RDF offers a flexible graph structure, it provides little guidance on how to organize data into named graphs, manage ontology ownership, or define governance boundaries. Standard follow-your-nose mechanisms like owl:imports apply only to ontologies and don’t extend to named graphs; we needed a generalized mechanism to express and resolve dependencies between them.
SHACL is not a modeling language for enterprise data. Designed to validate native RDF, SHACL assumes globally unique URIs and a single data graph. But enterprise data is structured around local schemas and typed keys, as in GraphQL, Avro, or SQL. SHACL could not express these patterns, making it difficult to model and validate real-world data across heterogeneous systems.
Teams lacked shared authoring practices. Without strong guidelines, teams modeled their ontologies inconsistently breaking semantic interoperability. Even subtle differences in style, structure, or naming led to divergent interpretations and made transpilation harder to define consistently across schemas.
Ontology tooling lacked support for collaborative modeling. Unlike GraphQL Federation, ontology frameworks had no built-in support for modular contributions, team ownership, or safe federation. Most engineers found the tools and concepts unfamiliar, and available authoring environments lacked the structure needed for coordinated contributions.
To address these challenges, UDA adopts a named-graph-first information model. Each named graph conforms to a governing model, itself a named graph in the knowledge graph. This systematic approach ensures resolution, modularity, and enables governance across the entire graph. While a full description of UDA’s information infrastructure is beyond the scope of this post, the next sections explain how UDA bootstraps the knowledge graph with its metamodel and uses it to model data container representations and mappings.
Upper is Domain Modeling
Upper is a language for formally describing domains — business or system — and their concepts. These concepts are organized into domain models: controlled vocabularies that define classes of keyed entities, their attributes, and their relationships to other entities, which may be keyed or nested, within the same domain or across domains. Keyed concepts within a domain model can be organized in taxonomies of types, which can be as complex as the business or the data system needs them to be. Keyed concepts can also be extended from other domain models — that is, new attributes and relationships can be contributed monotonically. Finally, Upper ships with a rich set of datatypes for attribute values, which can also be customized per domain.
The graph representation of the onepiece: domain model from our UI. Depicted here you can see how Characters are related to Devil Fruit, and that each Devil Fruit has a type.
Upper domain models are data. They are expressed as conceptual RDF and organized into named graphs, making them introspectable, queryable, and versionable within the UDA knowledge graph. This graph unifies not just the domain models themselves, but also the schemas they transpile to — GraphQL, Avro, Iceberg, Java — and the mappings that connect domain concepts to concrete data containers, such as GraphQL type resolvers served by a Domain Graph Service, Data Mesh sources, or Iceberg tables, through their representations. Upper raises the level of abstraction above traditional ontology languages: it defines a strict subset of semantic technologies from the W3C tailored and generalized for domain modeling. It builds on ontology frameworks like RDFS, OWL, and SHACL so domain authors can model effectively without even needing to learn what an ontology is.
Upper is the metamodel for Connected Data in UDA — the model for all models. It is designed as a bootstrapping upper ontology, which means that Upper is self-referencing, because it models itself as a domain model; self-describing, because it defines the very concept of a domain model; and self-validating, because it conforms to its own model. This approach enables UDA to bootstrap its own infrastructure: Upper itself is projected into a generated Jena-based Java API and GraphQL schema used in GraphQL service federated into Netflix’s Enterprise GraphQL gateway. These same generated APIs are then used by the projections and the UI. Because all domain models are conservative extensions of Upper, other system domain models — including those for GraphQL, Avro, Data Mesh, and Mappings — integrate seamlessly into the same runtime, enabling consistent data semantics and interoperability across schemas.
Traversing a domain model programmatically using the Java API generated from the Upper metamodel.
Data Container Representations
Data containers are repositories of information. They contain instance data that conform to their own schema languages or type systems: federated entities from GraphQL services, Avro records from Data Mesh sources, rows from Iceberg tables, or objects from Java APIs. Each container operates within the context of a system that imposes its own structural and operational constraints.
A Data Mesh source is a data container.
Data container representations are data. They are faithful interpretations of the members of data systems as graph data. UDA captures the definition of these systems as their own domain models, the system domains. These models encode both the information architecture of the systems and the schemas of the data containers within. They provide a blueprint for translating the systems into graph representations.
UDA catalogs the data container representations into the knowledge graph. It records the coordinates and metadata of the underlying data assets, but unlike a traditional catalog, it only tracks assets that are semantically connected to domain models. This enables users and systems to connect concepts from domain models to the concrete locations where corresponding instance data can be accessed. Those connections are called Mappings.
Mappings
Mappings are data that connect domain models to data containers. Every element in a domain model is addressable, from the domain model itself down to specific attributes and relationships. Likewise, data container representations make all components addressable, from an Iceberg table to an individual column, or from a GraphQL type to a specific field. A Mapping connects nodes in a subgraph of the domain model to nodes in a subgraph of a container representation. Visually, the Mapping is the set of arcs that link those two graphs together.
A mapping between a domain model and a Data Mesh Source from the UDA UI. Link to full mapping.
Mappings enable discovery. Starting from a domain concept, users and systems can walk the knowledge graph to find where that concept is materialized — in which data system, in which container, and even how a specific attribute or relationship is physically accessed. The inverse is also supported: given a data container, one can trace back to the domain concepts it participates in.
Mappings shape UDA’s approach to semantic data integration. Most existing schema languages are not expressive enough in capturing richer semantics of a domain to address requirements for data integration (for example, “accessibility of data, providing semantic context to support its interpretation, and establishing meaningful links between data”). A trivial example of this could be seen in the lack of built-in facilities in Avro to represent foreign keys, making it very hard to express how entities relate across Data Mesh sources. Mappings, together with the corresponding system domain models, allow for such relationships, and many other constraints, to be defined in the domain models and used programmatically in actual data systems.
Mappings enable intent-based automation. Data is not always available in the systems where consumers need it. Because Mappings encode both meaning and location, UDA can reason about how data should move, preserving semantics, without requiring the consumer to specify how it should be done. Beyond the cataloging use case, connecting to existing containers, UDA automatically derives canonical Mappings from registered domain models as part of the projection process.
Projections
A projection produces a concrete data container. These containers, such as a GraphQL schema or a Data Mesh source, implement the characteristics derived from a registered domain model. Each projection is a concrete realization of Upper’s denotational semantics, ensuring semantic interoperability across all containers projected from the same domain model.
Projections produce consistent public contracts across systems. The data containers generated by projections encode data contracts in the form of schemas, derived by transpiling a domain model into the target container’s schema language. UDA currently supports transpilation to GraphQL and Avro schemas.
The GraphQL transpilation produces a schema that adheres to the official GraphQL spec with the ability to generate all GraphQL types defined in the spec. Given that the UDA domain model can be federated, it also supports generating federated graphQL schemas. Below is an example of a transpiled GraphQL schema.
The Avro transpilation produces a schema that is a Data Mesh flavor of Avro, which includes some customization on top of the official Avro spec. This schema is used to automatically create a Data Mesh source container. Below is an example of a transpiled Avro schema.
Projections can automatically populate data containers. Some projections, such as those to GraphQL schemas or Data Mesh sources produce empty containers that require developers to populate the data. This might be creating GraphQL APIs or pushing events onto Data Mesh sources. Conversely, other containers, like Iceberg Tables, are automatically created and populated by UDA. For Iceberg Tables, UDA leverages the Data Mesh platform to automatically create data streams to move data into tables. This process utilizes much of the same infrastructure detailed in this blog post here.
Projections have mappings. UDA automatically generates and manages mappings between the newly created data containers and the projected domain model.
Early Adopters
Controlled Vocabularies (PDM)
The full range of Netflix’s business activities relies on a sprawling data model that captures the details of our many business processes. Teams need to be able to coordinate operational activities to ensure that content production is complete, advertising campaigns are in place, and promotional assets are ready to deploy. We implicitly depend upon a singular definition of shared concepts, such as content production is complete. Multiple definitions create coordination challenges. Software (and humans) don’t know that the definitions mean the same thing.
We started the Primary Data Management (PDM) initiative to create unified and consistent definitions for the core concepts in our data model. These definitions form controlled vocabularies, standardized and governed lists for what values are permitted within certain fields in our data model.
Primary Data Management (PDM) is a single place where business users can manage controlled vocabularies. Our data model governance has been scattered across different tools and teams creating coordination challenges. This is an information management problem relating to the definition, maintenance and consistent use of reference data and taxonomies. This problem is not unique to Netflix, so we looked outward for existing solutions to this problem.
Managing the taxonomy of One Piece characters in PDM.
PDM uses the Simple Knowledge Organization System (SKOS)model. It is a W3C data standard designed for modeling knowledge. Its terminology is abstract, with Concepts that can be organized into ConceptSchemes and properties to describe various types of relationships. Every system is hardcoded against something, that’s how software knows how to manipulate data. We want a system that can work with a data model as its input, so we still need something concrete to build the software against. This is what SKOS provides, a generic basis for modeling knowledge that our system can understand.
PDM uses Domain Models to integrate SKOS into the rest of Content Engineering’s ecosystem. A core premise of the system is that it takes a domain model as input, and everything that can be derived is derived from that model. PDM builds a user interface based upon the model definition and leverages UDA to project this model into type-safe interfaces for other systems to use. The system will provision a Domain Graph Service (DGS) within our federated GraphQL API environment using a GraphQL schema that UDA projects from the domain model. UDA is also used to provision data movement pipelines which are able to feed our GraphSearch infrastructure as well as move data into the warehouse. The data movement systems use Avro schemas, and UDA creates a projection from the domain model to Avro.
Consumers of controlled vocabularies never know they’re using SKOS. Domain models use terms that fit in with the domain. SKOS’s generic notion of broader and narrower to define a hierarchy are hidden from consumers as super-properties within the model. This allows consumers to work with language that is familiar to them while enabling PDM to work with any model. The best of both worlds.
Operational Reporting (Sphere)
Operational reporting serves the detailed day-to-day activities and processes of a business domain. It is a reporting paradigm specialized in covering high-resolution, low-latency data sets.
Operational reporting systems should generate reports without relying on technical intermediaries. Operational reporting systems need to address the persistent challenge of empowering business users to explore and obtain the data they need, when they need it. Without such self-service systems, requests for new reports or data extracts often result in back-and-forth exchanges, where the initial query may not exactly meet business users’ expectations, requiring further clarification and refinement.
Data discovery and query generation are two relevant aspects of data integration. Supplying end-users with an accurate, contextual, and user-friendly data discovery experience provides a basis for query generation mechanism which produces syntactically correct and semantically reliable queries.
Operational reports are predominantly run on data hydrated from GraphQL services into the Data Warehouse. You can read about our journey from conventional data movement to streaming data pipelines based on CDC and GraphQL hydration in this blog post. Among the challenging byproducts of this approach was that a single, distinct data concept is now present in two places (GraphQL and data warehouse), with some disparity in semantic context to guide and support the interpretations and connectivity of that data. To address this, we formulate a mechanism to use the syntax and semantics captured in the federated schema from Netflix’s Enterprise GraphQL and populate representational domain models in UDA to preserve those details and add more.
Domain models enable the data discovery experience. Metadata aggregated from various data-producing systems is captured in UDA domain models using a unified vocabulary. This metadata is surfaced for the users’ search and discovery needs; instead of specifying exact tables and join keys, users simply can search for familiar business concepts such as ‘actors’ or ‘movies’. We use UDA models to disambiguate and resolve the intended concepts and their related data entities.
UDA knowledge graph is the data landscape for query generation. Once concepts are discovered and their mappings to corresponding data containers are identified and located in the knowledge graph, we use them to establish join strategies. Through graph traversal, we identify boundaries and islands within the data landscape. This ensures only feasible, joinable combinations are selected while weeding out semantically incorrect and non-executable query candidates.
Generating a report in Sphere.
Sphere is a UDA-powered self-service operational reporting system. The solution based on knowledge graphs described above is called Sphere. Seeing self-service operational reporting through this lens, we can improve business users’ agency in access to operational data. They are empowered to explore, assemble, and refine reports at the conceptual level, while technical complexities are managed by the system.
Stay Tuned
UDA marks a fundamental shift in how we approach data modeling within Content Engineering. By providing a unified knowledge graph composed of what we know about our various data systems and the business concepts within them, we’ve made information more consistent, connected, and discoverable across our organization. We’re excited about future applications of these ideas such as:
Supporting additional projections like Protobuf/gRPC
Materializing the knowledge graph of instance data for querying, profiling, and management
Finally solving some of the initial challenges posed by Graph Search (that actually inspired some of this work)
If you’re interested in this space, we’d love to connect — whether you’re exploring new roles down the road or just want to swap ideas.
Expect to see future blog posts exploring PDM and Sphere in more detail soon!
Writeback for filesystems is the process of flushing the “dirty” (written)
data in the page cache to storage. At
the 2025 Linux Storage,
Filesystem, Memory Management, and BPF Summit (LSFMM+BPF), Anuj Gupta led a
combined storage and filesystem session on some work that has been done
to parallelize the writeback process. Some of the performance problems
that have been seen with the existing single-threaded writeback came up in
a session at last year’s summit, where the
idea of doing writeback in parallel was discussed.
Global Payments Inc. is a leading worldwide provider of payment technology and software solutions, headquartered in Atlanta, Georgia. The company processes more than 75 billion transactions annually, serving more than 5 million merchant locations and nearly 2,000 financial institutions globally. Through its merger with TSYS in 2019, Global Payments expanded its capabilities beyond merchant acquiring services to include issuer processing solutions.
The company’s services now encompass ecommerce and omnichannel payments, business management software, customer engagement tools, and cloud-based solutions. Their commitment to technological innovation and customer service has positioned them as one of the largest financial technology companies globally, consistently ranking among the Fortune 500.
This post demonstrates how the Issuer Solutions business of Global Payments, as a service provider, implemented cross-Region failover for an AWS PrivateLink backed service exposed to their customers. Their solution enables failover to a secondary Region without customer coordination, reducing Recovery Time Objective (RTO).
AWS PrivateLink involves two key roles: service providers and service consumers. Service providers build, own, and manage endpoint services. Service consumers create and manage Amazon Virtual Private Cloud (Amazon VPC) endpoints that connect their VPC to an Amazon VPC endpoint service privately, without exposing the traffic to the public internet. Enterprises often build services in multiple AWS Regions for resilience. This approach requires endpoint services in two Regions, with service consumers creating VPC endpoints for each service.
Issuer Solutions had the following requirements for this implementation:
The ability for consumers to access the service privately, without traversing the public internet
Resilience to degradation in a single Region by allowing failover to a secondary Region
Independent failover without customer coordination
Reliable and simple failover process
Solution overview
The following simplified architecture diagram illustrates the connectivity and failover mechanisms. The exact service implementation of Issuer Solutions is beyond this post’s scope. For simplicity, we represent the service as a Network Load Balancer backed by Amazon Elastic Compute Cloud (Amazon EC2) instances.
The solution consists of the following key components:
The service provider deploys identical services in two Regions. The service is represented in this simplified version with a Network Load Balancer backed by EC2 instances. Each Region is independent and therefore resilient against failures in the other Region.
Services are exposed through PrivateLink as VPC endpoint services in each Region, allowing client connections without needing NAT gateways or internet gateways and keeping the traffic within the customers’ own private IP space.
The service provider authorizes the consumer AWS account to find the services using the VPC endpoint service names.
The service consumer uses the VPC PrivateLink endpoint service names to create VPC endpoints with Elastic Network Interfaces (ENIs) in two Availability Zones in each Region. The consumer does this in both consumer Regions, and each consumer Region has two sets of VPC endpoints: one for the primary service of the provider and one for the secondary service.
The service consumer creates a Route 53 private hosted zone in each of the two Regions they use, each with two alias records, with a simple routing policy, pointing to the VPC endpoints’ FQDNs in their own Regions. These two alias records are primary.example.com and secondary.example.com.
The service provider creates a Route 53 ARC cluster with routing controls for the primary and secondary Regions.
The service provider creates a private hosted zone with a failover record set for a consumer specific CNAME like custC.service.p.com that resolves to primary.example.com and secondary.example.com. These records are associated with health checks that are associated with Route 53 ARC routing controls.
As shown in the architecture diagram, it is not necessary for the provider’s and consumer’s Regions to be the same because AWS supports creating VPC endpoints in a Region different to that of the VPC endpoint service itself. Refer to AWS PrivateLink now supports cross-region connectivity for more details.
How the DNS resolution works
Each consumer Region has two Route 53 private hosted zones involved in DNS resolution in this approach: the service provider’s hosted zone and the service consumer’s hosted zone. Both hosted zones are associated with the VPC used by the service consumer. Here is how the DNS resolution works:
When a client in the consumer VPC wants to reach the service, it uses the FQDN custC.service.p.com.
The hosted zone in the service provider’s account resolves custC.service.p.com to either primary.example.com or secondary.example.com depending on the status of the health checks controlled by ARC. For now, let’s assume this resolves to primary.example.com.
Next, primary.example.com resolves to the VPC endpoint FQDN com.amazonaws.vpce.<primary-region>.vpce-svcabc123 due to the hosted zone in the service consumer.
At the time of failover, the service provider will update the ARC health checks to turn off the primary control and turn on the secondary routing control. This causes the service provider’s hosted zone to resolve custC.service.p.com to secondary.example.com, which in turn resolves to the VPC endpoint FQDN in the secondary Region due to the service consumer’s hosted zone.
Considerations
With this setup, the service provider can fail over when they need to without the service consumer having to manually make any changes. This is especially useful for services that have multiple service consumers. Additionally, service consumers can make changes to the VPC endpoint as they see fit. They only need to update the hosted zone they manage to make sure that primary.example.com and secondary.example.com point to the correct VPC endpoints.
We used ARC in this post because it offers a robust solution for cross-Region failover with built-in static stability. ARC also avoids single points of failure in the failover logic by distributing it across multiple Regions.
This setup demonstrates an active-passive configuration where traffic is routed to a single Region at a time using the Route 53 failover routing policy. For an active-active approach, you can adapt this setup by employing alternative Route 53 policies such as weighted or latency-based routing, as detailed in Active-active and active-passive failover.
Code sample
We have created a GitHub repository with Terraform code to demonstrate this solution. The repository has the steps to set it up and test it.
Conclusion
This implementation of cross-Region failover by Global Payments Issuer Solutions for their PrivateLink backed service demonstrates a robust and flexible approach to providing high availability and resilience. By using AWS services such as PrivateLink, Route 53, and Route 53 ARC, they have created a solution that meets their key requirements. This architecture not only benefits Global Payments by allowing them to manage failovers efficiently, but also provides advantages to their service consumers. Customers maintain control over their own infrastructure while benefiting from seamless service continuity. As cloud architectures continue to evolve, solutions like this showcase the power of combining various AWS services to create highly available and fault-tolerant systems that meet complex business needs.
Clone our GitHub repository now and deploy this solution in your own AWS environment to try out this approach to cross-Region failover. Contact your AWS representative today to begin your journey toward enhanced business continuity.
This post is written by Goeksel Sarikaya, Senior Delivery Consultant at AWS, and Milosz Stawarski, Senior Software Architect at Stellantis.
Software licensing is a critical aspect of many organizations’ operations, with various models available to suit different needs. Two common types are named user licenses, which are assigned to specific individuals, and floating licenses, which can be shared among a pool of users. Some independent software vendors (ISVs) offer both options, whereas others might have limitations, particularly in cloud environments.
In this post, we explore a unique scenario where an ISV, unable to provide a floating license option for cloud usage, worked with Stellantis to develop an alternative solution. This approach, implemented with the ISV’s permission, treats named user licenses as if they were floating, automatically assigning and removing them based on the state of user workbench instances.
This solution is not intended to circumvent licensing terms or reduce costs at the expense of ISVs. Rather, it’s a collaborative approach to address specific customer needs when traditional floating licenses aren’t available. We will demonstrate how the solution uses serverless AWS services like Amazon EventBridge, AWS Lambda, Amazon DynamoDB, and AWS Systems Manager, keeping in mind that any similar implementation should only be pursued with explicit permission from the software vendor.
Overview of Stellantis
Stellantis N.V., born from the merger of FCA and PSA Group, leads the change towards software defined vehicles (SDV). As part of this transformation, AWS and Stellantis created the Virtual Engineering Workbench (VEW), a modular framework to develop, integrate, and test vehicle software in the cloud, ultimately connecting their vehicles to the cloud.
The VEW provides predefined environments tailored to specific use cases. These environments come fully equipped with the tools, integrated development environments (IDEs), and licensing necessary for developers to jumpstart their projects.
As the number of developers and projects grew, Stellantis faced a challenge in managing the limited number of named user licenses for their software tools. The manual process of assigning and revoking licenses became increasingly time-consuming and inefficient, potentially hindering the agility and productivity of their development teams.
Stellantis and AWS tackled this challenge head-on by collaborating on an innovative, dynamic license management solution using AWS serverless services. This solution transforms the traditional named user license model into a more flexible floating license system, automatically assigning and revoking licenses based on the state of user workbench instances. The licenses and solution discussed in this post pertain solely to the use of standalone software tools such as those used in automotive domains. These do not involve sharing of user data or content when licenses are reused.
Before we dive into the detailed workflow of the solution, let’s examine the high-level architecture. The following diagram illustrates how various AWS services work together to create this efficient license management system.
Architecture
This architecture uses key AWS services such as EventBridge, Lambda, DynamoDB, and Systems Manager to create a scalable, serverless solution that significantly reduces administrative overhead and optimizes license utilization.
In the following sections, we explore each component of this architecture in detail, explaining how they interact to provide a seamless license management experience for Stellantis’ VEW.
In workbench accounts (user accounts)
The design is serverless and based on an event-driven approach. The workflow in the user accounts is as follows:
Workbench instances are Amazon Elastic Compute Cloud (Amazon EC2). Their start and stop automatically sends AWS events.
An EventBridge rule invokes a Lambda function when such an event occurs. This function checks the tags on the EC2 instance to distinguish workbenches from other EC2 instances. Two tags are important for identifying workbench instances: vew:workbench:ownerId and vew:workbench:type.
The Lambda function creates a custom event with the following data: user-id, workbench-type, workbench-state, and instance-id, and sends this event to the default event bus.
An EventBridge rule forwards the custom event to a custom event bus in the license server account.
In license server account
The following steps take place in the license server account:
An EventBridge rule invokes a Lambda
This function interacts with a DynamoDB table that stores a mapping of licensed products to users. The function does the following:
Deduces the licensed products present in the workbench from the workbench type.
For each licensed product, it verifies if the combination of product and user is already present in the DynamoDB
If the workbench is starting:
If the combination is already present, it increases the count of workbenches in the table for this item by 1.
If the combination is not present, it creates a new item in the table (product, user-id, workbench-count, timestamp).
If the workbench is stopping, it decreases the count of workbenches in the table for this item by 1. If the count becomes 0, the item is deleted.
Any update to the DynamoDB table triggers another Lambda
If the change in the table is a creation of a new entry or deletion of an entry, this function writes the current timestamp to a Systems Manager parameter in both cases. This is so that if no changes are detected in the database, we don’t unnecessarily run the xLC (License Client for related product) caller function.
Another Lambda function is invoked every minute. It compares the timestamp written in the Systems Manager parameter indicating a DynamoDB item creation or deletion with the last time the function called the xLC CLI to assign users to a license.
If the DynamoDB timestamp is earlier, the function stops. If the DynamoDB timestamp is later, the function queries the table for obtaining the user-id for each product.
To maintain a comprehensive record of license assignment operations, you can enable data plane events for DynamoDB in AWS CloudTrail.
For each licensed product, the function uses Run Command, a capability of Systems Manager, to invoke the xLC CLI API on the license server to assign named users to a license for a product. The function provides the list of users assigned to the product to the API. This updates the named user list on the license server—the list is completely overwritten, which includes adding new user IDs and removing ones that are no longer needed.
Benefits and key features
The solution offers the following benefits:
Automated license assignment and removal – Users are automatically assigned licenses when their workbench instances start, and licenses are returned to the pool when instances stop, providing efficient license utilization.
Scalable and serverless architecture – The solution is built on serverless AWS services, allowing it to scale seamlessly as the number of users and workbench instances grows, without the need for provisioning or managing servers.
Centralized license management – The license server account acts as a central hub for managing licenses across multiple workbench accounts, simplifying administration and providing a unified view of license usage.
Reduced administrative overhead – By automating the license assignment and removal process, the solution can significantly reduce the administrative burden associated with manual license management.
Optimized license utilization – Licenses are assigned only when needed and returned to the pool when no longer required, maximizing license availability and minimizing idle licenses.
Monitoring and metrics – The solution provides monitoring capabilities and license usage metrics, enabling better visibility and informed decision-making regarding license procurement and allocation.
Conclusion
By implementing this serverless solution, it is possible to transform a manual named user license management systems to an automated floating license system for software tools. The event-driven architecture and serverless components provide efficient and scalable license assignment and removal based on the workbench instance state.
This solution has streamlined the license management process, reducing administrative overhead and optimizing license utilization. It is now possible to provision software tools more efficiently, improving productivity and resource allocation across the organization. Additionally, the centralized license management and monitoring capabilities provide better visibility and control over license usage, enabling informed decision-making and cost optimization.
Overall, this AWS based floating license solution has empowered organizations to use software tools more effectively, while minimizing the operational burden associated with license management. For more serverless learning resources, visit Serverless Land.
This post is cowritten with Nikos Tragaras and Raphaël Afanyan from Nexthink.
In this post, we describe Nexthink’s journey as they implemented a new real-time alerting system using Amazon Managed Service for Apache Flink. We explore the architecture, the rationale behind key technology choices, and the Amazon Web Services (AWS) services that enabled a scalable and efficient solution.
Nexthink is a pioneering leader in digital employee experience (DEX). With a mission to empower IT teams and elevate workplace productivity, Nexthink’s Infinity platform offers real-time visibility into end user environments, actionable insights, and robust automation capabilities. By combining real-time analytics, proactive monitoring, and intelligent automation, Infinity enables organizations to deliver an optimal digital workspace.
In the past 5 years, Nexthink completed its transformation into a fully-fledged cloud platform that processes trillions of events per day, reaching over 5 GB per second of aggregated throughput. Internally, Infinity comprises more than 300 microservices that use the power of Apache Kafka through Amazon Managed Service for Apache Kafka (Amazon MSK) for data ingestion and intra-service communication. The Nexthink ecosystem includes several hundreds of Micronaut-based Java microservices deployed in Amazon Elastic Kubernetes Service (Amazon EKS). The vast majority of microservices interact with Kafka through the Kafka Streams framework.
Nexthink alerting system
To help you understand Nexthink’s journey toward a new real-time alerting solution, we begin by examining the existing system and the evolving requirements that led them to seek a new solution.
Nexthink’s existing alerting system provides near real-time notifications, helping users detect and respond to critical events quickly. While effective, this system has limitations in scalability, flexibility, and real-time processing capabilities.
Nexthink gathers telemetry data from thousands of customers’ laptops covering CPU usage, memory, software versions, network performance, and more. Amazon MSK and ClickHouse serve as the backbone for this data pipeline. All endpoint data is ingested in Kafka multi-tenant topics, which are processed and finally stored in a ClickHouse database.
Using the current alerting system, clients can define monitoring rules in Nexthink Query Language (NQL), which are evaluated in near real time by polling the database every 15 minutes. Alerts are triggered when anomalies are detected against client-defined thresholds or long-term baselines. This process is illustrated in the following architecture diagram.
Originally, database-polling allowed great flexibility in the evaluation of complex alerts. However, this approach placed heavy stress on the database. As the company grew and supported larger customers with more endpoints and monitors, the database experienced increasingly heavy loads.
Evolution to a new use-case: Real-time alerts
As Nexthink expanded its data collection to include virtual desktop infrastructure (VDI), the need for real-time alerting became even more critical. Unlike traditional endpoints, such as laptops, where events are gathered every 5 minutes, VDI data is ingested every 30 seconds—significantly increasing the volume and frequency of data. The existing architecture relied on database polling to evaluate alerts, running at a 15-minute interval. This approach was inadequate for the new VDI use case, where alerts needed to be evaluated in near real time on messages arriving every 30 seconds. Merely increasing the polling frequency wasn’t a viable option because it would place excessive load on the database, leading to performance bottlenecks and scalability challenges. To meet these new demands efficiently, we shifted to real-time alert evaluation directly on Kafka topics.
Technology options
As we evaluated solutions for our real-time alerting system, we analyzed two main technology options: Apache Kafka Streams and Apache Flink. Each option had benefits and limitations that needed to be considered.
All Nexthink microservices up to that point integrated with Kafka using Apache Kafka Streams. We’ve observed in practice multiple benefits:
Lightweight and seamless integration. No need for additional infrastructure.
Low latency using RocksDB as a local key-value store.
Team expertise. Nexthink teams have been writing microservices with Kafka-streams for a long time and feel very comfortable using it.
In some use cases however, we found that there were important limitations:
Scalability – Scalability was constrained by the tight coupling between parallelism of microservices and the number of partitions in Kafka topics. Many microservices had already scaled out to match the partition count of the topics they consumed, limiting their ability to scale further. One potential solution was increasing the partition count. However, this approach introduced significant operational overhead, especially with microservices consuming topics owned by other domains. It required rebalancing the entire Kafka cluster and needed coordination across multiple teams. Additionally, such modifications impacted downstream services, requiring careful reconfiguration of stateful processing. The alternative approach would be to introduce intermediate topics to redistribute workload, but this would add complexity to the data pipeline and increase resource consumption on Kafka. These challenges made it clear that a more flexible and scalable approach was needed.
State management – Services that needed to create large K-tables in memory had an increased startup time. Also, in cases where the internal state was large in volume, we found that it applied significant load to the Kafka cluster during the creation of the internal state.
Late event processing – In windowing operations, late events had to be managed manually with techniques that complexified the codebase.
Seeking an alternative that could help us overcome the challenges posed by our current system, we decided to evaluate Flink. Its robust streaming capabilities, scalability, and flexibility made it an excellent choice for building real-time alerting systems based on Kafka topics. Several advantages made Flink particularly appealing:
Native integration with Kafka – Flink offers native connectors for Kafka, which is a central component in the Nexthink ecosystem.
Event-time processing and support for late events – Flink allows messages to be processed based on the event time (that is, when the event actually occurred) even if they arrive out of order. This feature is crucial for real-time alerts because it guarantees their accuracy.
Scalability – Flink’s distributed architecture allows it to scale horizontally independently from the number of partitions in the Kafka topics. This feature weighed a lot in our decision-making because the dependence on the number of partitions was a strong limitation in our platform up to this point.
Fault tolerance – Flink supports checkpoints, allowing managed state to be persisted and ensuring consistent recovery in case of failures. Unlike Kafka Streams, which relies on Kafka itself for long-term state persistence (adding extra load to the cluster), Flink’s checkpointing mechanism operates independently and runs out-of-band, minimizing the impact on Kafka while providing efficient state management.
Amazon Managed Service for Apache Flink – Amazon Managed Service for Apache Flink is a fully managed service that simplifies the deployment, scaling, and management of Flink applications for real-time data processing. By eliminating the operational complexities of managing Flink clusters, AWS enables organizations to focus on building and running real-time analytics and event-driven applications efficiently. Amazon Managed Service for Apache Flink provided us with significant flexibility. It streamlined our evaluation process, which meant we could quickly set up a proof-of-concept environment without getting into the complexities of managing an internal Flink cluster. Moreover, by reducing the overhead of cluster management, it made Flink a viable technology choice and accelerated our delivery timeline.
Solution
After careful evaluation of both options, we chose Apache Flink as our solution due to its superior scalability, robust event-time processing, and efficient state management capabilities. Here’s how we implemented our new real-time alerting system.
The following diagram is the solution architecture.
The first use case was to detect issues with VDI. However, our intention was to build a generic solution that would give us the option to onboard in the future existing use cases currently implemented through polling. We wanted to maintain a common way of configuring monitoring conditions and allow alert evaluation both with polling as well as in real time, depending on the type of device being monitored.
This solution comprises multiple parts:
Monitor configuration – Using Nexthink Query Language (NQL), the alerts administrator defines a monitor that specifies, for example:
Data source – VDI events
Time window – Every 30 seconds
Metric – Average network latency, grouped by desktop pool
Trigger condition(s) – Latency exceeding 300 ms for a continual period of 5 minutes
This monitor configuration is then stored in an internally developed document store and propagated downstream in a Kafka topic.
Data processing using Generic Stream Services– The Nexthink Collector, an agent installed on endpoints, captures and reports various kinds of activities from the VDI endpoints where it’s installed. These events are forwarded to Amazon MSK in one of Nexthink’s production virtual private clouds (VPCs) and are consumed by Java microservices running on Amazon EKS belonging to several domains within Nexthink
One of them is Generic Stream Services, a system that processes the collected events and aggregates them in buckets of 30 seconds. This component works as self-service for all the feature teams in Nexthink and can query and aggregate data from an NQL query. This way, we were able to keep a unified user experience on monitor configuration using NQL, regardless of how alerts were evaluated. This component is broken down into two services:
GS processor – Consumes raw VDI session events and applies initial processing
GS aggregator – Groups and aggregates the data according to the monitor configuration
Real-time monitoring using Flink – Static threshold alerting and seasonal change detection, which identifies variations in data that follow a recurring pattern over time, are the two types of detection that we offer for VDI issues. The system splits the processing between two applications:
Baseline application – Calculates statistical baselines with seasonality using time-of-day anomaly algorithm. For example, the latency by VDI client location or the CPU queue length of a desktop pool.
Alert application – Generates alerts based on user-defined thresholds when the unexpected values don’t change over time or dynamic thresholds based on baselines, which trigger when a metric deviates from an expected pattern.
The following diagram illustrates how we join VDI metrics with monitor configurations, aggregate data using sliding time windows, and evaluate threshold rules, all within Apache Flink. From this process, alerts are generated and are then grouped and filtered before being processed further by the consumers of alerts.
Alert processing and notifications – After an alert is triggered (when a threshold is exceeded) or recovered (when a metric returns to normal levels), the system will assess their impact to prioritize response through the impact processing module. Alerts are then consumed by notification services that deliver messages through emails or webhooks. The alert and impact data are then ingested into a time series database.
Benefits of the new architecture
One of the key advantages of adopting a streaming-based approach over polling was its ease of configuration and management, especially for a small team of three engineers. There was no need for cluster management, so all we needed to do was to provision the service and start coding.
Given our prior experience with Kafka and Kafka Streams and combined with the simplicity of a managed service, we were able to quickly develop and deploy a new alerting system without the overhead of complex infrastructure setup. We used Amazon Managed Service for Apache Flink to spin up a proof of concept within a few hours, which meant the team could focus on defining the business logic without having concerns related to cluster management.
Initially, we were concerned about the challenges of joining multiple Kafka topics. With our previous Kafka Streams implementation, joined topics required identical partition keys, a constraint known as co-partitioning. This created an inflexible architecture, particularly when integrating topics across different business domains. Each domain naturally had its own optimal partitioning strategy, forcing difficult compromises.
Amazon Managed Service for Apache Flink solved this problem through its internal data partitioning capabilities. Although Flink still incurs some network traffic when redistributing data across the cluster during joins, the overhead is practically negligible. The resulting architecture is both more scalable (because topics can be scaled independently based on their specific throughput requirements) and easier to maintain without complex partition alignment concerns.
This significantly improved our ability to detect and respond to VDI performance degradations in real time while keeping our architecture clean and efficient.
Lessons learnt
As with any new technology, adopting Flink for real-time processing came with its own set of challenges and insights.
One of the primary difficulties we encountered was observing Flink’s internal state. Unlike Kafka Streams, where the internal state is by default backed by a Kafka topic from which its content can be visualized, Flink’s architecture makes it inherently difficult to inspect what is happening inside a running job. This required us to invest in robust logging and monitoring strategies to better understand what is happening during the execution and debug issues effectively.
Another critical insight emerged around late event handling—specifically, managing events with timestamps that fall within a time-window’s boundaries but arrive after that window has closed. Amazon Managed Service for Apache Flink addresses this challenge through its built-in watermarking mechanism. A watermark is a timestamp-based threshold that indicates when Flink should consider all events before a specific time to have arrived. This allows the system to make informed decisions about when to process time-based operations like window aggregations. Watermarks flow through the streaming pipeline, enabling Flink to track the progress of event time processing even with out-of-order events.
Although watermarks provide a mechanism to manage late data, they introduce challenges when dealing with multiple input streams operating at different speeds. Watermarks work well when processing events from a single source but can become problematic when joining streams with varying velocities. This is because they can lead to unintended delays or premature data discards. For example, a slow stream can hold back processing across the entire pipeline, and an idle stream might cause premature window closing. Our implementation required careful tuning of watermark strategies and allowable lateness parameters to balance processing timeliness with data completeness.
Our transition from Kafka Streams to Apache Flink proved smoother than initially anticipated. Teams with Java backgrounds and prior experience with Kafka Streams found Flink’s programming model intuitive and easy to use. The DataStream API offers familiar concepts and patterns, and Flink’s more advanced features could be adopted incrementally as needed. This gradual learning curve gave our developers the flexibility to become productive quickly, focusing first on core stream processing tasks before moving on to more advanced concepts like state management and late event processing.
The future of Flink in Nexthink
Real-time alerting is now deployed to production and available to our clients. A major success of this project was the fact that we successfully introduced a technology as an alternative to Kafka streams, with very little management requirements, guaranteed scalability, data-management flexibility, and comparable cost.
The impact on the Nexthink alerting system was significant because we no longer have a single evaluating alert through database polling. Therefore, we’re already assessing the timeframe for onboarding other alerting use cases to real-time evaluation with Flink. This will alleviate database load and will also provide more accuracy on the alert triggering.
Yet the impact of Flink isn’t limited to the Nexthink alerting system. We now have a proven production-ready alternative for services that are limited in terms of scalability due to the number of partitions of the topics they are consuming. Thus, we’re actively evaluating the option to convert more services to Flink to allow them to scale out more flexibly.
Conclusion
Amazon Managed Service for Apache Flink has been transformative for our real-time alerting system at Nexthink. By handling the complex infrastructure management, AWS enabled our team to deploy a sophisticated streaming solution in less than a month, keeping our focus on delivering business value rather than managing Flink clusters.
The capabilities of Flink have proven it to be more than an alternative to Kafka Streams. It’s become a compelling first choice for both new projects and existing feature refactoring. Windowed processing, late event management, and stateful streaming operations have made complex use cases remarkably straightforward to implement. As our development teams continue to explore Flink’s potential, we’re increasingly confident that it will play a central role in Nexthink’s real-time data processing architecture moving forward.
Nikos Tragaras is a Principal Software Architect at Nexthink with around two decades of experience in building distributed systems, from traditional architectures to modern cloud-native platforms. He has worked extensively with streaming technologies, focusing on reliability and performance at scale. Passionate about programming, he enjoys building clean solutions to complex engineering problems
Raphaël Afanyan is a Software Engineer and Tech Lead of the Alerts team at Nexthink. Over the years, he has worked on designing and scaling data processing systems and played a key role in building Nexthink’s alerting platform. He now collaborates across teams to bring innovative product ideas to life, from backend architecture to polished user interfaces.
Simone Pomata is a Senior Solutions Architect at AWS. He has worked enthusiastically in the tech industry for more than 10 years. At AWS, he helps customers succeed in building new technologies every day.
Subham Rakshit is a Senior Streaming Solutions Architect for Analytics at AWS based in the UK. He works with customers to design and build streaming architectures so they can get value from analyzing their streaming data. His two little daughters keep him occupied most of the time outside work, and he loves solving jigsaw puzzles with them. Connect with him on LinkedIn.
Lorenzo Nicora works as a Senior Streaming Solutions Architect at AWS, helping customers across EMEA. He has been building cloud-centered, data-intensive systems for over 25 years, working across industries both through consultancies and product companies. He has used open source technologies extensively and contributed to several projects, including Apache Flink.
As data and data-driven technologies become a bigger part of everyday life, it’s more important than ever to make sure that young people are given the chance to learn data science concepts and skills.
David WeintropRotem Israel-FishelsonPeter F Moon
In our April research seminar, David Weintrop, Rotem Israel-Fishelson, and Peter Moon from the University of Maryland introduced API Can Code, a data science curriculum designed with high school students for high school students. Their talk explored how their innovative work uses real-world data and students’ own experiences and interests to create meaningful, authentic learning experiences in data science.
Quick note for educators: Are you interested in joining our free, exploratory data science education workshop for teachers on 10 July 2025 in Cambridge, UK? Then find out the details here.
David started by explaining the motivation behind the API Can Code project. The team’s goal was not to turn students into future data scientists, but to offer students the data literacy they need to explore and critically engage with a data-driven world.
The work was also guided by a shared view among leading teachers’ organisations that data science should be taught across all subjects in the K–12 curriculum. It also draws on strong research showing that when educational experiences connect with students’ own lives and interests, it leads to deeper engagement and better learning outcomes.
Reviewing the landscape
To prepare for the design of the curriculum, David, Rotem, and Peter wanted to understand what data science education options already exist for K–12 students. Rotem described how they compared four major K–12 data science curricula and examined different aspects, such as the topics they covered and the datasets they used. Their findings showed that many datasets were quite small in size, and that the datasets used were not always about topics that students were interested in.
The team also looked at 30 data science tools used across different K–12 platforms and analysed what each could do. They found that tools varied in how effective they were and that many lacked accessibility features to support students with diverse learning needs.
This analysis helped to refine the team’s objective: to create a data science curriculum that students find interesting and that is informed by their values and voices.
Participatory design
To work towards this goal, the team used a methodology called participatory design. This is an approach that actively involves the end users — in this case, high school students — in the design process. During several in-person sessions with 28 students aged 15 to 18 years old, the researchers facilitated low-tech, hands-on activities exploring the students’ identities and interests and how they think about data.
One activity, Empathy Map, involved students working together to create a persona representing a student in their school. They were asked to describe the persona’s daily life, interests, and concerns about technology and data:
The students’ involvement in the design process gave the team a better understanding of young people’s views and interests, which helped create the design of the API Can Code curriculum.
API Can Code: three units, three key tools
Peter provided an overview of the API Can Code curriculum. It follows a three-unit flow covering different concepts and tools in each unit:
Unit 1 introduces students to different types of data and data science terminology. The unit explores the role of data in the students’ daily lives, how use and misuse of data can affect them, different ways of collecting and presenting data, and how to evaluate databases for aspects such as size, recency, and trustworthiness. It also introduces them to RapidAPI, a hub that connects to a wide range of APIs from different providers, allowing students to access real-world data such as Zillow housing prices or Spotify music data.
Unit 2 covers the computing skills used in data science, including the use of programming tools to run efficient data science techniques. Students learn to use EduBlocks, a block-based programming environment where students can draw in JSON files from RapidAPI datasets, and process and filter data without needing a lot of text-based programming skills. The students also compare this approach with manual data processing, which they discover is very slow.
Unit 3 focuses on data analysis, visualisation, and interpretation. Students use CODAP, a web-based interactive data science tool, to calculate summary statistics, create graphs, and perform analyses. CODAP is a user-friendly but powerful platform, making it perfect for students to analyse and visualise their data sets. Students also practise interpreting pre-made graphs and the graphs and statistics that they are creating.
Peter described an example activity carried out by the students, showing how these three units flow together and build both technical skills and an understanding of the real-world uses of data science. Students were tasked with analysing a dataset from Zillow, a property website, to explore the question “How much does a house in my neighbourhood cost?” The images below show the process the students followed, which uses the data science skills and tools from all three units of the curriculum.
Click on an image to enlarge it.
Interest-driven learning in action
A central tenet of API Can Code is that students should explore data that matters to them. A diverse range of student interests was identified during the design work, and the curriculum uses these areas of interest, such as music, movies, sports, and animals, throughout the lessons.
The curriculum also features an open-ended final project, where students can choose a research question that is important to them and their lives, and answer it using data science skills.
The team shared two examples of memorable final projects. In one, a student set out to answer the question “Is Jhené Aiko a star?” The student found a publicly available dataset through an API provided by Deezer, a music streaming platform. She wrote a program that retrieved data on the artist’s longevity and collaborations, analysed the data, and concluded that Aiko is indeed a star. What stood out about this project wasn’t just the fact that the student independently defined stardom and answered their research question using real data, but that this was a truly personal, interest-driven project. David noted that the researchers could never have come up with this activity, since they had never previously heard of Jhené Aiko!
Jhené Aiko, an R&B singer-songwriter (Photo by Charito Yap, licensed under CC BY-ND 2.0)
Another student’s project analysed data about housing in Washington DC to answer the question “Which ward in DC has the most affordable houses?” Rotem explained that this student was motivated by her family thinking about moving away from the city. She wanted to use her project to persuade her parents to stay by identifying the most affordable ward in DC that they could move to. She was excited by the outcome of her project, and she presented her findings to other students and her parents.
These projects underscore the power of personally important data science projects driven by students’ interests. When students care about the questions they are exploring, they’re more invested in the process and more likely to keep using the skills and concepts they learn.
Resources
API Can Code is available online and completely free to use. Teachers can access lesson plans, tutorial videos, assessment rubrics, and more from the curriculum’s website https://apicancode.umd.edu/. The site also provides resources to support students, including example programs and glossaries.
Join our next seminar
In our current seminar series, we’re exploring teaching about AI and data science. Join us at our next seminar on Tuesday, 17 June from 17:00 to 18:30 BST to hear Netta Iivari (University of Oulu) introduce transformative agency and its importance for children’s computing education in the age of AI.
To sign up and take part in our research seminars, click below:
To provide the best experiences, we use technologies like cookies to store and/or access device information. Consenting to these technologies will allow us to process data such as browsing behavior or unique IDs on this site. Not consenting or withdrawing consent, may adversely affect certain features and functions.
Functional
Always active
The technical storage or access is strictly necessary for the legitimate purpose of enabling the use of a specific service explicitly requested by the subscriber or user, or for the sole purpose of carrying out the transmission of a communication over an electronic communications network.
Preferences
The technical storage or access is necessary for the legitimate purpose of storing preferences that are not requested by the subscriber or user.
Statistics
The technical storage or access that is used exclusively for statistical purposes.The technical storage or access that is used exclusively for anonymous statistical purposes. Without a subpoena, voluntary compliance on the part of your Internet Service Provider, or additional records from a third party, information stored or retrieved for this purpose alone cannot usually be used to identify you.
Marketing
The technical storage or access is required to create user profiles to send advertising, or to track the user on a website or across several websites for similar marketing purposes.


 Shubham Kumar is a Software Development Engineer at Amazon OpenSearch Service, specializing in the security domain. He is passionate about developing robust security features to enhance the protection of customer data and infrastructure.
 Sachet Alva is a Software Development Manager at Amazon OpenSearch Service, overseeing the infrastructure security and custom package initiatives. His team’s innovations contribute to the enhanced security and flexibility of Amazon OpenSearch Service deployments.
 Naveen Negi is a Senior Tech Product Manager for Amazon OpenSearch Service. He works closely with engineering teams and customers to shape the future of OpenSearch Service, making sure it meets evolving security and performance needs.
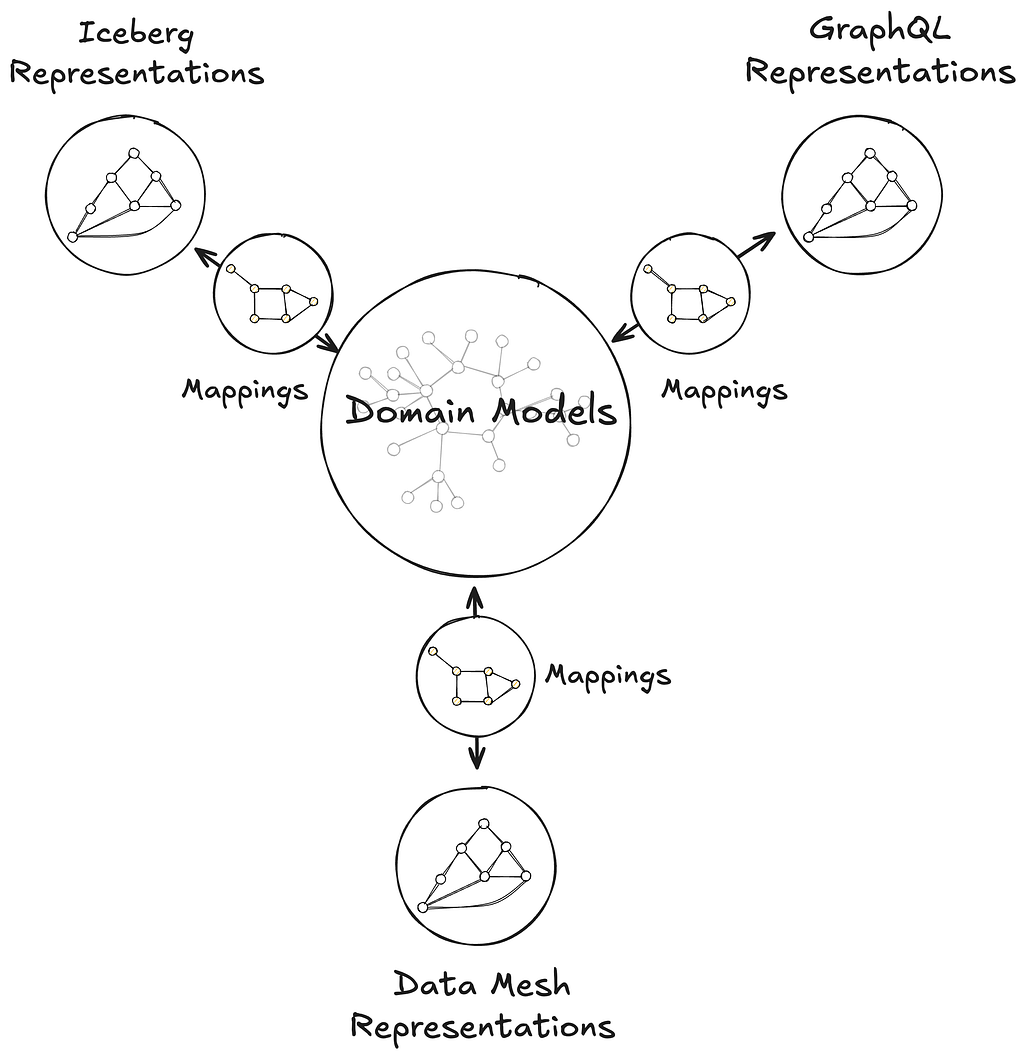


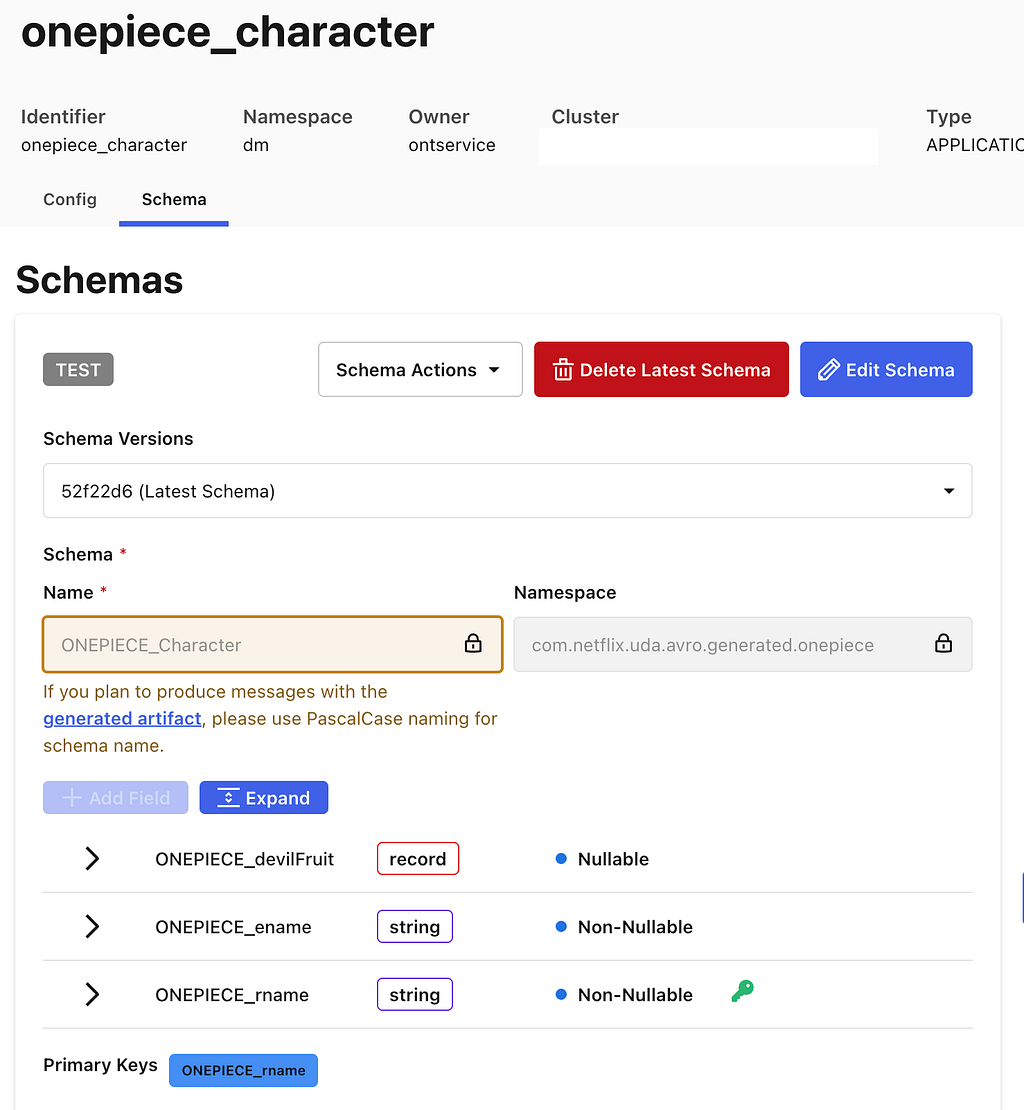
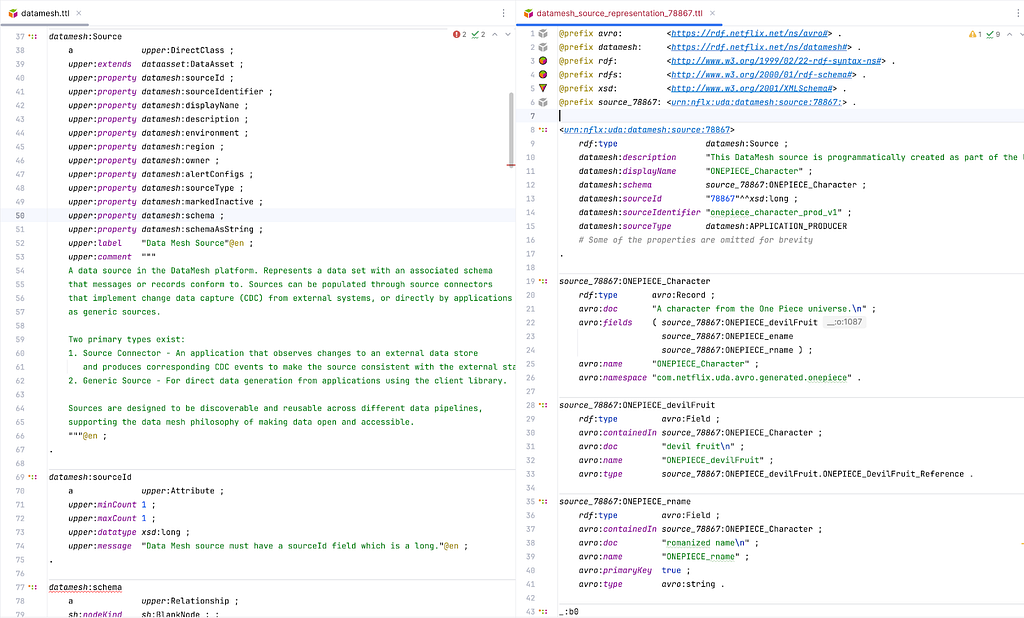
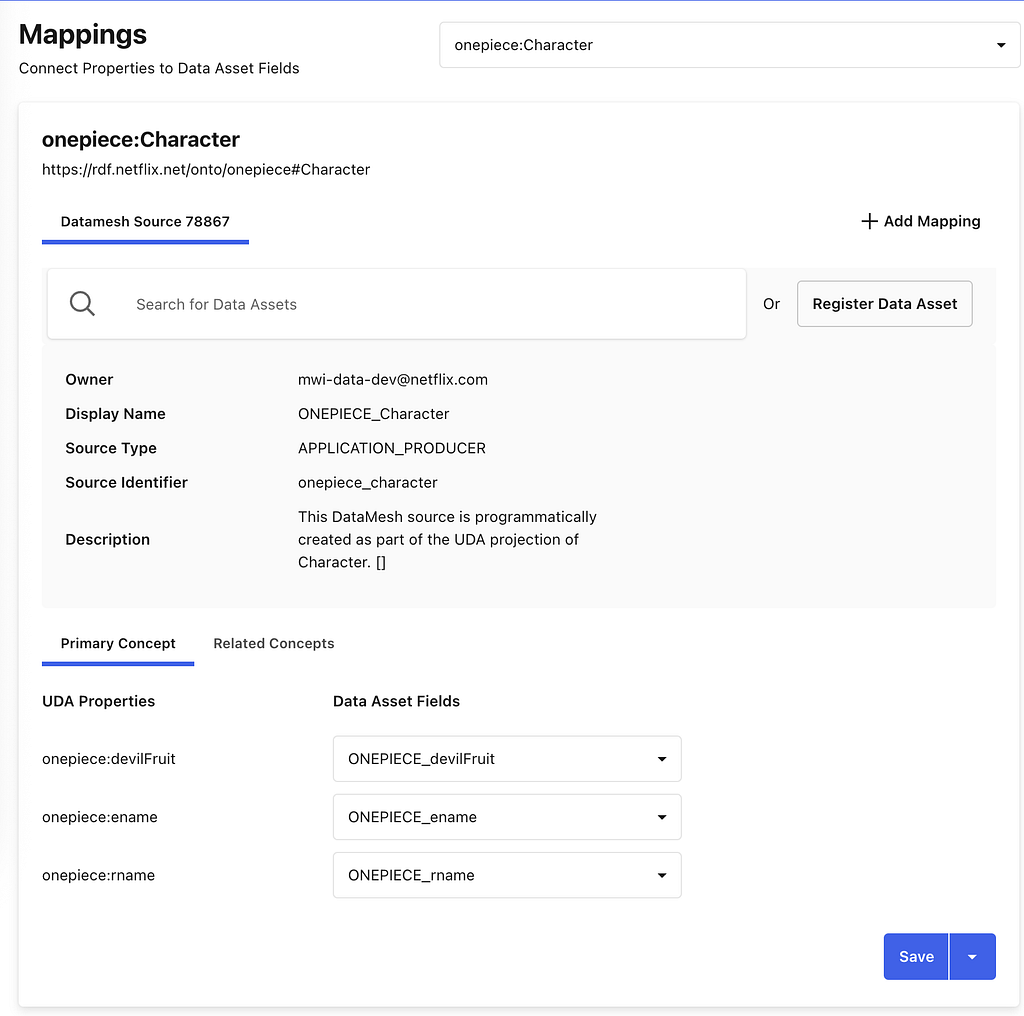

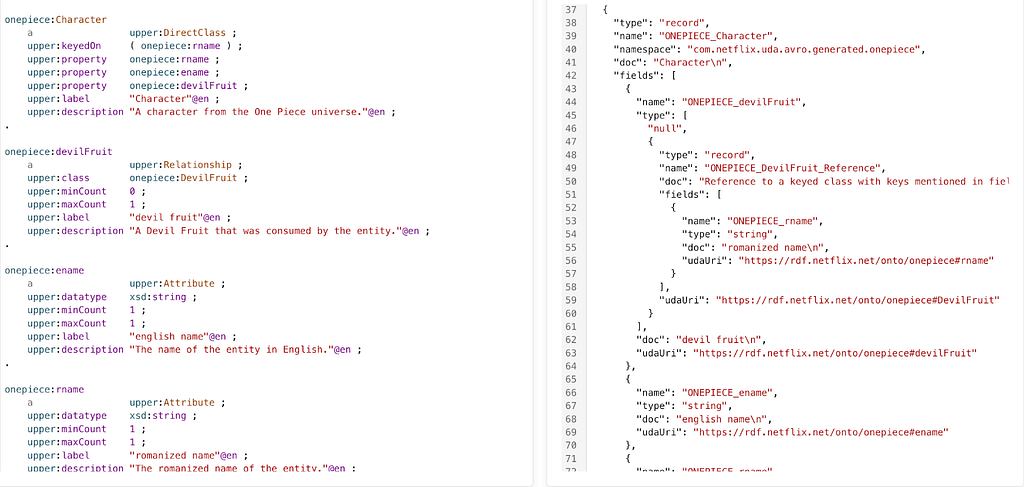
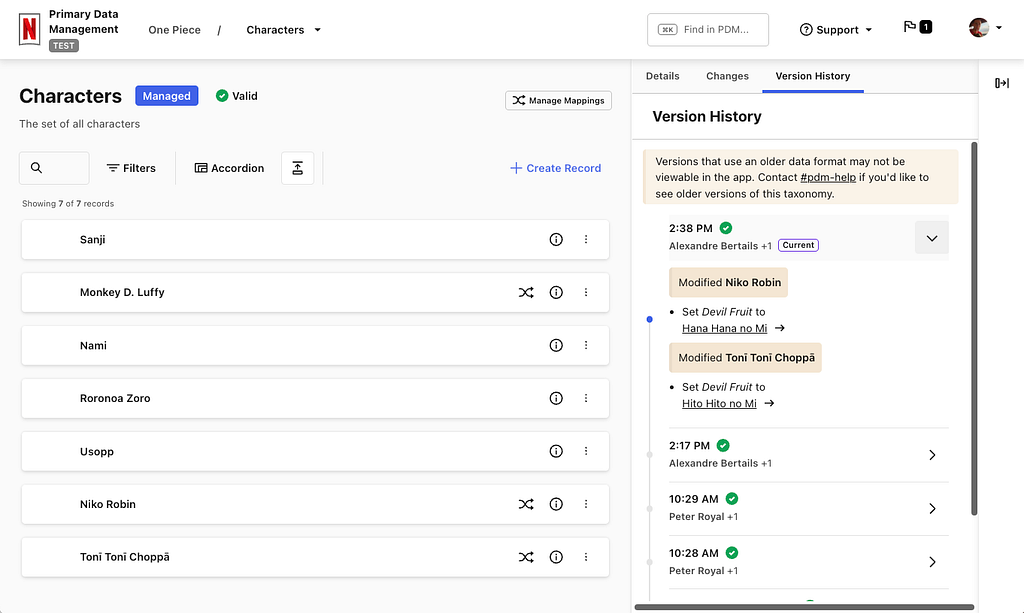
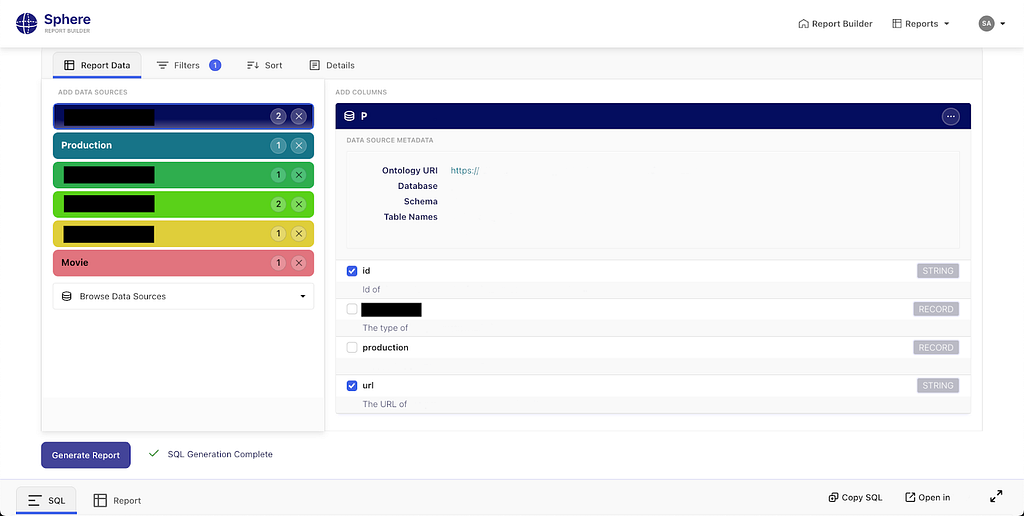


 Nikos Tragaras is a Principal Software Architect at Nexthink with around two decades of experience in building distributed systems, from traditional architectures to modern cloud-native platforms. He has worked extensively with streaming technologies, focusing on reliability and performance at scale. Passionate about programming, he enjoys building clean solutions to complex engineering problems
 Raphaël Afanyan is a Software Engineer and Tech Lead of the Alerts team at Nexthink. Over the years, he has worked on designing and scaling data processing systems and played a key role in building Nexthink’s alerting platform. He now collaborates across teams to bring innovative product ideas to life, from backend architecture to polished user interfaces.
 Simone Pomata is a Senior Solutions Architect at AWS. He has worked enthusiastically in the tech industry for more than 10 years. At AWS, he helps customers succeed in building new technologies every day.
 Subham Rakshit is a Senior Streaming Solutions Architect for Analytics at AWS based in the UK. He works with customers to design and build streaming architectures so they can get value from analyzing their streaming data. His two little daughters keep him occupied most of the time outside work, and he loves solving jigsaw puzzles with them. Connect with him on
  Lorenzo Nicora works as a Senior Streaming Solutions Architect at AWS, helping customers across EMEA. He has been building cloud-centered, data-intensive systems for over 25 years, working across industries both through consultancies and product companies. He has used open source technologies extensively and contributed to several projects, including Apache Flink.