Ако ситуацията беше малко по-различна, вероятно новина на седмицата щеше да бъде началото на 50-тото Народно събрание. Но то, заченато в грях, се роди трудно, а перспективите за бъдещето му съвсем не изглеждат обнадеждаващо, както и да се развият събитията. Това, за съжаление, налива вода в мелницата на тези, които нямат търпение да обявят смъртта на парламентарната република и да я подменят с президентска например.
Според Емилия Милчева обаче, колкото и изкушаващо да изглежда това политическо приключение за сегашния български президент, то е изпълнено с предизвикателства, които без подходящ контекст трудно биха се реализирали. Прочетете повече в нейния анализ, озаглавен „Ще стане ли президентът Радев партийно величие?“.
Свикнали сме Стефан Иванов да ни представя интересни книги или да четем поезията му, но тази седмица той ни показва една от другите си суперсили – тази на публициста. Под заглавието „За природата на поезията и политиката в думите“ ще намерите едно брилянтно и изключително важно интервю с поетите Линда Грегърсън и Ник Леърд, което само привидно гравитира около поезията, а всъщност болезнено откровено посяга към най-актуални теми от ежедневието на човечеството. Не подминавайте това четиво и си отделете достатъчно време за него. Включително за размишления.
В някакъв смисъл, макар че темата е архитектура, със сходна нагласа ще ви остави и текстът на Анета Василева „Make Architecture Great Again. Новият български архитектурен популизъм“, който е продължение на друг неин материал с подобно заглавие, публикуван в „Тоест“ през май. Първата част е посветена на това как духът на времето, политиката и идеологията оставят отпечатък върху сградите. И защо популизмът прониква и в сферата на архитектурата. Втората част е поглед към родните му проявления.
И ако играта на думи в заглавието на предишния материал ви е провокирала да насочите мисълта си отвъд океана, Александър Детев тъкмо се завърна оттам успокоен, че въпреки всичко американската мечта още си е на мястото. Не подминавайте интересния му и доста забавен обзор.
Отвъд океана идва и историческият повод през юни да се отбелязва необходимостта от зачитане на правата на ЛГБТИ хората. У нас тази година „София прайд“ ще се проведе за 17-ти пореден път. И отново смисълът, който събитието носи, е замъглен от шумни дискусии „за“ или „против“. Но за първи път от 17 години най-голямата група общински съветници от София – тази на „Продължаваме Промяната“, „Демократична България“ и „Спаси София“ – се обяви в подкрепа на прайда с нарочна декларация. За този прецедент пише Светла Енчева в материала си „Изгрява ли дъга над София и България?“.
Нека завършим седмицата с два много интересни текста от научната сфера. В първия Анастасия Орманджиева разказва за усъвършенстваните методи за извличане и разчитане на ДНК от вкаменелости, което е голям пробив в областта на еволюционната генетика. И ако искате да научите как ДНК на хора, живeли преди хилядолетия, може да ни помогне да се справим по-добре с бъдещи пандемии, инфекциозни болести или за разработване на нови лекарства и терапии, не пропускайте да прочетете „Палеогеномиката и тайните на античната ДНК“.
А Михаил Ангелов в новата си статия от поредицата „Научни новини“ разказва за ползите от употребата на някои отпадъци. Например в производството на шоколад или за пречистване на вода. Ако пък се интересувате от космически изследвания, може да прочетете за премеждията на капсулата „Старлайнер“ в орбита или за последните новини около поправената (от разстояние над 24 млрд. км) сонда „Вояджър 1“, която продължава мисията си.
Определението, че гражданският брак бил между мъж и жена, се появява въобще в българска конституция едва през 1989-та. До тогава не е съществувало и се споменава, че е между двама души и те са равни. Изчетох всичко в стенограмите на ВНС за тези членове, но не открих никаква дискусия или споменаване как е влязло, кой го е предложил и въобще как е било гласувано.
Има обаче напоително много дискусии обаче за нуждата да се заложи като престъпление т.н. публичен конкубинат – съжителството без брак. Тези са напоени значително с препратки към този член по-късно и идентични с днешни псевдо-моралистични лозунги на консервативни и религиозни организации, особено едни определени крайни евангелисти.
Отхвърлено е – както и следващите, които ще опиша – с аргументи, че не е работа на закона да налага морал, да се меси в личните взаимоотношения между двойка и какво правят в леглото. Интересно защо обаче тези аргументи не ги чуваме сега.
Има споменавания и опити още тогава да се забранява абортът и се прокарват идеята, че водело до някакъв упадък и че ограничаването му щяло да помогне за отдавна влошаващата се демография към онзи момент. Най-забавен пример за това е изказване на Георги Петров, който в един момент стана шеф на хазарта и придоби комичен прякор.
Намерих и премного искания да се вкарат елементи от различни религии, включително признаване на църковния брак като „по-траен“. Има доста препратки към зараждащите се секти и навлизащи влияния, които видимо не се нравят на народните избраници тогава, особено няколко по-късно обявени за агенти на ДС.
Та опитите да се вкарат ограничения не са от днес или вчера, а има добре структурирана и последователна кампания за подмяна на данни и факти, включително за статистиката за аборти, разводи и демографията като цяло. Забелязват се идентични лозунги на тези, които вече успяха да сработят в щатите и се проследяват лесно до едни и същи лица, които утре ще протестират парадирайки с някакви ценности, които отказват методично да определят.
Впрочем, преди точно 9 години дадох предложение в социалките да отпадне единственото споменаване на думата „мъж“ в Конституцията. Няма да ми липсва, но явно крехкото достойнство на някои люде страда от това.
This week includes modules that target file traversal and arbitrary file read vulnerabilities for software such as Apache, SolarWinds and Check Point, with the highlight being a module for the recent PHP vulnerability submitted by sfewer-r7. This module exploits an argument injection vulnerability, resulting in remote code execution and a Meterpreter shell running in the context of the Administrator user.
Note, that this attack requires the target to be running a Japanese or Chinese locale, as the attack targets Windows’s character replacement behavior for certain code pages when calling Win32 API functions.
A default configuration of XAMPP is vulnerable. This attack is unauthenticated and the server must expose PHP in CGI mode, not FastCGI. More information on this exploit can be found on AttackerKB.
Description: This module leverages an unauthenticated arbitrary root file read vulnerability for Check Point Security Gateway appliances. When the IPSec VPN or Mobile Access blades are enabled on affected devices, traversal payloads can be used to read any files on the local file system. This vulnerability is tracked as CVE-2024-24919.
Authors: Hussein Daher and sfewer-r7
Type: Auxiliary
Pull request: #19255 contributed by sfewer-r7
Path: gather/solarwinds_servu_fileread_cve_2024_28995
AttackerKB reference: CVE-2024-28995
Description: This module exploits an unauthenticated file read vulnerability, due to directory traversal, affecting SolarWinds Serv-U FTP Server 15.4, Serv-U Gateway 15.4, and Serv-U MFT Server 15.4. All versions prior to the vendor supplied hotfix "15.4.2 Hotfix 2" (version 15.4.2.157) are affected.
Apache OFBiz Forgot Password Directory Traversal
Authors: Mr-xn and jheysel-r7
Type: Exploit
Pull request: #19249 contributed by jheysel-r7
Path: multi/http/apache_ofbiz_forgot_password_directory_traversal
AttackerKB reference: CVE-2024-32113
Description: This adds an exploit for CVE-2024-32113, which is an unauthenticated RCE in Apache OFBiz.
PHP CGI Argument Injection Remote Code Execution
Authors: Orange Tsai, sfewer-r7, and watchTowr
Type: Exploit
Pull request: #19247 contributed by sfewer-r7
Path: windows/http/php_cgi_arg_injection_rce_cve_2024_4577
AttackerKB reference: CVE-2024-4577
Description: Windows systems running Japanese or Chinese (simplified or traditional) locales are vulnerable to a PHP CGI argument injection vulnerability. This exploit module returns a session running in the context of the Administrator user.
Enhancements and features (2)
#18829 from cdelafuente-r7 – Adding multiple HttpServer services in a module is sometimes complex since they share the same methods. This usually causes situations where #on_request_uri needs to be overridden to handle requests coming from each service. This updates the cmdstager and the Java HTTP ClassLoader mixins, since these are commonly used in the same module. This also updates the manageengine_servicedesk_plus_saml_rce_cve_2022_47966 module to make use of these new changes.
#19229 from softScheck – The junos_phprc_auto_prepend_file module used to depend on having a user authenticated to the J-Web application to steal the necessary session tokens in order to exploit. With this enhancement the module will now create a session if one doesn’t exist. Also it adds datastore options to change the hash format to be compatible with older versions as well an option to attempt to set ssh root login to true before attempting to establish a root ssh session.
Bugs fixed (4)
#19176 from Fufu-btw – This adds the x86 and x64 architectures to the exploit/windows/http/dnn_cookie_deserialization_rce module’s target metadata.
#19253 from aaronjfeingold – This fixes an incorrect CVE reference in the exploit/unix/http/zivif_ipcheck_exec module.
#19261 from zeroSteiner – Fixed powershell_base64 encoder to execute encoded strings correctly.
Documentation
You can find the latest Metasploit documentation on our docsite at docs.metasploit.com.
Get it
As always, you can update to the latest Metasploit Framework with msfupdate
and you can get more details on the changes since the last blog post from
GitHub:
The Amazon EMR runtime for Apache Spark is a performance-optimized runtime that is 100% API compatible with open source Apache Spark. It offers faster out-of-the-box performance than Apache Spark through improved query plans, faster queries, and tuned defaults. Amazon EMR on EC2, Amazon EMR Serverless, Amazon EMR on Amazon EKS, and Amazon EMR on AWS Outposts all use this optimized runtime, which is 4.5 times faster than Apache Spark 3.5.1 and has 2.8 times better price-performance based on an industry standard benchmark derived from TPC-DS at 3 TB scale (note that our TPC-DS derived benchmark results are not directly comparable with official TPC-DS benchmark results).
We added 35 optimizations since the EOY 2022 release, EMR 6.9, that are included in both EMR 7.0 and EMR 7.1. These improvements are turned on by default and are 100% API compatible with Apache Spark. Some of the improvements since our previous post, Amazon EMR on EKS widens the performance gap, include:
Spark physical plan operator improvements – We continue to improve Spark runtime performance by changing the operator algorithms:
Optimized data structures used in hash joins for performance and memory requirements, allowing the use of more performant join algorithm for more cases
Optimized sorting for partial window
Optimized rollup operations
Improved sort algorithm for shuffle partitioning
Optimized hash aggregate operator
More efficient decimal arithmetic operations
Aggregates based on Parquet statistics
Spark query planning improvements – We introduced new rules in the Spark’s Catalyst optimizer to improve efficiency:
Adaptively minimize redundant joins
Adaptively identify and disable unhelpful optimizations at runtime
Infer more advanced Bloom filters and dynamic partition pruning filters from complex query plans to reduce amount of data shuffled and read from Amazon Simple Storage Service (Amazon S3)
Fewer requests to Amazon S3 – We reduced requests sent to Amazon S3 when reading Parquet files by minimizing unnecessary requests and introducing a cache for Parquet footers.
Java 17 as default Java runtime used in Amazon EMR 7.0 – Java 17 was extensively tested and tuned for optimal performance, allowing us to make it the default Java runtime for Amazon EMR 7.0.
In this post, we share the testing methodology and benchmark results comparing the latest Amazon EMR versions (7.0 and 7.1) with the EOY 2022 release (version 6.9) and Apache Spark 3.5.1 to demonstrate the latest cost improvements Amazon EMR has achieved.
Benchmark results for Amazon EMR 7.1 vs. Apache Spark 3.5.1
To evaluate the Spark engine performance, we ran benchmark tests with the 3 TB TPC-DS dataset. We used EMR Spark clusters for benchmark tests on Amazon EMR and installed Apache Spark 3.5.1 on Amazon Elastic Compute Cloud (Amazon EC2) clusters designated for open source Spark (OSS) benchmark runs. We ran tests on separate EC2 clusters comprised of nine r5d.4xlarge instances for each of Apache Spark 3.5.1, Amazon EMR 6.9.0, and Amazon EMR 7.1. The primary node has 16 vCPU and 128 GB memory and eight worker nodes have a total of 128 vCPU and 1024 GB memory. We tested with Amazon EMR defaults to highlight the out-of-the-box experience and tuned Apache Spark with the minimal settings needed to provide a fair comparison.
For the source data, we chose the 3 TB scale factor, which contains 17.7 billion records, approximately 924 GB of compressed data in Parquet file format. The setup instructions and technical details can be found in the GitHub repository. We used Spark’s in-memory data catalog to store metadata for TPC-DS databases and tables. spark.sql.catalogImplementation is set to the default value in-memory. The fact tables are partitioned by the date column, which consists of partitions ranging from 200–2,100. No statistics were pre-calculated for these tables.
A total of 104 SparkSQL queries were run in three iterations sequentially and an average of each query’s runtime in these three iterations was used for comparison. The average of the three iterations’ runtime on Amazon EMR 7.1 was 0.51 hours, which is 1.9 times faster than Amazon EMR 6.9 and 4.5 times faster than Apache Spark 3.5.1. The following figure illustrates the total runtimes in seconds.
The per-query speedup on Amazon EMR 7.1 when compared to Apache Spark 3.5.1 is illustrated in the following chart. Although Amazon EMR is faster than Apache Spark on all TPC-DS queries, the speedup is much greater on some queries than on others. The horizontal axis represents queries in the TPC-DS 3 TB benchmark ordered by the Amazon EMR speedup descending and the vertical axis shows the speedup of queries due to the Amazon EMR runtime.
Cost comparison
Our benchmark outputs the total runtime and geometric mean figures to measure the Spark runtime performance by simulating a real-world complex decision support use case. The cost metric can provide us with additional insights. Cost estimates are computed using the following formulas. They factor in Amazon EC2, Amazon Elastic Block Store (Amazon EBS), and Amazon EMR costs, but don’t include Amazon S3 GET and PUT costs.
Amazon EC2 cost (include SSD cost) = number of instances * r5d.4xlarge hourly rate * job runtime in hours
4xlarge hourly rate = $1.152 per hour
Root Amazon EBS cost = number of instances * Amazon EBS per GB-hourly rate * root EBS volume size * job runtime in hours
Amazon EMR cost = number of instances * r5d.4xlarge Amazon EMR cost * job runtime in hours
Based on the calculation, the Amazon EMR 7.1 benchmark result demonstrates a 2.8 times improvement in job cost compared to Apache Spark 3.5.1 and a 1.7 times improvement when compared to Amazon EMR 6.9.
Metric
Amazon EMR 7.1
Amazon EMR 6.9
Apache Spark 3.5.1
Runtime in hours
0.51
0.87
1.76
Number of EC2 instances
9
9
9
Amazon EBS Size
20gb
20gb
20gb
Amazon EC2 cost
$5.29
$9.02
$18.25
Amazon EBS cost
$0.01
$0.02
$0.04
Amazon EMR cost
$1.24
$2.11
$0.00
Total cost
$6.54
$11.15
$18.29
Cost Savings
Baseline
Amazon EMR 7.1 is 1.7 times better
Amazon EMR 7.1 is 2.8 times better
Run OSS Spark benchmarking
For running Apache Spark 3.5.1, we used the following configurations to set up an EC2 cluster. We used one primary node and eight worker nodes of type r5d.4xlarge.
This benchmark application is built from branch tpcds-v2.13. If you’re building a new benchmark application, switch to the correct branch after downloading the source code from the GitHub repo.
Create and configure a YARN cluster on Amazon EC2
Follow the instructions in the emr-spark-benchmark GitHub repo to create an OSS Spark cluster on Amazon EC2 using Flintrock.
Based on the cluster selection for this test, the following are the configurations used:
When the Spark job is complete, download the test result file from the output S3 bucket s3a://<YOUR_S3_BUCKET>/benchmark_run/timestamp=xxxx/summary.csv/xxx.csv. You can use the Amazon S3 console and navigate to the output bucket location or use the Amazon Command Line Interface (AWS CLI).
The Spark benchmark application creates a timestamp folder and writes a summary file inside a summary.csv prefix. Your timestamp and file name will be different from the one shown in the preceding example.
The output CSV files have four columns without header names:
Query name
Median time
Minimum time
Maximum time
Because we have three runs, we can then compute the average and geometric mean of the runtimes.
Run aws configure to configure your AWS CLI shell to point to the benchmarking account. Refer to Configure the AWS CLI for instructions.
Upload the benchmark application to Amazon S3.
Deploy the EMR cluster and run the benchmark job
Complete the following steps to run the benchmark job:
Use the AWS CLI command as shown in Deploy EMR Cluster and run benchmark job to spin up an EMR on EC2 cluster. Update the provided script with the correct Amazon EMR version and root volume size, and provide the values required. Refer to create-cluster for a detailed description of the AWS CLI options.
Store the cluster ID from the response. You need this in the next step.
Submit the benchmark job in Amazon EMR using add-steps in the AWS CLI:
Replace <cluster ID> with the cluster ID from the create cluster response.
The benchmark application is at s3://<YOUR_S3_BUCKET>/spark-benchmark-assembly-3.5.1.jar.
The TPC-DS source data is at s3://<YOUR_S3_BUCKET>/BLOG_TPCDS-TEST-3T-partitioned.
The results are created in s3://<YOUR_S3_BUCKET>/benchmark_run.
After the job is complete, retrieve the summary results from s3://<YOUR_S3_BUCKET>/benchmark_run in the same way as the OSS benchmark runs and compute the average and geomean for Amazon EMR runs.
Amazon EMR continues to improve the EMR runtime for Apache Spark, leading to a performance improvement of 1.9x year-over-year and 4.5x faster performance than OSS Spark 3.5.1. We recommend that you stay up to date with the latest Amazon EMR release to take advantage of the latest performance benefits.
To keep up to date, subscribe to the Big Data Blog’s RSS feed to learn more about the EMR runtime for Apache Spark, configuration best practices, and tuning advice.
About the author
Ashok Chintalapati is a software development engineer for Amazon EMR at Amazon Web Services.
Steve Koonce is an Engineering Manager for EMR at Amazon Web Services.
Football (“soccer” in the US) is considered the most popular sport in the world, with around 3.5 billion fans spread across the world. European football is central to its popularity. The UEFA Euro 2024 (the European Football Championship) started on June 14 and will run until July 14, 2024. But how much do these games impact Internet traffic in countries where national teams are playing? That’s what we aim to explore in this blog post. We found that, on average, traffic dropped 6% during games in European countries with national teams playing in the tournament.
Cloudflare has a global presence with data centers in over 320 cities, which helps provide a global view of what’s happening on the Internet. This is helpful for security, privacy, efficiency, and speed purposes, but also for observing Internet disruptions and traffic trends.
In the past, we’ve seen how Internet traffic and HTTP requests are impacted by events such as total solar eclipses, the Super Bowl, and elections. 2024 is the year of elections, and we’ve been sharing our observations in blog posts and our new 2024 Election Insights report on Cloudflare Radar.
However, football games are different from elections. Related trends happen when major teams or national squads are playing matches that draw a lot of human attention. If a game is broadcast on a national TV channel, Internet traffic typically drops because during games. People’s attention is more on the TV set with the ‘old’ broadcast signal, for those games that don’t require a paid subscription. That’s the most common situation when national teams are playing in Europe.
If it’s on a closed or paid channel (where a subscription is needed), then sometimes traffic increases as fewer viewers have access to the TV broadcast. For context, there’s a trend of channels offering games in their apps through streaming, not only for paid channels but also national broadcasters such as the British BBC. The opening England game in Euro 2024 on Sunday, June 16, 2024, had 15 million viewers on BBC One and was also streamed 3.5 million times on BBC iPlayer. This variety of viewing options from a single service appears to be a new trend in the digital age.
Football games associated with drops in traffic
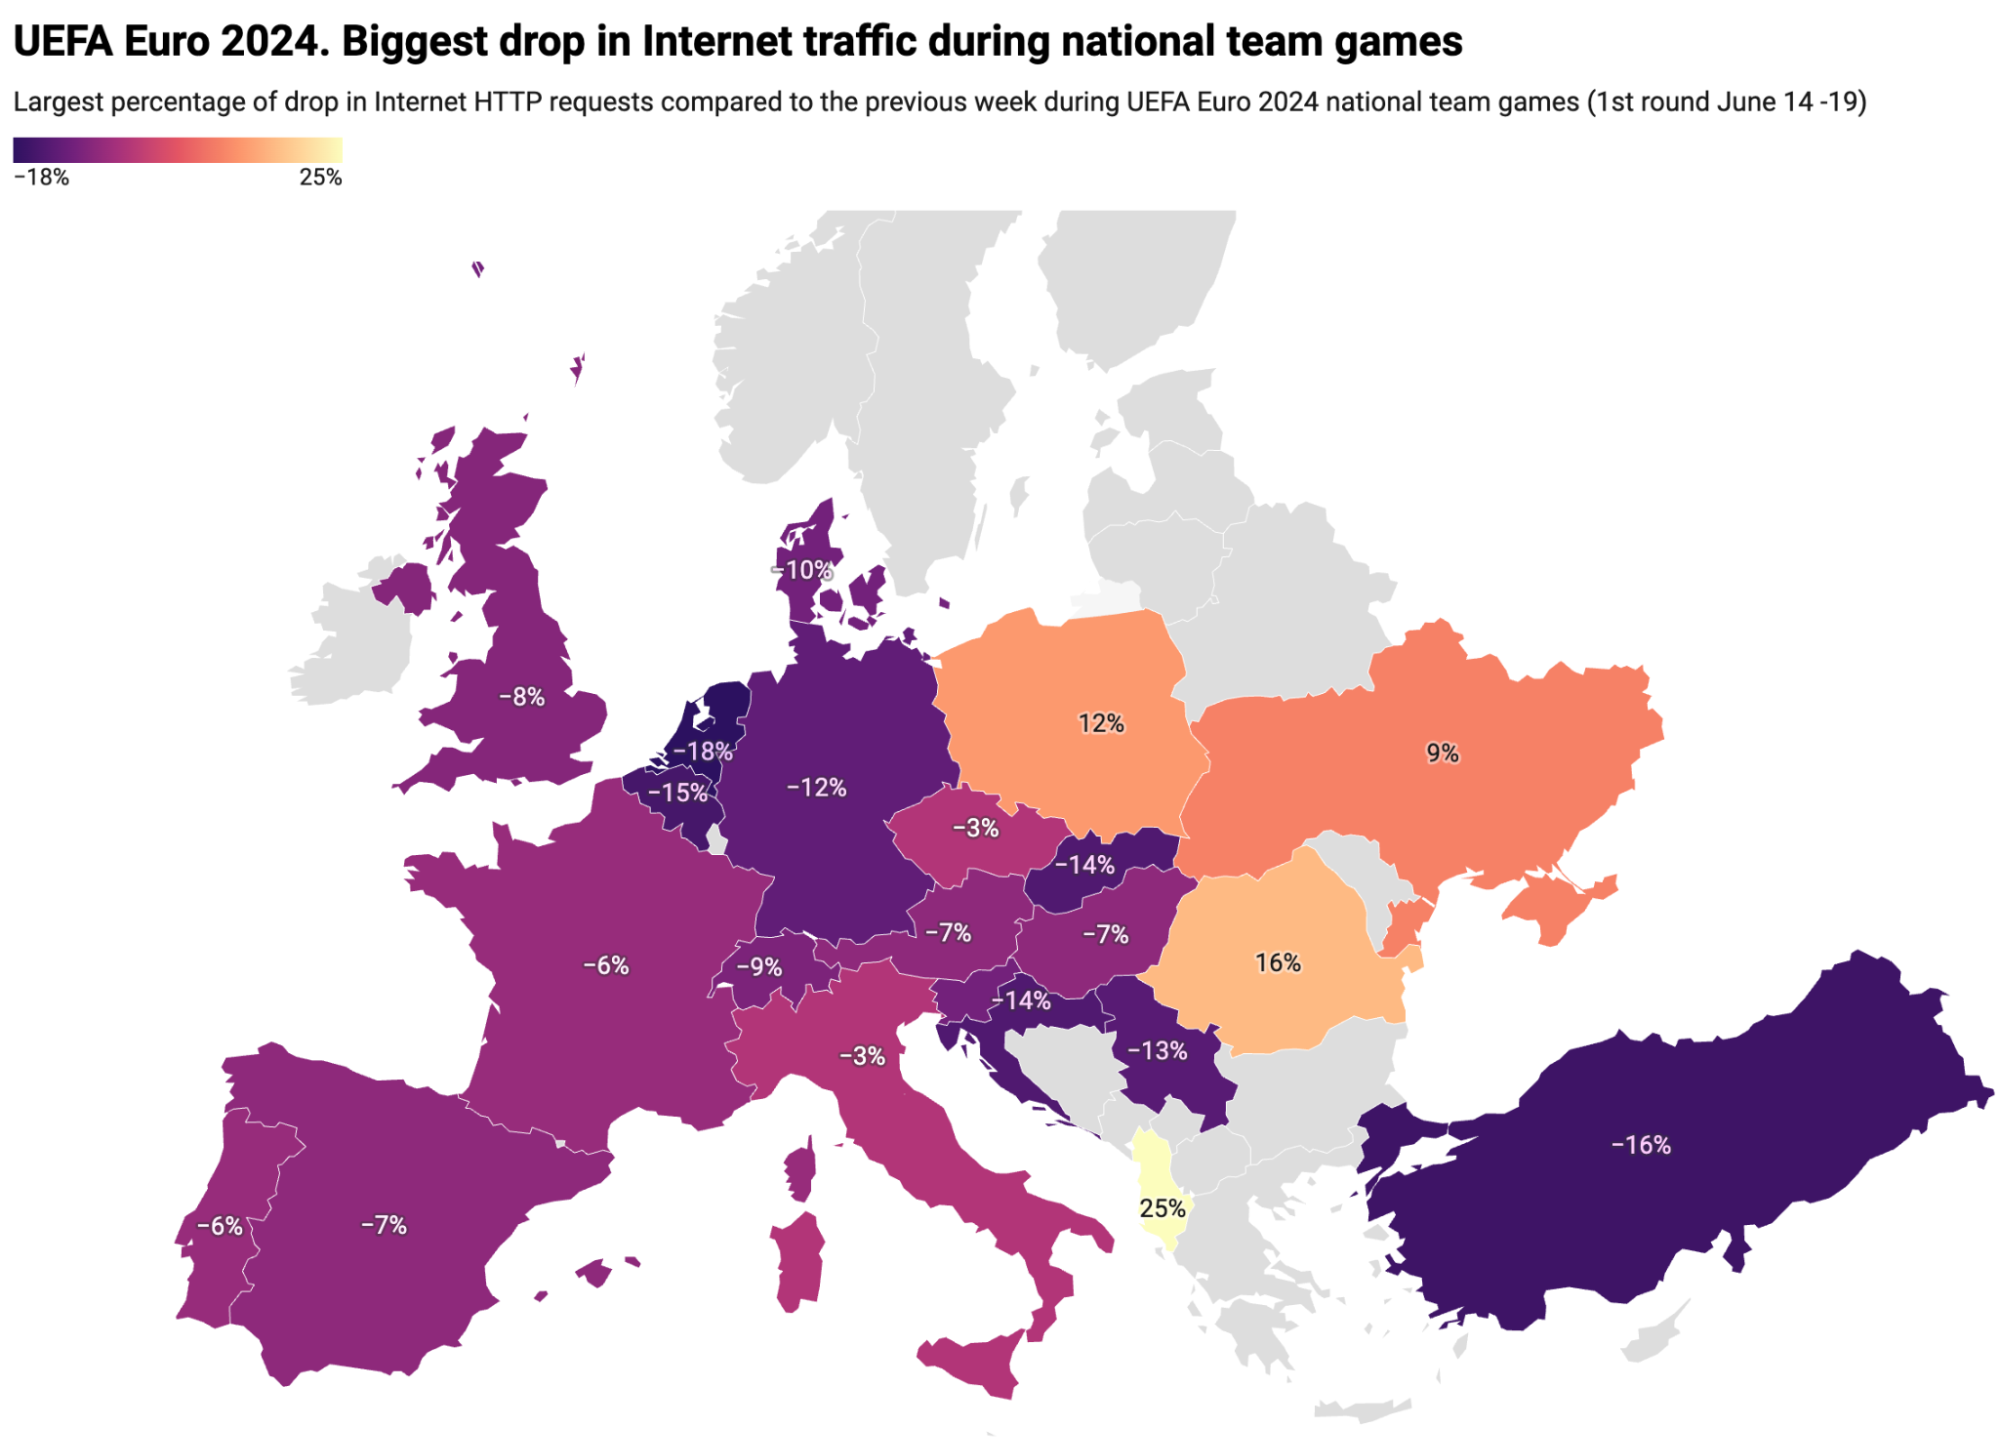
Now, for some game-related Internet trends: the Netherlands, Turkey, Belgium, Croatia, Slovakia, Serbia, and host Germany were the countries where their national team games had a significant impact on requests, with a drop of at least 12% compared to the previous week. Western Europe and countries around Germany top the list. The list shown in the map and the table below covers the first round of games among all teams in all six groups, which concluded on June 19, 2024.
Here is the full list, which provides more detail than the map above, showing each country and the percentage decrease (or increase) in traffic as compared to the previous week at the time those countries’ national team games were occurring.
Country
Increase/ decrease traffic
Game day/hour (UTC)
Opponent
Netherlands
-18%
June 16, 13:00
Poland
Turkey
-16%
June 18, 16:00
Georgia
Belgium
-15%
June 17, 16:00
Slovakia
Croatia
-14%
June 15, 16:00
Spain
Slovakia
-14%
June 17, 16:00
Belgium
Serbia
-13%
June 16, 19:00
England
Germany
-12%
June 14, 19:00
Scotland
Denmark
-10%
June 16, 16:00
Slovenia
Slovenia
-10%
June 16, 16:00
Denmark
Switzerland
-9%
June 15, 13:00
Hungary
England
-8%
June 16, 19:00
Serbia
Georgia
-8%
June 18, 16:00
Turkey
Austria
-7%
June 17, 19:00
France
Hungary
-7%
June 15, 13:00
Switzerland
Spain
-7%
June 15, 16:00
Croatia
France
-6%
June 17, 19:00
Austria
Scotland
-6%
June 14, 19:00
Germany
Portugal
-6%
June 18, 19:00
Czechia
Italy
-3%
June 15, 19:00
Albania
Czechia
-3%
June 18, 19:00
Portugal
Ukraine
9%
June 17, 13:00
Romania
Poland
12%
June 16, 13:00
Netherlands
Romania
16%
June 17, 13:00
Ukraine
Albania
25%
June 15, 19:00
Italy
Albania, Romania, Poland, Ukraine, and Slovenia were the only countries with an increase in HTTP requests during games. England (-8%) and Scotland (-6%) both have similar drops in requests during their national team games.
We’ve also noticed looking at our country-related HTTP data around games that social media services usually go up during half-time and before and after these national team games. As expected, traffic to websites in categories like AI chatbots, ecommerce (though some see increases during halftime), productivity tools, and business and financial services tends to decrease during Euro 2024 games.
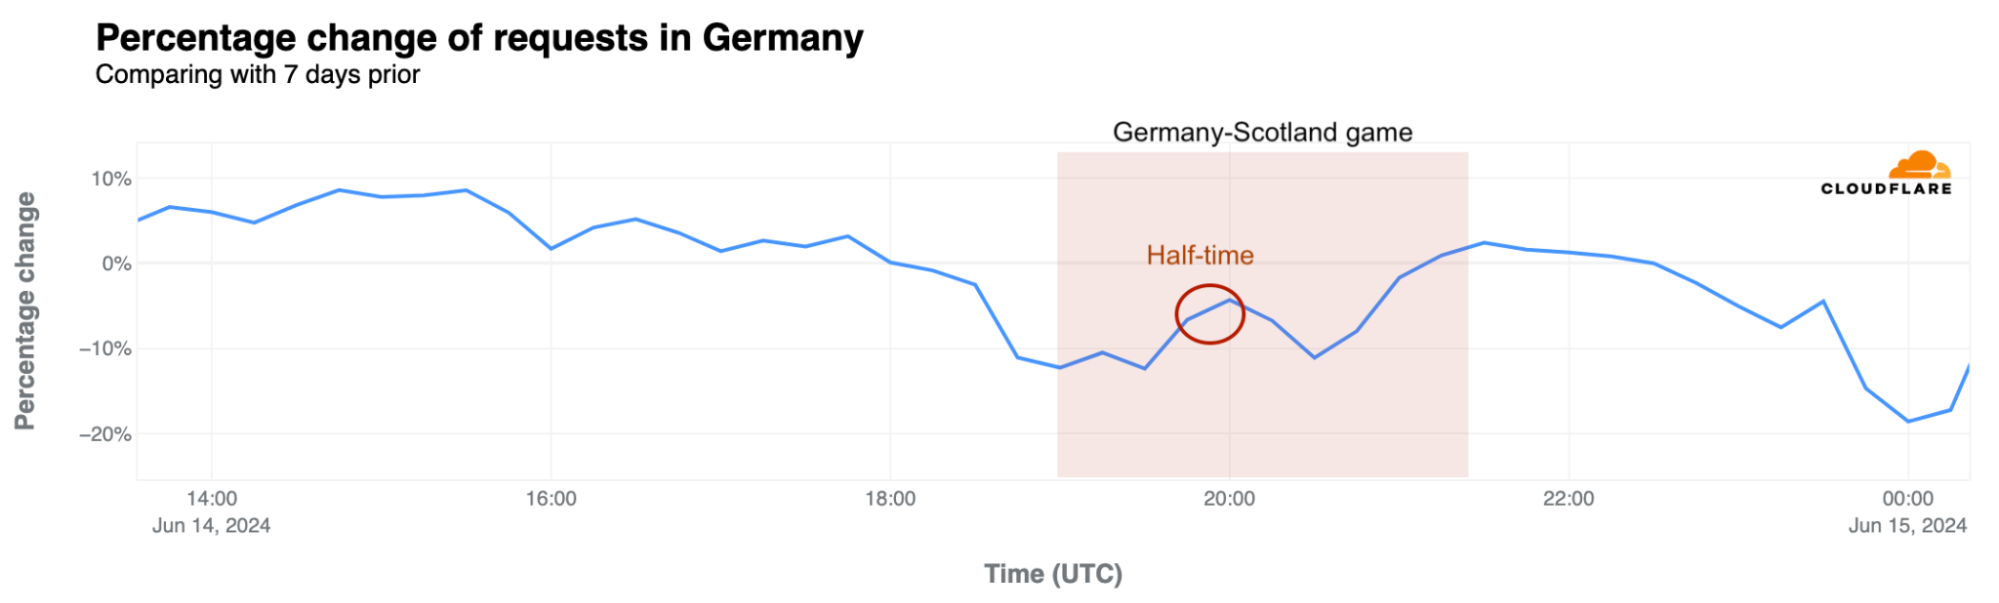
First day of competition: Germany-Scotland
Another important perspective is focused on the first day of competition. On June 14, 2024, Euro 2024 kicked off in Germany. How was Internet traffic impacted in the country?
When the ceremony started around 18:45 UTC (20:45 local time), by as much as 11%, deepening to a 12% drop from the previous week when the first game between Germany and Scotland began at 19:00 UTC (21:00 local time). Traffic briefly recovered during halftime to only 4% below the previous week’s levels, but fell again to 11% below the prior week during the second half. At 00:00 UTC (02:00 local time), requests dropped as much as 19% from the previous week, in a night of celebration for German fans.
The second round of games in the Euro 2024 group phase is already underway. We’re keeping an eye on country-related trends after games on X.
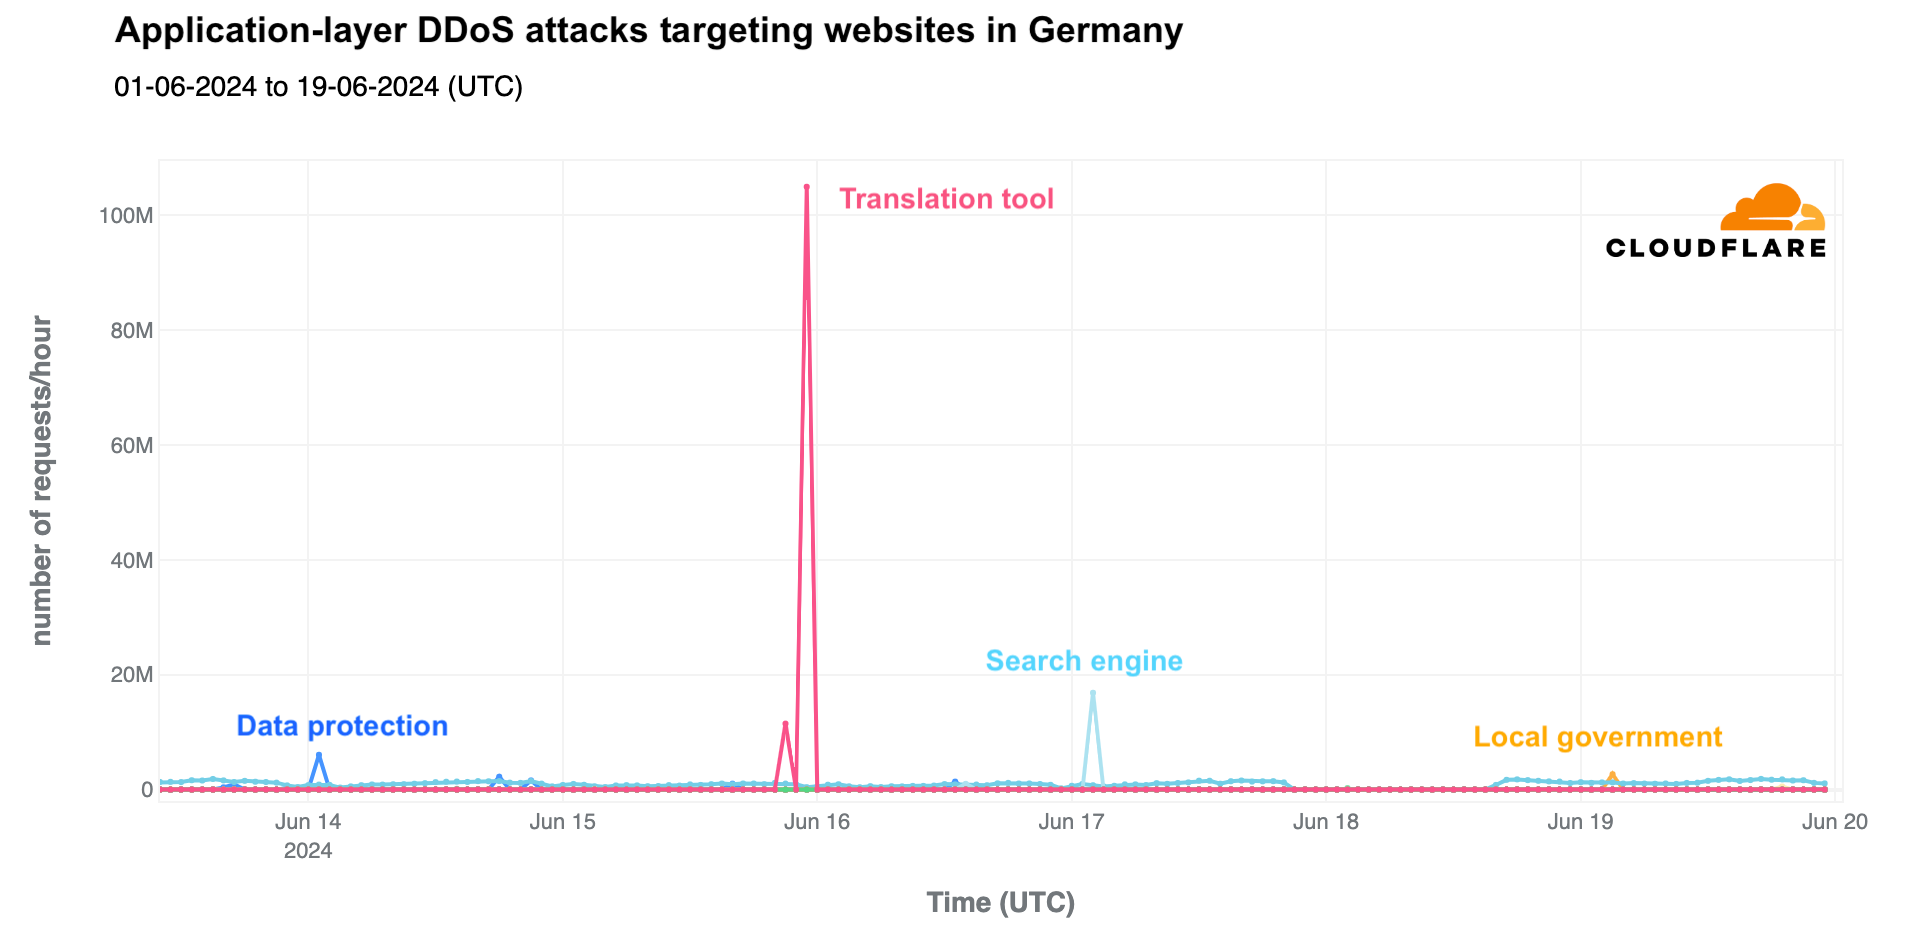
An attacks perspective
During the UEFA Euro 2024 event in Germany, we’ve observed several attacks in the country. These included application layer DDoS (Distributed Denial of Service) attacks targeting various websites, such as a translation tool, a data protection tool, a search engine, and a local government website. The most significant DDoS attack occurred on June 15, 2024, the day after the competition started, targeting the translation tool. This attack reached 105 million requests per hour at 23:00 UTC and lasted about two hours with two distinct spikes.
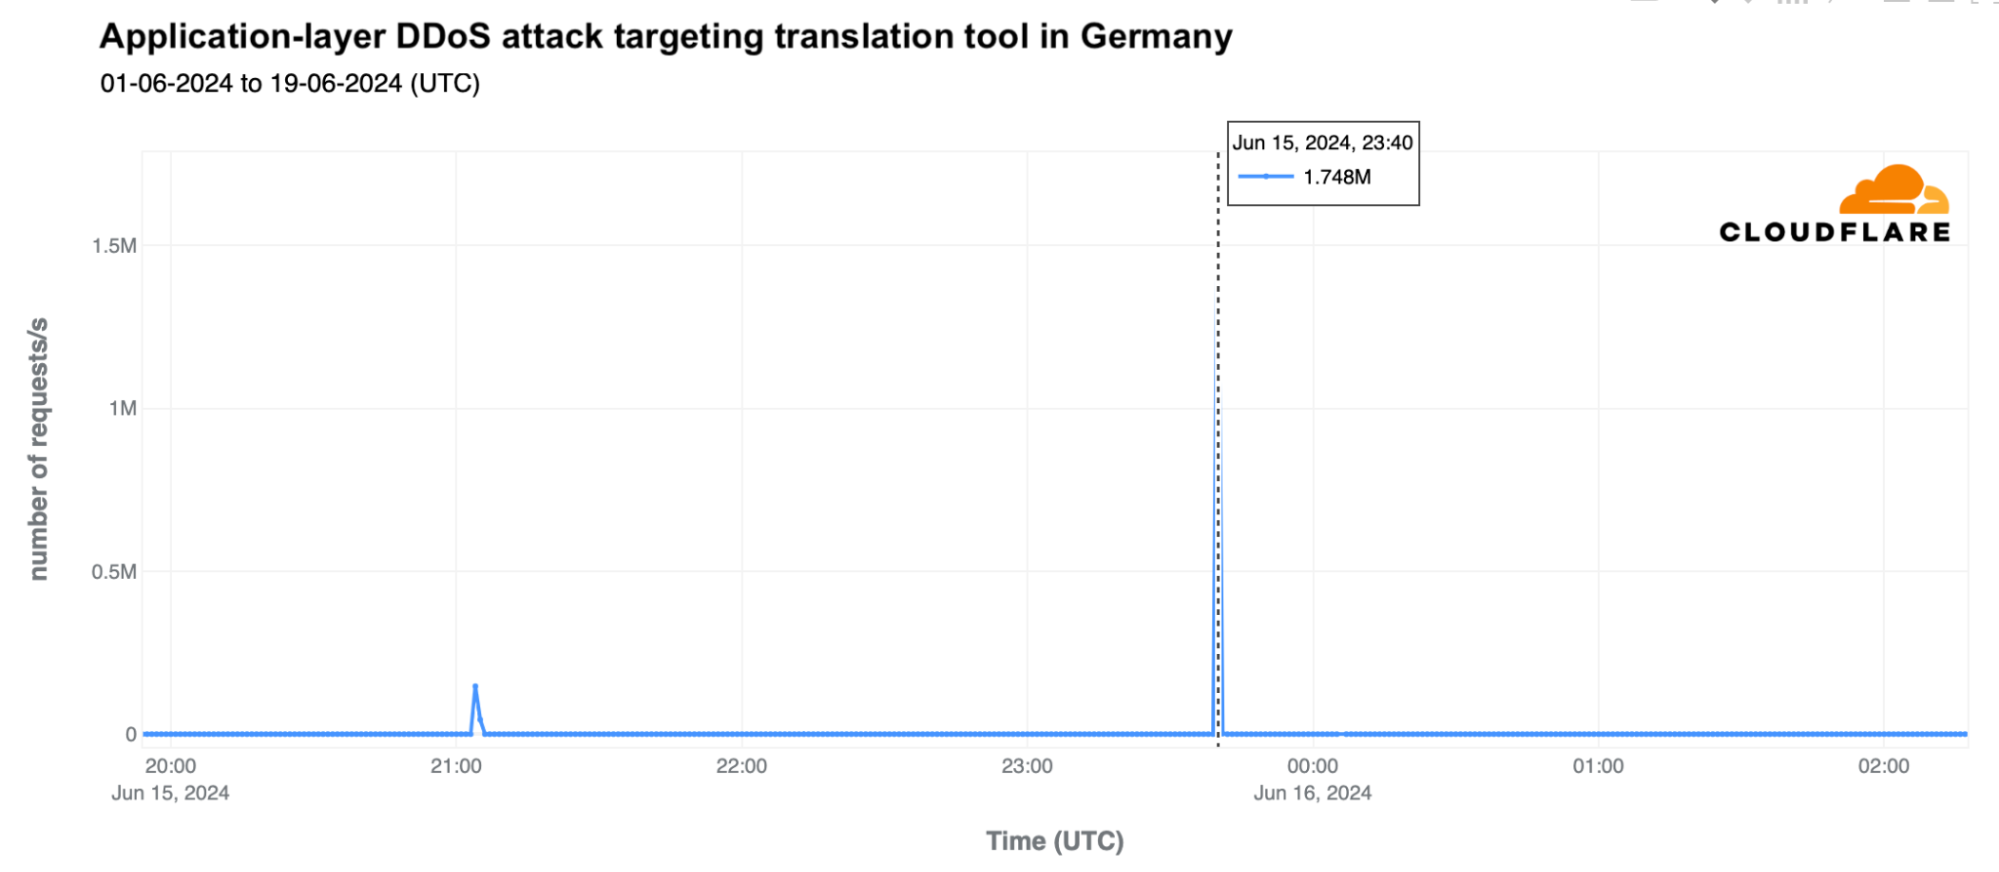
Looking more closely at the attack on the translation tool, it peaked at 1.74 million requests per second (rps) at 23:40 UTC, following an initial spike of 147,000 rps at 21:04 UTC.
Conclusion
Football is incredibly important to Europeans, enough to cause nationwide Internet traffic to drop when fans are rooting for their national teams in a UEFA Euro 2024 game broadcast on national TV.
Despite the popularity of online services like live score apps, sports news sites that track every minute of each game, and betting services enhanced with new visual tools and stats, national team football (or soccer) still significantly diverts attention away from the Internet.
We will continue to monitor UEFA Euro 2024 Internet trends. Based on the results of a poll we conducted on X, we plan to publish daily updates about games and their impact on countries whose national teams are playing that day. Follow us there.
At the
2024 Linux Storage,
Filesystem, Memory Management, and BPF Summit, Wedson Almeida Filho and
Kent Overstreet led a combined storage and filesystem session on using Rust
for Linux filesystems. Back in December 2023, Almeida had posted
an RFC patch set with
some Rust abstractions for filesystems, which resulted in some disagreement over the approach. On the
same mid-May day as the session, he posted
a second version of the RFC patches, which he wanted to discuss along with
other Rust-related topics.
Популизмът е феномен на нашето време, който, очаквано, остана тема на деня и след изборите за европейски и български парламент на 9 юни 2024 г. Изненадата от възхода на крайнодесните партии, от загубите на леви и зелени, от сменените приоритети в Европа, от феномена „Величие“ в България, от ниската избирателна активност и политическата апатия на българските граждани запълни анализаторското време.
Архитектурата остана в периферията, естетически деполитизирана или сведена до махленски скандали с велоалеи в градската среда. А не бива. Важно е да подредим и нея в голямата картина, защото тя помага да се направят връзки между на пръв поглед несвързани явления. И ни подготвя за това, което предстои.
Архитектурният популизъм и у нас, както и навсякъде, избуява неконтролируемо около избори. Особено около местни избори, но не само.
Ще разкажа няколко архитектурни истории от България, които са от два периода, наситени с избори: 2018–2019 и 2023–2024. Част от тях, особено по-старите, днес може да изглеждат безобидни. Но те бяха скандални за времето си и е добре да запазим чувствителността си към абсурдното, независимо каква част от ежедневието ни заема то днес.
#HUBAVOE
През 2018 г. Елена Филипова и Димитър Караниколов от българското студио за архитектурни визуализации „Мешрум“ направих един колаж, в който бяха събрани всички драми на българското общество около архитектурни казуси от последните години – строежи, ремонти, фалшиви крепости, паметници.
По онова време България председателства Съвета на Европа, НДК е ударно ремонтиран, паметникът пред него е разрушен, за да не загрозява, на следващата година предстоят местни избори, навсякъде кипят ремонти, тържествено се откриват обекти. Появява се хаштагът #HUBAVOE, който маркира всички безумия в градската среда, които сякаш се случваха ежедневно.
Колажът тогава беше придружен от ироничен текст в стила на „Не!Новините“, написан от Димитър Караниколов и Наталия Атанасова (също архитект):
Независими експерти от английската компания Meshroom разработиха специален софтуер, който на базата на сложни изчисления е в състояние да визуализира как ще изглежда София след 10 години.
… От изображението става ясно, че през 2028 г. градската управа в крайна сметка вече е успяла да се справи с най-големия проблем на столицата – трафика, използвайки изключително напредничав похват – пълно и повсеместно обезлюдяване поради влошаване на условията за живот. По този начин от града трайно са премахнати всички превозни средства, заедно с прилежащите им хора. Чиста работа!
… В самата столица са останали предимно кучета от породата Шопски самоед, които са оцелели благодарение на факта, че се хранят основно със строителни отпадъци, дребен чакъл и по-слабите представители на вида си.
Вече повече от 15 години в София текат непрестанни ремонти. Всяка нова партия, която идва на власт, ремонтира ремонтите на предната и започва нови. Малкото останали жители на столицата вече не вярват на никого.
… Софийска община, в отчаян опит да спечели симпатиите на гражданите и студентите по архитектура, решава за годишнината от разрушаването на паметника „1300 години България“ да го изгради наново. Паметникът е сглобен набързо и некачествено от итонг, дъвка и някакво много скъпо китайско тиксо. За да прикрие плачевния резултат, общината го опакова с оранжево платнище и въжета, като в хитър пиар ход обявява, че това е проект на Христо Явашев. Кристо, разбира се, отрича да има каквото и да е било общо с проекта.
Пет години по-късно нещата не са много различни. „Горещите“ архитектурни теми пак са събаряне на паметници, улични ремонти, коли и пешеходци, единствено хуморът сякаш е по-малко, а меметата в социалните мрежи са далеч по-скучни.
И сега е време за конкретните истории. Тях можем да разделим в три групи според различните проявления на елементарен политико-културен популизъм у нас, който засяга архитектурата и градската среда: флирт с общественото мнение, националистически кич и игри с паметта.
Флирт с общественото мнение
Архитектурата може да бъде използвана като мощен популистки инструмент за флиртуване с обществото, който успешно да прикрива управленски и комуникационни неудачи.
През 2018 г. един на пръв поглед стандартен и всъщност наложителен ремонт се превърна в социален експеримент, в който едновременно се тестваха способността на общинската администрация да реагира под стрес и властта на българските граждани в социалните мрежи.
„Графа“
Ремонтът на „Графа“ се превърна в символ на архитектурно-строителния провал и в устойчива фраза, която започва да се използва, за да етикетира всички проблеми, свързани с ремонти и обществени поръчки в страната. Властта паникьосано променяше решенията си – със или без трамвайни разделители, с черен гранитен фонтан или не, с призматични гранитни или с кръгли бетонни трамвайни разделители и т.н. – в зависимост от реакциите и ироничните колажи в социалните мрежи. Въпреки това обществото така и не остана доволно.
Къде тук е популизмът? Замисълът беше след ремонта през 2018–2019 г. „Граф Игнатиев“ да стане първата споделена улица в България. Такава беше първоначалната идея на спечелилия още през 2015 г. конкурсен проект на архитектурното студио АДА, това бе и посоката, в която по принцип уж цели да се развива Столичната община, особено след сътрудничеството си с датския урбанист Ян Геел. За тази цел ремонтът включваше не просто смяна на настилките, а изливане на нова плоча, която да уеднакви нивата по цялата улица.
Именно тези дейности драстично забавиха целия ремонт. Но в същото време 60-сантиметровите чугунени боларди обезсмислиха опита за създаване на съвременна споделена улица, както и целия ремонт, премахването на бордюрите и изливането на новата плоча, включително възможността София да получи публично пространство с равномерна настилка, по което движението да разчита на друг вид организация от стандартната.
По-голямата част от публичните пространства в София притежават ярка индивидуалност, но организацията им невинаги подчертава характеристиките на сградите, техните функции или дейностите на хората, които ги използват. […] Качеството на публичното пространство, включително около историческите сгради, силно се влошава от решенията, ориентирани към трафика и потребностите на автомобилите, а не на хората – колчета, грамадни пътни табели и маркировки на паркингите.
„Графа“ срещу „Патриарха“
Днес скандалите около ремонта на „Графа“ през 2018 г. изглеждат смешни и дребнави. Всички отдавна са забравили драмите около колчетата, фугите и цвета на плочките пред църквата „Свети Седмочисленици“, защото 2024 г. донесе нов „проблем“ – велоалеите по бул. „Патриарх Евтимий“ и новата организация на паркирането около НДК. Ироничното е, че тези промени са още по-стари от доклада на Ян Геел. Програмата за развитие на велосипедния транспорт на територията на Столична община е поръчана от Направление „Архитектура и градоустройство“ към общината преди почти 10 години, а велосипедното трасе по „Патриарха“ е с проектна готовност още за периода 2016–2019 г.
Ако някой реши да реформира, тутакси изникват протести от различни страни. Това е глобална тенденция, не е характерна само за България. […] Преди време имаше например план за реконструкция на Париж, който пропадна след протести и критики, а наблюдатели заключиха: „Ако днес се беше родил барон Осман, градът и досега щеше да си е със средновековните улички.“
Националистически кич
Архитектурата лесно се поддава на популистката реторика на нашето време, защото отдавна съществува откъсната от сложните хуманитарни дебати, вследствие на което е и недостатъчно подготвена за тях. Това лесно води до необосновани проекти, граничещи с националистически кич, които могат да се превърнат в инструмент в една далеч по-голяма политическа игра.
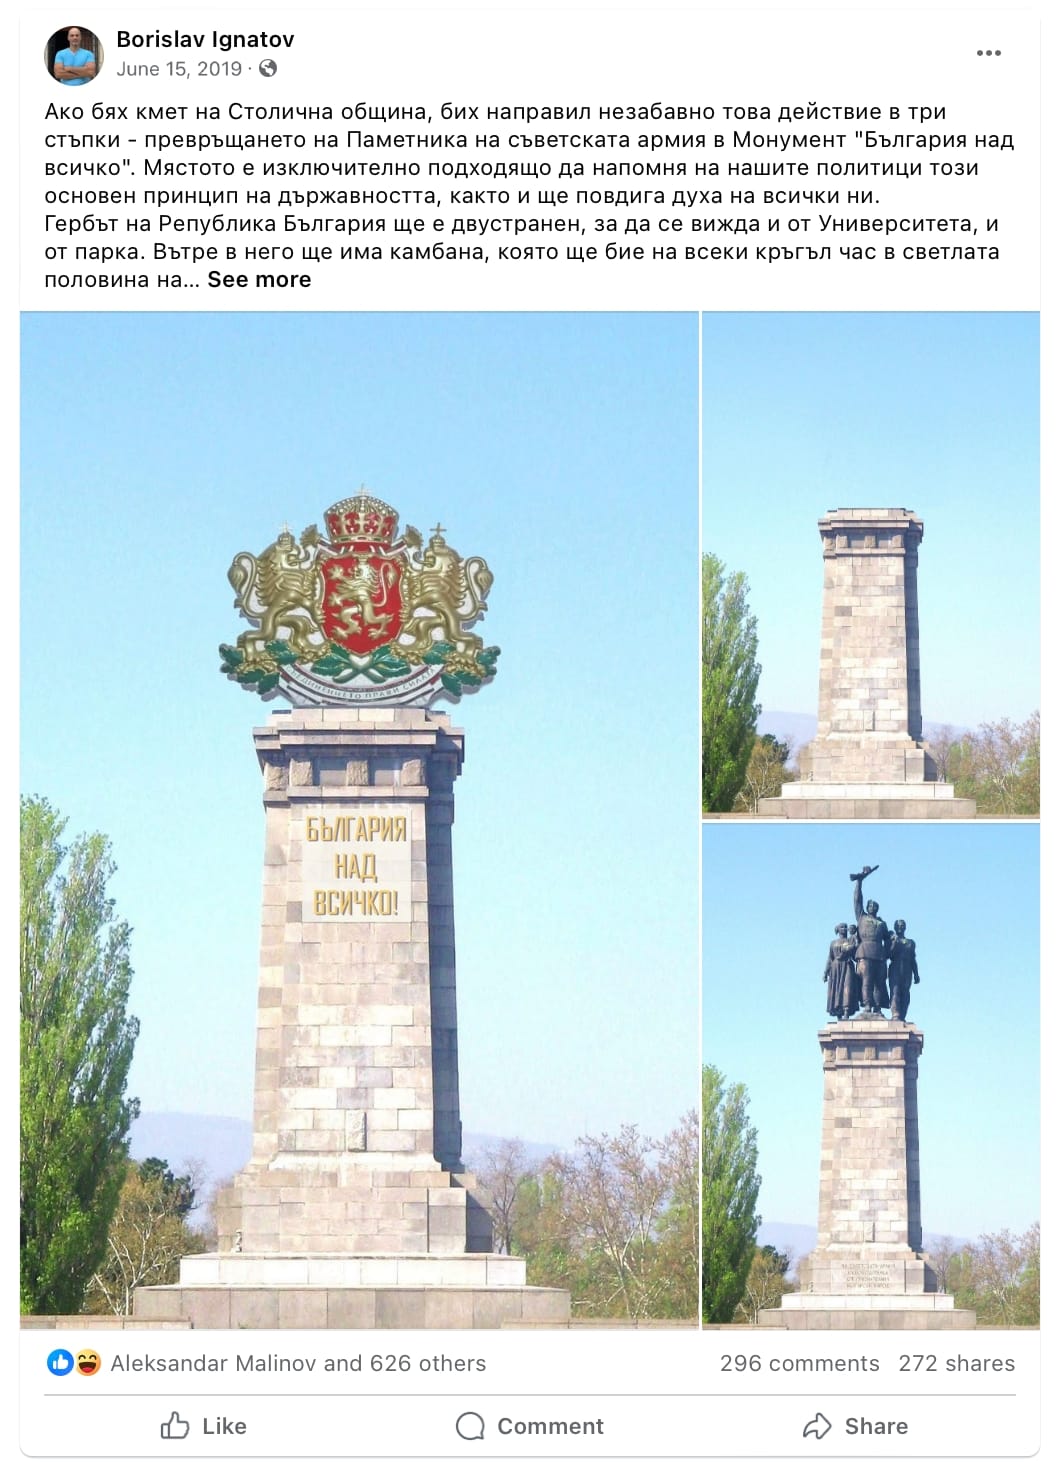
„България над всичко“
През юни 2019 г., няколко месеца преди местните избори, неочаквано появил се архитектурен проект фокусира за пореден път вниманието върху прословутата тема „Какво да правим с Паметника на Съветската армия в София?“. Тогавашният председател на Камарата на архитектите в България Борислав Игнатов публикува в личния си профил си във Facebook три визуализации на нов монумент „България над всичко“ – триизмерен герб на мястото на фигурите върху пиедестала на Паметника на Съветската армия, снабден със скрита камбана, която да звъни на всеки кръгъл час като във възрожденска часовникова кула.
Предложението бързо набра популярност, като в рамките на няколко дни събра стотици споделяния и коментари – доста за публикация на личния профил на относително непопулярен експерт, който в онзи момент все още не беше публична личност и чието онлайн влияние достигаше аудитория, далеч по-малка от тази на истински инфлуенсър.
Реакциите, очаквано, бяха полярни:
Този срам за България трябваше отдавна да се демонтира!
Промяната на паметника няма да промени историята. По-добре да се фокусира тази енергия в образованието на младите. Предложението е изключително нелепо като визия и концепция. 2019 година е все пак.
Две седмици по-късно, на 30 юни, след поредица дискусии и участия на арх. Игнатов в национални медии, включително в предаването „Лице в лице“ по bTV, авторът публикува отново в личния си Facebook профил ново предложение със значително променена идея – запазва паметника непокътнат, но го закопава в зелена могила, която представлява изкуствена структура, покрита с дървета и пешеходни маршрути и завършена с наблюдателна площадка на върха.
Борислав Игнатов мотивира новия проект така: „След като толкова много хора смятат, че паметникът е много важна част от нашата история, то той се запазва непокътнат. Нещо повече – запазва се и от разрушаващото влияние на природата и градската среда. Това става, като около паметника се изгражда саркофаг за негова защита, подобен на гробницата в Свещари. Така паметникът става експонат в собствено пространство.“
Това предложение се представи малко по-слабо откъм социални реакции. Коментарите обаче отново бяха напълно противоположни.
Два месеца по-късно, на 14 август, арх. Борислав Игнатов бе издигнат за кандидат-кмет на София от обединението „Демократична България“ и спечели малко над 12%. После той стана общински съветник в СОС като представител на същата коалиция, която го издигна, а днес изглежда напълно изоставил политическата си кариера.
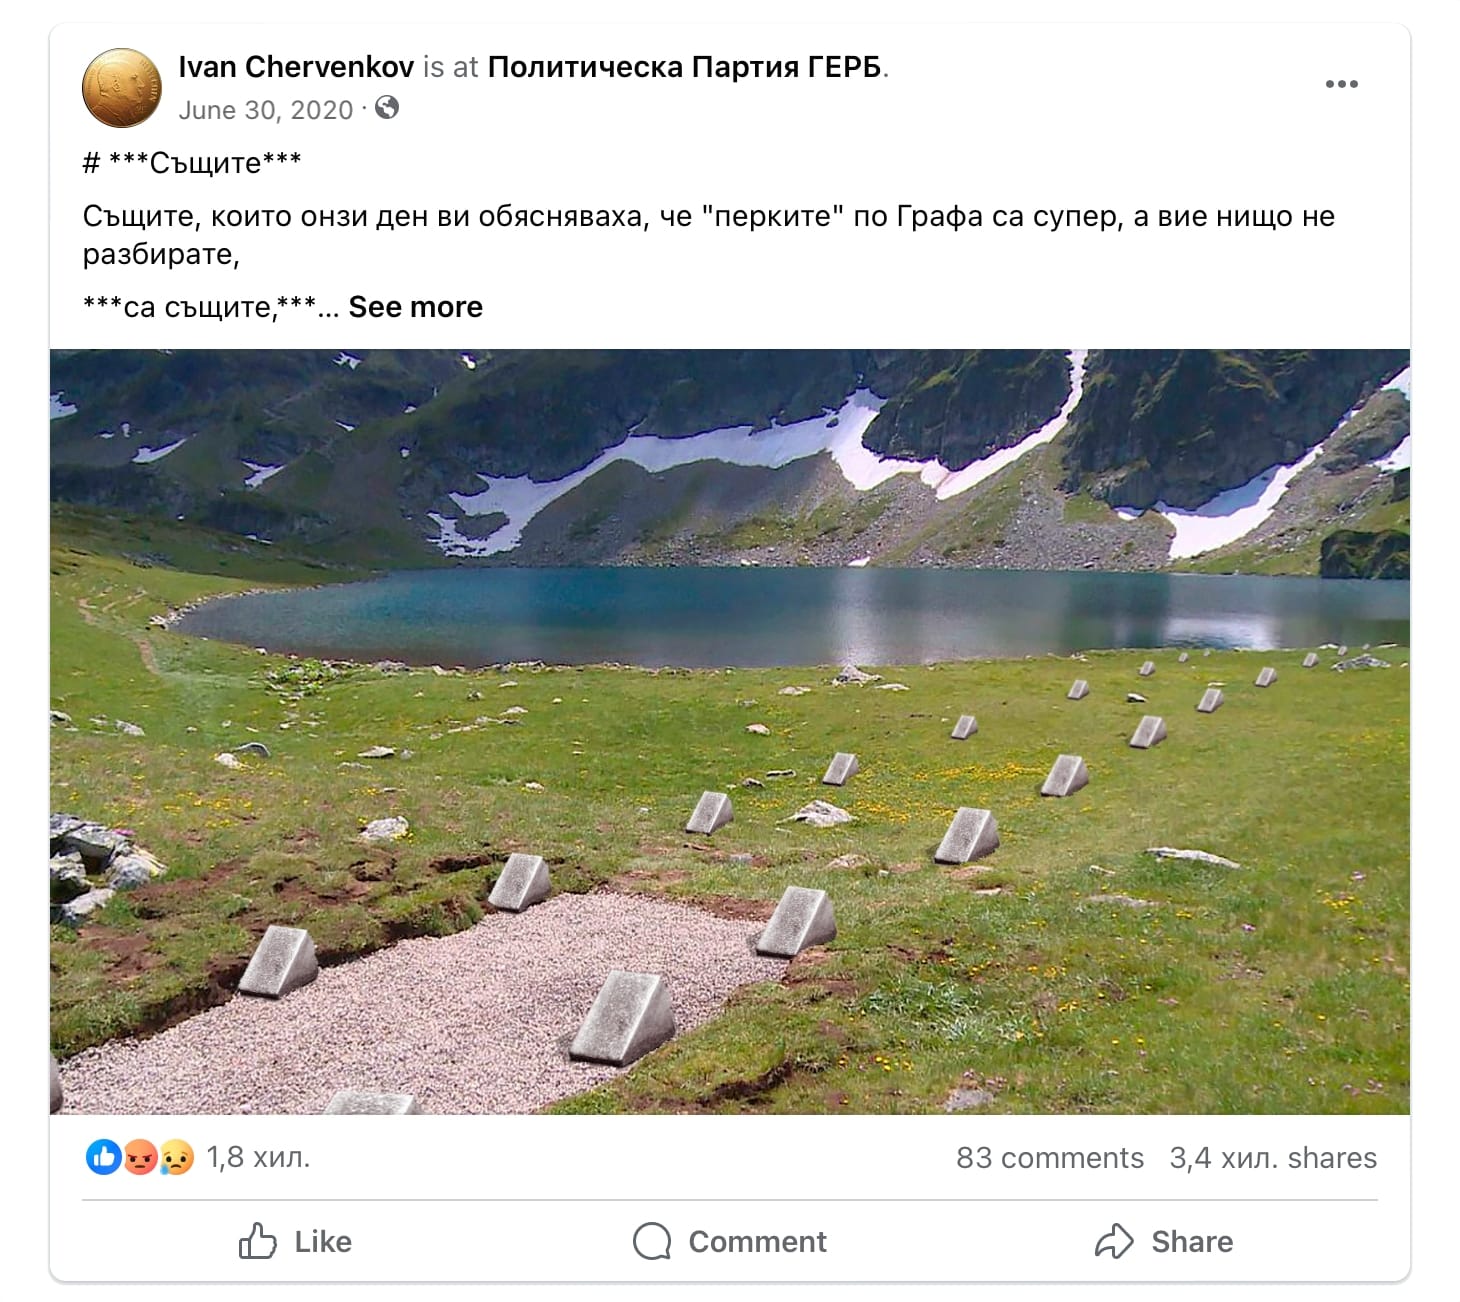
През 2024 г. темата с националистическия кич в центъра на София изглежда умилително остаряла, защото страната има нов архитектурно-националистически феномен – партия „Величие“ и създадения от нея „Исторически парк“ в община Ветрино.
„Исторически парк“ и фалшивото наследство
„Исторически парк“ не е само секта, нова националистическа или проруска формация или финансова пирамида. Това е и учебникарски пример за фалшиво наследство.
Когaто някой тръгне да вдига многометрови статуи на тракийски стрелци на входа на чисто нов „дисниленд“, пълен с фалшиви крепости, форуми, базилики и гробници, винаги има нещо гнило.
С тези думи още през 2019 г. номинирахме „Исторически парк“ край Варна за архитектурен бъг на годината на фикционалните годишни архитектурни награди WhATA Awards. През същата година, в края на юни, във варненското село Неофит Рилски отвори врати рекламираният като най-голям исторически парк в света, част от мащабна туристическа инициатива. Дошлите на откриването обаче се оказаха на строителна площадка.
Дружеството, което стои зад парка, набира пари след емитиране на 1 млн. акции, които обаче не се предлагат публично на фондовата борса. Разследване на „Капитал“ показа съмнителни схеми за привличане на нови акционери, макар изпълнителният директор Ивелин Михайлов да твърди, че фирмата не продава акции, а набира съдружници. Самата емисионна цена на акциите, изглежда, се определяше именно така – прогнозната цена на проекта, разделена върху един милион акции. Цялата история още тогава миришеше на 90-тарска пирамида, поръсена с малко напомпан патриотизъм и евтини имитации.
Изобщо трябва да сме подозрителни всеки път, когато се сблъскаме с бутафории и прояви на националпопулизъм. Обикновено имаме или зле прикрити комплекси, или нездравословна любов към величие, или склонност към финансови измами. А както се оказва през 2024 г. – всичко накуп плюс политически амбиции и популизъм.
Игри с паметта
И последно, няма как да говорим за архитектурен популизъм, без да стигнем до толкова рисковите игри с паметта, за които примерите са много и които сякаш са се превърнали в част от ежедневието ни. Съветски паметници, паметници на царе и национални герои, войнишки паметници – манията да говорим, спорим и строим паметници сякаш е в неконтролируем възход.
А всъщност няма нищо по-невидимо от паметника, както беше казал през 30-те години на ХХ в. немският писател Роберт Музил. И съдбата на паметниците днес е само най-видимата част от един по-глобален феномен:
наследството, сред което живеем, е все повече и по-категорично противоречиво – при това по много и най-различни начини.
Трудна работа е намесата в местата на паметта. Особено като имаме предвид, че архитектурата е пословично бавна, но е също толкова пословично дълготрайна.
Ако все пак приемем архитектурата и като част от културата, то трябва да подчертаем, че тя е малко по-различна област от всичко онова, което обикновено е предмет на оперативната културна критика. Човек може да избира музиката, която да слуша, филмите, които да гледа, книгите, които да чете, театралните постановки, на които да отиде или не. Но архитектурата е незаобиколима, навсякъде около нас.
Живеейки в урбанизирана среда, хората живеят сред архитектура, която им е наложена – често от сили, над които малко от тях имат реален контрол. Затова в съвременното хоризонтално общество на социални балони, активни граждани в социалните мрежи и умиращи авторитети е още по-важно да се изолира, анализира и блокира архитектурният популизъм във всички негови форми и проявления.
Security updates have been issued by AlmaLinux (firefox, ghostscript, idm:DL1, and thunderbird), Debian (php8.2 and putty), Mageia (chromium-browser-stable), Oracle (ghostscript and thunderbird), Red Hat (thunderbird), and SUSE (containerd, kernel, php-composer2, podofo, python-cryptography, and rmt-server).
The practice of cheating on exams (or at least attempting to) is presumably as old as the concept of exams itself, especially when the results of the exam can have significant consequences for one’s academic future or career. As access to the Internet became more ubiquitous with the growth of mobile connectivity, and communication easier with an assortment of social media and messaging apps, a new avenue for cheating on exams emerged, potentially facilitating the sharing of test materials or answers. Over the last decade, some governments have reacted to this perceived risk by taking aggressive action to prevent cheating, ranging from targeted DNS-based blocking/filtering to multi-hour nationwide shutdowns across multi-week exam periods.
Syria and Iraq are well-known practitioners of the latter approach, and we have covered past exam-related Internet shutdowns in Syria (2021, 2022, 2023) and Iraq (2022, 2023) here on the Cloudflare blog. It is now mid-June 2024, and exams in both countries took place over the last several weeks, and with those exams, regular nationwide Internet shutdowns. In addition, Baccalaureate exams also took place in Algeria, and we have written about related Internet disruptions there in the past (2022, 2023). However, in contrast to the single daily shutdowns in Syria and Iraq, the Algerian government opted instead for two multi-hour disruptions each day – one in the morning, one in the afternoon – and appears to be pursuing a content blocking strategy, rather than a full nationwide shutdown.
As we have done in past year’s posts, we will examine the impact that these shutdowns have on Internet traffic, but also analyze routing information and traffic from other Cloudflare services in an effort to better understand how these shutdowns are being implemented.
Syria
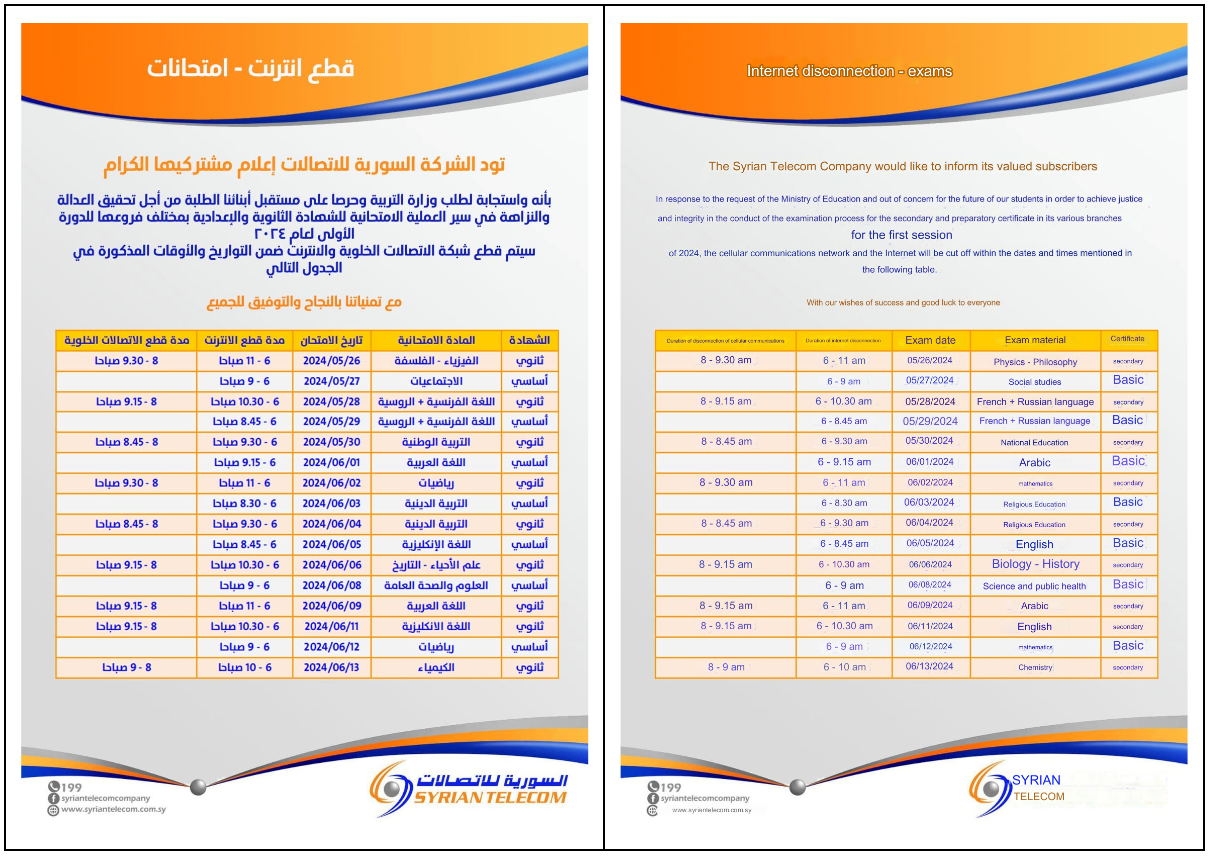
The Syrian Telecom Company, to their credit, publishes an exam schedule on social media, with the image below published to their Facebook page. The English version was created by applying Google Translate to the image. The schedule shows the date & time of each Internet shutdown (“disconnection”), in addition to the subject(s) of that day’s exam(s). In 2024, exams started on May 26, and went through June 13.
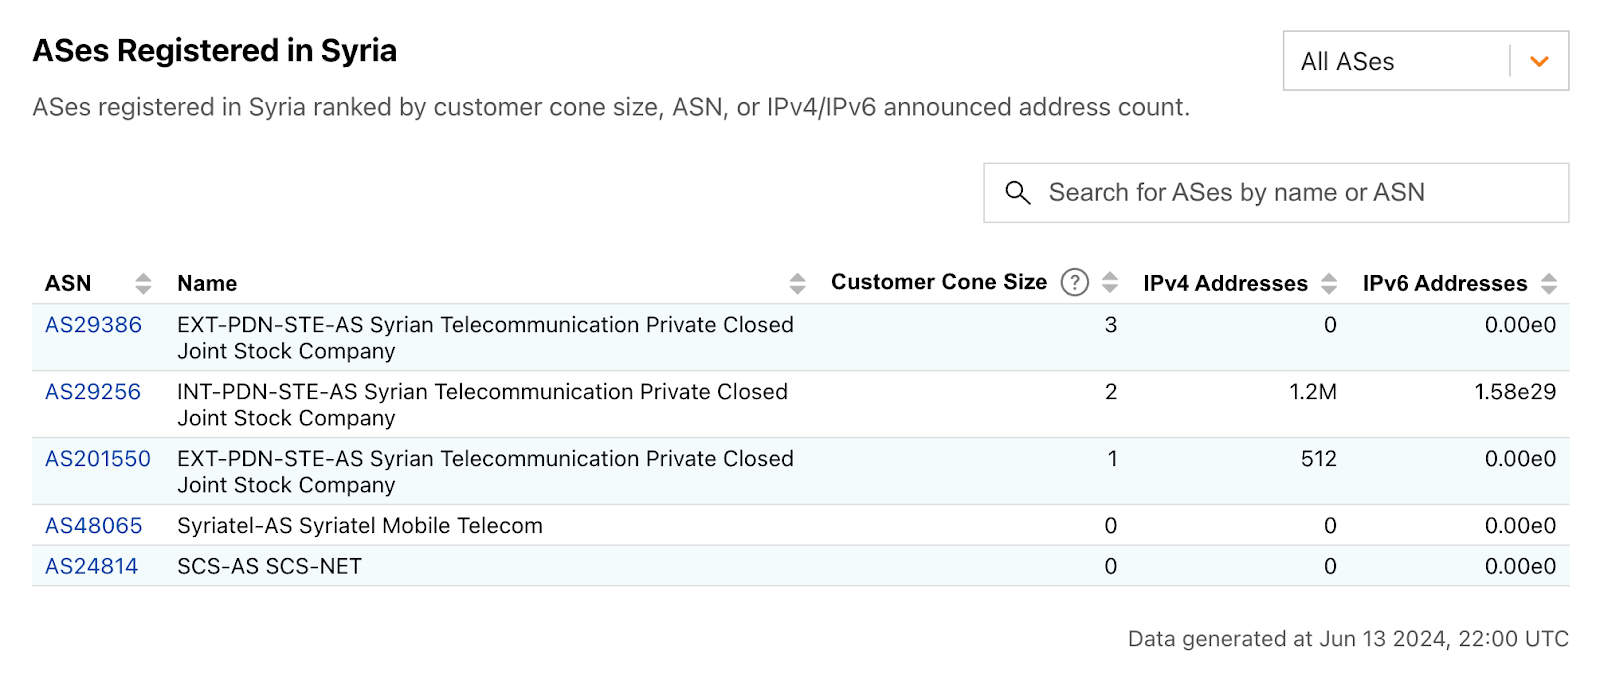
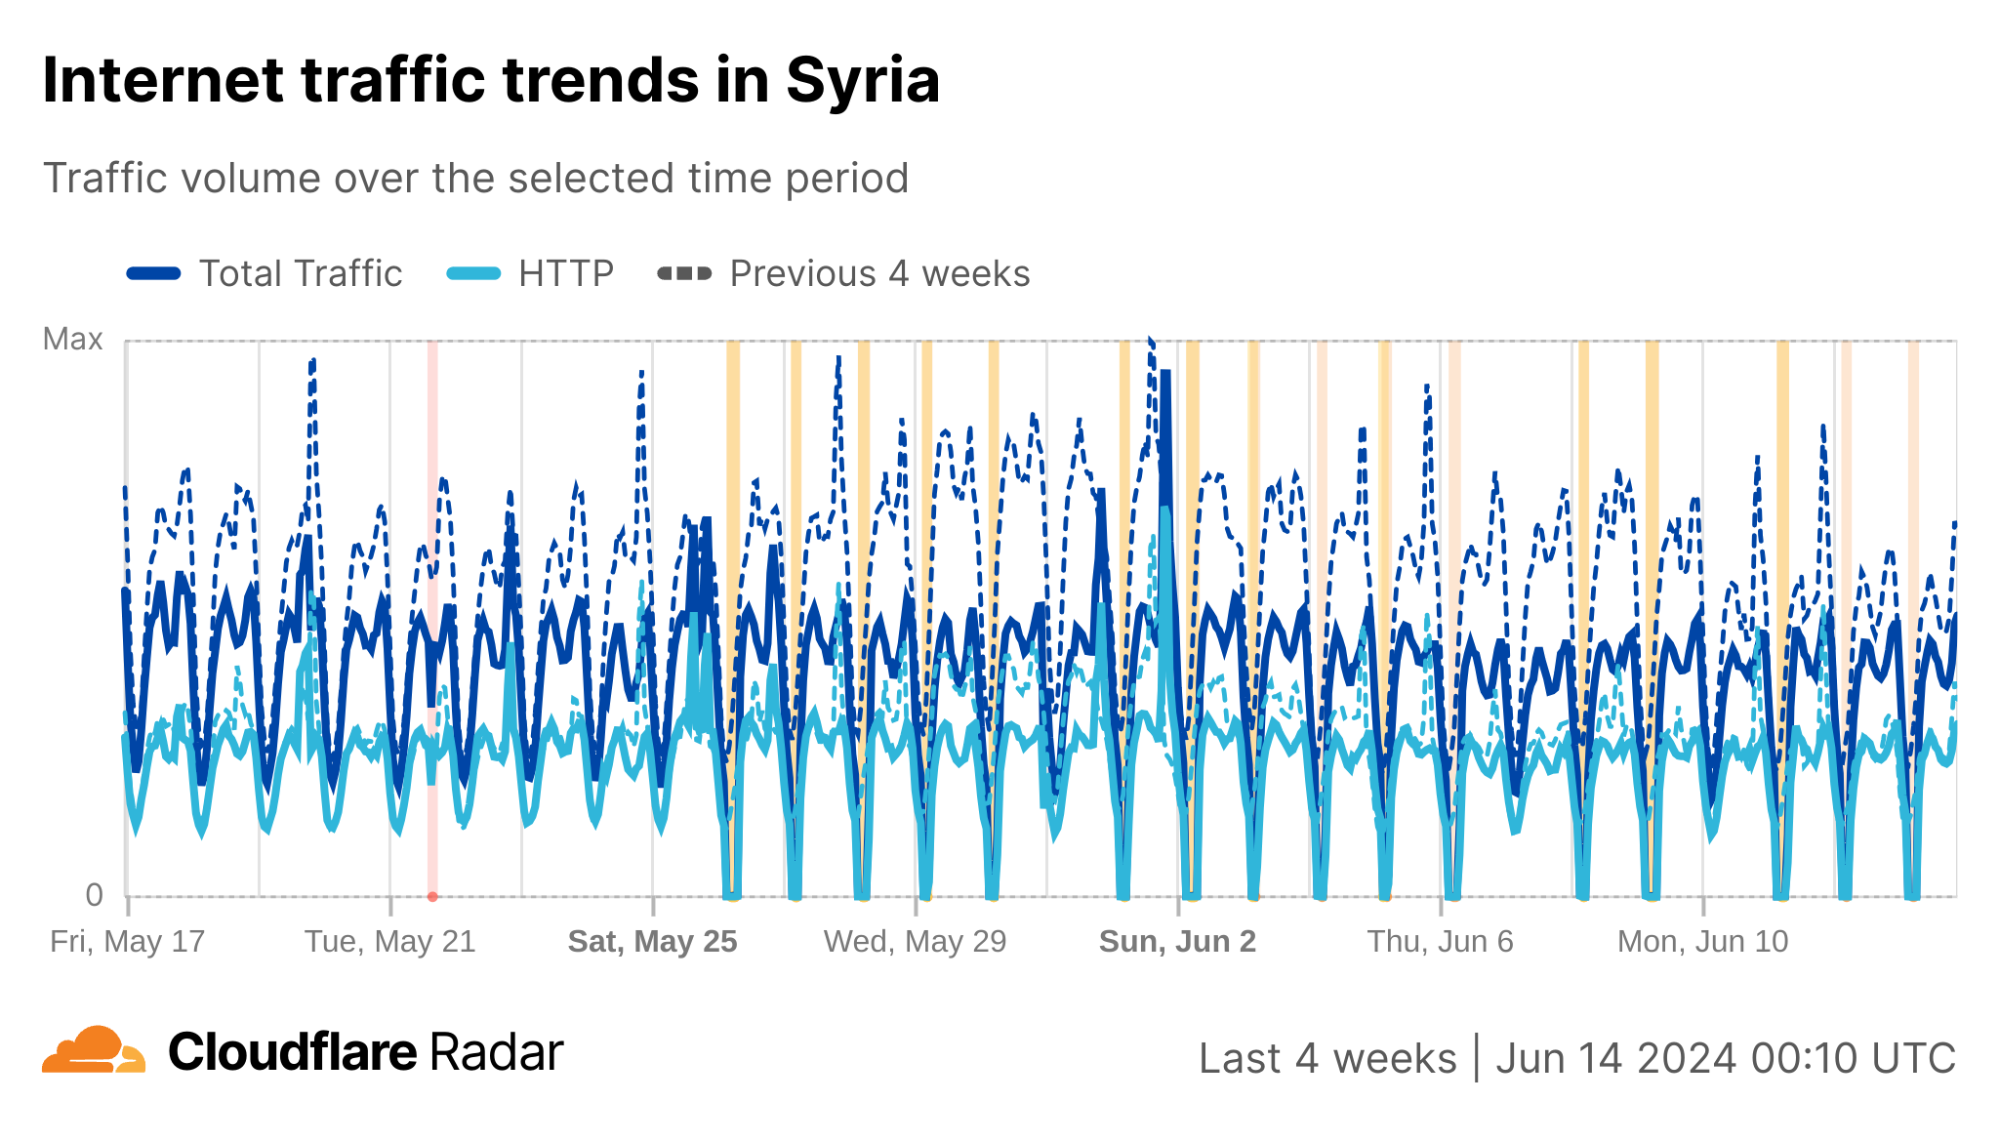
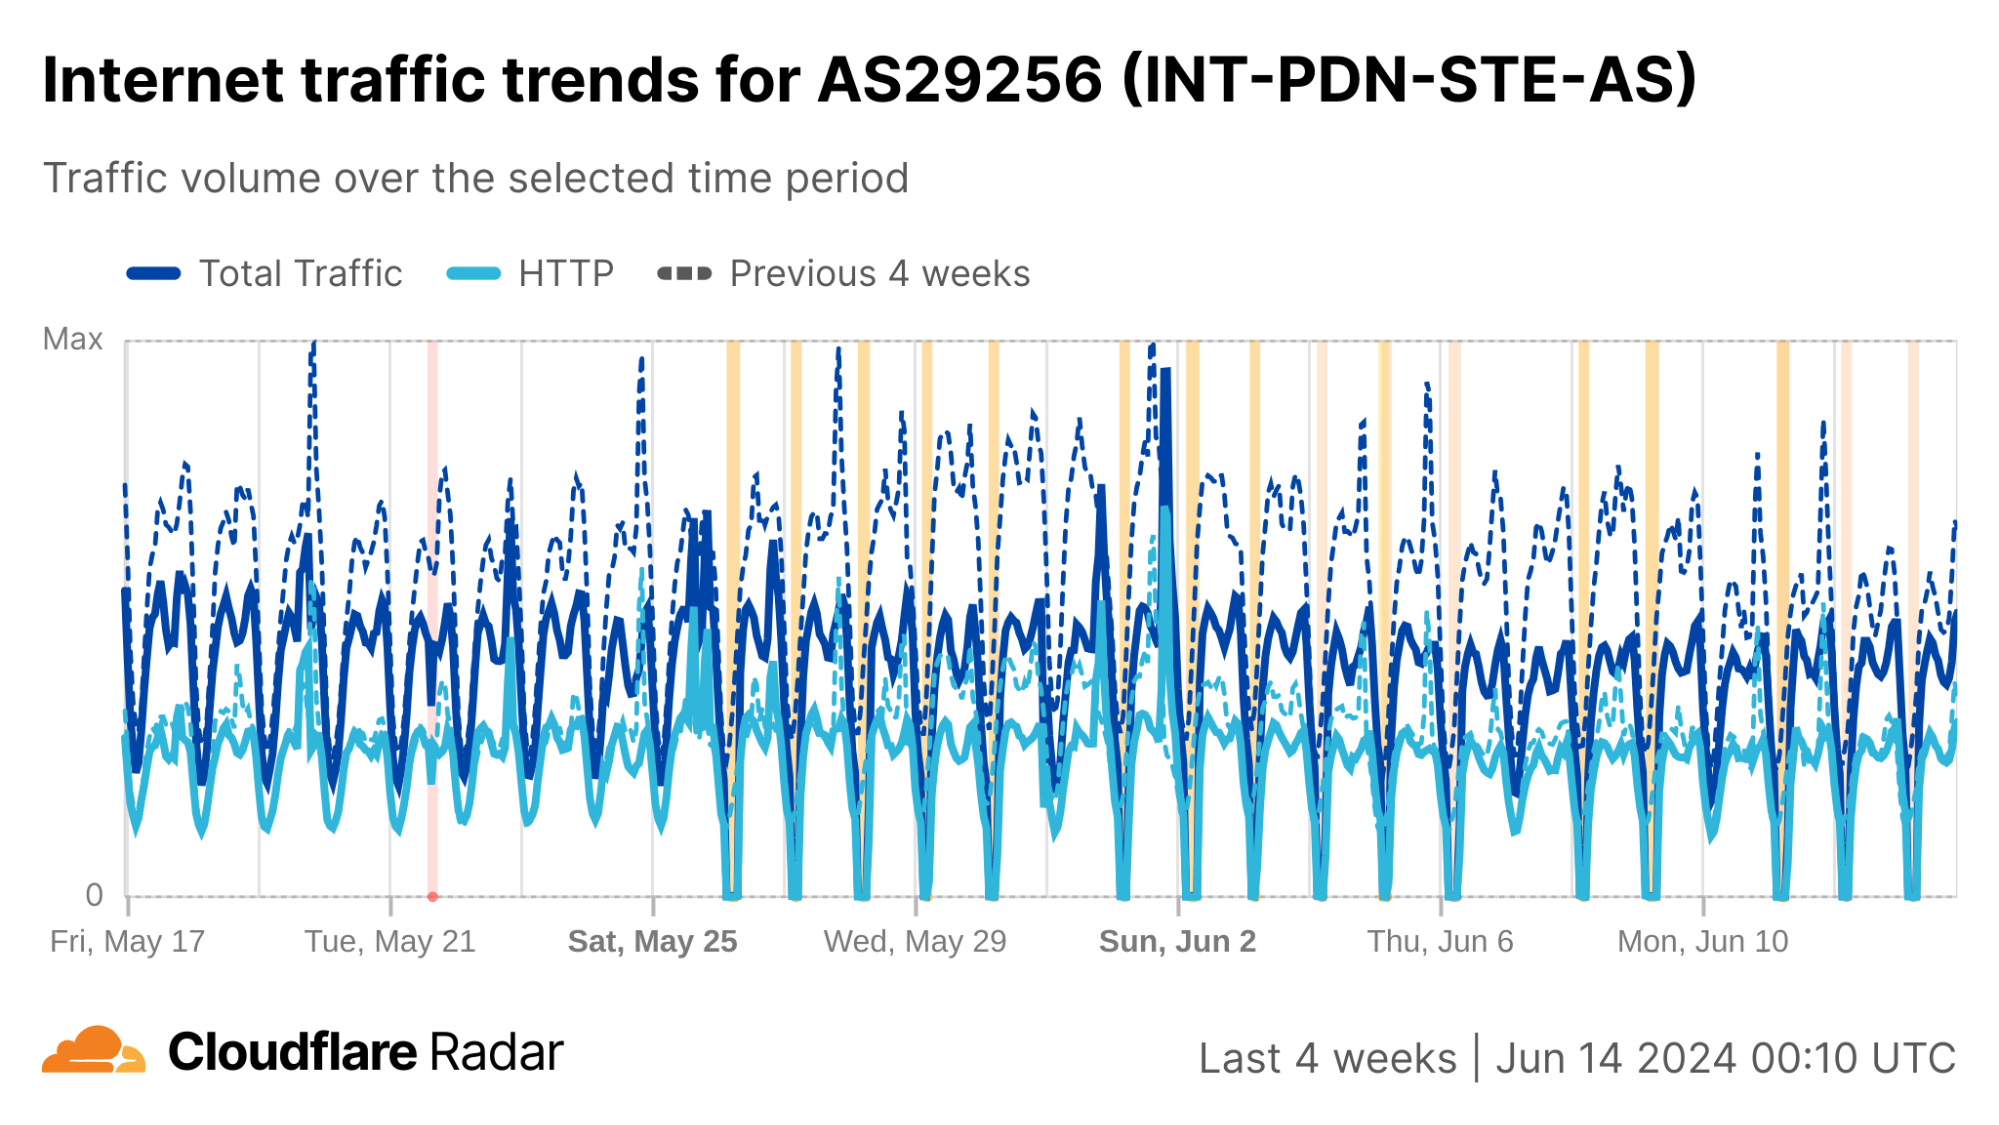
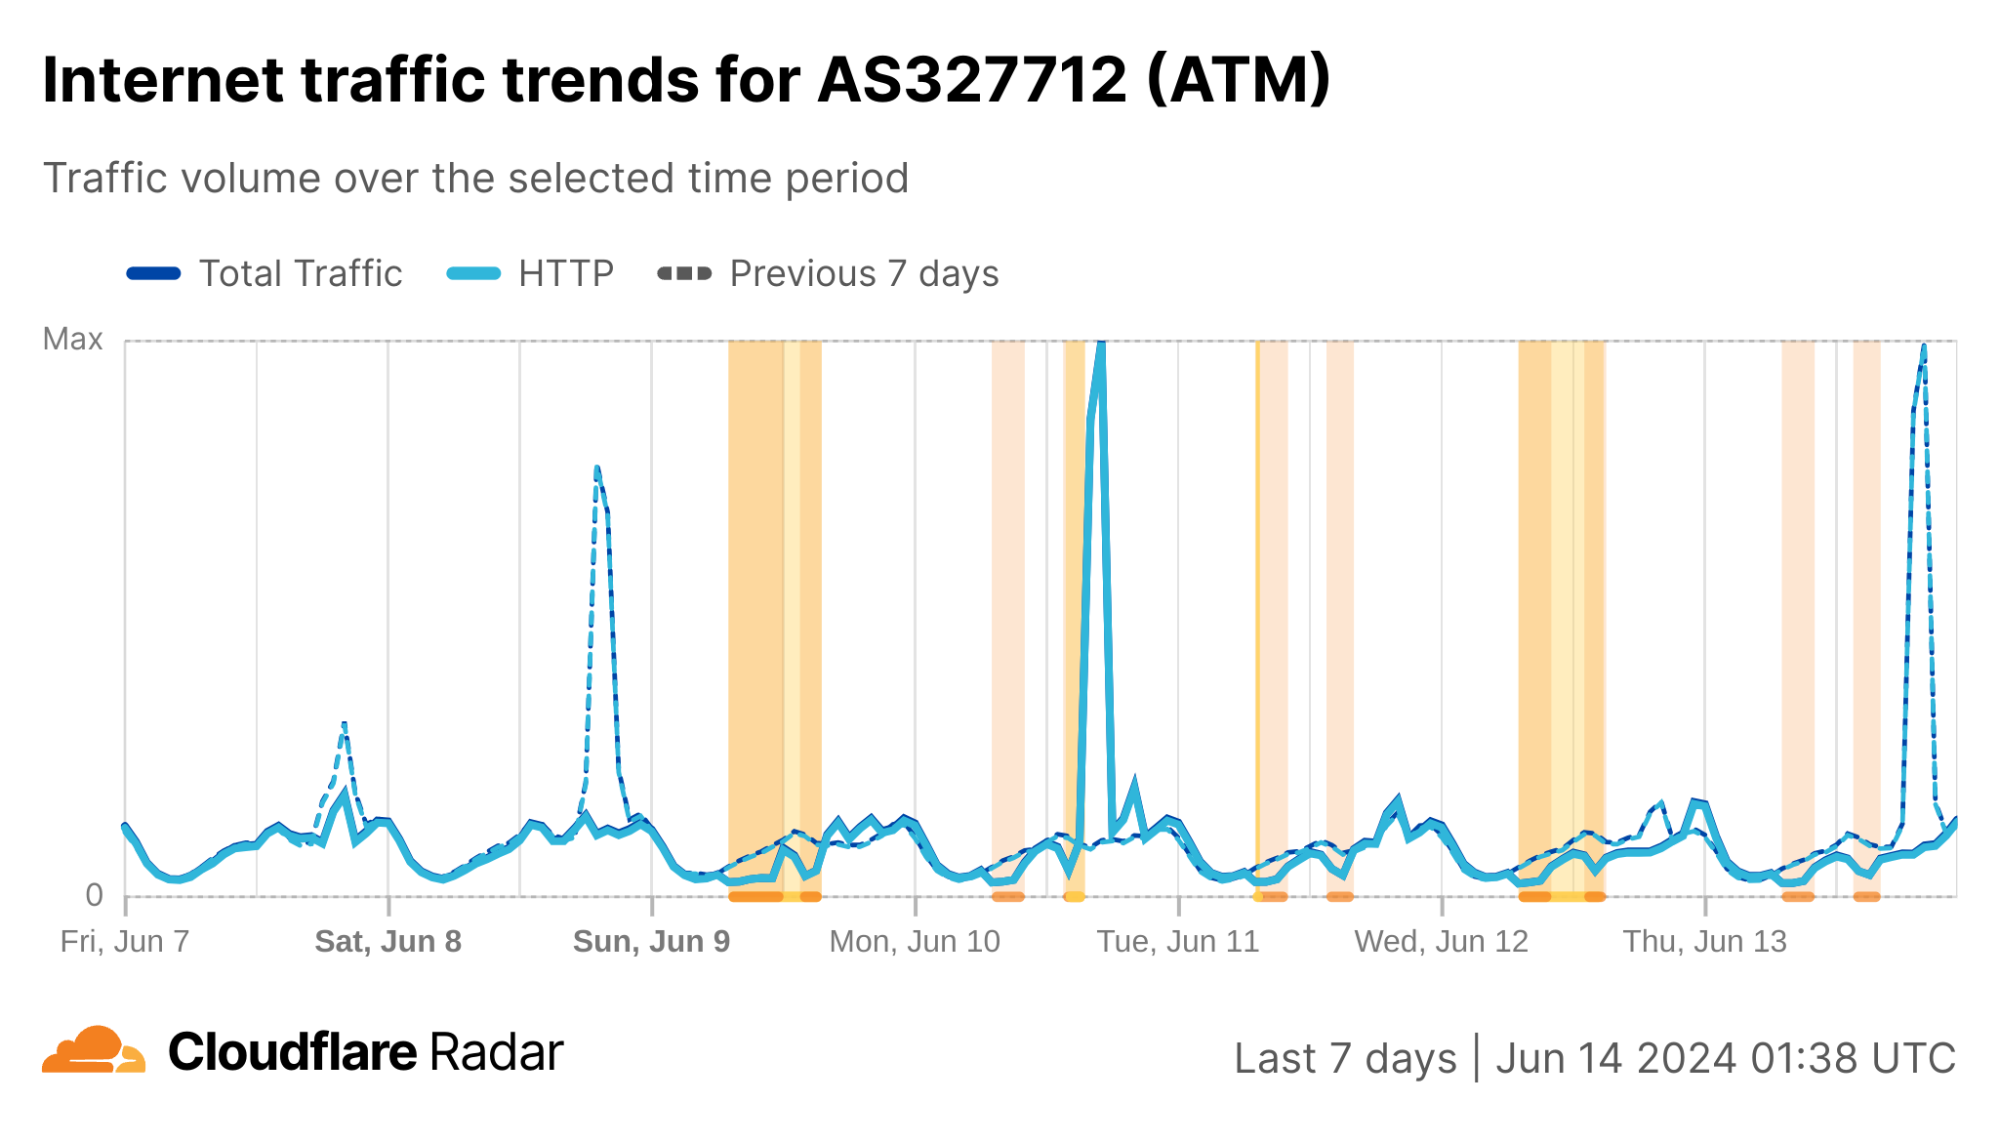
In Syria, AS29256 (Syrian Telecom) is effectively the Internet, as shown in the table below. While there are a few other autonomous systems (ASNs/ASes) registered in Syria, there are only two that currently announce IP address space to the public Internet. As such, the trends seen at a country level for Syria reflect those seen for AS29256, and this is clearly evident in the traffic graphs below.
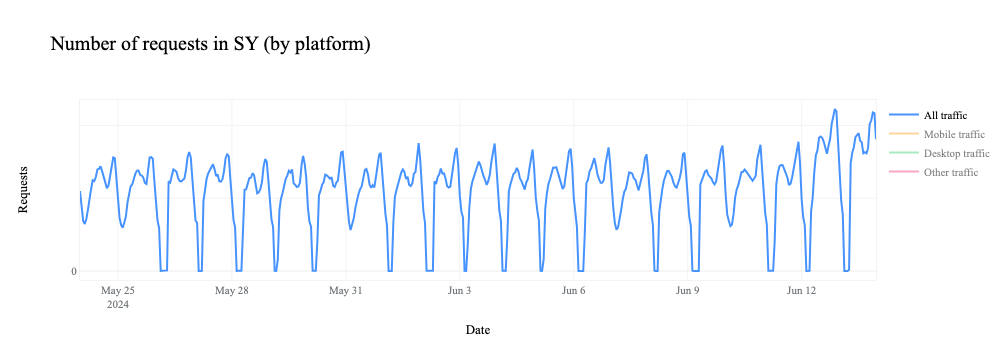
Nationwide Internet shutdowns in Syria began on May 26, taking place for varying multi-hour periods from Sunday to Thursday for three consecutive weeks. The graphs below show Internet traffic from the country, as well as AS29256, dropping to zero during the scheduled shutdowns.
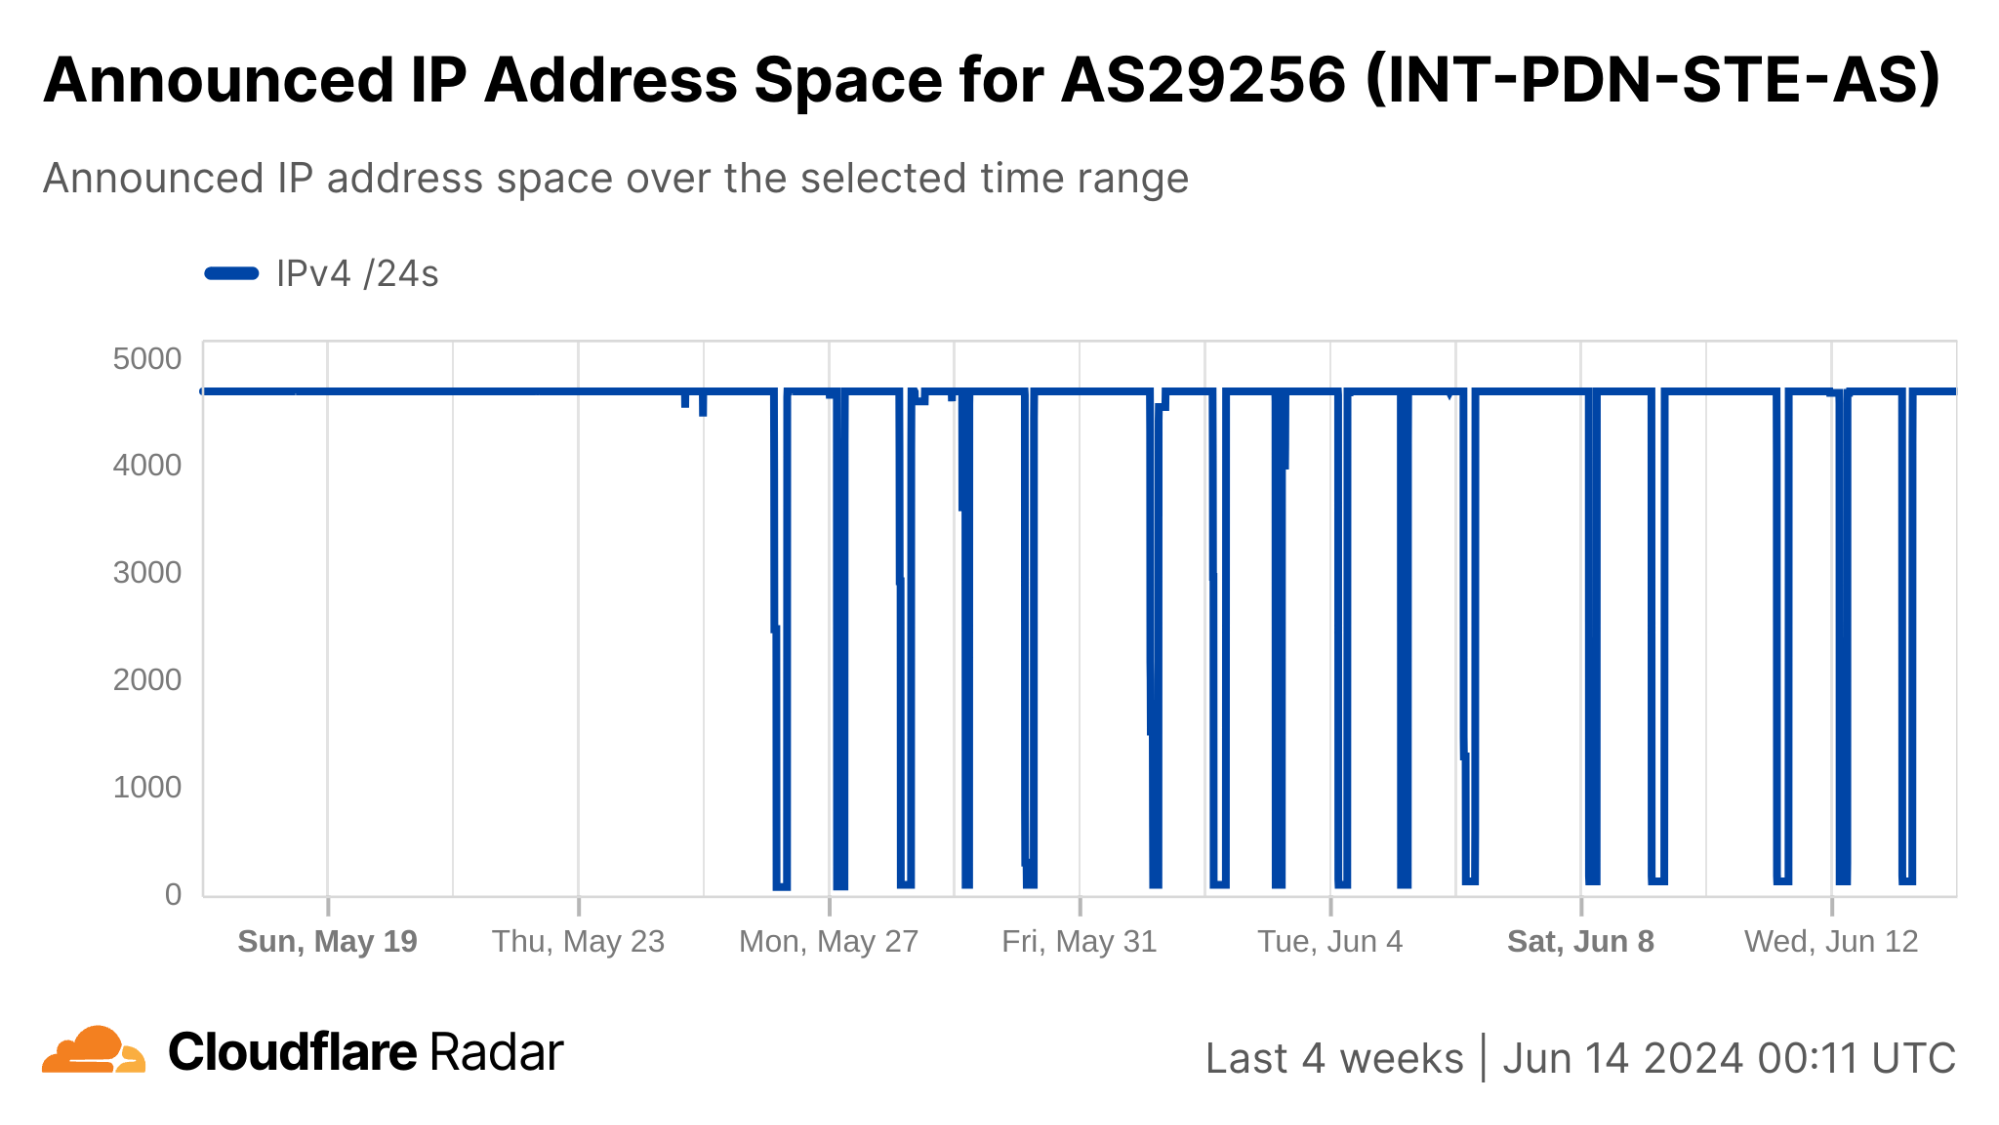
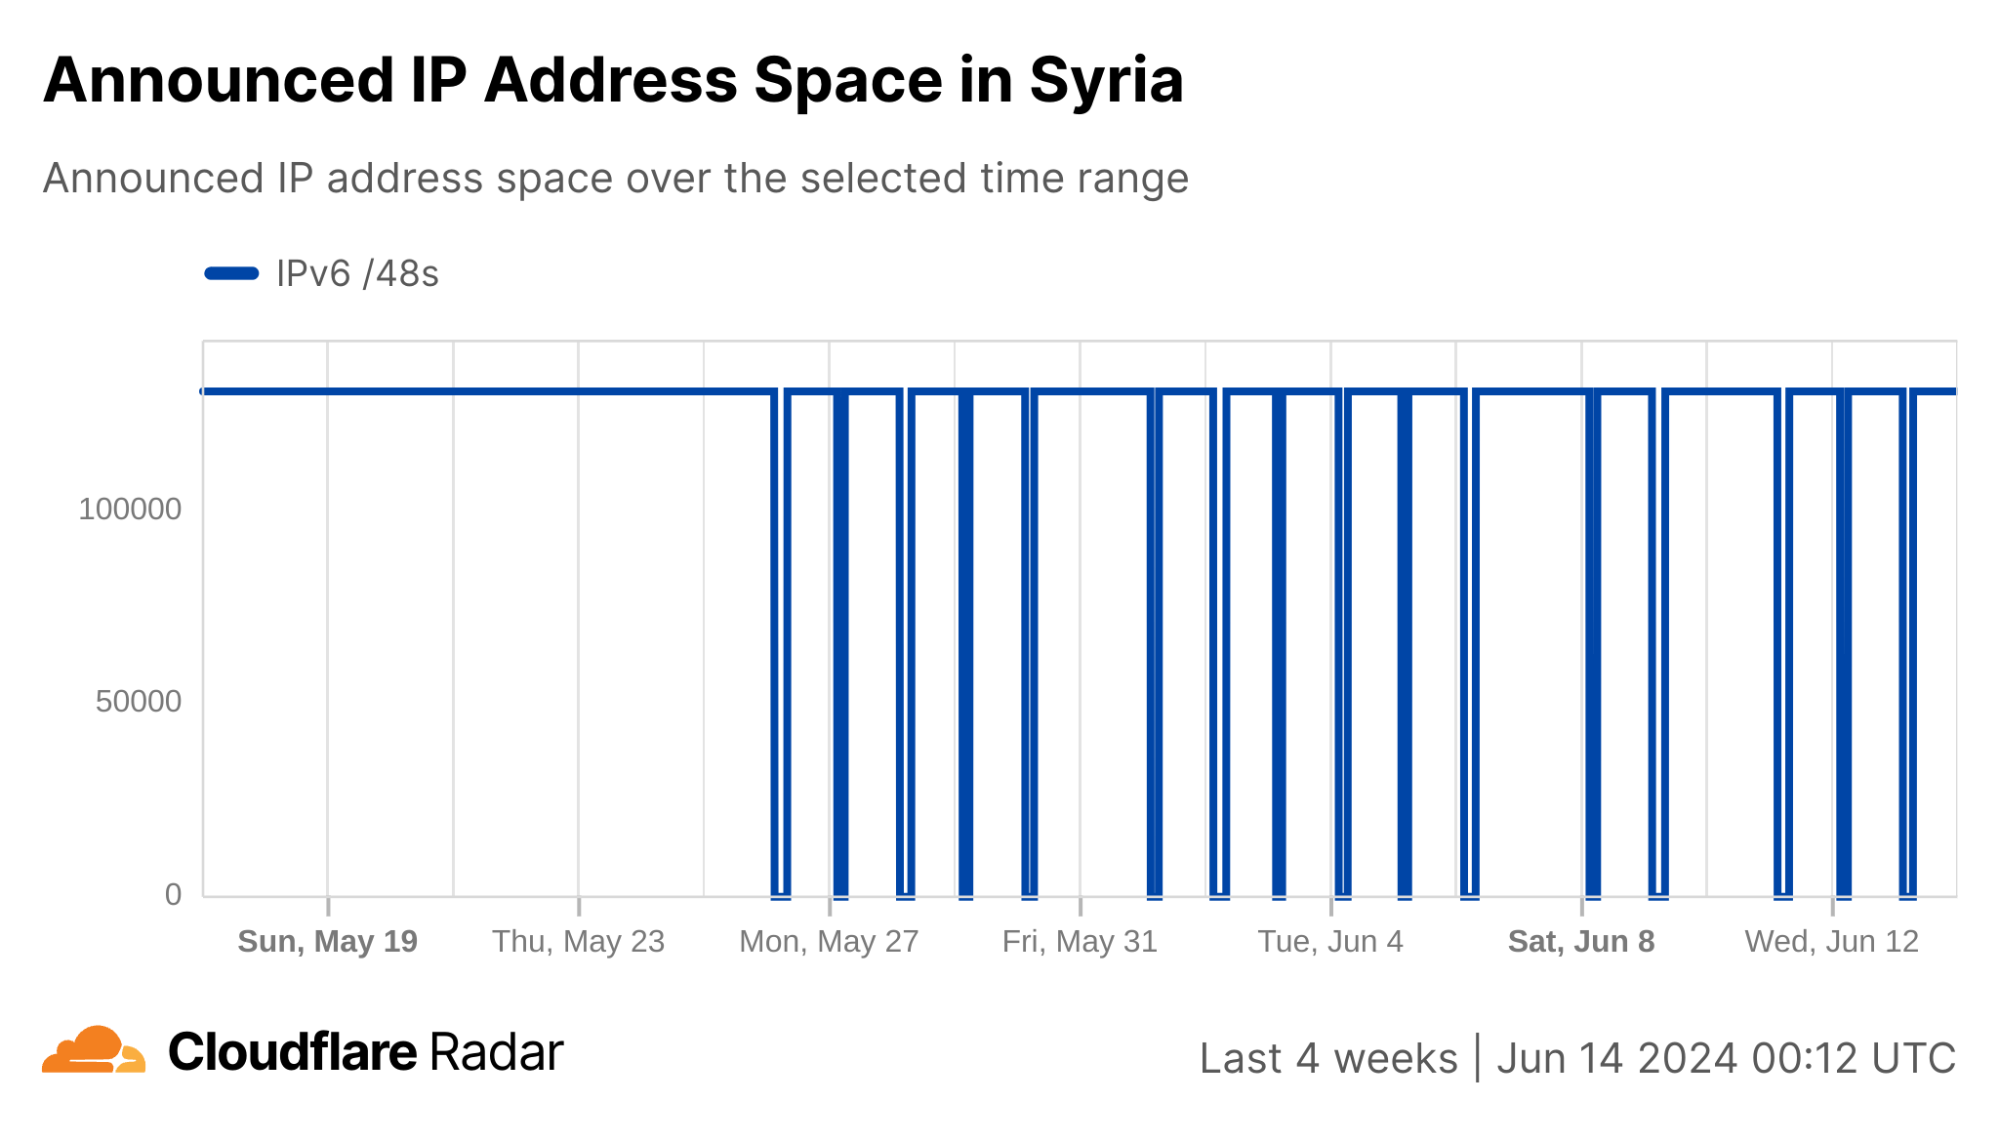
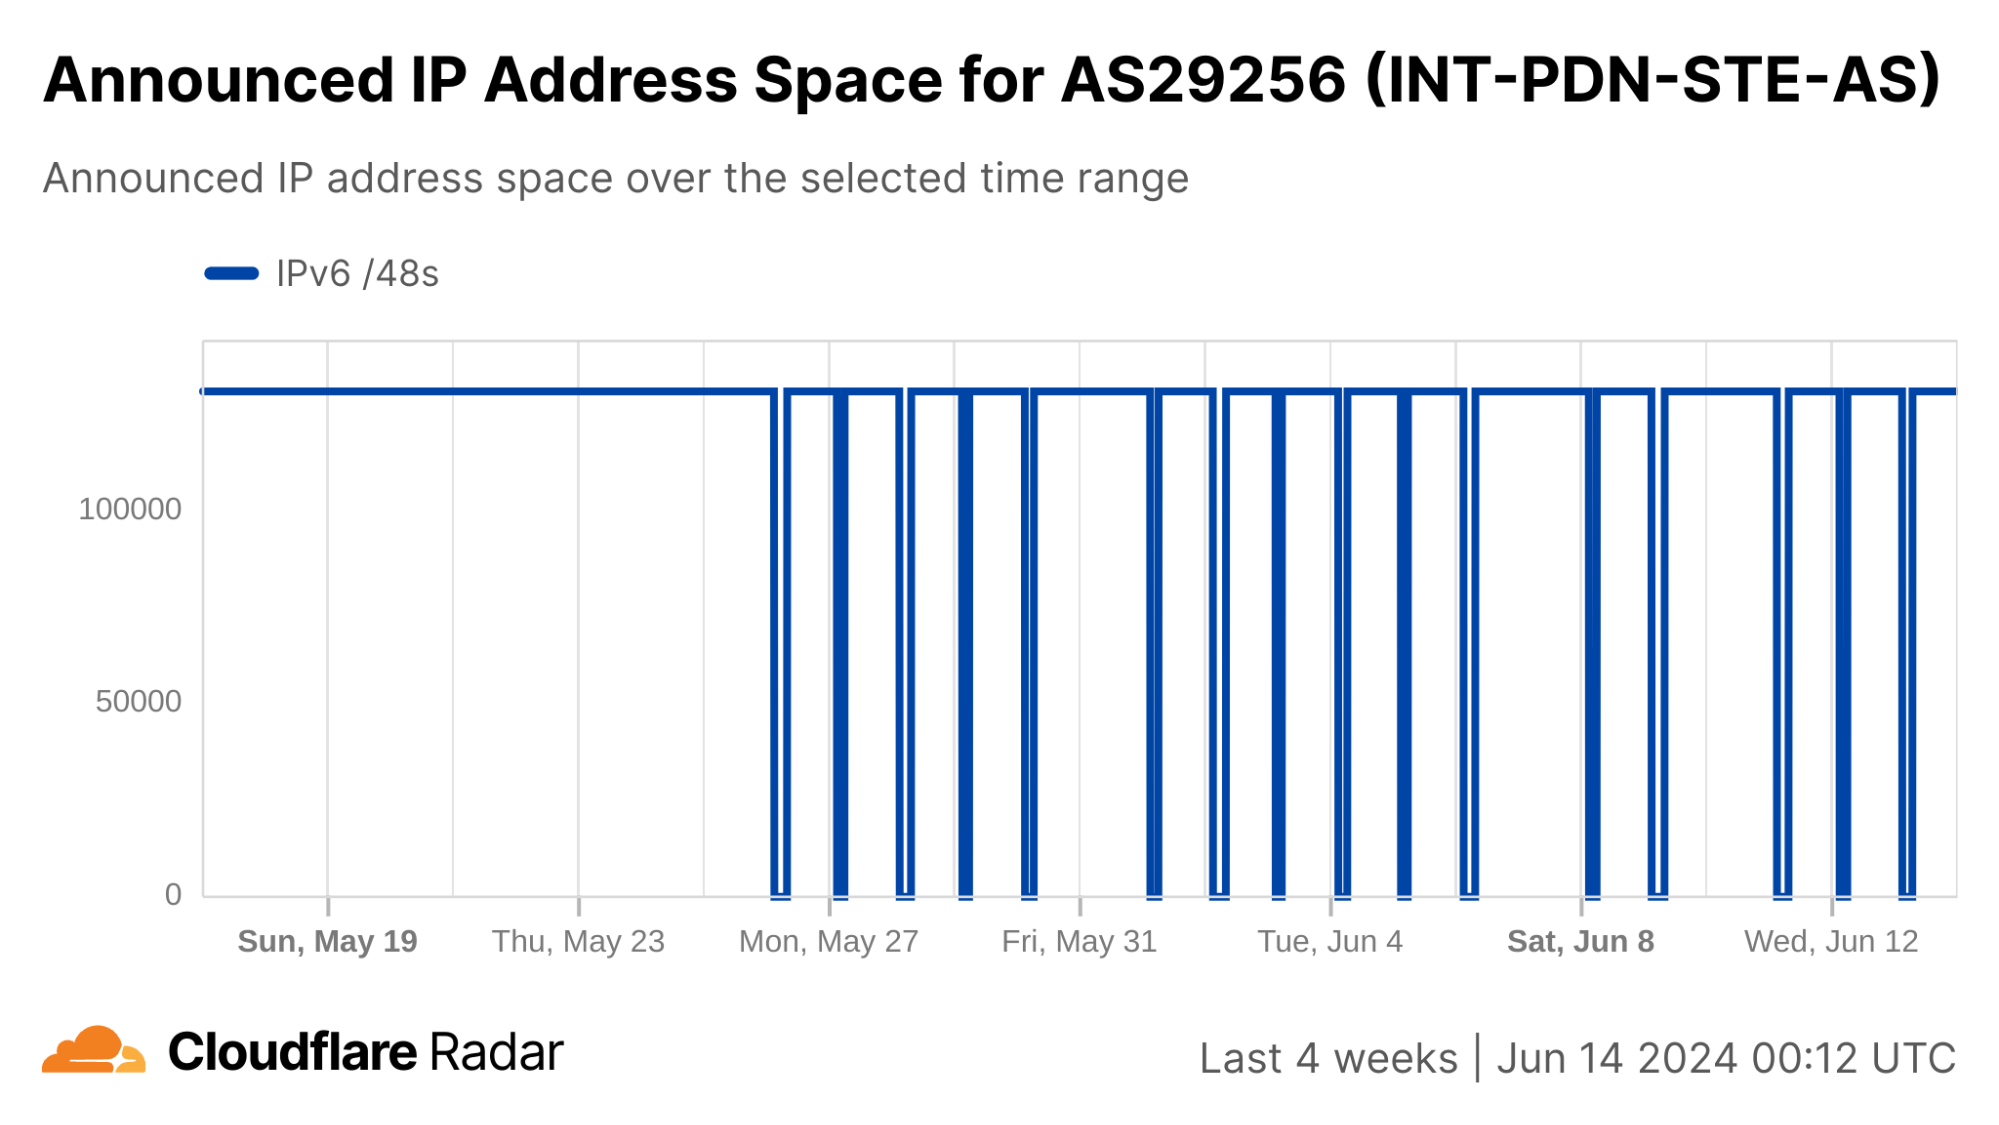
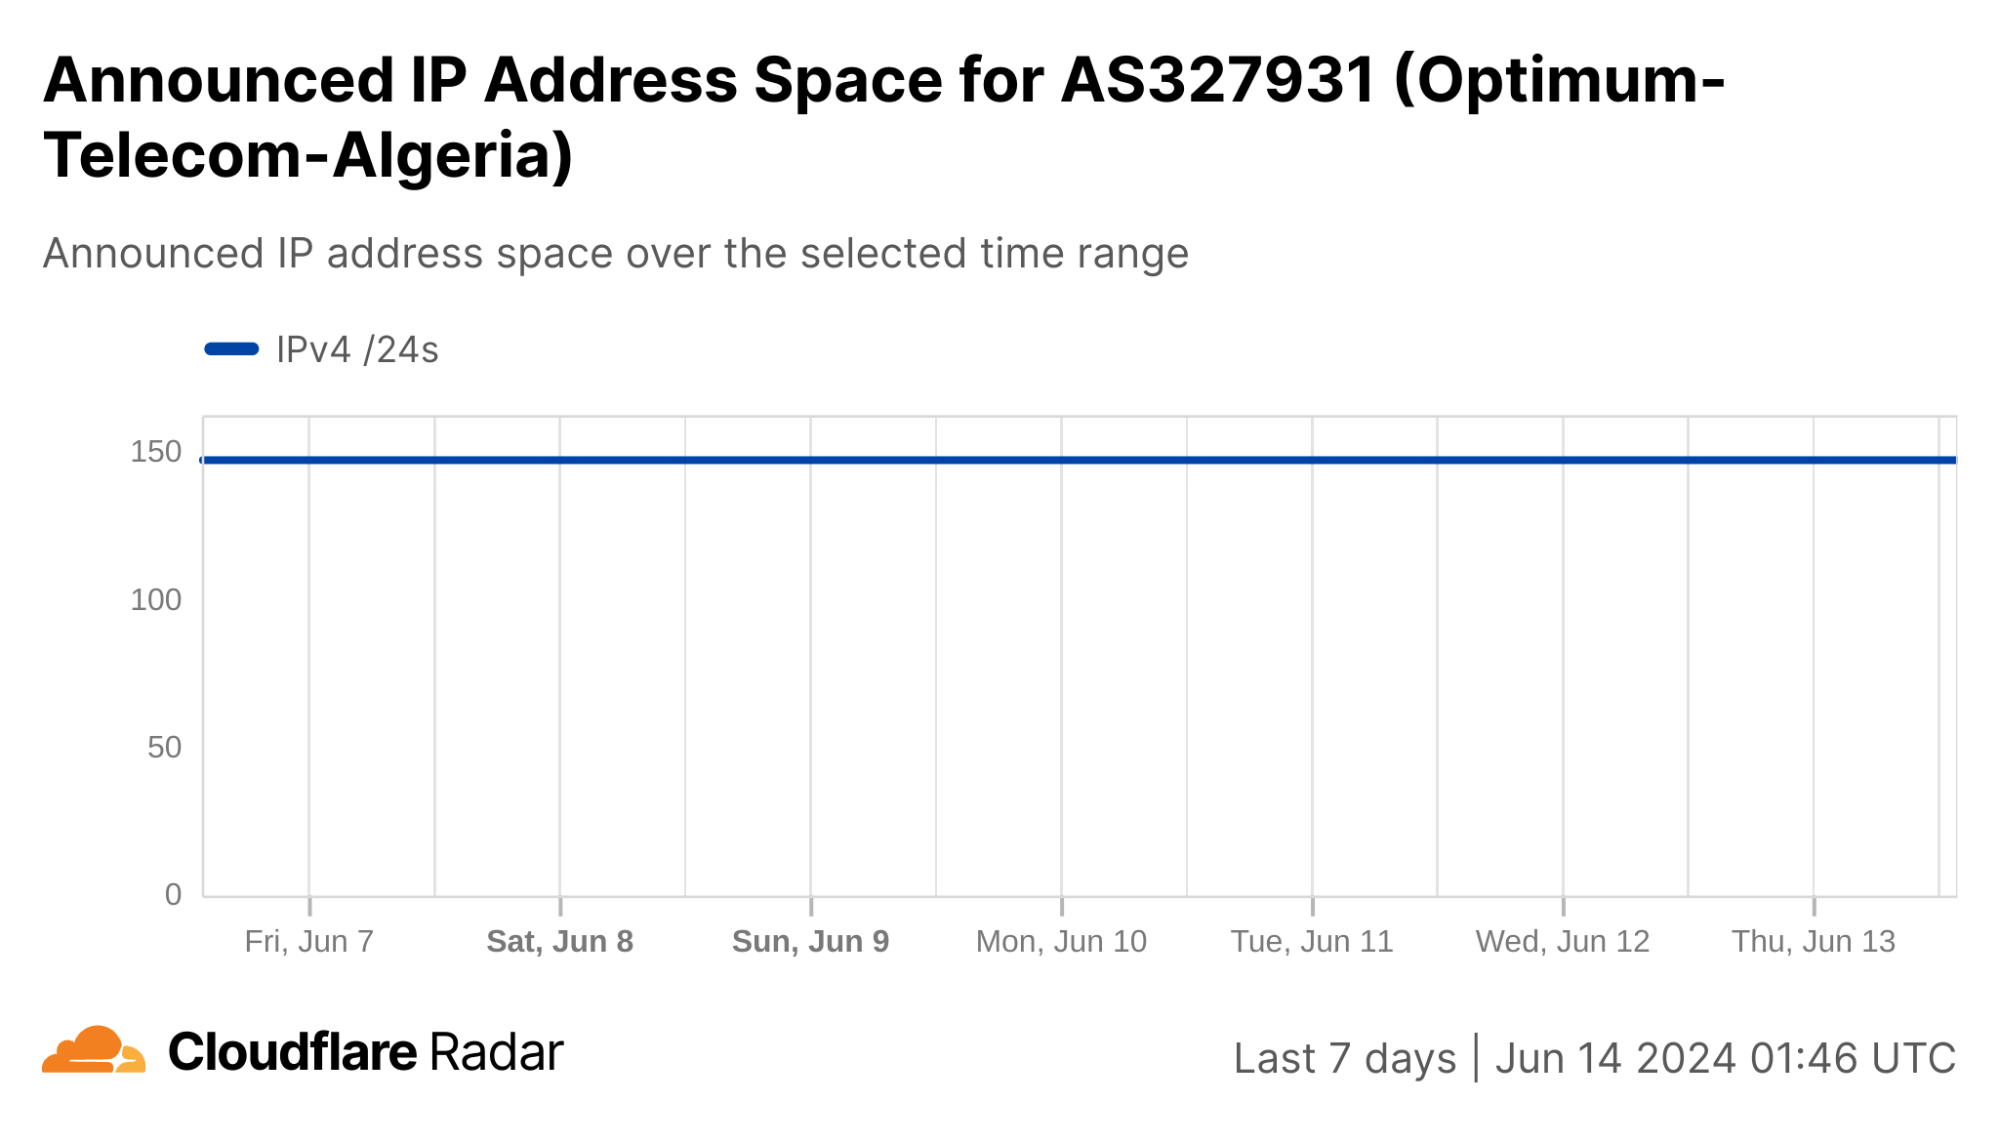
In addition, graphs from the Cloudflare Radar Routing pages for Syria and AS29256 show the number of IPv4 and IPv6 prefixes being announced country-wide and by AS29256 dropping to at or near zero during each shutdown. This ultimately means that there is no Internet path back to systems (IP addresses) connected to Syrian Telecom. Below, we explore why this is important and problematic.
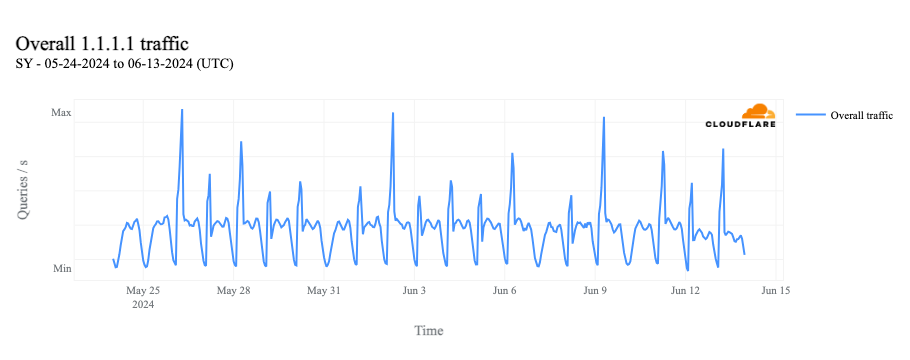
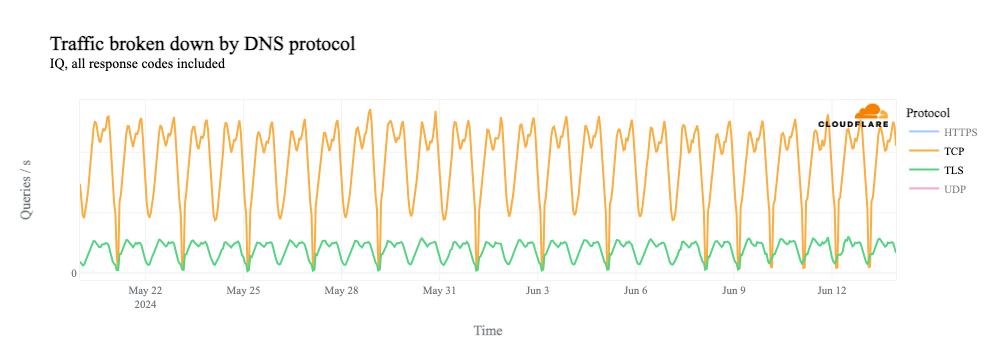
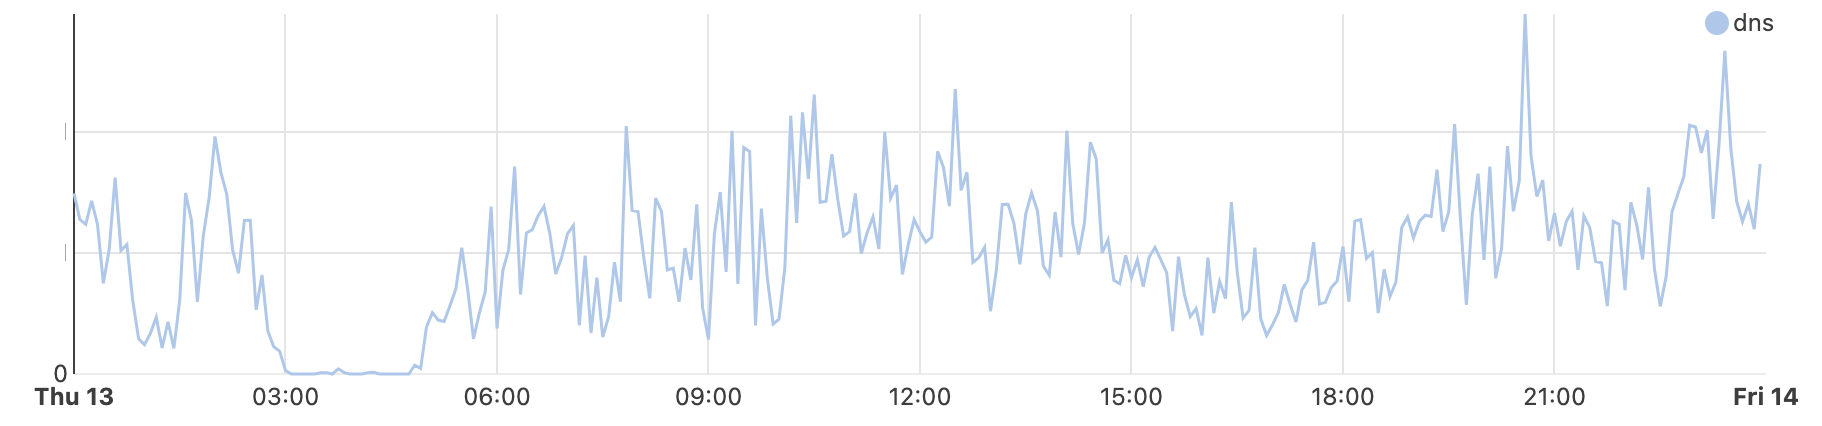
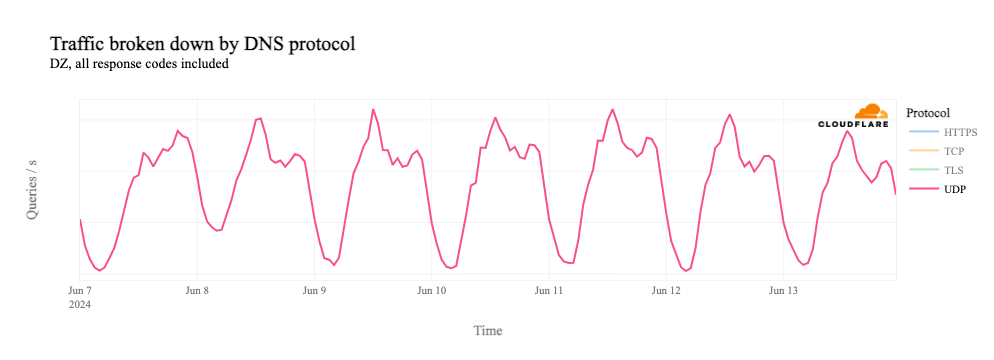
As has been observed in the past, the shutdowns in Syria are asymmetrical. That is, traffic can exit the country (via AS29256), but there are no paths for responses to return. The impact of this approach is clearly evident in traffic to Cloudflare’s 1.1.1.1 DNS Resolver. We continue to see traffic to the resolver when the shutdowns take place, and in fact, we see the traffic spike during the shutdowns, as the graph below shows.
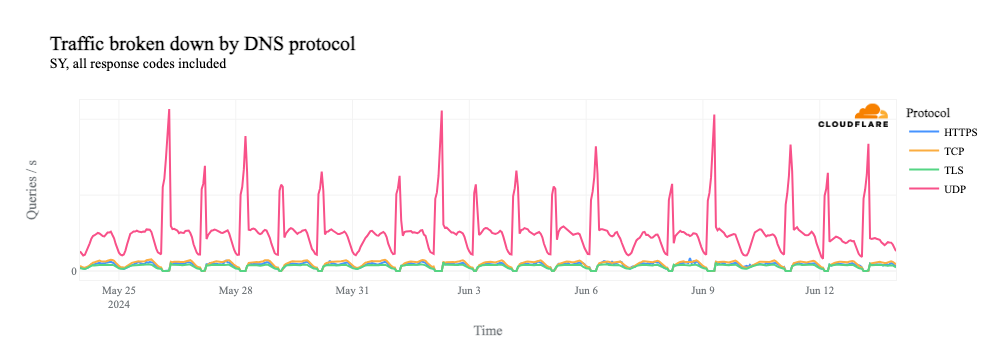
If we dig into traffic to 1.1.1.1 by protocol, we can see that it is driven by requests over UDP port 53, the standard port used for DNS requests over UDP and TCP. (Given the request pattern, that also appears to be the primary way that we see traffic to the resolver from Syria.)
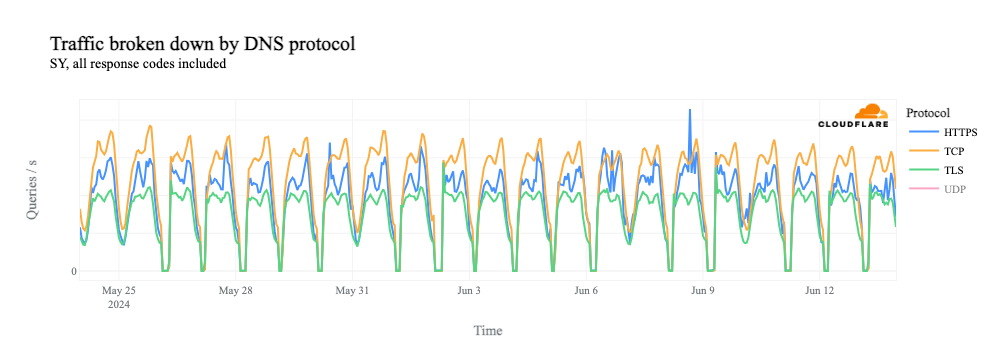
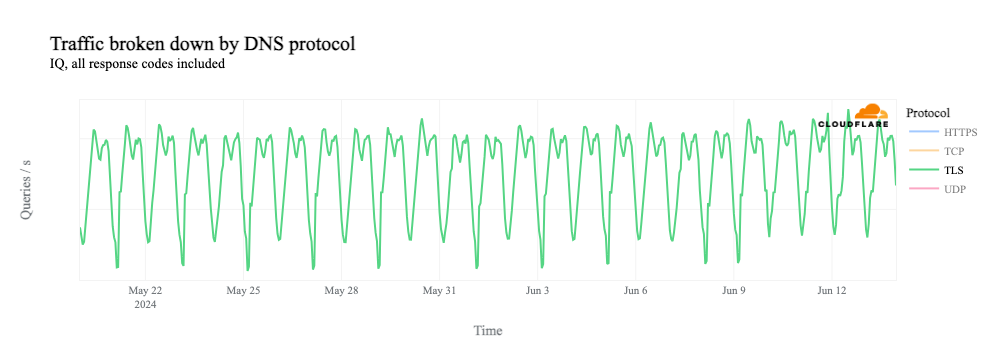
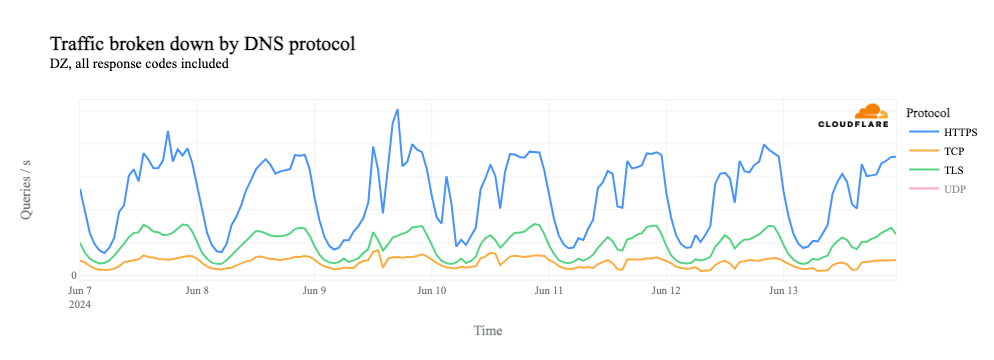
If we remove the UDP line from the graph, we see that request volume for DNS over TCP port 53, as well as DNS over HTTPS (DoH) and DNS over TLS (DoT), all drops to zero during the shutdowns.
Similarly, we can clearly see the shutdowns in HTTP(S) request-based traffic graphs as well, since HTTP(S) is also a TCP-based protocol.
Why do we see this impact? With DNS over UDP, the client simply makes a request to the resolver – no multi-step handshake is involved, as with TCP. So in this case, 1.1.1.1 is receiving these requests, but as shown above, there’s no path for the response to reach the client. Because it hasn’t received a response, the client retries the request, and this flood of retries is manifested as the spike seen in the graphs above.
However, as we see above, request volume for DNS over TCP, as well as DoH, DoT, and HTTP(S) (which all use TCP), falls to zero during the shutdowns. The lack of a path back to the client means that the TCP 3-way handshake can’t complete, and thus we don’t see DNS requests over these protocols.
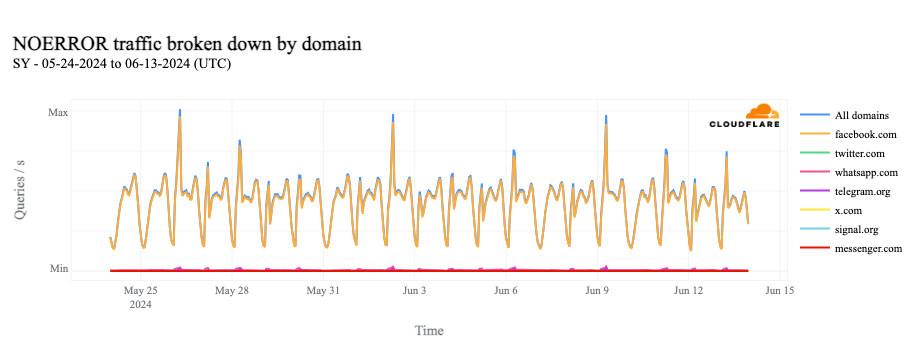
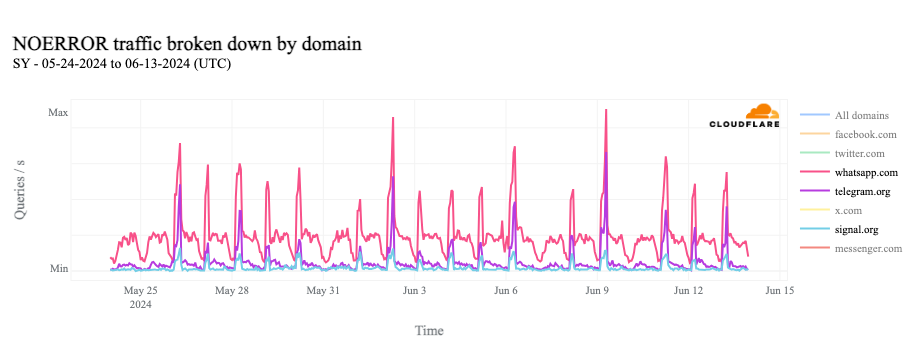
In looking at 1.1.1.1 Resolver request volume from Syria for popular social media and messaging applications, we can see traffic for facebook.com most closely matches the spikes shown above. Removing facebook.com from the graph, we can also see similar, though more limited, increases for domains used by popular messaging applications WhatsApp, Signal, and Telegram. Facebook and WhatsApp are reportedly the most popular social media and messaging applications in Syria.
Although we have focused on the analysis of traffic to Cloudflare’s DNS resolver, and the patterns seen within that traffic, it is also worth highlighting an interesting pattern observed in traffic to Cloudflare’s Authoritative DNS platform. (DNS resolvers act as a middleman between clients, such as a laptop or phone, and an authoritative DNS server. Authoritative DNS servers contain information specific to the domain names they serve, including IP addresses and other types of records.)
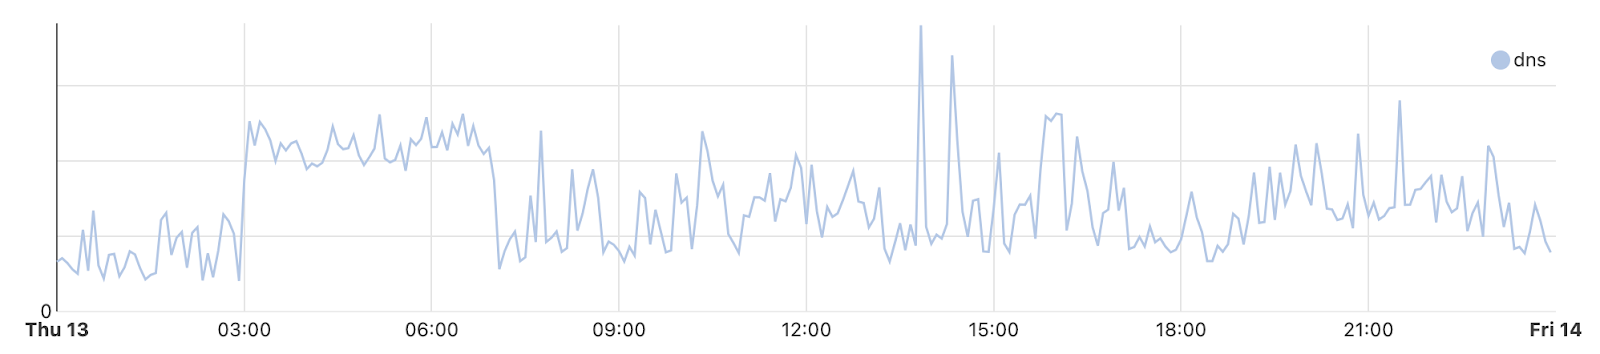
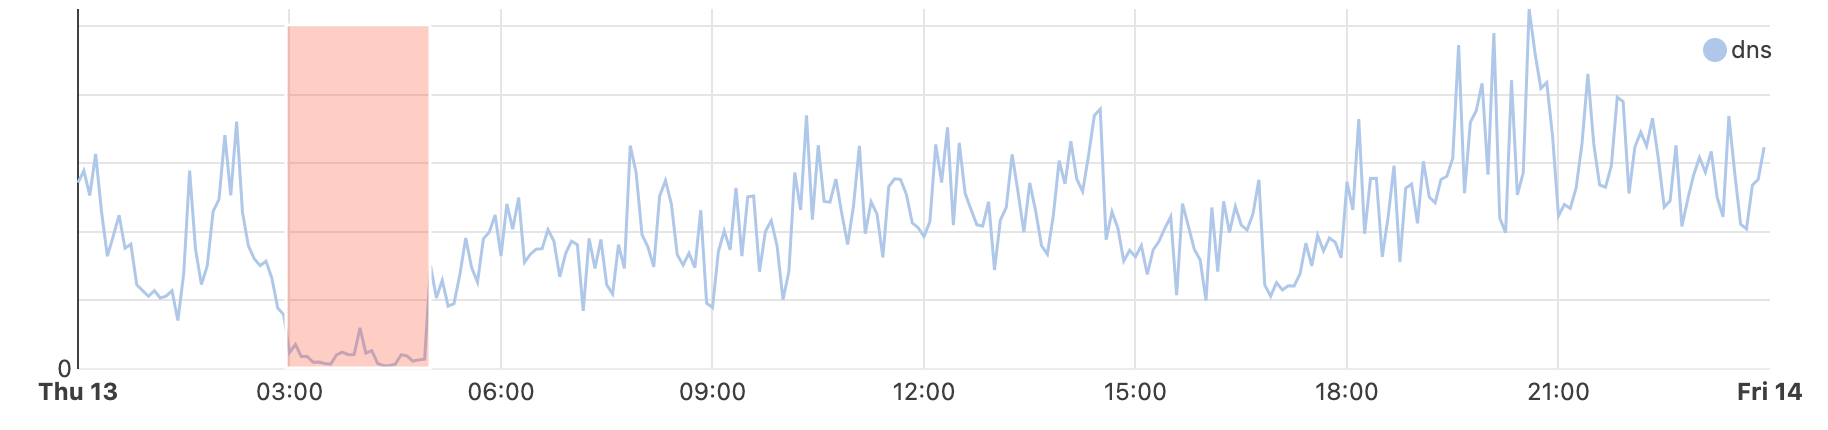
The graph below shows bits/second traffic from Syria for Cloudflare’s authoritative DNS service on June 13. (Similar patterns were observed during the other days when shutdowns occurred, but data volume limits the ability to create a graph showing an extended period of time.) In this graph, we can see that at the start of the shutdown (03:00 UTC), traffic rises sharply, effectively plateaus for the duration of the shutdown, and then returns to normal levels. We believe that the traffic pattern illustrated here could be the result of some local resolvers in Syria having the IP addresses for our authoritative DNS servers cached, and are making requests to them. The increased traffic level could be because they are retrying their queries after not receiving responses, but in a less aggressive fashion than the client applications driving the resolver traffic spikes shown above.
In summary, Syria appears to be implementing their Internet shutdowns not through filtering, but rather by simply not announcing their IP address space for the duration of the shutdown, thereby preventing any responses from returning to the originating requestor, whether client application, web browser, or local DNS resolver.
Iraq
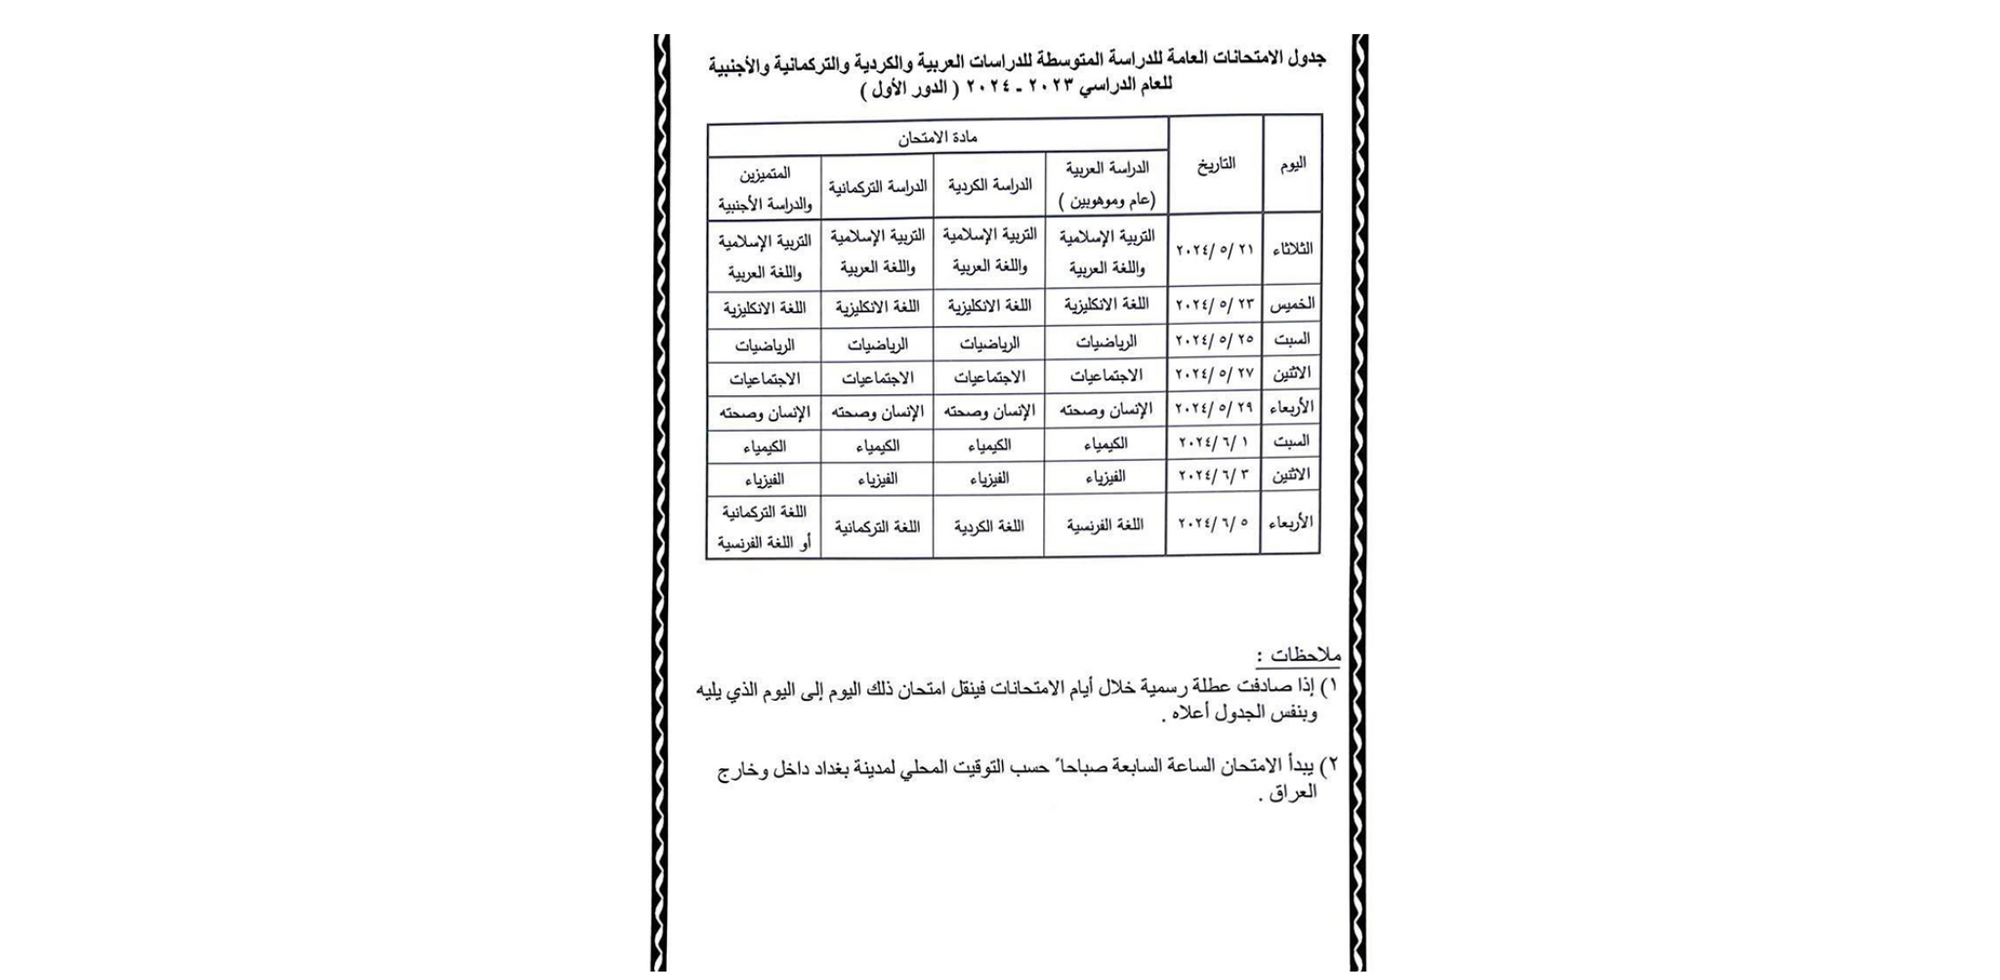
On May 19, the Iraqi Ministry of Communication posted an update that stated (translated) “The Ministry of Communications would like to note that the Internet service will be cut off for two hours during the general exams for intermediate studies, from six in the morning until eight in the morning, based on higher directives and at the request of the Ministry of Education.” The post came nearly a year after the Iraqi Ministry of Communication refused a request from the Ministry of Education to shut down the Internet during the baccalaureate exams as part of efforts to prevent cheating. On May 20, the Iraqi Ministry of Education posted the schedule for the upcoming set of exams to its Facebook page.
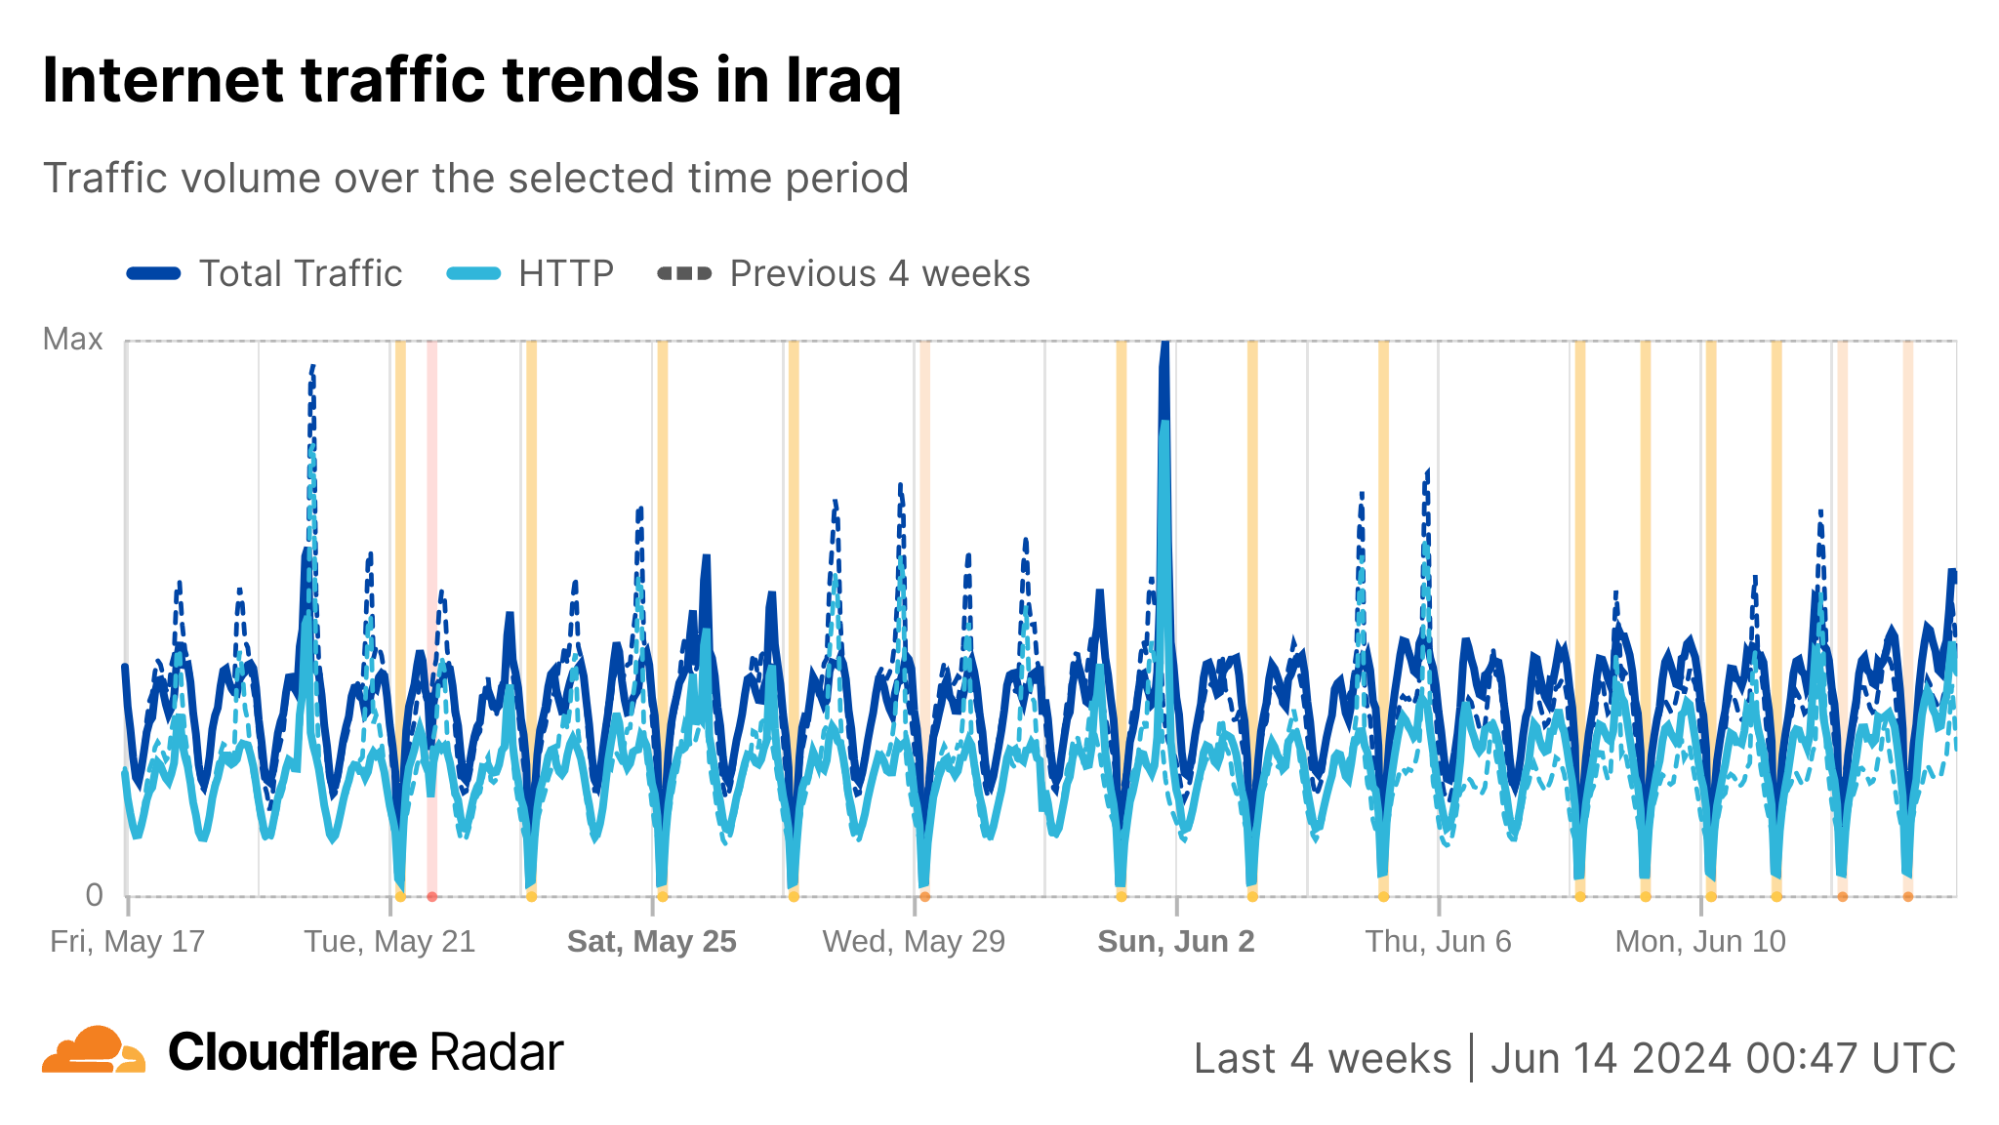
Iraq has a much richer network service provider environment than Syria does, with over 150autonomous systems (ASNs) registered in the country and announcing IP address space, compared to just two ASNs (both Syrian Telecom) in Syria announcing IP address space. Although traffic in Iraq is generally concentrated among the larger providers, shutdowns are rarely “complete” at a country level because not every autonomous system (network provider) in the country implements a shutdown. (This is due in part to the autonomous Kurdistan region in the north, which often implements similar shutdowns on their own schedule. Network providers in this region are included in Iraq’s country-level graphs.)
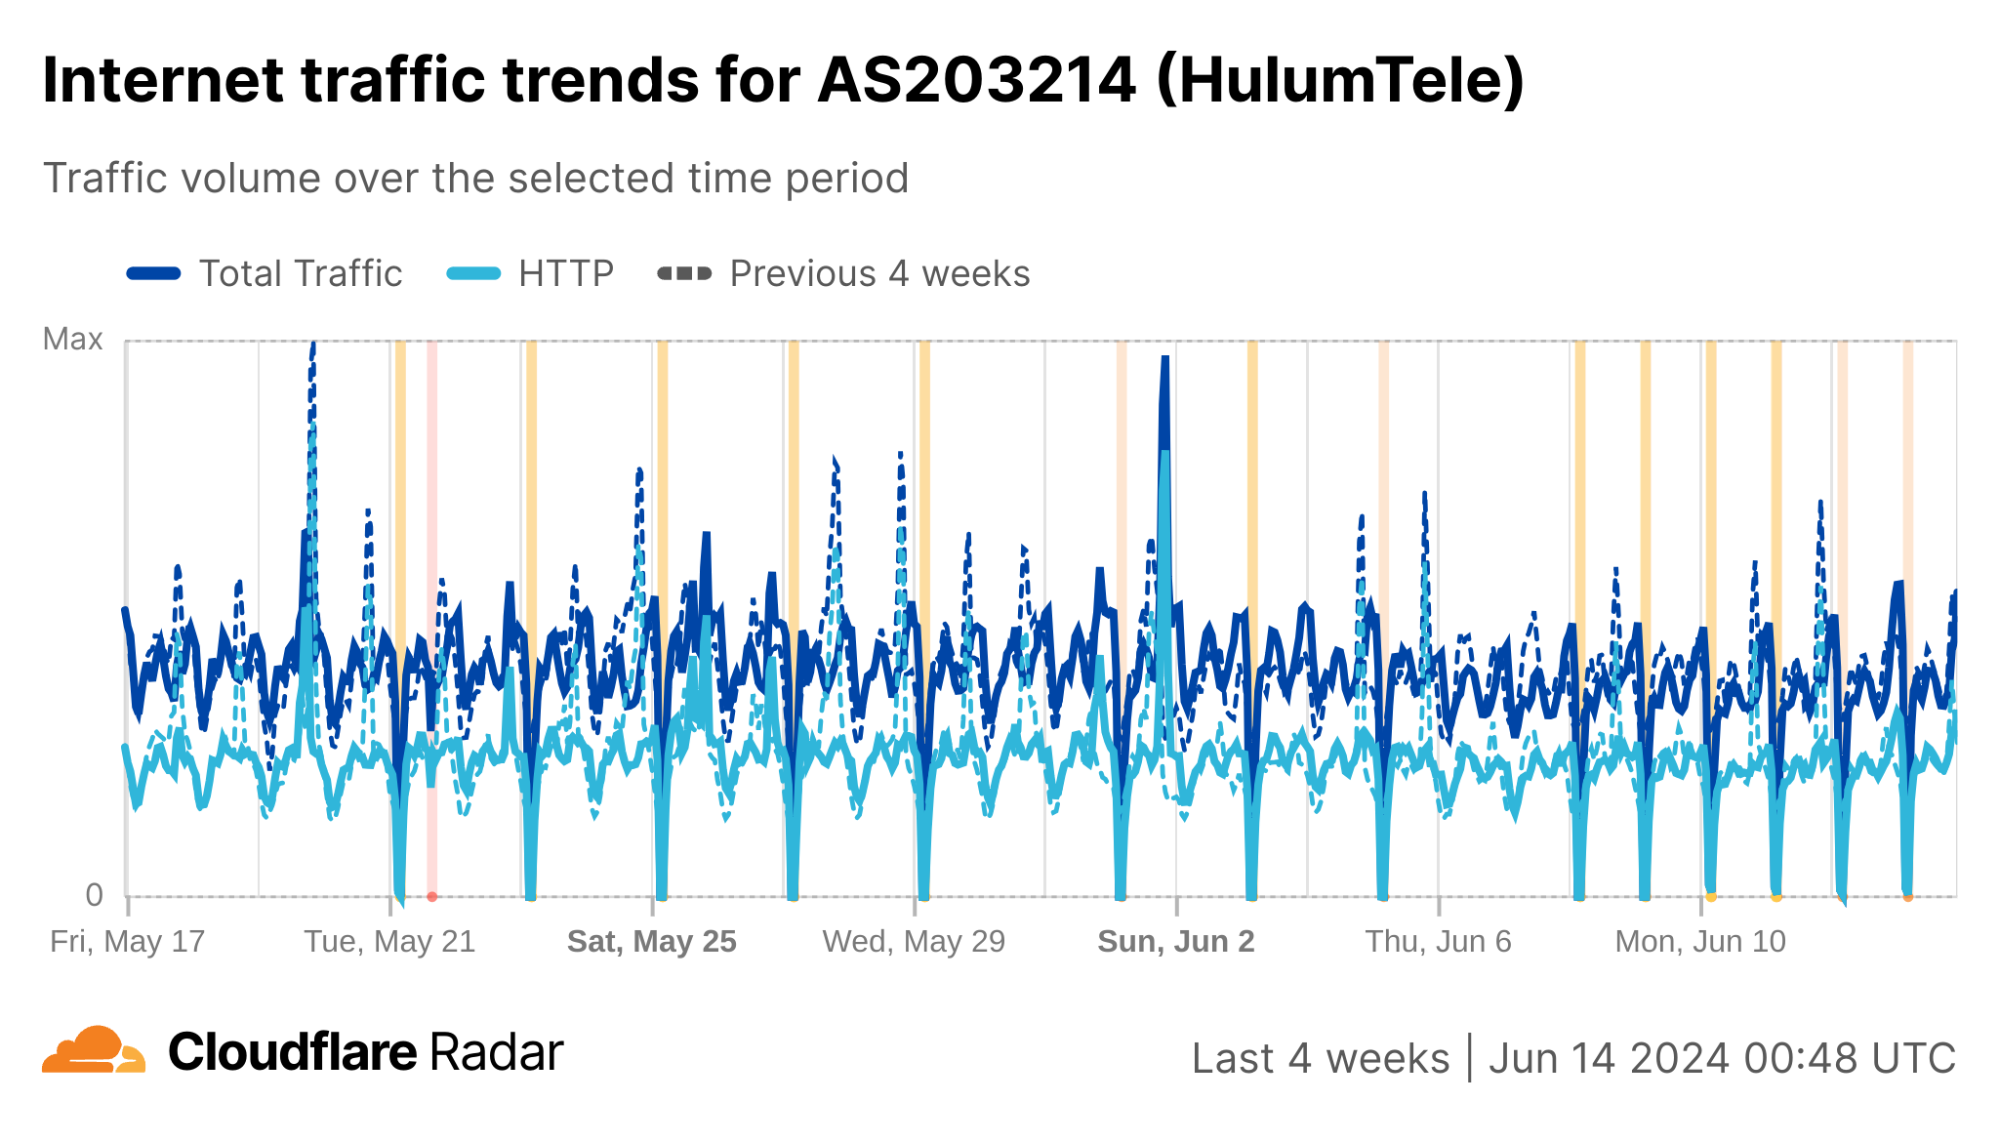
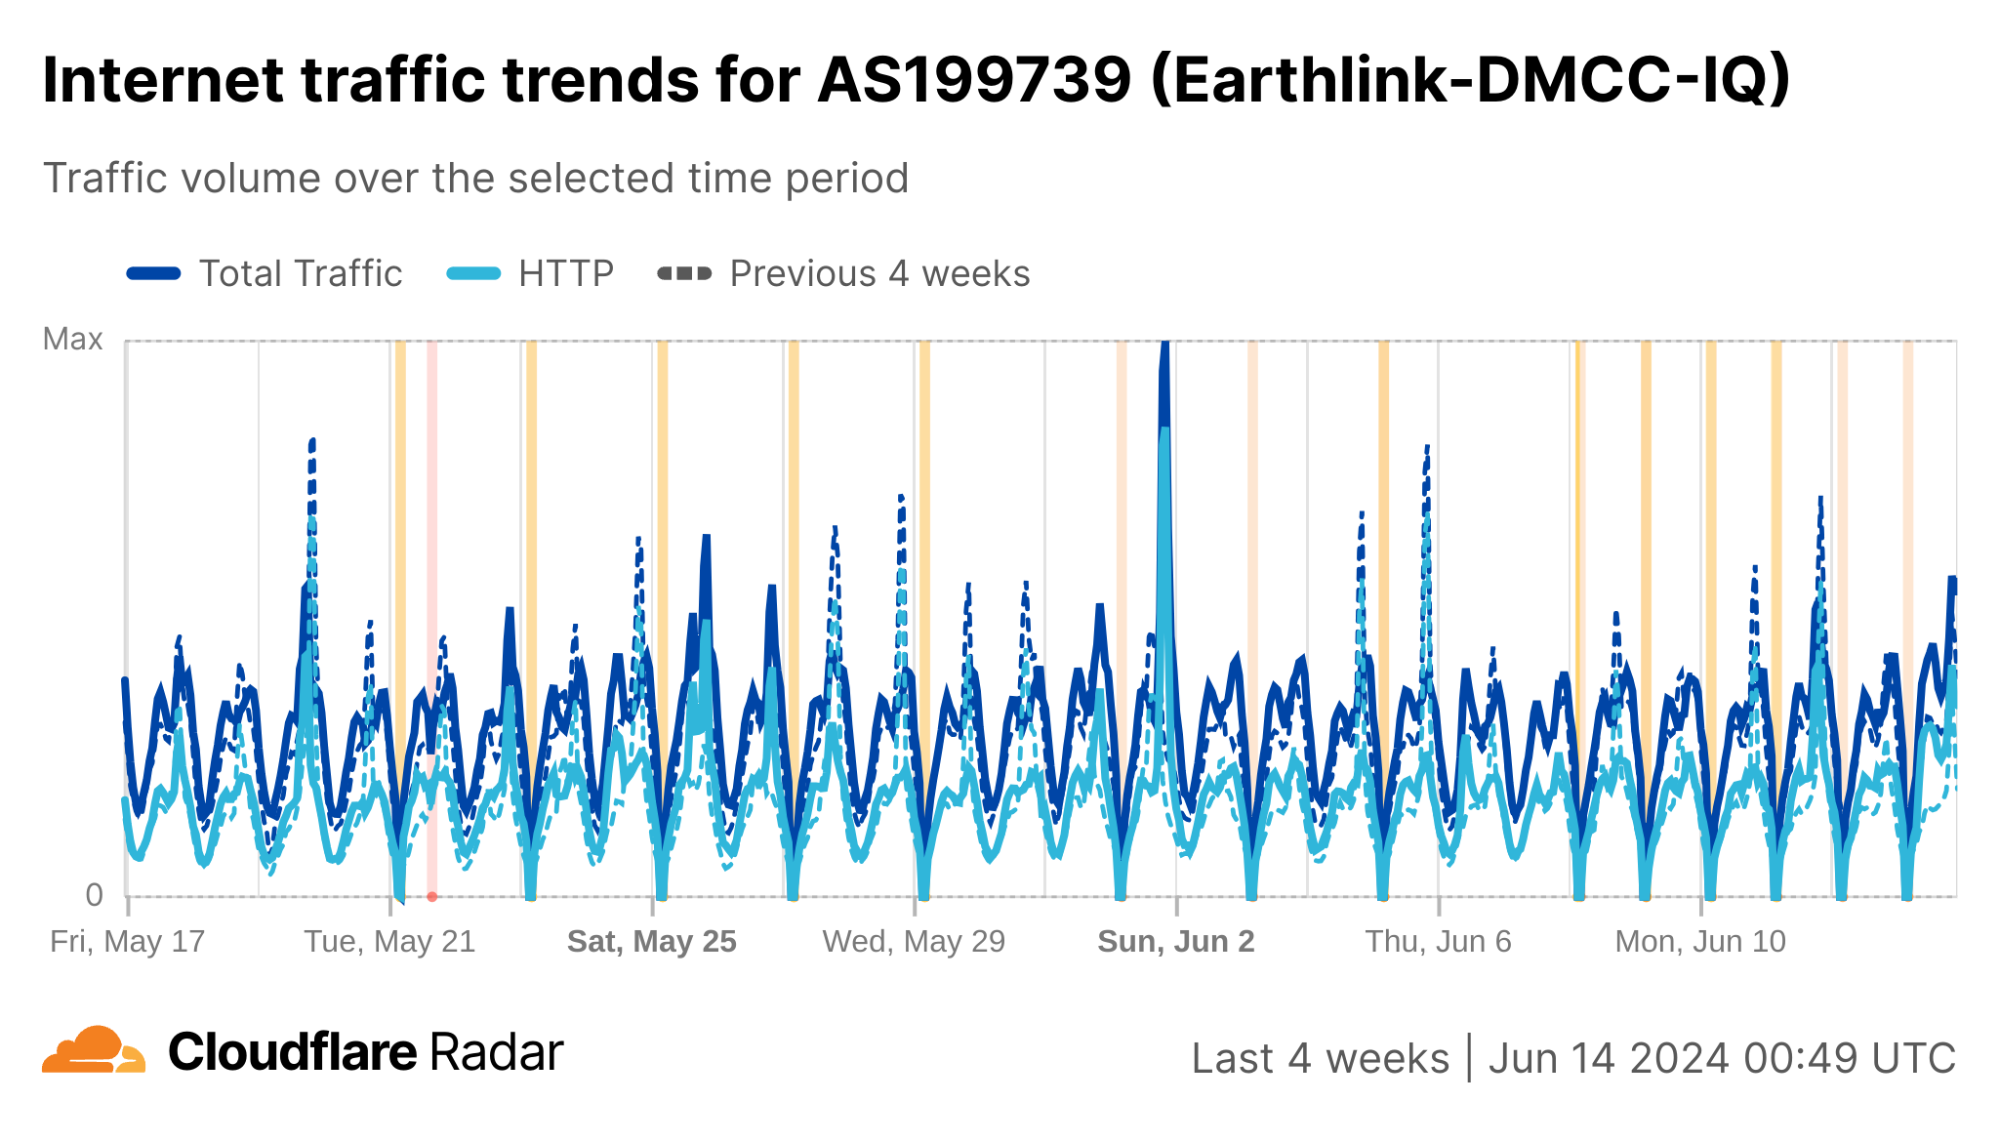
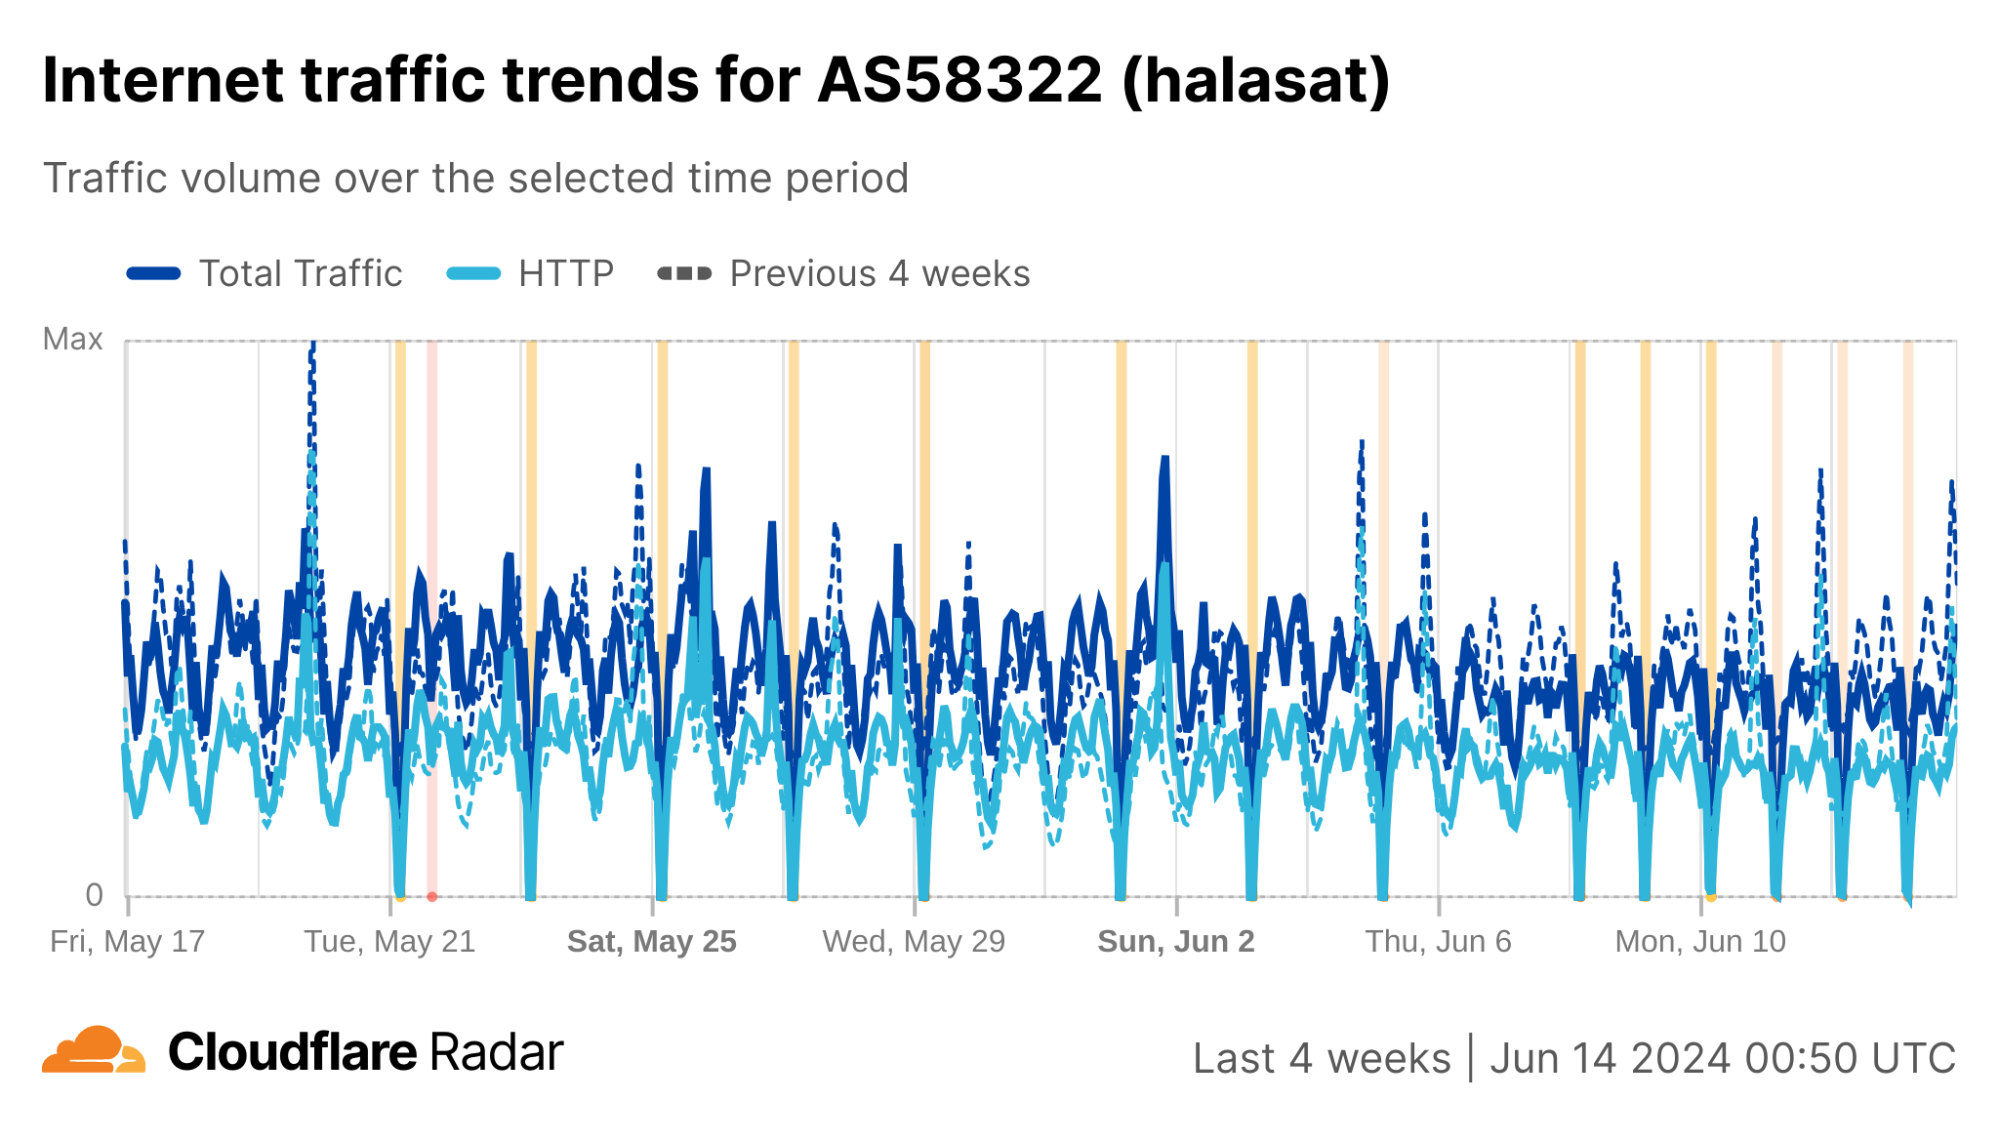
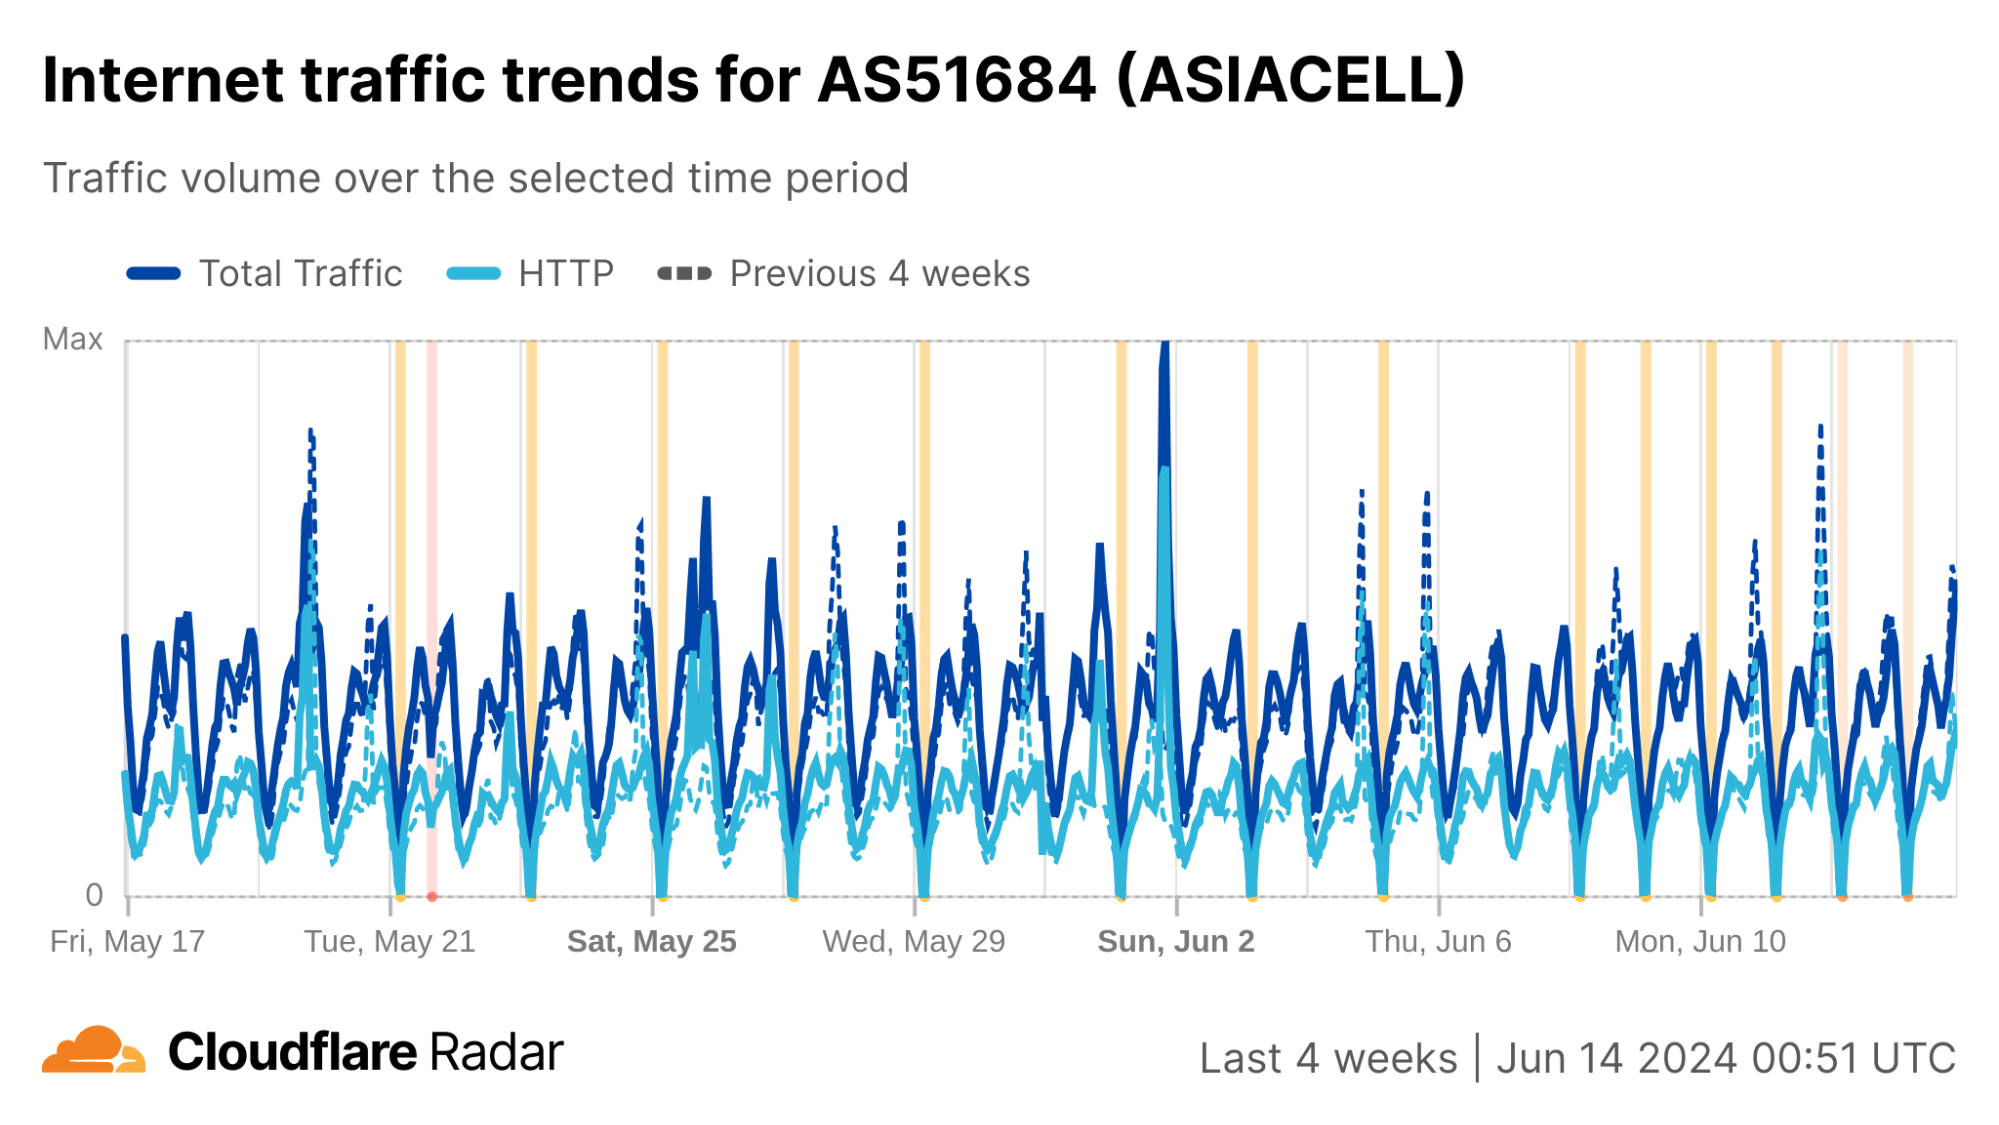
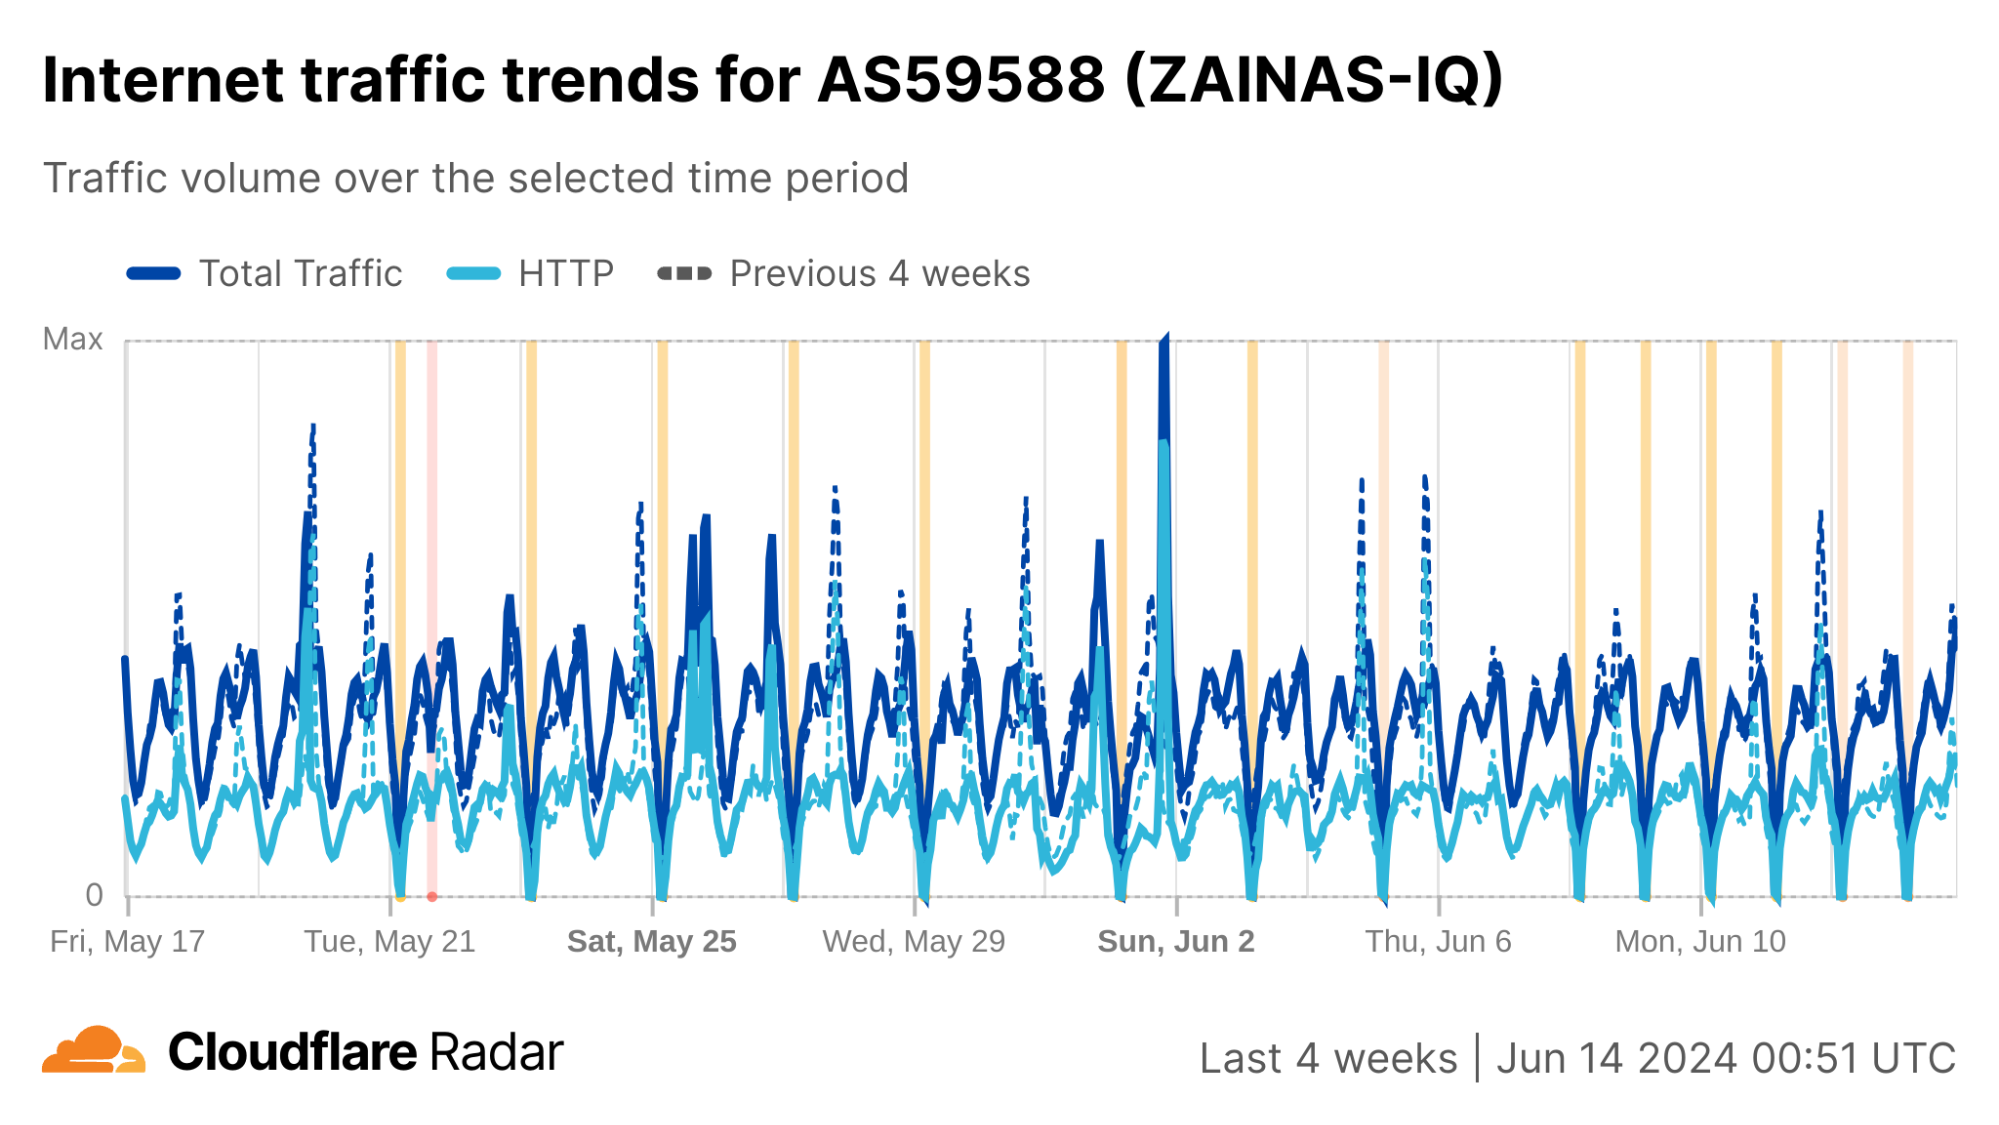
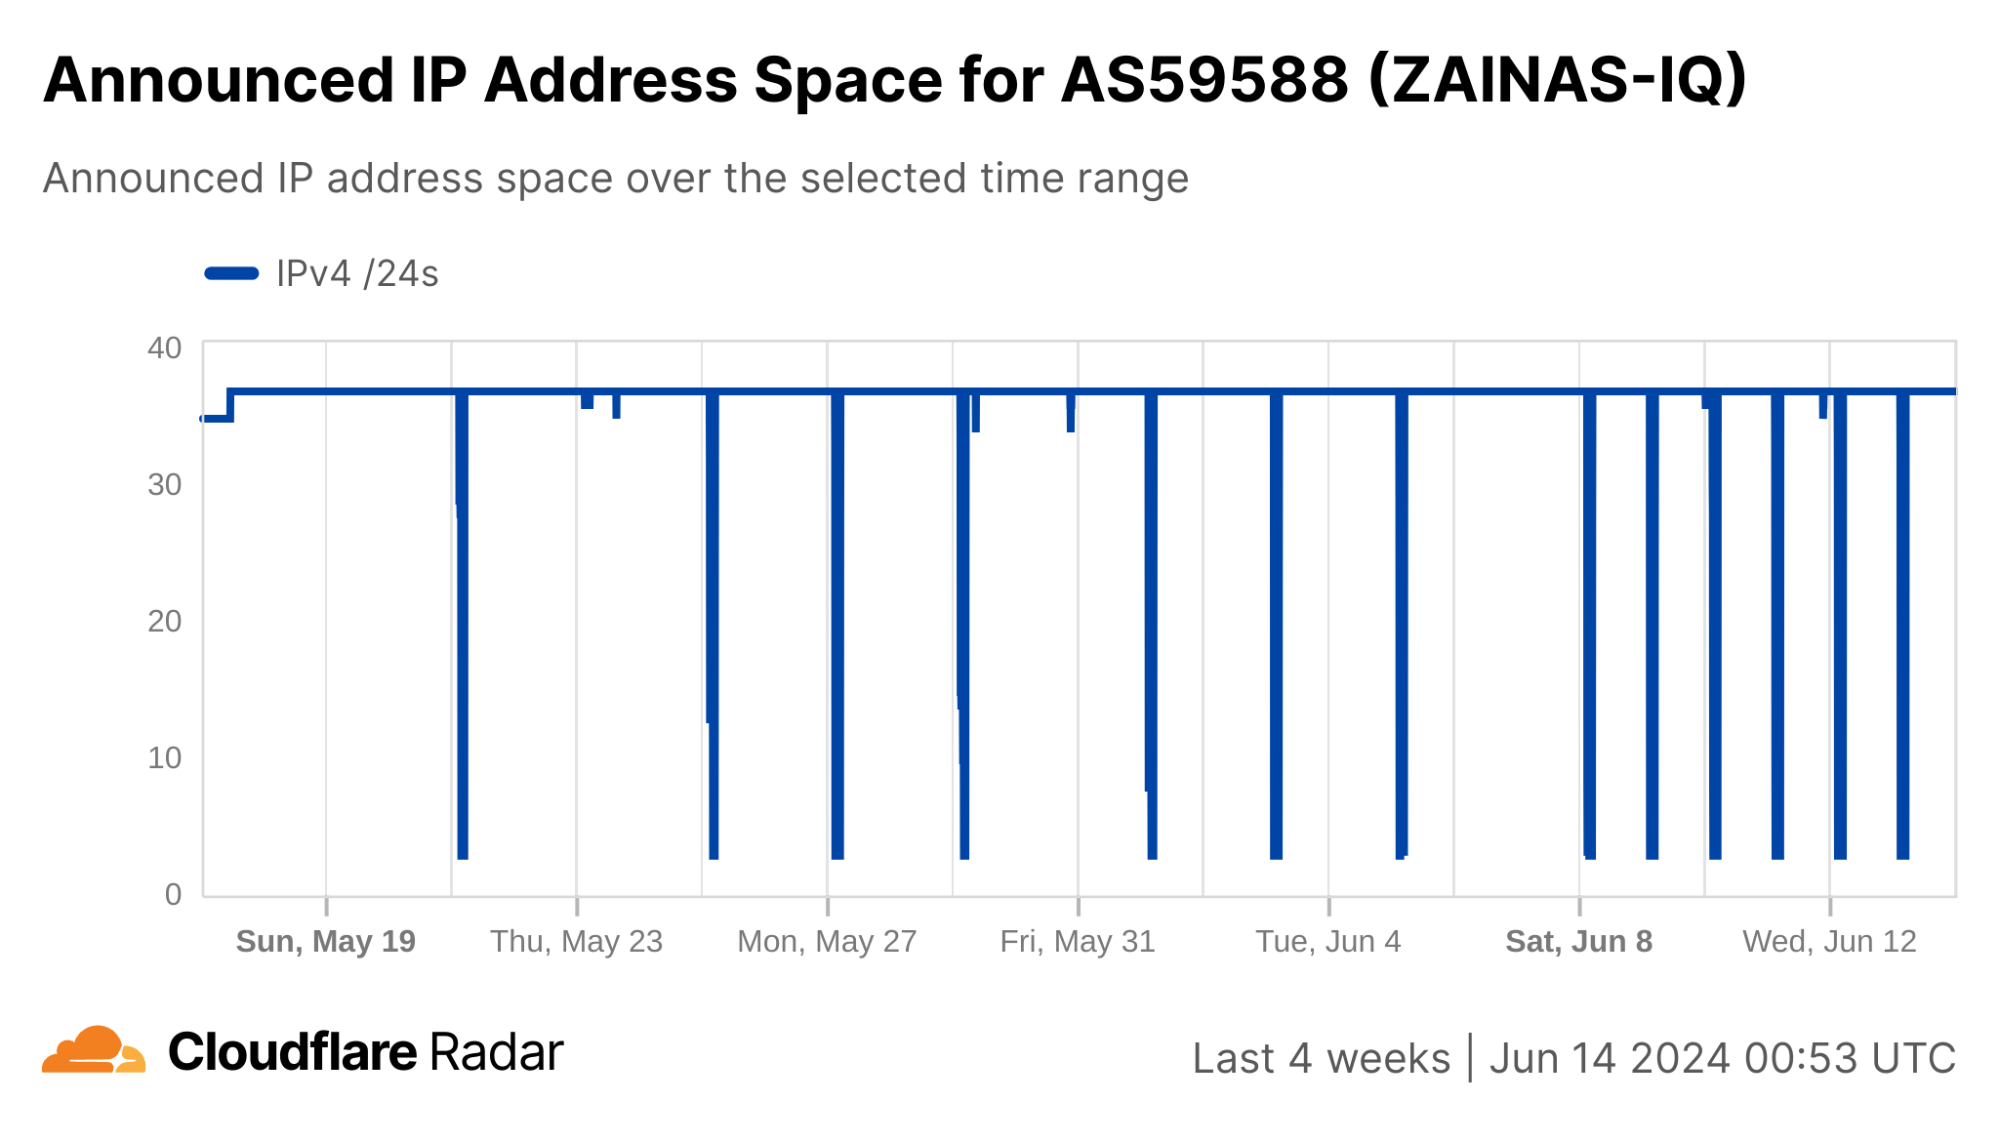
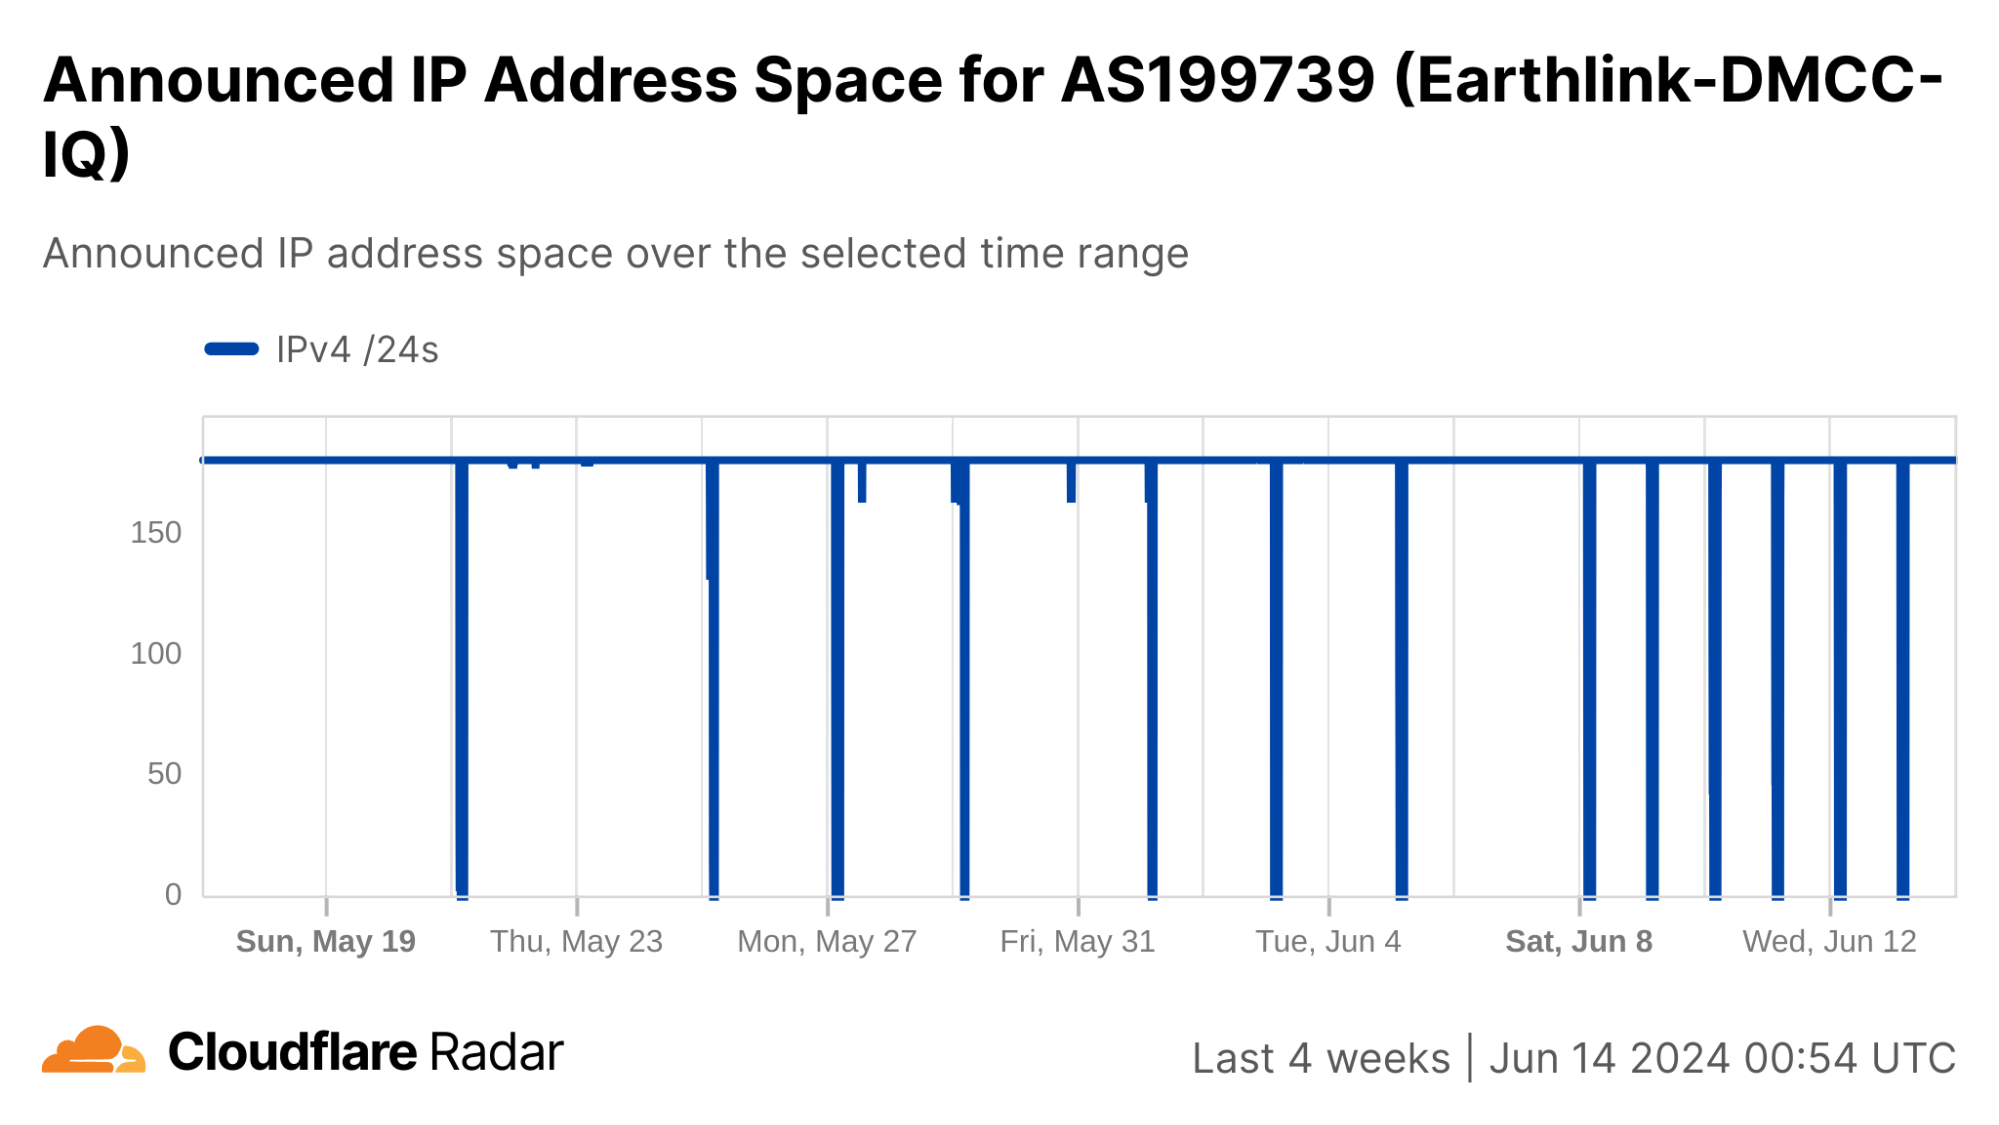
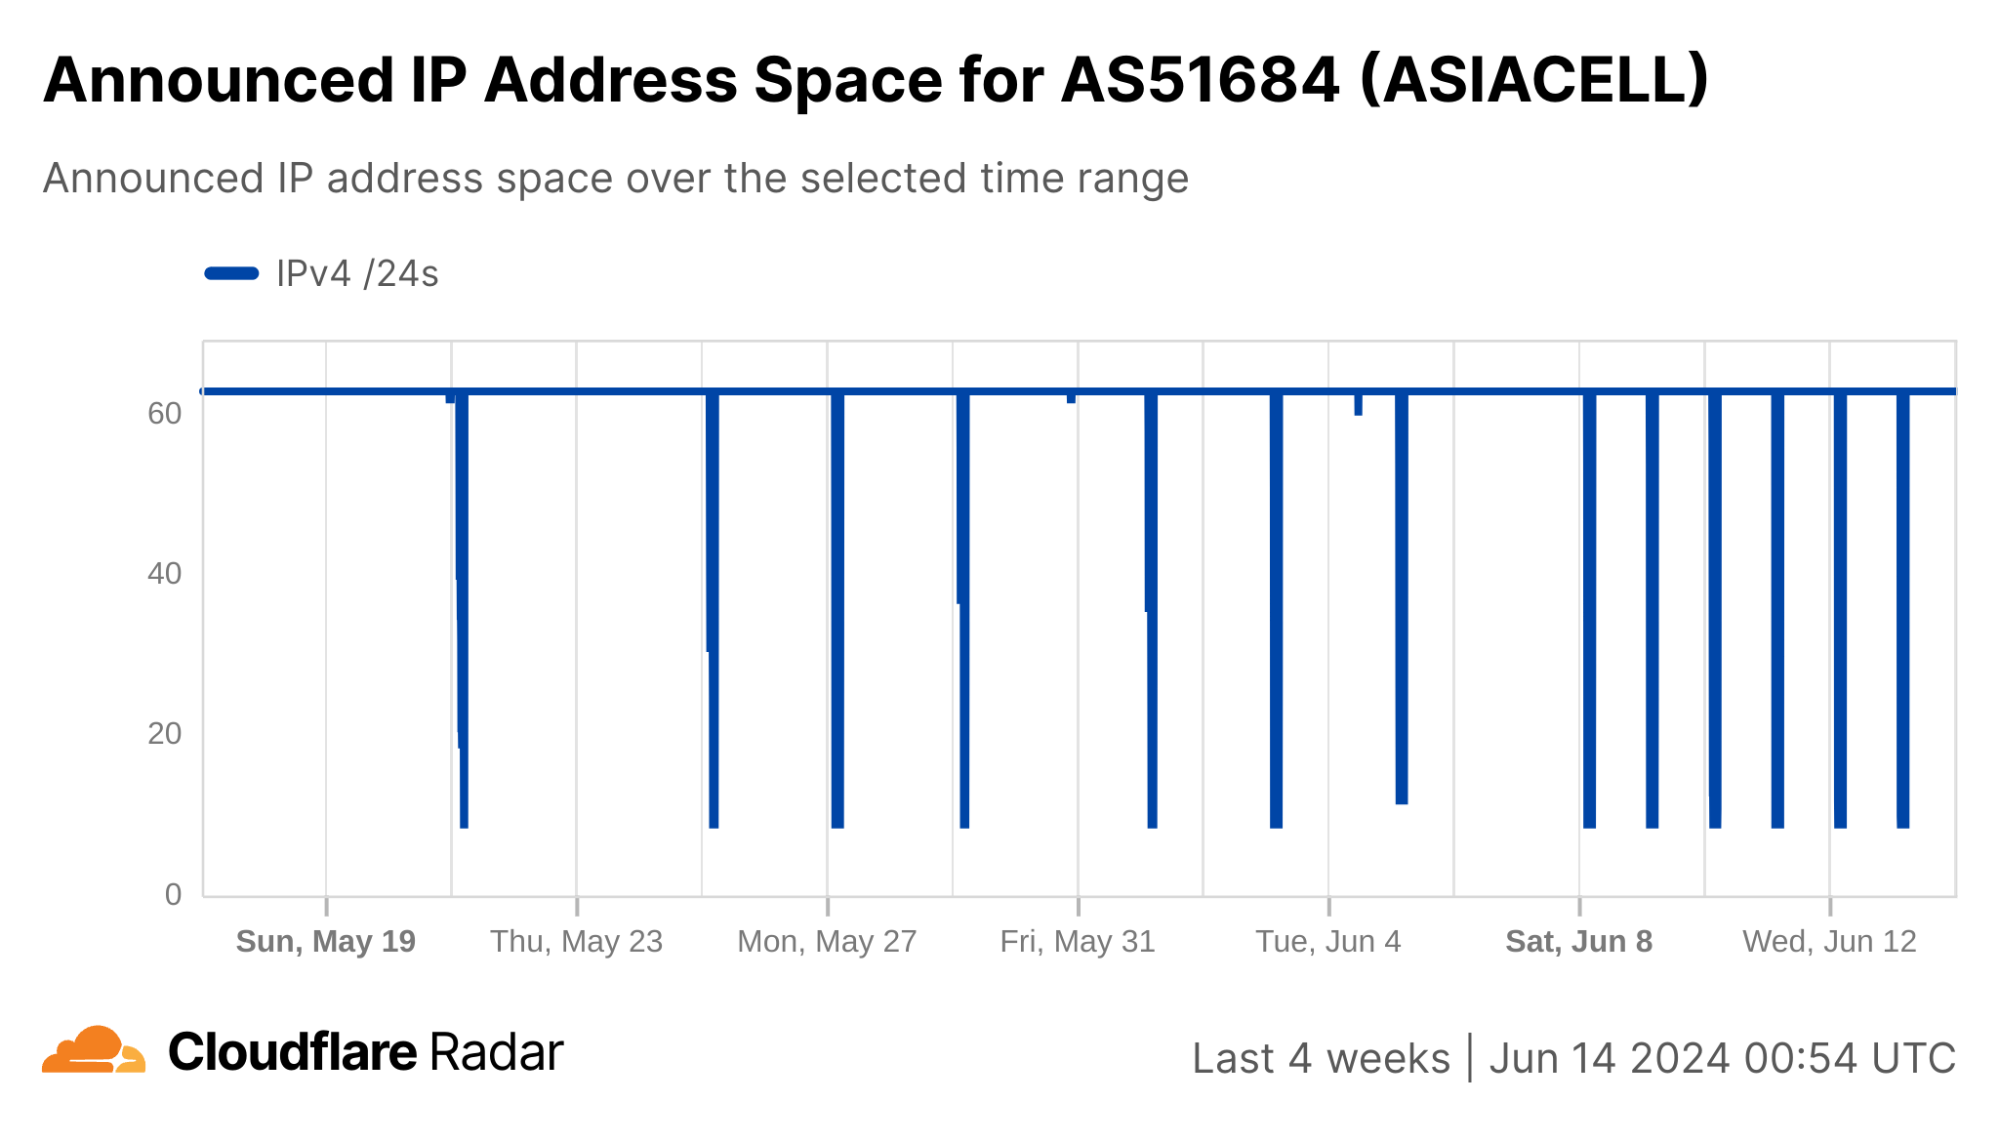
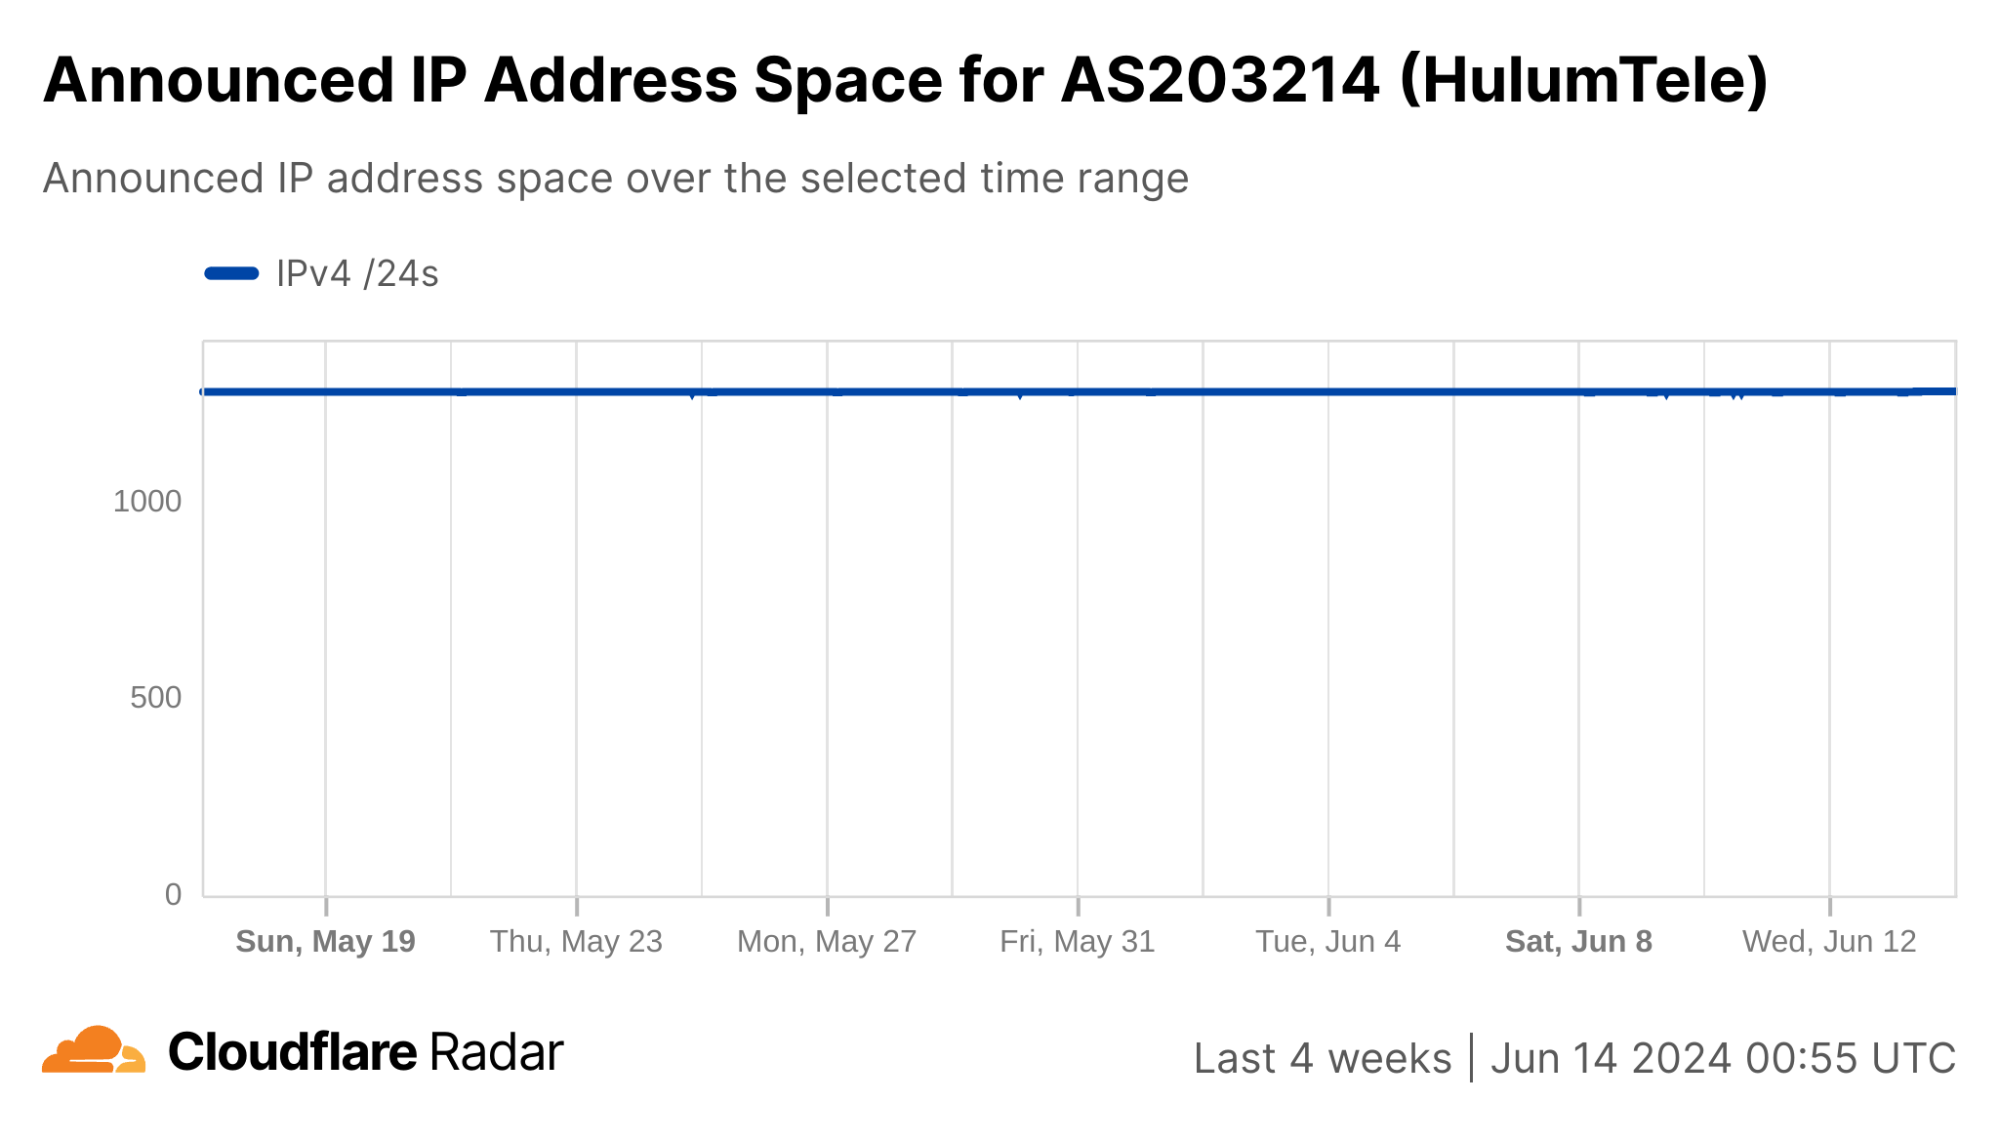
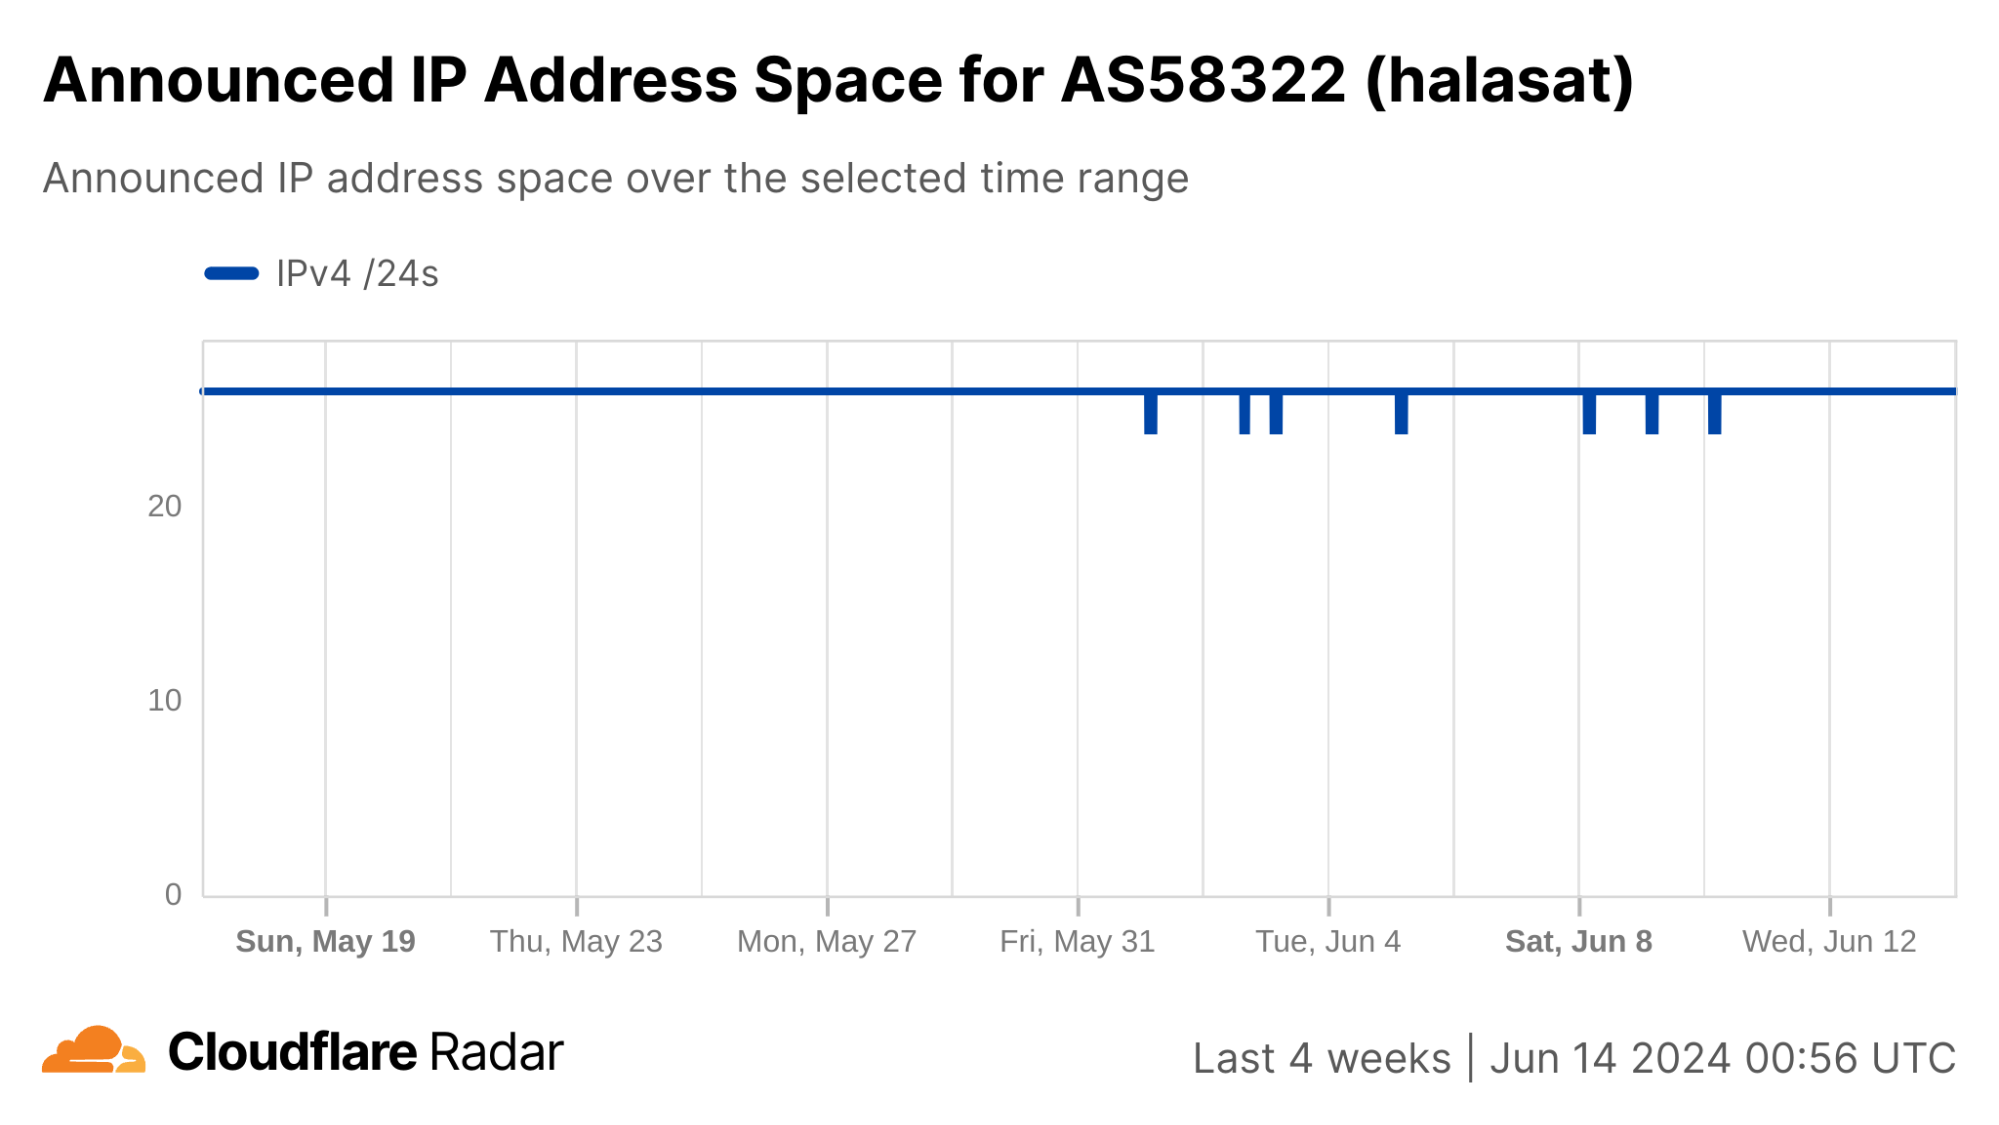
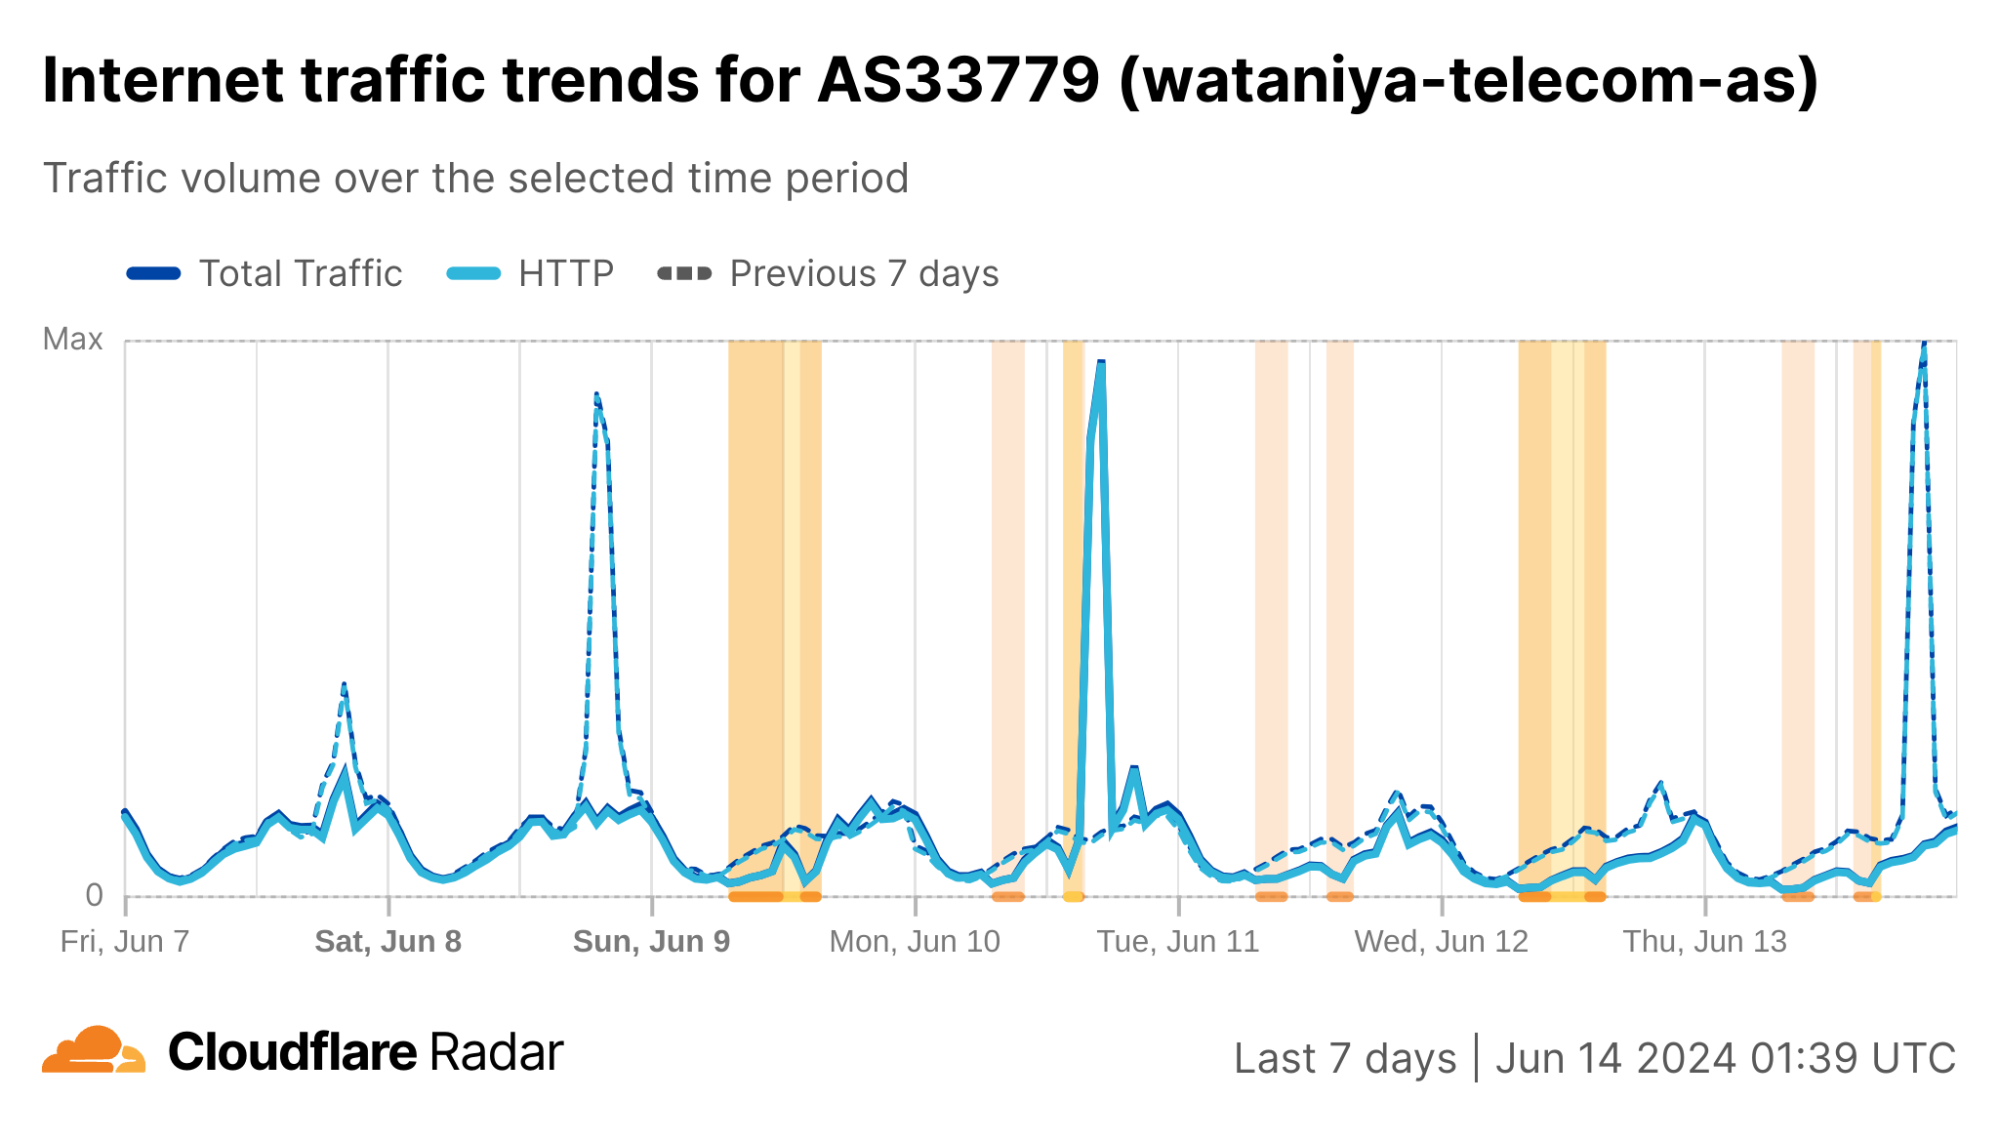
We can see this in a Cloudflare Radar traffic graph that shows the shutdowns at a country level, where traffic is dropping by around 87% during each multi-hour shutdown. In addition to the five networks also shown here (AS203214 (HulumTele), AS199739 (Earthlink), AS58322 (Halasat), AS51684 (Asiacell), and AS59588 (Zainas)), further analysis finds more than 30 where we observed a complete loss of traffic during the shutdowns, with a number of them downstream of these providers.
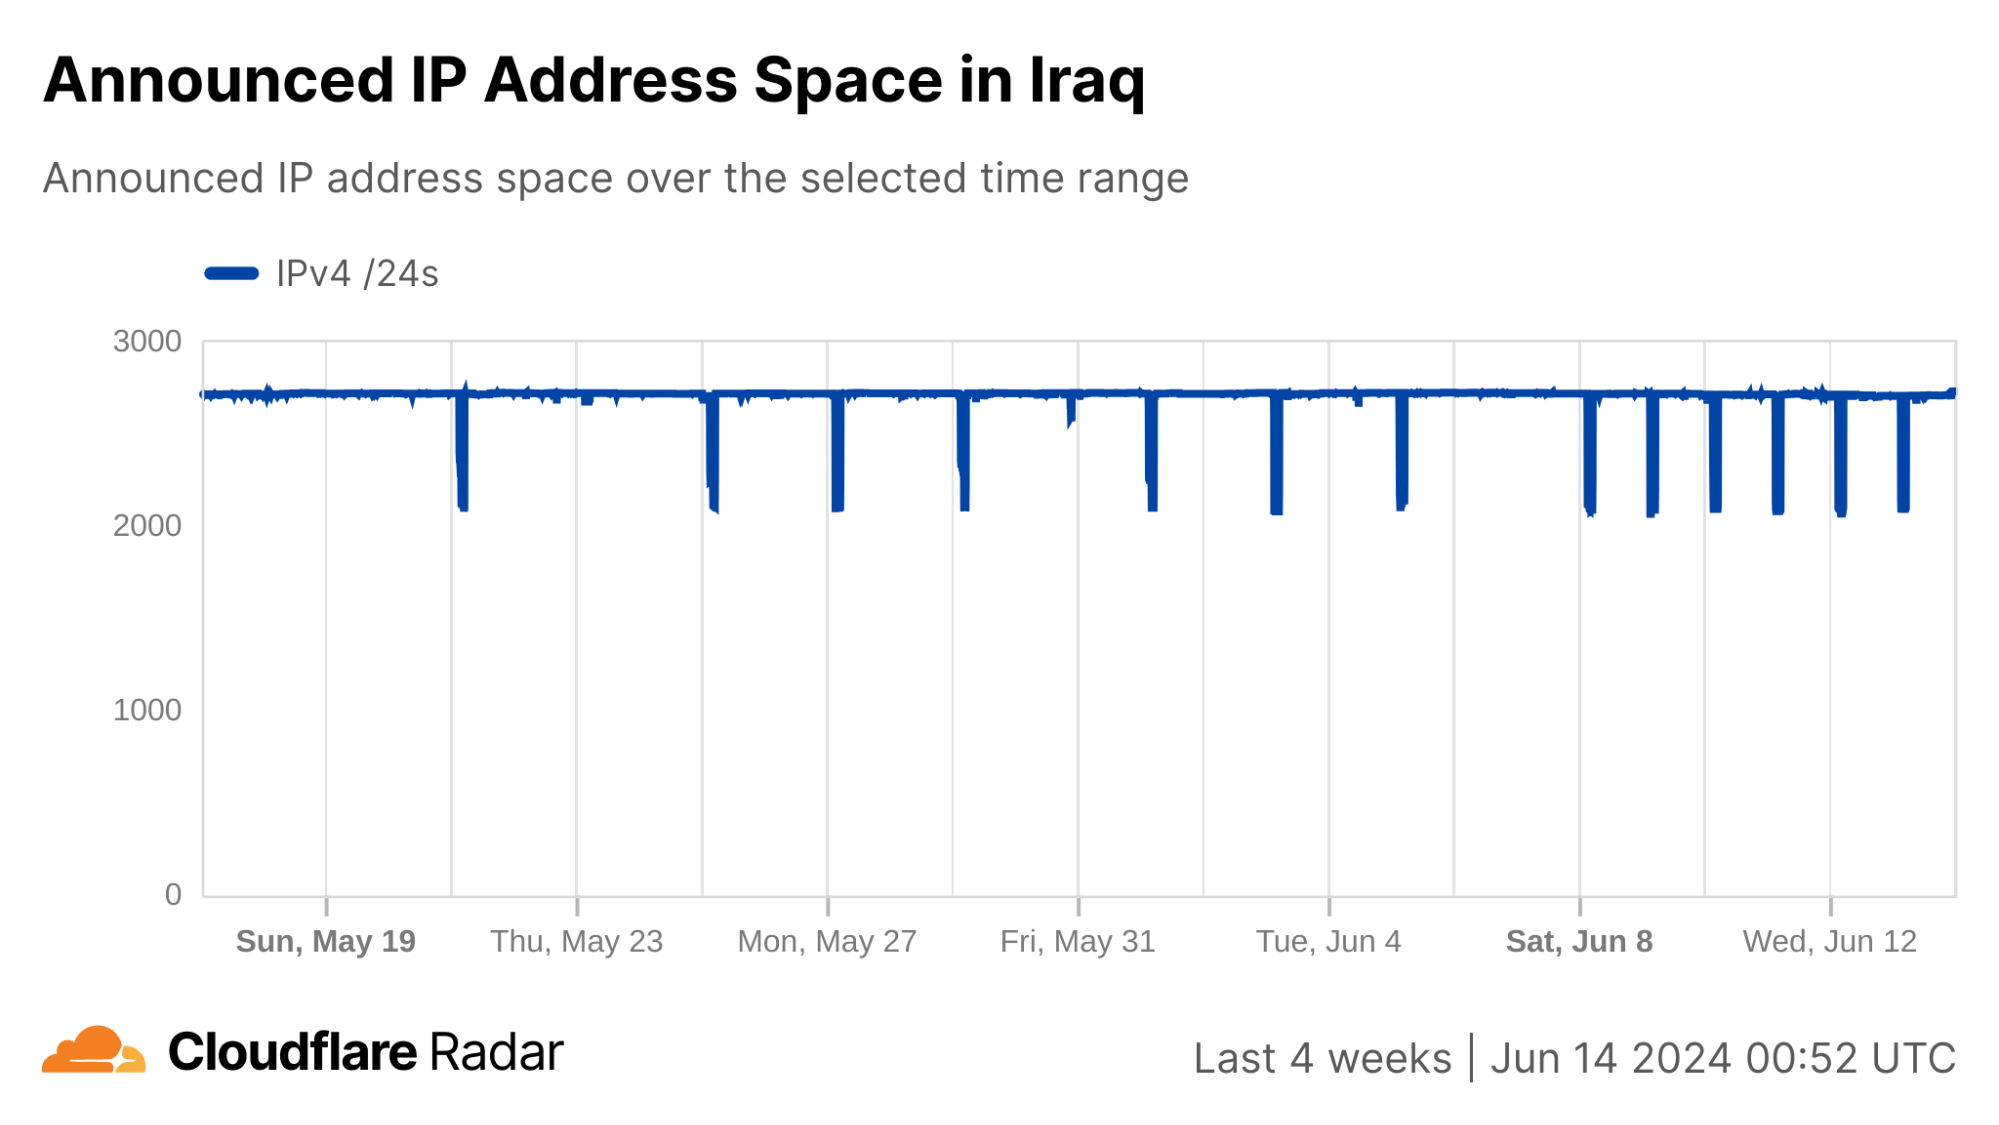
In contrast to Syria, the changes to announced IP address space during the shutdowns are much less severe in Iraq. Several of the shutdowns are correlated with a drop of ~20-25% in announced IPv4 address space, while a few others saw a drop closer to just 2%.
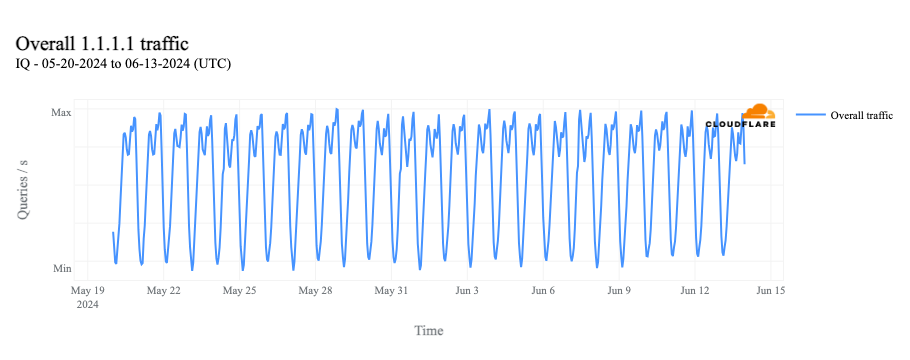
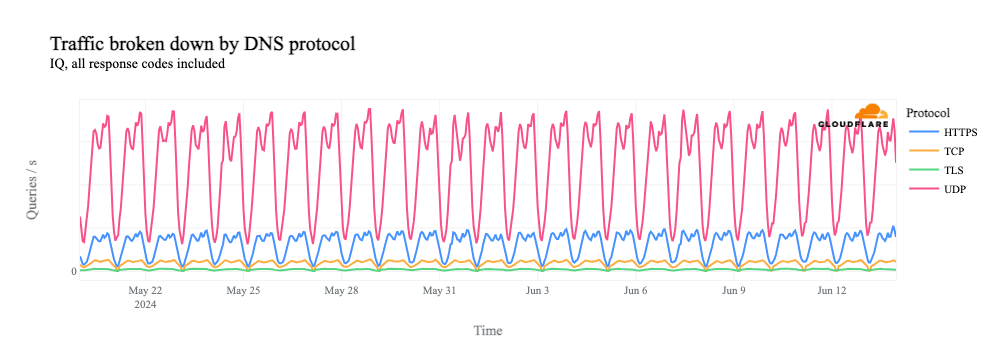
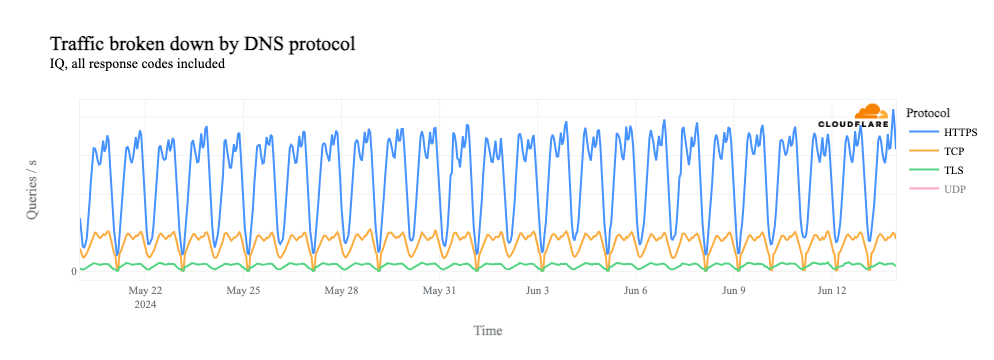
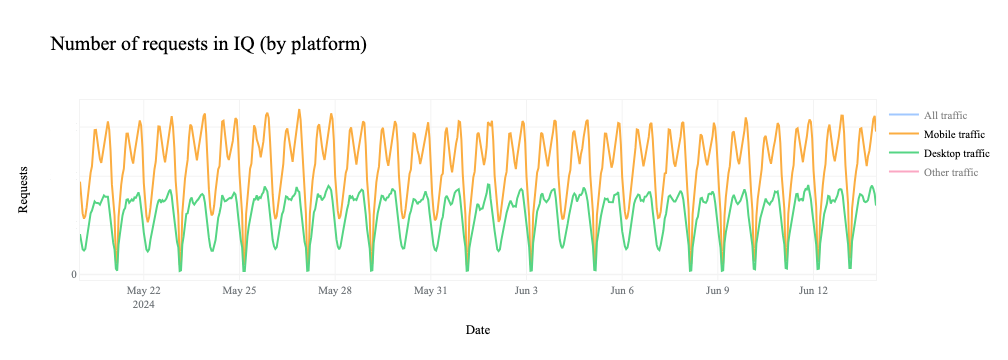
Similar to Syria, we can also look at 1.1.1.1 resolver traffic data to better understand how the shutdowns are being implemented. The country-level graphs below suggest that UDP traffic patterns are not visibly changing, suggesting that responses from the resolver are, in fact, getting back to the clients. However, this likely isn’t the case, and such a conclusion is at least in part an artifact of the graph’s time frame and hourly granularity, as well as the inclusion of resolver traffic from Kurdish network providers (ASNs). The shutdowns are more clearly evident in the DNS-over-TCP and DNS-over-HTTPS graphs below, as well as in the graph for HTTP(S) request traffic (both mobile & desktop), which is also TCP-based. In these graphs, the troughs on days that shutdowns occurred generally dip lower than those on the days that the Internet remained available.
In looking at authoritative DNS traffic from Iraq during a shutdown (for June 13 as an example day, as above), we see evidence of a decline in traffic during the time the shutdown occurs.
The decline in authoritative DNS traffic is more evident at an ASN level, such as in the graph below for AS203214 (Hulum), effectively confirming that UDP traffic is not getting through here either.
Considering the traffic, 1.1.1.1 Resolver, and authoritative DNS observations reviewed here, it suggests that the Internet shutdowns taking place in Iraq are more complex than Syria’s, as it appears that both UDP and TCP traffic are unable to egress from impacted network providers. As not all impacted network providers are showing a complete loss of announced IP address space during the shutdowns, Iraq is taking a different approach to disrupting Internet connectivity. Although analysis of our data doesn’t provide a definitive conclusion, there are several likely options, and network providers in the country may be combining several. These options revolve around:
IP: Block packets from reaching IP addresses. This may be done by withdrawing prefix announcements from the routing table (a brute force approach) or by blocking access to specific IP addresses, such as those associated with a specific application or service (a more surgical approach).
Connection: Block connections based on SNI/HTTP headers, or other application data. If a network or on-path device is able to observe the server name (or other relevant headers/data), then the connection can be terminated.
DNS: Operators of private or ‘internal’ DNS resolvers, offered by ISPs and enterprise environments for use by their own users, can apply content restrictions, blocking the resolution of hostnames associated with websites and other applications.
The consequences of these options are covered in more detail in a blog post. In addition, applying them at common network chokepoints, such as AS212330 (IRAQIXP) or AS208293 (AlSalam State Company, associated with the Iraqi Ministry of Communications), can disrupt connectivity at multiple downstream ISPs, without those providers necessarily having to take action themselves.
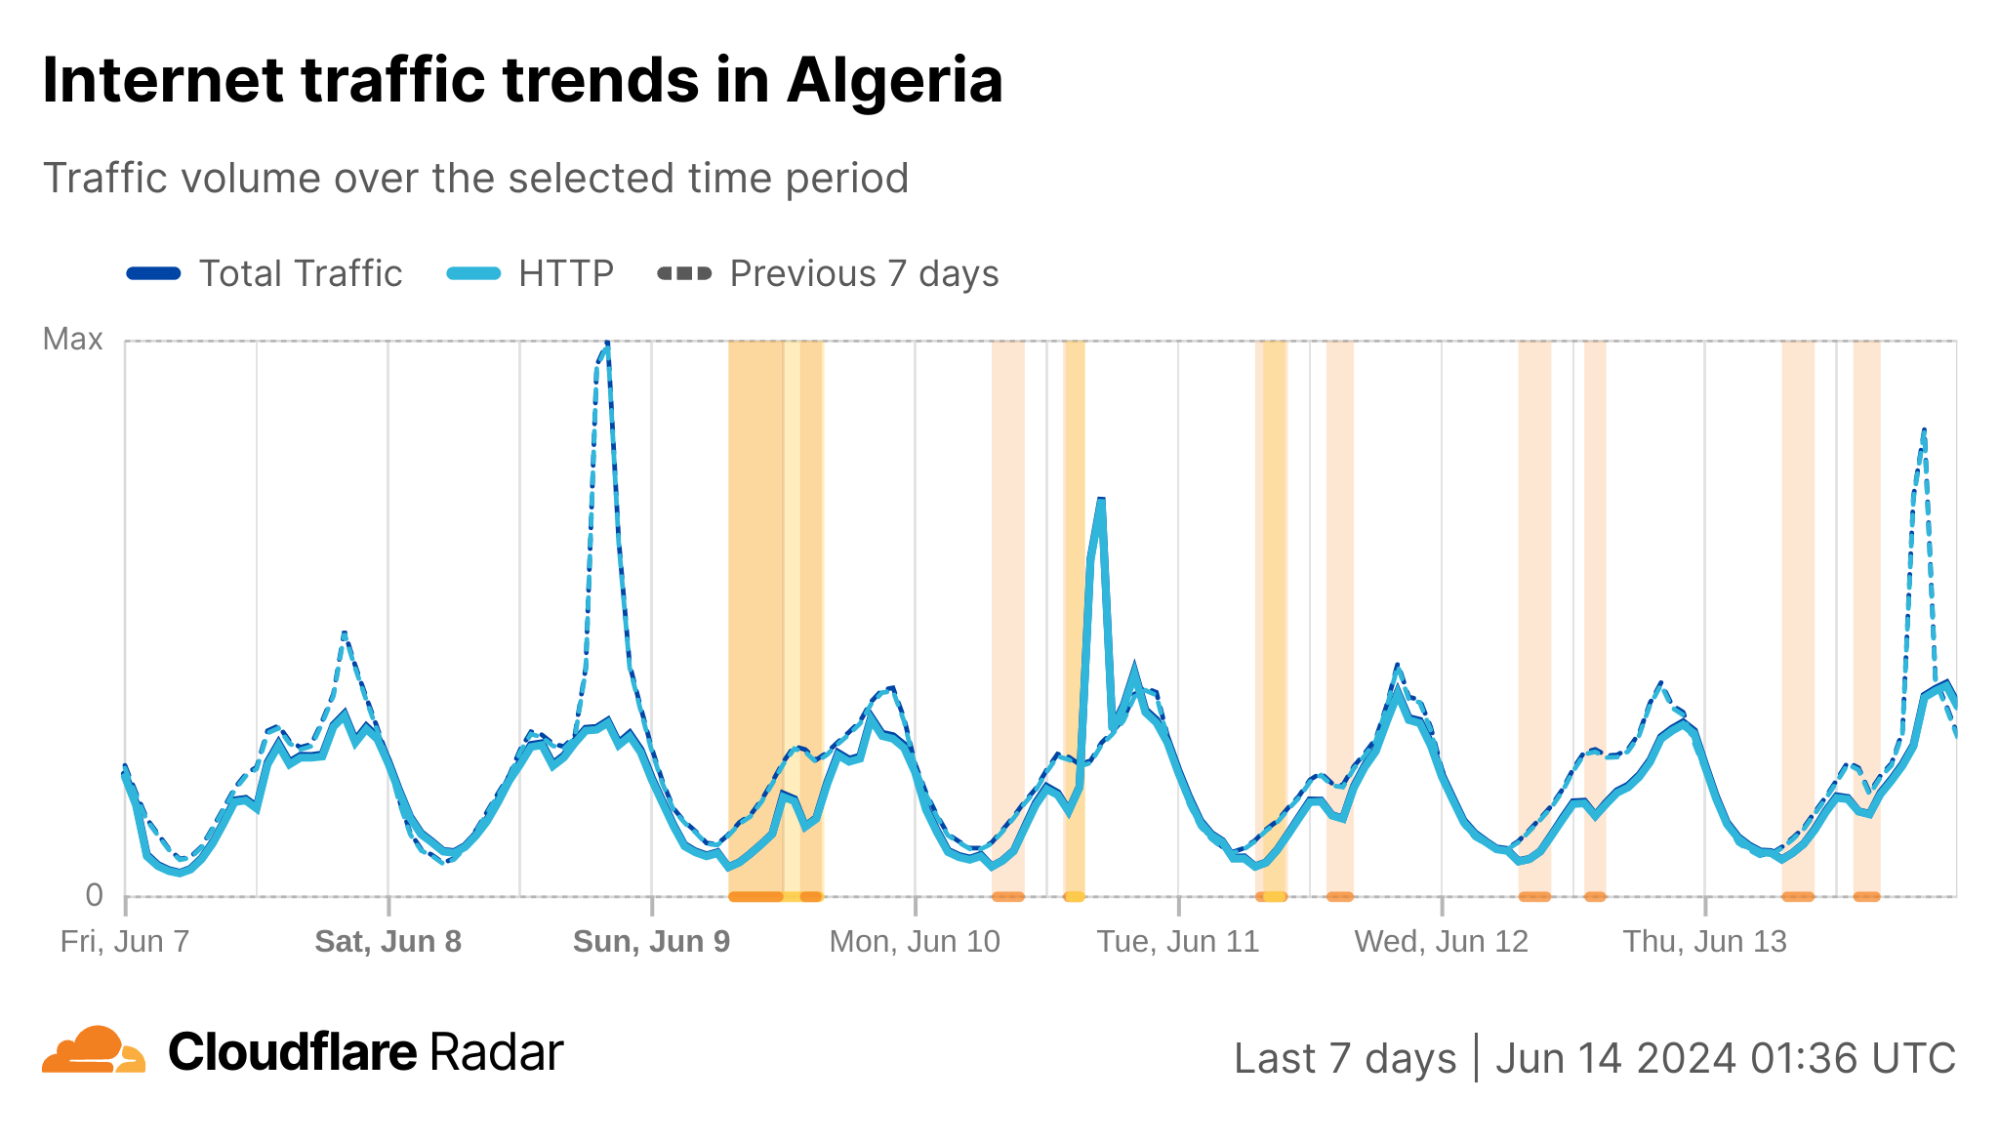
Algeria
As we noted in blog posts in 2022 and 2023, Algeria has a history of disrupting Internet connectivity during Baccalaureate exams. This has been taking place since 2018, following widespread cheating in 2016 that saw questions leaked online both before and during tests. On March 13, the Algerian Ministry of Education announced that the Baccalaureate exams would be held June 9-13. As expected, Internet disruptions were observed both country-wide and at a network level. Similar to previous years, two disruptions were observed each day. The first one began at 08:00 local time (07:00 UTC), and except for June 9, lasted three hours, ending at 11:00 local time (10:00 UTC). (On June 9, it lasted until 13:00 local time (12:00 UTC).) The second one began between 14:00-14:30 local time (13:00-13:30 UTC), and lasted until 16:00-17:00 local time (15:00-16:00 UTC) – the end time varied by day.
As seen in the graphs below, the impact to traffic was fairly nominal, suggesting that wide scale Internet shutdowns similar to those seen in Syria were not being implemented. While this is in line with 2023’s pronouncement by the Minister of Education that there would be no Internet shutdown on exam days, a number of posts on X complained of broader cuts to Internet connectivity.
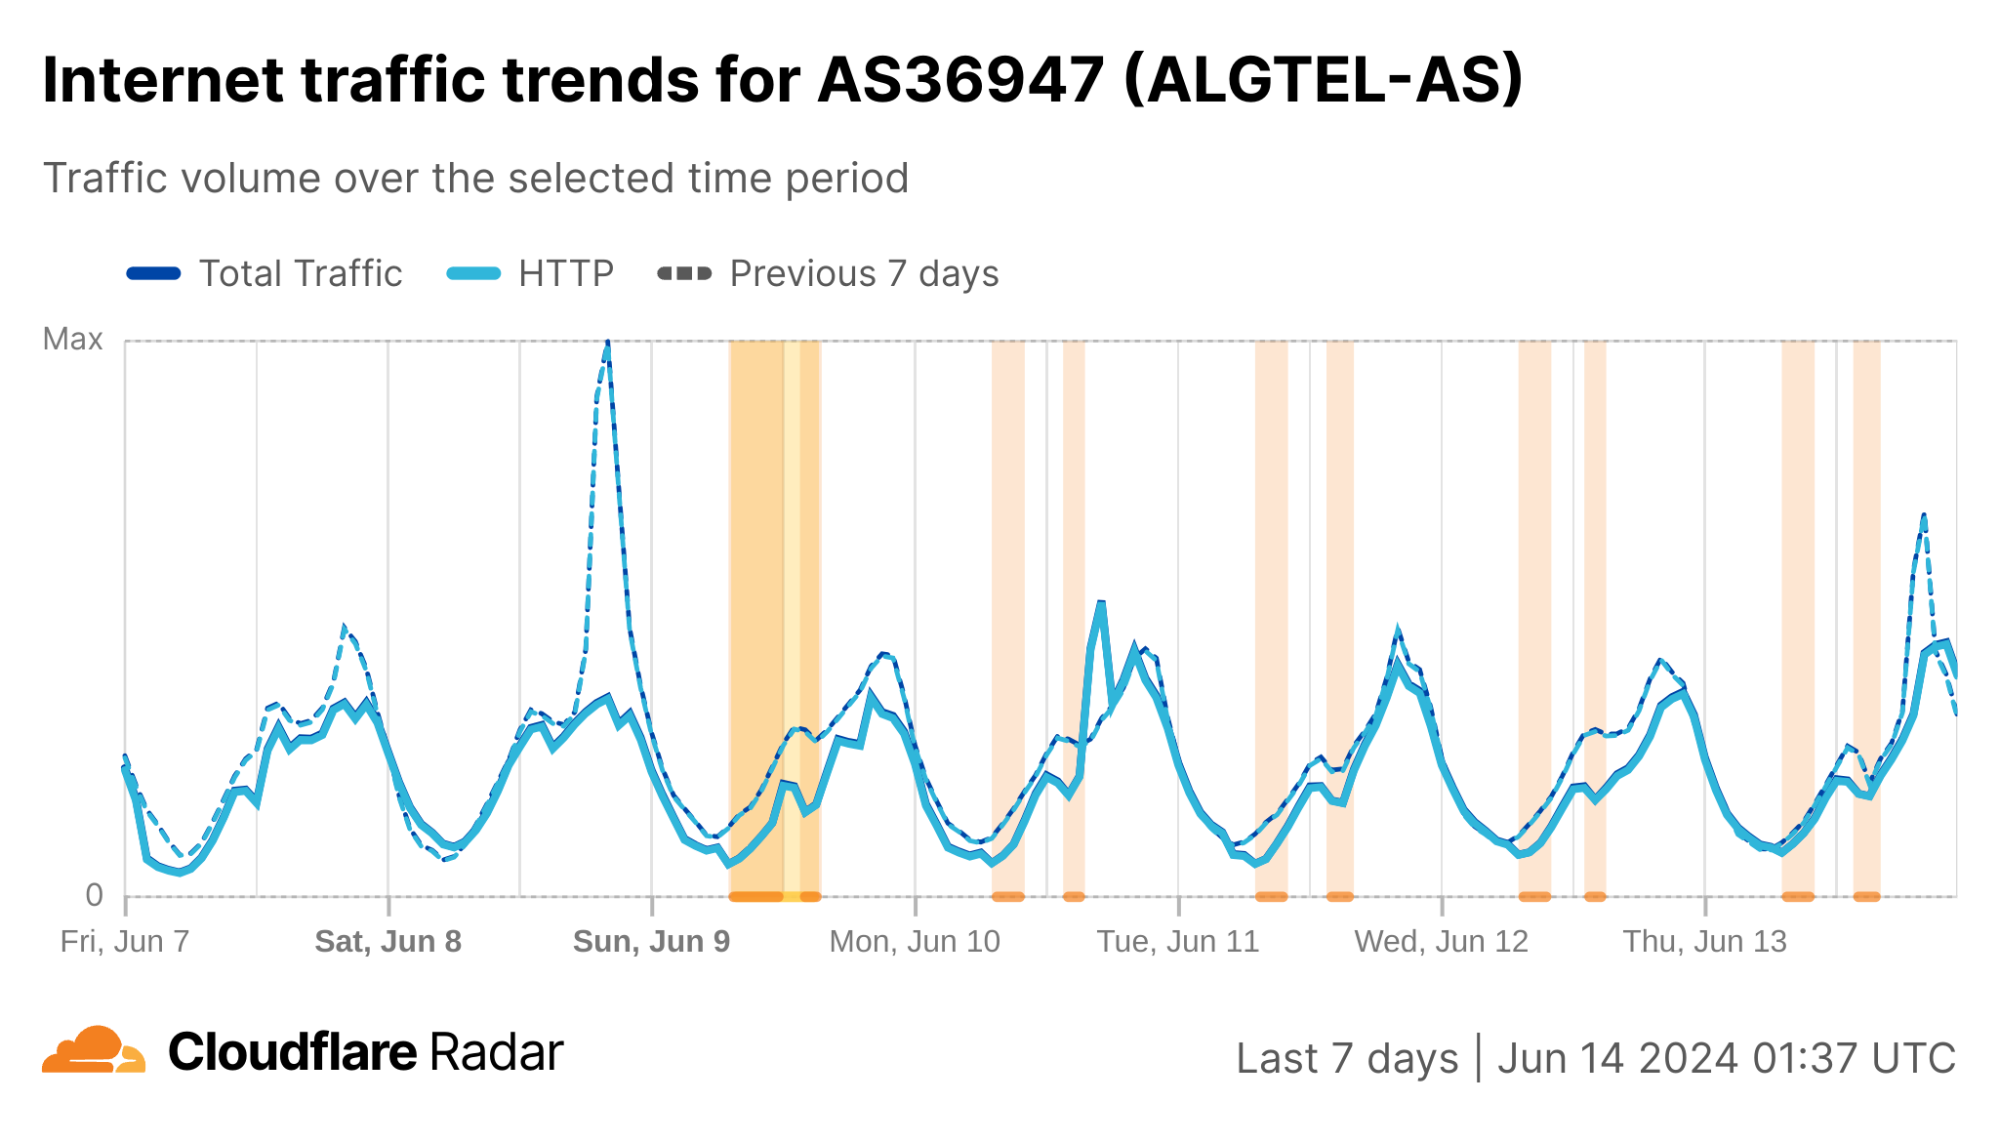
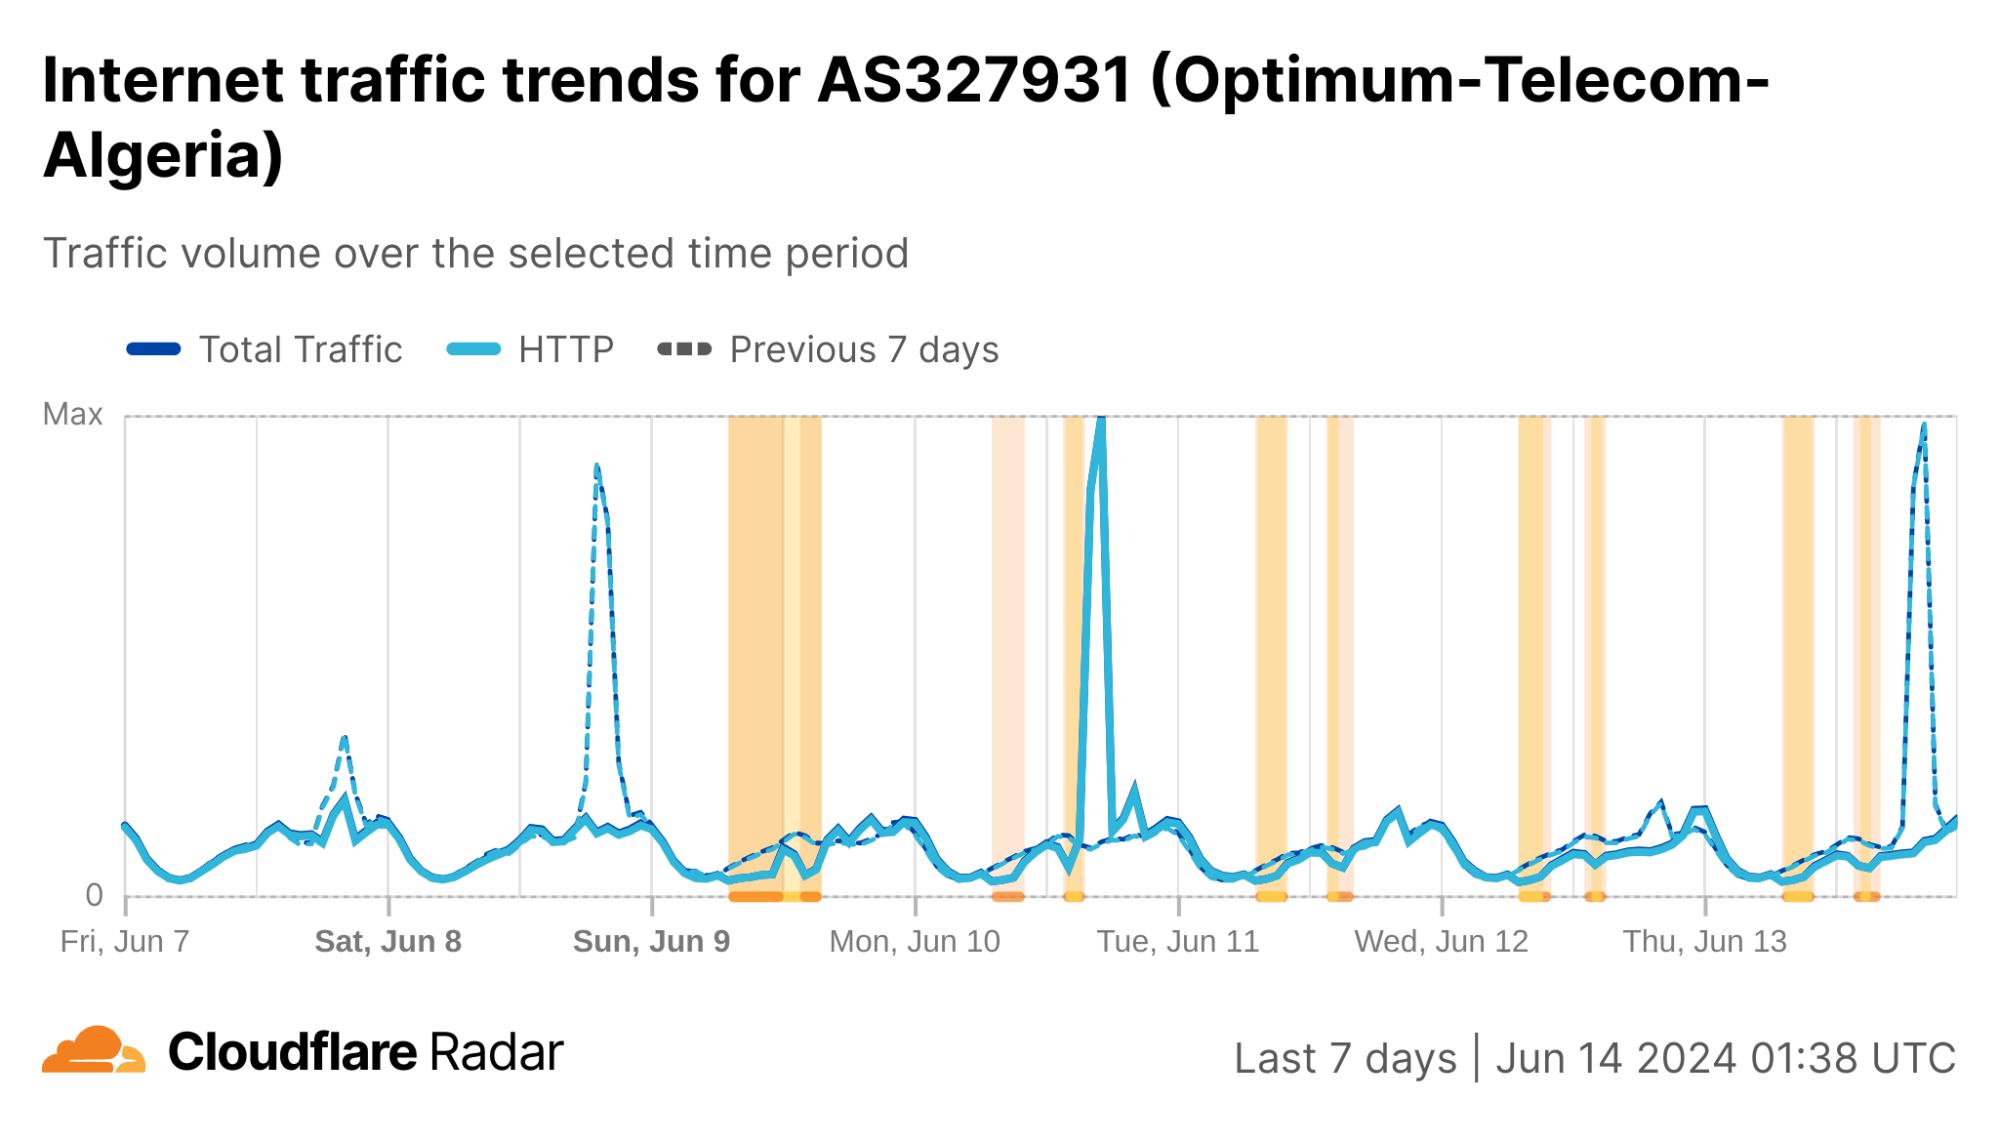
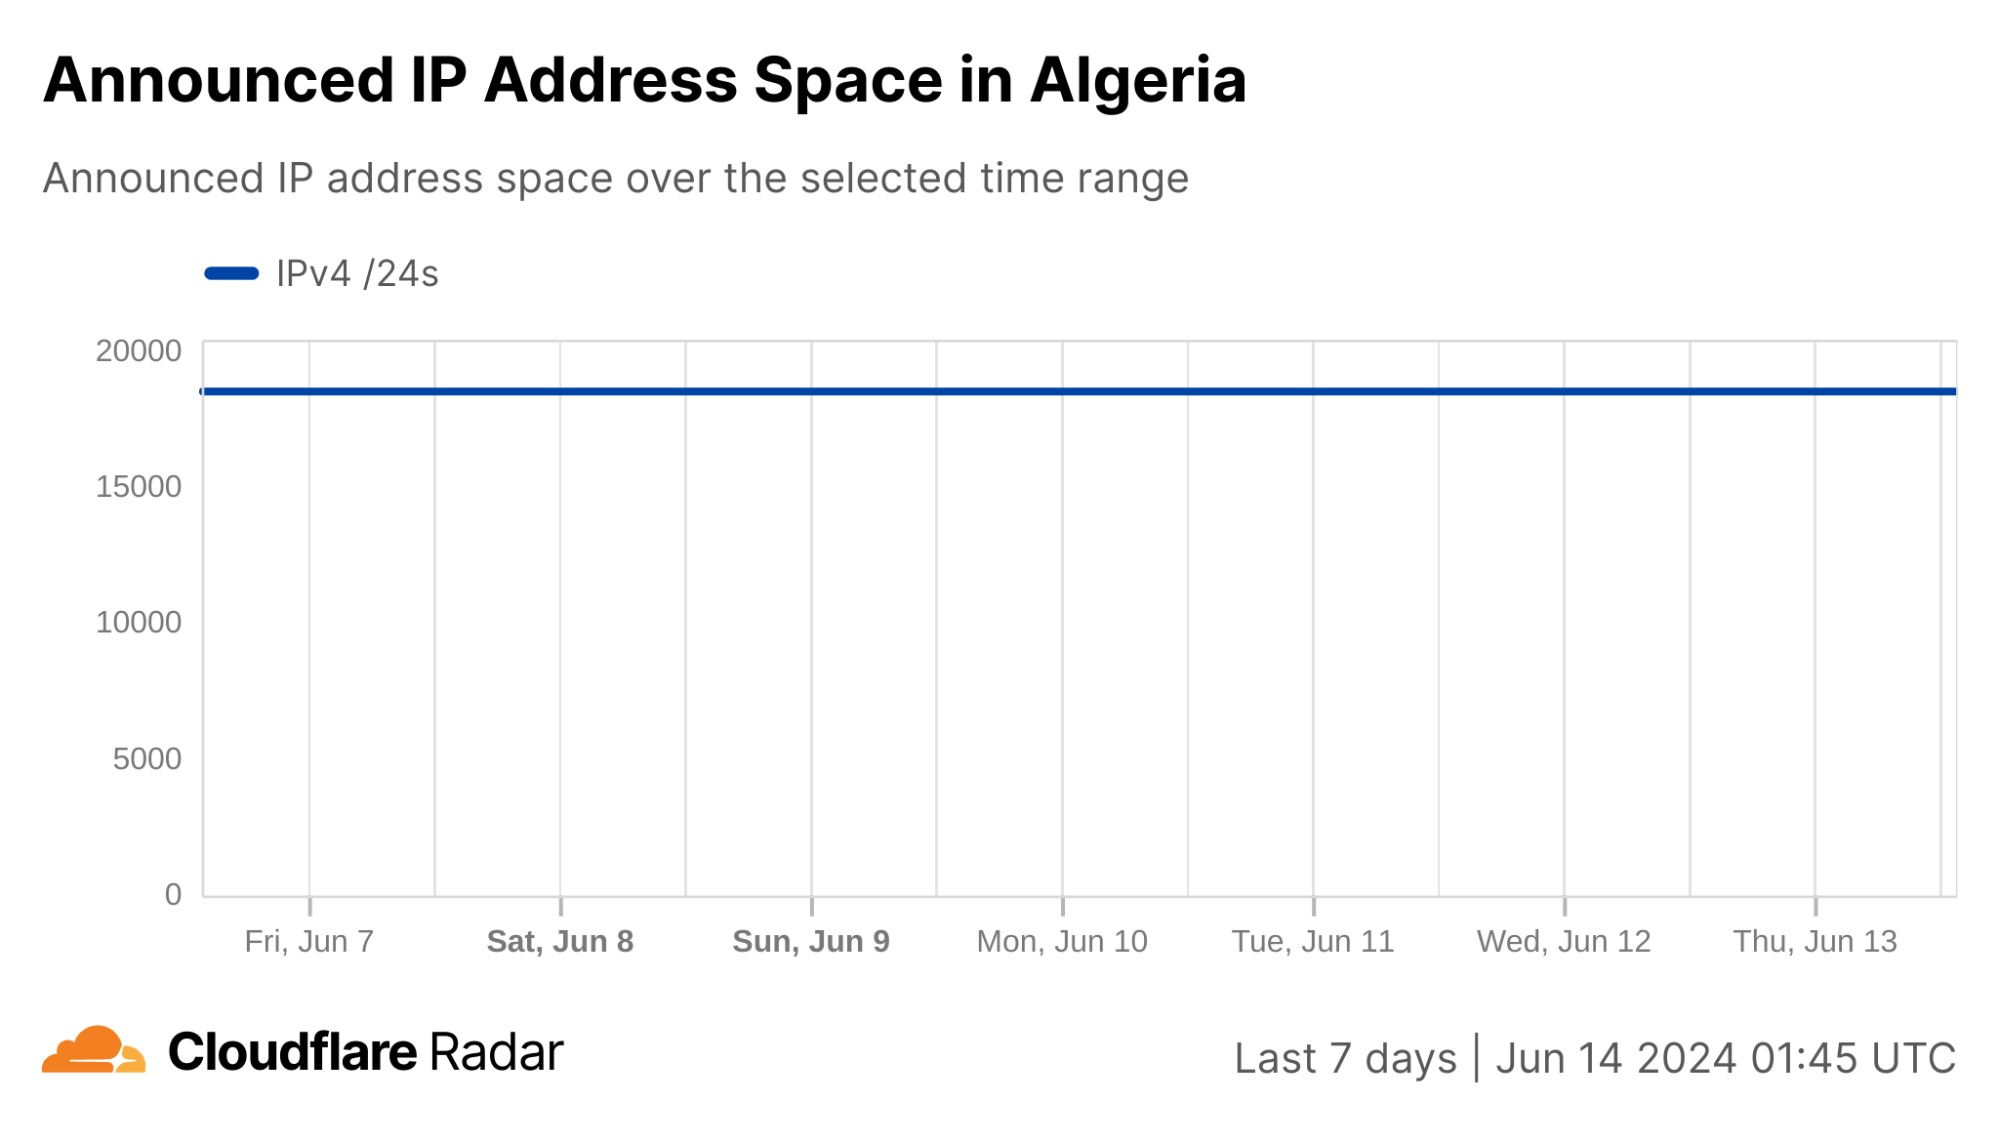
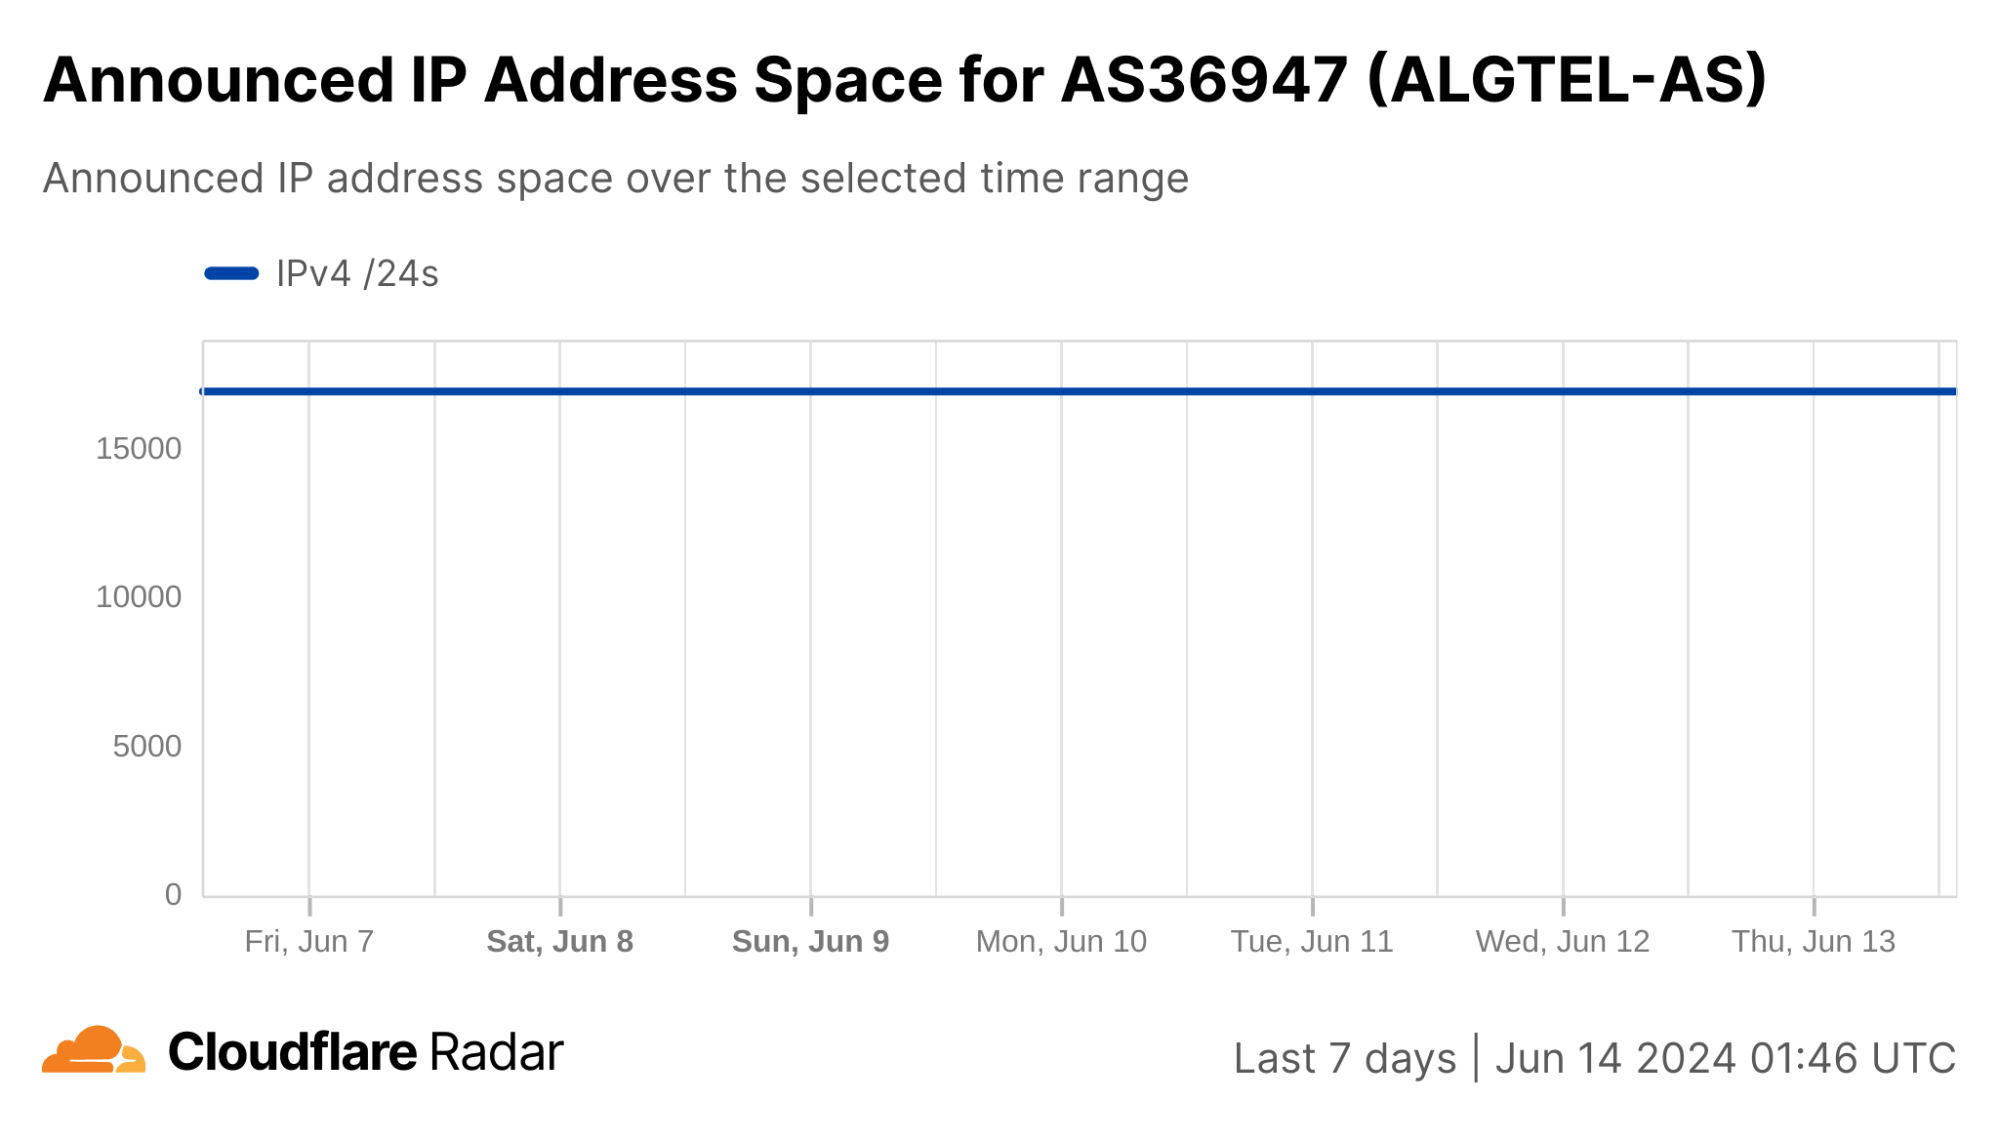
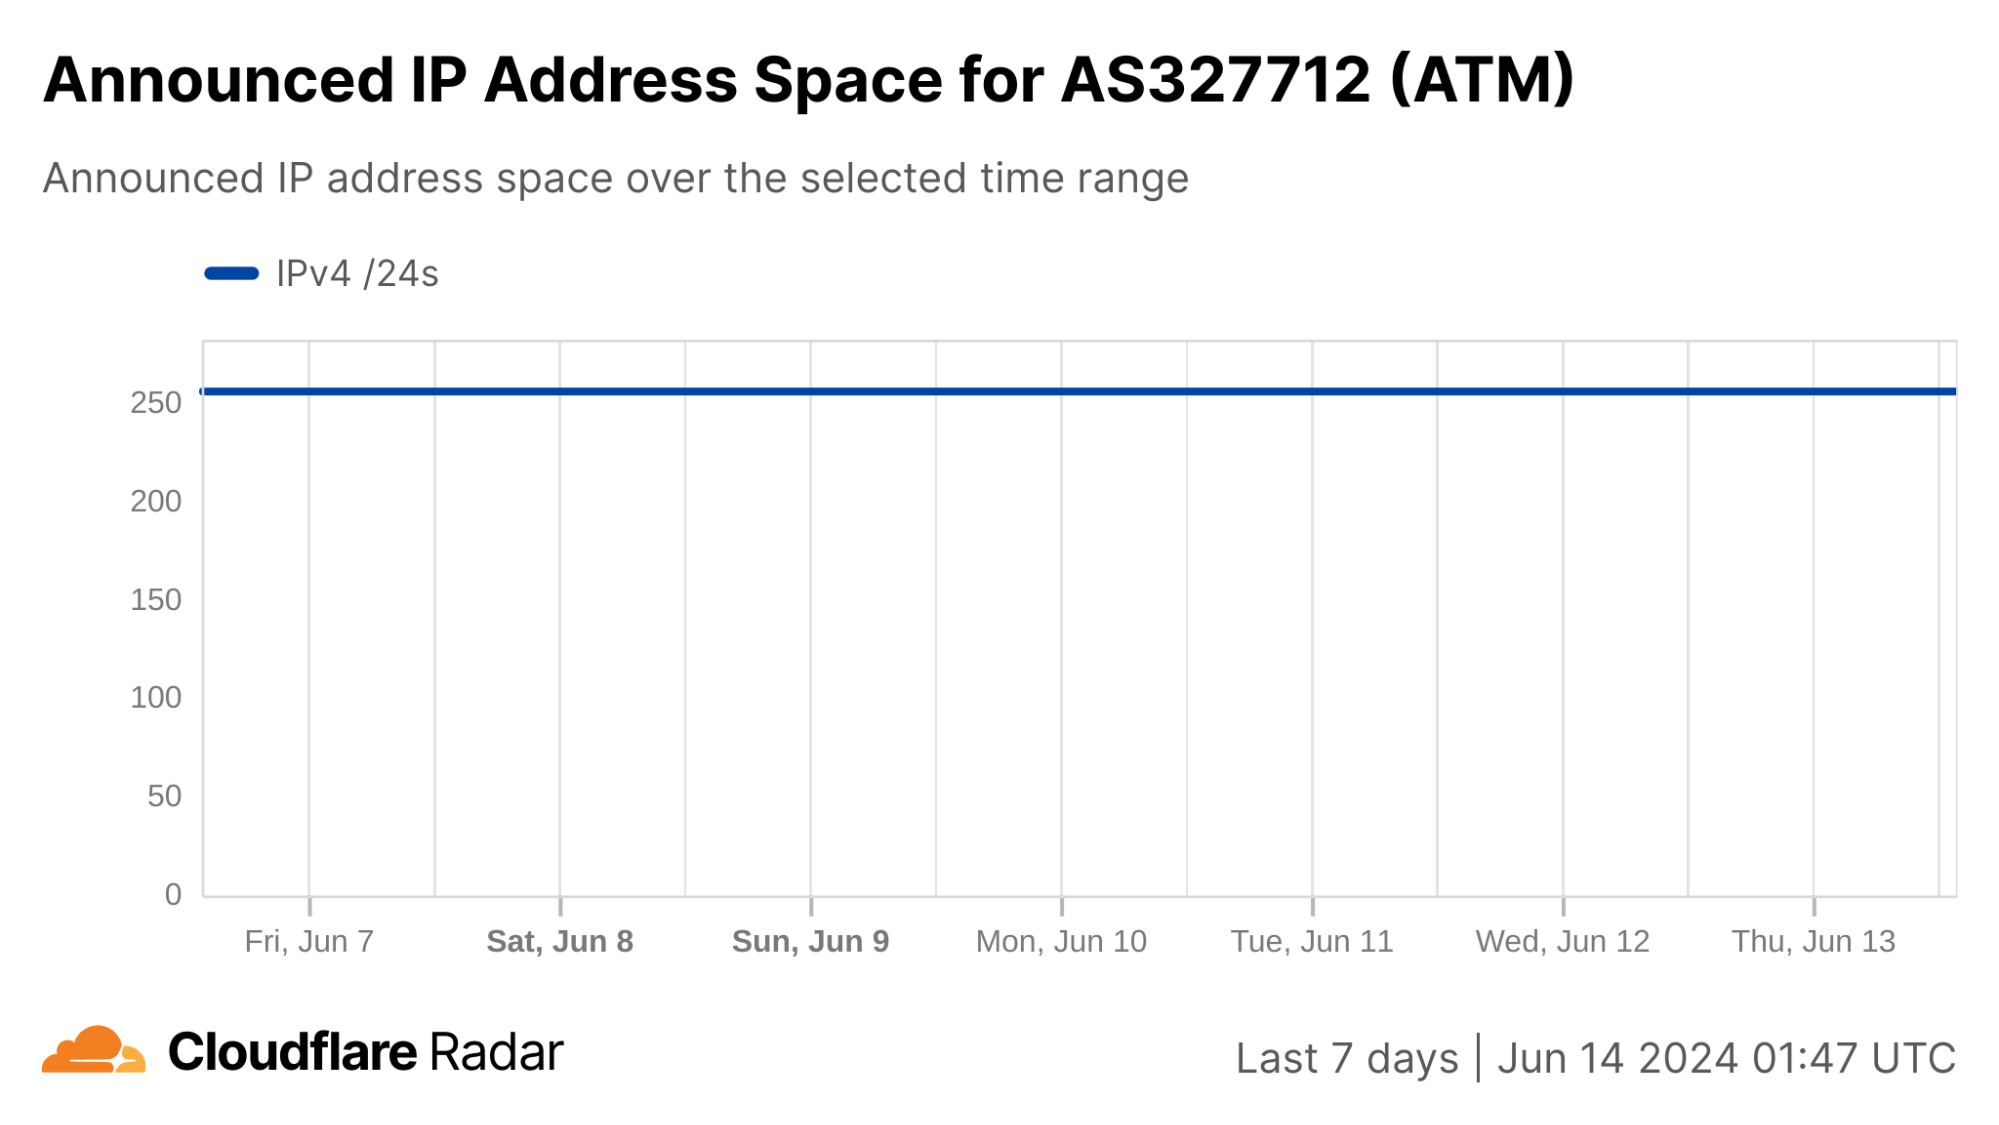
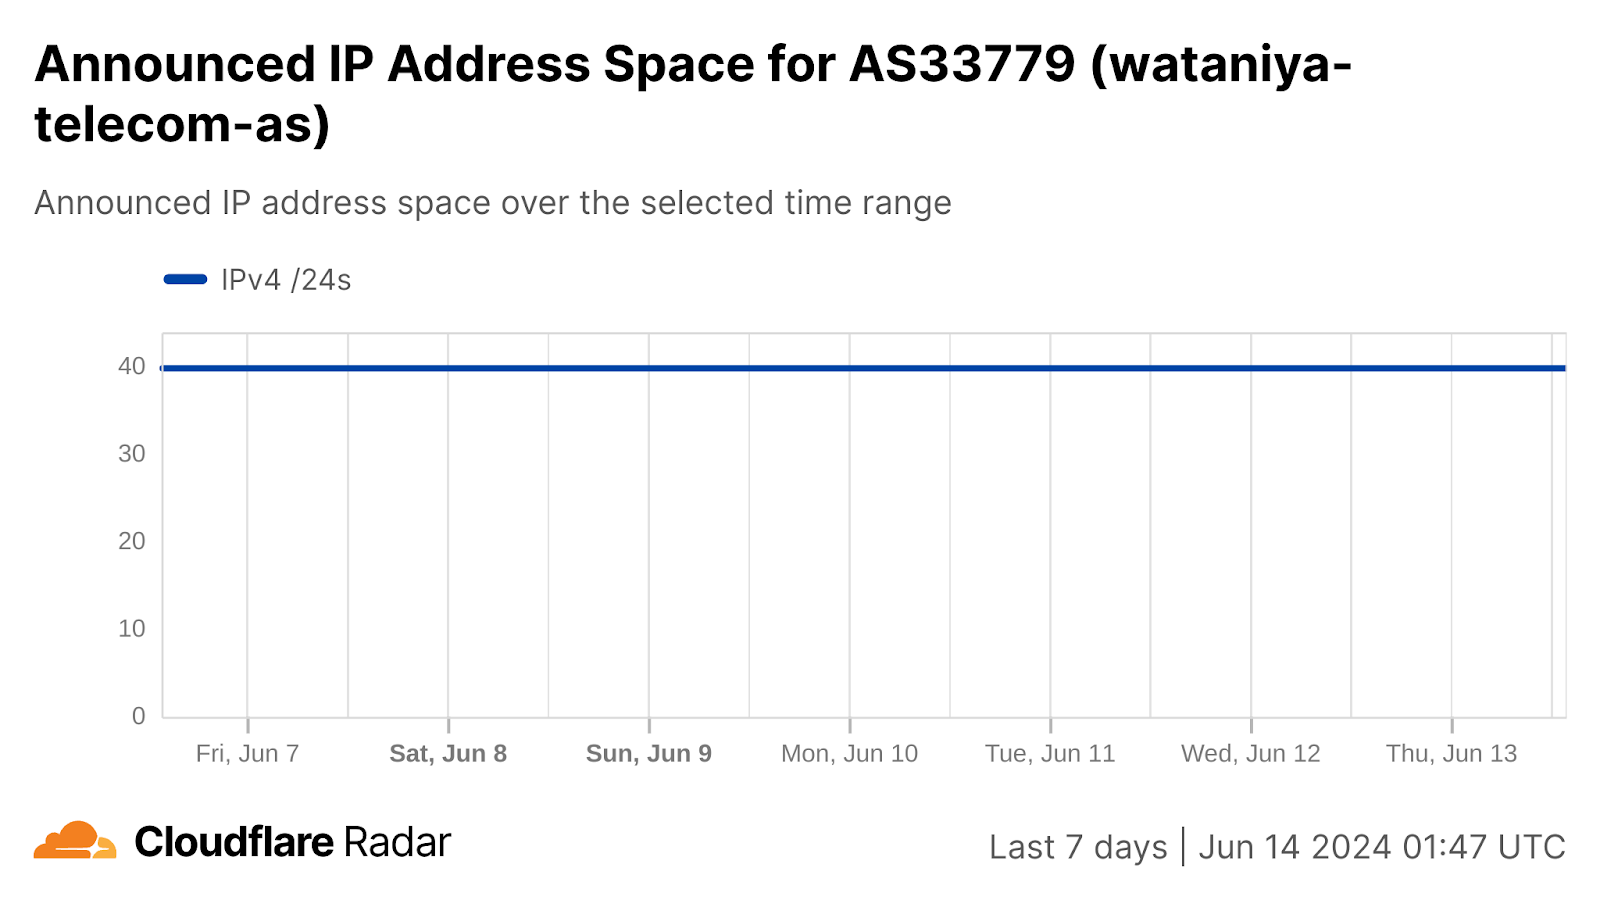
Similar to the analysis above of the shutdowns in Syria and Iraq, we can also review changes to announced IP address space to better understand how connectivity was being disrupted. In this case, as the graphs below show, no meaningful changes to announced IPv4 address space were observed during the days the Baccalaureate exams were given. As such, the observed drops in traffic were not caused by routing changes.
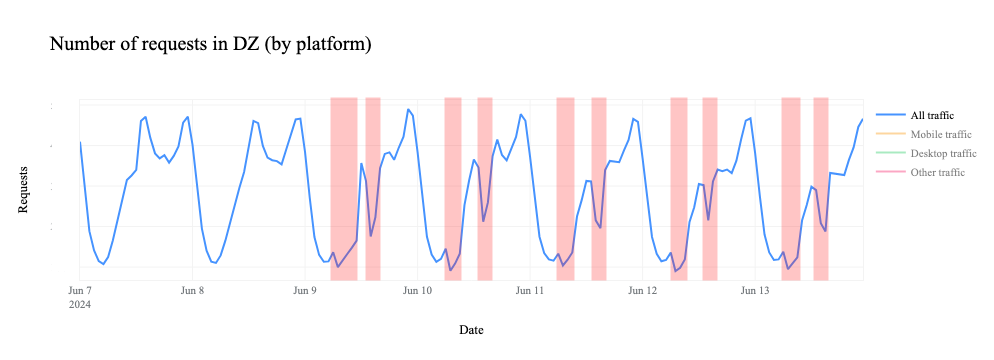
In the HTTP(S) request traffic graph below, the twice-daily disruptions are highlighted, with the morning one appearing as a nominal drop in traffic, and the afternoon one causing a more severe decline. (The graph shows request traffic aggregated at a country level, but the graphs for the ASNs listed above also show similar patterns.)
In addition, similar patterns are observed in 1.1.1.1 resolver traffic at a country and ASN level, but only for DNS over TCP, DNS over TLS, and DNS over HTTPS, all of which leverage TCP. In the graph below showing only resolver traffic over UDP, there’s no clear evidence of disruptions. However, in the graph that shows resolver traffic over HTTPS, TCP, and TLS, a slight perturbation is visible in the morning, as traffic begins to rise for the day, and a sharper decrease is visible in the afternoon, with both disruptions aligning with the twice daily drops in traffic discussed above.
These observations support the conjecture that the Algerian government is likely taking a more nuanced approach to restricting access to content, interfering in some fashion with TCP-based traffic. The conjecture is also supported by an internal tool that helps to understand connection tampering that is based on research co-designed and developed by members of the Cloudflare Research team. We will be launching insights into TCP connection tampering on Cloudflare Radar later in 2024 and, in the meantime, technical details can be found in the peer-reviewed paper titled Global, Passive Detection of Connection Tampering.
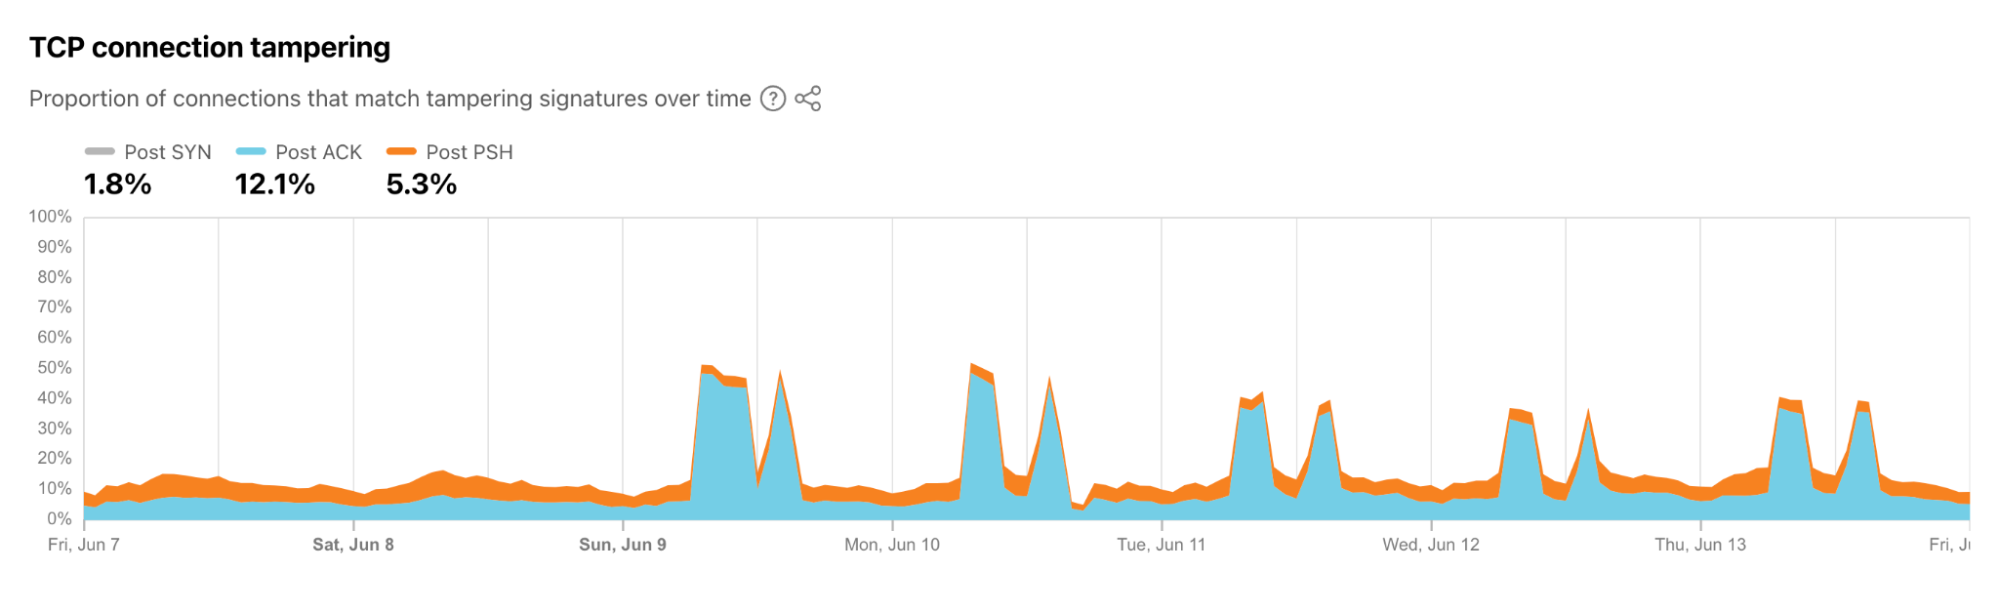
The graph below, taken from the internal tool, highlights observed TCP connection tampering in connections from Algeria during the week that the Baccalaureate exams took place. While some baseline level of post-ACK and post-PSH tampering is consistently visible, we see significant increases in post-ACK twice a day during the exam period, at the times that align with the shifts in traffic discussed above. Technical descriptions of post-ACK and post-PSH tampering can be found in the Cloudflare Radar glossary, but in short, tampering post-ACK means an established TCP connection to Cloudflare’s server has been abruptly ended by one or more RST packets before the server sees data packets. Although clients do use RSTs, clients are more likely to close connections with a FIN (as specified by the RFC). The RST method can also be used by middleboxes that (i) sees the data packet, then (ii) drops the data packet, then (iii) sends an RST to the server to force the server to close the connection (and very likely another RST to the client too for the same reason). Tampering post-PSH means that something on the path, like a middlebox, (i) saw something it didn’t like on an established connection, then (ii) permitted the data to pass but then, (iii) it sends the RST to force endpoints to close the connection.
Looking beyond Cloudflare-sourced data, aggregated test results from the Open Observatory of Network Interference (OONI) also show evidence of anomalous behavior. Using OONI Probe, a mobile and desktop app, can probe for potential blocking of websites, instant messaging apps, and censorship circumvention tools. Examining test results from users in Algeria for popular messaging platforms WhatsApp, Telegram, Signal, and Facebook Messenger for the first two weeks of June, we clearly see the appearance of test results marked as “Anomaly” starting on June 9. (OONI defines “Anomaly” results as “Measurements that provided signs of potential blocking”.) OONI Tor testresults also show a similar “Anomaly” pattern. Anomalous traffic patterns are also visible for Google Web Search, YouTube, and GMail.
Although the analysis of these observations and data sets doesn’t provide us with specific details around exactly how the observed Internet disruptions are being implemented, it strongly supports the supposition that network providers in Algeria are, in some fashion, interfering with TCP connections, but not blocking them outright nor shutting down their networks completely. Given that popular messaging platforms, Google properties, Cloudflare’s 1.1.1.1 DNS resolver, and some number of Cloudflare customer sites all appear to be impacted, it suggests that a list of hostnames are being targeted for disruption/interference, either by the SNI or the destination IP address.
Conclusion
Perhaps recognizing the broad negative impact that brute-force nationwide Internet shutdowns have as a response to cheating on exams, some governments appear to be turning to more nuanced techniques, such as content blocking or connection tampering. However, because these are widely applied as well, they are arguably just as disruptive as a full nationwide Internet shutdown. The cause of full shutdowns, such as those seen in Syria, are arguably easier to diagnose than the disruptions to connectivity seen in Iraq and Algeria, which appear to use approaches that are hard to specifically identify from the outside.
In today’s cybersecurity landscape, staying ahead of evolving threats is crucial. The State of Security Panel from our Take Command summit held May 21st delved into how artificial intelligence (AI) is reshaping cyber attacks and defenses.
The discussion highlighted the dual role of AI in cybersecurity, presenting both challenges and solutions. To learn more about these insights and protect your organization from sophisticated threats, watch the full video.
Key takeaways from the 30 minute panel:
AI-Enhanced Attacks: Friendly Hacker and CEO of SocialProof Security Rachel Tobac highlighted the growing use of AI by attackers, stating, “Eight times out of ten, I’m using AI tools during my attacks.” AI helps create convincing phishing emails and scripts, making attacks more efficient and scalable.
Voice Cloning and Deepfakes: Attackers are now using AI for voice cloning and deep fakes, making it vital for organizations to verify identities through multiple communication channels. Rachel continued, “We can even do a deep fake, live during a Teams or Zoom call to trick somebody.”
Cloud Vulnerabilities: Rapid7’s Chief Security Officer Jaya Baloo pointed out that roughly 45% of data breaches are due to cloud issues, caused by misconfigurations and vulnerabilities, making cloud security a critical focus.
“Professional paranoia is something that I think we should hold dear to us,”– Jaya Bayloo, Chief Security Officer, Rapid7
„Ето че парламентаризмът пак се провали“, ще каже президентът Румен Радев, ако 50-тият парламент не успее да излъчи редовно правителство. Този рефрен ще бъде повторен многократно от говорителите му, а унилото гражданство, две трети от което игнорира изборите, ще се съгласи с него.
Политолозите пак ще заговорят за партийния проект на президента, който все така е в люпилнята на „Дондуков“ 2 (макар че такова щраусово яйце трудно може да се скрие). А техният колега Слави Василев, работил и като щатен сътрудник на държавния глава до 2019 г., ще заговори за любимата си президентска република.
Но наистина ли Румен Радев, преполовил втория си мандат като президент, смята да се заеме с такова епохално дело, срутвайки парламентарната демокрация? За целта тя също трябва да му помогне, ако президентът смята да го направи по демократичен път, т.е. Велико народно събрание да промени държавното устройство.
На първи и втори поглед
На пръв поглед всички предпоставки са налице. Първи е по рейтинг, зад него са всички партийни лидери. Под неговия юмрук се роди политическата сила, свалила ГЕРБ от власт. За последните три години служебните кабинети, назначени от Радев, са управлявали близо 18 месеца, така че държавният глава разполага с дълга кадрова скамейка. Службите продължават да работят с назначените от него шефове. Подбрани от Радев кадри заминаха като посланици.
И редовното правителство на ПП–ДБ, и служебното на Димитър Главчев запазиха и даже издигнаха негови назначения (като шефа на ДФ „Земеделие“, който за 2024 г. разпределя 3,302 млрд. лв. – Георги Тахов, станал министър на земеделието и храните). А онова, което направи служебното управление на Радев, сключвайки 13-годишната сделка с турската компания „Боташ“ при пълна непрозрачност и неизгодни за България условия, е сравнимо с построяването на „Турски поток“ от кабинета на ГЕРБ и Бойко Борисов.
Трудно е за вярване, че президентът би напуснал тази зона на комфорт и власт, за да гони несгодите на едно партийно величие на терен със силна конкуренция и неизбежно споделяне на властовия ресурс. До края на втория му мандат има цели две години и половина и едва ли би го прекратил, за да поведе партия. А партия, която не е оглавявана от Радев, не би имала успеха, който всички смятат, че ѝ е предначертан по подразбиране. Независимо от факта, че втория мандат на Радев подкрепиха 1 537 347 души, а само малко повече български граждани гласуваха за седемте партии в 50-тия парламент – 1 880 161.
Радев е смятан за олицетворението на мечтата за „силна ръка“ и стабилност, каквато Борисов вече не е в състояние да осигури поради ред причини, и първата се нарича Пеевски. Но Румен Радев не е политикът, който би повторил модела „Орбан“. Подалият оставка като лидер на „Да, България“ Христо Иванов в интервю за „Дойче Веле“ казва:
По-лошото е, че не можем да знаем кога ще бъде лансиран реалният проект „силна ръка“ и „завой към Орбан“, но вероятно е въпрос на месеци. И още по-лошото – никой не може да знае кога в международен план ще се случи следващият катаклизъм.
Вероятно подобен катаклизъм би ускорил президентския проект, подпомогнат и от усилията на руските хибридчици – а може би не. Въпреки нескритите си амбиции за власт, като човек, издигнал се от низините, Румен Радев е прагматик, преминал и през достатъчно професионални изпитания в кариерата си на военен пилот, за да рискува сигурността на настоящото си положение. А и ще излезе, че хем критикува партиите, хем ще се „смали“ до нивото им в сравнение със сегашната висота на своята надпартийност. Пред очите му е и примерът на президента Георги Първанов (2002–2012), чийто опит за летене на партиен терен след двата мандата в Президентството се оказа провал.
Вазата на Рубин
Известната оптическа илюзия „Вазата на Рубин“ представлява рисунка, в която всеки вижда най-напред или ваза, или два човешки профила. Индивидуалната нагласа при възприемането зависи от личния опит, когнитивните умения, както и от специфичните характеристики на самата илюзия. Същото е и при възприемането на българската политика – едни виждат летящо прасе, захапало тиква, други – злото в Средната земя. И политиката все повече се възприема като меме и все по-малко като политика.
В този контекст президентът е еманация на държавност и стабилност. А политиката в България се крепи върху неустойчивите конструкции на устни споразумения, „сглобки“ без коалиционен договор, компромиси и (не)способност да се управлява и политическата опозиция, и вътрешнопартийната динамика. Наред с това политиците дават обещания, които не изпълняват, и поставят червени линии, които преминават.
В политическите битки ПП–ДБ изгубиха най-ценното – моралното си превъзходство, ГЕРБ – способността да сложат ред в хаоса, а БСП изобщо се погуби. Но пък появата на действителен президентски проект може и да ги мобилизира за активна политическа работа сред избирателите и така да има оздравителен ефект върху политическото в България.
Румен Радев не трябва да забравя, че в един момент няма да го подмине въпросът, зададен и на Борисов: Пеевски ли вижда, когато се погледне в огледалото? Проблемът е, че държавата вече се оглежда в Пеевски и не Радев е политикът, който може да счупи огледалото.
Използването на плодовете на какаовото дърво е древна традиция, започнала преди повече от 5000 години в Южна Америка, на територията на днешен Еквадор. Европейските колонизатори за първи път пренасят какаови зърна на Стария континент през XVI век и както се казва, останалото е история.
Традиционната технология за производство на шоколад е изключително трудоемка. Плодовете на дървото се берат ръчно, след което се изважда сърцевината им – лепкава маса от пулп и семена. Тя преминава през няколкодневна ферментация, после зърната се изсушават, изпичат и смилат, за да се получи какаова маса, която служи за основа на различни продукти.
Тъй като какаовата маса не съдържа много естествени захари, тя не е особено сладка и има характерен горчив вкус. Затова към нея обикновено се прибавят захар, мляко на прах и други добавки. Понякога това се прави дори и за натуралните шоколади, за да им се придаде известна сладост.
Интересен подход за намаляване на екологичния отпечатък от производството на шоколад е т.нар. шоколад от цял плод. В него се използват части от плода, които обикновено се изхвърлят – вътрешната част на шушулката (ендокарп) и месестият пулп, обвиващ семената. За целта ендокарпът се стрива на прах и се смесва с пулпа, за да се образува сладък гел. След смесването му с емулгатор (например лецитин) този гел може да замести рафинираната захар в шоколада.
След изпитване на различни рецепти в лабораторни условия учени са намерили една рецепта, при която текстурата на шоколада е неразличима от традиционно приготвения. Резултатът е потвърден от 11-членно жури. Вкусът не отговаря напълно, защото продуктът не е толкова сладък, колкото контролата. Това вероятно се получава, защото гелът е с по-едри частици, които не са с кристална структура и не се разтапят в устата като захарта. Друга промяна във вкуса е появата на специфични плодови нотки.
Това води и до следния недостатък на технологията: приложима е само в производството на тъмен шоколад, чийто конвенционален еквивалент съдържа около 10% добавена захар.
Все пак подходът има предимства както от хранителна, така и от екологична гледна точка. Освен че количеството на вложената захар намалява, в шоколада има повече фибри и по-малко наситени мазнини поради редуцираното количество какаово масло (което понякога се заменя с рибено). Ползите за природата също са разнообразни: избягват се отглеждането и транспортът на захарно цвекло, производството е по-независимо, а отпадъците намаляват.
Идеята на учените не е революционна, защото подобни шоколади се предлагат на пазара от няколко години, макар да са все още рядкост. Но в изследването си авторите описват начин за прецизиране и оптимизиране на технологията и измерват потенциалния ефект върху околната среда – фактори, които са важни за масовото ѝ въвеждане.
Външната част на шушулките на какаовия плод също може да бъде оползотворена за производството на забавители на горенето. Това са вещества, с които могат да се третират материали, така че драстично да се намали тяхната запалимост. По-старите забавители са бром- и хлорсъдържащи молекули, които са токсични. Това налага забраната на употребата им и въвеждането на нови продукти, един от които се базира на модифициран лигнин. Обикновено лигнинът се добива от дървесина, но се съдържа и в други видове растителни тъкани, като шушулките.
За извличането му шушулките първо се смилат на прах, след което минават през няколко стъпки на обработка за отстраняване на мазнини, въглехидрати и белтъчини. Полученият чист лигнин може да се модифицира в три химични стъпки, така че към него да се прикачи молекула, наречена DOPO, която му придава способността да забавя горенето. Така обработениятлигнин не гори при нагряване, а само се овъглява.
Резултатът е обещаващ, но въпреки че DOPO се счита за вещество с ниска опасност за здравето, авторите на изследването отбелязват, че трябва да се направи оценка на риска, преди да се използва. Ако безопасността му се потвърди, може да бъде добавен към продуктите, които се използват в момента, и да даде възможност за оползотворяване и добавяне на стойност при отпадъци от земеделието.
Пречистване на вода
С промяната на климатичните условия достъпът до питейна вода на големи групи хора ще става все по-голямо предизвикателство. Едно от решенията е използването на океанска вода, но обезсоляването ѝ е изключително скъпо, енергоемко и неприложимо в много географски райони, застрашени от недостиг на вода. Там обикновено се прибягва до изпомпване на вода от подземни находища, която често съдържа най-различни замърсители – тежки метали, пестициди, торове.
Индия е такова място – в много от щатите ѝ нивата на арсеник и флуор са над допустимите според Световната здравна организация. За решаването на този проблем местен колектив е разработил иновативна технология, която не само пречиства водата, но и позволява безопасно депониране на замърсителите, както и многократно използване на системата.
Процесът започва с пропускането на замърсената вода през филтър, направен от хитозан, към който са добавени метали – желязо и алуминий. Хитозанът е естествен полимер, получен при третирането на хитина от черупките на ракообразни с основен агент (например натриева основа). При преминаването на водата през филтъра арсеникът се адсорбира върху хитозана и така водата се пречиства.
Следващата стъпка е отделянето на арсеника от филтриращия материал, който по този начин се регенерира за повторна употреба. Това се постига с помощта на промиването му с разтвор на натриева основа. Отработеният разтвор се пречиства през мембрана, която отделя арсеника от него, и той може да се използва отново.
Финалната стъпка е биоремедиацията на арсеника с помощта на тор от крави. В него се съдържат микроорганизми, които имат способността да метилират арсеника и да го преобразуват от неорганичен тежък метал в многократно по-безопасна органична форма. За този процес е нужно кратко време (около седмица) и после получената смес може да бъде депонирана, без да оказва голямо влияние върху околната среда.
Процесът се прилага успешно и при замърсяване от флуор, като за целта в последната стъпка той се утаява с помощта на калциев хидроксид (гасена вар) или калциев хлорид. Получената утайка от калциев флуорид е неразтворима във вода и е практически инертна форма на флуора.
Възможността за преизползване на много от компонентите в процеса прави разработката на екипа практична и иновативна – качества, които са отразени в заявление за патент от началото на годината. Изследователите вече работят върху подобряване на технологията, така че да може да се използва и за други тежки метали, както и в по-голям мащаб. Идеята е в малките населени места, където няма достъп до много средства и инфраструктура, да се изградят пречиствателни станции, които да осигуряват чиста питейна вода и да бъдат лесни за поддръжка.
За пречистване на вода може да се използват и различни растителни отпадъци. Процесът, при който замърсителите се адсорбират (прикрепват се по повърхността ѝ) или абсорбират (вмъкват се в нея) от биологична матрица, може общо да бъде наречен биосорбция.
Биосорбцията набира популярност и съществуват редица примери за употребата ѝ – абсорбция на живак в използвано кафе, лекарствени продукти в люспи от ориз, багрила в черупки от орехи. Кокосовите отпадъци, съставляващи над 60% от целия плод, са особено добър адсорбент и може да се използват за премахване на кобалт, хром и никел, при това без никаква обработка.
За подобряване на способността за свързване на опасните субстанции растителните отпадъци могат да бъдат третирани по различен начин – с киселини, основи или други вещества. Така тяхната структура се променя и адаптира спрямо замърсителите. Недостатък е, че при тази обработка често се генерират токсични отпадъци, които следва да се третират по специален начин, за да се обезвредят.
Постигнатите до момента успехи са обобщени в публикация, в която също се предлагат разнообразни методи за оптимизация на технологията. Авторите не крият и предизвикателствата, които трябва да се преодолеят преди по-широкото ѝ приложение. Преработката им може да създаде нови потоци, които трябва да бъдат пречиствани. Също така тяхната селективност не е висока и понякога замърсителите не могат да бъдат извлечени. Това ограничава възможността за преизползването на биосорбантите, както и за връщането на тежките метали в различни производствени процеси.
Въпреки това технологията изглежда перспективна и се работи активно за премахване на тези пречки. Пример за подобряване на регенерацията е третирането с ултразвук или електрохимически методи. Със задълбочаване на климатичните промени нуждата от използване на цялата добита биомаса ще се увеличава, тъй като земеделието ще става все по-енергоемко, скъпо и трудно. Подобни технологии са много обещаващи, защото предоставят възможност ключови ресурси като например замърсените води да станат достъпни.
„Старлайнер“ е в орбита
След дългогодишни отлагания капсулата „Старлайнер“ на „Боинг“ бе изстреляна към Международната космическа станция (МКС) с екипаж от двама астронавти – ветераните Сунита Уилямс и Бъч Уилмор. Първоначалният план беше капсулата да е завършена през 2014 г., а полетите с екипаж да започнат през 2017 г., но първо проектът имаше финансови проблеми с одобряването на бюджета за НАСА, а след това технически – от страна на „Боинг“. През 2022 г., след успешен пробен полет, капсулата беше одобрена за тест с астронавти, но при проверка се установи, че е използвана запалима изолация на кабелите и беше открит проблем с парашутите, което наложи поредното отлагане.
В последните няколко месеца различни технически спънки забавиха полета, като непосредствено преди него беше установен и теч на хелий в системата за управление на капсулата. След преценка на риска беше взето решение, че тя може да бъде изстреляна. За съжаление, изпускането на газ се оказа само началото – след като стигна до ниска околоземна орбита, по време на захода към МКС в капсулата се появиха нови течове и няколко от двигателите за контрол на ориентацията ѝ отказаха. Това наложи известно забавяне на скачването, но то се осъществи и в момента астронавтите са в станцията.
От НАСА и „Боинг“ взеха решение да забавят връщането на капсулата към Земята, докато не се анализират всички данни. Ако няма промяна в текущите планове, астронавтите трябва да кацнат на 26 юни в Ню Мексико.
Въпреки възникналите проблеми успешният полет до МКС е добра новина за НАСА, тъй като след разрешаването им агенцията ще има достъп до две компании (заедно със SpaceX), които могат да извеждат астронавти в орбита. И НАСА, и „Боинг“ разглеждат ситуацията по-скоро като възможност за изчистване на грешки и извличане на информация за подобряване на капсулата, отколкото като провал.
„Вояджър 1“ отново изпраща научни данни
След като повече от половин година не беше ясно дали „Вояджър 1“ ще може да прави измервания и да ги изпраща към нас, благодарение на усилията на техническия екип в НАСА той отново работи на пълни обороти, или поне доколкото позволяват намаляващите му ресурси.
През април с далечната сонда беше осъществена връзка и екипът на НАСА започна да получава диагностични данни, които помогнаха за точно определяне на проблема и изпращане на обновен софтуер, който да заобиколи повредената памет в бордовия компютър. Месец по-късно, в средата на май, към апарата беше изпратена команда да започне да връща данни от два от научните си инструменти – подсистемата за измерване на плазмени вълни и магнетометъра.
Преди няколко дни от НАСА съобщиха, че получават данни и от други два прибора – подсистемата за измерване на космически лъчи и инструмента за измерване на заредени частици. На сондата има още шест измервателни уреда, но те не са активни или поради повреда, или защото са изключени, за да пестят енергия. Апаратът се захранва от генератор с радиоактивни изотопи, който бавно губи ефективността си, и се очаква около 2030 г. да не може да захранва дори и активните към момента четири инструмента.
Екипът планира няколко софтуерни обновления за подобряване работата на апарата. Първо ще бъдат синхронизирани отново часовниците на бордовите компютри, така че всички зададени инструкции да се изпълняват в правилния момент. След това ще бъде направен опит да се оптимизира работата на системата за записване на данни от инструмента, измерващ плазмените вълни. Тези данни се записват на магнитна лента и се изпращат два пъти в годината към Земята, за разлика от повечето друга информация, която не се съхранява, а се изпраща директно.
Така сондата отново заема мястото си на пионер в изследването на междузвездното пространство. Това е районът на Космоса отвъд хелиосферата – сферата, в която все още се усеща ефектът от магнитните полета и заредените частици (т.нар. слънчев вятър), излъчвани от Слънцето. Мисията „Вояджър“, състояща се от два идентични апарата, изстреляни с около две седмици разлика, е най-старата активна мисия на НАСА – 50-годишният юбилей ще бъде отбелязан през 2027 г. Двата апарата са и най-далечните обекти в Космоса, създадени от човек – намират се на почти един светлинен ден от Земята, или над 24 млрд. км.
The collective thoughts of the interwebz
Manage Consent
To provide the best experiences, we use technologies like cookies to store and/or access device information. Consenting to these technologies will allow us to process data such as browsing behavior or unique IDs on this site. Not consenting or withdrawing consent, may adversely affect certain features and functions.
Functional
Always active
The technical storage or access is strictly necessary for the legitimate purpose of enabling the use of a specific service explicitly requested by the subscriber or user, or for the sole purpose of carrying out the transmission of a communication over an electronic communications network.
Preferences
The technical storage or access is necessary for the legitimate purpose of storing preferences that are not requested by the subscriber or user.
Statistics
The technical storage or access that is used exclusively for statistical purposes.The technical storage or access that is used exclusively for anonymous statistical purposes. Without a subpoena, voluntary compliance on the part of your Internet Service Provider, or additional records from a third party, information stored or retrieved for this purpose alone cannot usually be used to identify you.
Marketing
The technical storage or access is required to create user profiles to send advertising, or to track the user on a website or across several websites for similar marketing purposes.


 Ashok Chintalapati is a software development engineer for Amazon EMR at Amazon Web Services.
 Steve Koonce is an Engineering Manager for EMR at Amazon Web Services.