New tools for production safety — Gradual deployments, Source maps, Rate Limiting, and new SDKs

Post Syndicated from Tanushree Sharma original https://blog.cloudflare.com/workers-production-safety


2024’s Developer Week is all about production readiness. On Monday. April 1, we announced that D1, Queues, Hyperdrive, and Workers Analytics Engine are ready for production scale and generally available. On Tuesday, April 2, we announced the same about our inference platform, Workers AI. And we’re not nearly done yet.

However, production readiness isn’t just about the scale and reliability of the services you build with. You also need tools to make changes safely and reliably. You depend not just on what Cloudflare provides, but on being able to precisely control and tailor how Cloudflare behaves to the needs of your application.

Today we are announcing five updates that put more power in your hands – Gradual Deployments, source mapped stack traces in Tail Workers, a new Rate Limiting API, brand-new API SDKs, and updates to Durable Objects – each built with mission-critical production services in mind. We build our own products using Workers, including Access, R2, KV, Waiting Room, Vectorize, Queues, Stream, and more. We rely on each of these new features ourselves to ensure that we are production ready – and now we’re excited to bring them to everyone.

Gradually deploy changes to Workers and Durable Objects

Deploying a Worker is nearly instantaneous – a few seconds and your change is live everywhere.

When you reach production scale, each change you make carries greater risk, both in terms of volume and expectations. You need to meet your 99.99% availability SLA, or have an ambitious P90 latency SLO. A bad deployment that’s live for 100% of traffic for 45 seconds could mean millions of failed requests. A subtle code change could cause a thundering herd of retries to an overwhelmed backend, if rolled out all at once. These are the kinds of risks we consider and mitigate ourselves for our own services built on Workers.

The way to mitigate these risks is to deploy changes gradually – commonly called rolling deployments:

  1. The current version of your application runs in production.
  2. You deploy the new version of your application to production, but only route a small percentage of traffic to this new version, and wait for it to “soak” in production, monitoring for regressions and bugs. If something bad happens, you’ve caught it early at a small percentage (e.g. 1%) of traffic and can revert quickly.
  3. You gradually increment the percentage of traffic until the new version receives 100%, at which point it is fully rolled out.

Today we’re opening up a first-class way to deploy code changes gradually to Workers and Durable Objects via the Cloudflare API, the Wrangler CLI, or the Workers dashboard. Gradual Deployments is entering open beta – you can use Gradual Deployments with any Cloudflare account that is on the Workers Free plan, and very soon you’ll be able to start using Gradual Deployments with Cloudflare accounts on the Workers Paid and Enterprise plans. You’ll see a banner on the Workers dashboard once your account has access.

When you have two versions of your Worker or Durable Object running concurrently in production, you almost certainly want to be able to filter your metrics, exceptions, and logs by version. This can help you spot production issues early, when the new version is only rolled out to a small percentage of traffic, or compare performance metrics when splitting traffic 50/50. We’ve also added observability at a version level across our platform:

  • You can filter analytics in the Workers dashboard and via the GraphQL Analytics API by version.
  • Workers Trace Events and Tail Worker events include the version ID of your Worker, along with optional version message and version tag fields.
  • When using wrangler tail to view live logs, you can view logs for a specific version.
  • You can access version ID, message, and tag from within your Worker’s code, by configuring the Version Metadata binding.

You may also want to make sure that each client or user only sees a consistent version of your Worker. We’ve added Version Affinity so that requests associated with a particular identifier (such as user, session, or any unique ID) are always handled by a consistent version of your Worker. Session Affinity, when used with Ruleset Engine, gives you full control over both the mechanism and identifier used to ensure “stickiness”.

Gradual Deployments is entering open beta. As we move towards GA, we’re working to support:

  • Version Overrides. Invoke a specific version of your Worker in order to test before it serves any production traffic. This will allow you to create Blue-Green Deployments.
  • Cloudflare Pages. Let the CI/CD system in Pages automatically progress the deployments on your behalf.
  • Automatic rollbacks. Roll back deployments automatically when the error rate spikes for a new version of your Worker.

We’re looking forward to hearing your feedback! Let us know what you think through this feedback form or reach out in our Developer Discord in the #workers-gradual-deployments-beta channel.

Source mapped stack traces in Tail Workers

Production readiness means tracking errors and exceptions, and trying to drive them down to zero. When an error occurs, the first thing you typically want to look at is the error’s stack trace – the specific functions that were called, in what order, from which line and file, and with what arguments.

Most JavaScript code – not just on Workers, but across platforms – is first bundled, often transpiled, and then minified before being deployed to production. This is done behind the scenes to create smaller bundles to optimize performance and convert from Typescript to JavaScript if needed.

If you’ve ever seen an exception return a stack trace like: /src/index.js:1:342,it means the error occurred on the 342nd character of your function’s minified code. This is clearly not very helpful for debugging.

Source maps solve this – they map compiled and minified code back to the original code that you wrote. Source maps are combined with the stack trace returned by the JavaScript runtime in order to present you with a human-readable stack trace. For example, the following stack trace shows that the Worker received an unexpected null value on line 30 of the down.ts file. This is a useful starting point for debugging, and you can move down the stack trace to understand the functions that were called that were set that resulted in the null value.

Unexpected input value: null
  at parseBytes (src/down.ts:30:8)
  at down_default (src/down.ts:10:19)
  at Object.fetch (src/index.ts:11:12)

Here’s how it works:

  1. When you set upload_source_maps = true in your wrangler.toml, Wrangler will automatically generate and upload any source map files when you run wrangler deploy or wrangler versions upload.
  2. When your Worker throws an uncaught exception, we fetch the source map and use it to map the stack trace of the exception back to lines of your Worker’s original source code.
  3. You can then view this deobfuscated stack trace in real-time logs or in Tail Workers.

Starting today, in open beta, you can upload source maps to Cloudflare when you deploy your Worker – get started by reading the docs. And starting on April 15th , the Workers runtime will start using source maps to deobfuscate stack traces. We’ll post a notification in the Cloudflare dashboard and post on our Cloudflare Developers X account when source mapped stack traces are available.

New Rate Limiting API in Workers

An API is only production ready if it has a sensible rate limit. And as you grow, so does the complexity and diversity of limits that you need to enforce in order to balance the needs of specific customers, protect the health of your service, or enforce and adjust limits in specific scenarios. Cloudflare’s own API has this challenge – each of our dozens of products, each with many API endpoints, may need to enforce different rate limits.

You’ve been able to configure Rate Limiting rules on Cloudflare since 2017. But until today, the only way to control this was in the Cloudflare dashboard or via the Cloudflare API. It hasn’t been possible to define behavior at runtime, or write code in a Worker that interacts directly with rate limits – you could only control whether a request is rate limited or not before it hits your Worker.

Today we’re introducing a new API, in open beta, that gives you direct access to rate limits from your Worker. It’s lightning fast, backed by memcached, and dead simple to add to your Worker. For example, the following configuration defines a rate limit of 100 requests within a 60-second period:

[[unsafe.bindings]]
name = "RATE_LIMITER"
type = "ratelimit"
namespace_id = "1001" # An identifier unique to your Cloudflare account

# Limit: the number of tokens allowed within a given period, in a single Cloudflare location
# Period: the duration of the period, in seconds. Must be either 60 or 10
simple = { limit = 100, period = 60 } 

Then, in your Worker, you can call the limit method on the RATE_LIMITER binding, providing a key of your choosing. Given the configuration above, this code will return a HTTP 429 response status code once more than 100 requests to a specific path are made within a 60-second period:

export default {
  async fetch(request, env) {
    const { pathname } = new URL(request.url)

    const { success } = await env.RATE_LIMITER.limit({ key: pathname })
    if (!success) {
      return new Response(`429 Failure – rate limit exceeded for ${pathname}`, { status: 429 })
    }

    return new Response(`Success!`)
  }
}

Now that Workers can connect directly to a data store like memcached, what else could we provide? Counters? Locks? An in-memory cache? Rate limiting is the first of many primitives that we’re exploring providing in Workers that address questions we’ve gotten for years about where a temporary shared state that spans many Worker isolates should live. If you rely on putting state in the global scope of your Worker today, we’re working on better primitives that are purpose-built for specific use cases.

The Rate Limiting API in Workers is in open beta, and you can get started by reading the docs.

New auto-generated SDKs for Cloudflare’s API

Production readiness means going from making changes by clicking buttons in a dashboard to making changes programmatically, using an infrastructure-as-code approach like Terraform or Pulumi, or by making API requests directly, either on your own or via an SDK.

The Cloudflare API is massive, and constantly adding new capabilities – on average we update our API schemas between 20 and 30 times per day. But to date, our API SDKs have been built and maintained manually, so we had a burning need to automate this.

We’ve done that, and today we’re announcing new client SDKs for the Cloudflare API in three languages – Typescript, Python and Go – with more languages on the way.

Each SDK is generated automatically using Stainless API, based on the OpenAPI schemas that define the structure and capabilities of each of our API endpoints. This means that when we add any new functionality to the Cloudflare API, across any Cloudflare product, these API SDKs are automatically regenerated, and new versions are published, ensuring that they are correct and up-to-date.

You can install the SDKs by running one of the following commands:

// Typescript
npm install cloudflare

// Python
pip install --pre cloudflare

// Go
go get -u github.com/cloudflare/cloudflare-go/v2

If you use Terraform or Pulumi, under the hood, Cloudflare’s Terraform Provider currently uses the existing, non-automated Go SDK. When you run terraform apply, the Cloudflare Terraform Provider determines which API requests to make in what order, and executes these using the Go SDK.

The new, auto-generated Go SDK clears a path towards more comprehensive Terraform support for all Cloudflare products, providing a base set of tools that can be relied upon to be both correct and up-to-date with the latest API changes. We’re building towards a future where any time a product team at Cloudflare builds a new feature that is exposed via the Cloudflare API, it is automatically supported by the SDKs. Expect more updates on this throughout 2024.

Durable Object namespace analytics and WebSocket Hibernation GA

Many of our own products, including Waiting Room, R2, and Queues, as well as platforms like PartyKit, are built using Durable Objects. Deployed globally, including newly added support for Oceania, you can think of Durable Objects like singleton Workers that can provide a single point of coordination and persist state. They’re perfect for applications that need real-time user coordination, like interactive chat or collaborative editing. Take Atlassian’s word for it:

One of our new capabilities is Confluence whiteboards, which provides a freeform way to capture unstructured work like brainstorming and early planning before teams document it more formally. The team considered many options for real-time collaboration and ultimately decided to use Cloudflare’s Durable Objects. Durable Objects have proven to be a fantastic fit for this problem space, with a unique combination of functionalities that has allowed us to greatly simplify our infrastructure and easily scale to a large number of users. – Atlassian

We haven’t previously exposed associated analytical trends in the dashboard, making it hard to understand the usage patterns and error rates within a Durable Objects namespace unless you used the GraphQL Analytics API directly. The Durable Objects dashboard has now been revamped, letting you drill down into metrics, and go as deep as you need.

From day one, Durable Objects have supported WebSockets, allowing many clients to directly connect to a Durable Object to send and receive messages.

However, sometimes client applications open a WebSocket connection and then eventually stop doing…anything. Think about that tab you’ve had sitting open in your browser for the last 5 hours, but haven’t touched. If it uses WebSockets to send and receive messages, it effectively has a long-lived TCP connection that isn’t being used for anything. If this connection is to a Durable Object, the Durable Object must stay running, waiting for something to happen, consuming memory, and costing you money.

We first introduced WebSocket Hibernation to solve this problem, and today we’re announcing that this feature is out of beta and is Generally Available. With WebSocket Hibernation, you set an automatic response to be used while hibernating and serialize state such that it survives hibernation. This gives Cloudflare the inputs we need in order to maintain open WebSocket connections from clients while “hibernating” the Durable Object such that it is not actively running, and you are not billed for idle time. The result is that your state is always available in-memory when you actually need it, but isn’t unnecessarily kept around when it’s not. As long as your Durable Object is hibernating, even if there are active clients still connected over a WebSocket, you won’t be billed for duration.

In addition, we’ve heard developer feedback on the costs of incoming WebSocket messages to Durable Objects, which favor smaller, more frequent messages for real-time communication. Starting today incoming WebSocket messages will be billed at the equivalent of 1/20th of a request (as opposed to 1 message being the equivalent of 1 request as it has been up until now). Following a pricing example:

WebSocket Connection Requests Incoming WebSocket Messages Billed Requests Request Billing
Before 10K 432M 432,010,000 $64.65
After 10K 432M 21,610,000 $3.09

Production ready, without production complexity

Becoming production ready on the last generation of cloud platforms meant slowing down how fast you shipped. It meant stitching together many disconnected tools or standing up whole teams to work on internal platforms. You had to retrofit your own productivity layers onto platforms that put up roadblocks.

The Cloudflare Developer Platform is grown up and production ready, and committed to being an integrated platform where products intuitively work together and where there aren’t 10 ways to do the same thing, with no need for a compatibility matrix to help understand what works together. Each of these updates shows this in action, integrating new functionality across products and parts of Cloudflare’s platform.

To that end, we want to hear from you about not only what you want to see next, but where you think we could be even simpler, or where you think our products could work better together. Tell us where you think we could do more – the Cloudflare Developers Discord is always open.

What’s new with Cloudflare Media: updates for Calls, Stream, and Images

Post Syndicated from Deanna Lam original https://blog.cloudflare.com/whats-next-for-cloudflare-media


Our customers use Cloudflare Calls, Stream, and Images to build live, interactive, and real-time experiences for their users. We want to reduce friction by making it easier to get data into our products. This also means providing transparent pricing, so customers can be confident that costs make economic sense for their business, especially as they scale.

Today, we’re introducing four new improvements to help you build media applications with Cloudflare:

  • Cloudflare Calls is in open beta with transparent pricing
  • Cloudflare Stream has a Live Clipping API to let your viewers instantly clip from ongoing streams
  • Cloudflare Images has a pre-built upload widget that you can embed in your application to accept uploads from your users
  • Cloudflare Images lets you crop and resize images of people at scale with automatic face cropping

Build real-time video and audio applications with Cloudflare Calls

Cloudflare Calls is now in open beta, and you can activate it from your dashboard. Your usage will be free until May 15, 2024. Starting May 15, 2024, customers with a Calls subscription will receive the first terabyte each month for free, with any usage beyond that charged at $0.05 per real-time gigabyte. Additionally, there are no charges for inbound traffic to Cloudflare.

To get started, read the developer documentation for Cloudflare Calls.

Live Instant Clipping: create clips from live streams and recordings

Live broadcasts often include short bursts of highly engaging content within a longer stream. Creators and viewers alike enjoy being able to make a “clip” of these moments to share across multiple channels. Being able to generate that clip rapidly enables our customers to offer instant replays, showcase key pieces of recordings, and build audiences on social media in real-time.

Today, Cloudflare Stream is launching Live Instant Clipping in open beta for all customers. With the new Live Clipping API, you can let your viewers instantly clip and share moments from an ongoing stream – without re-encoding the video.

When planning this feature, we considered a typical user flow for generating clips from live events. Consider users watching a stream of a video game: something wild happens and users want to save and share a clip of it to social media. What will they do?

First, they’ll need to be able to review the preceding few minutes of the broadcast, so they know what to clip. Next, they need to select a start time and clip duration or end time, possibly as a visualization on a timeline or by scrubbing the video player. Finally, the clip must be available quickly in a way that can be replayed or shared across multiple platforms, even after the original broadcast has ended.

That ideal user flow implies some heavy lifting in the background. We now offer a manifest to preview recent live content in a rolling window, and we provide the timing information in that response to determine the start and end times of the requested clip relative to the whole broadcast. Finally, on request, we will generate on-the-fly that clip as a standalone video file for easy sharing as well as an HLS manifest for embedding into players.

Live Instant Clipping is available in beta to all customers starting today! Live clips are free to make; they do not count toward storage quotas, and playback is billed just like minutes of video delivered. To get started, check out the Live Clipping API in developer documentation.

Integrate Cloudflare Images into your application with only a few lines of code

Building applications with user-uploaded images is even easier with the upload widget, a pre-built, interactive UI that lets users upload images directly into your Cloudflare Images account.

Many developers use Cloudflare Images as an end-to-end image management solution to support applications that center around user-generated content, from AI photo editors to social media platforms. Our APIs connect the frontend experience – where users upload their images – to the storage, optimization, and delivery operations in the backend.

But building an application can take time. Our team saw a huge opportunity to take away as much extra work as possible, and we wanted to provide off-the-shelf integration to speed up the development process.

With the upload widget, you can seamlessly integrate Cloudflare Images into your application within minutes. The widget can be integrated in two ways: by embedding a script into a static HTML page or by installing a package that works with your favorite framework. We provide a ready-made Worker template that you can deploy directly to your account to connect your frontend application with Cloudflare Images and authorize users to upload through the widget.

To try out the upload widget, sign up for our closed beta.

Optimize images of people with automatic face cropping for Cloudflare Images

Cloudflare Images lets you dynamically manipulate images in different aspect ratios and dimensions for various use cases. With face cropping for Cloudflare Images, you can now crop and resize images of people’s faces at scale. For example, if you’re building a social media application, you can apply automatic face cropping to generate profile picture thumbnails from user-uploaded images.

Our existing gravity parameter uses saliency detection to set the focal point of an image based on the most visually interesting pixels, which determines how the image will be cropped. We expanded this feature by using a machine learning model called RetinaFace, which classifies images that have human faces. We’re also introducing a new zoom parameter that you can combine with face cropping to specify how closely an image should be cropped toward the face.

To apply face cropping to your image optimization, sign up for our closed beta.

Photo by Eye for Ebony on Unsplash
https://example.com/cdn-cgi/image/fit=crop,width=500,height=500,gravity=face,zoom=0.6/https://example.com/images/picture.jpg

Meet the Media team over Discord

As we’re working to build the next set of media tools, we’d love to hear what you’re building for your users. Come say hi to us on Discord. You can also learn more by visiting our developer documentation for Calls, Stream, and Images.

Announcing Pages support for monorepos, wrangler.toml, database integrations and more!

Post Syndicated from Nevi Shah original https://blog.cloudflare.com/pages-workers-integrations-monorepos-nextjs-wrangler


Pages launched in 2021 with the goal of empowering developers to go seamlessly from idea to production. With built-in CI/CD, Preview Deployments, integration with GitHub and GitLab, and support for all the most popular JavaScript frameworks, Pages lets you build and deploy both static and full-stack apps globally to our network in seconds.

Pages has superpowers like these that Workers does not have, and vice versa. Today you have to choose upfront whether to build a Worker or a Pages project, even though the two products largely overlap. That’s why during 2023’s Developer Week, we started bringing both products together to give developers the benefit of the best of both worlds. And it’s why we announced that like Workers, Pages projects can now directly access bindings to Cloudflare services — using workerd under-the-hood — even when using the local development server provided by a full-stack framework like Astro, Next.js, Nuxt, Qwik, Remix, SolidStart, or SvelteKit. Today, we’re thrilled to be launching some new improvements to Pages that bring functionality previously restricted to Workers. Welcome to the stage: monorepos, wrangler.toml, new additions to Next.js support, and database integrations!

Pages now supports monorepos

Many development teams use monorepos – repositories that contain multiple apps, with each residing in its own subdirectory. This approach is extremely helpful when these apps share code.

Previously, the Pages CI/CD set-up limited users to one repo per project. To use a monorepo with Pages, you had to directly upload it on your own, using the Wrangler CLI. If you did this, you couldn’t use Pages’ integration with GitHub or Gitlab, or have Pages CI/CD handle builds and deployments. With Pages support for monorepos, development teams can trigger builds to their various projects with each push.

Manage builds and move fast
You can now include and exclude specific paths to watch for in each of your projects to avoid unnecessary builds from commits to your repo.

Let’s say a monorepo contains 4 subdirectories – a marketing app, an ecommerce app, a design library, and a package. The marketing app depends on the design library, while the ecommerce app depends on the design library and the package.

Updates to the design library should rebuild and redeploy both applications, but an update to the marketing app shouldn’t rebuild and deploy the ecommerce app. However, by default, any push you make to my-monorepo triggers a build for both projects regardless of which apps were changed. Using the include/exclude build controls, you can specify paths to build and ignore for your project to help you track dependencies and build more efficiently.

Bring your own tools
Already using tools like Turborepo, NX, and Lerna? No problem! You can also bring your favorite monorepo management tooling to Pages to help manage your dependencies quickly and efficiently.

Whatever your tooling and however you’re set up, check out our documentation to get started with your monorepo right out of the box.

Configure Pages projects with wrangler.toml

Today, we’re excited to announce that you can now configure Pages projects using wrangler.toml — the same configuration file format that is already used for configuring Workers.

Previously, Pages projects had to be configured exclusively in the dashboard. This forced you to context switch from your development environment any time you made a configuration change, like adding an environment variable or binding. It also separated configuration from code, making it harder to know things like what bindings are being used in your project. If you were developing as a team, all the users on your team had to have access to your account to make changes – even if they had access to make changes to the source code via your repo.

With wrangler.toml, you can:

  • Store your configuration file in source control. Keep your configuration in your repo alongside the rest of your code.
  • Edit your configuration via your code editor. Remove the need to switch back and forth between interfaces.
  • Write configuration that is shared across environments. Define bindings and environment variables for local, preview, and production in one file.
  • Ensure better access control. By using a configuration file in your repo, you can control who has access to make changes without giving access to your Cloudflare dashboard.

Migrate existing projects
If you have an existing Pages project, we’ve added a new Wrangler CLI command that downloads your existing configuration and provides you with a valid wrangler.toml file.

$ npx wrangler@latest pages download config <PROJECT_NAME>

Run this command, add the wrangler.toml file that it generates to your project’s root directory, and then when you deploy, your project will be configured based on this configuration file.

If you are already using wrangler.toml to define your local development configuration, you can continue doing so. By default, your existing wrangler.toml file will continue to only apply to local development. When you run `wrangler pages deploy`, Wrangler will show you the additional fields that you must add in order for your configuration to apply to production and preview environments. Add these fields to your wrangler.toml, and then when you deploy your changes, the configuration you’ve defined in wrangler.toml will be used by your Pages project.

Refer to the documentation for more information on exactly what’s supported and how to leverage wrangler.toml in your development workflows.

Integrate Pages projects with your favorite database

You can already connect to D1, Cloudflare’s serverless SQL database, directly from Pages projects. And you can connect directly to your existing PostgreSQL database using Hyperdrive. Today, we’re making it even easier for you to connect 3rd party databases to Pages with just a couple of clicks. Pages now integrates directly with Neon, PlanetScale, Supabase, Turso, Upstash, and Xata!

Simply navigate to your Pages project’s settings, select your database provider, and we’ll add environment variables with credentials needed to connect as well a secret with the API key from the provider for you automatically.

Not ready to ship to production yet? You can deploy your changes to Pages’ preview environment alongside your staging database and test your deployment with its unique preview URL.

What’s coming up for integrations?
We’re just getting started with database integrations, with many more providers to come. In the future, we’re also looking to expand our integrations platform to include seamless set up when building other components of your app – think authentication and observability!

Want to bring your favorite tools to Cloudflare but don’t see the integration option? Want to build out your own integration?

Not only are we looking for user input on new integrations to add, but we’re also opening up the integrations platform to builders who want to submit their own products! We’ll be releasing step-by-step documentation and tooling to easily build and publish your own integration. If you’re interested in submitting your own integration, please fill out our integration intake form and we’ll be in touch!

Improved Next.js Support for Pages

With 30 minor and patch releases since the 1.0 launch of next-on-pages during Dev Week 2023, our Next.js integration has been continuously maturing and keeping up with the evolution of Next.js. In addition to performance improvements, and compatibility and bug fixes, we released three significant improvements.

First, the ESLint plugin eslint-plugin-next-on-pages is a great way to catch and fix compatibility issues as you are writing your code before you build and deploy applications. The plugin contains several rules for the most common coding mistakes we see developers make, with more being added as we identify problematic scenarios.

Another noteworthy change is the addition of getRequestContext() APIs, which provides you with access to Cloudflare-specific resources and metadata about the request currently being processed by your application, allowing for example you to take client’s location or browser preferences into account when generating a response.

Last but not least, as we just shared in a dedicated post, we have completely overhauled the local development workflow for Next.js as well as other full-stack frameworks. Thanks to the new setupDevPlatform() API, you can now use the default development server `next dev`, with support for instant edit & refresh experience, while also using D1, R2, KV and other resources provided by the Cloudflare development platform. Want to take it for a quick spin? Use C3 to scaffold a new Next.js application with just one command.

To learn more about our Next.js integration, check out our Next.js framework guide.

What’s next for the convergence of Workers and Pages?

While today’s launch represents just a few of the many upcoming additions to converge Pages and Workers, we also wanted to share a few milestones that are on the horizon, planned later in 2024

Pages features coming soon to Workers

  • Workers CI/CD. Later this year, we plan to bring the CI/CD system from Cloudflare Pages to Cloudflare Workers. Connect your repositories to Cloudflare and trigger builds for your Workers with every commit.
  • Serve static assets from Workers. You will be able to deploy and serve static assets as part of Workers – just like you can with Pages today – and build Workers using full-stack frameworks! This will also extend to Workers for Platforms, allowing you to build platforms that let your customers deploy complete, full-stack applications that serve both dynamic and static assets.
  • Workers preview URLs. Preview versions of your Workers with every change and share a unique URL with your team for testing.

Workers features coming soon to Pages

  • Add Tail Workers to Pages projects. Get observability into your Pages Functions by capturing console.log() messages, unhandled exceptions, and request metadata, and then forward the information to external destinations.
  • Workers Trace Events Logpush. Push your Pages Functions logs to supported destinations like R2, Datadog, or any HTTP destination for long term storage, auditing, and compliance.
  • Gradual Deployments. Gradually deploy new versions of your Pages Function to reduce risk when making changes to critical applications.

You might also notice that the Pages and Workers interfaces in the Cloudflare Dash will begin to look more similar through the rest of this year. These changes aren’t just superficial, or us porting over functionality from one product to another. Under-the-hood, we are unifying the way that Workers and Pages projects are composed and then deployed to our network, ensuring that as we add new products and features, they can work with both Pages and Workers on day one.

In the meantime, bring your monorepo, a wrangler.toml, and your favorite databases to Pages and let’s rock! Be sure to show off what you’ve built in the Cloudflare Developer Discord or by giving us a shout at @CloudflareDev.

Cloudflare Calls: millions of cascading trees all the way down

Post Syndicated from Renan Dincer original https://blog.cloudflare.com/cloudflare-calls-anycast-webrtc


Following its initial announcement in September 2022, Cloudflare Calls is now in open beta and available in your Cloudflare Dashboard. Cloudflare Calls lets developers build real-time audio/video apps using WebRTC, and it abstracts away the complexity by turning the Cloudflare network into a singular SFU. In this post, we dig into how we make this possible.

WebRTC growing pains

WebRTC is the only way to send UDP traffic out of a web browser – everything else uses TCP.

As a developer, you need a UDP-based transport layer for applications demanding low latency and real-time feedback, such as audio/video conferencing and interactive gaming. This is because unlike WebSocket and other TCP-based solutions, UDP is not subject to head-of-line blocking, a frequent topic on the Cloudflare Blog.

When building a new video conferencing app, you typically start with a peer-to-peer web application using WebRTC, where clients exchange data directly. This approach is efficient for small-scale demos, but scalability issues arise as the number of participants increases. This is because the amount of data each client must transmit grows substantially, following an almost exponential increase relative to the number of participants, as each client needs to send data to n-1 other clients.

Selective Forwarding Units (SFUs) play pivotal roles in scaling WebRTC applications. An SFU functions by receiving multiple media or data flows from participants and deciding which streams should be forwarded to other participants, thus acting as a media stream routing hub. This mechanism significantly reduces bandwidth requirements and improves scalability by managing stream distribution based on network conditions and participant needs. Even though it hasn’t always been this way from when video calling on computers first became popular, SFUs are often found in the cloud, rather than home computers of clients, because of superior connectivity offered in a data center.

A modern audio/video application thus quickly becomes complicated with the addition of this server side element. Since all clients connect to this central SFU server, there are numerous things to consider when you’re architecting and scaling a real-time application:

  • How close is the SFU server location(s) to the end user clients, how is a client assigned to a server?
  • Where is the SFU hosted, and if it’s hosted in the cloud, what are the egress costs from VMs?
  • How many participants can fit in a “room”? Are all participants sending and receiving data? With cameras on? Audio only?
  • Some SFUs require the use of custom SDKs. Which platforms do these run on and are they compatible with the application you’re trying to build?
  • Monitoring/reliability/other issues that come with running infrastructure

Some of these concerns, and the complexity of WebRTC infrastructure in general, has made the community look in different directions. However, it is clear that in 2024, WebRTC is alive and well with plenty of new and old uses. AI startups build characters that converse in real time, cars leverage WebRTC to stream live footage of their cameras to smartphones, and video conferencing tools are going strong.

WebRTC has been interesting to us for a while. Cloudflare Stream implemented WHIP and WHEP WebRTC video streaming protocols in 2022, which remain the lowest latency way to broadcast video. OBS Studio implemented WHIP broadcasting support as have a variety of software and hardware vendors alongside Cloudflare. In late 2022, we launched Cloudflare Calls in closed beta. When we blogged about it back then, we were very impressed with how WebRTC fared, and spoke to many customers about their pain points as well as creative ideas the existing browser APIs can foster. We also saw other WebRTC-based apps like Clubhouse rise in popularity and Twitter Spaces play a role in popular culture. Today, we see real-time applications of a different sort. Many AI projects have impressive demos with voice/video interactions. All of these apps are built with the same WebRTC APIs and system architectures.

We are confident that Cloudflare Calls is a new kind of WebRTC infrastructure you should try. When we set out to build Cloudflare Calls, we had a few ideas that we weren’t sure would work, but were worth trying:

  • Build every WebRTC component on Anycast with a single IP address for DTLS, ICE, STUN, SRTP, SCTP, etc.
  • Don’t force an SDK – WebRTC APIs by themselves are enough, and allow for the most novel uses to shine, because best developers always find ways to hit the limits of SDKs.
  • Deploy in all 310+ cities Cloudflare operates in – use every Cloudflare server, not just a subset
  • Exchange offer and answer over HTTP between Cloudflare and the WebRTC client. This way there is only a single PeerConnection to manage.

Now we know this is all possible, because we made it happen, and we think it’s the best experience a developer can get with pure WebRTC.

Is Cloudflare Calls a real SFU?

Cloudflare is in the business of having computers in numerous places. Historically, our core competency was operating a caching HTTP reverse proxy, and we are very good at this. With Cloudflare Calls, we asked ourselves “how can we build a large distributed system that brings together our global network to form one giant stateful system that feels like a single machine?”

When using Calls, every PeerConnection automatically connects to the closest Cloudflare data center instead of a single server. Rather than connecting every client that needs to communicate with each other to a single server, anycast spreads out connections as much as possible to minimize last mile latency sourced from your ISP between your client and Cloudflare.

It’s good to minimize last mile latency because after the data enters Cloudflare’s control, the underlying media can be managed carefully and routed through the Cloudflare backbone. This is crucial for WebRTC applications where millisecond delays can significantly impact user experience. To give you a sense about latency between Cloudflare’s data centers and end-users, about 95% of the Internet connected population is within 50ms of a Cloudflare data center. As I write this, I am about 20ms away, but in the past, I have been lucky enough to be connected to a **great** home Wi-Fi network less than 1ms away in Manhattan. “But you are just one user!” you might be thinking, so here is a chart from Cloudflare Radar showing recent global latency measurements:

This setup allows more opportunities for packets lost to be replied with retransmissions closer to users, more opportunities for bandwidth adjustments.

Eliminating SFU region selection

A traditional challenge in WebRTC infrastructure involves the manual selection of Selective Forwarding Units (SFUs) based on geographic location to minimize latency. Some systems solve this problem by selecting a location for the SFU after the first user joins the “room”. This makes routing inefficient when the rest of the participants in the conversation are clustered elsewhere. The anycast architecture of Calls eliminates this issue. When a client initiates a connection, BGP dynamically determines the closest data center. Each selected server only becomes responsible for the PeerConnection of the clients closest to it.

One might see this is actually a simpler way of managing servers, as there is no need to maintain a layer of WebRTC load balancing for traffic or CPU capacity between servers. However, anycast has its own challenges, and we couldn’t take a laissez-faire approach.

Steps to establishing a PeerConnection

One of the challenging parts in assigning a server to a client PeerConnection is supporting dual stack networking for backwards compatibility with clients that only support the old version of the Internet Protocol, IPv4.

Cloudflare Calls uses a single IP address per protocol, and our L4 load balancer directs packets to a single server per client by using the 4-tuple {client IP, client port, destination IP, destination port} hashing. This means that every ICE connectivity check packet arrives at different servers: one for IPv4 and one for IPv6.

ICE is not the only protocol used for WebRTC; there is also STUN and TURN for connectivity establishment. Actual media bits are encrypted using DTLS, which carries most of the data during a session.

DTLS packets don’t have any identifiers in them that would indicate they belong to a specific connection (unlike QUIC’s connection ID field), so every server should be able to handle DTLS packets and get the necessary certificates to be able to decrypt them for processing. DTLS encryption is negotiated at the SDP layer using the HTTPS API.

The HTTPS API for Calls also lands on a different server than DTLS and ICE connectivity checks. Since DTLS packets need information from the SDP exchanged using the HTTPS API, and ICE connectivity checks depend on the HTTPS API for userFragment and password fields in the connectivity check packets, it would be very useful for all of these to be available in one server. Yet in our setup, they’re not.

Fippo and Gustavo of WebRTCHacks complained (gracefully noted) about slow replies to ICE connectivity checks in their great article as they were digging into our WHIP implementation right around our announcement in 2022:

Looking at the Wireshark dumps we see a surprisingly large amount of time pass between the first STUN request and the first STUN response – it was 1.8 seconds in the screenshot below.

In other tests, it was shorter, but still 600ms long.

After that, the DTLS packets do not get an immediate response, requiring multiple attempts. This ultimately leads to a call setup time of almost three seconds – way above the global average of 800ms Fippo has measured previously (for the complete handshake, 200ms for the DTLS handshake). For Cloudflare with their extensive network, we expected this to be way below that average.

Gustavo and Fippo observed our solution to this problem of different parts of the WebRTC negotiation landing on different servers. Since Cloudflare Calls unbundles the WebRTC protocol to make the entire network act like a single computer, at this critical moment, we need to form consensus across the network. We form consensus by configuring every server to handle any incoming PeerConnection just in time. When a packet arrives, if the server doesn’t know about it, it quickly learns about the negotiated parameters from another server, such as the ufrag and the DTLS fingerprint from the SDP, and responds with the appropriate response.

Getting faster

Even though we’ve sped up the process of forming consensus across the Cloudflare network, any delays incurred can still have weird side effects. For example, up until a few months ago, delays of a few hundred milliseconds caused slow connections in Chrome.

A connectivity check packet delayed by a few hundred milliseconds signals to Chrome that this is a high latency network, even though every other STUN message after that was replied to in less than 5-10ms. Chrome thus delays sending a USE-CANDIDATE attribute in the responses for a few seconds, degrading the user experience.

Fortunately, Chrome also sends DTLS ClientHello before USE-CANDIDATE (behavior we’ve seen only on Chrome), so to help speed up Chrome, Calls uses DTLS packets in place of STUN packets with USE-CANDIDATE attributes.

After solving this issue with Chrome, PeerConnections globally now take about 100-250ms to get connected. This includes all consensus management, STUN packets, and a complete DTLS handshake.

Sessions and Tracks are the building blocks of Cloudflare’s SFU, not rooms

Once a PeerConnection is established to Cloudflare, we call this a Session. Many media Tracks or DataChannels can be published using a single Session, which returns a unique ID for each. These then can be subscribed to over any other PeerConnection anywhere around the world using the unique ID. The tracks can be published or subscribed anytime during the lifecycle of the PeerConnection.

In the background, Cloudflare takes care of scaling through a fan-out architecture with cascading trees that are unique per track. This structure works by creating a hierarchy of nodes where the root node distributes the stream to intermediate nodes, which then fan out to end-users. This significantly reduces the bandwidth required at the source and ensures scalability by distributing the load across the network. This simple but powerful architecture allows developers to build anything from 1:1 video calls to large 1:many or many:many broadcasting scenarios with Calls.

There is no “room” concept in Cloudflare Calls. Each client can add as many tracks into a PeerConnection as they’d like. The limit is the bandwidth available between Cloudflare and the client, which is practically limited by the client side every time. The signaling or the concept of a “room” is left to the application developer, who can choose to pull as many tracks as they’d like from the tracks they have pushed elsewhere into a PeerConnection. This allows developers to move participants into breakout rooms and then back into a plenary room, and then 1:1 rooms while keeping the same PeerConnection and MediaTracks active.

Cloudflare offers an unopinionated approach to bandwidth management, allowing for greater control in customizing logic to suit your business needs. There is no active bandwidth management or restriction on the number of tracks. The WebRTC Stats API provides a standardized way to access data on packet loss and possible congestion, enabling you to incorporate client-side logic based on this information. For instance, if poor Wi-Fi connectivity leads to degraded service, your front-end could inform the user through a notice and automatically reduce the number of video tracks for that client.

“NACK shield” at the edge

The Internet can’t guarantee timely and orderly delivery of packets, leading to the necessity of retransmission mechanisms, particularly in protocols like TCP. This ensures data eventually reaches its destination, despite possible delays. Real-time systems, however, need special consideration of these delays. A packet that is delayed past its deadline for rendering on the screen is worthless, but a packet that is lost can be recovered if it can be retransmitted within a very short period of time, on the order of milliseconds. This is where NACKs come to play.

A WebRTC client receiving data constantly checks for packet loss. When one or more packets don’t arrive at the expected time or a sequence number discontinuity is seen on the receiving buffer, a special NACK packet is sent back to the source in order to ask for a packet retransmission.

In a peer-to-peer topology, if it receives a NACK packet, the source of the data has to retransmit packets for every participant. When an SFU is used, the SFU could send NACKs back to source, or keep a complex buffer for each client to handle retransmissions.

This gets more complicated with Cloudflare Calls, since both the publisher and the subscriber connect to Cloudflare, likely to different servers and also probably in different locations. In addition, there is a possibility of other Cloudflare data centers in the middle, either through Argo, or just as part of scaling to many subscribers on the same track.

It is common for SFUs to backpropagate NACK packets back to the source, losing valuable time to recover packets. Calls goes beyond this and can handle NACK packets in the location closest to the user, which decreases overall latency. The latency advantage gives more chance for the packet to be recovered compared to a centralized SFU or no NACK handling at all.

Since there is possibly a number of Cloudflare data centers between clients, packet loss within the Cloudflare network is also possible. We handle this by generating NACK packets in the network. With each hop that is taken with the packets, the receiving end can generate NACK packets. These packets are then recovered or backpropagated to the publisher to be recovered.

Cloudflare Calls does TURN over Anycast too

Separately from the SFU, Calls also offers a TURN service. TURN relays act as relay points for traffic between WebRTC clients like the browser and SFUs, particularly in scenarios where direct communication is obstructed by NATs or firewalls. TURN maintains an allocation of public IP addresses and ports for each session, ensuring connectivity even in restrictive network environments.

Cloudflare Calls’ TURN service supports a few ports to help with misbehaving middleboxes and firewalls:

  • TURN-over-UDP over port 3748 (standard), and also port 53
  • TURN-over-TCP over ports 3748 and 80
  • TURN-over-TLS over ports 5349 and 443

TURN works the same way as Calls, available over anycast and always connecting to the closest datacenter.

Pricing and how to get started

Cloudflare Calls is now in open beta and available in your Cloudflare Dashboard. Depending on your use case, you can set up an SFU application and/or a TURN service with only a few clicks.

To kick off its open beta phase, Calls is available at no cost for a limited time. Starting May 15, 2024, customers will receive the first terabyte each month for free, with any usage beyond that charged at $0.05 per real-time gigabyte. Beta customers will be provided at least 30 days to upgrade from the free beta to a paid subscription. Additionally, there are no charges for in-bound traffic to Cloudflare. For volume pricing, talk to your account manager.

Cloudflare Calls is ideal if you are building new WebRTC apps. If you have existing SFUs or TURN infrastructure, you may still consider using Calls alongside your existing infrastructure. Building a bridge to Calls from other places is not difficult as Cloudflare Calls supports standard WebRTC APIs and acts like just another WebRTC peer.

We understand that getting started with a new platform is difficult, so we’re also open sourcing our internal video conferencing app, Orange Meets. Orange Meets supports small and large conference calls by maintaining room state in Workers Durable Objects. It has screen sharing, client-side noise-canceling, and background blur. It is written with TypeScript and React and is available on GitHub.

We’re hiring

We think the current state of Cloudflare Calls enables many use cases. Calls already supports publishing and subscribing to media tracks and DataChannels. Soon, it will support features like simulcasting.

But we’re just scratching the surface and there is so much more to build on top of this foundation.

If you are passionate about WebRTC (and other real-time protocols!!), the Media Platform team building the Calls product at Cloudflare is hiring and would love to talk to you.

What’s New in Rapid7 Products & Services: Q1 2024 in Review

Post Syndicated from Margaret Wei original https://blog.rapid7.com/2024/04/04/whats-new-in-rapid7-products-services-q1-2024-in-review/

What’s New in Rapid7 Products & Services: Q1 2024 in Review

We kicked off 2024 with a continued focus on bringing security professionals (which if you’re reading this blog, is likely you!) the tools and functionality needed to anticipate risks, pinpoint threats, and respond faster with confidence. Below we’ve highlighted some key releases and updates from this past quarter across Rapid7 products and services—including InsightCloudSec, InsightVM, InsightIDR, Rapid7 Labs, and our managed services.

Anticipate Imminent Threats Across Your Environment

Monitor, remediate, and takedown threats with Managed Digital Risk Protection (DRP)

Rapid7’s new Managed Digital Risk Protection (DRP) service provides expert monitoring and remediation of external threats across the clear, deep, and dark web to prevent attacks earlier.

Now available in our highest tier of Managed Threat Complete and as an add on for all other Managed D&R customers, Managed DRP extends your team with Rapid7 security experts to:

  • Identify the first signs of a cyber threat to prevent a breach
  • Rapidly remediate and takedown threats to minimize exposure
  • Protect against ransomware data leakage, phishing, credential leakage, data leakage, and provide dark web monitoring

Read more about the benefits of Managed DRP in our blog here.

What’s New in Rapid7 Products & Services: Q1 2024 in Review

Ensure safe AI development in the cloud with Rapid7 AI/ML Security Best Practices

We’ve recently expanded InsightCloudSec’s support for GenAI development and training services (including AWS Bedrock, Azure OpenAI Service and GCP Vertex) to provide more coverage so teams can effectively identify, assess, and quickly act to resolve risks related to AI/ML development.

This expanded generative AI coverage enriches our proprietary compliance pack, Rapid7 AI/ML Security Best Practices, which continuously assesses your environment through event-driven harvesting to ensure your team is safely developing with AI in a manner that won’t leave you exposed to common risks like data leakage, model poisoning, and more.

As with all critical resources connected to your InsightCloudSec environment, these risks are enriched with Layered Context to automatically prioritize AI/ML risk based on exploitability and potential impact. They’re also continuously monitored for effective permissions and actual usage to rightsize permissions to ensure alignment with LPA. In addition to this extensive visibility, InsightCloudSec offers native automation to alert on and even remediate risk across your environment without the need for human intervention.

Stay ahead of emerging threats with insights and guidance from Rapid7 Labs

In the first quarter of this year, Rapid7 initiated the Emergent Threat Response (ETR) process for 12 different threats, including (but not limited to):

  • Zero-day exploitation of Ivanti Connect Secure and Ivanti Pulse Secure gateways, the former of which has historically been targeted by both financially motivated and state-sponsored threat actors in addition to low-skilled attackers.
  • Critical CVEs affecting outdated versions of Atlassian Confluence and VMware vCenter Server, both widely deployed products in corporate environments that have been high-value targets for adversaries, including in large-scale ransomware campaigns.
  • High-risk authentication bypass and remote code execution vulnerabilities in ConnectWise ScreenConnect, widely used software with potential for large-scale ransomware attacks, providing coverage before CVE identifiers were assigned.
  • Two authentication bypass vulnerabilities in JetBrains TeamCity CI/CD server that were discovered by Rapid7’s research team.

Rapid7’s ETR program is a cross-team effort to deliver fast, expert analysis alongside first-rate security content for the highest-priority security threats to help you understand any potential exposure and act quickly to defend your network. Keep up with future ETRs on our blog here.

Pinpoint Critical and Actionable Insights to Effectively and Confidently Respond

Introducing the newest tier of Managed Threat Complete

Since we released Managed Threat Complete last year, organizations all over the globe have unified their vulnerability management programs with their threat detection and response programs. Now, teams have a unified view into the full kill chain and a tailored service to turbocharge their program, mitigate the most pressing risks and eliminate threats.

Managed Threat Complete Ultimate goes beyond our previously available Managed Threat Complete bundles to include:

  • Managed Digital Risk Protection for monitoring and remediation of threats across the clear, deep, and dark web
  • Managed Vulnerability Management for clarity guidance to remediate the highest priority risk
  • Velociraptor, Rapid7’s leading open-source DFIR framework, from monitoring and hunting to in-depth investigations into potential threats, access the tool that is leveraged by our Incident Response experts on behalf of our managed customers
  • Ransomware Prevention for recognizing threats and stopping attacks before they happen with multi-layered prevention (coming soon – stay tuned)

Get to the data you need faster with new Log Search and Investigation features in InsightIDR

Our latest enhancements to Log Search and Investigations will help drive efficiency for your team and give you time back in your day-to-day—and when you really need it in the heat of an incident. Faster search times, easier-to-write queries, and intuitive recommendations will help you find event trends within your data and save you time without sacrificing results.

  • Triage investigations faster with log data readily accessible from the investigations timeline – with a click of the new “view log entry” button you’ll instantly see the context and log data behind an associated alert.
  • Create precise queries quickly with new automatic suggestions – as you type in Log Search, the query bar will automatically suggest the elements of LEQL that you can use in your query to get to the data you need—like users, IP addresses, and processes—faster.
  • Save time sifting through search results with new LEQL ‘select’ clause – define exactly what keys to return in the search results so you can quickly answer questions from log data and avoid superfluous information.

Easily view vital cloud alert context with Simplified Cloud Threat Alerts

This quarter we launched Simplified Cloud Threat Alerts within InsightIDR to make it easier to quickly understand what a cloud alert – like those from AWS GuardDuty – means, which can be a daunting task for even the most experienced analysts due to the scale and complexity of cloud environments.

With this new feature, you can view details and known issues with the resources (e.g. assets, users, etc.) implicated in the alert and have clarity on the steps that should be taken to appropriately respond to the alert. This will help you:

  • Quickly understand what a given cloud resource is, its intended purpose, what applications it supports and who “owns” it.
  • Get a clear picture around what an alert means, what next steps to take to verify the alert, or how to respond if the alert is in fact malicious.
  • Prioritize response efforts based on potential impact with insight into whether or not the compromised resource is misconfigured, has active vulnerabilities, or has been recently updated in a manner that signals potential pre-attack reconnaissance.

A growing library of actionable detections in InsightIDR

In Q1 2024 we added 1,349 new detection rules. See them in-product or visit the Detection Library for descriptions and recommendations.

Stay tuned!

As always, we’re continuing to work on exciting product enhancements and releases throughout the year. Keep an eye on our blog and release notes as we continue to highlight the latest in product and service investments at Rapid7.

Surveillance by the New Microsoft Outlook App

Post Syndicated from Bruce Schneier original https://www.schneier.com/blog/archives/2024/04/surveillance-by-the-new-microsoft-outlook-app.html

The ProtonMail people are accusing Microsoft’s new Outlook for Windows app of conducting extensive surveillance on its users. It shares data with advertisers, a lot of data:

The window informs users that Microsoft and those 801 third parties use their data for a number of purposes, including to:

  • Store and/or access information on the user’s device
  • Develop and improve products
  • Personalize ads and content
  • Measure ads and content
  • Derive audience insights
  • Obtain precise geolocation data
  • Identify users through device scanning

Commentary.

Careers in computer science: Two perspectives

Post Syndicated from Dan Fisher original https://www.raspberrypi.org/blog/careers-in-computer-science-two-perspectives/

As educators, it’s important that we showcase the wide range of career opportunities available in the field of computing, not only to inspire learners, but also to help them feel sure they’re choosing to study a subject that is useful for their future. For example, a survey from the BBC in September 2023 found that more than a quarter of UK teenagers often feel anxious, with “exams and school life” among the main causes. To help young people chart their career paths, we recently hosted two live webinars for National Careers Week in the UK.

Our goal for the webinars was to highlight the breadth of careers within computing and to provide insights from professionals who are pursuing their own diverse and rewarding paths. Each webinar featured engaging discussions and an interactive Q&A session with learners who use our Ada Computer Science platform. The learners could ask their own questions to get firsthand knowledge and perspectives from our guest speakers.

Our guest speakers

Jess Van Brummelen is a Human–Computer Interaction Research Scientist at Niantic, the video games company behind augmented reality game Pokémon Go. After developing an interest in programming during her undergraduate degree in mechanical engineering, she went on to complete a Master’s degree and PhD in computer science at MIT.

Ashley Edwards is a Senior Research Scientist at Google DeepMind, working on reinforcement learning. She received her PhD in 2019 from Georgia Tech, spent time as an intern at Google Brain, and worked as a research scientist at Uber AI Labs.

You can read extracts from our interviews with Jess and Ashley and watch the full videos below. Teachers have contacted us to say they’ll be using the webinars for careers-focused sessions with their students. We hope you will do the same!

Please note that we have edited the extracts below to add clarity.

Jess Van Brummelen

Jessica Van Brummelen.

Hi Jess. What advice would you give to a student who is thinking about a career in human–computer interaction in the gaming industry?

In terms of HCI and gaming, I’d actually recommend that you keep gaming! It’s a small part of my job but it’s really important to understand what’s fun and enjoyable in games. Not only that; gaming can be great for learning to problem-solve — there’s been all sorts of research on the positive impact of gaming.

A second thing, going back to how I felt in my mechanical engineering classes, I really felt like an ‘other’ and not someone who is the standard computer scientist or engineer. I would encourage students to pursue their dreams anyway because it’s so important to have diversity in these types of careers, especially technology, because it goes out to so many different people and it can really affect society. It’s really important that the people who make it come from many different backgrounds and cultures so we can create technology that is better for everyone.

[From Owen, a student on the livestream] What’s the most impossible idea you’ve come up with while working at Niantic?

I’m currently publishing a paper addressing the question, ‘Can we guide people without using anything visual on their phone?’ That means using audio and haptic (technology that transmits information via touch, e.g. vibrations) prompts instead. We tried out different commands where the phone said ‘turn left’ and ‘turn right’, but we really wanted to test how to guide someone more specifically in a game environment. For example, if there was a hidden object on a wall in a game that a person couldn’t see, could we guide them to that object while they’re walking? So I ran a study where I guided people to scan a statue by moving around it. Scanning is the process of using the camera on your phone to scan an object in real life, which is then reconstructed on your phone. Scanning objects can trigger other augmented reality experiences within a game. For example, you might scan a real-life box in a room and this might trigger an animation of that box opening to reveal a secret within the game. We tested a lot of different things. For example, test subjects listened to music as they were walking and when they were on the right path, the music sounded really good. But when they were off the path, it sounded terrible. So it helped them to look for the right path. Then if you were pointing the phone in the wrong direction for scanning objects, you would get warning vibrations on the phone. So we did the study and we were hoping it would improve safety. It turns out it was neutral on improving safety — I think this is because it was such a novel system. People weren’t used to using it and still bumped into things! But it did make people better at scanning the objects, which was interesting.

Watch Jess’s full interview:

Ashley Edwards

Ashley Edwards.

Hi Ashley. Is there something you studied in school that you found to be more useful now than you ever thought it would be?

Maths! I always enjoyed doing maths, but I didn’t realise I would need it as a computer scientist. You see it popping up all the time, especially in machine learning. Having a strong knowledge of calculus and linear algebra is really helpful.

How do you train an AI model using machine learning

You start by asking the question, ‘What is the problem I’m trying to solve?’ Then typically you need input data and the outputs you want to achieve, so you ask two more questions, ‘What data do I want to come in?’ and ‘What do I want to come out?’ Let’s say you decide to use a supervised learning model (a category of machine learning where labelled data sets are used to train algorithms to detect patterns and predict outcomes) to predict whether a photo contains a cat. You train the model using a giant set of images with labels that say either ‘This is a cat’ or ‘This isn’t a cat’. By training the model with the images, you get to a point where your model can analyse the features of any image and predict whether it contains a cat or not.

In my field of research, I work on something called reinforcement learning, which is where you train your model through trial and error and the use of ‘rewards’. Let’s imagine we are trying to train a robot. We might write a program that tells the robot, ‘I am going to give you a reward if you take the right step forward and it’s going to be a positive reward. If you fall over, I’m going to give you a negative reward.’ So you train the robot to prioritise the right behaviours to optimise the rewards it’s getting.

[From a student] Will I still need to learn to code in the future?

I think it is going to be very different in the future, but we’ll still need to learn how to build different types of algorithms and we’re going to need to understand the concepts behind coding as well. We’ll still need to ask questions like, ‘What is it that I want to build?’ and ‘Is this actually doing the correct thing?’

Watch Ashley’s full interview:

Broadening access

Jess and Ashley are forging successful careers not only through a combination of smart choices, hard work, talent, and a passion for technology; they also had access to opportunities to discover their passion and receive an education in this field. Too many young people around the world still don’t have these opportunities.

That is why we provide free resources and training to help schools broaden access to computing education. For example, our free learning platform, Ada Computer Science, provides students aged 14 to 19 with high-quality computing resources and interactive questions, written by experts from our team. To learn more, visit adacomputerscience.org.

The post Careers in computer science: Two perspectives appeared first on Raspberry Pi Foundation.

Оценките – (не)нужното зло

Post Syndicated from original https://www.toest.bg/otsenkite-ne-nuzhnoto-zlo/

Оценките – (не)нужното зло

Много от темите, засягащи образователната система и нейното актуализиране, тепърва се промъкват в България. Смесването на различни възрасти в едно занятие, блоковото разпределение на часовете с цел по-качествено научаване, преминаването в полудигитална среда с електронни учебници – все неща, за които чуваме, но не виждаме в действие. На фона на тази стагнация и нежелание за модернизация да говорим за оценките в училище е чиста революция, но все някога тази дискусия трябва да започне.

В различните държави оценките могат не само да бъдат изразени различно (българската шестица в Съединените щати е оценка А), но и да са разделени на различни степени – еквивалент на нашата уж шестобална система във Франция например е 20-точкова система с много по-детайлно разделение на оценяването. Общото между всички тези различни системи обаче са количествените и качествените показатели, които се съдържат във всяка оценка.

Дали оценките се пишат с букви или цифри, няма значение – те служат за рационализиране на комуникационния процес между учебните институции или между техните части и участници. Това, което не правят обаче, е да служат на отделния учещ и да допринасят за неговия напредък. Защото основаващата се на сравнение и съревнование учебна система търси единствено количествения израз на постиженията и напълно изключва качествения. 

Актуално състояние

Оценките и начините на оценяване са поредният инструмент, който не се е променял поне от времето на родителите ни. Ако имате дете в училищна възраст, може да го разпитате как го изпитват. 

Все още, през 2024 г., разполагаме с прилично количество авторитарни учители, които изправят ученика до бюрото си и се държат с него като на разпит. 

Все още (понякога оправданото) безсилие на учителите се изразява в класическото наказание: „Извадете по един двоен лист“ (все едно някой някога е можел да изпише два листа, докато се намира в ступор от рязкото прекъсване на някое забавление в клас).

Все още учителите са просто хора и е съвсем естествено да са субективни и да дават предимство на ученици, към които изпитват симпатия, както и да им е трудно да признаят макар и минимална положителна промяна у някой ученик, когото не харесват толкова.

Колкото и правилници за оценяване да бъдат съставени и въведени, като например Наредба № 11 от 1 септември 2016 г. за оценяване на резултатите от обучението на учениците, никой от тях няма да може да намали щетите от субективното оценяване, от гоненето на успех (от родители и учители), от безкрайните уроци и курсове, целящи да вкарат поредното дете в „хубаво“ училище.

Ако все пак се примирим с неизбежността на оценките, е хубаво да си дадем сметка, че имаме шестобална система, която реално не е шестобална, защото оценките в нея са от слаб 2 до отличен 6. Двойката в тази система се използва най-често за наказание, а не като инструмент, който води до включването на изработени механизми за помощ. Защото в реалността вместо двойка и помощ идва тройката – за запазване на броя на учениците и за изпълнението на квотите. Ученикът научава, че няма кой да му помогне, но същевременно се научава, че независимо какво прави, той просто ще премине нататък. Поне до 12. клас – за след това не е нужно да се мисли.

Съвсем умишлено няма да говоря за безумието на националното външно оценяване, защото то е достойно за поредица анализи на всеки от участниците в него – от създателите му до последния изтерзан родител, напълнил още няколко джоба в сферата на частните уроци и школи и изпразнил и последните резерви от желание и любопитство на детето, което тепърва ще има още поне пет години гимназиален курс пред себе си. 

Ако трябва да съберем настоящето в две думи, те биха били несправедливо и насилствено.

Как може да бъде

Откакто има оценки, се смята, че те са инструмент за мотивация учещият да се представя по-добре, а ако ги няма, ще липсва стимул за постигане на целите. Научно погледнато обаче, има нищожно малко доказателства, че оценките карат учениците да са по-трудолюбиви и да учат повече. За сметка на това има огромно количество доказателства, че точно оценките възпрепятстват успешното представяне при изпитване и влияят негативно на мотивацията за учене.

Психологията отдавна е доказала, че ако изживяваме поражение и негативни чувства в дадена ситуация, ние съзнателно и несъзнателно ще се опитваме да избегнем попадането в нея. Така например, ако всяко изпитване по предмет Х е свързано с унизителното изкарване пред целия клас и демонстрирането на силната позиция на учителя, а в същото време имаме ученик, който среща затруднения по дадения предмет, то не би трябвало да се чудим, когато този ученик не може да насмогне със знанията си и постепенно започне да избягва не само ученето по предмета, но и самите часове. 

Обръщаме се към мотивационната психология за отговор, която прави разлика между вътрешна и външна мотивация. Външната мотивация са оценките – всяка оценка ни поставя етикет и ни отрежда мястото, което сме „заслужили“. Много по-важна обаче е вътрешната мотивация, която има три основни изграждащи я елемента: самостоятелност, компетентност и свързаност. 

Самостоятелността е правото на избор, свободата да поемеш контрол. Всеки ученик в момента е обект на обучението си; не участва по никакъв начин във формирането на нито една от задачите, които трябва да изпълни. Дори самостоятелните задачи, като презентация или проект, са изкривени и се използват като инструмент за повишаване на същата тази оценка и учениците знаят това. Ако позволим на децата да изберат темата си, да се задълбочат в посоката, която ги влече заради личния им интерес, а не заради постижението, ще постигнем много повече от добър успех. 

Под компетентност тук разбираме възможността да се усвояват нови умения. Дали 12-годишното еднотипно заучаване на предварително зададено съдържание развива нови умения? Може би, особено умения да се заобиколи всячески скуката. Да научим децата да общуват, да си сътрудничат и да мислят критично са само първите стъпки. Много по-важно е да бъдат развити умения – тогава знанието самò ще намери пътя си.

Свързаността е емоционалната част, чувството да си част от нещо. Всеки от нас има спомен за онзи учител, който го е вдъхновил да открие повече за себе си и света и е отворил нова врата към бъдещето. Да бъдеш приет и да бъдеш уважаван като отделен човек винаги води до желание да отвърнеш със същото. Да поставим децата над оценките им е подкрепата, от която се нуждаят. И няма нищо страшно плануваният урок понякога да отпадне заради тема, която силно е повлияла върху децата и те се нуждаят да говорят по нея.

Оценката е само израз на моментно състояние. Тя не показва колко сме добри, дали сме умни, дали сме успешни. Тя показва кои сме в точно този час – разсеяни, притеснени и паникьосани или спокойни, съсредоточени и подкрепени. По-важни от оценката са умението и желанието да учим през целия си живот, без да го приемаме като тегоба.

И понеже поставянето на оценка е неизбежно, нека поне се прави с обратна връзка. Уважителна, човешка и индивидуална обратна връзка в едно или няколко изречения. Когато е нужно – и в разговор. 

Английската думата education, която означава и „образование“, и „възпитание“, произлиза от латинското educo, educare, което освен всичко друго означава и „отглеждам“. Отглеждането е сред процесите, през които минаваме, за да станем пълноценни членове на заобикалящия ни свят, за да можем един ден самостоятелно да поемем отговорност за себе си и околните и да разкрием и развием потенциала си. Често цитираната поговорка, че е нужно цяло село, за да се отгледа едно дете, всъщност е вярна. Освен на родителите си, детето разчита на останалите членове на семейството си, на учителите – в детската градина, в началното училище, в следващите степени, на треньорите си, на подкрепящите го във всеки негов интерес обучители, на професори, на колеги, ръководители и много, много още. 

Не е ли абсурдно все още да смятаме, че образованието трябва да се състои от дългогодишно изсипване на факти върху деца, които нямат търпение да открият света и мястото си в него, и проверяването на степента на запомняне на тези факти под строг поглед? Дали слагането на етикет на всяко дете може да го мотивира и ако да – как и колко? За това дори не ни е нужна генерална реформа, а просто повече човечност. Защото не е задължително добрите оценки и успешният живот да вървят ръка за ръка.

Когато виждаме хората такива, каквито са, ги правим по-лоши. Но ако се отнасяме с тях, сякаш са това, което трябва да бъдат, тогава ги отвеждаме там, където трябва да отидат.

Йохан Волфганг фон Гьоте


Светът се променя с бясна скорост. Професиите, в които ще се развиват поколенията, започващи днес образователния си път, все още не са измислени. Подготвена ли е нашата образователна система, за да отговори на тези предизвикателства? Какво може и трябва да се промени? А как?

Веднъж месечно в рубриката „Възможното образование“ ще говорим за промяната – такава, каквато искаме да я видим, за добрите примери и за посоките, в които може би е добре да обърне поглед българската образователна система.

This is the Astera Labs Aries 6 PCIe Gen6 and CXL Retimer

Post Syndicated from Cliff Robinson original https://www.servethehome.com/this-is-the-astera-labs-aries-6-pcie-gen6-and-cxl-retimer/

We saw the Astera Labs Aries 6 PCIe Gen6 and CXL retimer running at NVIDIA GTC 2024 and looking great compared to Broadcom’s planned chip

The post This is the Astera Labs Aries 6 PCIe Gen6 and CXL Retimer appeared first on ServeTheHome.

Amazon DataZone now integrates with AWS Glue Data Quality and external data quality solutions

Post Syndicated from Andrea Filippo La Scola original https://aws.amazon.com/blogs/big-data/amazon-datazone-now-integrates-with-aws-glue-data-quality-and-external-data-quality-solutions/

Today, we are pleased to announce that Amazon DataZone is now able to present data quality information for data assets. This information empowers end-users to make informed decisions as to whether or not to use specific assets.

Many organizations already use AWS Glue Data Quality to define and enforce data quality rules on their data, validate data against predefined rules, track data quality metrics, and monitor data quality over time using artificial intelligence (AI). Other organizations monitor the quality of their data through third-party solutions.

Amazon DataZone now integrates directly with AWS Glue to display data quality scores for AWS Glue Data Catalog assets. Additionally, Amazon DataZone now offers APIs for importing data quality scores from external systems.

In this post, we discuss the latest features of Amazon DataZone for data quality, the integration between Amazon DataZone and AWS Glue Data Quality and how you can import data quality scores produced by external systems into Amazon DataZone via API.

Challenges

One of the most common questions we get from customers is related to displaying data quality scores in the Amazon DataZone business data catalog to let business users have visibility into the health and reliability of the datasets.

As data becomes increasingly crucial for driving business decisions, Amazon DataZone users are keenly interested in providing the highest standards of data quality. They recognize the importance of accurate, complete, and timely data in enabling informed decision-making and fostering trust in their analytics and reporting processes.

Amazon DataZone data assets can be updated at varying frequencies. As data is refreshed and updated, changes can happen through upstream processes that put it at risk of not maintaining the intended quality. Data quality scores help you understand if data has maintained the expected level of quality for data consumers to use (through analysis or downstream processes).

From a producer’s perspective, data stewards can now set up Amazon DataZone to automatically import the data quality scores from AWS Glue Data Quality (scheduled or on demand) and include this information in the Amazon DataZone catalog to share with business users. Additionally, you can now use new Amazon DataZone APIs to import data quality scores produced by external systems into the data assets.

With the latest enhancement, Amazon DataZone users can now accomplish the following:

  • Access insights about data quality standards directly from the Amazon DataZone web portal
  • View data quality scores on various KPIs, including data completeness, uniqueness, accuracy
  • Make sure users have a holistic view of the quality and trustworthiness of their data.

In the first part of this post, we walk through the integration between AWS Glue Data Quality and Amazon DataZone. We discuss how to visualize data quality scores in Amazon DataZone, enable AWS Glue Data Quality when creating a new Amazon DataZone data source, and enable data quality for an existing data asset.

In the second part of this post, we discuss how you can import data quality scores produced by external systems into Amazon DataZone via API. In this example, we use Amazon EMR Serverless in combination with the open source library Pydeequ to act as an external system for data quality.

Visualize AWS Glue Data Quality scores in Amazon DataZone

You can now visualize AWS Glue Data Quality scores in data assets that have been published in the Amazon DataZone business catalog and that are searchable through the Amazon DataZone web portal.

If the asset has AWS Glue Data Quality enabled, you can now quickly visualize the data quality score directly in the catalog search pane.

By selecting the corresponding asset, you can understand its content through the readme, glossary terms, and technical and business metadata. Additionally, the overall quality score indicator is displayed in the Asset Details section.

A data quality score serves as an overall indicator of a dataset’s quality, calculated based on the rules you define.

On the Data quality tab, you can access the details of data quality overview indicators and the results of the data quality runs.

The indicators shown on the Overview tab are calculated based on the results of the rulesets from the data quality runs.

Each rule is assigned an attribute that contributes to the calculation of the indicator. For example, rules that have the Completeness attribute will contribute to the calculation of the corresponding indicator on the Overview tab.

To filter data quality results, choose the Applicable column dropdown menu and choose your desired filter parameter.

You can also visualize column-level data quality starting on the Schema tab.

When data quality is enabled for the asset, the data quality results become available, providing insightful quality scores that reflect the integrity and reliability of each column within the dataset.

When you choose one of the data quality result links, you’re redirected to the data quality detail page, filtered by the selected column.

Data quality historical results in Amazon DataZone

Data quality can change over time for many reasons:

  • Data formats may change because of changes in the source systems
  • As data accumulates over time, it may become outdated or inconsistent
  • Data quality can be affected by human errors in data entry, data processing, or data manipulation

In Amazon DataZone, you can now track data quality over time to confirm reliability and accuracy. By analyzing the historical report snapshot, you can identify areas for improvement, implement changes, and measure the effectiveness of those changes.

Enable AWS Glue Data Quality when creating a new Amazon DataZone data source

In this section, we walk through the steps to enable AWS Glue Data Quality when creating a new Amazon DataZone data source.

Prerequisites

To follow along, you should have a domain for Amazon DataZone, an Amazon DataZone project, and a new Amazon DataZone environment (with a DataLakeProfile). For instructions, refer to Amazon DataZone quickstart with AWS Glue data.

You also need to define and run a ruleset against your data, which is a set of data quality rules in AWS Glue Data Quality. To set up the data quality rules and for more information on the topic, refer to the following posts:

After you create the data quality rules, make sure that Amazon DataZone has the permissions to access the AWS Glue database managed through AWS Lake Formation. For instructions, see Configure Lake Formation permissions for Amazon DataZone.

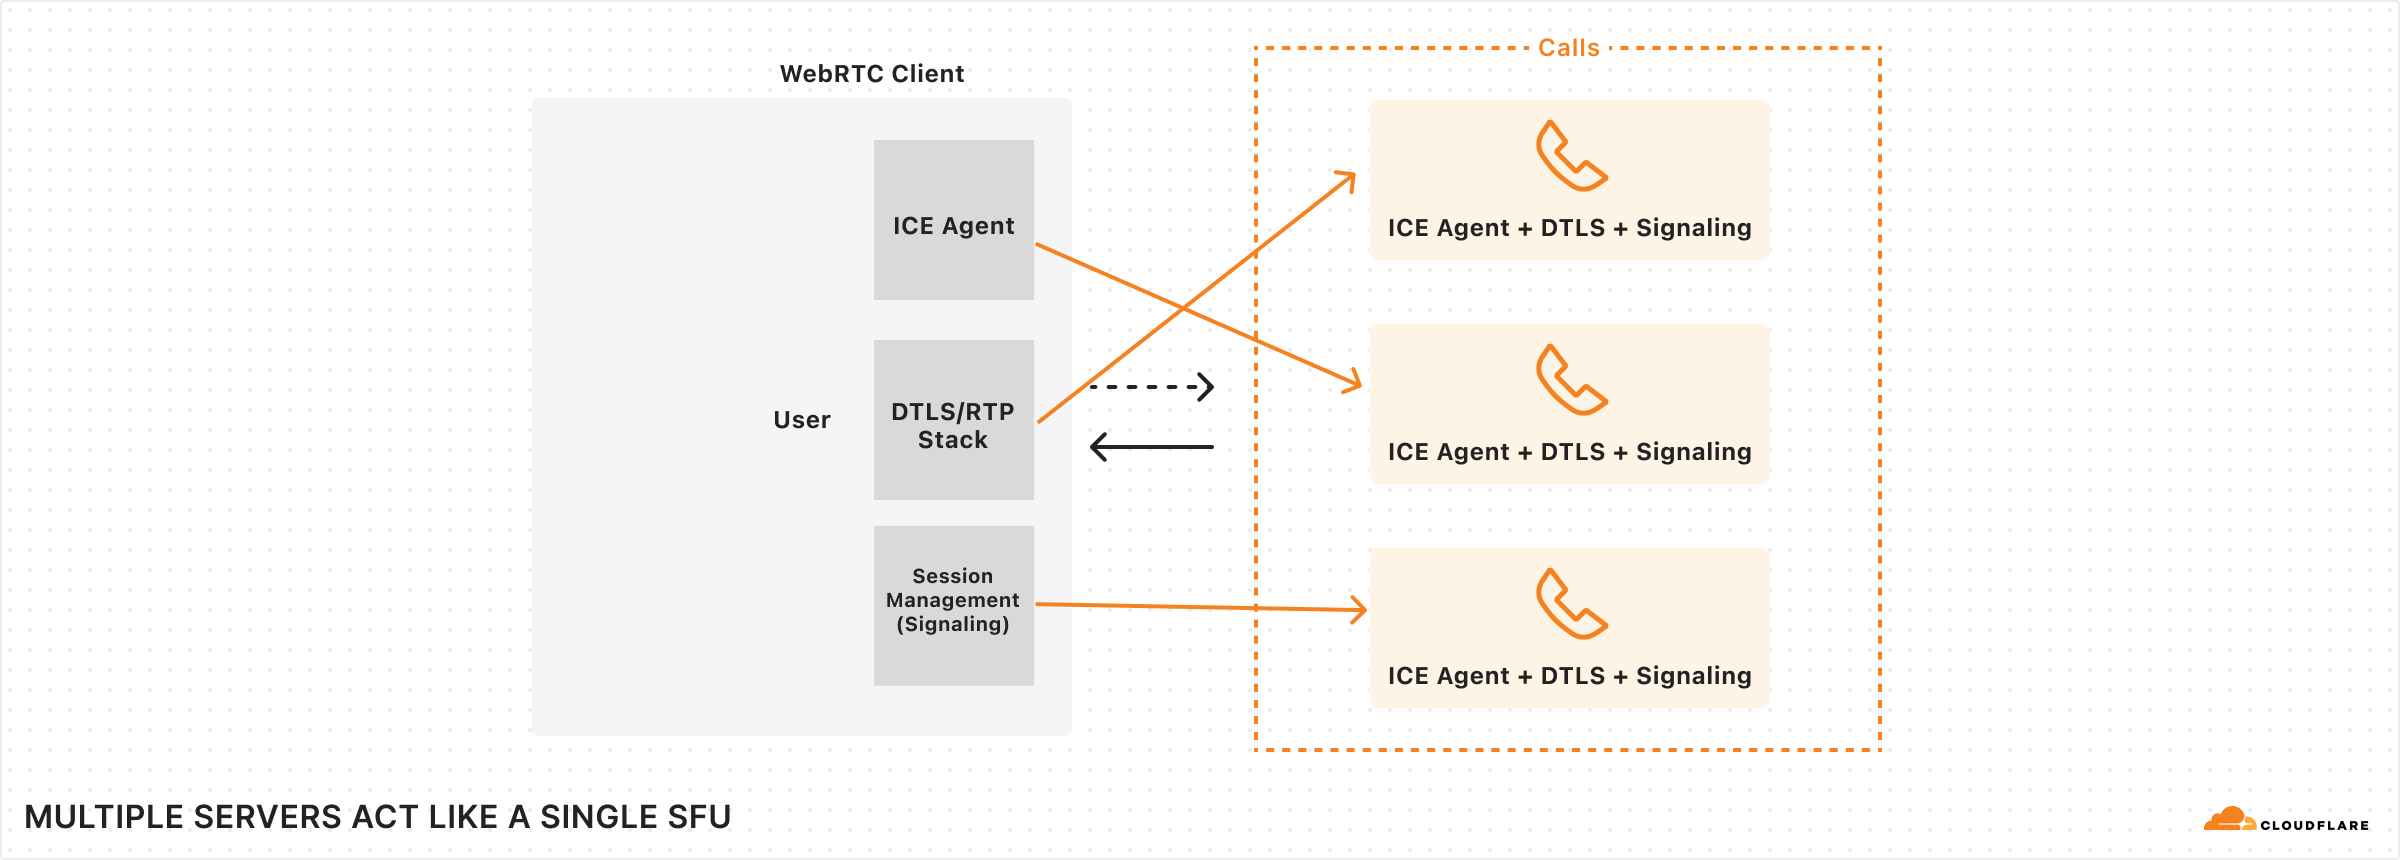
In our example, we have configured a ruleset against a table containing patient data within a healthcare synthetic dataset generated using Synthea. Synthea is a synthetic patient generator that creates realistic patient data and associated medical records that can be used for testing healthcare software applications.

The ruleset contains 27 individual rules (one of them failing), so the overall data quality score is 96%.

If you use Amazon DataZone managed policies, there is no action needed because these will get automatically updated with the needed actions. Otherwise, you need to allow Amazon DataZone to have the required permissions to list and get AWS Glue Data Quality results, as shown in the Amazon DataZone user guide.

Create a data source with data quality enabled

In this section, we create a data source and enable data quality. You can also update an existing data source to enable data quality. We use this data source to import metadata information related to our datasets. Amazon DataZone will also import data quality information related to the (one or more) assets contained in the data source.

  1. On the Amazon DataZone console, choose Data sources in the navigation pane.
  2. Choose Create data source.
  3. For Name, enter a name for your data source.
  4. For Data source type, select AWS Glue.
  5. For Environment, choose your environment.
  6. For Database name, enter a name for the database.
  7. For Table selection criteria, choose your criteria.
  8. Choose Next.
  9. For Data quality, select Enable data quality for this data source.

If data quality is enabled, Amazon DataZone will automatically fetch data quality scores from AWS Glue at each data source run.

  1. Choose Next.

Now you can run the data source.

While running the data source, Amazon DataZone imports the last 100 AWS Glue Data Quality run results. This information is now visible on the asset page and will be visible to all Amazon DataZone users after publishing the asset.

Enable data quality for an existing data asset

In this section, we enable data quality for an existing asset. This might be useful for users that already have data sources in place and want to enable the feature afterwards.

Prerequisites

To follow along, you should have already run the data source and produced an AWS Glue table data asset. Additionally, you should have defined a ruleset in AWS Glue Data Quality over the target table in the Data Catalog.

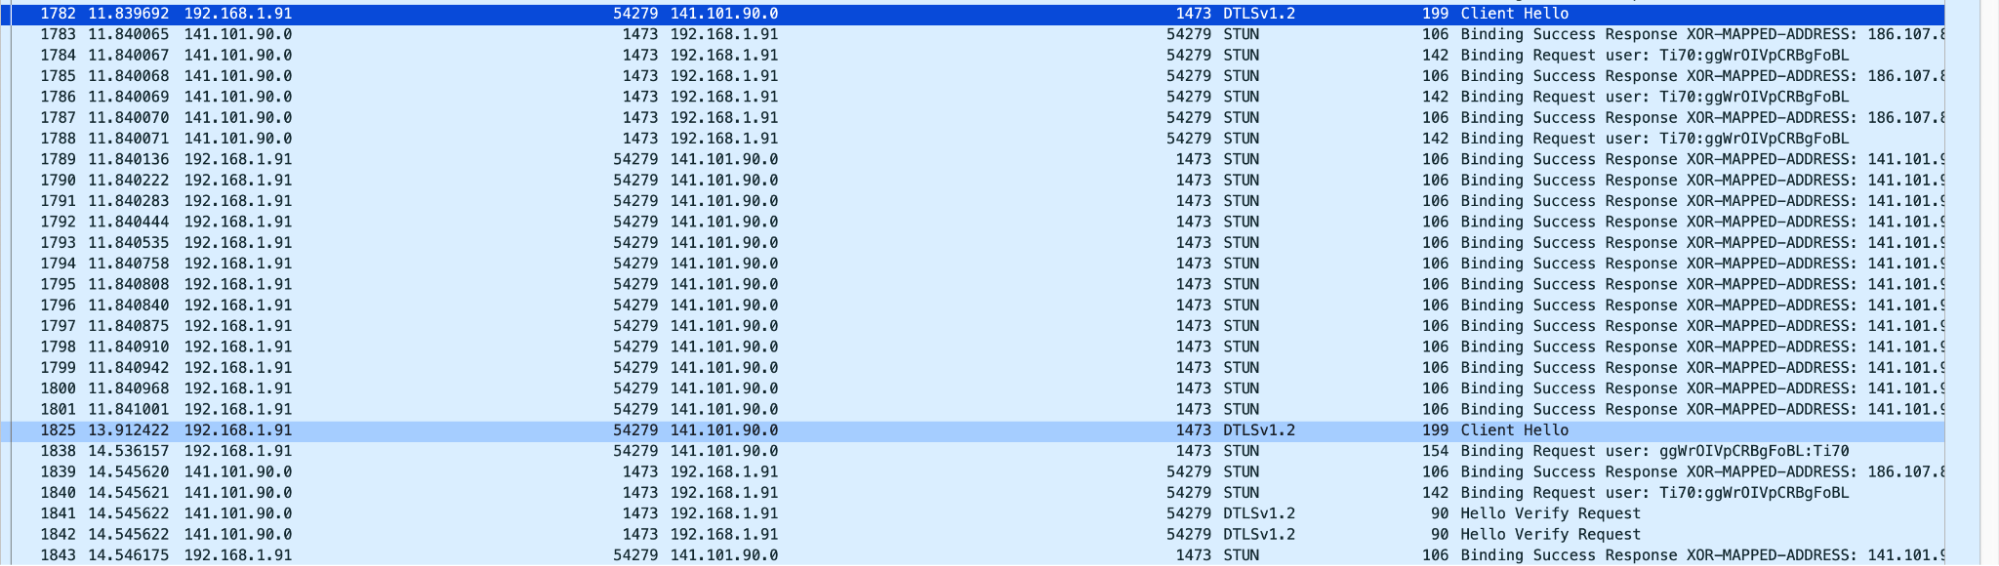
For this example, we ran the data quality job multiple times against the table, producing the related AWS Glue Data Quality scores, as shown in the following screenshot.

Import data quality scores into the data asset

Complete the following steps to import the existing AWS Glue Data Quality scores into the data asset in Amazon DataZone:

  1. Within the Amazon DataZone project, navigate to the Inventory data pane and choose the data source.

If you choose the Data quality tab, you can see that there’s still no information on data quality because AWS Glue Data Quality integration is not enabled for this data asset yet.

  1. On the Data quality tab, choose Enable data quality.
  2. In the Data quality section, select Enable data quality for this data source.
  3. Choose Save.

Now, back on the Inventory data pane, you can see a new tab: Data quality.

On the Data quality tab, you can see data quality scores imported from AWS Glue Data Quality.

Ingest data quality scores from an external source using Amazon DataZone APIs

Many organizations already use systems that calculate data quality by performing tests and assertions on their datasets. Amazon DataZone now supports importing third-party originated data quality scores via API, allowing users that navigate the web portal to view this information.

In this section, we simulate a third-party system pushing data quality scores into Amazon DataZone via APIs through Boto3 (Python SDK for AWS).

For this example, we use the same synthetic dataset as earlier, generated with Synthea.

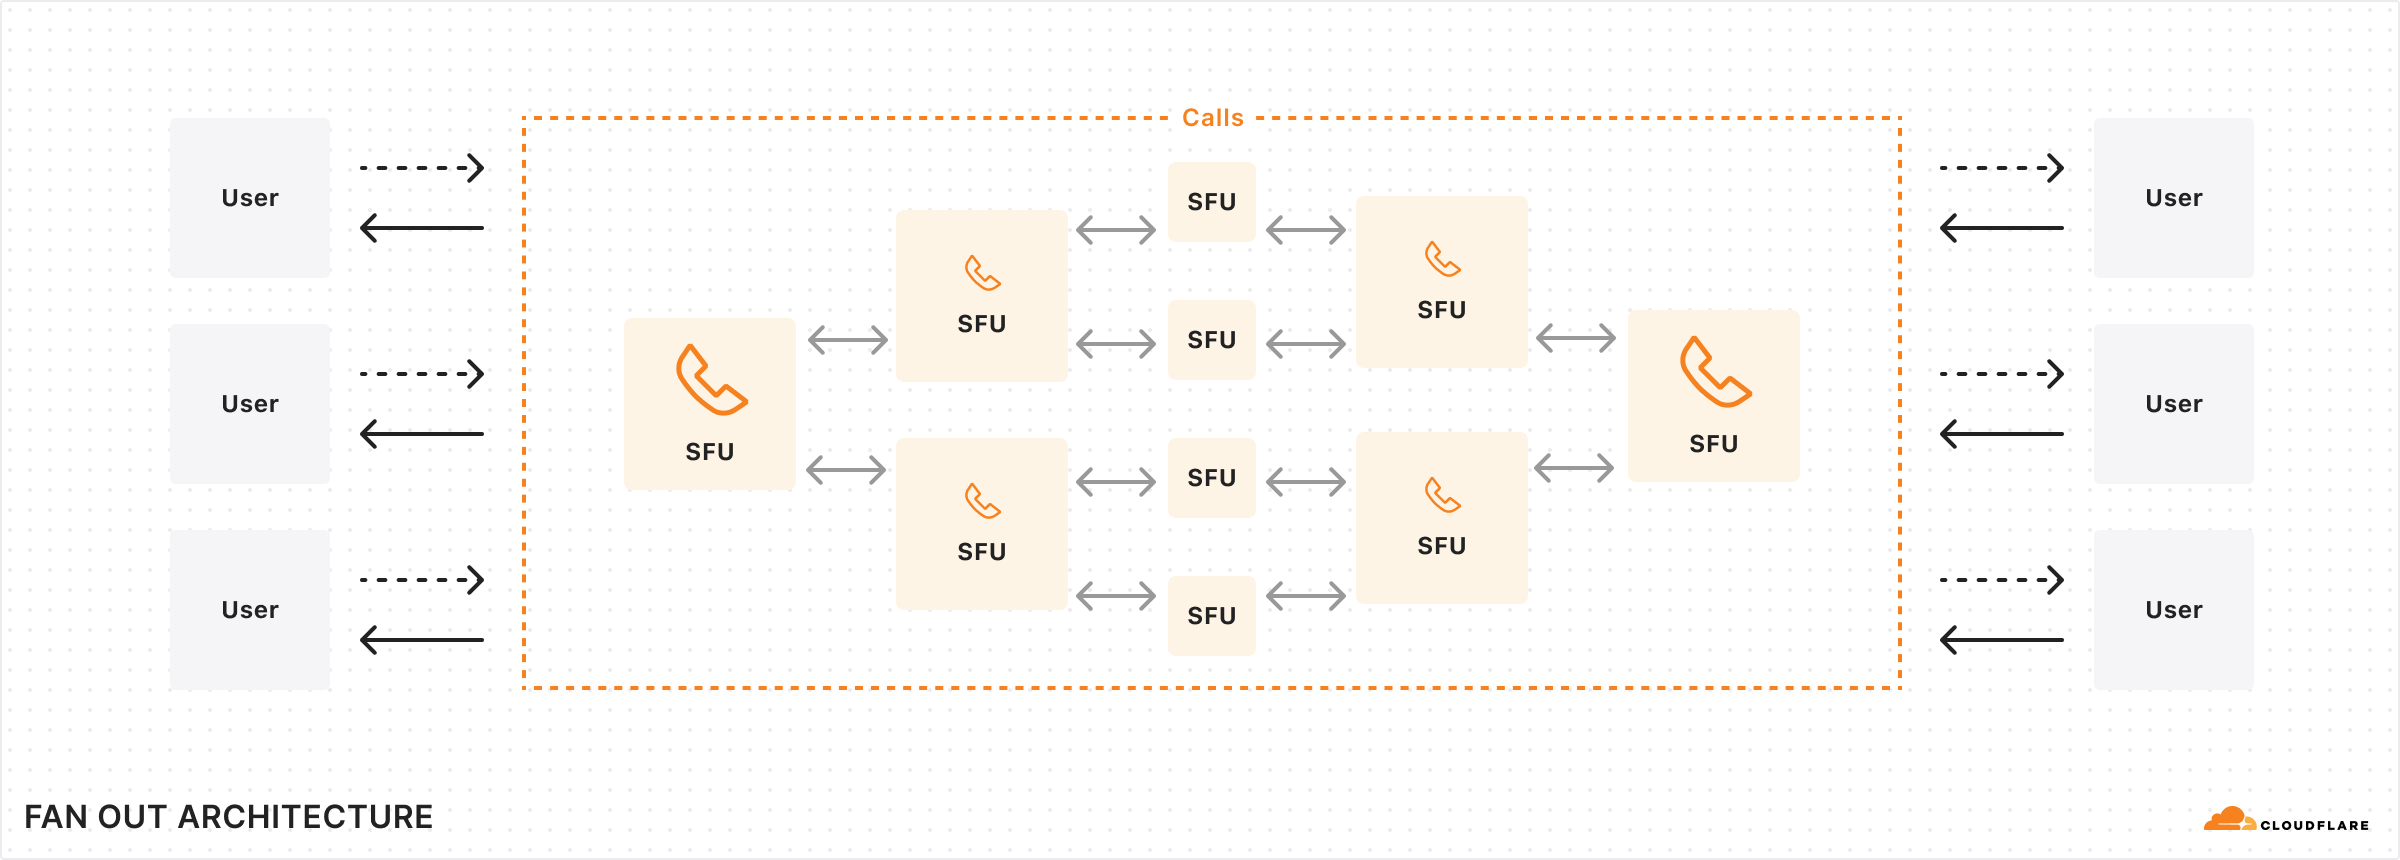
The following diagram illustrates the solution architecture.

The workflow consists of the following steps:

  1. Read a dataset of patients in Amazon Simple Storage Service (Amazon S3) directly from Amazon EMR using Spark.

The dataset is created as a generic S3 asset collection in Amazon DataZone.

  1. In Amazon EMR, perform data validation rules against the dataset.
  2. The metrics are saved in Amazon S3 to have a persistent output.
  3. Use Amazon DataZone APIs through Boto3 to push custom data quality metadata.
  4. End-users can see the data quality scores by navigating to the data portal.

Prerequisites

We use Amazon EMR Serverless and Pydeequ to run a fully managed Spark environment. To learn more about Pydeequ as a data testing framework, see Testing Data quality at scale with Pydeequ.

To allow Amazon EMR to send data to the Amazon DataZone domain, make sure that the IAM role used by Amazon EMR has the permissions to do the following:

  • Read from and write to the S3 buckets
  • Call the post_time_series_data_points action for Amazon DataZone:
    {
        "Version": "2012-10-17",
        "Statement": [
            {
                "Sid": "Statement1",
                "Effect": "Allow",
                "Action": [
                    "datazone:PostTimeSeriesDataPoints"
                ],
                "Resource": [
                    "<datazone_domain_arn>"
                ]
            }
        ]
    }

Make sure that you added the EMR role as a project member in the Amazon DataZone project. On the Amazon DataZone console, navigate to the Project members page and choose Add members.

Add the EMR role as a contributor.

Ingest and analyze PySpark code

In this section, we analyze the PySpark code that we use to perform data quality checks and send the results to Amazon DataZone. You can download the complete PySpark script.

To run the script entirely, you can submit a job to EMR Serverless. The service will take care of scheduling the job and automatically allocating the resources needed, enabling you to track the job run statuses throughout the process.

You can submit a job to EMR within the Amazon EMR console using EMR Studio or programmatically, using the AWS CLI or using one of the AWS SDKs.

In Apache Spark, a SparkSession is the entry point for interacting with DataFrames and Spark’s built-in functions. The script will start initializing a SparkSession:

with SparkSession.builder.appName("PatientsDataValidation") \
        .config("spark.jars.packages", pydeequ.deequ_maven_coord) \
        .config("spark.jars.excludes", pydeequ.f2j_maven_coord) \
        .getOrCreate() as spark:

We read a dataset from Amazon S3. For increased modularity, you can use the script input to refer to the S3 path:

s3inputFilepath = sys.argv[1]
s3outputLocation = sys.argv[2]

df = spark.read.format("csv") \
            .option("header", "true") \
            .option("inferSchema", "true") \
            .load(s3inputFilepath) #s3://<bucket_name>/patients/patients.csv

Next, we set up a metrics repository. This can be helpful to persist the run results in Amazon S3.

metricsRepository = FileSystemMetricsRepository(spark, s3_write_path)

Pydeequ allows you to create data quality rules using the builder pattern, which is a well-known software engineering design pattern, concatenating instruction to instantiate a VerificationSuite object:

key_tags = {'tag': 'patient_df'}
resultKey = ResultKey(spark, ResultKey.current_milli_time(), key_tags)

check = Check(spark, CheckLevel.Error, "Integrity checks")

checkResult = VerificationSuite(spark) \
    .onData(df) \
    .useRepository(metricsRepository) \
    .addCheck(
        check.hasSize(lambda x: x >= 1000) \
        .isComplete("birthdate")  \
        .isUnique("id")  \
        .isComplete("ssn") \
        .isComplete("first") \
        .isComplete("last") \
        .hasMin("healthcare_coverage", lambda x: x == 1000.0)) \
    .saveOrAppendResult(resultKey) \
    .run()

checkResult_df = VerificationResult.checkResultsAsDataFrame(spark, checkResult)
checkResult_df.show()

The following is the output for the data validation rules:

+----------------+-----------+------------+----------------------------------------------------+-----------------+----------------------------------------------------+
|check           |check_level|check_status|constraint                                          |constraint_status|constraint_message                                  |
+----------------+-----------+------------+----------------------------------------------------+-----------------+----------------------------------------------------+
|Integrity checks|Error      |Error       |SizeConstraint(Size(None))                          |Success          |                                                    |
|Integrity checks|Error      |Error       |CompletenessConstraint(Completeness(birthdate,None))|Success          |                                                    |
|Integrity checks|Error      |Error       |UniquenessConstraint(Uniqueness(List(id),None))     |Success          |                                                    |
|Integrity checks|Error      |Error       |CompletenessConstraint(Completeness(ssn,None))      |Success          |                                                    |
|Integrity checks|Error      |Error       |CompletenessConstraint(Completeness(first,None))    |Success          |                                                    |
|Integrity checks|Error      |Error       |CompletenessConstraint(Completeness(last,None))     |Success          |                                                    |
|Integrity checks|Error      |Error       |MinimumConstraint(Minimum(healthcare_coverage,None))|Failure          |Value: 0.0 does not meet the constraint requirement!|
+----------------+-----------+------------+----------------------------------------------------+-----------------+----------------------------------------------------+

At this point, we want to insert these data quality values in Amazon DataZone. To do so, we use the post_time_series_data_points function in the Boto3 Amazon DataZone client.

The PostTimeSeriesDataPoints DataZone API allows you to insert new time series data points for a given asset or listing, without creating a new revision.

At this point, you might also want to have more information on which fields are sent as input for the API. You can use the APIs to obtain the specification for Amazon DataZone form types; in our case, it’s amazon.datazone.DataQualityResultFormType.

You can also use the AWS CLI to invoke the API and display the form structure:

aws datazone get-form-type --domain-identifier <your_domain_id> --form-type-identifier amazon.datazone.DataQualityResultFormType --region <domain_region> --output text --query 'model.smithy'

This output helps identify the required API parameters, including fields and value limits:

$version: "2.0"
namespace amazon.datazone
structure DataQualityResultFormType {
    @amazon.datazone#timeSeriesSummary
    @range(min: 0, max: 100)
    passingPercentage: Double
    @amazon.datazone#timeSeriesSummary
    evaluationsCount: Integer
    evaluations: EvaluationResults
}
@length(min: 0, max: 2000)
list EvaluationResults {
    member: EvaluationResult
}

@length(min: 0, max: 20)
list ApplicableFields {
    member: String
}

@length(min: 0, max: 20)
list EvaluationTypes {
    member: String
}

enum EvaluationStatus {
    PASS,
    FAIL
}

string EvaluationDetailType

map EvaluationDetails {
    key: EvaluationDetailType
    value: String
}

structure EvaluationResult {
    description: String
    types: EvaluationTypes
    applicableFields: ApplicableFields
    status: EvaluationStatus
    details: EvaluationDetails
}

To send the appropriate form data, we need to convert the Pydeequ output to match the DataQualityResultsFormType contract. This can be achieved with a Python function that processes the results.

For each DataFrame row, we extract information from the constraint column. For example, take the following code:

CompletenessConstraint(Completeness(birthdate,None))

We convert it to the following:

{
  "constraint": "CompletenessConstraint",
  "statisticName": "Completeness_custom",
  "column": "birthdate"
}

Make sure to send an output that matches the KPIs that you want to track. In our case, we are appending _custom to the statistic name, resulting in the following format for KPIs:

  • Completeness_custom
  • Uniqueness_custom

In a real-world scenario, you might want to set a value that matches with your data quality framework in relation to the KPIs that you want to track in Amazon DataZone.

After applying a transformation function, we have a Python object for each rule evaluation:

..., {
   'applicableFields': ["healthcare_coverage"],
   'types': ["Minimum_custom"],
   'status': 'FAIL',
   'description': 'MinimumConstraint - Minimum - Value: 0.0 does not meet the constraint requirement!'
 },...

We also use the constraint_status column to compute the overall score:

(number of success / total number of evaluation) * 100

In our example, this results in a passing percentage of 85.71%.

We set this value in the passingPercentage input field along with the other information related to the evaluations in the input of the Boto3 method post_time_series_data_points:

import boto3

# Instantiate the client library to communicate with Amazon DataZone Service
#
datazone = boto3.client(
    service_name='datazone', 
    region_name=<Region(String) example: us-east-1>
)

# Perform the API operation to push the Data Quality information to Amazon DataZone
#
datazone.post_time_series_data_points(
    domainIdentifier=<DataZone domain ID>,
    entityIdentifier=<DataZone asset ID>,
    entityType='ASSET',
    forms=[
        {
            "content": json.dumps({
                    "evaluationsCount":<Number of evaluations (number)>,
                    "evaluations": [<List of objects {
                        'description': <Description (String)>,
                        'applicableFields': [<List of columns involved (String)>],
                        'types': [<List of KPIs (String)>],
                        'status': <FAIL/PASS (string)>
                        }>
                     ],
                    "passingPercentage":<Score (number)>
                }),
            "formName": <Form name(String) example: PydeequRuleSet1>,
            "typeIdentifier": "amazon.datazone.DataQualityResultFormType",
            "timestamp": <Date (timestamp)>
        }
    ]
)

Boto3 invokes the Amazon DataZone APIs. In these examples, we used Boto3 and Python, but you can choose one of the AWS SDKs developed in the language you prefer.

After setting the appropriate domain and asset ID and running the method, we can check on the Amazon DataZone console that the asset data quality is now visible on the asset page.

We can observe that the overall score matches with the API input value. We can also see that we were able to add customized KPIs on the overview tab through custom types parameter values.

With the new Amazon DataZone APIs, you can load data quality rules from third-party systems into a specific data asset. With this capability, Amazon DataZone allows you to extend the types of indicators present in AWS Glue Data Quality (such as completeness, minimum, and uniqueness) with custom indicators.

Clean up

We recommend deleting any potentially unused resources to avoid incurring unexpected costs. For example, you can delete the Amazon DataZone domain and the EMR application you created during this process.

Conclusion

In this post, we highlighted the latest features of Amazon DataZone for data quality, empowering end-users with enhanced context and visibility into their data assets. Furthermore, we delved into the seamless integration between Amazon DataZone and AWS Glue Data Quality. You can also use the Amazon DataZone APIs to integrate with external data quality providers, enabling you to maintain a comprehensive and robust data strategy within your AWS environment.

To learn more about Amazon DataZone, refer to the Amazon DataZone User Guide.


About the Authors


Andrea Filippo
is a Partner Solutions Architect at AWS supporting Public Sector partners and customers in Italy. He focuses on modern data architectures and helping customers accelerate their cloud journey with serverless technologies.

Emanuele is a Solutions Architect at AWS, based in Italy, after living and working for more than 5 years in Spain. He enjoys helping large companies with the adoption of cloud technologies, and his area of expertise is mainly focused on Data Analytics and Data Management. Outside of work, he enjoys traveling and collecting action figures.

Varsha Velagapudi is a Senior Technical Product Manager with Amazon DataZone at AWS. She focuses on improving data discovery and curation required for data analytics. She is passionate about simplifying customers’ AI/ML and analytics journey to help them succeed in their day-to-day tasks. Outside of work, she enjoys nature and outdoor activities, reading, and traveling.

Use Apache Iceberg in your data lake with Amazon S3, AWS Glue, and Snowflake

Post Syndicated from Andries Engelbrecht original https://aws.amazon.com/blogs/big-data/use-apache-iceberg-in-your-data-lake-with-amazon-s3-aws-glue-and-snowflake/

This is post is co-written with Andries Engelbrecht and Scott Teal from Snowflake.

Businesses are constantly evolving, and data leaders are challenged every day to meet new requirements. For many enterprises and large organizations, it is not feasible to have one processing engine or tool to deal with the various business requirements. They understand that a one-size-fits-all approach no longer works, and recognize the value in adopting scalable, flexible tools and open data formats to support interoperability in a modern data architecture to accelerate the delivery of new solutions.

Customers are using AWS and Snowflake to develop purpose-built data architectures that provide the performance required for modern analytics and artificial intelligence (AI) use cases. Implementing these solutions requires data sharing between purpose-built data stores. This is why Snowflake and AWS are delivering enhanced support for Apache Iceberg to enable and facilitate data interoperability between data services.

Apache Iceberg is an open-source table format that provides reliability, simplicity, and high performance for large datasets with transactional integrity between various processing engines. In this post, we discuss the following:

  • Advantages of Iceberg tables for data lakes
  • Two architectural patterns for sharing Iceberg tables between AWS and Snowflake:
    • Manage your Iceberg tables with AWS Glue Data Catalog
    • Manage your Iceberg tables with Snowflake
  • The process of converting existing data lakes tables to Iceberg tables without copying the data

Now that you have a high-level understanding of the topics, let’s dive into each of them in detail.

Advantages of Apache Iceberg

Apache Iceberg is a distributed, community-driven, Apache 2.0-licensed, 100% open-source data table format that helps simplify data processing on large datasets stored in data lakes. Data engineers use Apache Iceberg because it’s fast, efficient, and reliable at any scale and keeps records of how datasets change over time. Apache Iceberg offers integrations with popular data processing frameworks such as Apache Spark, Apache Flink, Apache Hive, Presto, and more.

Iceberg tables maintain metadata to abstract large collections of files, providing data management features including time travel, rollback, data compaction, and full schema evolution, reducing management overhead. Originally developed at Netflix before being open sourced to the Apache Software Foundation, Apache Iceberg was a blank-slate design to solve common data lake challenges like user experience, reliability, and performance, and is now supported by a robust community of developers focused on continually improving and adding new features to the project, serving real user needs and providing them with optionality.

Transactional data lakes built on AWS and Snowflake

Snowflake provides various integrations for Iceberg tables with multiple storage options, including Amazon S3, and multiple catalog options, including AWS Glue Data Catalog and Snowflake. AWS provides integrations for various AWS services with Iceberg tables as well, including AWS Glue Data Catalog for tracking table metadata. Combining Snowflake and AWS gives you multiple options to build out a transactional data lake for analytical and other use cases such as data sharing and collaboration. By adding a metadata layer to data lakes, you get a better user experience, simplified management, and improved performance and reliability on very large datasets.

Manage your Iceberg table with AWS Glue

You can use AWS Glue to ingest, catalog, transform, and manage the data on Amazon Simple Storage Service (Amazon S3). AWS Glue is a serverless data integration service that allows you to visually create, run, and monitor extract, transform, and load (ETL) pipelines to load data into your data lakes in Iceberg format. With AWS Glue, you can discover and connect to more than 70 diverse data sources and manage your data in a centralized data catalog. Snowflake integrates with AWS Glue Data Catalog to access the Iceberg table catalog and the files on Amazon S3 for analytical queries. This greatly improves performance and compute cost in comparison to external tables on Snowflake, because the additional metadata improves pruning in query plans.

You can use this same integration to take advantage of the data sharing and collaboration capabilities in Snowflake. This can be very powerful if you have data in Amazon S3 and need to enable Snowflake data sharing with other business units, partners, suppliers, or customers.

The following architecture diagram provides a high-level overview of this pattern.

The workflow includes the following steps:

  1. AWS Glue extracts data from applications, databases, and streaming sources. AWS Glue then transforms it and loads it into the data lake in Amazon S3 in Iceberg table format, while inserting and updating the metadata about the Iceberg table in AWS Glue Data Catalog.
  2. The AWS Glue crawler generates and updates Iceberg table metadata and stores it in AWS Glue Data Catalog for existing Iceberg tables on an S3 data lake.
  3. Snowflake integrates with AWS Glue Data Catalog to retrieve the snapshot location.
  4. In the event of a query, Snowflake uses the snapshot location from AWS Glue Data Catalog to read Iceberg table data in Amazon S3.
  5. Snowflake can query across Iceberg and Snowflake table formats. You can share data for collaboration with one or more accounts in the same Snowflake region. You can also use data in Snowflake for visualization using Amazon QuickSight, or use it for machine learning (ML) and artificial intelligence (AI) purposes with Amazon SageMaker.

Manage your Iceberg table with Snowflake

A second pattern also provides interoperability across AWS and Snowflake, but implements data engineering pipelines for ingestion and transformation to Snowflake. In this pattern, data is loaded to Iceberg tables by Snowflake through integrations with AWS services like AWS Glue or through other sources like Snowpipe. Snowflake then writes data directly to Amazon S3 in Iceberg format for downstream access by Snowflake and various AWS services, and Snowflake manages the Iceberg catalog that tracks snapshot locations across tables for AWS services to access.

Like the previous pattern, you can use Snowflake-managed Iceberg tables with Snowflake data sharing, but you can also use S3 to share datasets in cases where one party does not have access to Snowflake.

The following architecture diagram provides an overview of this pattern with Snowflake-managed Iceberg tables.

This workflow consists of the following steps:

  1. In addition to loading data via the COPY command, Snowpipe, and the native Snowflake connector for AWS Glue, you can integrate data via the Snowflake Data Sharing.
  2. Snowflake writes Iceberg tables to Amazon S3 and updates metadata automatically with every transaction.
  3. Iceberg tables in Amazon S3 are queried by Snowflake for analytical and ML workloads using services like QuickSight and SageMaker.
  4. Apache Spark services on AWS can access snapshot locations from Snowflake via a Snowflake Iceberg Catalog SDK and directly scan the Iceberg table files in Amazon S3.

Comparing solutions

These two patterns highlight options available to data personas today to maximize their data interoperability between Snowflake and AWS using Apache Iceberg. But which pattern is ideal for your use case? If you’re already using AWS Glue Data Catalog and only require Snowflake for read queries, then the first pattern can integrate Snowflake with AWS Glue and Amazon S3 to query Iceberg tables. If you’re not already using AWS Glue Data Catalog and require Snowflake to perform reads and writes, then the second pattern is likely a good solution that allows for storing and accessing data from AWS.

Considering that reads and writes will probably operate on a per-table basis rather than the entire data architecture, it is advisable to use a combination of both patterns.

Migrate existing data lakes to a transactional data lake using Apache Iceberg

You can convert existing Parquet, ORC, and Avro-based data lake tables on Amazon S3 to Iceberg format to reap the benefits of transactional integrity while improving performance and user experience. There are several Iceberg table migration options (SNAPSHOT, MIGRATE, and ADD_FILES) for migrating existing data lake tables in-place to Iceberg format, which is preferable to rewriting all of the underlying data files—a costly and time-consuming effort with large datasets. In this section, we focus on ADD_FILES, because it’s useful for custom migrations.

For ADD_FILES options, you can use AWS Glue to generate Iceberg metadata and statistics for an existing data lake table and create new Iceberg tables in AWS Glue Data Catalog for future use without needing to rewrite the underlying data. For instructions on generating Iceberg metadata and statistics using AWS Glue, refer to Migrate an existing data lake to a transactional data lake using Apache Iceberg or Convert existing Amazon S3 data lake tables to Snowflake Unmanaged Iceberg tables using AWS Glue.

This option requires that you pause data pipelines while converting the files to Iceberg tables, which is a straightforward process in AWS Glue because the destination just needs to be changed to an Iceberg table.

Conclusion

In this post, you saw the two architecture patterns for implementing Apache Iceberg in a data lake for better interoperability across AWS and Snowflake. We also provided guidance on migrating existing data lake tables to Iceberg format.

Sign up for AWS Dev Day on April 10 to get hands-on not only with Apache Iceberg, but also with streaming data pipelines with Amazon Data Firehose and Snowpipe Streaming, and generative AI applications with Streamlit in Snowflake and Amazon Bedrock.


About the Authors

Andries Engelbrecht is a Principal Partner Solutions Architect at Snowflake and works with strategic partners. He is actively engaged with strategic partners like AWS supporting product and service integrations as well as the development of joint solutions with partners. Andries has over 20 years of experience in the field of data and analytics.

Deenbandhu Prasad is a Senior Analytics Specialist at AWS, specializing in big data services. He is passionate about helping customers build modern data architectures on the AWS Cloud. He has helped customers of all sizes implement data management, data warehouse, and data lake solutions.

Brian Dolan joined Amazon as a Military Relations Manager in 2012 after his first career as a Naval Aviator. In 2014, Brian joined Amazon Web Services, where he helped Canadian customers from startups to enterprises explore the AWS Cloud. Most recently, Brian was a member of the Non-Relational Business Development team as a Go-To-Market Specialist for Amazon DynamoDB and Amazon Keyspaces before joining the Analytics Worldwide Specialist Organization in 2022 as a Go-To-Market Specialist for AWS Glue.

Nidhi Gupta is a Sr. Partner Solution Architect at AWS. She spends her days working with customers and partners, solving architectural challenges. She is passionate about data integration and orchestration, serverless and big data processing, and machine learning. Nidhi has extensive experience leading the architecture design and production release and deployments for data workloads.

Scott Teal is a Product Marketing Lead at Snowflake and focuses on data lakes, storage, and governance.

AlmaLinux OS – CVE-2024-1086 and XZ (AlmaLinux blog)

Post Syndicated from jzb original https://lwn.net/Articles/968299/

AlmaLinux has announced
updated kernels for AlmaLinux 8 and 9 to address CVE-2024-1086, a
use-after-free vulnerability in the kernel that could be exploited to
gain local privilege escalation. This is notable because the fix
marks a divergence between AlmaLinux and Red Hat Enterprise Linux (RHEL):

In January of this year, a kernel flaw was disclosed and named CVE-2024-1086.
This flaw is trivially exploitable on most RHEL-equivalent
systems. There are many proof-of-concept posts available now,
including one from our Infrastructure team lead, Jonathan Wright (Dealing
with CVE-2024-1086
). In multi-user scenarios, this flaw is
especially problematic.

Though this was flagged as something to be fixed in Red Hat
Enterprise Linux, Red Hat has only rated this as a moderate
impact
.

The AlmaLinux project would also like to note that it is not
impacted by the XZ backdoor. “Because enterprise Linux takes a bit
longer to adopt those updates (sometimes to the chagrin of our users),
the version of XZ that had the back door inserted hadn’t made it
further than Fedora in our ecosystem.

Malcolm: Improvements to static analysis in the GCC 14 compiler

Post Syndicated from corbet original https://lwn.net/Articles/968297/

David Malcolm writes
about some static-analyzer features
that are coming in the GCC 14
release.

Solving the halting problem?

Obviously I’m kidding with the title here, but for GCC 14 I’ve
implemented a new warning: -Wanalyzer-infinite-loop that’s able to
detect some simple cases of infinite loops.

See also: this report from the 2023 GNU
Tools Cauldron.

Simplify your query management with search templates in Amazon OpenSearch Service

Post Syndicated from Arun Lakshmanan original https://aws.amazon.com/blogs/big-data/simplify-your-query-management-with-search-templates-in-amazon-opensearch-service/

Amazon OpenSearch Service is an Apache-2.0-licensed distributed search and analytics suite offered by AWS. This fully managed service allows organizations to secure data, perform keyword and semantic search, analyze logs, alert on anomalies, explore interactive log analytics, implement real-time application monitoring, and gain a more profound understanding of their information landscape. OpenSearch Service provides the tools and resources needed to unlock the full potential of your data. With its scalability, reliability, and ease of use, it’s a valuable solution for businesses seeking to optimize their data-driven decision-making processes and improve overall operational efficiency.

This post delves into the transformative world of search templates. We unravel the power of search templates in revolutionizing the way you handle queries, providing a comprehensive guide to help you navigate through the intricacies of this innovative solution. From optimizing search processes to saving time and reducing complexities, discover how incorporating search templates can elevate your query management game.

Search templates

Search templates empower developers to articulate intricate queries within OpenSearch, enabling their reuse across various application scenarios, eliminating the complexity of query generation in the code. This flexibility also grants you the ability to modify your queries without requiring application recompilation. Search templates in OpenSearch use the mustache template, which is a logic-free templating language. Search templates can be reused by their name. A search template that is based on mustache has a query structure and placeholders for the variable values. You use the _search API to query, specifying the actual values that OpenSearch should use. You can create placeholders for variables that will be changed to their true values at runtime. Double curly braces ({{}}) serve as placeholders in templates.

Mustache enables you to generate dynamic filters or queries based on the values passed in the search request, making your search requests more flexible and powerful.

In the following example, the search template runs the query in the “source” block by passing in the values for the field and value parameters from the “params” block:

GET /myindex/_search/template
 { 
      "source": {   
         "query": { 
             "bool": {
               "must": [
                 {
                   "match": {
                    "{{field}}": "{{value}}"
                 }
             }
        ]
     }
    }
  },
 "params": {
    "field": "place",
    "value": "sweethome"
  }
}

You can store templates in the cluster with a name and refer to them in a search instead of attaching the template in each request. You use the PUT _scripts API to publish a template to the cluster. Let’s say you have an index of books, and you want to search for books with publication date, ratings, and price. You could create and publish a search template as follows:

PUT /_scripts/find_book
{
  "script": {
    "lang": "mustache",
    "source": {
      "query": {
        "bool": {
          "must": [
            {
              "range": {
                "publish_date": {
                  "gte": "{{gte_date}}"
                }
              }
            },
            {
              "range": {
                "rating": {
                  "gte": "{{gte_rating}}"
                }
              }
            },
            {
              "range": {
                "price": {
                  "lte": "{{lte_price}}"
                }
              }
            }
          ]
        }
      }
    }
  }
}

In this example, you define a search template called find_book that uses the mustache template language with defined placeholders for the gte_date, gte_rating, and lte_price parameters.

To use the search template stored in the cluster, you can send a request to OpenSearch with the appropriate parameters. For example, you can search for products that have been published in the last year with ratings greater than 4.0, and priced less than $20:

POST /books/_search/template
{
  "id": "find_book",
  "params": {
    "gte_date": "now-1y",
    "gte_rating": 4.0,
    "lte_price": 20
  }
}

This query will return all books that have been published in the last year, with a rating of at least 4.0, and a price less than $20 from the books index.

Default values in search templates

Default values are values that are used for search parameters when the query that engages the template doesn’t specify values for them. In the context of the find_book example, you can set default values for the from, size, and gte_date parameters in case they are not provided in the search request. To set default values, you can use the following mustache template:

PUT /_scripts/find_book
{
  "script": {
    "lang": "mustache",
    "source": {
      "query": {
        "bool": {
          "filter": [
            {
              "range": {
                "publish_date": {
                  "gte": "{{gte_date}}{{^gte_date}}now-1y{{/gte_date}}"
                }
              }
            },
            {
              "range": {
                "rating": {
                  "gte": "{{gte_rating}}"
                }
              }
            },
            {
              "range": {
                "price": {
                  "lte": "{{lte_price}}"
                }
              }
            }
          ]
        },
        "from": "{{from}}{{^from}}0{{/from}}",
        "size": "{{size}}{{^size}}2{{/size}}"
      }
    }
  }
}

In this template, the {{from}}, {{size}}, and {{gte_date}} parameters are placeholders that can be filled in with specific values when the template is used in a search. If no value is specified for {{from}}, {{size}}, and {{gte_date}}, OpenSearch uses the default values of 0, 2, and now-1y, respectively. This means that if a user searches for products without specifying from, size, and gte_date, the search will return just two products matching the search criteria for 1 year.

You can also use the render API as follows if you have a stored template and want to validate it:

POST _render/template
{
  "id": "find_book",
  "params": {
    "gte_date": "now-1y",
    "gte_rating": 4.0,
    "lte_price": 20
  }
}

Conditions in search templates

The conditional statement that allows you to control the flow of your search template based on certain conditions. It’s often used to include or exclude certain parts of the search request based on certain parameters. The syntax as follows:

{{#Any condition}}
  ... code to execute if the condition is true ...
{{/Any}}

The following example searches for books based on the gte_date, gte_rating, and lte_price parameters and an optional stock parameter. The if condition is used to include the condition_block/term query only if the stock parameter is present in the search request. If the is_available parameter is not present, the condition_block/term query will be skipped.

GET /books/_search/template
{
  "source": """{
    "query": {
      "bool": {
        "must": [
        {{#is_available}}
        {
          "term": {
            "in_stock": "{{is_available}}"
          }
        },
        {{/is_available}}
          {
            "range": {
              "publish_date": {
                "gte": "{{gte_date}}"
              }
            }
          },
          {
            "range": {
              "rating": {
                "gte": "{{gte_rating}}"
              }
            }
          },
          {
            "range": {
              "price": {
                "lte": "{{lte_price}}"
              }
            }
          }
        ]
      }
    }
  }""",
  "params": {
    "gte_date": "now-3y",
    "gte_rating": 4.0,
    "lte_price": 20,
    "is_available": true
  }
}

By using a conditional statement in this way, you can make your search requests more flexible and efficient by only including the necessary filters when they are needed.

To make the query valid inside the JSON, it needs to be escaped with triple quotes (""") in the payload.

Loops in search templates

A loop is a feature of mustache templates that allows you to iterate over an array of values and run the same code block for each item in the array. It’s often used to generate a dynamic list of filters or queries based on the values passed in the search request. The syntax is as follows:

{{#list item in array}}
  ... code to execute for each item ...
{{/list}}

The following example searches for books based on a query string ({{query}}) and an array of categories to filter the search results. The mustache loop is used to generate a match filter for each item in the categories array.

GET books/_search/template
{
  "source": """{
    "query": {
      "bool": {
        "must": [
        {{#list}}
        {
          "match": {
            "category": "{{list}}"
          }
        }
        {{/list}}
          {
          "match": {
            "title": "{{name}}"
          }
        }
        ]
      }
    }
  }""",
  "params": {
    "name": "killer",
    "list": ["Classics", "comics", "Horror"]
  }
}

The search request is rendered as follows:

{
  "query": {
    "bool": {
      "must": [
        {
          "match": {
            "title": "killer"
          }
        },
        {
          "match": {
            "category": "Classics"
          }
        },
        {
          "match": {
            "category": "comics"
          }
        },
        {
          "match": {
            "category": "Horror"
          }
        }
      ]
    }
  }
}

The loop has generated a match filter for each item in the categories array, resulting in a more flexible and efficient search request that filters by multiple categories. By using the loops, you can generate dynamic filters or queries based on the values passed in the search request, making your search requests more flexible and powerful.

Advantages of using search templates

The following are key advantages of using search templates:

  • Maintainability – By separating the query definition from the application code, search templates make it straightforward to manage changes to the query or tune search relevancy. You don’t have to compile and redeploy your application.
  • Consistency – You can construct search templates that allow you to design standardized query patterns and reuse them throughout your application, which can help maintain consistency across your queries.
  • Readability – Because templates can be constructed using a more terse and expressive syntax, complicated queries are straightforward to test and debug.
  • Testing – Search templates can be tested and debugged independently of the application code, facilitating simpler problem-solving and relevancy tuning without having to re-deploy the application. You can easily create A/B testing with different templates for the same search.
  • Flexibility – Search templates can be quickly updated or adjusted to account for modifications to the data or search specifications.

Best practices

Consider the following best practices when using search templates:

  •  Before deploying your template to production, make sure it is fully tested. You can test the effectiveness and correctness of your template with example data. It is highly recommended to run the application tests that use these templates before publishing.
  • Search templates allow for the addition of input parameters, which you can use to modify the query to suit the needs of a particular use case. Reusing the same template with varied inputs is made simpler by parameterizing the inputs.
  • Manage the templates in an external source control system.
  • Avoid hard-coding values inside the query—instead, use defaults.

Conclusion

In this post, you learned the basics of search templates, a powerful feature of OpenSearch, and how templates help streamline search queries and improve performance. With search templates, you can build more robust search applications in less time.

If you have feedback about this post, submit it in the comments section. If you have questions about this post, start a new thread on the Amazon OpenSearch Service forum or contact AWS Support.

Stay tuned for more exciting updates and new features in OpenSearch Service.


About the authors

Arun Lakshmanan is a Search Specialist with Amazon OpenSearch Service based out of Chicago, IL. He has over 20 years of experience working with enterprise customers and startups. He loves to travel and spend quality time with his family.

Madhan Kumar Baskaran works as a Search Engineer at AWS, specializing in Amazon OpenSearch Service. His primary focus involves assisting customers in constructing scalable search applications and analytics solutions. Based in Bengaluru, India, Madhan has a keen interest in data engineering and DevOps.

[$] A memory model for Rust code in the kernel

Post Syndicated from corbet original https://lwn.net/Articles/967049/

The Rust programming language differs from C in many ways; those
differences tend to be what users admire in the language. But those
differences can also lead to an impedance mismatch when Rust code is
integrated into a C-dominated system, and it can be even worse in the
kernel, which is not a typical C program. Memory models are a case in
point. A programming language’s view of memory is sufficiently fundamental
and arcane that many developers never have to learn much about it. It is
hard to maintain that sort of blissful ignorance while working in the
kernel, though, so a recent discussion of how to choose a memory model for
kernel code in Rust is of interest.

The collective thoughts of the interwebz