Post Syndicated from Talks at Google original https://www.youtube.com/watch?v=ogIn1l7JXd0
To-Do Lists and much more
Post Syndicated from BeardedTinker original https://www.youtube.com/watch?v=7GAQxomFQ5k
Peeking into the crystal ball: What 2023 cyber threats told us about 2024
Post Syndicated from sabeen malik original https://blog.rapid7.com/2023/12/12/peeking-into-the-crystal-ball-what-2023-cyber-threats-told-us-about-2024/

Stepping into 2024 feels like opening the latest best-selling mystery novel – you know there’s adventure ahead, but the plot is still up in the air.
In the twist-riddled world of cybersecurity, we can’t help but ask, What’s next on the digital horizon? Sure, every business would like 2024 to be “less surprising” in terms of cyber threats, but let’s be honest, that’s not going to happen.
Even though we’re surely in for more than a few surprises in the coming year, there are ways we can be better prepared. So sit back and relax as we venture through some insights we’ve gained in 2023 and offer ways you can put them into practice in the coming year.
Prediction 1: Ransomware actors burning through zero-days
RDP (remote desktop protocol) has long been the initial entry vector of choice for ransomware groups, closely followed by the less-so sophisticated email. However the MOVEit and SysAid campaigns show change is brewing.
Rapid7 has observed an increasing number of zero-day vulnerabilities being exploited by ransomware groups, and it’s unlikely this trend will abate. Forget the mindset that ransomware actors just go after “the low hanging fruit”; they are now exploiting zero-day vulnerabilities at mass scale.
This trend is seeing criminal groups that to date have not demonstrated any real capable skills in gaining access to previously unidentified vulnerabilities, exploit them and gain a foothold into victim networks. This demonstrates that potentially something is afoot in the ransomware ecosystem. For organizations, the message is simple: get your vulnerability management and patching procedures in place and do it now. Being proactive when it comes to dealing with vulnerabilities that are being exploited in the wild is imperative.
Prediction 2: Cyber Risk and Vulnerability disclosures will lead to consolidation around better risk management practices.
With the growing number of regulatory disclosures for cyber risk management practices and incidents, the emergence of GenAI as a potent tool for cyber attacks, more ransomware hijacks, and the lack of common lexicon around cyber risk, businesses are truly going to have to spend more time than ever determining their risk profile, and subsequently thinking about the tools and services that they will need to address the risks.
This means that more leaders will be deciding between whether to deal with compliance risk mitigation and/or creating agile cyber risk management strategies. The leaders that understand this moment as a rallying call to uplevel the conversation about systemic risks will set their business up for success by not getting sidetracked by playing compliance whack-a-mole, but by investing in a strategic vision for dealing with cyber business risks. Those businesses will also be able to withstand the scrutiny related to more global requirements for disclosure of both cyber risk management and cyber incident response and procedures. More disclosure may not necessarily lead to clarity in the short term on what are best practices, but over the long term we will see more consolidation on best practices on cyber disclosures and risk management practices.
At the same time, governments will also be struggling to find the right balance on how to incentivize risk management rather than compliance risk mitigation whack-a-mole if they continue to introduce regulations that are not driven by harmonization around best practices and product security instead of first to market on regulations.
Here’s the catch: as regulations become more comprehensive, they may inadvertently nudge the industry towards a more consolidated structure – a double edged sword.
Prediction 3: Growth of real-time information sharing within global public-private cyber partnerships
The regulatory dance floor will definitely become more crowded in 2024, especially with AI cutting in.
This new dance partner will be adding to the complexity of tools needed to deal with cyber risk mitigation and will lead to more robust and global public-private partnerships. We might see something like a global cybersecurity flash mob in 2024. Instead of just sharing the usual threat intelligence of cyber threats and cyber risks, governments and businesses will join hands to share threat intel, resources and bolster defenses in concentrated ways to deal with specific threats. Ultimately, moving beyond the historical PPP’s of quarterly meetings, to a more real-time sharing approach in order to deal with the diminishing timelines between initial entry vectors to final stage payloads.
It will be interesting to see if more action oriented partnerships bolster capacity and cyber defenses. In order for such an approach to be successful, a mentality of “information sharing” and an open door of communication must be developed.
Prediction 4: Cloudy with a chance of threats
The cloud will continue to be a critical cyber battleground. And in the coming year, an emerging concern will likely be the misuse of commercial cloud service providers (CSPs). That’s because cybercriminals are no longer relying on known command-and-control servers; instead, they’re turning to commercial CSPs for cover to host malicious content.
It’s a clever trend, and it comes back to the game of hide-and-seek, with attackers exploiting the cloud’s anonymity and legitimacy, and blending their activities with legitimate services. Combatting this threat requires more innovative solutions, such as those leveraging AI and advanced automation techniques — as well as heightened vigilance — in the cloud. Organizations need advanced risk scoring across cloud environments, so security teams get complete visibility that eliminates blind spots and enables them to effectively prioritize remediation actions.
Prediction 5: AI and automation will be table stakes
As mentioned in prediction 4, innovations in AI and automation promise to effectively address an ever-increasing volume of attacks. Seeing threat intelligence is one thing, but it’s a completely different ball game to be doing something about it. This is where more automated responses come into play. With AI coming and more advanced automation techniques, the majority of detection and remediation or prevention work will occur automatically.
But, let’s not get ahead of ourselves. The inevitable rush to market for some solutions means that some AI capabilities will miss the mark. Therefore, organizations that adopt AI solutions must ensure that they truly improve cyber resilience without presenting new cyber risks.
Over the next year, a growing AI use case will be the use of AI synthetic media (i.e., deep fakes) and identity management. Governments will have the challenge of navigating the tricky space between the problematic use case of biometric technology and synthetic media, while businesses will have to understand how to manage the risks with identity and access management.
Be ready for 2024
So, there’s our bird’s eye view of what the cyber landscape could look like in 2024. But as always, there will be many shifts, evolutions, and transformations in the new year, some unprecedented and some expected. Regardless, practitioners must stay on their toes, remain vigilant, and aim for resilience. Here’s to a more prepared, secure — and less stressful — 2024.
For more thoughts from our team on what 2024 could bring, watch the Top Cybersecurity Predictions webinar on-demand.
Security updates for Tuesday
Post Syndicated from corbet original https://lwn.net/Articles/954706/
Security updates have been issued by Debian (libreoffice and webkit2gtk), Fedora (java-1.8.0-openjdk and seamonkey), Oracle (apr, edk2, kernel, and squid:4), Red Hat (postgresql:12, tracker-miners, and webkit2gtk3), SUSE (curl, go1.20, go1.21, hplip, openvswitch, opera, squid, and xerces-c), and Ubuntu (binutils, ghostscript, libreoffice, linux, linux-aws, linux-aws-5.15, linux-azure, linux-azure-5.15,
linux-azure-fde, linux-azure-fde-5.15, linux-gcp, linux-gke,
linux-hwe-5.15, linux-ibm, linux-ibm-5.15, linux-kvm, linux-nvidia,
linux-oracle, linux-oracle-5.15, linux-raspi, linux, linux-aws, linux-aws-5.4, linux-azure, linux-azure-5.4,
linux-bluefield, linux-gcp, linux-gcp-5.4, linux-hwe-5.4, linux-ibm,
linux-ibm-5.4, linux-kvm, linux-xilinx-zynqmp, postfixadmin, python3.11, and webkit2gtk).
From Google to Generative AI: Ranking top Internet services in 2023
Post Syndicated from João Tomé original http://blog.cloudflare.com/radar-2023-year-in-review-internet-services/

Ask nearly any Internet user, and they are bound to have their own personal list of favorite sites, applications, and Internet services for news, messaging, video, AI chatbots, music, and more. Sum that question up across a lot of users in a lot of different countries, and you end up with a sense of the most popular websites and services in the world. In a nutshell, that’s what this blog post is about: how humans interacted with the online world in 2023 from what Cloudflare observed.
Building on similar reports we’ve done over the past two years, we have compiled a ranking of the top Internet properties of 2023. In addition to our overall ranking, we chose 9 categories to focus on. One of these is a new addition in 2023: Generative AI. Here are the 9 categories we’ll be digging into:
1. Generative AI
2. Social Media
3. E-commerce
4. Video Streaming
5. News
6. Messaging
7. Metaverse & Gaming
8. Financial Services
9. Cryptocurrency Services
Our method for calculating the results is the same as in 2022: we analyze anonymized DNS query data from our 1.1.1.1 public DNS resolver, used by millions of people around the world. To build the lists of Internet services, we use two additional methods. First, we aggregate domains that belong to one online service. For instance, for Twitter/X, we include twitter.com, t.co, and x.com among others. Second, we reference our large source list of domains and identify the sites that provide services to humans. That means that our rankings do not include every domain seen in the data (for example, we exclude domains such as root-servers.net and cloudflare-dns.com). A site’s overall ranking is relative to other sites that meet these criteria; its rank within a category is relative to other sites in the same category. That’s important to note: just because a site has gone down in the rankings, it doesn’t necessarily mean its traffic has declined — it could just be that other sites’ traffic increased. Similarly, the inverse is true. What we’re doing here isn’t tracking absolute traffic, but rather, relative popularity.
With that, we can begin our analysis. Following the success of OpenAI’s ChatGPT launch on November 30, 2022, Generative AI has captivated both the world and the news. OpenAI is now close to ranking among our top 100 most popular Internet services overall, rising from #200 in January.
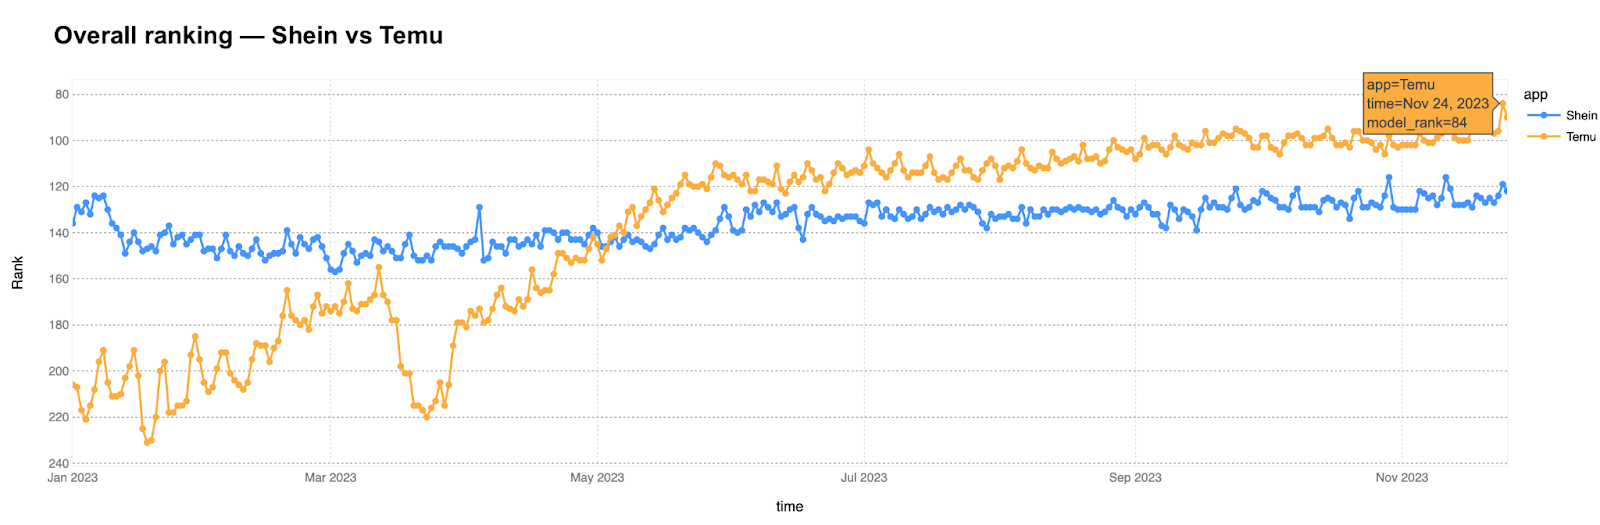
In e-commerce, low price and fast fashion marketplace Temu experienced similar growth, becoming the year’s surprise by surpassing Shein and other major players, reaching #7 in its category. And Black Friday was the best day for several other e-commerce services, as well as payment services such as PayPal, Stripe and Klarna.
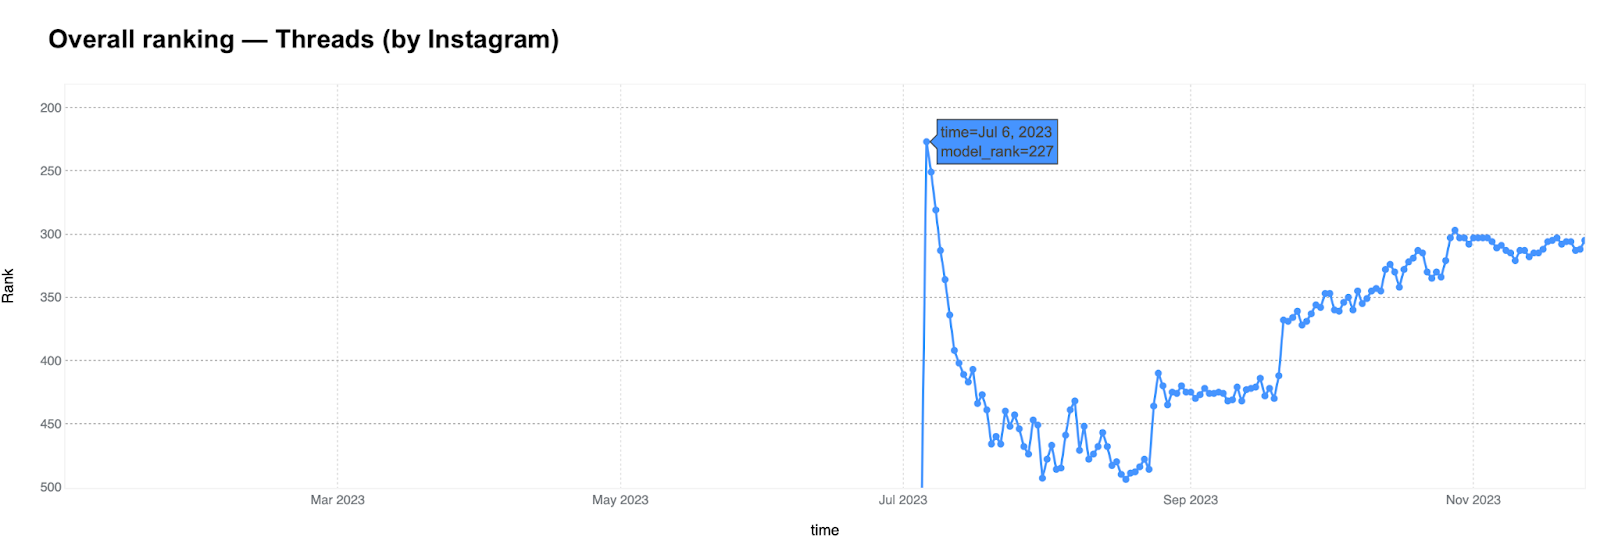
In social media, X/Twitter lost some ground in our Overall ranking, but maintained its status as a significant online discussion platform. New additions like Threads by Instagram, launched in July, are still gaining their footing in the category. Additionally, we observed notable news-related trends linked to events such as the March 2023 United States banking crisis, the Titan submersible implosion, the Wagner Group rebellion, and the October 7 Hamas attack on Israel.
We close our report out with a discussion of a range of trends that don’t fit neatly into our other categories, including a look at Taylor Swift’s and Beyoncé websites — both of which appeared in our overall traffic rankings.
Keep reading for a detailed look at the evolution of trends throughout the year. For more, visit our 2023 Cloudflare Radar Year in Review microsite. Along with the lists of most popular Internet services, the Year in Review site and its associated blog post explore a number of additional metrics.
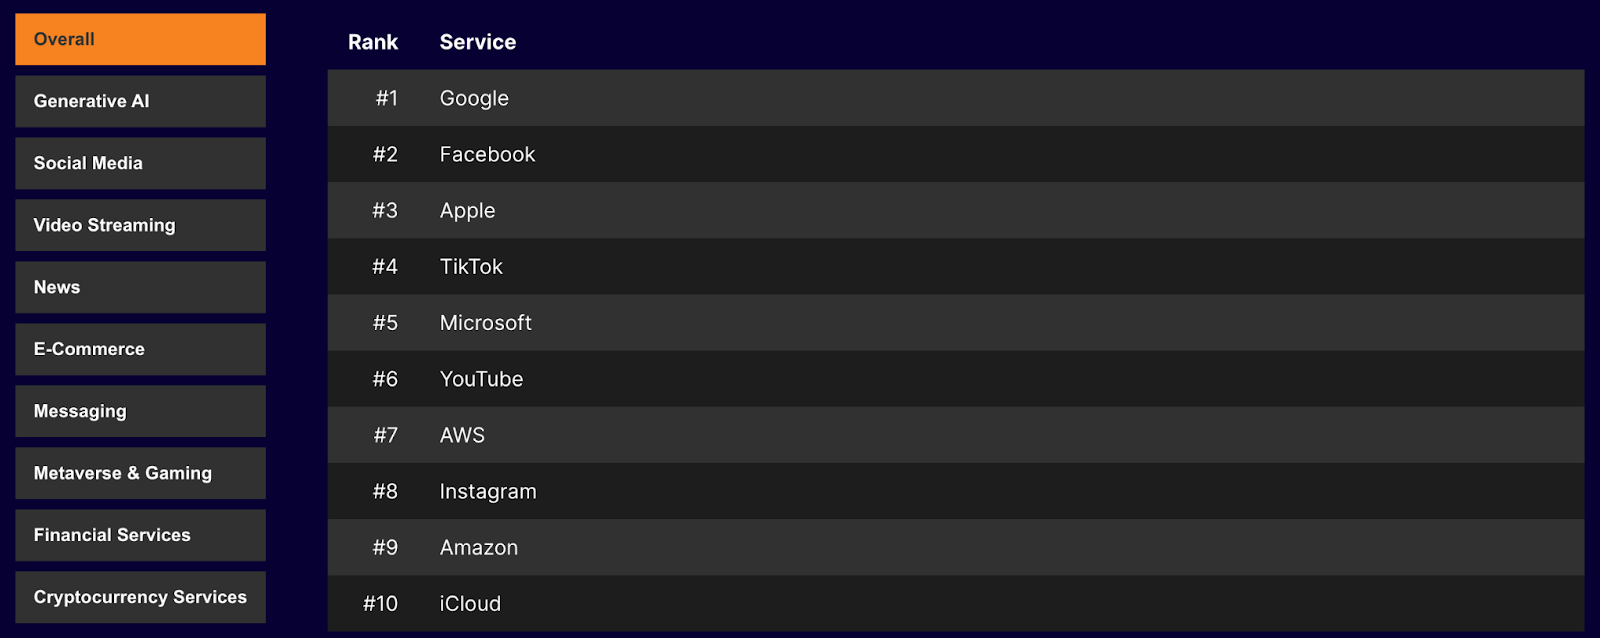
Google is #1. Facebook, Apple and TikTok follow
Since we began reporting these rankings in 2021, we always start with an Overall Top 10 list. These are the services that are the top Internet properties globally in 2023, based on DNS traffic through our 1.1.1.1 resolver. Unsurprisingly, Google (we’re including here services like Google Maps and Google Flights that use google.com, for example) remained the #1 most popular Internet service in our Overall ranking. Since we implemented our new ranking method last year, no other service has challenged Google’s position as the #1 leader in our rankings.
Top 10 — Most popular Internet services 2023, Overall
- Apple
- TikTok
- Microsoft
- YouTube
- AWS
- Amazon
- iCloud
Beyond Google, Facebook was consistently #2, while Apple (that uses, for example, apple.com for several use cases, including on iPhone related services) was generally #3, except when TikTok took the spot in April. Microsoft mostly held the #5 ranking, although it sometimes traded places with YouTube at #6.
AWS — we’re separating it from Amazon by using domains like amazonaws.com — held a firm position at #7, and Instagram was clearly #8 through the year, with a few exceptions involving Amazon. The #10 position changed more frequently, alternating between iCloud (for which we use domains such as icloud.com, distinct from apple.com), Netflix (mainly on weekends), and Microsoft Office. In the chart below, you can follow the evolution of the top Internet services in our Overall ranking throughout the year.
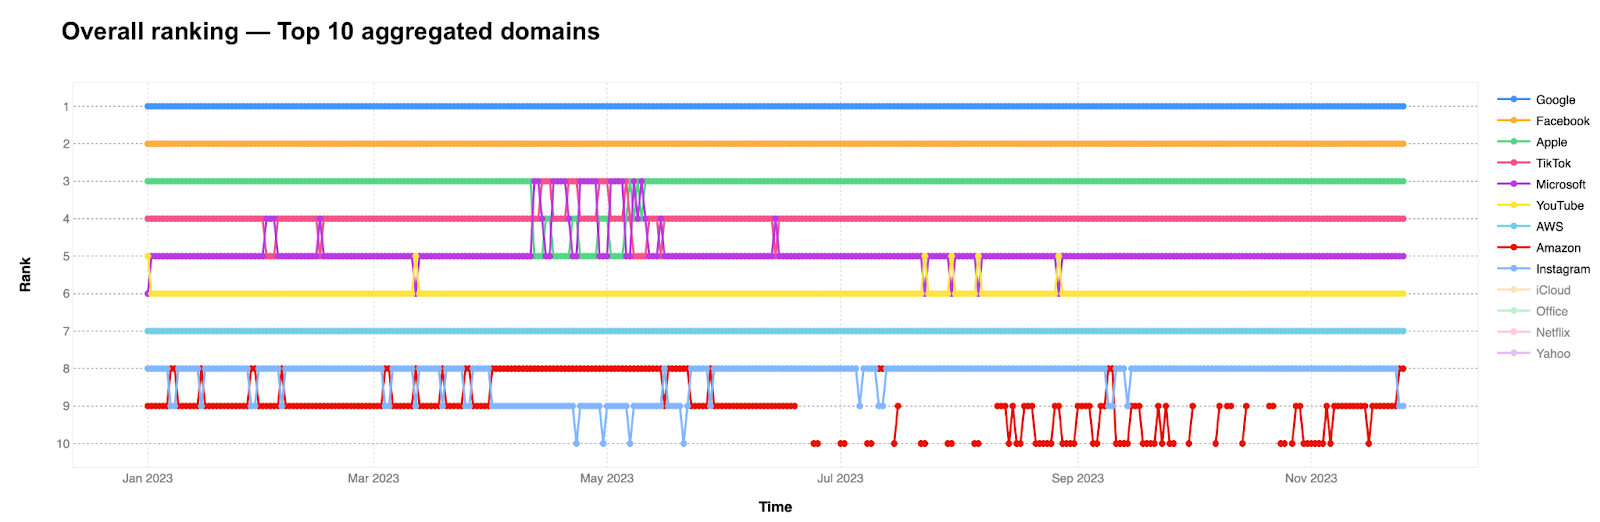
In 2022, X/Twitter ranked as high as #10 in our Overall ranking, but never reached this spot in 2023. We’ll talk more about X/Twitter’s performance in the Social Media category below.
Ready to face the Generative AI era?
The Generative AI category became a global phenomenon in 2023, though it started gaining attention in late November 2022 with the launch of ChatGPT from OpenAI. We tested it on our ‘This Week in NET’ show on December 2, 2022, and were impressed. It’s not surprising that OpenAI was popular early in 2023 and topped this list. Other generative AI services also emerged during the year.
Top 10 — Generative AI services 2023
- OpenAI
- character.ai
- QuillBot
- Hugging Face
- Poe
- Perplexity
- Wordtune
- Bard
- ProWritingAid
- Voicemod
Significant changes occurred below Open AI’s #1 spot throughout the year. After mid-year, we noticed a shift, when character.ai took the #2 spot from Quillbot. Quora’s Poe AI, which combines several AI chatbots including ChatGPT, entered the top 10 in late March, holding the #3 spot until late April before settling at #4.
This figure shows movement among the Generative AI services that were more popular later in the year:
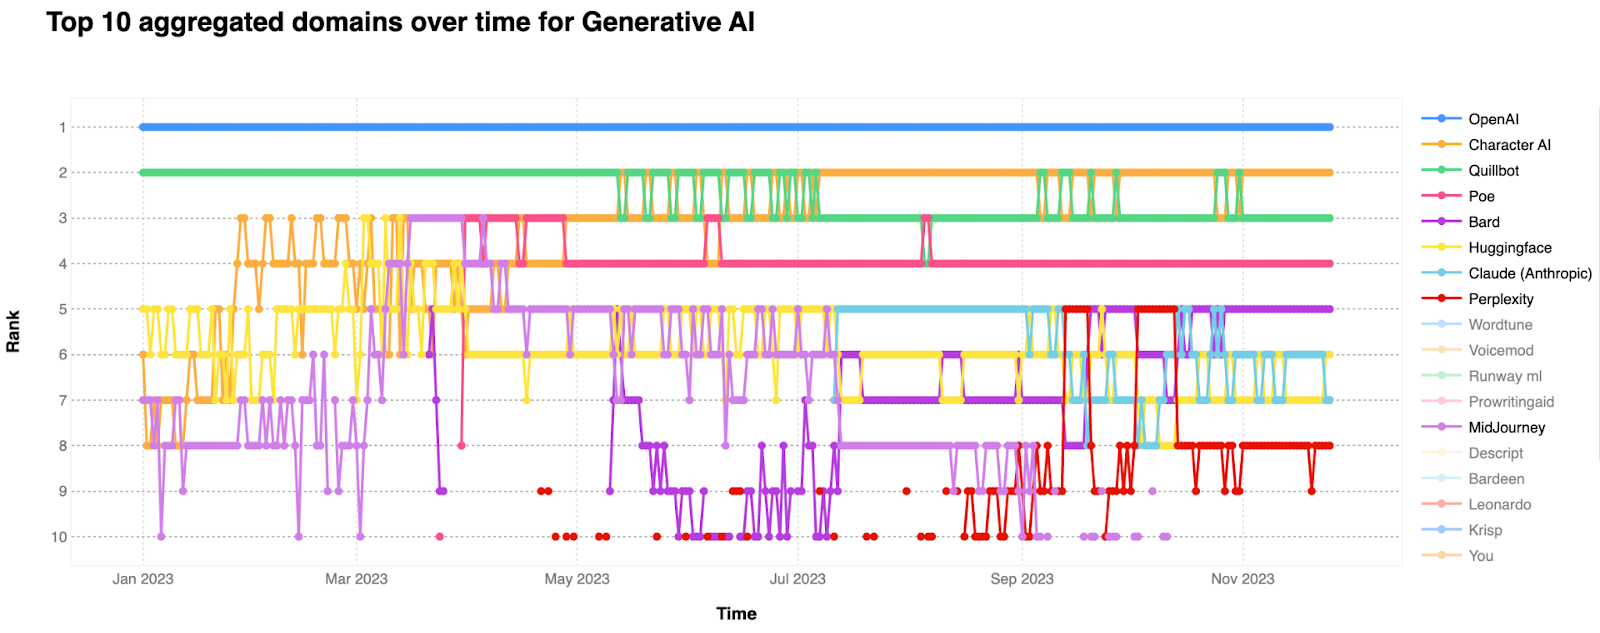
AI model platform Hugging Face was typically #5, but Google’s Bard also reached #5 in November. Bard, launched in limited regions in March, made our top 10 within the category after its broader release in Europe and Brazil. It was #7 from July to September before peaking later in the year.
Other Generative AI services that became important in our list later in 2023 include Anthropic’s Claude (whose new model, Claude 2, launched in July, though it is not yet available in the European Union). It was #5 in August before dropping to #6 after September. Perplexity AI, a ChatGPT competitor, was #8 after September.
Midjourney, which relies on Discord bot commands to create artwork, peaked at #3 in late March but started declining, dropping to #5 in April and May, and then to #10 in September.
Other AI-inclusive services like Prowritingaid, Voicemod, and Wordtune were more popular earlier in the year but became less so later on. Bardeen was in the top 10 in May and June, while Descript appeared at #9 between March and May.
Notable trends that we observed when looking at trends for Generative AI services in our larger Overall ranking include:
- OpenAI, which was around #200 in our Overall ranking in early January, saw a significant rise between March and April (OpenAI launched GPT-4 and plugins during that time) and is now near the top 100. It peaked early in November (#104 on November 9), right after OpenAI’s first developer conference on November 6 in San Francisco. The brief removal of Sam Altman in late November didn’t have a noticeable impact.
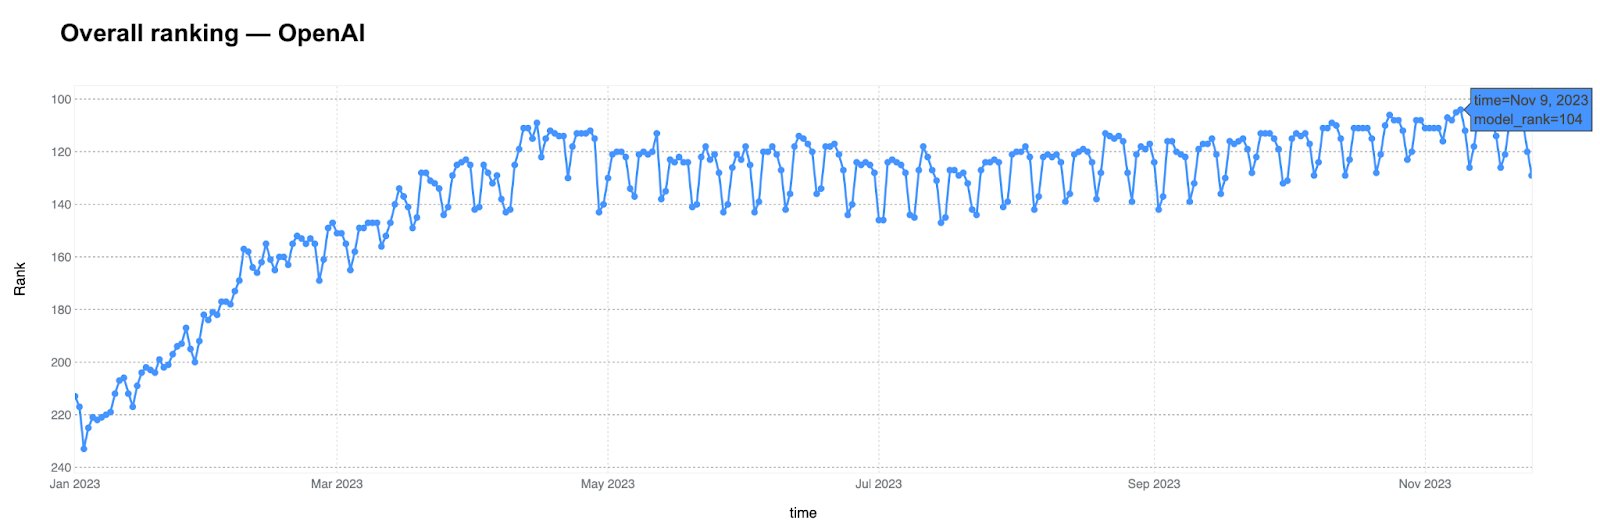
- character.ai‘s growth was similar to OpenAI, rising from the top 500 in early January to around #200 recently. Quillbot remained steady throughout the year, around #258.
- Poe AI peaked at #276 on June 18 and is now around #290. Claude AI was around #380 in November after a late August peak at #337.
Social media: The Facebook (not X) effect
An analysis from Kepios estimates that there are 4.95 billion social media users around the world in 2023, comprising 61.4% of the world population, so this category plays a big role in our everyday life as a central stage for communication, information, and general attention.
Unsurprisingly, social media platforms such as Facebook, TikTok, and Instagram rank high in our most popular Internet properties and are featured in our Top 10 Overall Internet services list.
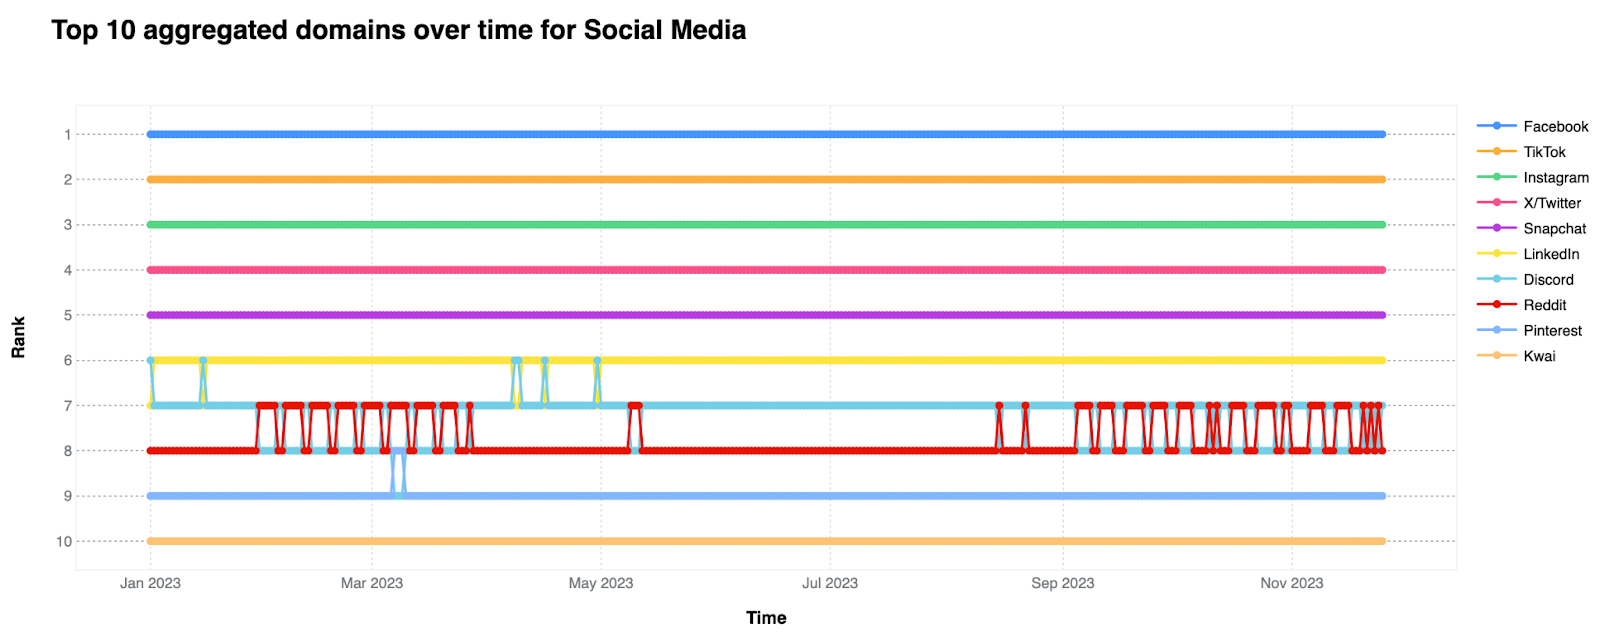
Within our Social Media category list, the top five remained the same as last year. Facebook was #1, followed by TikTok (#2), Instagram (#3), X/Twitter (#4), and Snapchat (#5).
Top 10 — Social Media services 2023
- TikTok
- X/Twitter
- Snapchat
- Discord
- Kwai
In contrast to 2022, when Twitter (renamed X in July 2023) and Instagram often swapped places at #3, this year X/Twitter never challenged Instagram in our rankings.
LinkedIn held a strong #6, with Discord challenging it during a few days in January and April.
Reddit, usually at #8, competed with Discord for the #7 spot in February and March but fell back to #8 in April, concurrent with the controversy around Reddit API changes. Reddit often challenged Discord on weekdays, while Discord was more popular on weekends. Following these are Pinterest (#9) and Kwai, the Chinese video app popular in Brazil, Indonesia, and other countries (#10). Here’s the top 10 chart across 2023:
A Twitter (or X) drop after a possible football (or soccer) peak
Let’s continue on social media, but leave its specific category and examine how social media services fared in our Overall ranking where bigger shifts between services are seen.
The graph below depicts the position of Instagram and Twitter in the Overall ranking. Instagram consistently ranked in the top 10, typically holding positions #8 or #9 with brief dips to #10 around May 2023.
X/Twitter, which reached as high as #8 overall last year following the start of the war in Ukraine, ended 2022 at #12 and continued its downward trend in 2023. It started between #12 and #16, lower than last year, and ended between #13 and #19. Here’s how these two evolved in 2023:
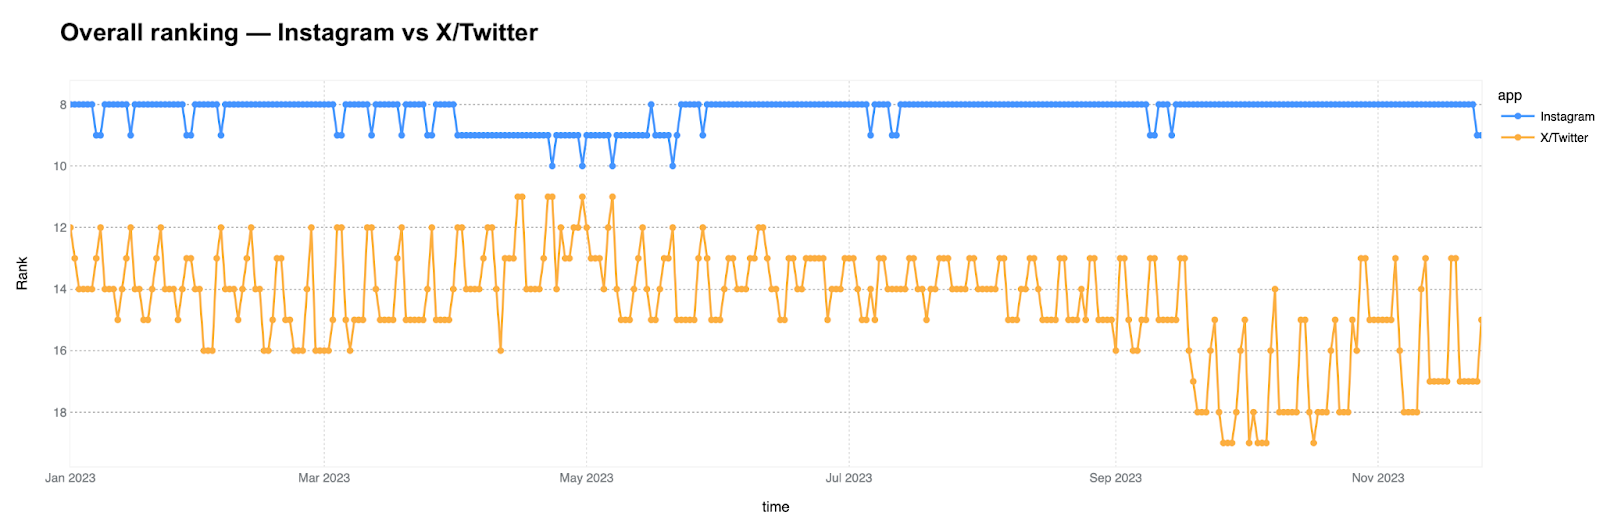
We noticed that X/Twitter was particularly popular on weekends, peaking at #11 or #12 between April 15 and June 10. Specifically, it ranked at #11 in the weekends before May 14 and then at #12 from May 14 to June 10. This coincides with key moments in European football competitions. However, after the European Champions League final on June 10, X/Twitter never reached those heights again.
Let’s explore this possible football (or soccer) Twitter trend. X/Twitter’s rankings peaked around significant moments in the English Premier League (arguably the most-watched sports league in the world), particularly when Manchester City made crucial advances to their title after April 15. The trend lasted until the European Champions League final on June 10, where City’s victory and historic treble coincided with X/Twitter’s final peak ranking of the year — the weekend of June 3, when there were already no Premier League games, and X/Twitter dropped to #13.
Alternatives to X/Twitter: Mastodon, Threads, and others
Tumblr, a more established platform than other recent alternatives, fluctuated between #125 and #153 in our Overall ranking, showing a downward trend. Close behind was an aggregation of several hundred Mastodon servers, ranking between #160 and #200.
Threads from Instagram/Meta (seen in the next chart), peaked at #227 on July 6 in our Overall ranking, then dropped but recovered to around #300 after late August, and did not make it into the top 10 social media services ranking for 2023. For context, Kwai (#10 in the Social Media ranking) usually ranks around our Overall top 50.
Bluesky, a newer entrant, first appeared in our Top 500 in late August, with a first spike at #432 on September 19 and reaching the top 400 in November, peaking at #397 on November 19. Truth Social had a peak at #318 on August 23 but then dropped, averaging around #450 in November.
Other social apps including Hive Social, Counter Social, Post.News, T2/Pebble, Parler, etc., didn’t appear in our Overall 500 ranking.
Here are some other trends we observed among social media apps, and how they did in our Overall ranking:
- Snapchat was more popular on weekends, fluctuating between #18 and #21 overall, with improved performance after October, with several days at #18, close to X/Twitter.
- Discord was also more popular on weekends, varying between #24 and #35, peaking in April at #24. It had a similar trend to Midjourney, the generative AI image service that generates images for its users on Discord. It ended the year around #32.
- Reddit, which was more popular on weekdays, dropped in our ranking during the summer in the Northern Hemisphere, in contrast with other social media services, and moved between #30 and #38.
- Quora was also more popular on weekdays, and fluctuated between #116 and #146, dropping in summer and settling around #130 in November.
- Tinder, the social dating app, fell from a peak of #124 to #133 in November, and is much more popular on Sundays.
- OnlyFans showed steady growth, peaking at #148 in early July and settling around #175. The adult oriented social content subscription service was more popular on the weekends, particularly on Sundays.
- BeReal, a French social media app for daily photo sharing, approached but did not enter the Social Media top 10 ranking, and grew to a peak of #141 in our Overall ranking in September but fell in November.
E-commerce: Temu means growth
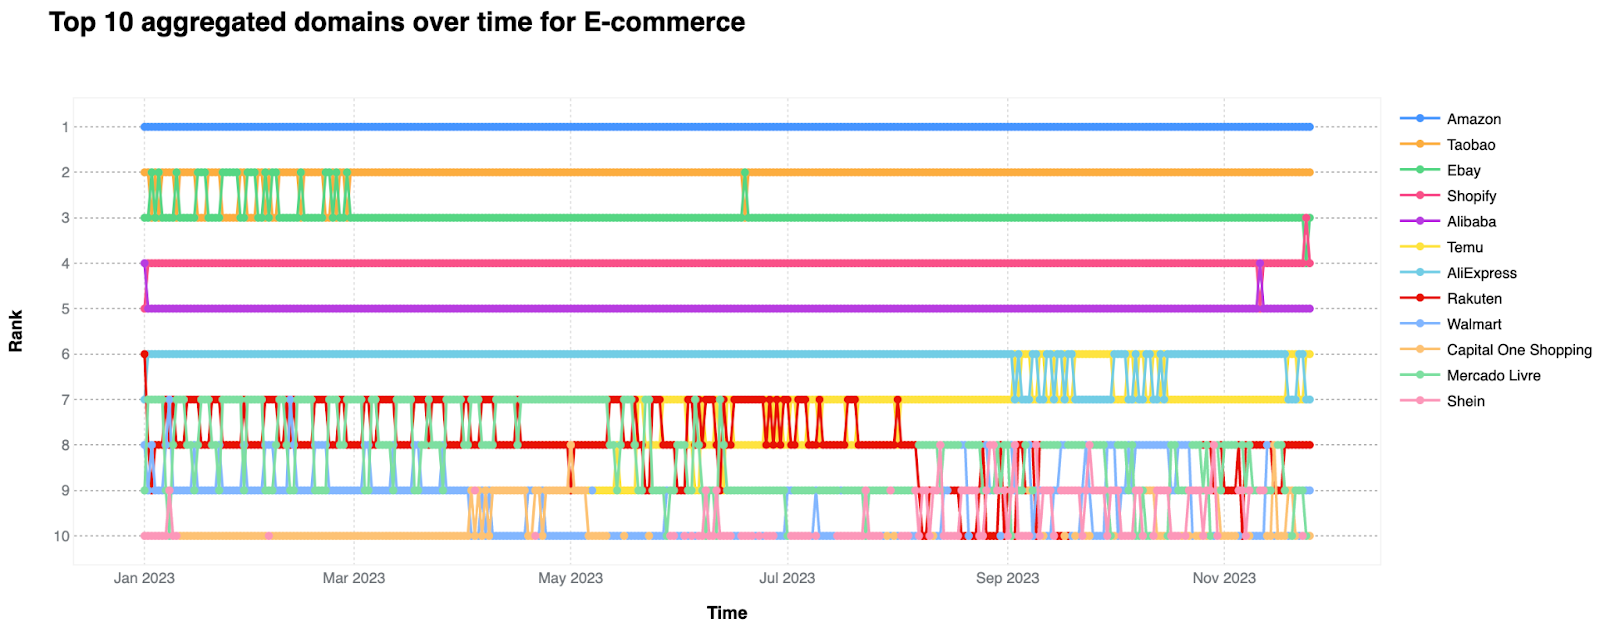
E-commerce remains as relevant as ever, something that is especially evident in our recent Cyber Week blog post. Amazon consistently tops the category, with Taobao as a solid #2. In 2022, eBay was mostly #2 but has now dropped to #3, although it had several days in early 2023 in the #2 spot, as well as on June 19.
Top 10 — E-commerce services 2023
- Amazon
- Taobao
- eBay
- Shopify
- Alibaba
- AliExpress
- Temu
- Rakuten
- Mercado Libre
- Walmart
Throughout the year, Shopify was a solid #4, overtaking eBay at #3 on Black Friday. Alibaba was #5, peaking on Singles’ Day, November 11. AliExpress followed at #6.
Rakuten and Temu battled for the #7 ranking in 2023. Temu, the Chinese-owned and Boston-based low price and fast fashion marketplace (launched in the US in September 2022) was definitely one of the surprises of the year. It expanded to Canada, Australia and New Zealand in February, and ended 2023 as #7 in front of Rakuten. It ranked #6 at times during the year, including Black Friday. Temu wasn’t in our top 10 in 2022.
The South American e-commerce platform Mercado Libre, the American retail giant Walmart, and the fast fashion brand Shein, ‘battled’ during the year for the 9th and 10th place rankings in the E-commerce category.
Looking at how e-commerce sites did in our Overall ranking, we observed the following trends:
- Amazon finished the year at #9 overall, reaching #8 on its Prime Day shopping event (July 11-12) and Black Friday.
- Shein, the Chinese fast fashion brand, showed growth, starting at around #130 in January and ending around #120. It’s a similar trend to the one we observed in 2022.
- Temu was not in the top 200 in January but finished in the top 100, peaking on Black Friday at #84 — a similar trend was seen in OpenAI performance. Temu also overtook Shein in May 2023.
- Best Buy also peaked on Black Friday in 2023, as did Nike, Adidas, Victoria’s Secret, and H&M. Zara’s best day was November 23.
- Target first peaked on November 12 at #134 and again on Black Friday at #135.
- Ikea didn’t perform as well during Black Friday week in our ranking, and had its 2023 peak on June 14-15 (#172), when it launched its own summer sale and a remote interior design AI related strategy.
- Alibaba’s highest position in 2023 was on Single’s Day, November 11, at #67.
Video streaming: YouTube and Netflix remain uncontested
Video streaming platforms continue to play a central role in entertaining us. YouTube remains the top service for all video streaming, with Netflix as a close second. However, within our rankings, Netflix is the clear leader among paid streaming services, followed by Disney Plus, Amazon Prime Video, Hulu, and HBO/HBO Max.
Top 10 — Video streaming services 2023
- YouTube
- Netflix
- Twitch
- Roku
- Disney Plus
- Prime Video
- Hulu
- HBO/Max
- Vimeo
- Pluto TV
Twitch, which has a significant amount of video game live-streaming content, secured the #3 spot, as it did in 2022. Roku, a digital media player that also offers streaming services, ranked #4. Following are Disney Plus, Prime Video, Hulu, and HBO/Max (now known as Max), with Vimeo surpassing Pluto TV later in the year. Dailymotion also made a top 10 appearance in late February for a few days.
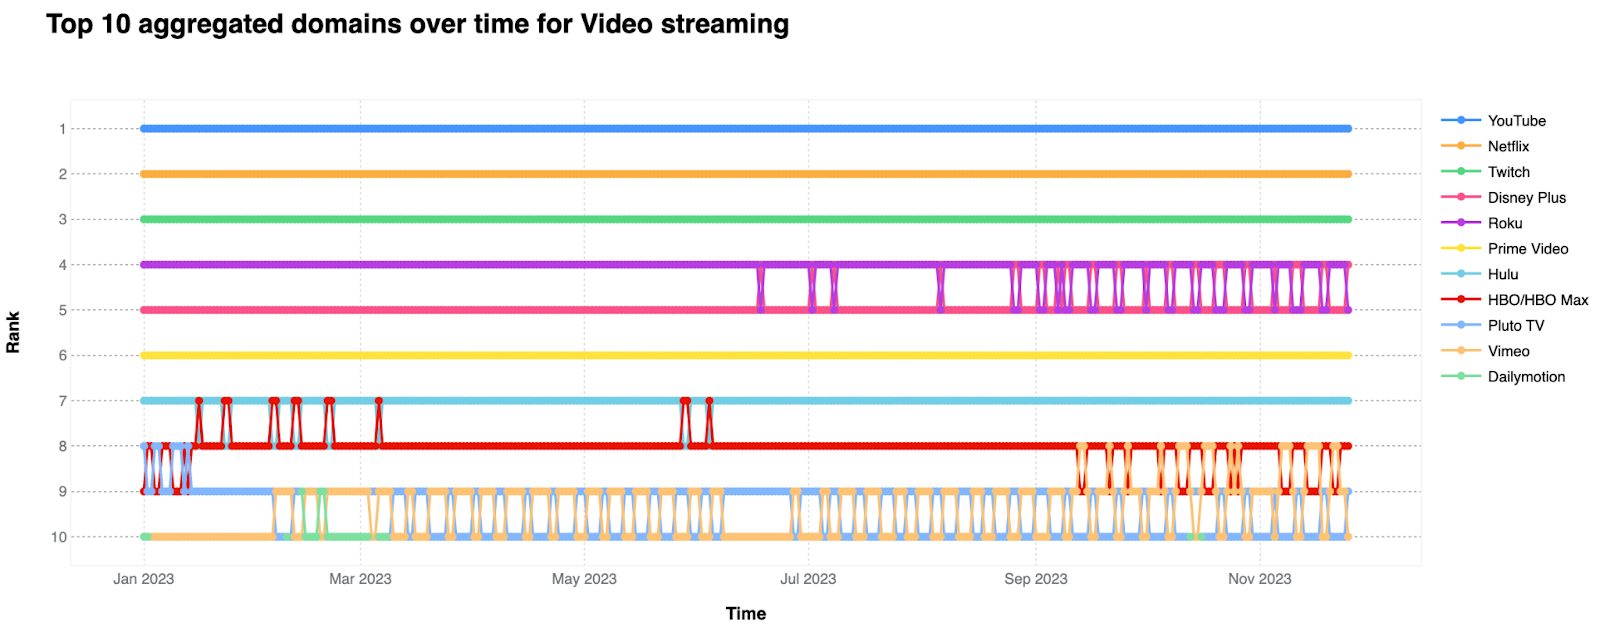
Throughout the year, Disney+ occasionally challenged Roku, especially on weekends following the premiere of the Star Wars-related miniseries Ahsoka on August 23.
Looking at how video streaming services performed in our Overall ranking, we found:
- Netflix peaked at #9 on Sundays in April and May, coinciding with the release of ‘The Diplomat‘ starring Keri Russell — it was the most watched show on the platform at that time. Netflix, Prime Video, HBO/Max, were more popular on weekends.
- Prime Video was more popular earlier in the year, peaking at #50 on March 26, the weekend ‘Top Gun: Maverick‘ premiered.
- HBO/Max has been dropping in our Overall ranking since September but remains in the top 100.
- Peacock, NBC’s streaming service, peaked at #111 in October and was more popular on Sundays.
- Paramount Plus has been falling in our Overall ranking, down to around #156 in November, and is also more popular on Sundays.
The News: Globo and BBC global perspectives
News organizations worldwide play a crucial role in keeping the public informed, especially during times of crisis like pandemics, wars, or financial uncertainty. With that in mind, the ranking of news organizations also highlights a few newsworthy trends.
Top 10 — News services 2023
- Globo
- BBC
- Fox News
- CNN
- NY Times
- Daily Mail
- Washington Post
- The Guardian
- NPR
- Wall Street Journal
Last year, BBC and Globo tied for #1 in this category. In 2023, Globo — a Brazilian media conglomerate popular in South America, was consistently #1, followed by the BBC, the UK’s national broadcaster. The only exception was on June 20, when the BBC was #1. This coincided with the Titan submersible implosion on June 18, which remained in global news for most of the following week.
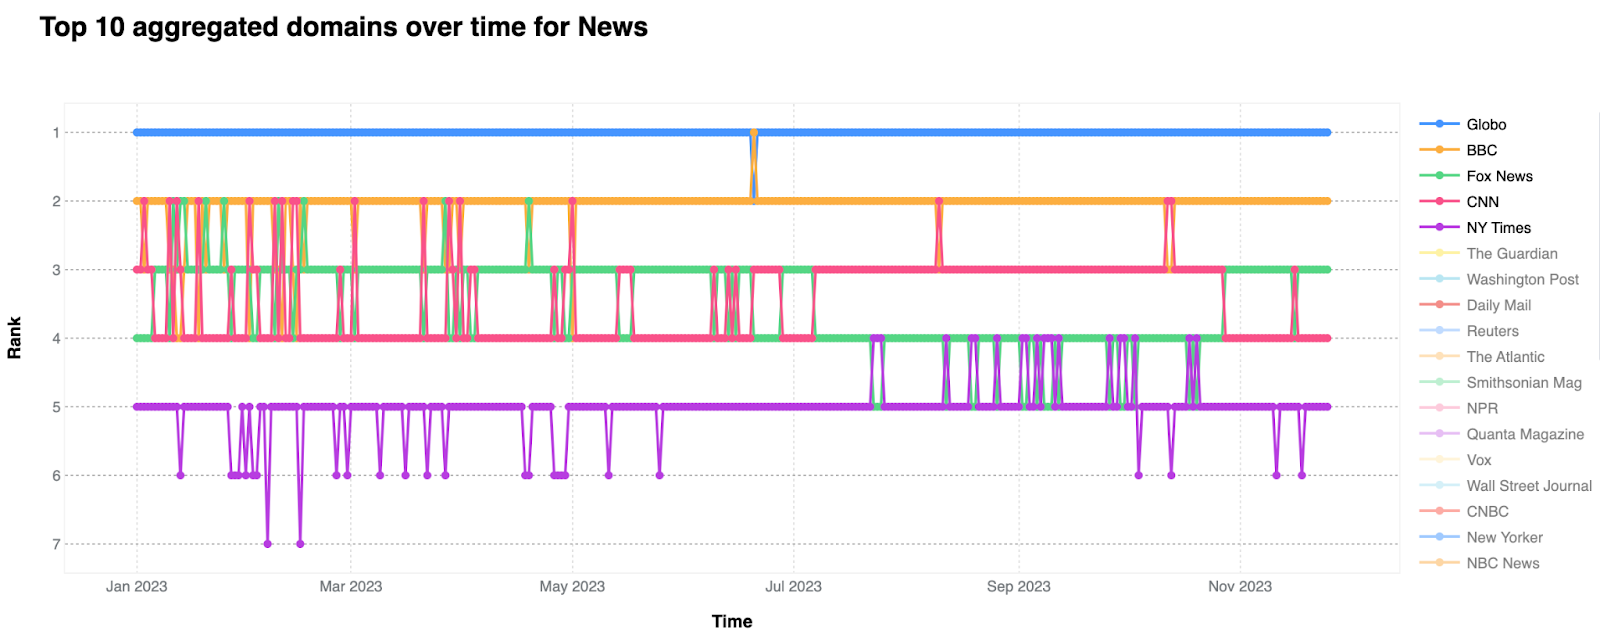
Fox News and CNN also played a key role in our list. Fox News was overtaken by CNN for the #3 spot from July onwards, though Fox led again in November. The New York Times held a steady #5, followed by the Daily Mail and NPR, with the Washington Post overtaking NPR in June.
The ranking lower in the top 10 fluctuated more, with the Wall Street Journal mostly at #9, reaching #8 in September. The Guardian was #8 in October, coinciding with the start of the Hamas-Israel conflict on October 7.
Titan submersible implosion & the Hamas-Israel conflict
Notable news trends we identified in our larger Overall ranking include:
- CNN had its 2023 peak on June 22, reaching #73, and was already higher than usual in the previous days. That was the day the United States Coast Guard announced that they had discovered debris from the Titan submersible implosion, confirming that the five people aboard were dead. The other peak of the year for CNN was February 14, Valentine’s Day.
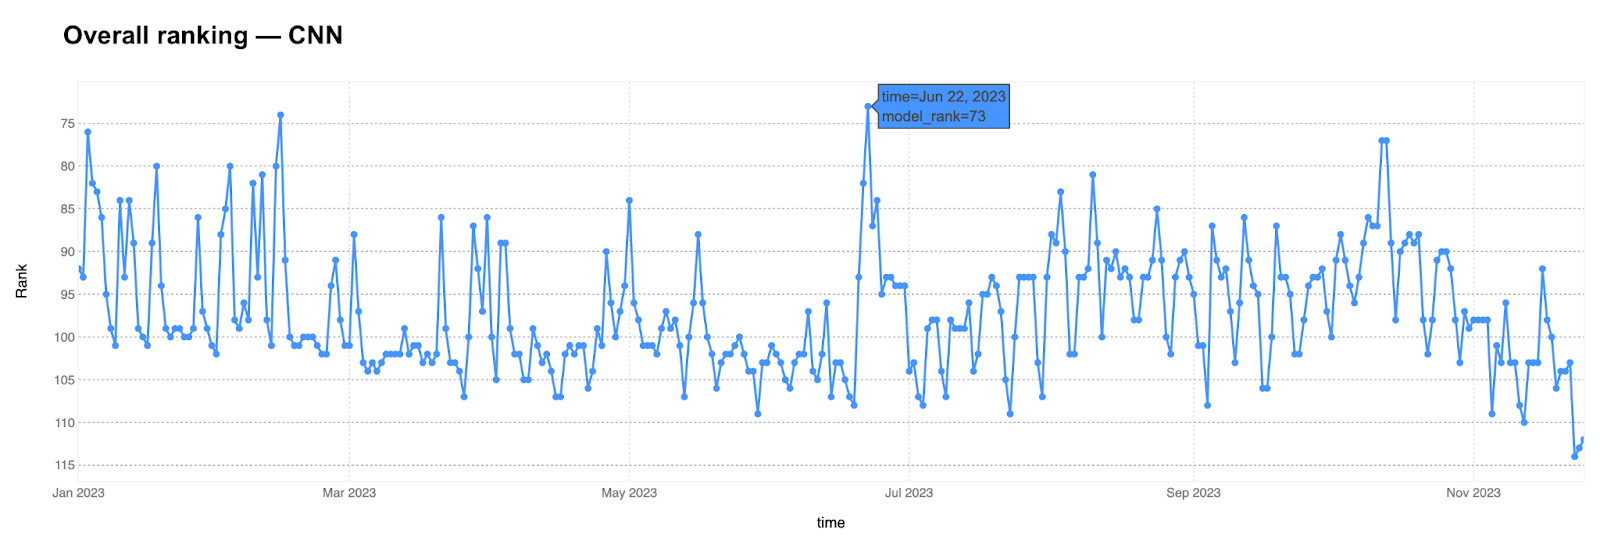
- The Daily Mail (#127) and The Indian Express (#389) also peaked on June 22, with Fox News also reaching one of its highest ranks on that day, although it was higher in early January.
- German news outlet Bild also peaked on June 22, while Der Spiegel‘s highest point was the previous day, June 21.
- BBC, had a significant peak in our Overall list on October 8, following the Hamas attack on Israel, reaching #76. It also moved higher in the news category ranking on that day, as noted above.
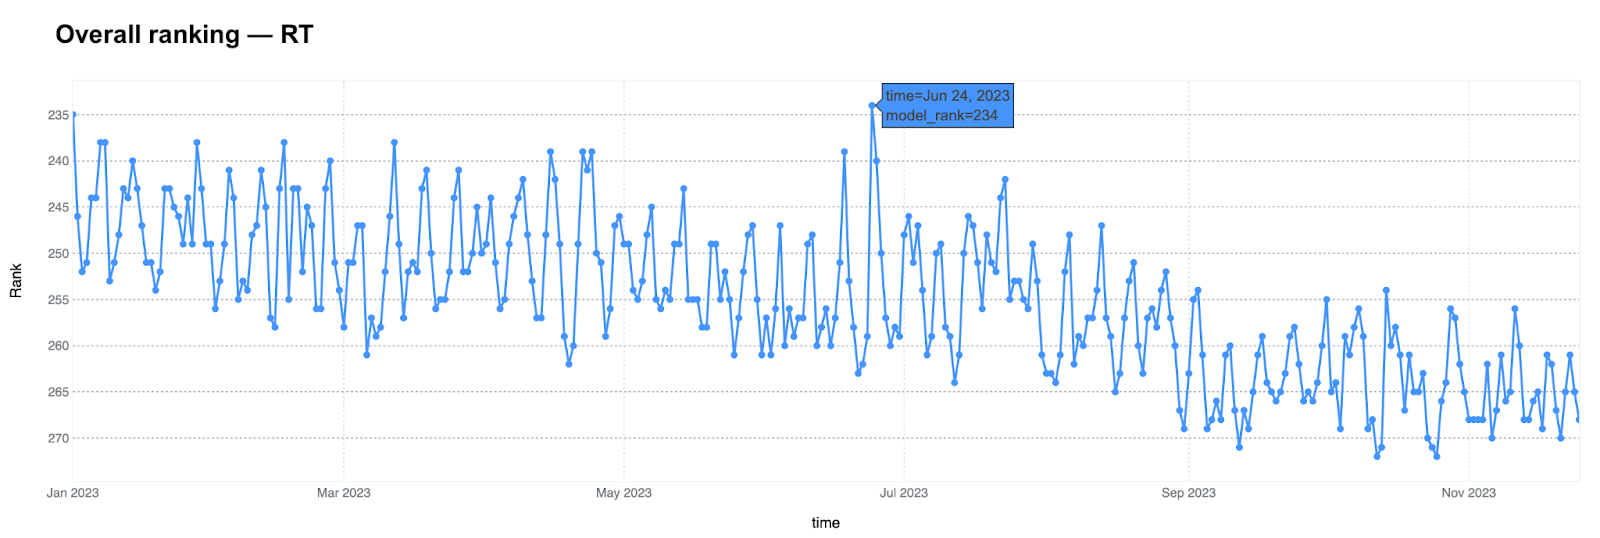
- RT, the Russian news organization, showed a decline throughout the year but peaked on June 24 (#234) during the Wagner Group rebellion in Russia.
- Israeli newspapers Times of Israel and Haaretz jumped into our Overall ranking on October 7, the day of the Hamas attack on Israel. The former had its peak on October 9 at #275, the latter on October 8 at #393.
- The Washington Post peaked on April 4-5 (#117), coinciding with Finland joining NATO and Donald Trump’s not guilty plea after becoming the first US president to be indicted.
- China Daily appeared in our top 500 in January, peaking on January 20 at #361, ahead of the Chinese New Year on January 22. A similar rise was seen in the South China Morning Post.
- TMZ‘s highest rank was on October 29 (#243), following the announcement of the TV star Matthew Perry‘s death.
- BuzzFeed, combining buzzfeed.com and buzzfeednews.com, declined in our Overall ranking, especially after the summer, falling to around #300 in November. In April 2023, it was announced that BuzzFeed News would be shutting down, and it did so in May.
Messaging: WhatsApp rules & Telegram rises
Messaging is seen as a type of social media and remains as relevant as ever including for specific communication purposes. Apple’s iMessage is not included in this category, because it doesn’t have a unique domain name whose traffic can be analyzed. Keeping that in mind, WhatsApp remained the top messaging service in 2023, consistent with its position in 2022.
Top — Messaging services 2023
- Viber
- Telegram
- LINE
- Signal
- Messenger
- GroupMe
- Kik
Following WhatsApp is the Chinese service QQ, also known as Tencent QQ, which includes games and mobile payments and is popular in Asia, at #2. Viber, popular in Eastern Europe, Asia, and the Middle East, comes next. The top three are unchanged from 2022. Telegram, widely used in Eastern Europe and Asia, holds the #4 spot. LINE from Japan briefly contested this position early in 2023. Signal follows, and the Chinese app WeChat is at #7, ahead of Facebook’s Messenger.
The list concludes with Microsoft’s GroupMe and the Canadian service Kik Messenger. The standings are similar to 2022, but Telegram, WeChat, and Signal have shown improvements.
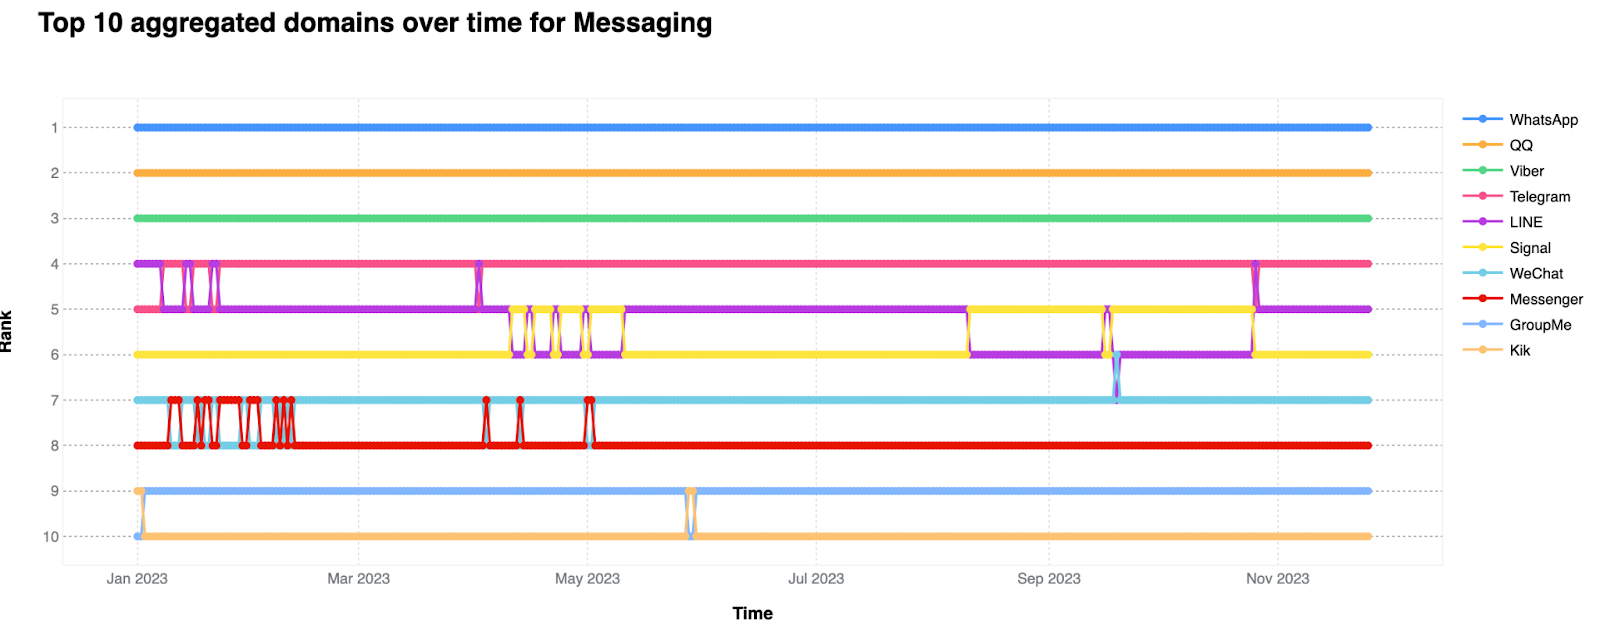
Here are other messaging trends from our Overall ranking:
- WhatsApp‘s was generally most popular between late May and early September, though its peak came on November 14th, when it reached #13 in our Overall ranking (a rank it shared that month with X/Twitter).
- Telegram rose to #79 overall on June 24, following the Wagner Group rebellion in Russia, which occurred June 23-24.
- WeChat saw a significant spike the first quarter of the year on January 21-22, Chinese New Year‘s Eve and respective New Year day. WeChat peaked in 2023 at #122 on August 19, coinciding with news regarding China’s military drills around Taiwan.
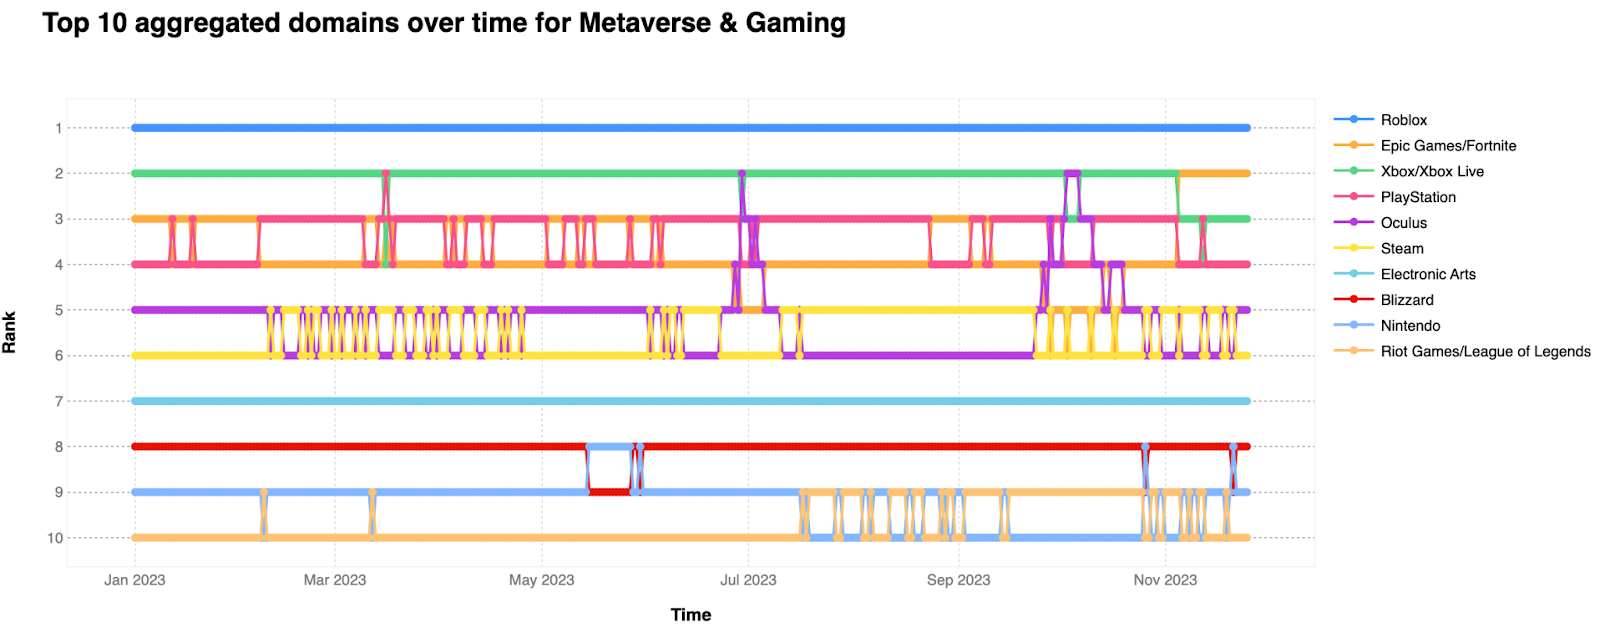
Metaverse & Gaming: Roblox leads, Oculus grows
Is gaming part of the metaverse? In a sense, one could argue that it depends on the game, given that it is all about being immersed in another world. Concepts aside, we’ve included both in the same category since last year. Roblox was the uncontested winner of this category in 2023, followed by two services that are now much more than just popular gaming consoles, but also popular online gaming services: Microsoft’s Xbox and Sony’s PlayStation.
Top 10 — Metaverse & Gaming services 2023
- Roblox
- Xbox/Xbox Live
- Epic Games/Fortnite
- PlayStation
- Oculus
- Steam
- Electronic Arts
- Blizzard
- Nintendo
- Riot Games/League of Legends
Xbox and PlayStation were at the podium of the list for most of the year. The top spots were similar to 2022, but PlayStation, which was #3 last year, was surpassed by Epic Games (known for Fortnite) during the last part of 2023.
Oculus, a VR headset and also metaverse experience service owned by Meta (we’re considering domains related to those two aspects provided by Meta’s Reality Labs), rose in the rankings to #5, continuing a trend from late 2022. It reached as high as #2 on June 29, and again on October 3-4 after the announcement of Quest 3 at Meta Connect 2023.
Steam was more popular than Oculus from July to September, reaching #5. Electronic Arts was a solid #7 throughout the year, and Blizzard (famous for World of Warcraft and an Activision Blizzard subsidiary), was mostly in #8. The top 10 list ends with Nintendo and Riot Games/League of Legends ‘battling’ for the #9 and #10 spots, with the latter overtaking Nintendo since September.
Here’s the top 10 chart across 2023:
Financial services: Stripe takes the lead, Black Friday impact
The financial services sector is diverse, ranging from traditional banking to cryptocurrency-only services to tax-related services. This year, Stripe, an Irish-American payment platform, dethroned PayPal as the top service in this category.
Top 10 — Financial Services 2023
- Stripe
- PayPal
- Alipay
- TradingView
- Nubank (BR)
- Intuit
- American Express
- Binance
- Bradesco Bank
- CoinGecko
PayPal started the year at #1 but was overtaken by Stripe on most days since March. PayPal still led on some weekends during the summer and on Black Friday. TradingView lost its #3 spot to Alipay in late July. Intuit was more popular early in the year, peaking on April 18, the Tax Day in the United States, but ended mostly at #5 on weekdays (see our 2022 blog post on how Tax Day impacts related sites for more on this trend).
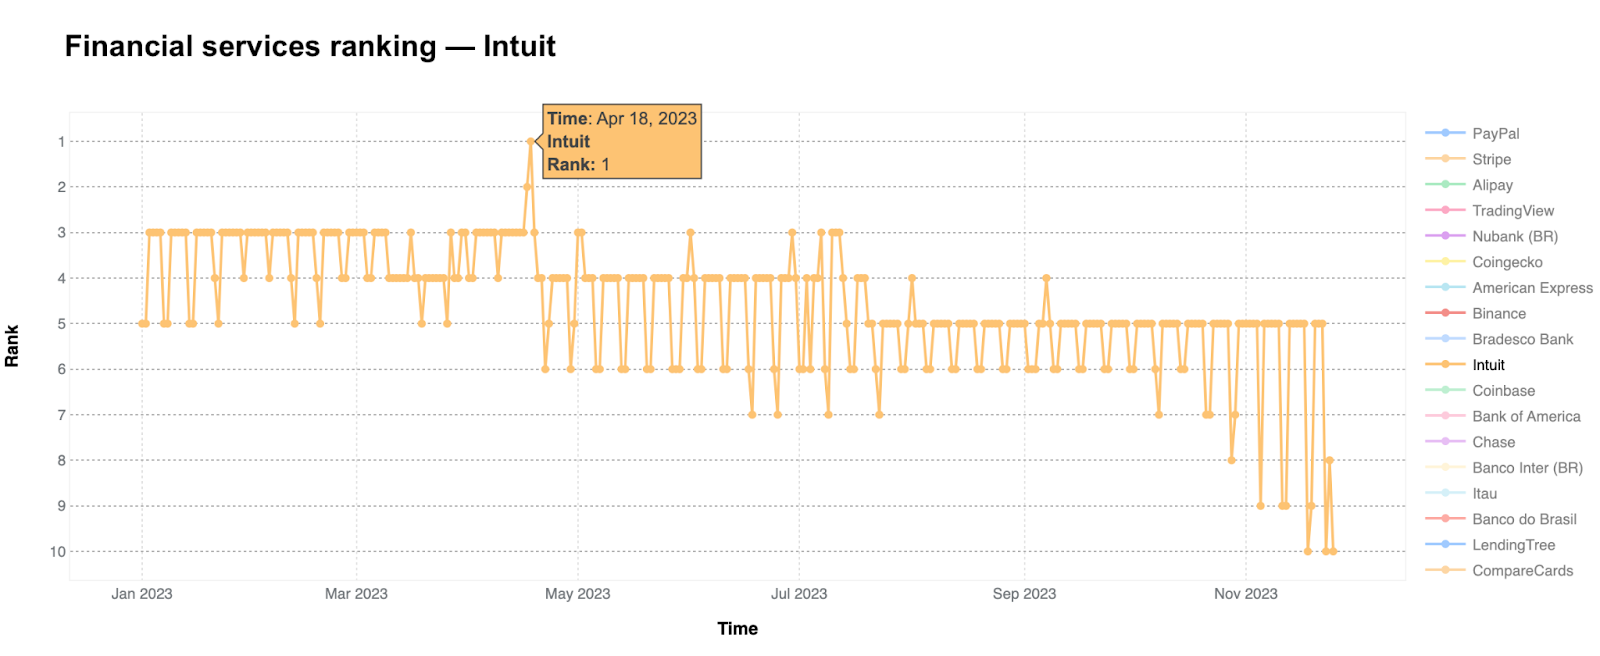
The Brazilian Nubank, an online-only bank or neobank, and the largest of its kind in Latin America, was a surprise at #6, often reaching higher ranks on weekends, especially on Saturdays, as it peaked on June 3 and July 1.
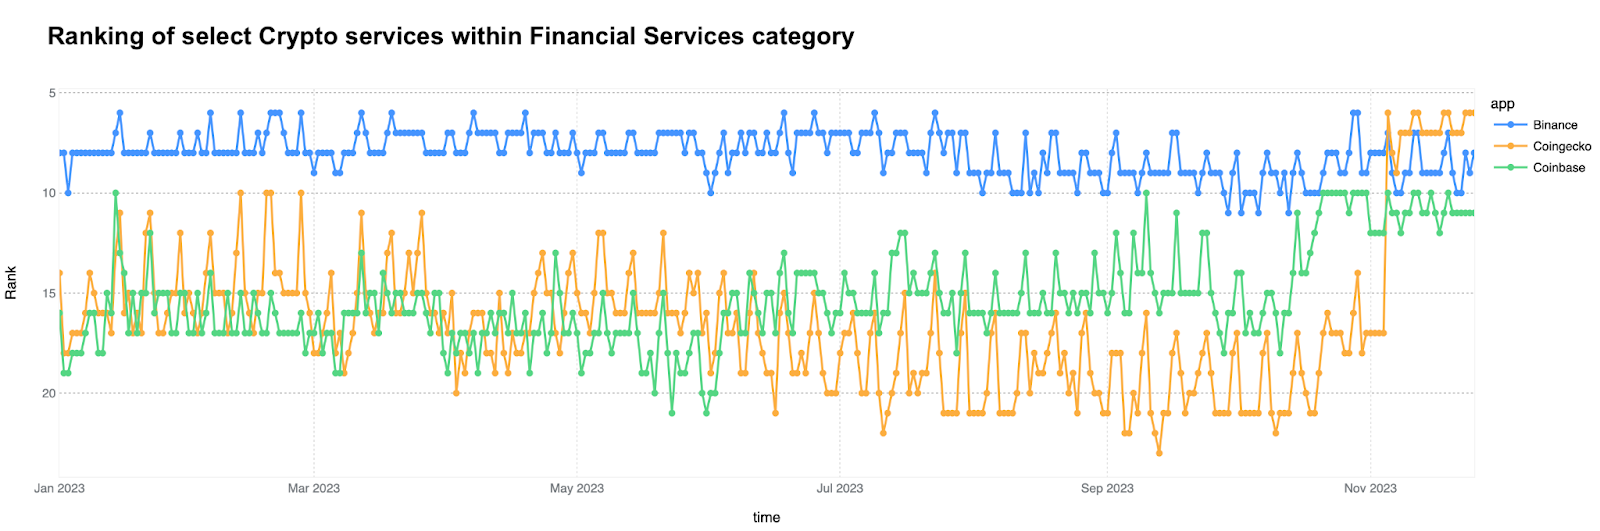
Focusing on specific crypto services in the Financial category (more on crypto below), we can see that Binance lost ground throughout 2023, especially after August moving between #8 and #9. This is a change from its trend in 2022, when Binance was on a growth trajectory and ranked #6. CoinGecko, a cryptocurrency data aggregation and tracking website, made a late appearance in 2023 with several days as #6 in November, and Coinbase appeared at #10 after late October. Here’s the crypto perspective in this Financial services category:
Here are other financial services trends from our Overall ranking
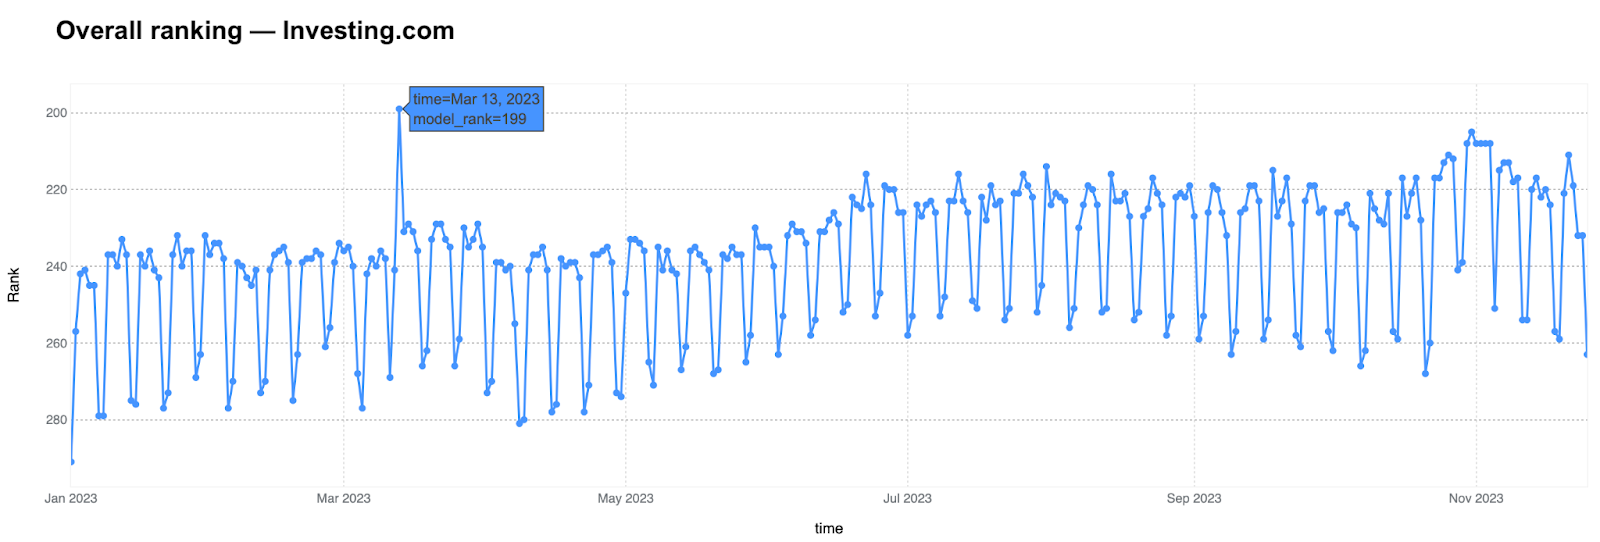
- Investing.com‘s peak at #199 occurred on March 13, three days after the collapse and seizure of Silicon Valley Bank (SVB), and the same day that bank shares plunged on contagion fears — a period known as the 2023 US banking crisis. It was the same day MarketWatch also peaked (#293).
- Online-only financial services such as PayPal (#71) and Klarna (#211) reached their annual peak in our Overall ranking on Black Friday, November 24. Stripe, however, had a clear spike at #77 on that day, but its best day was on November 10, at #68.
- Venmo, an American mobile payment service owned by PayPal, had its best month in September.
Crypto: Binance declines and CoinGecko rises
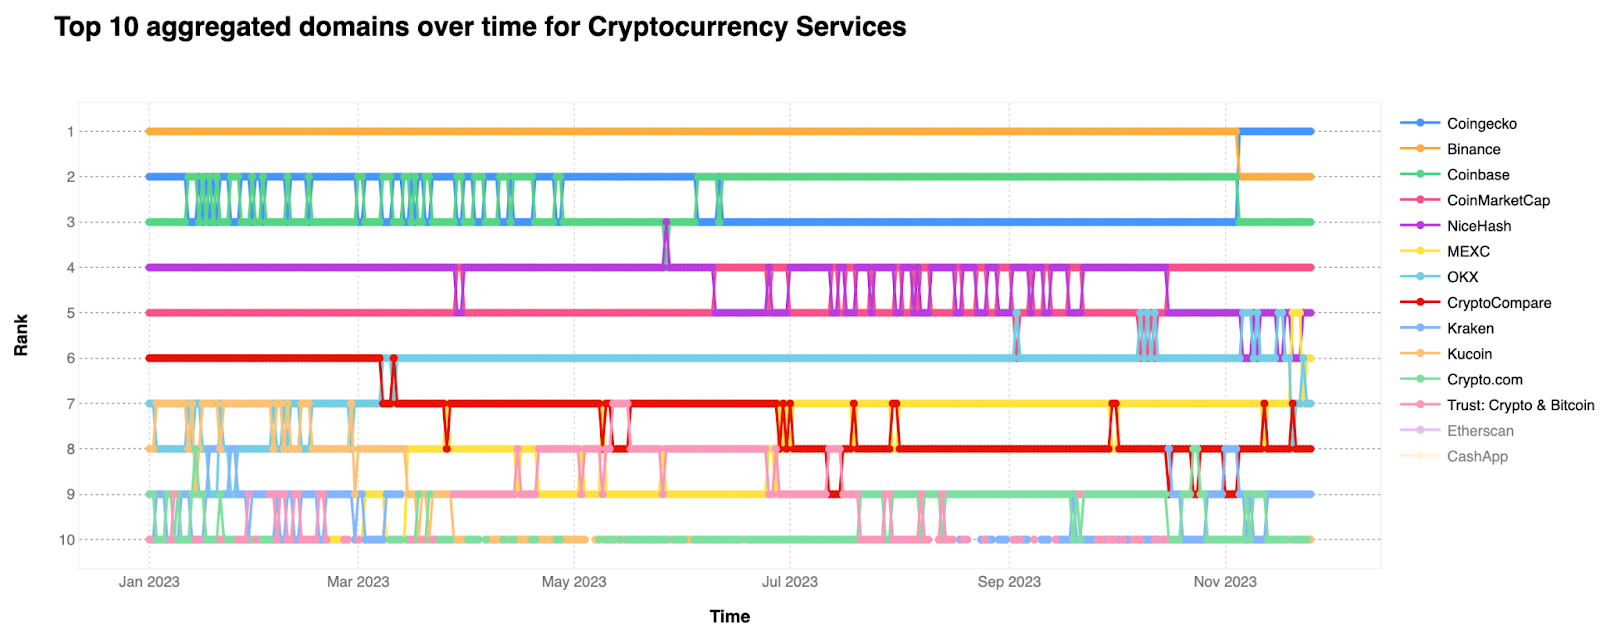
In addition to our Financial Services category, we also evaluated cryptocurrency-related services in particular. Despite the disappearance of Sam Bankman-Fried’s FTX from our rankings after its bankruptcy in November 2022, the crypto sector continues to show several changes this year. Binance, Coinbase, and CoinGecko (a provider of crypto data tools) remain at the top of the list, a trend similar to 2022. While Binance held on to its #1 position across most of 2023, in the last month it was overtaken by CoinGecko.
Top 10 — Cryptocurrency services 2023
- Binance
- CoinGecko
- Coinbase
- CoinMarketCap
- NiceHash
- OKX
- MEXC
- CryptoCompare
- Kraken
- Crypto.com
Throughout the year, CoinGecko gained momentum, surpassing the cryptocurrency exchange platforms Binance and Coinbase in November. CoinMarketCap and NiceHash were also prominent, with CoinMarketCap reaching #4 by October. OKX, MEXC, and Crypto.com were already in the top 10 in 2022, and CryptoCompare, Kraken, and Trust: Crypto & Bitcoin, which also competed for the #10 position, were new inclusions in 2023. Kucoin and Etherscan fell out of the 2023 top 10 after being there in 2022.
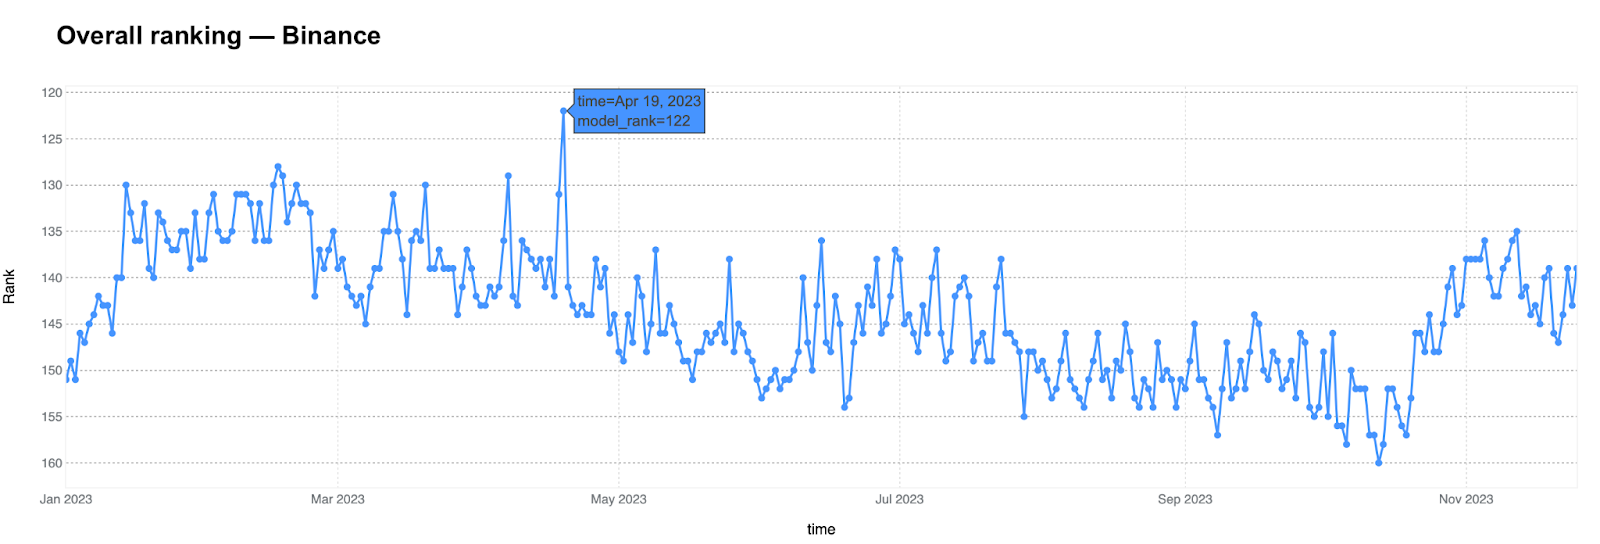
What happened to Binance? In both the Financial Services and Cryptocurrency categories, we noticed Binance, a key cryptocurrency player, lost its leading position in 2023, dropping to #2 in November. The company faced challenges in July, with several top executives leaving. Then, in November, US authorities filed a lawsuit against Binance, resulting in multiple charges and fines. In our Overall ranking, Binance’s highest point was on April 19, the day after US Tax Day, ranking at #122. However, its rank fell later, though it slightly improved to around #140 by November.
Other trends from our overall ranking: Taylor, Beyoncé, GitHub and Spotify’s popularity
Outside the categories we reviewed in the Year in Review, several notable trends emerged in our Overall ranking:
- Taylor Swift’s official site entered our top 500 on August 10 (#464), when she announced her album ‘1989 (Taylor’s Version)‘ in Los Angeles and on social media.
Surprise!! 1989 (Taylor’s Version) is on its way to you 🔜! The 1989 album changed my life in countless ways, and it fills me with such excitement to announce that my version of it will be out October 27th. To be perfectly honest, this is my most FAVORITE re-record I’ve ever done… pic.twitter.com/JFYOWhBxhj
— Taylor Swift (@taylorswift13) August 10, 2023
- Beyoncé’s official site went even higher on our overall ranking than Swift’s. It appeared only on June 15, but reached #346. In the news that day (and the day before), the Financial Times reported that economists at Danske Bank believed that Beyoncé’s decision to start her world tour in Stockholm led to a surge in local hotel prices that resulted in inflation in Sweden, calling it “astonishing for a single event”. At the time, June 15, Beyoncé had a Cologne, Germany, concert, where a fan gender reveal also made the news.
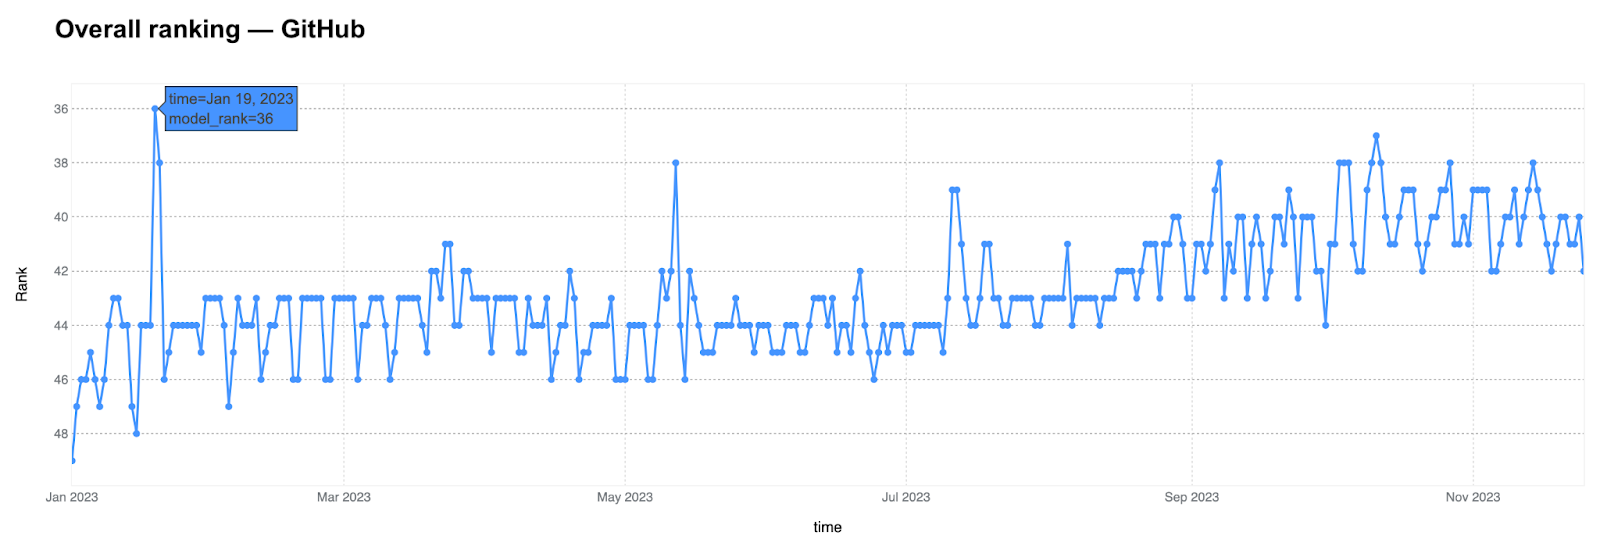
- GitHub is a top 50 site in our Overall ranking, and it showed clear growth in 2023, moving from #49 to #42 in November. It reached its highest point at #36 on January 19, when it announced reaching 100 million developers, and had another peak on May 12 at #38. Have any guesses about what contributed to these peaks (or any of the others you see in our report)? Let us know at @CloudflareRadar.
- Spotify’s best day in 2023 was on Black Friday, November 24, when it reached #57, after showing significant growth throughout November. However, our list ends on November 25, so we couldn’t capture the impact of the recently launched Spotify Wrapped.
- NASA. This year, NASA continued to showcase images from the James Webb Space Telescope. The NASA website peaked in our ranking on October 12 at #160, the day before the scheduled launch of NASA’s Psyche mission, aimed at exploring a unique metal-rich asteroid. Another peak occurred on April 28 at #172, coinciding with a broadcasted spacewalk at the International Space Station.
- SpaceX. SpaceX had its best and only notable days in our ranking (within the overall top 500) on April 17 (#412), followed by April 20 (#416). April 17 marked SpaceX’s Starship orbital flight‘s first attempt, which was aborted just before launch and then resumed on April 20.
- Craigslist. The American classified ads website saw a decline in our ranking this year, with its lowest point in November and its worst day on Black Friday, when it fell to #268.
- DHL. The courier service improved its ranking in 2023, with its best performance in November, peaking on Thanksgiving Day, November 23, in the US at #211.
- NFL (National Football League). The NFL site had its first significant peak on April 29 at #189, the day of the NFL Draft, surpassing even the Super Bowl’s popularity. This peak was matched only by weekends after September 10, when it climbed as high as #160.
- Flightradar24’s most-trafficked day was April 23, when an American Airlines flight made an emergency landing in Ohio due to an engine fire. It rose to #176 on that day.
- Waze. The traffic app had lower rankings between June and early September (summer in the Northern Hemisphere), peaking on March 19 at #142 and on October 2 at #145.
- Tides & Currents. The US Weather Service peaked on August 29-30 at #215 during Hurricane Idalia, described as “an unprecedented event,” as the storm approached Florida’s Gulf Coast.
Wrap up: 2023, shifting AI and e-commerce tides
The Internet plays a role in socializing, entertaining, working, communicating, learning, and staying informed when you most need it. In our popular Internet services rankings, the dominance of giants like Google and Facebook, and the relevance of TikTok and others, underscore the continued influence of established players in shaping online interactions and content consumption. However, the rise of generative AI services, notably OpenAI’s ChatGPT, signals an exciting sector that is rapidly gaining traction. Let’s see where generative AI services can go in 2024.
In the social media realm, X/Twitter seems to be losing some influence in our ranking but continues to be highly influential, and much higher than the direct competition. Mastodon, Threads, and others still have a long way to go to compete. Although not seen as direct microblogging competition, Discord and Reddit continue to show growth.
An emerging player, Temu, made significant strides in the E-commerce realm. In the cryptocurrency space, Binance lost momentum as CoinGecko gained traction. In the gaming and metaverse sectors, the highlights included Roblox’s consistency and Oculus’s growth.
Looking ahead, the trends observed in 2023 set the stage for an even more interconnected and technologically advanced future. The growing importance of AI, the steadfast popularity of social media, and the evolving dynamics in e-commerce and financial services suggest a future where humans will have to continue to adapt to the opportunities and challenges that lie ahead.
Creating rankings is a team effort that comes with its own challenges and requires careful attention and frequent updates. If you want to help us make these categorical rankings better, you can. Feedback is appreciated, including regarding other categories to include in the 2024 Year in Review.
(Our data scientist, Sabina Zejnilovic, played a crucial role in accurately gathering the Internet services data and contributed to this blog post, as did David Belson with his guidance, along with many others.)
Cloudflare 2023 Year in Review
Post Syndicated from David Belson original http://blog.cloudflare.com/radar-2023-year-in-review/

The 2023 Cloudflare Radar Year in Review is our fourth annual review of Internet trends and patterns observed throughout the year at both a global and country/region level across a variety of metrics. Below, we present a summary of key findings, and then explore them in more detail in subsequent sections.
Key findings
Traffic Insights & Trends
- Global Internet traffic grew 25%, in line with peak 2022 growth. Major holidays, severe weather, and intentional shutdowns clearly impacted Internet traffic. 🔗
- Google was again the most popular general Internet service, with 2021 leader TikTok falling to fourth place. OpenAI was the most popular service in the emerging Generative AI category, and Binance remained the most popular Cryptocurrency service. 🔗
- Globally, over two-thirds of mobile device traffic was from Android devices. Android had a >90% share of mobile device traffic in over 25 countries/regions; peak iOS mobile device traffic share was 66%. 🔗
- Global traffic from Starlink nearly tripled in 2023. After initiating service in Brazil in mid-2022, Starlink traffic from that country was up over 17x in 2023. 🔗
- Google Analytics, React, and HubSpot were among the most popular technologies found on top websites. 🔗
- Globally, nearly half of web requests used HTTP/2, with 20% using HTTP/3. 🔗
- NodeJS was the most popular language used for making automated API requests. 🔗
- Googlebot was responsible for the highest volume of request traffic to Cloudflare in 2023. 🔗
Connectivity & Speed
- Over 180 Internet outages were observed around the world in 2023, with many due to government-directed regional and national shutdowns of Internet connectivity. 🔗
- Aggregated across 2023, only a third of IPv6-capable requests worldwide were made over IPv6. In India, however, that share reached 70%. 🔗
- The top 10 countries all had measured average download speeds above 200 Mbps, with Iceland showing the best results across all four measured Internet quality metrics. 🔗
- Over 40% of global traffic comes from mobile devices. In more than 80 countries/regions, the majority of traffic comes from mobile devices. 🔗
Security
- Just under 6% of global traffic was mitigated by Cloudflare’s systems as being potentially malicious or for customer-defined reasons. In the United States, 3.65% of traffic was mitigated, while in South Korea, it was 8.36%. 🔗
- A third of global bot traffic comes from the United States, and over 11% of global bot traffic comes from Amazon Web Services. 🔗
- Globally, Finance was the most attacked industry, but the timing of spikes in mitigated traffic and the target industries varied widely throughout the year and around the world. 🔗
- Even as an older vulnerability, Log4j remained a top target for attacks during 2023. However, HTTP/2 Rapid Reset emerged as a significant new vulnerability, beginning with a flurry of record-breaking attacks. 🔗
- 1.7% of TLS 1.3 traffic is using post-quantum encryption. 🔗
- Deceptive links and extortion attempts were two of the most common types of threats found in malicious email messages. 🔗
- Routing security, measured as the share of RPKI valid routes, improved globally during 2023. Significant growth was observed in countries including Saudi Arabia, the United Arab Emirates, and Vietnam. 🔗
Introduction
Cloudflare Radar launched in September 2020, and in the blog post that announced its availability, we talked about how its intent was to “shine a light on the Internet’s patterns”. Cloudflare’s network currently spans more than 310 cities in over 120 countries/regions, serving an average of over 50 million HTTP(S) requests per second for millions of Internet properties, in addition to handling over 70 million DNS requests per second on average. The data generated by this massive global footprint and scale, combined with data from complementary Cloudflare tools, enables Radar to provide unique near-real time perspectives on the patterns and trends we observe across the Internet. For the last several years (2020, 2021, 2022), we’ve been aggregating these insights into an annual Year In Review, shining a light on the Internet’s patterns over the course of that year. The new Cloudflare Radar 2023 Year In Review continues that tradition, featuring interactive charts, graphs, and maps you can use to explore notable Internet trends observed throughout this past year.
The 2023 Year In Review is organized into three sections: Traffic Insights & Trends, Connectivity & Speed, and Security. We have incorporated several new metrics this year, and have endeavored to keep underlying methodologies consistent with last year wherever possible. Website visualizations shown at a weekly granularity cover the period from January 2 through November 26, 2023. Trends for over 180 countries/regions are available on the website, with some smaller or less populated locations excluded due to insufficient data. Note that some of the metrics are presented only as a worldwide view, and will not be shown if a country/region is selected. Because of the control plane and analytics outage that occurred November 2-4, traffic data for relevant metrics has been interpolated for that three-day period.
Below, we provide an overview of the content contained within the major Year In Review sections (Traffic Insights & Trends, Connectivity & Speed, and Security), along with notable observations and key findings. In addition, we have also published a companion blog post that specifically explores trends seen across Top Internet Services.
However, the notable observations and key findings contained within this post only skim the surface of the unique insights that can be found in the Year in Review website, which we strongly encourage you to visit to explore the data in more detail and look at trends for your country/region. As you do so, we encourage you to consider how the trends presented within these blog posts and the website’s various sections impact your business or organization, and to think about how these insights can inform actions that you can take to improve user experience or enhance your security posture in the future.
Traffic Insights & Trends

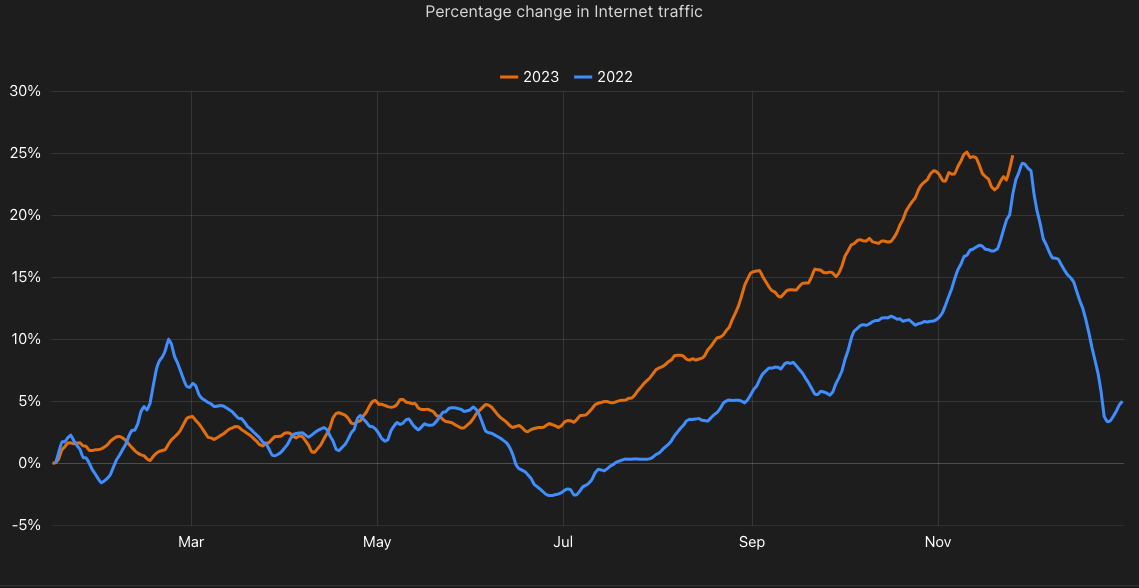
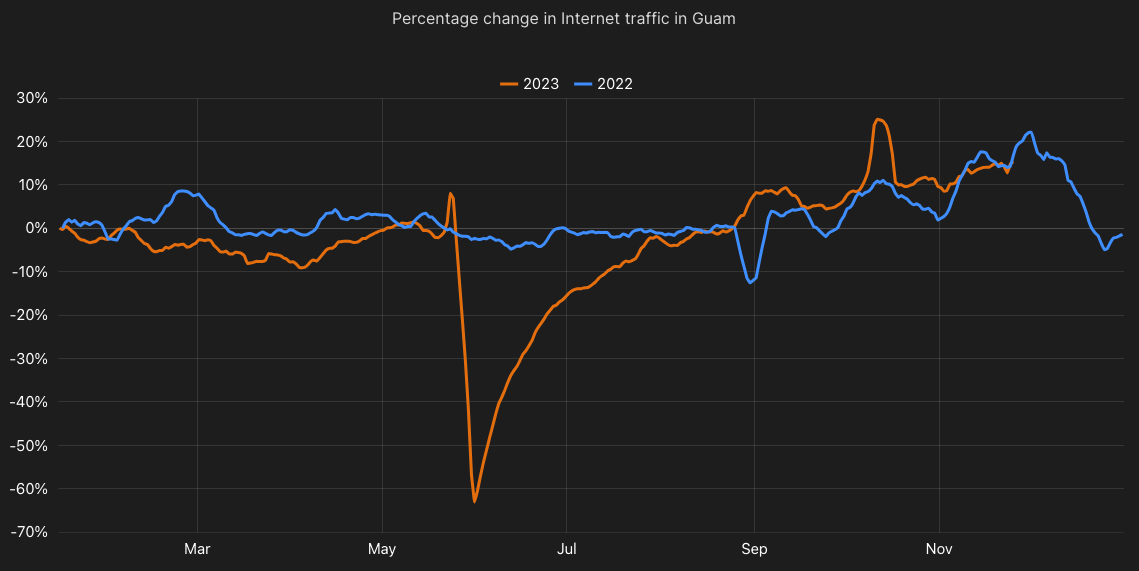
Global Internet traffic grew 25%, in line with peak 2022 growth. Major holidays, severe weather, and intentional shutdowns clearly impacted Internet traffic.
Twenty-five years ago, Worldcom executives claimed that Internet traffic was doubling every 100 days (3.5 months). A quarter-century later, we know that these claims were unrealistically aggressive, but it is clear that the Internet is growing quickly as more and more devices are connected, consuming content from a growing universe of websites, applications, and services.
To determine the traffic trends over time, we first established a baseline, calculated as the average daily traffic volume (excluding bot traffic) over the second full calendar week (January 8-14) of 2023. We chose the second calendar week to allow time for people to get back into their “normal” routines (school, work, etc.) after the winter holidays and New Year’s Day. The percent change shown in our traffic trends chart is calculated relative to the baseline value, and represents a seven-day trailing average — it does not represent absolute traffic volume for a country/region. The seven-day averaging is done to smooth the sharp changes seen with a daily granularity. A trend line for 2022 is shown for comparison purposes.
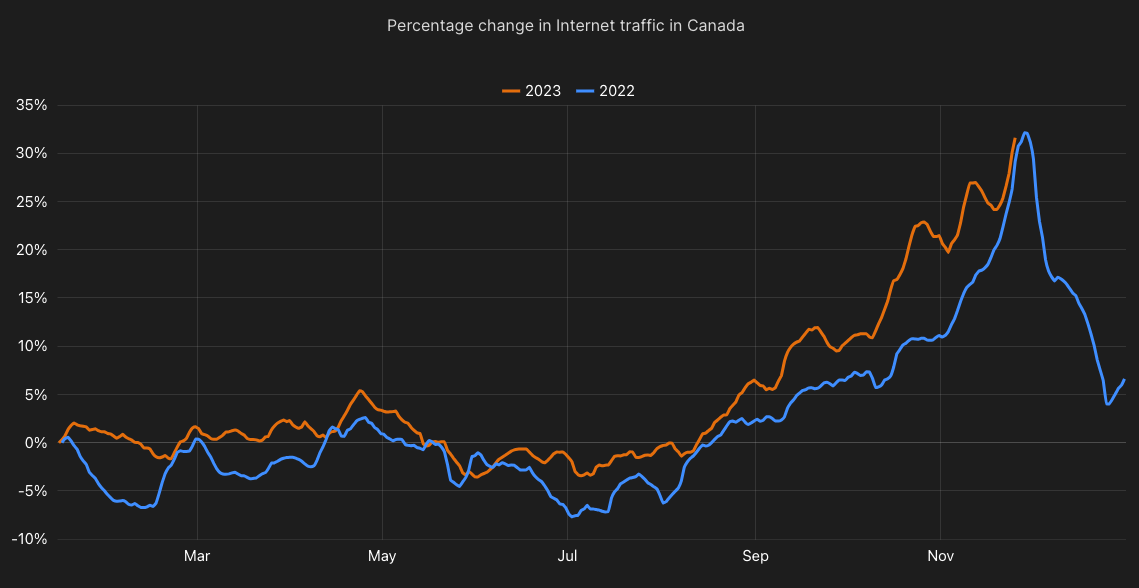
Our data shows that globally, Internet traffic grew 25% in 2023, with nominal initial growth accelerating during the second half of the year. Overall, the pattern is similar to that observed in 2022 (excepting last year’s late February spike), and peak growth for the year is just slightly above the peak growth level seen in 2022. Traffic patterns in Canada were also rather consistent year-over-year, exhibiting similar seasonality, and peak growth above 30% in both 2022 and 2023. In many countries, the 2022 trend line shows a clear drop in traffic heading into the Christmas holiday, with a slight rebound ahead of New Year’s Day. It will be interesting to see if traffic follows this pattern in 2023 as well.
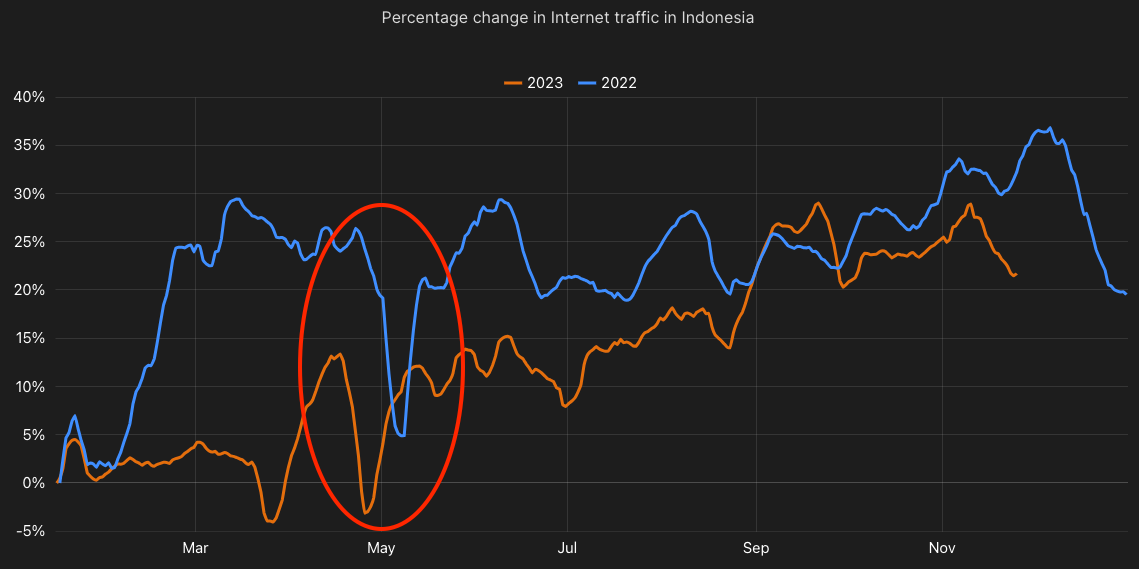
Comparisons with 2022 traffic trends helps make the impact of major holidays on Internet traffic more visible. For example, in Muslim countries including Indonesia, Turkey, and the United Arab Emirates, the celebration of Eid-Ul-Fitr, the festival marking the end of the fast of Ramadan, is visible as a noticeable drop in traffic around April 21-23, 2023, just before a similar drop visible in the 2022 trend line during last year’s celebration on May 2-3. In Italy, a drop in traffic is clearly visible around Pasqua di Resurrezione and Lunedì dell’Angelo (Easter Sunday and Monday) on April 9-10, one week ahead of a similar drop in traffic in 2022
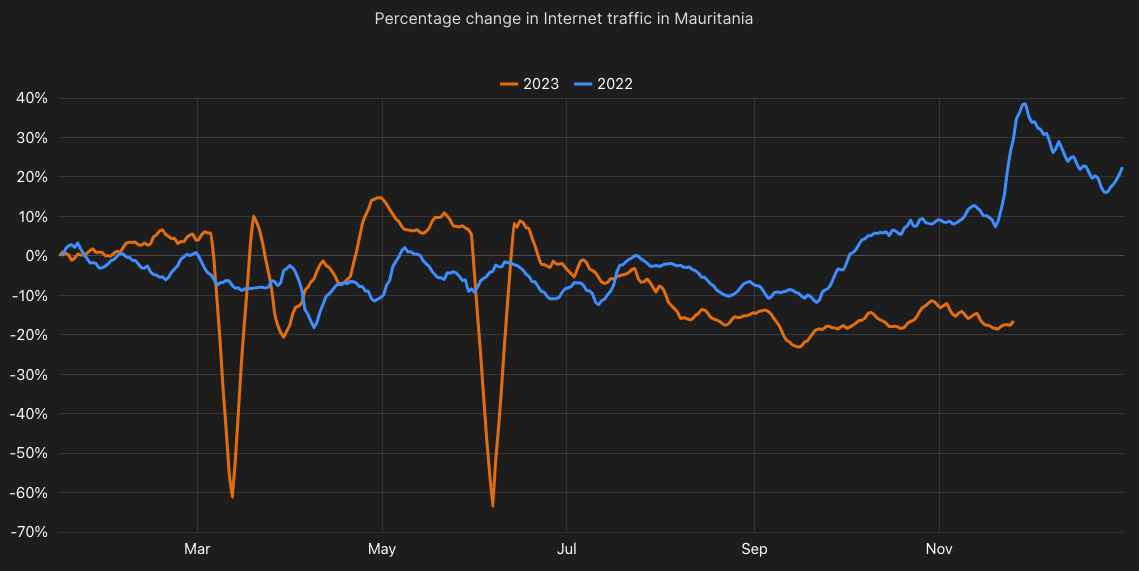
In addition, extended disruptions to Internet connectivity are also clearly visible within the traffic trend charts. Examples include Mauritania, where government-directed shutdowns occurred from March 6-12 and May 30 – June 6, and Gabon, where a shutdown was in place from August 26-30, as well as Guam, where Super Typhoon Mawar caused a multi-week drop in traffic starting on May 24.
Google was again the most popular general Internet service, with 2021 leader TikTok falling to fourth place. OpenAI was the most popular service in the emerging Generative AI category, and Binance remained the most popular Cryptocurrency service.
One of the most popular sections of the Year In Review over the last several years has been the exploration of the most popular Internet services, both generally and across a number of categories. These rankings of service popularity are based on analysis of anonymized query data of traffic to our 1.1.1.1 public DNS resolver from millions of users around the world. Although DNS resolution operates at a domain level, domains that belong to a single Internet service are grouped together for the purposes of these rankings.
In the overall category, Google once again held the top spot, owing in part to its broad portfolio of services as well as the popularity of the Android mobile operating system. In addition to perennial categories like e-commerce, video streaming, and messaging, this year we also looked at Generative AI, which has been on a meteoric rise in 2023. In this category, OpenAI held the top spot, building on the success and popularity of ChatGPT, which it launched only a year ago. And despite the turmoil seen in the cryptocurrency space this year, Binance remained the most popular service in that category.
We explore these categorical rankings, as well as trends seen by specific services, in more detail in a separate blog post.
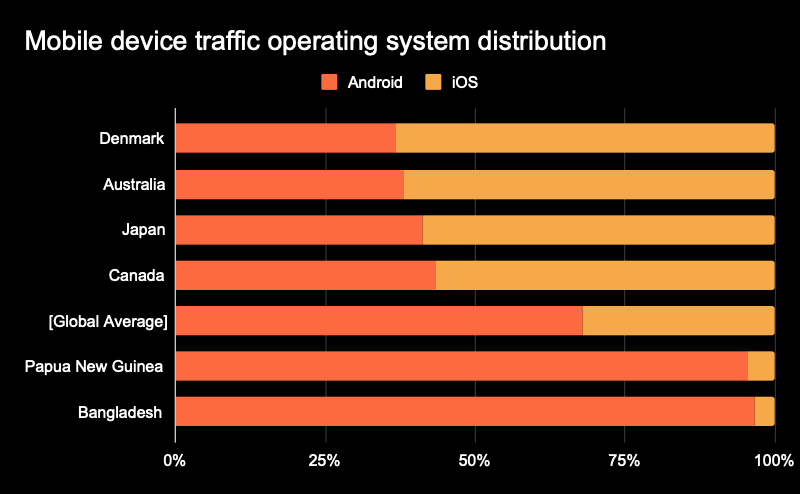
Globally, over two-thirds of mobile device traffic was from Android devices. Android had a >90% share of mobile device traffic in over 25 countries/regions; peak iOS mobile device traffic share was 66%.
Apple’s iOS and Google’s Android are the two leading operating systems used on mobile devices, and analysis of information in the user agent reported with each request allows us to gain insight into the distribution of traffic by client operating system throughout the year. Given the wide range of both devices and price points for Android devices, it is not surprising that Android is responsible for the majority of mobile device traffic when aggregated globally.
Globally, over two-thirds of mobile device traffic was from Android devices. The split is in line with Android/iOS usage observed in 2022. When looking at the countries/regions with the highest levels of Android usage, we find Bangladesh and Papua New Guinea at the top of the list, both with over 95% of mobile device traffic coming from Android devices. Looking more closely at other countries that see particularly high levels of Android usage, it is interesting to note that they are largely in Africa, Oceania/Asia, and South America, and that many have lower levels of gross national income per capita. This is presumably where the availability of lower priced “budget” phones plays to Android’s advantage from an adoption perspective.
In contrast, while the share of mobile device traffic from iOS at a country/region level never tops 70%, many of the countries with an iOS share over 50%, including Denmark, Australia, Japan, and Canada, have comparatively higher gross national income per capita, which likely speaks to a greater ability to afford higher priced devices.
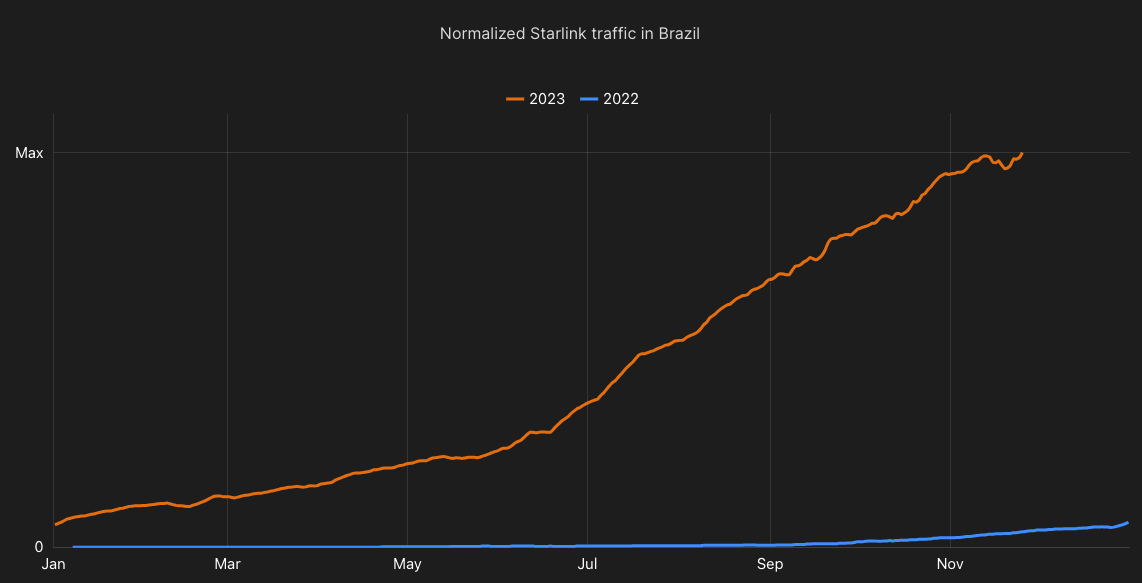
Global traffic from Starlink nearly tripled in 2023. After initiating service in Brazil in mid-2022, Starlink traffic from that country was up over 17x in 2023.
SpaceX’s Starlink high-speed satellite Internet service has continued to rapidly grow its footprint since launching in 2019, making high performance Internet connections available in many countries/regions that were previously unserved or underserved by traditional wired or wireless broadband. The current leader in the space, in the future it will be joined by Amazon’s Project Kuiper service, which launched its first two test satellites this year, as well as Eutelsat OneWeb, which grew its satellite constellation in 2023 as well.
To track the growth in usage and availability of Starlink’s service, we analyzed aggregate Cloudflare traffic volumes associated with the service’s autonomous system (AS14593) throughout 2023. Although Starlink is not yet available globally, we did see traffic growth across a number of countries/regions. The request volume shown on the trend line in the chart represents a seven-day trailing average. A trend line for 2022 is shown for comparison purposes, and is scaled to the maximum value across 2022 and 2023.
Globally, we saw Starlink traffic more than triple this year. In the United States, traffic from Starlink was up over 2.5x, and grew over 17x in Brazil. In countries where Starlink turned up service in 2023, including Kenya, the Philippines, and Zambia, we saw traffic grow rapidly once the service became available.
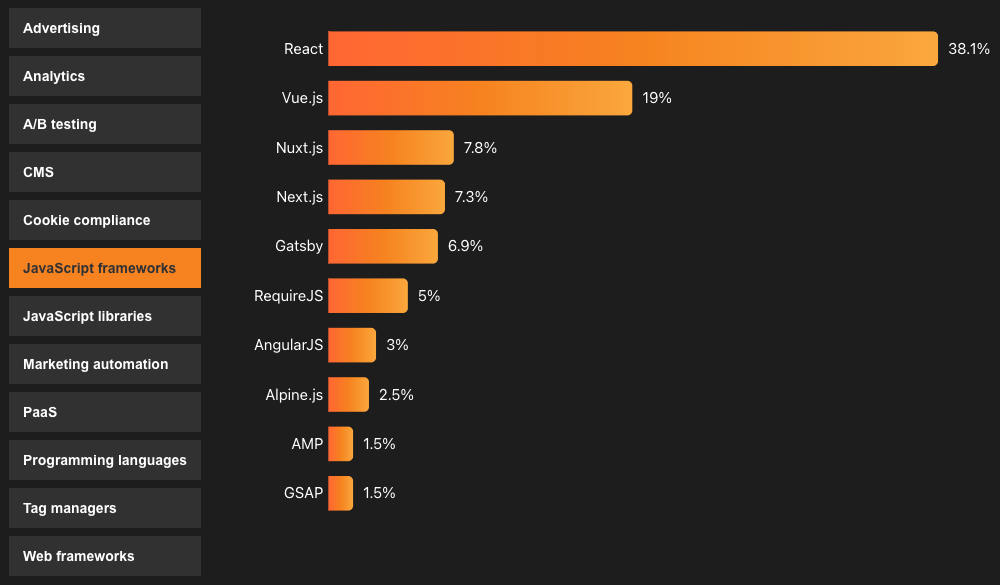
Google Analytics, React, and HubSpot were among the most popular technologies found on top websites.
Modern websites are complex productions, relying on a mix of frameworks, platforms, services, and tools, and the developer community is responsible for making them coexist with one another to deliver a seamless experience. Using the Cloudflare Radar URL Scanner, which we launched in March 2023, we scanned websites associated with the top 5000 domains to identify the most popular technologies and services used across a dozen different categories, including (but not limited to) Analytics, where Google Analytics was by far the most widely used; JavaScript Frameworks, where React had a commanding lead; and Marketing Automation providers, where leader HubSpot was closely followed by several competitors.
Globally, nearly half of web requests used HTTP/2, with 20% using HTTP/3.
HTTP (HyperText Transfer Protocol) is the core protocol that the web relies upon. HTTP/1.0 was first standardized in 1996, HTTP/1.1 in 1999, and HTTP/2 in 2015. The most recent version, HTTP/3, was completed in 2022, and runs on top of QUIC, a new transport protocol. On the client side, HTTP/3 support is enabled by default in the latest versions of desktop and mobile Google Chrome and Mozilla Firefox, and for a portion of Apple Safari users. HTTP/3 is available for free for all Cloudflare customers, though not every customer chooses to enable it.
Using QUIC allows HTTP/3 to deliver improved performance by mitigating the effects of packet loss and network changes, as well as establishing connections more quickly. It also provides encryption by default, mitigating the risk of attacks. Websites and applications that remain on older versions of HTTP miss out on these benefits.
Analysis of the HTTP version negotiated for each request allows us to gain insight into the distribution of traffic by the various versions of the protocol aggregated throughout the year. (“HTTP/1.x” aggregates requests made over HTTP/1.0 and HTTP/1.1.) At a global level, 20% of requests were made over the latest version, HTTP/3. Another third of requests were made over the comparatively ancient HTTP/1.x versions, while HTTP/2 remained dominant, and accounted for the 47% balance.

Looking at the version distribution geographically, we found a number of Asian countries, including Nepal, Thailand, Malaysia, and Sri Lanka among those with highest rates of HTTP/3 usage, although these rates did not exceed 35%. In contrast, more than half of the requests from ten countries, including Ireland, Albania, Finland, and China, were made over HTTP/1.x during 2023.
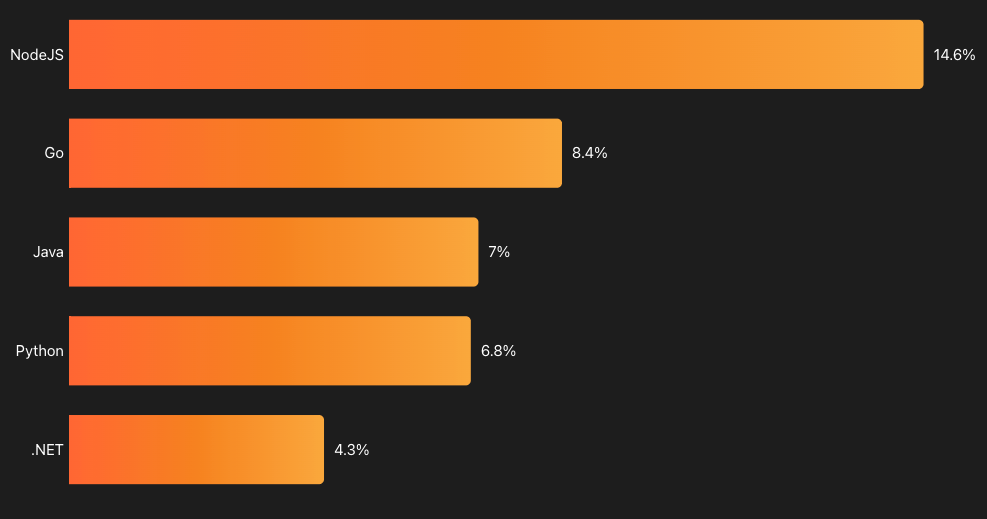
NodeJS was the most popular language used for making automated API requests.
In addition, as developers increasingly use automated API calls to power dynamic websites and applications, we can use our unique visibility into Web traffic to identify the top languages these API clients are written in. Looking at API-related requests determined to not be coming from a person using a browser or native mobile application, we applied heuristics to help identify the language used to build the client.
Our analysis found that almost 15% of automated API requests are made by NodeJS clients, with Go, Java, Python, and .NET holding smaller shares.
Googlebot was responsible for the highest volume of request traffic to Cloudflare in 2023.
Cloudflare Radar enables users to see Internet traffic trends at a country/region or network level over a selected period of time. However, we wanted to zoom out a bit, and look at the traffic Cloudflare saw from the entire IPv4 Internet over the course of the entire year. Hilbert curves, as “continuous space-filling curves”, have properties that are useful for visualizing the Internet’s IPv4 address space.
Using a Hilbert curve visualization, we can visualize aggregated request traffic (over IPv4) to Cloudflare from January 1st through November 26th, 2023. In order to make the amount of data used for the visualization manageable, IP addresses are aggregated at a /20 level, meaning that at the highest zoom level, each cell represents traffic from 4096 IPv4 addresses. (The sheer size of the IPv6 address space would make associated traffic very hard to see in such a visualization, especially as such a small amount has been allocated for assignment by the Regional Internet Registries.)
Within the visualization, IP addresses are grouped by ownership, and for much of the IP address space shown there, a mouseover at the default zoom level will show the Regional Internet Registry (RIR) that the address block belongs to. However, there are also a number of blocks that were assigned prior to the existence of the RIR system, and for these, they are labeled with the name of the organization that owns them. Progressive zooming ultimately shows the autonomous system and country/region that the IP address block is associated with, as well as its share of traffic relative to the maximum. (If a country/region is selected, only the IP address blocks associated with that location are visible.) Overall traffic shares are indicated by shading based on a color scale, and although a number of large unshaded blocks are visible, this does not necessarily mean that the associated address space is unused, but rather that it may be used in a way that does not generate traffic to Cloudflare.
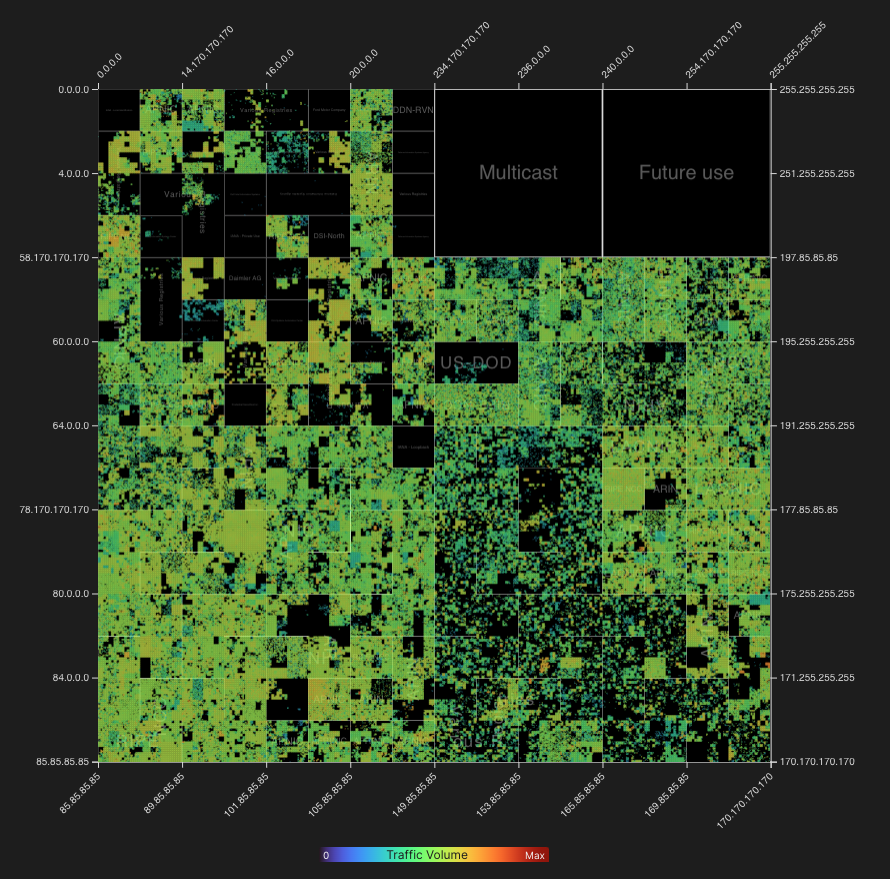
Areas of higher request volume, indicated by warmer orange/red shading, are visibly scattered throughout the plot, but the IP address block that had the maximum request volume to Cloudflare during 2023 was 66.249.64.0/20, which belongs to Google. This IP address block is one of several used by the Googlebot web crawler, which is a likely explanation for the high request volume, given the number of web properties on Cloudflare’s network.
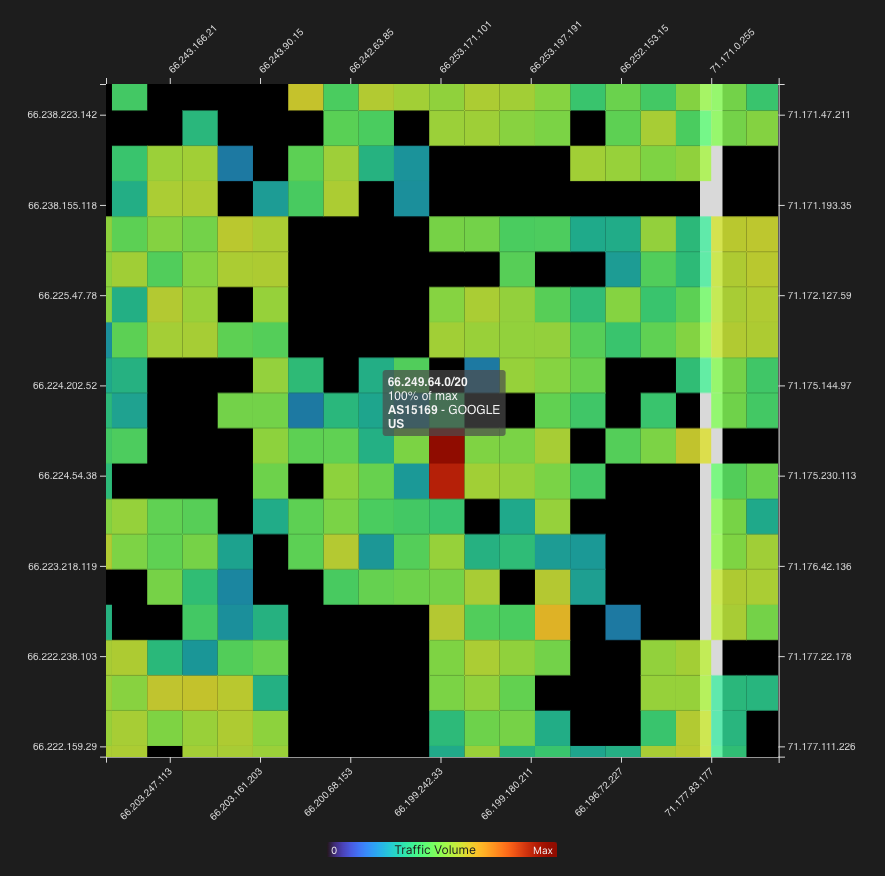
It is hard to do this visualization justice with a short summary and static screenshot. To explore it in more detail, we encourage you to go to the Year in Review website and explore it by dragging and zooming to move around the IPv4 Internet.
Connectivity & Speed

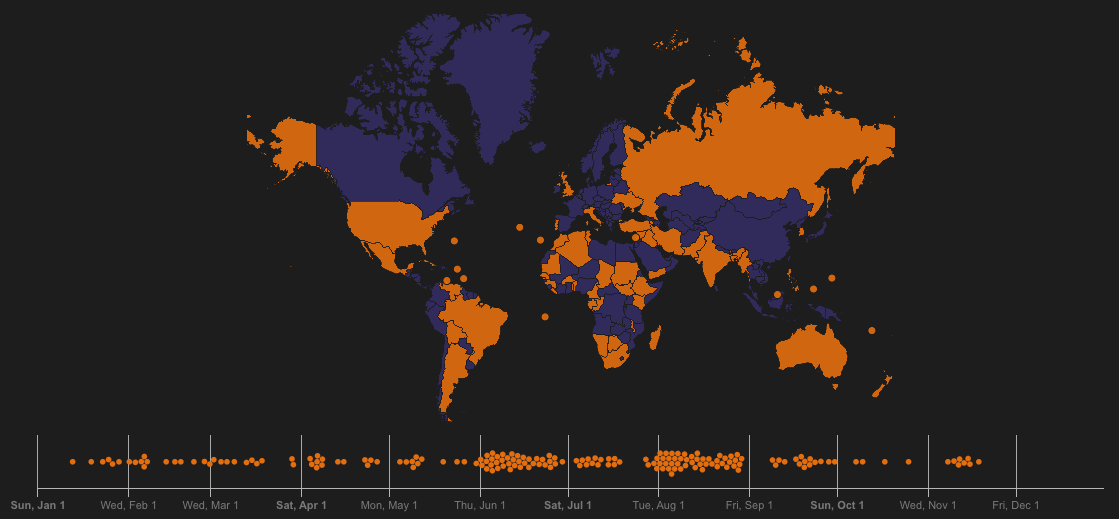
Over 180 Internet outages were observed around the world in 2023, with many due to government-directed regional and national shutdowns of Internet connectivity.
During 2023, we have written frequently about Internet outages, whether due to technical issues, government-directed shutdowns, or geopolitical conflict, as well as infrastructure resilience issues (including fiber cuts, power outages, and severe weather) highlighted in our quarterly summaries. The impacts of these outages can be significant, including significant economic losses and severely limited communications. The Cloudflare Radar Outage Center tracks these Internet outages, and uses Cloudflare traffic data for insights into their scope and duration.
Some of these outages seen through the year were short-lived, lasting just a couple of hours, while others have stretched on for multiple months. In the latter category, localized government-directed shutdowns in Manipur, India and Amhara, Ethiopia have lasted over seven and four months respectively (as of early December). In the former category, Iraq frequently experienced multi-hour nationwide Internet shutdowns intended to prevent cheating on academic exams — these contribute to the clustering visible in the timeline during June, July, and August.
Within the timeline on the Year in Review website, mousing over a dot will display metadata about that outage, and clicking on it will open a page with additional information. If a country/region is selected, only outages for that country will be displayed.
Aggregated across 2023, only a third of IPv6-capable requests worldwide were made over IPv6. In India, however, that share reached 70%.
IPv6 has been around in some fashion since 1998, with an expanded address space that better supports the universe of Internet-connected devices that has grown exponentially over the last quarter-century. And over that time, available IPv4 space has been exhausted, leading connectivity providers to resort to solutions like Network Address Translation, and cloud and hosting providers to acquire blocks of IPv4 address space for as much as $50 per address. IPv6 also brings a number of other benefits to network providers, and if implemented correctly, adoption should be transparent from an end user perspective.
Cloudflare has been a vocal and active advocate for IPv6 stretching all the way back to our first birthday in 2011, when we announced our Automatic IPv6 Gateway, which enabled free IPv6 support for all of our customers. Just a few years later, we enabled IPv6 support by default for all of our customers. (Although it is enabled by default, not all customers choose to keep it enabled for a variety of reasons.) However, this support is only half of the equation for driving IPv6 adoption, as end user connections need to support it as well. (Technically, it is a bit more complex than that, but those are the two foundational requirements.) Analysis of the IP version used for each request made to Cloudflare allows us to gain insight into the distribution of traffic by the various versions of the protocol, aggregated throughout the year.
Thanks to near-complete IPv6 adoption by Indian telecommunications provider Reliance Jio, 70% of dual-stacked requests from Indian users were made via IPv6. India was followed closely by Malaysia, where 66% of dual-stacked requests were made over IPv6 during 2023, thanks to strong IPv6 adoption rates across leading Internet providers within the country. Other countries that saw more than half of dual-stacked requests, on average, made over IPv6 include Saudi Arabia, Vietnam, Greece, France, Uruguay, and Thailand. In contrast, there were on the order of 40 countries/regions where less than 1% of dual-stacked requests were made over IPv6 during 2023. Lagging adoption across such a large cohort of countries/regions 25 years after IPv6 was first published as a draft standard is quite surprising.

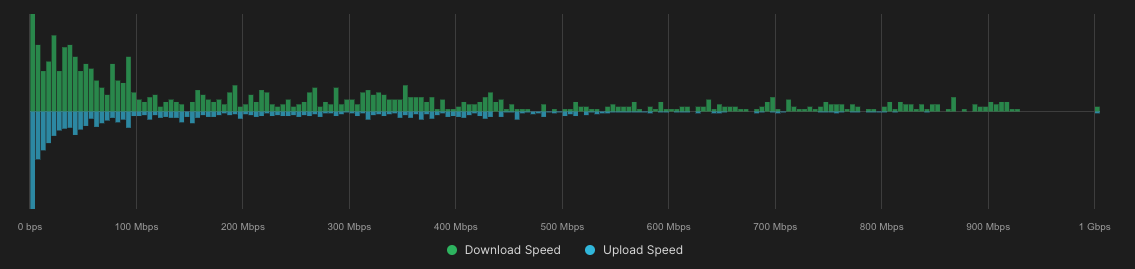
The top 10 countries all had measured average download speeds above 200 Mbps, with Iceland showing the best results across all four measured Internet quality metrics.
Even when they are not facing Internet outages, users around the world are often contending with poor performance on their Internet connections, whether due to low speeds, high latency, or a combination of these factors. Although Internet providers continue to evolve their service portfolios to offer increased connection speeds and reduced latency in order to support growth in use cases like online gaming and videoconferencing, consumer adoption is often mixed due to cost, availability, or other issues. By aggregating the results of speed.cloudflare.com tests taken during 2023, we can get a geographic perspective on connection quality metrics including average download and upload speeds, and average idle and loaded latencies, as well as the distribution of the measurements.
In Iceland, over 85% of all Internet connections are over fiber, and this is reflected in its ranking as the country with the best overall Internet quality metrics, as speed test results show that providers there deliver the highest average speeds (282.5 Mbps download, 179.9 Mbps upload) and lowest average latencies (9.6 ms idle, 77.1 ms loaded). The histogram below shows that while there is a large cluster of download speeds between 0–100 Mbps, there were also a significant number of tests that measured even higher speeds, including some in excess of 1 Gbps.
Western European countries including Spain, Portugal, and Denmark also ranked among the top 10 across multiple Internet quality metrics.
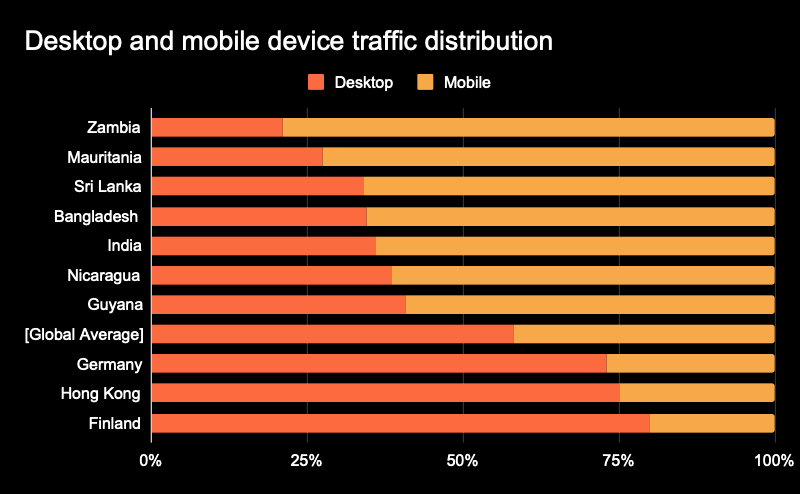
Over 40% of global traffic comes from mobile devices. In more than 80 countries/regions, the majority of traffic comes from mobile devices.
Over the last 15 years or so, mobile devices have become increasingly ubiquitous, becoming indispensable in both our personal and professional lives, thanks in large part to their ability to enable us to access the Internet from nearly anywhere at any time. In some countries/regions, mobile devices primarily connect to the Internet via Wi-Fi, while others are “mobile first”, where Internet access is primarily through 4G/5G services.
Analysis of information contained with the user agent reported with each request to Cloudflare enables us to categorize it as coming from a mobile, desktop, or other type of device. Aggregating this categorization throughout the year at a global level, we found that 42% of traffic came from mobile devices, with 58% coming from desktop devices such as laptops and “classic” PCs. These traffic shares were in line with those measured in 2022. 79% of traffic came from mobile devices in Zambia, making it the country with the largest mobile device traffic share in 2023. Other countries/regions that had more than 50% of traffic come from mobile devices were concentrated in the Middle East/Africa, the Asia Pacific Region, and South/Central America. In contrast, Finland had one of the highest shares of desktop device traffic, at 80%.
Security

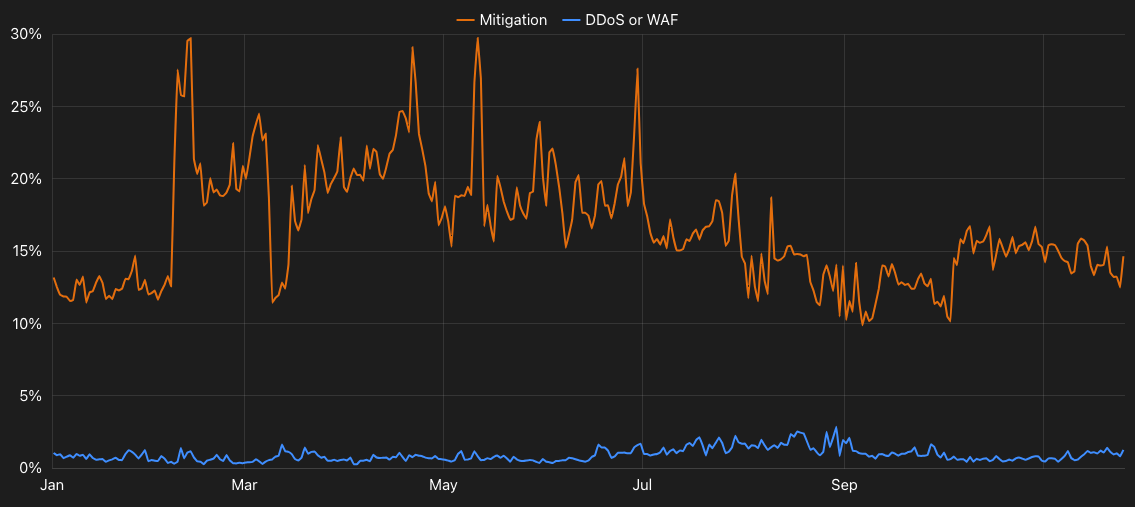
Just under 6% of global traffic was mitigated by Cloudflare’s systems as being potentially malicious or for customer-defined reasons. In the United States, 3.65% of traffic was mitigated, while in South Korea, it was 8.36%.
Malicious bots are often used to attack websites and applications. To protect customers from these threats, Cloudflare mitigates (blocks) this attack traffic using DDoS mitigation techniques or Web Application Firewall (WAF) Managed Rules. However, customers may also choose to have Cloudflare mitigate traffic using other techniques for a variety of other reasons, such as rate-limiting requests, or blocking all traffic from a given location, even if it isn’t malicious. Analyzing traffic to Cloudflare’s network seen throughout 2023, we looked at the overall share that was mitigated (for any reason), as well as the share that was mitigated as a DDoS attack or by WAF Managed Rules.
Overall, just under 6% of global traffic was mitigated by Cloudflare’s systems as being potentially malicious or for customer-defined reasons, while only around 2% of it saw DDoS/Managed WAF mitigations. Some countries, such as Bermuda, saw the percentages for the two metrics track very closely, while other countries, like Pakistan and South Africa showed much larger gaps between their trend lines.
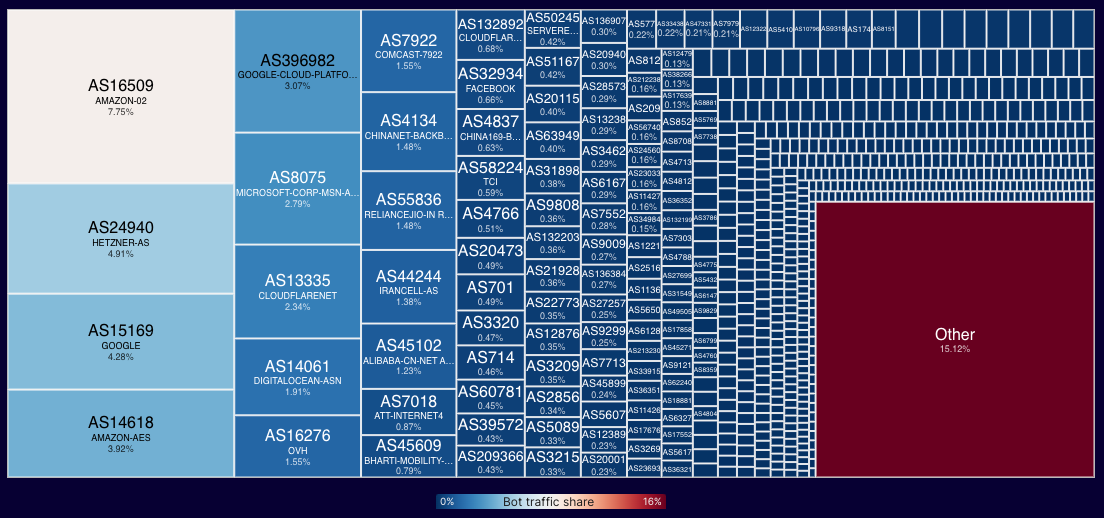
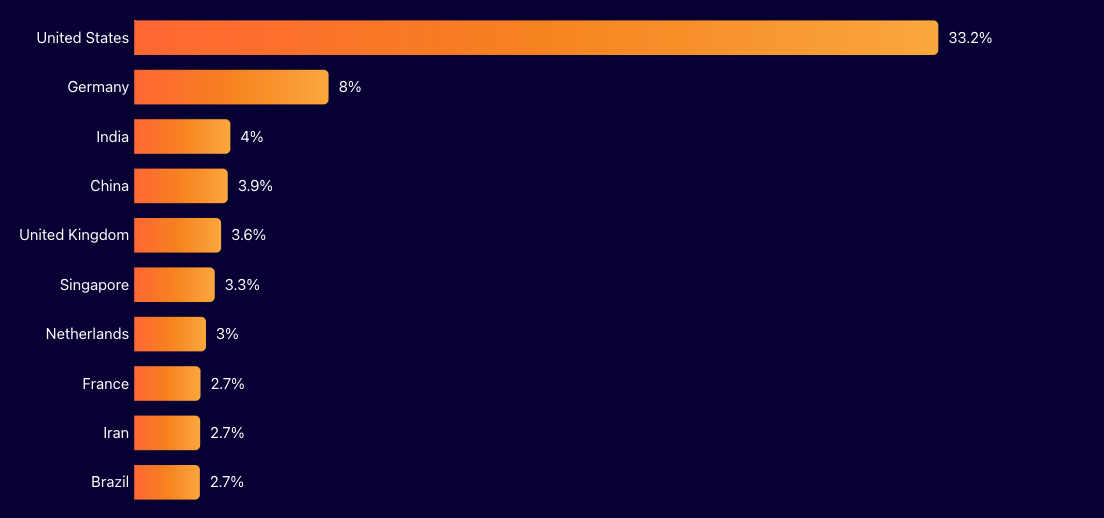
A third of global bot traffic comes from the United States, and over 11% of global bot traffic comes from Amazon Web Services.
Bot traffic describes any non-human Internet traffic, and monitoring bot traffic levels can help site and application owners spot potentially malicious activity. Of course, bots can be helpful too, and Cloudflare maintains a list of verified bots to help keep the Internet healthy. Verified bots include those used for things like search engine indexing, performance testing, and availability monitoring. Regardless of intent, we wanted to look at where bot traffic was coming from, and we can use the IP address of a request to identify the network (autonomous system) and country/region associated with the bot making the request. Perhaps unsurprisingly, we found that cloud platforms were among the leading sources of bot traffic. This is likely due to the ease of automating the provisioning/teardown of compute resources and the relatively low cost of doing so, the distributed geographic footprint of cloud platforms, and the availability of high-bandwidth connections.
Globally, nearly 12% of bot traffic comes from Amazon Web Services, and over 7% from Google. Some of it comes from consumer ISPs as well, with U.S. broadband provider Comcast originating over 1.5% of global bot traffic. A disproportionate amount of bot traffic originates from the United States, responsible for nearly a third of global bot traffic, four times that of Germany, which originates just 8%. Within the United States, Amazon’s total share of bot traffic just edges out Google’s.
Globally, Finance was the most attacked industry, but the timing of spikes in mitigated traffic and the target industries varied widely throughout the year and around the world.
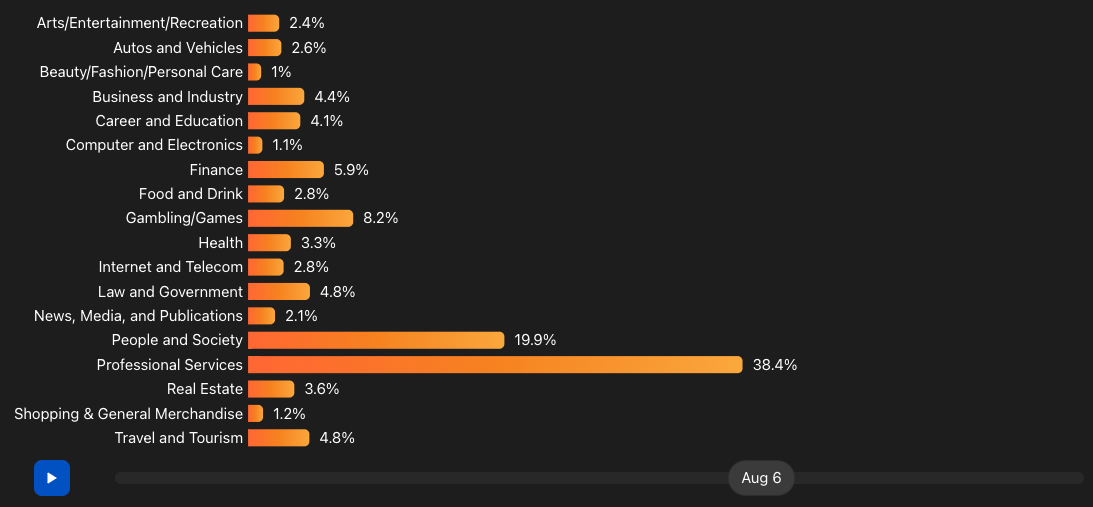
The industries targeted by attacks often shift over time, depending on the intent of the attackers. They may be trying to cause financial harm by attacking ecommerce sites during a busy shopping period, or they may be trying to make a political statement by attacking government-related sites. To identify industry-targeted attack activity during 2023, we analyzed mitigated traffic for customers that had an associated industry and vertical within their customer record. Mitigated traffic was aggregated weekly by source country/region across 18 target industries.
At a global level, Finance organizations were the most attacked over the course of the year, though we saw a significant amount of volatility from week-to-week. Interestingly, some clustering was evident, as Finance, which includes organizations that provide websites and applications for mobile payments, investments/trading, and cryptocurrency, was also a top target for a number of European countries, including Austria, Switzerland, France, the United Kingdom, Ireland, Italy, and the Netherlands, as well as in North America, for Canada, the United States, and Mexico. The Health industry, which includes companies that make exercise equipment, as well medical testing device manufacturers, was a top target across multiple African countries, including Benin, Côte d’Ivoire, Cameroon, Ethiopia, Senegal, and Somalia.
Overall, however, the year started slowly, with no industry seeing more than 8% of traffic being mitigated. As the first quarter progressed, Professional Services and News/Media/Publications organizations saw spikes in the share of mitigated traffic later in January, with Health jumping in mid-February and Law & Government organizations seeing a sharp increase in mitigated traffic in early March. Customers in the Arts/Entertainment/Recreation industry classification were apparently targeted by a multi-week attack campaign, with more than 20% of traffic mitigated during the weeks of March 26, April 2, and April 9. The overall peak during the year was experienced by the Professional Services industry, which saw a mitigated traffic share of 38.4% for the week of August 6, nearly twice its January spike. The timing of spikes and the industries experiencing those spikes varied widely across countries/regions.
Even as an older vulnerability, Log4j remained a top target for attacks during 2023. However, HTTP/2 Rapid Reset emerged as a significant new vulnerability, beginning with a flurry of record-breaking attacks.
In August 2023, we published a blog post that explored traffic seen by Cloudflare for the most commonly exploited vulnerabilities of 2022, as listed in a joint Cybersecurity Advisory. These included vulnerabilities in the Log4j Java-based logging utility, Microsoft Exchange, Atlassian’s Confluence platform, VMWare, and F5’s BIG-IP traffic management system. Although these are older vulnerabilities, attackers continued to actively target and exploit them throughout 2023, in part because organizations are frequently slow to follow the recommendations outlined in the Cybersecurity Advisory. We updated the analysis done for our blog post to include just the attack activity seen in 2023.
Attack activity by vulnerability varied by location, and in some, attacks targeted only a subset of the vulnerabilities. Aggregated worldwide, attack volume targeting Log4j consistently dwarfed that seen for the other vulnerabilities, and saw spikes during the last week of October and mid-late November; attack activity targeting Atlassian vulnerabilities increased in late July and trended slowly higher through the rest of the year. At a country/region level, Log4j was generally the most targeted vulnerability. In countries including France, Germany, India, and the United States, associated attack volume remained at a significant level throughout the year, while in other countries/regions, these attacks are most visible as infrequent, short-lived spikes within a country/region’s graphs, punctuating otherwise low levels of attack volume.
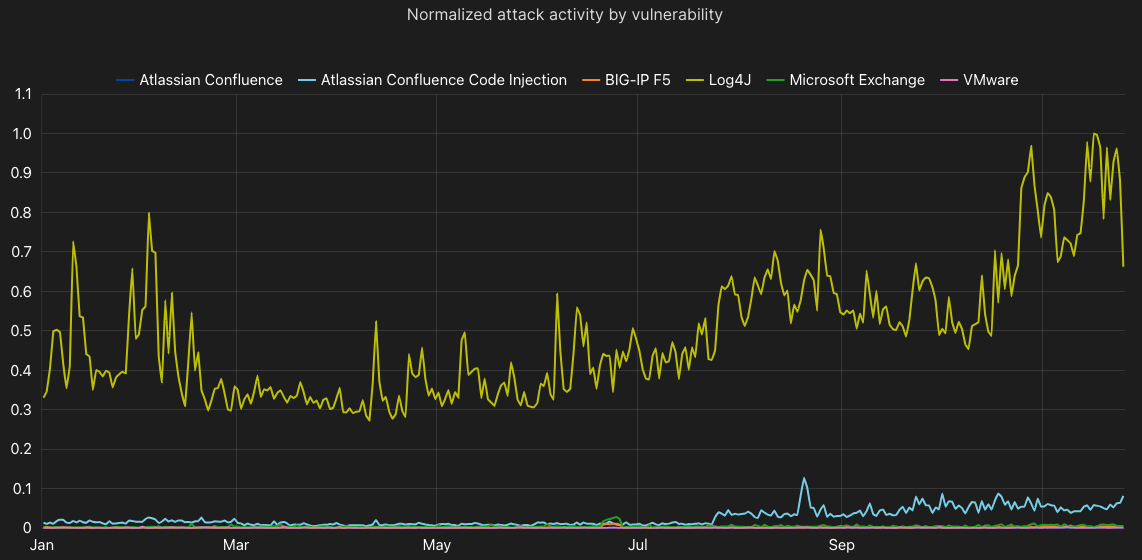
We also expect that through 2024, attackers will continue to target the HTTP/2 Rapid Reset vulnerability disclosed in October. The vulnerability (see CVE-2023-44487 for details) abuses an underlying weakness in the request cancellation feature of the HTTP/2 protocol, leading to resource exhaustion on the target web/proxy server. Between the end of August and the beginning of October, we saw a number of attacks targeting this vulnerability. Across this set of attacks, the average attack rate was 30M requests per second (rps), with nearly 90 peaking above 100M rps, and the largest one hitting 201M rps. This largest attack was nearly 3x bigger than our previous biggest attack on record.
One notable concern about this vulnerability is that the attacker was able to generate such a large attack with a botnet consisting of just 20,000 compromised systems. This is much smaller than some of the largest botnets today, which comprise hundreds of thousands or millions of hosts. With average web traffic estimated to be between 1–3 billion requests per second, attacks using this method could conceivably focus an entire web’s worth of requests on a few unsuspecting targets.
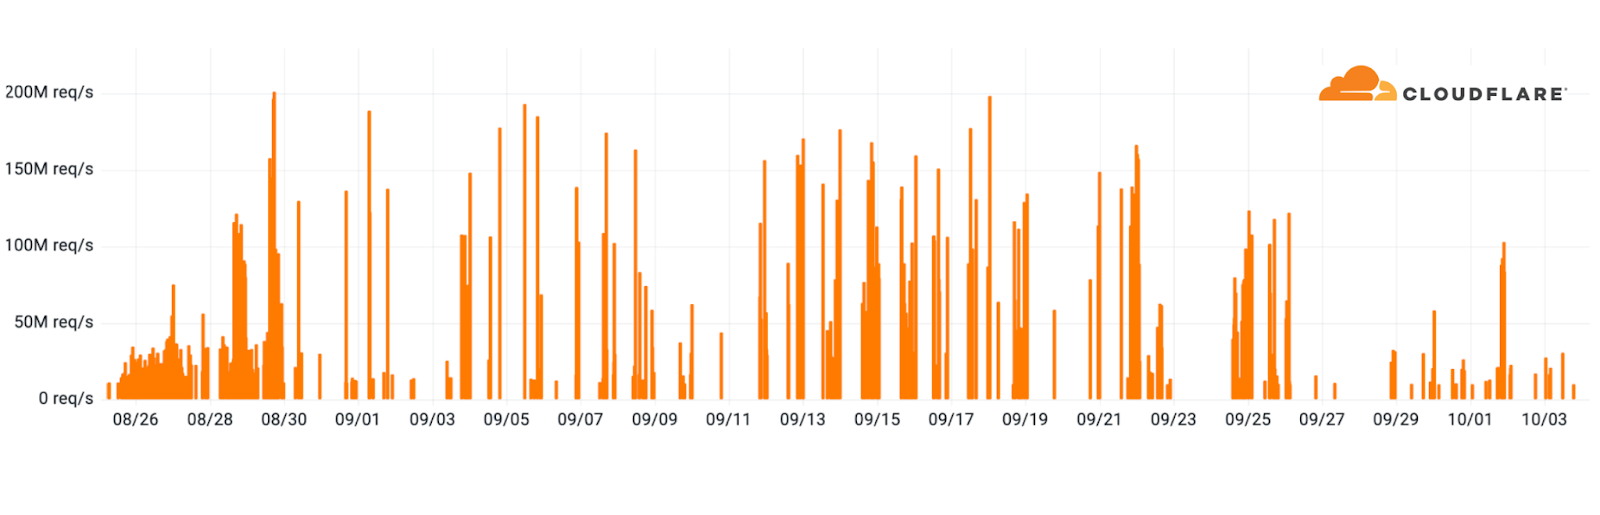
1.7% of TLS 1.3 traffic is using post-quantum encryption
Post-quantum refers to a new set of cryptographic techniques that can protect data from adversaries with the ability to capture and store today’s data for decryption by sufficiently powerful quantum computers in the future. The Cloudflare Research team has been exploring post-quantum cryptography since 2017.
In October 2022, we enabled post-quantum key agreement at our edge by default, but use of it requires that the browser support it as well. Google’s Chrome browser started to slowly enable support in August 2023, and we expect its support will continue to grow in 2024, and that other browsers will add support over time as well. In September 2023, we announced general availability of post-quantum cryptography for both inbound and outbound connections and for many internal services, and expect to finish upgrading all internal services by the end of 2024.
After first enabling support in August, Chrome began ramping the number of browsers (version 116 and later) that use post-quantum cryptography, resulting in gradual growth leading to the significant increase seen on November 8. These actions helped push the share of TLS 1.3 traffic using post-quantum encryption to 1.7% at the end of November. As this ramp continues with future Chrome updates, and as other browsers add support for post-quantum encryption, we expect this share to continue to grow rapidly in 2024.
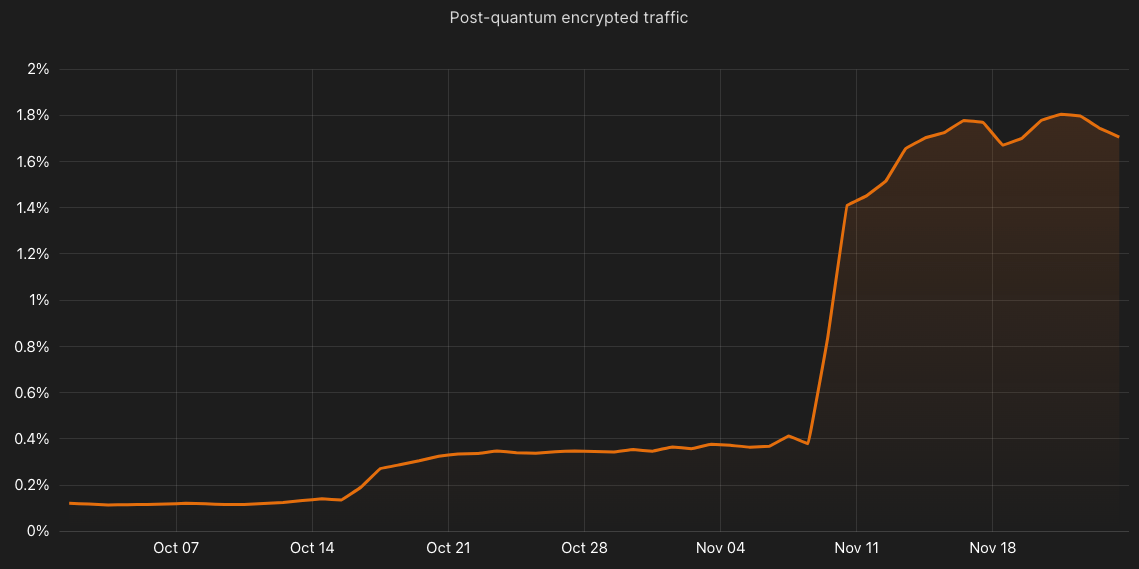
Deceptive links and extortion attempts were two of the most common types of threats found in malicious email messages.
As the #1 business application, email represents a very attractive entry point into enterprise networks for attackers. Targeted malicious emails may attempt to impersonate an otherwise legitimate sender, try to get the user to click on a deceptive link, or contain a dangerous attachment, among other types of threats. Cloudflare Area 1 Email Security protects customers from email-based attacks, including those carried out through targeted malicious email messages. Over the course of 2023, an average of 2.65% of emails analyzed by Cloudflare Area 1 were found to be malicious. Aggregated at a weekly level, spikes to over 3.5%, 4.5%, and over 5% were seen in early February, early September, and late October respectively.
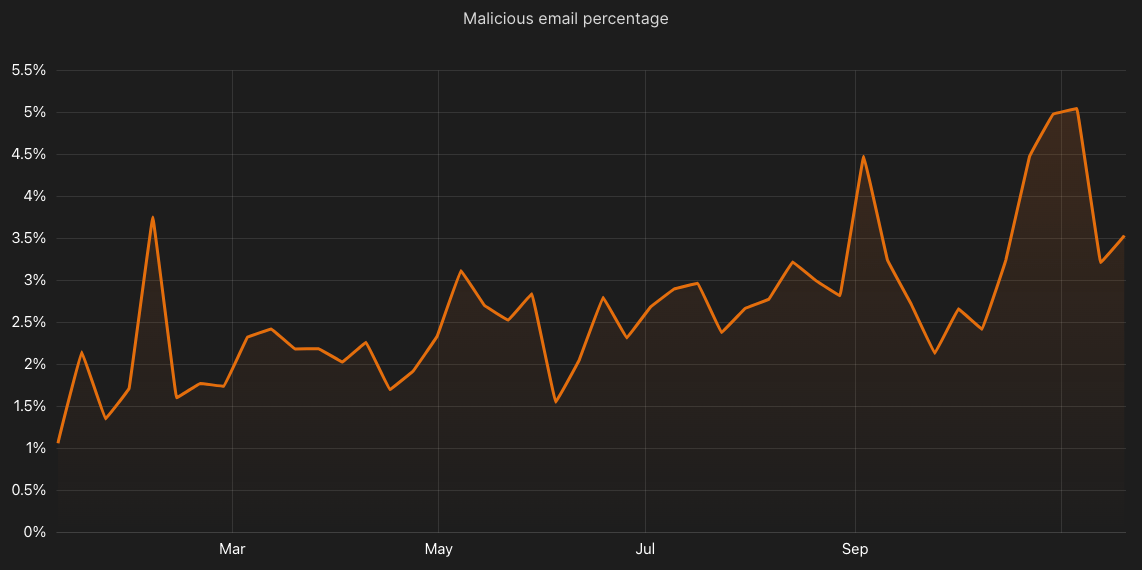
When carrying out attacks using malicious email messages, attackers use a variety of techniques, which we refer to as threat categories. These categories are defined and explored in detail in Cloudflare’s 2023 phishing threats report. Analysis of malicious emails shows that messages may contain multiple types of threats, highlighting the need for a comprehensive email security solution. Exploring threat activity trends for these categories, aggregated weekly across the year, we found that as much as 80% of them contained deceptive links.
However, it appears that attackers may have started to shift strategies in August, as the percentage of emails containing deceptive links began to fall while the share proposing to extort the recipient began to increase. By the end of October, and into November, the two threat categories had traded places, with nearly 80% of analyzed malicious emails containing an extortion threat, while only 20% contained deceptive links, as seen towards the right side of the graph below. However, this extortion campaign may have been short-lived, as its percentage fell almost as quickly as it rose. Identity deception and credential harvesting were also commonly identified threats, though the share of emails they were found in gradually declined over the course of the year.
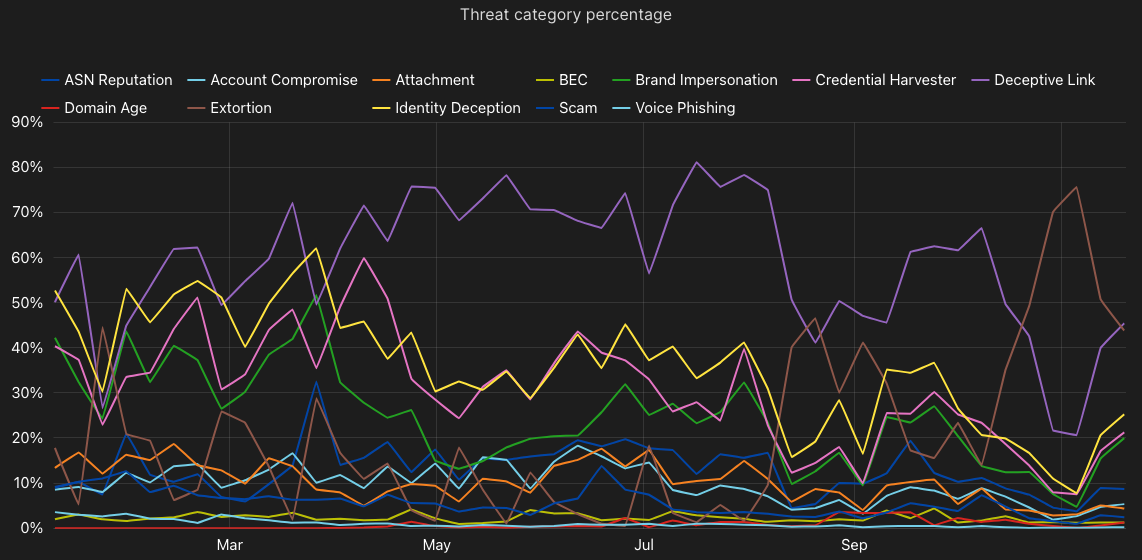
Routing security, measured as the share of RPKI valid routes, improved globally during 2023. Significant growth was observed in countries including Saudi Arabia, the United Arab Emirates, and Vietnam.
Border Gateway Protocol (BGP) is the routing protocol for the Internet, communicating routes between networks, enabling traffic to flow between source and destination. However, because it relies on trust between networks, incorrect information shared between peers, whether done so intentionally or not, can send traffic to the wrong place, potentially with malicious results. Resource Public Key Infrastructure (RPKI) is a cryptographic method of signing records that associate a BGP route announcement with the correct originating AS number. In simple terms, it provides a way of ensuring that the information being shared originally came from a network that is allowed to do so. (Note that this is only half of the challenge of implementing routing security, as network providers also need to validate these signatures and filter out invalid announcements.) In the United States, the federal government recognizes the importance of routing security, with the Federal Communications Commission holding a “Border Gateway Protocol Security Workshop” on July 31.
Cloudflare has been a strong proponent of routing security, from being a founding participant in the MANRS CDN and Cloud Programme, to releasing an RPKI toolkit for network operators, to providing a public tool that enables users to test whether their Internet provider has implemented BGP safely, to presenting at this summer’s FCC workshop.
Building on the July release of the new Routing page on Cloudflare Radar, we analyzed data from RIPE NCC’s RPKI daily archive to determine the share of RPKI valid routes (as opposed to those route announcements that are invalid or whose status is unknown) and how that share has changed over the course of 2023. Since the start of the year, the global share of RPKI valid routes grew to nearly 45%, up six percentage points from the end of 2022. At a country/region level, we are looking at routes announced by autonomous systems associated with the given country/region. In the United States, the increased FCC attention on routing security is arguably warranted, as less than a third of the routes are RPKI valid. Although this is significantly better than South Korea, where less than 1% of announced routes are RPKI valid, it trails Vietnam significantly, where the share increased 35 percentage points during the first half of the year to 90%.
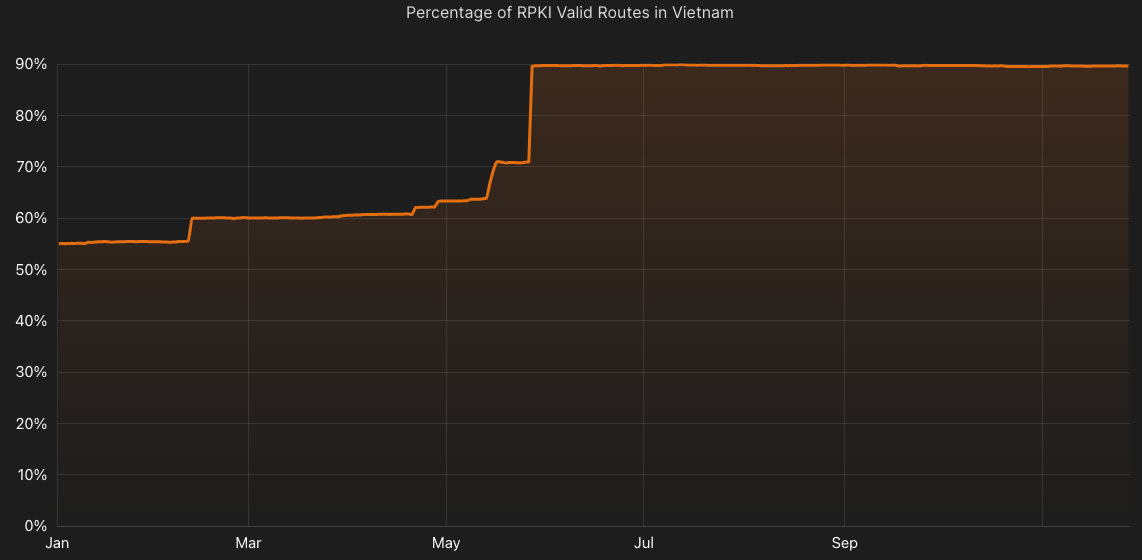
Conclusion
In the Cloudflare Radar 2023 Year In Review, we have attempted to provide a snapshot of the Internet, as dynamic as it is, through trend graphs and summary statistics, providing unique perspectives on Internet traffic, Internet quality, and Internet security, and how key metrics across these areas vary around the world.
As we said in the introduction, we strongly encourage you to visit the Cloudflare Radar 2023 Year In Review website and explore the trends relevant to metrics, countries/regions, and industries of interest, and to consider how they impact your organization so that you are appropriately prepared for 2024.
If you have any questions, you can contact the Cloudflare Radar team at [email protected] or on social media at @CloudflareRadar (X/Twitter), cloudflare.social/@radar (Mastodon), and radar.cloudflare.com (Bluesky).
Acknowledgements
As we noted last year, it truly is a team effort to produce the data, website, and content for our annual Year in Review, and I’d like to acknowledge those team members that contributed to this year’s effort. Thank you to: Sabina Zejnilovic, Jorge Pacheco, Carlos Azevedo (Data Science); Arun Chintalapati, Reza Mohammady (Design); Vasco Asturiano, Nuno Pereira, Tiago Dias (Front End Development); João Tomé (Most popular Internet services); and Davide Marquês, Paula Tavares, Celso Martinho (Project/Engineering Management) as well as countless other colleagues for their answers, edits, and ideas.
Monitoring AWS Cost Explorer with Zabbix
Post Syndicated from evgenii.gordymov original https://blog.zabbix.com/monitoring-aws-cost-explorer-with-zabbix/26159/
Cloud-based service platforms are becoming increasingly popular, and one of the most widely adopted is Amazon Web Services (AWS). Like many cloud services, AWS charges a user fee, which has led many users to look for a breakdown of which specific services they are being charged for. Fortunately, Zabbix has an AWS Cost Explorer over HTTP template that’s ready to run right out of the box and provides a list of daily and monthly maintenance costs.
Why monitor AWS costs?
While AWS cost data is stored for 12 months, Zabbix allows data to be stored for up to 25 years (see Keep lost resources period). The Keep lost resources period is a vital parameter for storing data longer than 12 months since the cost data removed from AWS will result in the discovered items becoming lost. Therefore, if we want to keep our cost data for a period longer than 12 months, Keep lost resources period parameter needs to be adjusted accordingly.
In addition, Zabbix can show fees charged for unavailable services, such as test deployments for a cluster in the us-east-1 region.
Preparing to monitor in a few easy steps
I recommend visiting zabbix.com/integrations/aws for any sources referred to in this tutorial. You can also find a link to all Zabbix templates there. For the most part, we will follow the steps outlined in the readme.
The AWS Cost Explorer by HTTP template can use key-based and role-based authorization. Set the following macros {$AWS.AUTH_TYPE}, possible values: role_base, access_key (using by default).
If you are using access key-based authorization, be sure set the following macros {$AWS.ACCESS.KEY.ID}, {$AWS.SECRET.ACCESS.KEY}.
Create or use an existing access key, which you can get from Identity and Access Management (IAM).
Accessing the IAM Console:
- Log in to your AWS Management Console.Navigate to the IAM service.
- Next, go to the Users tab and select the required user.
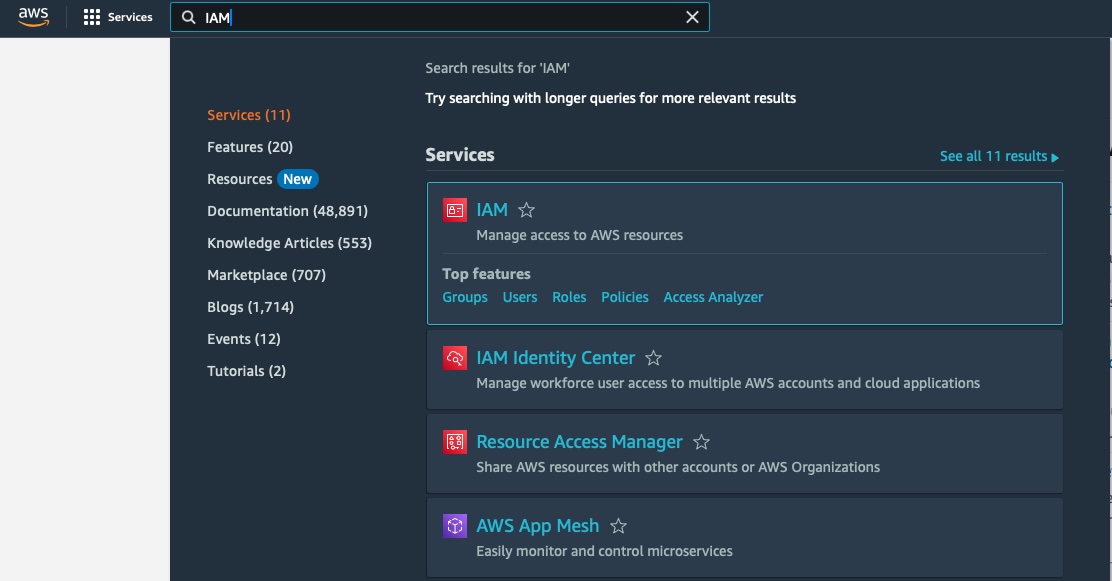
Creating a access key for monitoring:
- After that, go to the Security credentials tab.
- Select Create access key.
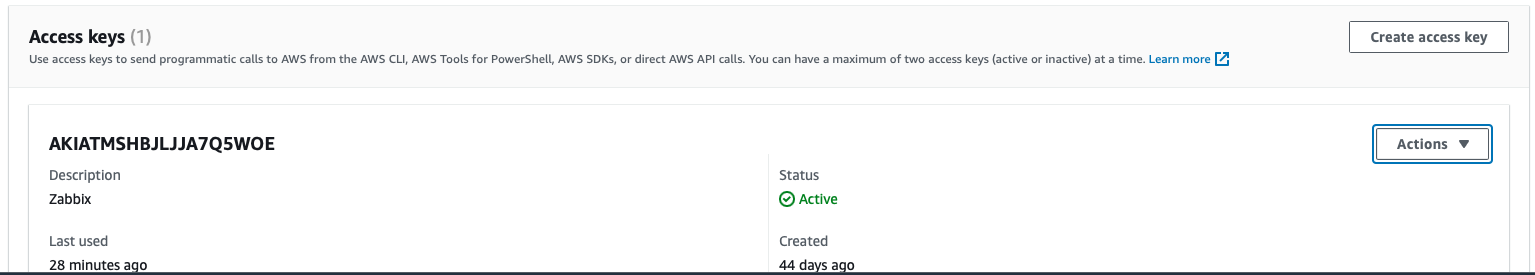
Add the following required permissions to your Zabbix IAM policy in order to collect metrics.
Defining Permissions through IAM Policies:
- Access the “Policies” section within IAM.
- Click on “Create Policy”.
- Select the JSON tab to define policy permissions.
- Provide a meaningful name and description for the policy.
- Structure the policy document based on the permissions needed for the AWS Cost Explorer by HTTP template.
{ "Version": "2012-10-17", "Statement": [ { "Action": [ "ce:GetDimensionValues", "ce:GetCostAndUsage" ], "Effect": "Allow", "Resource": "*" } ] }

Attaching Policies to the User:
- Go back to the “Users” section within IAM.
- Click on “Add Permissions”.
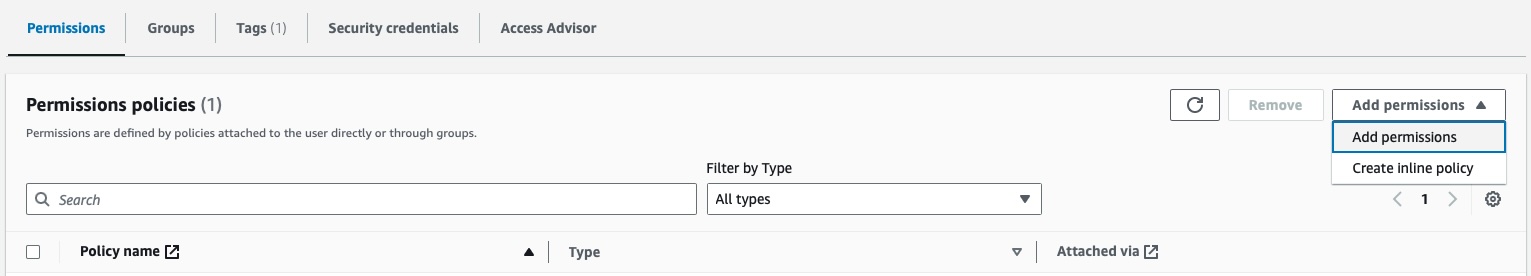
– Search for and select the policy created in the previous step.

– Review the attached policies to ensure they align with the intended permissions for the user.
Creating a host in Zabbix
Now, let’s create a host that will represent the metrics available via the Cost Explorer API:
- Create a Host Group in which to put hosts related to AWS. For this example, let’s create one that we’ll call AWS Cloud.
- Head to the host page under Configuration and click Create host. Give this host the name AWS Cost. We’ll also assign this host to the AWS Cloud group we created and attach the AWS Cost Explorer template by HTTP.
- Click the Macros tab and select Inherited and host macros. In this case, we need to change the first two macros. The first, {$AWS.ACCESS.KEY.ID}, should be set to the received access key ID. For the second, {$AWS.SECRET.ACCESS.KEY}, the secret access key should be set to the previously retrieved value from the Security credentials tab.

- Click Add. The AWS Cost Explorer template has three low-level discovery rules that use master items. The low-level discovery rules will start discovering resources only after the master item has collected the required data.

The best practice is to always test such items for data. Don’t forget to fill in the required macros!

In AWS daily costs by services and AWS monthly costs by services discovery you can filter by service, which can be specified in macros.
- Let’s execute the master items to collect the required data on-demand. Choose both items to get data and click Execute now.


In a few minutes, you should receive cost metrics by services for 12 months plus the current month, as well as by day. If you want the information to be stored longer, remember to change the Keep lost resources period in the LLD rule, as it’s set to 30 days by default.
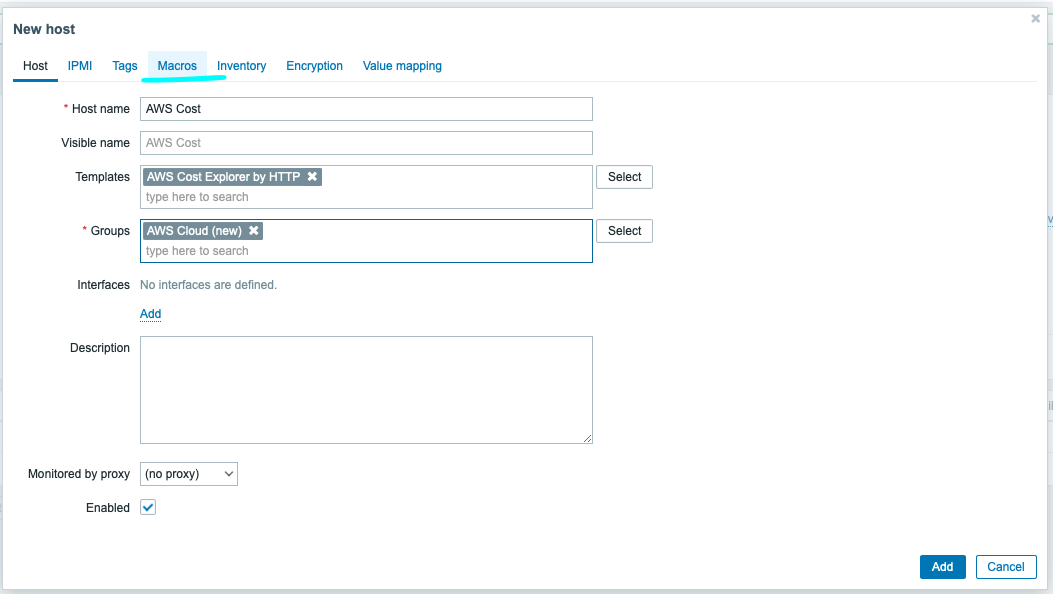
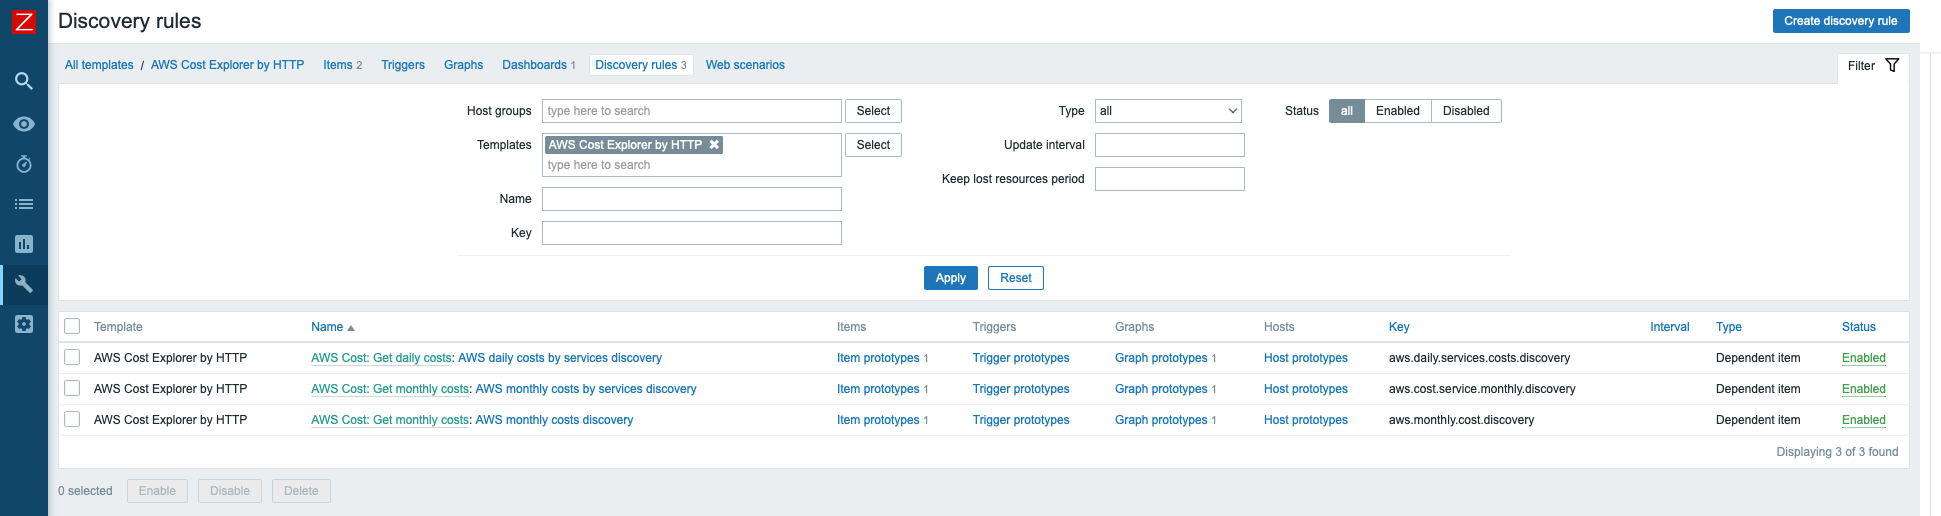
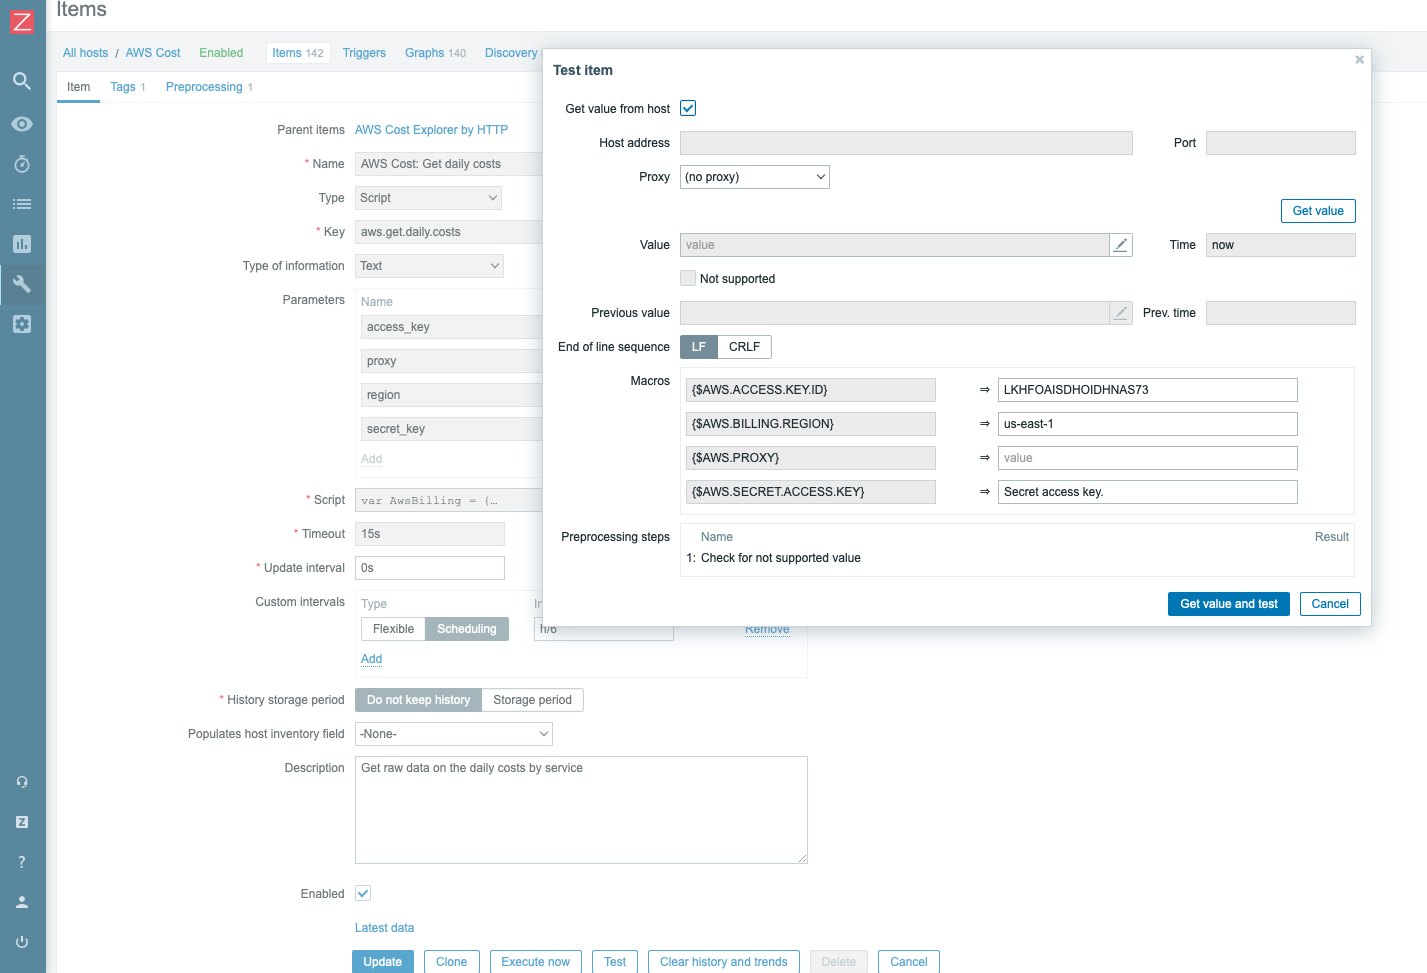
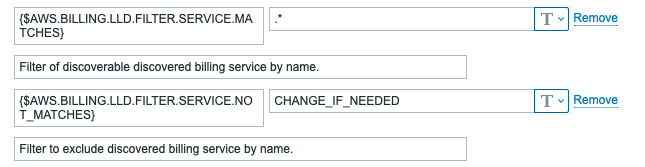

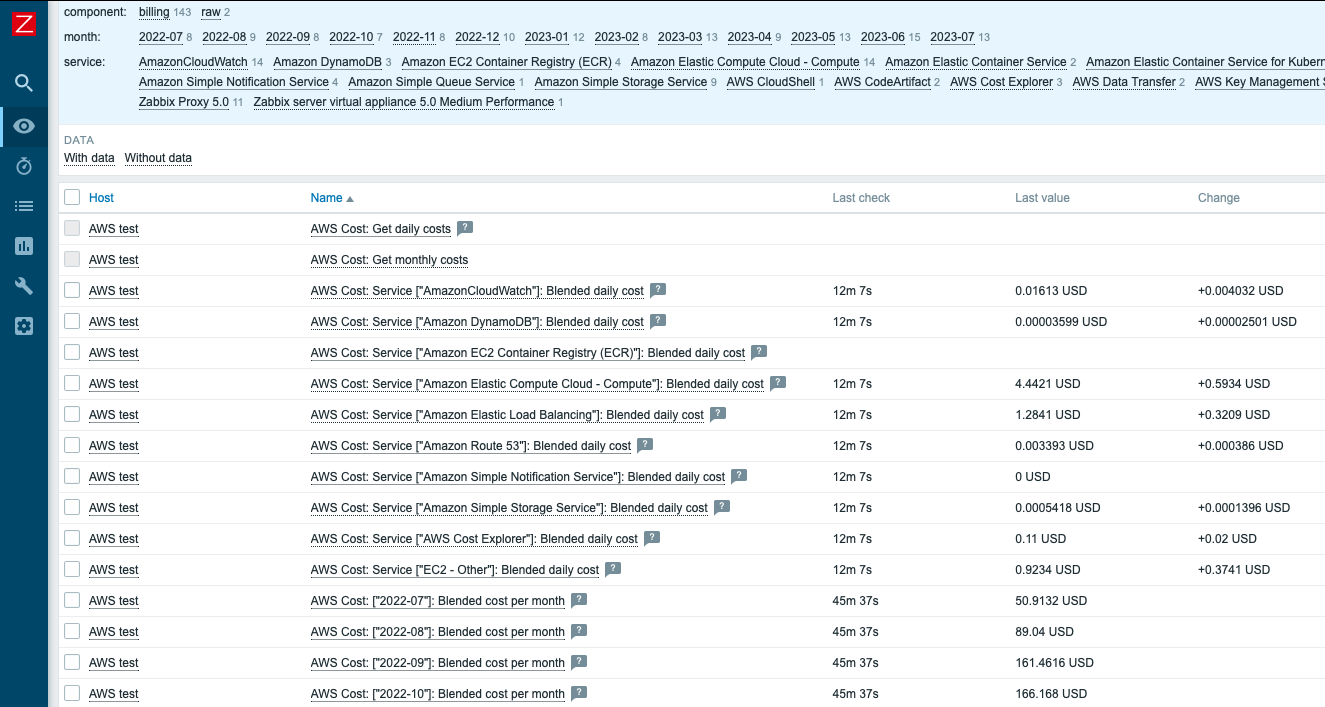
Good luck!
The post Monitoring AWS Cost Explorer with Zabbix appeared first on Zabbix Blog.
New Windows/Linux Firmware Attack
Post Syndicated from Bruce Schneier original https://www.schneier.com/blog/archives/2023/12/new-windows-linux-firmware-attack.html
Interesting attack based on malicious pre-OS logo images:
LogoFAIL is a constellation of two dozen newly discovered vulnerabilities that have lurked for years, if not decades, in Unified Extensible Firmware Interfaces responsible for booting modern devices that run Windows or Linux….
The vulnerabilities are the subject of a coordinated mass disclosure released Wednesday. The participating companies comprise nearly the entirety of the x64 and ARM CPU ecosystem, starting with UEFI suppliers AMI, Insyde, and Phoenix (sometimes still called IBVs or independent BIOS vendors); device manufacturers such as Lenovo, Dell, and HP; and the makers of the CPUs that go inside the devices, usually Intel, AMD or designers of ARM CPUs….
As its name suggests, LogoFAIL involves logos, specifically those of the hardware seller that are displayed on the device screen early in the boot process, while the UEFI is still running. Image parsers in UEFIs from all three major IBVs are riddled with roughly a dozen critical vulnerabilities that have gone unnoticed until now. By replacing the legitimate logo images with identical-looking ones that have been specially crafted to exploit these bugs, LogoFAIL makes it possible to execute malicious code at the most sensitive stage of the boot process, which is known as DXE, short for Driver Execution Environment.
“Once arbitrary code execution is achieved during the DXE phase, it’s game over for platform security,” researchers from Binarly, the security firm that discovered the vulnerabilities, wrote in a whitepaper. “From this stage, we have full control over the memory and the disk of the target device, thus including the operating system that will be started.”
From there, LogoFAIL can deliver a second-stage payload that drops an executable onto the hard drive before the main OS has even started.
It’s an interesting vulnerability. Corporate buyers want the ability to display their own logos, and not the logos of the hardware makers. So the ability has to be in the BIOS, which means that the vulnerabilities aren’t being protected by any of the OS’s defenses. And the BIOS makers probably pulled some random graphics library off the Internet and never gave it a moment’s thought after that.
AI isn’t just robots: How to talk to young children about AI
Post Syndicated from Sway Grantham original https://www.raspberrypi.org/blog/how-to-talk-to-young-children-about-ai/
Young children have a unique perspective on the world they live in. They often seem oblivious to what’s going on around them, but then they will ask a question that makes you realise they did get some insight from a news story or a conversation they overheard. This happened to me with a class of ten-year-olds when one boy asked, with complete sincerity and curiosity, “And is that when the zombie apocalypse happened?” He had unknowingly conflated the Great Plague with television depictions of zombies taking over the world.

How to talk to young people about AI
Absorbing media and assimilating it into your existing knowledge is a challenge, and this is a concern when the media is full of big, scary headlines about artificial intelligence (AI) taking over the world, stealing jobs, and being sentient. As teachers and parents, you don’t need to know all the details about AI to answer young people’s questions, but you can avoid accidentally introducing alternate conceptions. This article offers some top tips to help you point those inquisitive minds in the right direction.

AI is not a person
Technology companies like to anthropomorphise their products and give them friendly names. Why? Because it makes their products seem more endearing and less scary, and makes you more likely to include them in your lives. However, when you think of AI as a human with a name who needs you to say ‘please’ or is ‘there to help you’, you start to make presumptions about how it works, what it ‘knows’, and its morality. This changes what we ask, how much we trust an AI device’s responses, and how we behave when using the device. The device, though, does not ‘see’ or ‘know’ anything; instead, it uses lots of data to make predictions. Think of word association: if I say “bread”, I predict that a lot of people in the UK will think “butter”. Here, I’ve used the data I’ve collected from years of living in this country to predict a reasonable answer. This is all AI devices are doing.

[AI] does not ‘see’ or ‘know’ anything; instead, it uses lots of data to make predictions.
When talking to young children about AI, try to avoid using pronouns such as ‘she’ or ‘he’. Where possible, avoid giving devices human names, and instead call them “computer”, to reinforce the idea that humans and computers are very different. Let’s imagine that a child in your class says, “Alexa told me a joke at the weekend — she’s funny!” You could respond, “I love using computers to find new jokes! What was it?” This is just a micro-conversation, but with it, you are helping to surreptitiously challenge the child’s perception of Alexa and the role of AI in it.
Where possible, avoid giving devices human names, and instead call them ‘computer’, to reinforce the idea that humans and computers are very different.
Another good approach is to remember to keep your emotions separate from computers, so as not to give them human-like characteristics: don’t say that the computer ‘hates’ you, or is ‘deliberately ignoring’ you, and remember that it’s only ‘helpful’ because it was told to be. Language is important, and we need to continually practise avoiding anthropomorphism.
AI isn’t just robots (actually, it rarely is)
The media plays a huge role in what we imagine when we talk about AI. For the media, the challenge is how to make lines of code and data inside a computer look exciting and recognisable to their audiences. The answer? Robots! When learners hear about AI taking over the world, it’s easy for them to imagine robots like those you’d find in a Marvel movie. Yet the majority of AI exists within systems they’re already aware of and are using — you might just need to help draw their attention to it.
Even better than just calling out uses of AI: try to have conversations about when things go wrong and AI systems suggest silly options.
For example, when using a word processor, you can highlight to learners that the software sometimes predicts what word you want to type next, and that this is an example of the computer using AI. When learners are using streaming services for music or TV and the service predicts something that they might want to watch or listen to next, point out that this is using AI technology. When they see their parents planning a route using a satnav, explain that the satnav system uses data and AI to plan the best route.
Even better than just calling out uses of AI: try to have conversations about when things go wrong and AI systems suggest silly options. This is a great way to build young people’s critical thinking around the use of computers. AI systems don’t always know best, because they’re just making predictions, and predictions can always be wrong.
AI complements humans
There’s a delicate balance between acknowledging the limitations of AI and portraying it as a problematic tool that we shouldn’t use. AI offers us great opportunities to improve the way we work, to get us started on a creative project, or to complete mundane tasks. However, it is just a tool, and tools complement the range of skills that humans already have. For example, if you gave an AI chatbot app the prompt, ‘Write a setting description using these four phrases: dark, scary, forest, fairy tale’, the first output from the app probably wouldn’t make much sense. As a human, though, you’d probably have to do far less work to edit the output than if you had had to write the setting description from scratch. Now, say you had the perfect example of a setting description, but you wanted 29 more examples, a different version for each learner in your class. This is where AI can help: completing a repetitive task and saving time for humans.

To help children understand how AI and humans complement each other, ask them the question, ‘What can’t a computer do?’ Answers that I have received before include, ‘Give me a hug’, ‘Make me laugh’, and ‘Paint a picture’, and these are all true. Can Alexa tell you a joke that makes you laugh? Yes — but a human created that joke. The computer is just the way in which it is being shared. Even with AI ‘creating’ new artwork, it is really only using data from something that someone else created. Humans are required.
Overall, we must remember that young children are part of a world that uses AI, and that it is likely to be ever more present in the future. We need to ensure that they know how to use AI responsibly, by minimising their alternate conceptions. With our youngest learners, this means taking care with the language you choose and the examples you use, and explaining AI’s role as a tool.
To help children understand how AI and humans complement each other, ask them the question, ‘What can’t a computer do?’
These simple approaches are the first steps to empowering children to go on to harness this technology. They also pave the way for you to simply introduce the core concepts of AI in later computing lessons without first having to untangle a web of alternate conceptions.
This article also appears in issue 22 of Hello World, which is all about teaching and AI. Download your free PDF copy now.
If you’re an educator, you can use our free Experience AI Lessons to teach your learners the basics of how AI works, whatever your subject area.
The post AI isn’t just robots: How to talk to young children about AI appeared first on Raspberry Pi Foundation.
Comic for 2023.12.12 – Pronouns
Post Syndicated from Explosm.net original https://explosm.net/comics/pronouns-3
New Cyanide and Happiness Comic
Living our Values and Leveraging Diverse Skill Sets: How Jonathan Atwood Built a Successful Career as a Customer Advisor at Rapid7
Post Syndicated from Rapid7 original https://blog.rapid7.com/2023/12/11/living-our-values-and-leveraging-diverse-skill-sets-how-jonathan-atwood-built-a-successful-career-as-a-customer-advisor-at-rapid7/

At Rapid7, our Customer Advisors play a pivotal role at ensuring our customers understand their threat landscape – and feel confident in their security programs. By collaborating across various internal teams, strengthening customer relationships, and proactively seeking solutions and advocating for customer needs, Customer Advisors have a direct impact on the fortunes of our business. To do this successfully requires a clear understanding of Rapid7’s core values and associated behaviors as well as an equal balance of strong technical knowledge and exceptional customer relationship skills.
Jonathan: “You need to create a strong relationship with customers to fully understand their needs and their business. You also have to be able to talk in detail about very technical scenarios. This requires having some experience or education in the cybersecurity field as well as the ability to relay information to our engineers and developers. Customers are extremely aware of the potential risks a security event may pose to their businesses, so it’s important their questions are answered in detail. This enables a clear understanding of what is happening in their environments.”
In addition to presenting and reviewing activity reports, Customer Advisors like Jonathan take a proactive approach to providing guidance and advice on all aspects of a customer’s security ecosystem.
Jonathan: “I may be asked to advise on reviewing the results of a recent Pen test, break down a bug or issue with a particular piece of code, or speak up if there is a storage container system they are using that I wouldn’t agree with or recommend”.
Jonathan also notes that the requirements for each customer can also vary depending on industry or field, based on specific security frameworks that may be in place that govern how they do business. Understanding these requirements helps provide additional guidance and shape recommendations for the unique needs of individual customers.
Jonathan: “HIPAA is a common example of a security framework. So if I have a customer who is in the medical field, I’m also thinking of the regulations in place for protecting patient health information and how to best advise them based on those specific requirements.”
While the role is dynamic and requires a wide range of skills to be successful, Jonathan says it’s the ability to see the impact of his work that he finds most rewarding.
Jonathan: “I’ve always had an aspiration to help people. In this role, I can feel the impact my work has on the customer as well as internally at Rapid7. When I have provided the right guidance and solutions and they are happy with our services, that leads to customer renewals and helps you feel like you’re contributing directly to the success of the business.”
The responsibility for cultivating relationships isn’t limited to external customers. For Jonathan, building internal relationships helps him drive positive impact in his role and for his own development and growth.
Jonathan: “Collaboration is a huge part of Rapid7’s culture. You should never be afraid of reaching out to ask a question or to raise your hand if you need help. Any time I’ve reached out to someone with a question – whether it was big or small, in a team chat or a 1:1 conversation, everyone has always been willing to jump in and help.
“We talk a lot about our values as a company, and when it comes to those Rapid7 core values like Advocating for Customers, Challenging Convention, and Impacting Together, we all understand that having these conversations helps get us to the best possible outcome. Additionally, the events the company hosts to bring people from different teams together are helpful in understanding how different teams operate and how you might eventually partner together in the future.”
An emphasis on collaboration and a deep dive of Rapid7’s core values are key elements of a new hire’s global onboarding program. The current program combines a mix of company education (culture, values, benefits processes, etc.) with programs specific to each person’s role or team.
Jonathan: “Once hired, I would recommend fully taking advantage of the first few weeks of onboarding. A lot of content is self paced, and it sets a good foundation of how to be successful at Rapid7 as well as imparts information about our products and services. I also recommend new Customer Advisors become certified for Insight IDR. As an employee, you can take the test for free, and it gives you a great foundation to build on. This is also a great time to shadow some calls to get familiar with some common topics and questions that might come up.”
Throughout onboarding and beyond, Jonathan also states the importance of being eager to learn (reflected in Rapid7’s “Never Done” core value).
Jonathan: “For new hires in this role, come in with an open mind and be ready to learn and ask questions. This is a very complex role, and it can be stressful at times due to the nature of our industry. The more you recognize and seek the experience and feedback of those around you, the more successful you will be. Take advantage of opportunities to learn and grow throughout your time here – not just as a new hire.”
Rapid7 is continuing to grow teams in locations around the world. Learn more about career opportunities or browse all open jobs.
Bottomley: Solving the Looming Developer Liability Problem
Post Syndicated from corbet original https://lwn.net/Articles/954528/
James Bottomley writes
that open-source developers are increasingly likely to be held liable for
flaws in their code and suggests a solution:
Indemnification means one party, in particular circumstances,
agreeing to be on the hook for the legal responsibilities of
another party. This is actually a well known way not of avoiding
liability but transferring it to where it belongs. As such, it’s
easily sellable in the court of public opinion: we’re not looking
to avoid liability, merely trying to make sure it lands on those
who are making all the money from the code.
Next-Gen Broadcom PCIe Switches to Support AMD Infinity Fabric XGMI to Counter NVIDIA NVLink
Post Syndicated from Patrick Kennedy original https://www.servethehome.com/next-gen-broadcom-pcie-switches-to-support-amd-infinity-fabric-xgmi-to-counter-nvidia-nvlink/
Broadcom said it will support AMD XGMI or Infinity Fabric on its next-gen PCIe switches and we expect XGMI NICs in a big counter to NVIDIA
The post Next-Gen Broadcom PCIe Switches to Support AMD Infinity Fabric XGMI to Counter NVIDIA NVLink appeared first on ServeTheHome.
[$] Some recent and notable changes to Rust
Post Syndicated from corbet original https://lwn.net/Articles/954033/
The Rust project makes incremental releases every six
weeks, a fact that makes it easy to overlook some of the
interesting changes coming to the language, such as new
ABIs, better debugger support, asynchronous traits, and
support for C strings.
The end of the year provides an opportunity to look back
over the past several months of updates, and to look
forward to what to expect in 2024.
Wi-Fi 7 is Marketing BS (…for now)
Post Syndicated from Crosstalk Solutions original https://www.youtube.com/watch?v=nvDAxWX-CYw
Blue/Green Deployments with Amazon ECS using Amazon CodeCatalyst
Post Syndicated from Hareesh Iyer original https://aws.amazon.com/blogs/devops/blue-green-deployments-with-amazon-ecs-using-amazon-codecatalyst/
Amazon CodeCatalyst is a modern software development service that empowers teams to deliver software on AWS easily and quickly. Amazon CodeCatalyst provides one place where you can plan, code, and build, test, and deploy your container applications with continuous integration/continuous delivery (CI/CD) tools.
In this post, we will walk-through how you can configure Blue/Green and canary deployments for your container workloads within Amazon CodeCatalyst.
Pre-requisites
To follow along with the instructions, you’ll need:
- An AWS account. If you don’t have one, you can create a new AWS account.
- An Amazon Elastic Container Service (Amazon ECS) service using the Blue/Green deployment type. If you don’t have one, follow the Amazon ECS tutorial and complete steps 1-5.
- An Amazon Elastic Container Registry (Amazon ECR) repository named
codecatalyst-ecs-image-repo. Follow the Amazon ECR user guide to create one. - An Amazon CodeCatalyst space, with an empty Amazon CodeCatalyst project named
codecatalyst-ecs-projectand an Amazon CodeCatalyst environment calledcodecatalyst-ecs-environment. Follow the Amazon CodeCatalyst tutorial to set these up. - Follow the Amazon CodeCatalyst user guide to associate your account to the environment.
Walkthrough
Now that you have setup an Amazon ECS cluster and configured Amazon CodeCatalyst to perform deployments, you can configure Blue/Green deployment for your workload. Here are the high-level steps:
- Collect details of the Amazon ECS environment that you created in the prerequisites step.
- Add source files for the containerized application to Amazon CodeCatalyst.
- Create Amazon CodeCatalyst Workflow.
- Validate the setup.
Step 1: Collect details from your ECS service and Amazon CodeCatalyst role
In this step, you will collect information from your prerequisites that will be used in the Blue/Green Amazon CodeCatalyst configuration further down this post.
If you followed the prerequisites tutorial, below are AWS CLI commands to extract values that are used in this post. You can run this on your local workstation or with AWS CloudShell in the same region you created your Amazon ECS cluster.
ECSCLUSTER='tutorial-bluegreen-cluster'
ECSSERVICE='service-bluegreen'
ECSCLUSTERARN=$(aws ecs describe-clusters --clusters $ECSCLUSTER --query 'clusters[*].clusterArn' --output text)
ECSSERVICENAME=$(aws ecs describe-services --services $ECSSERVICE --cluster $ECSCLUSTER --query 'services[*].serviceName' --output text)
TASKDEFARN=$(aws ecs describe-services --services $ECSSERVICE --cluster $ECSCLUSTER --query 'services[*].taskDefinition' --output text)
TASKROLE=$(aws ecs describe-task-definition --task-definition tutorial-task-def --query 'taskDefinition.executionRoleArn' --output text)
ACCOUNT=$(aws sts get-caller-identity --query "Account" --output text)
echo Account_ID value: $ACCOUNT
echo EcsRegionName value: $AWS_DEFAULT_REGION
echo EcsClusterArn value: $ECSCLUSTERARN
echo EcsServiceName value: $ECSSERVICENAME
echo TaskDefinitionArn value: $TASKDEFARN
echo TaskExecutionRoleArn value: $TASKROLE
Note down the values of Account_ID, EcsRegionName, EcsClusterArn, EcsServiceName, TaskDefinitionArn and TaskExecutionRoleArn. You will need these values in later steps.
Step 2: Add Amazon IAM roles to Amazon CodeCatalyst
In this step, you will create a role called CodeCatalystWorkflowDevelopmentRole-spacename to provide Amazon CodeCatalyst service permissions to build and deploy applications. This role is only recommended for use with development accounts and uses the AdministratorAccess AWS managed policy, giving it full access to create new policies and resources in this AWS account.
- In Amazon CodeCatalyst, navigate to your space. Choose the Settings tab.
- In the Navigation page, select AWS accounts. A list of account connections appears. Choose the account connection that represents the AWS account where you created your build and deploy roles.
- Choose Manage roles from AWS management console.
- The Add IAM role to Amazon CodeCatalyst space page appears. You might need to sign in to access the page.
- Choose Create CodeCatalyst development administrator role in IAM. This option creates a service role that contains the permissions policy and trust policy for the development role.
- Note down the role name. Choose Create development role.
Step 3: Create Amazon CodeCatalyst source repository
In this step, you will create a source repository in CodeCatalyst. This repository stores the tutorial’s source files, such as the task definition file.
- In Amazon CodeCatalyst, navigate to your project.
- In the navigation pane, choose Code, and then choose Source repositories.
- Choose Add repository, and then choose Create repository.
- In Repository name, enter:
codecatalyst-advanced-deployment
- Choose Create.
Step 4: Create Amazon CodeCatalyst Dev Environment
In this step, you will create a Amazon CodeCatalyst Dev environment to work on the sample application code and configuration in the codecatalyst-advanced-deployment repository. Learn more about Amazon CodeCatalyst dev environments in Amazon CodeCatalyst user guide.
- In Amazon CodeCatalyst, navigate to your project.
- In the navigation pane, choose Code, and then choose Source repositories.
- Choose the source repository for which you want to create a dev environment.
- Choose Create Dev Environment.
- Choose AWS Cloud9 from the drop-down menu.
- In Create Dev Environment and open with AWS Cloud9 page (Figure 1), choose Create to create a Cloud9 development environment.
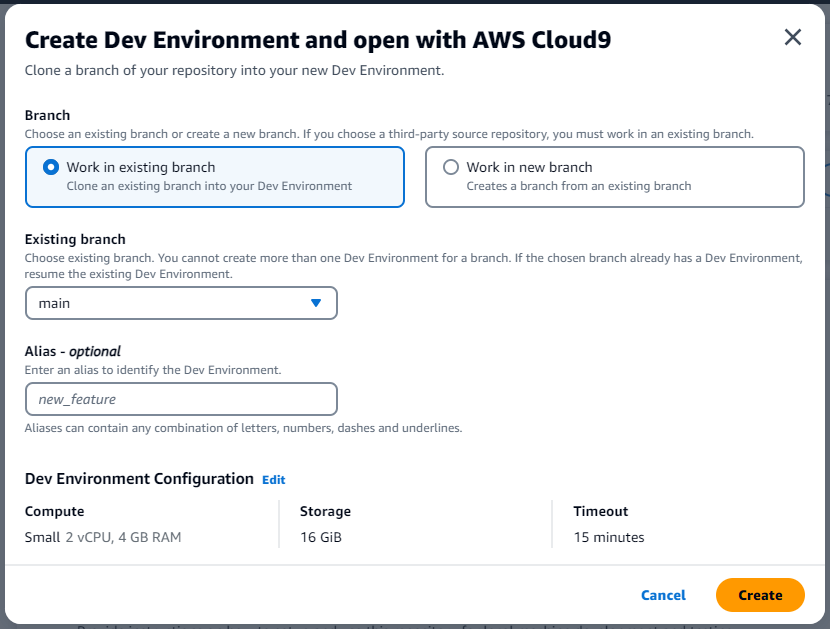
Figure 1: Create Dev Environment in Amazon CodeCatalyst
AWS Cloud9 IDE opens on a new browser tab. Stay in AWS Cloud9 window to continue with Step 5.
Step 5: Add Source files to Amazon CodeCatalyst source repository
In this step, you will add source files from a sample application from GitHub to Amazon CodeCatalyst repository. You will be using this application to configure and test blue-green deployments.
- On the menu bar at the top of the AWS Cloud9 IDE, choose Window, New Terminal or use an existing terminal window.
- Download the Github project as a zip file, un-compress it and move it to your project folder by running the below commands in the terminal.
cd codecatalyst-advanced-deployment
wget -O SampleApp.zip https://github.com/build-on-aws/automate-web-app-amazon-ecs-cdk-codecatalyst/zipball/main/
unzip SampleApp.zip
mv build-on-aws-automate-web-app-amazon-ecs-cdk-codecatalyst-*/SampleApp/* .
rm -rf build-on-aws-automate-web-app-amazon-ecs-cdk-codecatalyst-*
rm SampleApp.zip
- Update the task definition file for the sample application. Open task.json in the current directory. Find and replace “<arn:aws:iam::<account_ID>:role/AppRole> with the value collected from step 1: <TaskExecutionRoleArn>.
- Amazon CodeCatalyst works with AWS CodeDeploy to perform Blue/Green deployments on Amazon ECS. You will create an Application Specification file, which will be used by CodeDeploy to manage the deployment. Create a file named
appspec.yamlinside thecodecatalyst-advanced-deploymentdirectory. Update the <TaskDefinitionArn> with value from Step 1.
version: 0.0
Resources:
  - TargetService:
      Type: AWS::ECS::Service
      Properties:
        TaskDefinition: "<TaskDefinitionArn>"
        LoadBalancerInfo:
          ContainerName: "MyContainer"
          ContainerPort: 80
PlatformVersion: "LATEST"- Commit the changes to Amazon CodeCatalyst repository by following the below commands. Update <your_email> and <your_name> with your email and name.
git config user.email "<your_email>"
git config user.name "<your_name>"
git add .
git commit -m "Initial commit"
git push
Step 6: Create Amazon CodeCatalyst Workflow
In this step, you will create the Amazon CodeCatalyst workflow which will automatically build your source code when changes are made. A workflow is an automated procedure that describes how to build, test, and deploy your code as part of a continuous integration and continuous delivery (CI/CD) system. A workflow defines a series of steps, or actions, to take during a workflow run.
- In the navigation pane, choose CI/CD, and then choose Workflows.
- Choose Create workflow. Select codecatalyst-advanced-deployment from the Source repository dropdown.
- Choose main in the branch. Select Create (Figure 2). The workflow definition file appears in the Amazon CodeCatalyst console’s YAML editor.

Figure 2: Create workflow page in Amazon CodeCatalyst
- Update the workflow by replacing the contents in the YAML editor with the below. Replace <Account_ID> with your AWS account ID. Replace <EcsRegionName>, <EcsClusterArn>, <EcsServiceName> with values from Step 1. Replace <CodeCatalyst-Dev-Admin-Role> with the Role Name from Step 3.

Name: BuildAndDeployToECS
SchemaVersion: "1.0"

# Set automatic triggers on code push.
Triggers:
  - Type: Push
    Branches:
      - main

Actions:
  Build_application:
    Identifier: aws/build@v1
    Inputs:
      Sources:
        - WorkflowSource
      Variables:
        - Name: region
          Value: <EcsRegionName>
        - Name: registry
          Value: <Account_ID>.dkr.ecr.<EcsRegionName>.amazonaws.com
        - Name: image
          Value: codecatalyst-ecs-image-repo
    Outputs:
      AutoDiscoverReports:
        Enabled: false
      Variables:
        - IMAGE
    Compute:
      Type: EC2
    Environment:
      Connections:
        - Role: <CodeCatalystPreviewDevelopmentAdministrator role>
          Name: "<Account_ID>"
      Name: codecatalyst-ecs-environment
    Configuration:
      Steps:
        - Run: export account=`aws sts get-caller-identity --output text | awk '{ print $1 }'`
        - Run: aws ecr get-login-password --region ${region} | docker login --username AWS --password-stdin ${registry}
        - Run: docker build -t appimage .
        - Run: docker tag appimage ${registry}/${image}:${WorkflowSource.CommitId}
        - Run: docker push --all-tags ${registry}/${image}
        - Run: export IMAGE=${registry}/${image}:${WorkflowSource.CommitId}
  RenderAmazonECStaskdefinition:
    Identifier: aws/ecs-render-task-definition@v1
    Configuration:
      image: ${Build_application.IMAGE}
      container-name: MyContainer
      task-definition: task.json
    Outputs:
      Artifacts:
        - Name: TaskDefinition
          Files:
            - task-definition*
    DependsOn:
      - Build_application
    Inputs:
      Sources:
        - WorkflowSource
  DeploytoAmazonECS:
    Identifier: aws/ecs-deploy@v1
    Configuration:
      task-definition: /artifacts/DeploytoAmazonECS/TaskDefinition/${RenderAmazonECStaskdefinition.task-definition}
      service: <EcsServiceName>
      cluster: <EcsClusterArn>
      region: <EcsRegionName>
      codedeploy-appspec: appspec.yaml
      codedeploy-application: tutorial-bluegreen-app
      codedeploy-deployment-group: tutorial-bluegreen-dg
      codedeploy-deployment-description: "Blue-green deployment for sample app"
    Compute:
      Type: EC2
      Fleet: Linux.x86-64.Large
    Environment:
      Connections:
        - Role: <CodeCatalyst-Dev-Admin-Role>
        # Add account id within quotes. Eg: "12345678"
          Name: "<Account_ID>"
      Name: codecatalyst-ecs-environment
    DependsOn:
      - RenderAmazonECStaskdefinition
    Inputs:
      Artifacts:
        - TaskDefinition
      Sources:
        - WorkflowSource
The workflow above does the following:
- Whenever a code change is pushed to the repository, a Build action is triggered. The Build action builds a container image and pushes the image to the Amazon ECR repository created in Step 1.
- Once the Build stage is complete, the Amazon ECS task definition is updated with the new ECR repository image.
- The DeploytoECS action then deploys the new image to Amazon ECS using Blue/Green Approach.
To confirm everything was configured correctly, choose the Validate button. It should add a green banner with The workflow definition is valid at the top.
Select Commit to add the workflow to the repository (Figure 3)
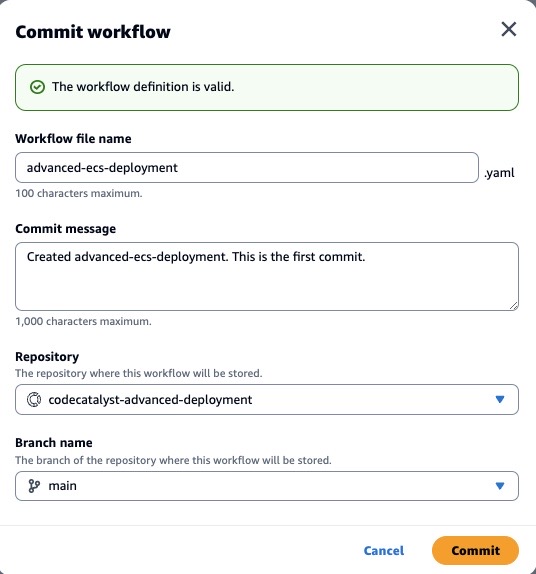
Figure 3: Commit workflow page in Amazon CodeCatalyst
The workflow file is stored in a ~/.codecatalyst/workflows/ folder in the root of your source repository. The file can have a .yml or .yaml extension.
Let’s review our work, using the load balancer’s URL that you created during prerequisites, paste it into your browser. Your page should look similar to (Figure 4).

Figure 4: Sample Application (Blue version)
Step 7: Validate the setup
To validate the setup, you will make a small change to the sample application.
- Open Amazon CodeCatalyst dev environment that you created in Step 4.
- Update your local copy of the repository. In the terminal run the command below.
git pull
- In the terminal, navigate to
/templatesfolder. Open index.html and search for “Las Vegas”. Replace the word with “New York”. Save the file. - Commit the change to the repository using the commands below.
git add .
git commit -m "Updating the city to New York"
git push
After the change is committed, the workflow should start running automatically. You can monitor of the workflow run in Amazon CodeCatalyst console (Figure 5)
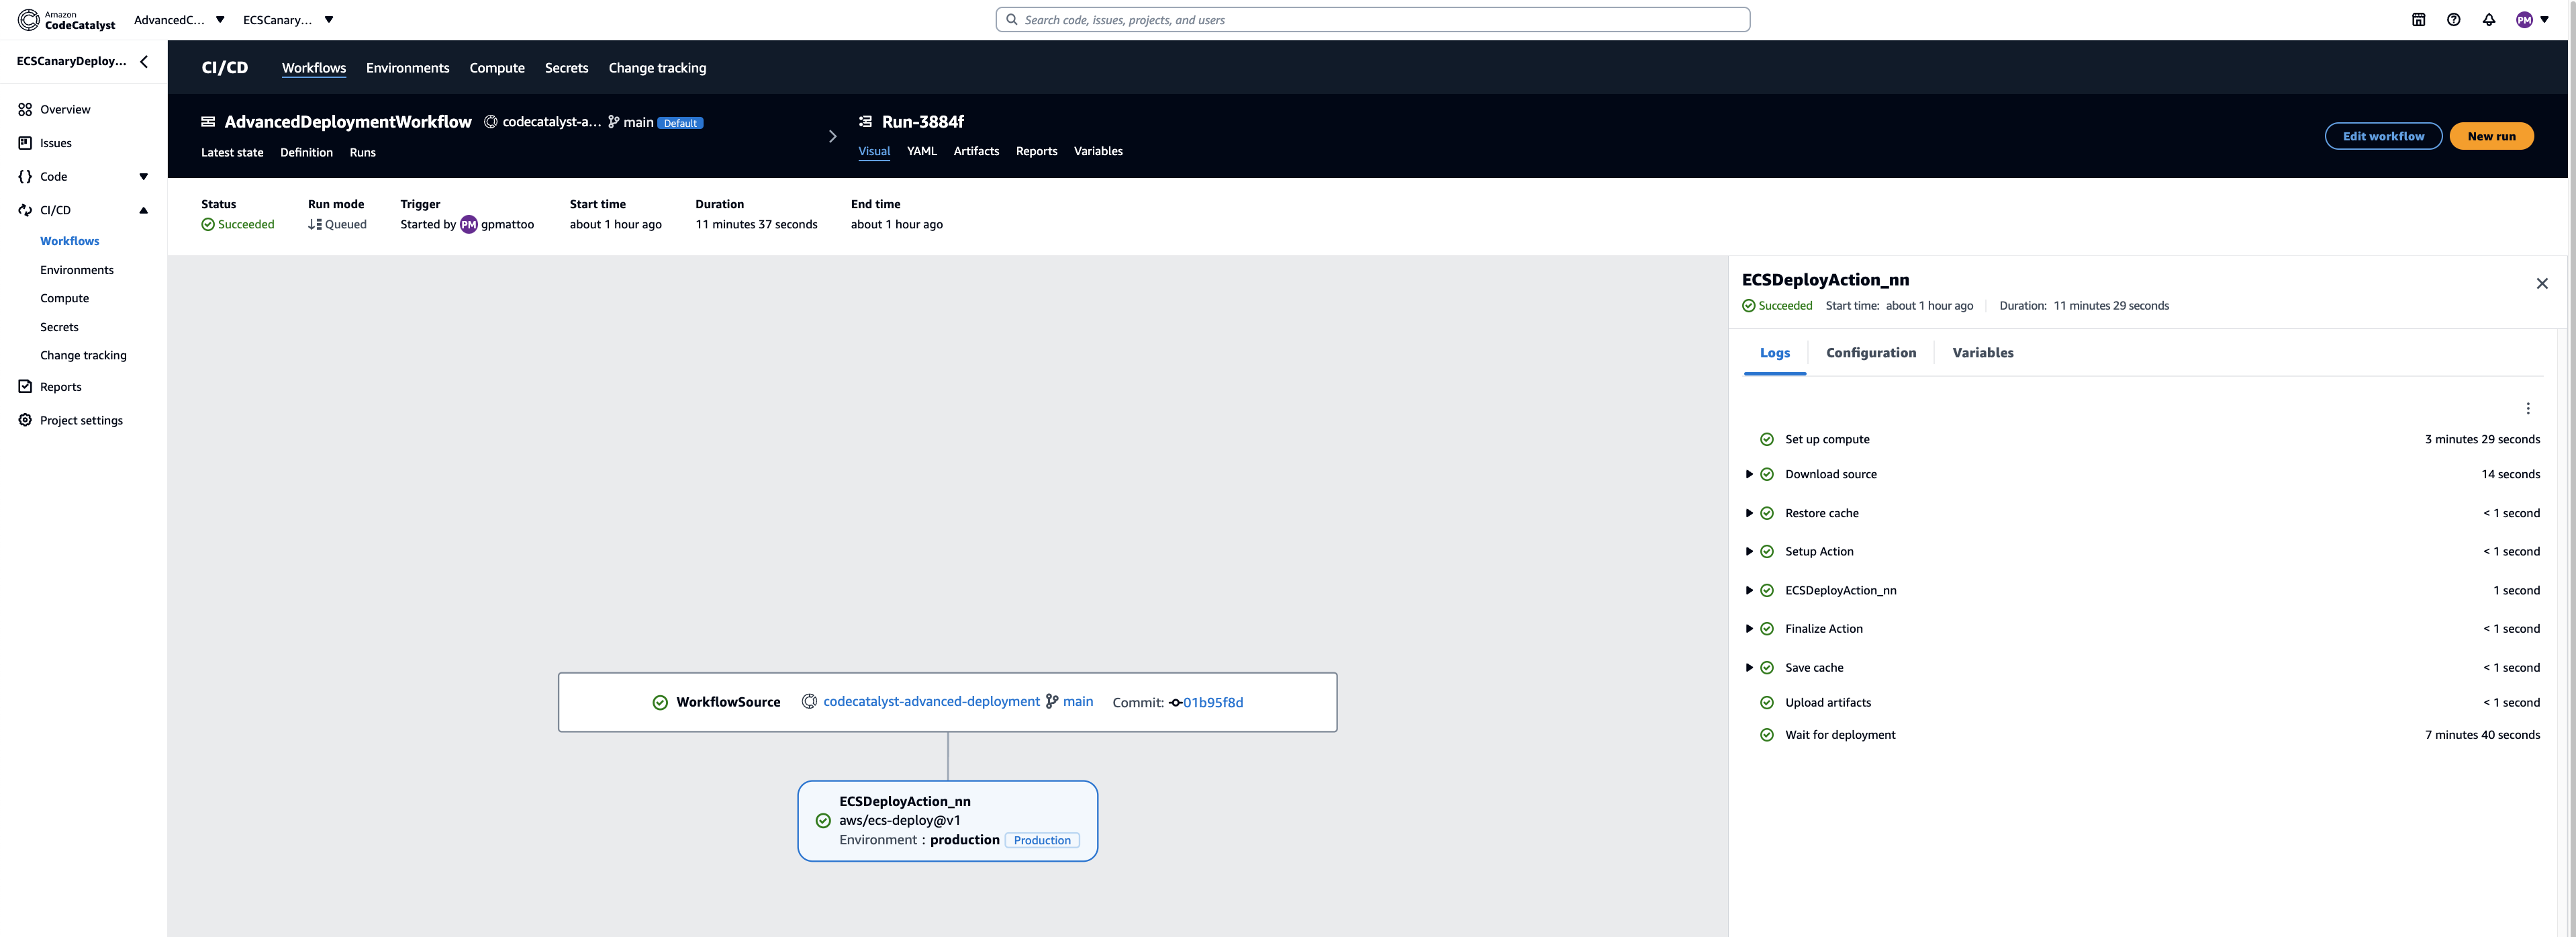
Figure 5: Blue/Green Deployment Progress on Amazon CodeCatalyst
You can also see the deployment status on the AWS CodeDeploy deployment page (Figure 6)
- Going back to the AWS console.
- In the upper left search bar, type in “CodeDeploy”.
- In the left hand menu, select Deployments.
Figure 6: Blue/Green Deployment Progress on AWS CodeDeploy
Let’s review our update, using the load balancer’s URL that you created during pre-requisites, paste it into your browser. Your page should look similar to (Figure 7).

Figure 7: Sample Application (Green version)
Cleanup
If you have been following along with this workflow, you should delete the resources you deployed so you do not continue to incur charges.
- Delete the Amazon ECS service and Amazon ECS cluster from AWS console.
- Manually delete Amazon CodeCatalyst dev environment, source repository and project from your CodeCatalyst Space.
- Delete the AWS CodeDeploy application through console or CLI.
Conclusion
In this post, we demonstrated how you can configure Blue/Green deployments for your container workloads using Amazon CodeCatalyst workflows. The same approach can be used to configure Canary deployments as well. Learn more about AWS CodeDeploy configuration for advanced container deployments in AWS CodeDeploy user guide.
Kernel prepatch 6.7-rc5
Post Syndicated from corbet original https://lwn.net/Articles/954469/
The 6.7-rc5 kernel prepatch is out for
testing.
Nothing looks particularly scary, which is good, because if it had
been, I wouldn’t have had the capacity to deal with it last week.Let’s hope it stays that way even as I am getting better. Because the
holidays are almost upon us, and I’m woefully underprepared.
Two stable kernels
Post Syndicated from jake original https://lwn.net/Articles/954454/
Greg Kroah-Hartman has announced the release of the 6.6.6 and 6.1.67 stable kernels. Both contain a single
reversion of the “wifi: cfg80211: fix CQM for non-range use” patch.
Security updates for Monday
Post Syndicated from jake original https://lwn.net/Articles/954449/
Security updates have been issued by Debian (chromium), Fedora (bluez, chromium, and curl), Red Hat (apr), Slackware (libxml2), and Ubuntu (squid3 and tar).
Best of the History Guy: The Cold War
Post Syndicated from The History Guy: History Deserves to Be Remembered original https://www.youtube.com/watch?v=0KQEvmz8xa0