Post Syndicated from The Atlantic original https://www.youtube.com/watch?v=XZrfgPrO4wk
What Happiness Is and How to Build It, With Arthur C. Brooks | The Atlantic Festival 2023
Post Syndicated from The Atlantic original https://www.youtube.com/watch?v=0Q0FQYk87r0
How Can We Bridge Political Divides? With Utah Governor Spencer Cox | The Atlantic Festival 2023
Post Syndicated from The Atlantic original https://www.youtube.com/watch?v=X8Wq1TM9ZEw
OpenAI CTO Mira Murati on Chatbots and Artificial General Intelligence | The Atlantic Festival 2023
Post Syndicated from The Atlantic original https://www.youtube.com/watch?v=Z3KSrAxZsqc
Christianity Today’s Russell Moore on the Evangelical Church’s Future | The Atlantic Festival 2023
Post Syndicated from The Atlantic original https://www.youtube.com/watch?v=00dFEHUOISU
Enable Security Hub partner integrations across your organization
Post Syndicated from Joaquin Manuel Rinaudo original https://aws.amazon.com/blogs/security/enable-security-hub-partner-integrations-across-your-organization/
AWS Security Hub offers over 75 third-party partner product integrations, such as Palo Alto Networks Prisma, Prowler, Qualys, Wiz, and more, that you can use to send, receive, or update findings in Security Hub.
We recommend that you enable your corresponding Security Hub third-party partner product integrations when you use these partner solutions. By centralizing findings across your AWS and partner solutions in Security Hub, you can get a holistic cross-account and cross-Region view of your security risks. In this way, you can move beyond security reporting and start implementing automations on top of Security Hub that help improve your overall security posture and reduce manual efforts. For example, you can configure your third-party partner offerings to send findings to Security Hub and build standardized enrichment, escalation, and remediation solutions by using Security Hub automation rules, or other AWS services such as AWS Lambda or AWS Step Functions.
To enable partner integrations, you must configure the integration in each AWS Region and AWS account across your organization in AWS Organizations. In this blog post, we’ll show you how to set up a Security Hub partner integration across your entire organization by using AWS CloudFormation StackSets.
Overview
Figure 1 shows the architecture of the solution. The main steps are as follows:
- The deployment script creates a CloudFormation template that deploys a stack set across your AWS accounts.
- The stack in the member account deploys a CloudFormation custom resource using a Lambda function.
- The Lambda function iterates through target Regions and invokes the Security Hub boto3 method enable_import_findings_for_product to enable the corresponding partner integration.
When you add new accounts to the organizational units (OUs), StackSets deploys the CloudFormation stack and the partner integration is enabled.
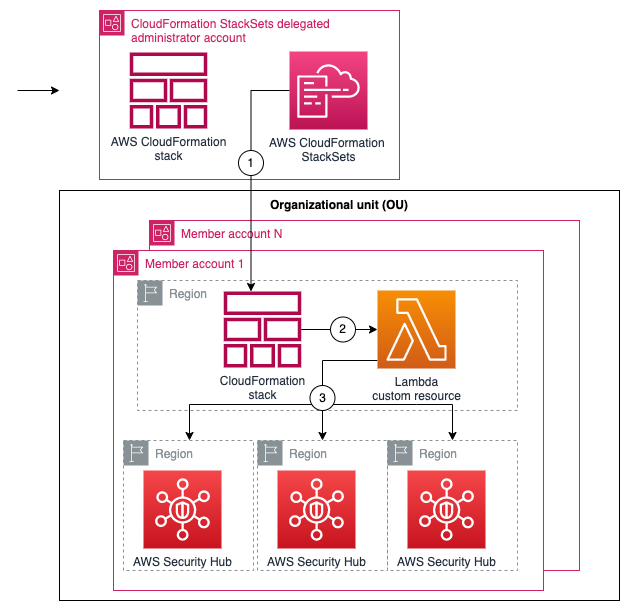
Figure 1: Diagram of the solution
Prerequisites
To follow along with this walkthrough, make sure that you have the following prerequisites in place:
- Security Hub enabled across an organization in the Regions where you want to deploy the partner integration.
- Trusted access with AWS Organizations enabled so that you can deploy CloudFormation StackSets across your organization. For instructions on how to do this, see Activate trusted access with AWS Organizations.
- Permissions to deploy CloudFormation StackSets in a delegated administrator account for your organization.
- AWS Command Line Interface (AWS CLI) installed.
Walkthrough
Next, we show you how to get started with enabling your partner integration across your organization using the following solution.
Step 1: Clone the repository
In the AWS CLI, run the following command to clone the aws-securityhub-deploy-partner-integration GitHub repository:
Step 2: Set up the integration parameters
- Open the parameters.json file and configure the following values:
- ProductName — Name of the product that you want to enable.
- ProductArn — The unique Amazon Resource Name (ARN) of the Security Hub partner product. For example, the product ARN for Palo Alto PRISMA Cloud Enterprise, is arn:aws:securityhub:<REGION>:188619942792:product/paloaltonetworks/redlock; and for Prowler, it’s arn:aws:securityhub:<REGION>::product/prowler/prowler. To find a product ARN, see Available third-party partner product integrations.
- DeploymentTargets — List of the IDs of the OUs of the AWS accounts that you want to configure. For example, use the unique identifier (ID) for the root to deploy across your entire organization.
- DeploymentRegions — List of the Regions in which you’ve enabled Security Hub, and for which the partner integration should be enabled.
- Save the changes and close the file.
Step 3: Deploy the solution
- Open a command line terminal of your preference.
- Set up your AWS_REGION (for example, export AWS_REGION=eu-west-1) and make sure that your credentials are configured for the delegated administrator account.
- Enter the following command to deploy:
Step 4: Verify Security Hub partner integration
To test that the product integration is enabled, run the following command in one of the accounts in the organization. Replace <TARGET-REGION> with one of the Regions where you enabled Security Hub.
Step 5: (Optional) Manage new partners, Regions, and OUs
To add or remove the partner integration in certain Regions or OUs, update the parameters.json file with your desired Regions and OU IDs and repeat Step 3 to redeploy changes to your Security Hub partner integration. You can also directly update the CloudFormation parameters for the securityhub-integration-<PARTNER-NAME> from the CloudFormation console.
To enable new partner integrations, create a new parameters.json file version with the partner’s product name and product ARN to deploy a new stack using the deployment script from Step 3. In the next step, we show you how to disable the partner integrations.
Step 6: Clean up
If needed, you can remove the partner integrations by destroying the stack deployed. To destroy the stack, use the command line terminal configured with the credentials for the AWS StackSets delegated administrator account and run the following command:
You can also directly delete the stack mentioned in Step 5 from the CloudFormation console by accessing the stack page from the CloudFormation console, selecting the stack securityhub-integration-<PARTNER-NAME>, and then choosing Delete.
Conclusion
In this post, you learned how you to enable Security Hub partner integrations across your organization. Now you can configure the partner product of your choice to send, update, or receive Security Hub findings.
You can extend your security automation by using Security Hub automation rules, Amazon EventBridge events, and Lambda functions to start or enrich automated remediation of new ingested findings from partners. For an example of how to do this, see Automated Security Response on AWS.
Developer teams can opt in to configure their own chatbot in AWS Chatbot to receive notifications in Amazon Chime, Slack, or Microsoft Teams channels. Lastly, security teams can use existing bidirectional integrations with Jira Service Management or Jira Core to escalate severe findings to their developer teams.
If you have feedback about this post, submit comments in the Comments section below. If you have questions about this post, start a new thread on the AWS Security, Identity, & Compliance re:Post or contact AWS Support.
Want more AWS Security news? Follow us on Twitter.
1.1.1.1 lookup failures on October 4th, 2023
Post Syndicated from Ólafur Guðmundsson original http://blog.cloudflare.com/1-1-1-1-lookup-failures-on-october-4th-2023/
On 4 October 2023, Cloudflare experienced DNS resolution problems starting at 07:00 UTC and ending at 11:00 UTC. Some users of 1.1.1.1 or products like WARP, Zero Trust, or third party DNS resolvers which use 1.1.1.1 may have received SERVFAIL DNS responses to valid queries. We’re very sorry for this outage. This outage was an internal software error and not the result of an attack. In this blog, we’re going to talk about what the failure was, why it occurred, and what we’re doing to make sure this doesn’t happen again.
Background
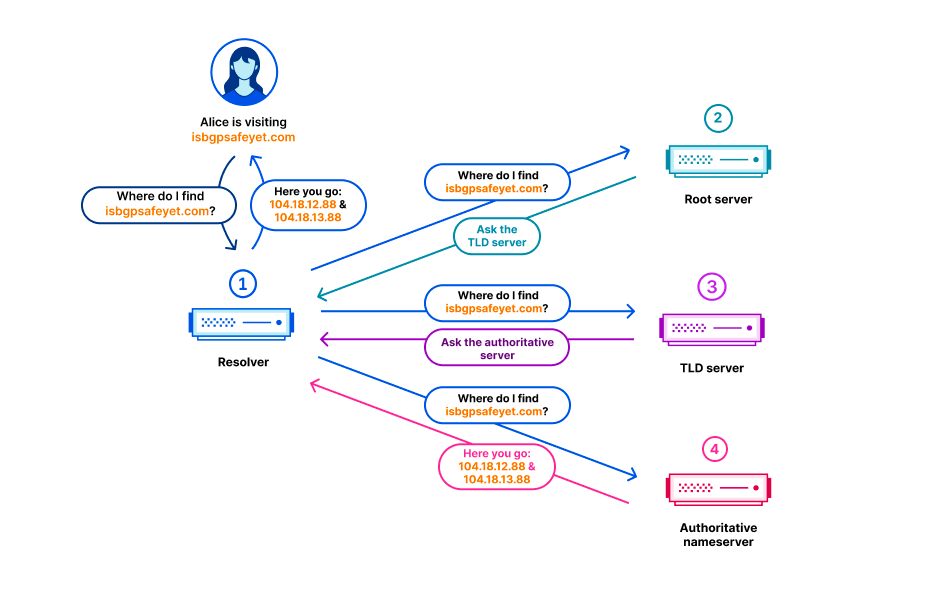
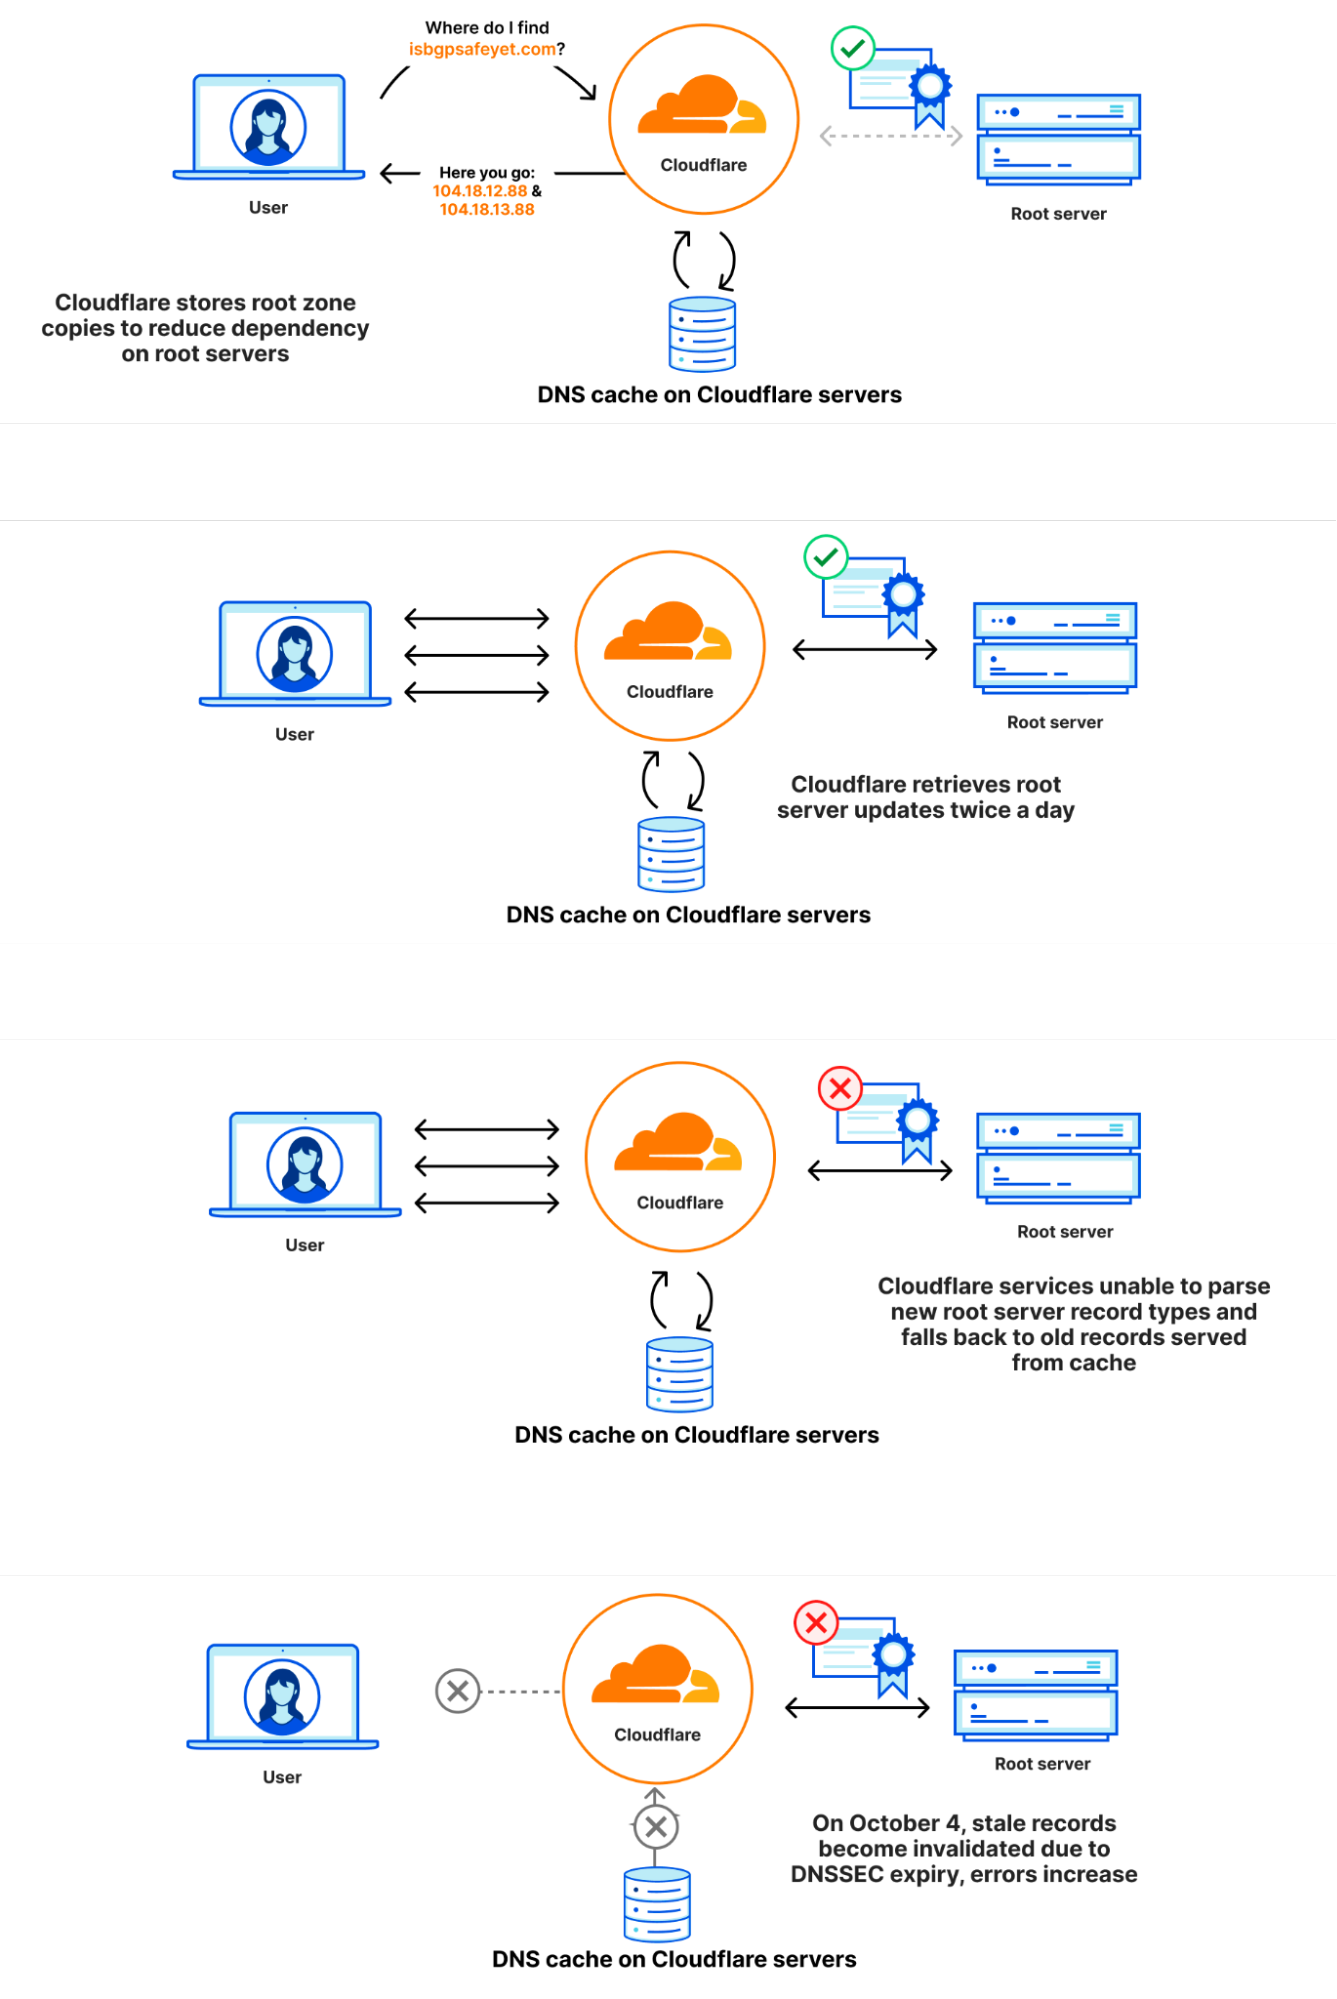
In the Domain Name System (DNS), every domain name exists within a DNS zone. The zone is a collection of domain names and host names that are controlled together. For example, Cloudflare is responsible for the domain name cloudflare.com, which we say is in the “cloudflare.com” zone. The .com top-level domain (TLD) is owned by a third party and is in the “com” zone. It gives directions on how to reach cloudflare.com. Above all of the TLDs is the root zone, which gives directions on how to reach TLDs. This means that the root zone is important in being able to resolve all other domain names. Like other important parts of the DNS, the root zone is signed with DNSSEC, which means the root zone itself contains cryptographic signatures.
The root zone is published on the root servers, but it is also common for DNS operators to retrieve and retain a copy of the root zone automatically so that in the event that the root servers cannot be reached, the information in the root zone is still available. Cloudflare’s recursive DNS infrastructure takes this approach as it also makes the resolution process faster. New versions of the root zone are normally published twice a day. 1.1.1.1 has a WebAssembly app called static_zone running on top of the main DNS logic that serves those new versions when they are available.
What happened
On 21 September, as part of a known and planned change in root zone management, a new resource record type was included in the root zones for the first time. The new resource record is named ZONEMD, and is in effect a checksum for the contents of the root zone.
The root zone is retrieved by software running in Cloudflare’s core network. It is subsequently redistributed to Cloudflare’s data centers around the world. After the change, the root zone containing the ZONEMD record continued to be retrieved and distributed as normal. However, the 1.1.1.1 resolver systems that make use of that data had problems parsing the ZONEMD record. Because zones must be loaded and served in their entirety, the system’s failure to parse ZONEMD meant the new versions of the root zone were not used in Cloudflare’s resolver systems. Some of the servers hosting Cloudflare's resolver infrastructure failed over to querying the DNS root servers directly on a request-by-request basis when they did not receive the new root zone. However, others continued to rely on the known working version of the root zone still available in their memory cache, which was the version pulled on 21 September before the change.
On 4 October 2023 at 07:00 UTC, the DNSSEC signatures in the version of the root zone from 21 September expired. Because there was no newer version that the Cloudflare resolver systems were able to use, some of Cloudflare’s resolver systems stopped being able to validate DNSSEC signatures and as a result started sending error responses (SERVFAIL). The rate at which Cloudflare resolvers generated SERVFAIL responses grew by 12%. The diagrams below illustrate the progression of the failure and how it became visible to users.
Incident timeline and impact
21 September 6:30 UTC: Last successful pull of the root zone
4 October 7:00 UTC: DNSSEC signatures in the root zone obtained on 21 September expired causing an increase in SERVFAIL responses to client queries.
7:57: First external reports of unexpected SERVFAILs started coming in.
8:03: Internal Cloudflare incident declared.
8:50: Initial attempt made at stopping 1.1.1.1 from serving responses using the stale root zone file with an override rule.
10:30: Stopped 1.1.1.1 from preloading the root zone file entirely.
10:32: Responses returned to normal.
11:02: Incident closed.
This below chart shows the timeline of impact along with the percentage of DNS queries that returned with a SERVFAIL error:
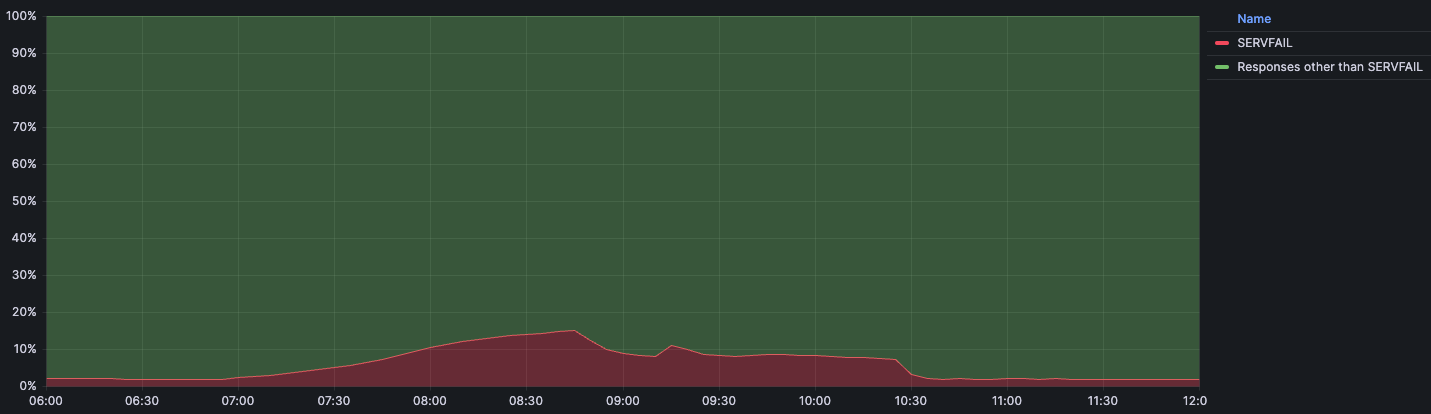
We expect a baseline volume of SERVFAIL errors for regular traffic during normal operation. Usually that percentage sits at around 3%. These SERVFAILs can be caused by legitimate issues in the DNSSEC chain, failures to connect to authoritative servers, authoritative servers taking too long to respond, and many others. During the incident the amount of SERVFAILs peaked at 15% of total queries, although the impact was not evenly distributed around the world and was mainly concentrated in our larger data centers like Ashburn, Virginia; Frankfurt, Germany; and Singapore.
Why this incident happened
Why parsing the ZONEMD record failed
DNS has a binary format for storing resource records. In this binary format the type of the resource record (TYPE) is stored as a 16-bit integer. The type of resource record determines how the resource data (RDATA) is parsed. When the record type is 1, this means it is an A record, and the RDATA can be parsed as an IPv4 address. Record type 28 is an AAAA record, whose RDATA can be parsed as an IPv6 address instead. When a parser runs into an unknown resource type it won’t know how to parse its RDATA, but fortunately it doesn’t have to: the RDLENGTH field indicates how long the RDATA field is, allowing the parser to treat it as an opaque data element.
                                   1  1  1  1  1  1
      0  1  2  3  4  5  6  7  8  9  0  1  2  3  4  5
    +--+--+--+--+--+--+--+--+--+--+--+--+--+--+--+--+
    |                                               |
    /                                               /
    /                      NAME                     /
    |                                               |
    +--+--+--+--+--+--+--+--+--+--+--+--+--+--+--+--+
    |                      TYPE                     |
    +--+--+--+--+--+--+--+--+--+--+--+--+--+--+--+--+
    |                     CLASS                     |
    +--+--+--+--+--+--+--+--+--+--+--+--+--+--+--+--+
    |                      TTL                      |
    |                                               |
    +--+--+--+--+--+--+--+--+--+--+--+--+--+--+--+--+
    |                   RDLENGTH                    |
    +--+--+--+--+--+--+--+--+--+--+--+--+--+--+--+--|
    /                     RDATA                     /
    /                                               /
    +--+--+--+--+--+--+--+--+--+--+--+--+--+--+--+--+
The reason static_zone didn’t support the new ZONEMD record is because up until now we had chosen to distribute the root zone internally in its presentation format, rather than in the binary format. When looking at the text representation for a few resource records we can see there is a lot more variation in how different records are presented.
.			86400	IN	SOA	a.root-servers.net. nstld.verisign-grs.com. 2023100400 1800 900 604800 86400
.			86400	IN	RRSIG	SOA 8 0 86400 20231017050000 20231004040000 46780 . J5lVTygIkJHDBt6HHm1QLx7S0EItynbBijgNlcKs/W8FIkPBfCQmw5BsUTZAPVxKj7r2iNLRddwRcM/1sL49jV9Jtctn8OLLc9wtouBmg3LH94M0utW86dKSGEKtzGzWbi5hjVBlkroB8XVQxBphAUqGxNDxdE6AIAvh/eSSb3uSQrarxLnKWvHIHm5PORIOftkIRZ2kcA7Qtou9NqPCSE8fOM5EdXxussKChGthmN5AR5S2EruXIGGRd1vvEYBrRPv55BAWKKRERkaXhgAp7VikYzXesiRLdqVlTQd+fwy2tm/MTw+v3Un48wXPg1lRPlQXmQsuBwqg74Ts5r8w8w==
.			518400	IN	NS	a.root-servers.net.
.			86400	IN	ZONEMD	2023100400 1 241 E375B158DAEE6141E1F784FDB66620CC4412EDE47C8892B975C90C6A102E97443678CCA4115E27195B468E33ABD9F78C
When we run into an unknown resource record it’s not always easy to know how to handle it. Because of this, the library we use to parse the root zone at the edge does not make an attempt at doing so, and instead returns a parser error.
Why a stale version of the root zone was used
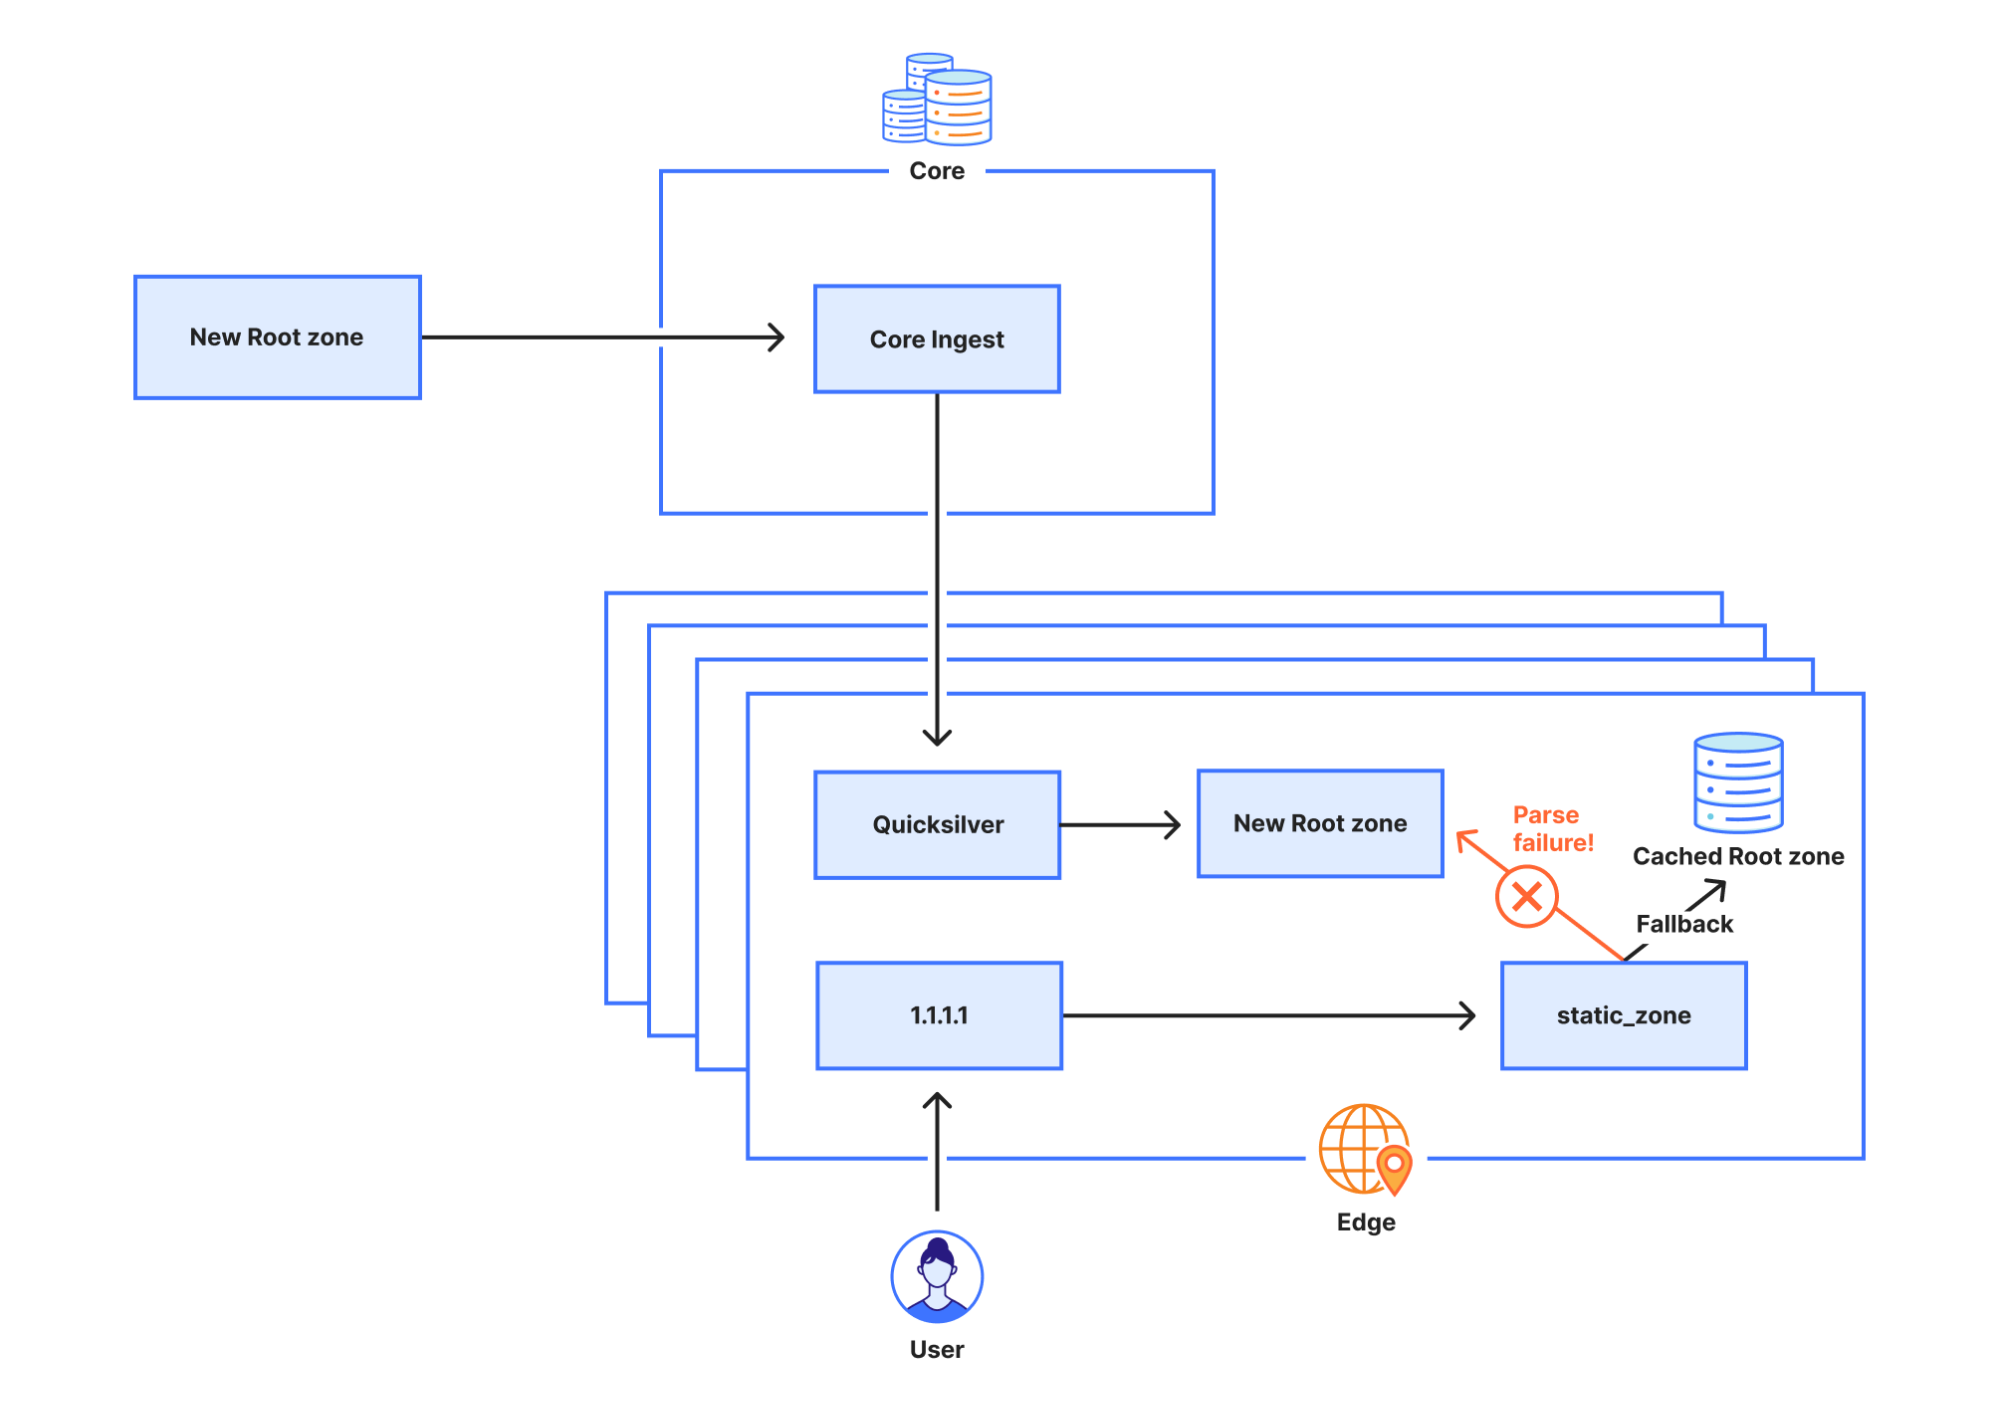
The static_zone app, tasked with loading and parsing the root zone for the purpose of serving the root zone locally (RFC 7706), stores the latest version in memory. When a new version is published it parses it and, when successfully done so, drops the old version. However, as parsing failed the static_zone app never switched to a newer version, and instead continued using the old version indefinitely. When the 1.1.1.1 service is first started the static_zone app does not have an existing version in memory. When it tries to parse the root zone it fails in doing so, but because it does not have an older version of the root zone to fall back on, it falls back on querying the root servers directly for incoming requests.
Why the initial attempt at disabling static_zone didn’t work
Initially we tried to disable the static_zone app through override rules, a mechanism that allows us to programmatically change some behavior of 1.1.1.1. The rule we deployed was:
phase = pre-cache set-tag rec_disable_static
For any incoming request this rule adds the tag rec_disable_static to the request. Inside the static_zone app we check for this tag and, if it’s set, we do not return a response from the cached, static root zone. However, to improve cache performance queries are sometimes forwarded to another node if the current node can’t find the response in its own cache. Unfortunately, the rec_disable_static tag is not included in the queries being forwarded to other nodes, which caused the static_zone app to continue replying with stale information until we eventually disabled the app entirely.
Why the impact was partial
Cloudflare regularly performs rolling reboots of the servers that host our services for tasks like kernel updates that can only take effect after a full system restart. At the time of this outage, resolver server instances that were restarted between the ZONEMD change and the DNSSEC invalidation did not contribute to impact. If they had restarted during this two-week period, they would have failed to load the root zone on startup and fallen back to resolving by sending DNS queries to root servers instead. In addition, the resolver uses a technique called serve stale (RFC 8767) with the purpose of being able to continue to serve popular records from a potentially stale cache to limit the impact. A record is considered to be stale once the TTL amount of seconds has passed since the record was retrieved from upstream. This prevented a total outage; impact was mainly felt in our largest data centers which had many servers that had not restarted the 1.1.1.1 service in that timeframe.
Remediation and follow-up steps
This incident had widespread impact, and we take the availability of our services very seriously. We have identified several areas of improvement and will continue to work on uncovering any other gaps that could cause a recurrence.
Here is what we are working on immediately:
Visibility: We’re adding alerts to notify when static_zone serves a stale root zone file. It should not have been the case that serving a stale root zone file went unnoticed for as long as it did. If we had been monitoring this better, with the caching that exists, there would have been no impact. It is our goal to protect our customers and their users from upstream changes.
Resilience: We will re-evaluate how we ingest and distribute the root zone internally. Our ingestion and distribution pipelines should handle new RRTYPEs seamlessly, and any brief interruption to the pipeline should be invisible to end users.
Testing: Despite having tests in place around this problem, including tests related to unreleased changes in parsing the new ZONEMD records, we did not adequately test what happens when the root zone fails to parse. We will improve our test coverage and the related processes.
Architecture: We should not use stale copies of the root zone past a certain point. While it’s certainly possible to continue to use stale root zone data for a limited amount of time, past a certain point there are unacceptable operational risks. We will take measures to ensure that the lifetime of cached root zone data is better managed as described in RFC 8806: Running a Root Server Local to a Resolver.
Conclusion
We are deeply sorry that this incident happened. There is one clear message from this incident: do not ever assume that something is not going to change! Many modern systems are built with a long chain of libraries that are pulled into the final executable, each one of those may have bugs or may not be updated early enough for programs to operate correctly when changes in input happen. We understand how important it is to have good testing in place that allows detection of regressions and systems and components that fail gracefully on changes to input. We understand that we need to always assume that “format” changes in the most critical systems of the internet (DNS and BGP) are going to have an impact.
We have a lot to follow up on internally and are working around the clock to make sure something like this does not happen again.
Les échecs des recherches sur le résolveur 1.1.1.1 le 4 octobre 2023
Post Syndicated from Ólafur Guðmundsson original http://blog.cloudflare.com/fr-fr/1-1-1-1-lookup-failures-on-october-4th-2023-fr-fr/
Le 4 octobre 2023, Cloudflare a rencontré des problèmes de résolution DNS à partir de 7 h UTC, et ce jusqu’à 11 h UTC. Certains utilisateurs de 1.1.1.1 ou de produits tels que WARP, Zero Trust ou d’autres résolveurs DNS tiers utilisant 1.1.1.1 peuvent avoir reçu des réponses SERVFAIL DNS à leurs requêtes, pourtant valides. Nous sommes sincèrement désolés pour cette panne. Celle-ci était due à une erreur logicielle interne et n’était aucunement le résultat d’une attaque. Cet article de blog va nous permettre de discuter de la nature de cette défaillance, des raisons pour lesquelles elle s’est produite et des mesures que nous avons mises en œuvre pour nous assurer qu’une telle situation ne se reproduise jamais.
Contexte
Dans le Domain Name System (DNS, système de noms de domaine), chaque nom de domaine existe au sein d’une zone DNS. Cette zone constitue un ensemble de noms de domaine et de noms d’hôte, contrôlés conjointement. Pour prendre un exemple, Cloudflare est responsable du nom de domaine cloudflare.com, que nous disons se trouver dans la zone « cloudflare.com ». Le domaine de premier niveau (TLD, Top-Level Domain) « .com » est détenu par un tiers et se situe dans la zone « com ». Il donne des indications sur la manière d’atteindre cloudflare.com. Au-dessus de tous les TLD se trouve la zone racine, qui donne des informations sur la marche à suivre pour joindre les TLD. La zone racine joue donc un rôle important, car elle permet la résolution de tous les autres domaines. Comme d’autres composants importants du DNS, la zone racine est signée à l’aide de DNSSEC, ce qui veut dire que la zone racine elle-même contient des signatures cryptographiques.
La zone racine est publiée sur les serveurs racines, mais il est également courant pour les opérateurs de DNS de récupérer automatiquement et de conserver une copie de la zone racine afin que les informations contenues dans cette dernière restent disponibles au cas où les serveurs racines ne seraient pas joignables. L’infrastructure DNS récursive de Cloudflare adopte cette approche, car elle permet également d’accélérer le processus de résolution. De nouvelles versions de la zone racine sont généralement publiées deux fois par jour. Le résolveur 1.1.1.1 dispose d’une application WebAssembly nommée « static_zone » et exécutée en parallèle de la logique DNS principale. C’est cette application qui transmet les nouvelles versions lorsqu’elles sont disponibles.
Que s’est-il passé ?
Le 21 septembre, dans le cadre d’une modification connue et planifiée de la gestion de la zone racine, un nouveau type d’enregistrement de ressource a été inclus dans les zones racines pour la première fois. Baptisé ZONEMD, ce nouvel enregistrement de ressource constitue, dans les faits, une somme de contrôle pour le contenu de la zone racine.
Cette zone est récupérée à l’aide d’un logiciel exécuté au sein du réseau central de Cloudflare. Elle est ensuite redistribuée vers les datacenters Cloudflare partout dans le monde. Après la modification, la zone racine contenant l’enregistrement ZONEMD a continué à être récupéré et distribué comme à la normale. Toutefois, les systèmes du résolveur 1.1.1.1 qui utilisent ces données ont éprouvé des difficultés pour analyser l’enregistrement ZONEMD record. Comme les zones doivent être chargées et transmises dans leur intégralité, l’échec de l’analyse de ZONEMD impliquait que la zone racine n’était pas utilisée dans les systèmes de résolution de Cloudflare. Certains des serveurs hébergeant l’infrastructure du résolveur de Cloudflare ne parvenaient pas à interroger les serveurs DNS racines directement, requête par requête, car ils n’avaient pas reçu la nouvelle zone racine. D’autres, toutefois, continuaient à se reposer sur la version fonctionnelle connue de cette dernière, toujours disponible dans leur mémoire cache, c’est-à-dire la version extraite le 21 septembre, avant la modification.
Le 4 octobre 2023, à 7 h UTC, les signatures DNSSEC de la version de la zone racine datant du 21 septembre ont expiré. Comme il n’existait aucune nouvelle version de cette zone que les systèmes de résolution de Cloudflare pouvaient utiliser, certains de ces derniers ont commencé à ne plus être en mesure de valider les signatures DNSSEC et ont par conséquent commencé à envoyer des messages d’erreur en guise de réponse (SERVFAIL). Le taux de génération de réponses SERVFAIL par les résolveurs de Cloudflare a augmenté de 12 %. Les schémas ci-dessous illustrent la progression de l’erreur et la manière dont elle est devenue visible pour les utilisateurs.
Chronologie et répercussions de l’incident
21 septembre 6 h 30 UTC : dernière extraction réussie de la zone racine.
4 octobre 7 h UTC : expiration des signatures DNSSEC contenues dans la zone racine obtenue le 21 septembre, avec pour résultat une augmentation des réponses SERVFAIL aux requêtes des clients.
7 h 57 : arrivée des premiers signalements externes de réponses SERVFAIL inattendues.
8 h 03 : déclaration de l’incident en interne chez Cloudflare.
8 h 50 : tentative initiale visant à empêcher le résolveur 1.1.1.1 d’émettre des réponses basées sur le fichier de zone racine obsolète à l’aide d’une règle de forçage.
10 h 30 : déploiement d’une mesure empêchant le résolveur 1.1.1.1 de précharger le fichier de zone racine dans son intégralité.
10 h 32 : retour à la normale des réponses.
11 h 02 : fin de l’incident.
Le graphique ci-dessous montre la frise chronologique des répercussions par rapport au pourcentage de requêtes DNS ayant reçu une erreur SERVFAIL en réponse :
Nous nous attendons à un certain volume de base d’erreurs SERVFAIL pour le trafic normal, en période d’activité normale. Ce pourcentage se situe généralement autour des 3 %. Ces erreurs SERVFAIL peuvent résulter de problèmes légitimes au sein de la chaîne DNSSEC, d’échecs de la connexion aux serveurs de référence, d’un délai de réponse trop long de la part des serveurs de référence et de bien d’autres sources. Au cours de l’incident, la quantité d’erreurs SERVFAIL s’est élevée à 15 % du total des requêtes. L’impact n’était toutefois pas distribué de manière homogène à travers le monde et se concentrait principalement dans nos plus grands datacenters, comme ceux d’Ashburn, en Virginia, de Francfort, en Allemagne, et de Singapour.
Les raisons à l’origine de l’incident
Pourquoi l’analyse de l’enregistrement ZONEMD a échoué
Le DNS utilise un format binaire pour stocker les enregistrements de ressources. Sous ce format binaire, le type de l’enregistrement de ressource (TYPE) est stocké sous la forme d’un nombre entier à 16 bits. Le type d’enregistrement de ressource détermine la manière dont les données de la ressource (RDATA) sont analysées. Un type d’enregistrement défini sur 1 signifie qu’il s’agit d’un enregistrement A et que les RDATA peuvent être considérées comme une adresse IPv4. En réciproque, le type 28 désigne un enregistrement AAAA, dont les RDATA peuvent être analysées sous la forme d’une adresse IPv6. Un analyseur qui rencontre un type d’enregistrement inconnu ne saura pas comment analyser ses RDATA, mais n’aura heureusement pas à le faire : le champ RDLENGTH indique la longueur du champ RDATA, soit un paramètre qui permet à l’analyseur de traiter l’enregistrement comme un élément de données opaque.
                                   1  1  1  1  1  1
      0  1  2  3  4  5  6  7  8  9  0  1  2  3  4  5
    +--+--+--+--+--+--+--+--+--+--+--+--+--+--+--+--+
    |                                               |
    /                                               /
    /                      NAME                     /
    |                                               |
    +--+--+--+--+--+--+--+--+--+--+--+--+--+--+--+--+
    |                      TYPE                     |
    +--+--+--+--+--+--+--+--+--+--+--+--+--+--+--+--+
    |                     CLASS                     |
    +--+--+--+--+--+--+--+--+--+--+--+--+--+--+--+--+
    |                      TTL                      |
    |                                               |
    +--+--+--+--+--+--+--+--+--+--+--+--+--+--+--+--+
    |                   RDLENGTH                    |
    +--+--+--+--+--+--+--+--+--+--+--+--+--+--+--+--|
    /                     RDATA                     /
    /                                               /
    +--+--+--+--+--+--+--+--+--+--+--+--+--+--+--+--+
L’application static_zone n’a pas pris en charge le nouvel enregistrement ZONEMD, car jusqu’ici, nous avions choisi de distribuer la zone racine en interne sous son format de présentation, plutôt que sous son format binaire. Lorsque nous observons la représentation texte de quelques enregistrements de ressource, nous pouvons constater la présence de bien plus de variations dans la manière dont les différents enregistrements sont présentés.
.			86400	IN	SOA	a.root-servers.net. nstld.verisign-grs.com. 2023100400 1800 900 604800 86400
.			86400	IN	RRSIG	SOA 8 0 86400 20231017050000 20231004040000 46780 . J5lVTygIkJHDBt6HHm1QLx7S0EItynbBijgNlcKs/W8FIkPBfCQmw5BsUTZAPVxKj7r2iNLRddwRcM/1sL49jV9Jtctn8OLLc9wtouBmg3LH94M0utW86dKSGEKtzGzWbi5hjVBlkroB8XVQxBphAUqGxNDxdE6AIAvh/eSSb3uSQrarxLnKWvHIHm5PORIOftkIRZ2kcA7Qtou9NqPCSE8fOM5EdXxussKChGthmN5AR5S2EruXIGGRd1vvEYBrRPv55BAWKKRERkaXhgAp7VikYzXesiRLdqVlTQd+fwy2tm/MTw+v3Un48wXPg1lRPlQXmQsuBwqg74Ts5r8w8w==
.			518400	IN	NS	a.root-servers.net.
.			86400	IN	ZONEMD	2023100400 1 241 E375B158DAEE6141E1F784FDB66620CC4412EDE47C8892B975C90C6A102E97443678CCA4115E27195B468E33ABD9F78C
Lorsque nous rencontrons un enregistrement de ressource inconnu, il n’est pas toujours évident de savoir comment le traiter. De ce fait, la bibliothèque que nous utilisons pour analyser la zone racine en périphérie de notre réseau ne s’y risque même pas et renvoie à la place une erreur d’analyse.
Pourquoi une version obsolète de la zone racine a été utilisée
L’application static_zone, chargée de charger et d’analyser la zone racine afin de diffuser cette dernière localement (RFC 7706), stocke la dernière version en mémoire. Lorsqu’une nouvelle version est publiée et qu’elle l’analyse (et qu’elle y parvient !), l’application abandonne l’ancienne version. Toutefois, comme l’analyse a échoué, l’application static_zone n’est jamais passée à la nouvelle version et a continué d’utiliser l’ancienne indéfiniment. Quand le service 1.1.1.1 est lancé pour la première fois, l’application static_zone ne dispose pas d’une version existante en mémoire. Lorsque l’application tente d’analyser la zone racine, mais qu’elle n’y parvient pas, elle se rabat sur l’interrogation directe des serveurs racines concernant les requêtes entrantes, car elle ne dispose pas d’une version plus ancienne de la zone racine sur laquelle se replier.
Pourquoi la tentative initiale de désactiver static_zone n’a pas fonctionné
Au départ, nous avons tenté de désactiver l’application static_zone par le biais d’une règle de forçage, un mécanisme qui nous permet de modifier certains comportements du résolveur 1.1.1.1 de manière programmatique. La règle que nous avons déployée était la suivante :
phase = pre-cache set-tag rec_disable_static
Cette règle ajoute à chaque requête entrante la balise rec_disable_static. Nous vérifions la présence de cette balise au sein de l’application static_zone et, si nous la voyons apparaître, nous ne renvoyons pas de réponse de la zone racine statique, mise en cache. Toutefois, afin d’améliorer les performances du cache, les requêtes sont parfois transférées à un autre nœud, si le nœud actuel ne parvient pas à trouver la réponse dans son propre cache. Malheureusement, la balise rec_disable_static n’est pas incluse dans les requêtes transférées aux autres nœuds. C’est ce qui a amené l’application static_zone à continuer à répondre par des informations obsolètes, jusqu’à ce que nous désactivions totalement l’application.
Pourquoi les impacts ont été partiels
Cloudflare procède régulièrement au redémarrage alterné des serveurs qui hébergent nos services pour des tâches telles que la mise à jour du noyau, qui ne peut prendre effet qu’après un redémarrage complet du système. Au moment de la défaillance, les instances serveur du résolveur qui avaient été redémarrées entre la modification ZONEMD et l’invalidation des DNSSEC n’ont pas contribué à l’impact. Si elles avaient redémarré au cours de cette période de deux semaines, elles n’auraient pas pu charger la zone racine au démarrage et s’en seraient remises à la résolution par envoi de requêtes DNS aux serveurs racines à la place. En outre, le résolveur utilise une technique nommée « Diffuser du contenu obsolète » (RFC 8767) dans le but de pouvoir continuer à diffuser des enregistrements populaires depuis un cache potentiellement obsolète afin de limiter les impacts. Un enregistrement est considéré comme obsolète lorsqu’un nombre de secondes égal au TTL s’est écoulé depuis que l’enregistrement a été récupéré en amont. Cette fonctionnalité a évité une défaillance totale. Les impacts se sont fait principalement sentir dans nos plus grands datacenters, qui disposaient de nombreux serveurs n’ayant pas redémarré le service 1.1.1.1 au cours de cette période.
Mesures de correction et de suivi
Cet incident a eu des répercussions très étendues. En outre, nous prenons la disponibilité de nos services très au sérieux. Nous avons identifié plusieurs domaines d’amélioration et continuerons à nous efforcer de dénicher d’éventuelles autres lacunes susceptibles d’entraîner une récidive.
Dans l’immédiat, nous travaillons sur ce qui suit :
Visibilité : nous allons ajouter des alertes conçues pour nous informer lorsque l’application static_zone diffuse un fichier de zone racine obsolète. En effet, cette diffusion n’aurait pas dû passer inaperçue aussi longtemps. Si nous avions mieux surveillé la zone racine (et grâce aux possibilités de mise en cache existantes), la défaillance n’aurait eu aucun impact. Notre objectif consiste à protéger nos clients et leurs utilisateurs des modifications en amont.
Résilience : nous allons réévaluer la manière dont nous ingérons et distribuons la zone racine en interne. Nos pipelines d’ingestion et de distribution doivent pouvoir traiter les RRTYPE sans accroc et les éventuelles interruptions brèves du pipeline doivent être invisibles pour les utilisateurs finaux.
Tests : malgré la présence de tests en place autour de ce problème, y compris de tests liés à des modifications non publiées pour l’analyse des nouveaux enregistrements ZONEMD, nous n’avons pas suffisamment testé ce qui se produit lorsque l’analyse de la zone racine échoue. Nous allons améliorer notre couverture de tests, de même que les processus connexes.
Architecture : nous ne devrions pas utiliser de copies obsolètes de la zone racine passé un certain point. S’il est certes possible de continuer à utiliser des données de zone racine pendant une période limitée, ces dernières entraînent des risques opérationnels inacceptables après un moment. Nous allons prendre des mesures pour nous assurer que la durée de vie des données de zone racine mises en cache soit mieux gérée, comme décrit dans la RFC 8806 : Running a Root Server Local to a Resolver (Exécuter un serveur racine en local pour un résolveur).
Conclusion
Nous sommes profondément désolés que cet incident se soit produit. Nous en retirons un message clair : il ne fait jamais supposer que rien ne va changer ! De nombreux systèmes modernes sont bâtis autour d’une longue chaîne de bibliothèques extraites au sein de l’exécutable final et chacune d’elles peut comporter des bugs ou ne pas être mise à jour suffisamment tôt pour que les programmes puissent fonctionner correctement lorsque des changements se produisent au niveau des intrants. Nous comprenons l’importance du fait de disposer d’une bonne structure de tests en place, capable de détecter les régressions, de même que les systèmes et les composants qui rencontrent des défaillances invisibles au premier abord après une modification des intrants. Nous savons que nous devons toujours partir du principe que les changements de « format » au niveau des systèmes les plus essentiels d’Internet (le DNS et le BGP) auront forcément des répercussions.
Nous avons beaucoup de suivi à effectuer en interne et travaillons sans relâche pour nous assurer que ce genre d’incident ne se reproduise plus jamais.
1.1.1.1 Lookup-Fehler am 4. Oktober 2023
Post Syndicated from Ólafur Guðmundsson original http://blog.cloudflare.com/de-de/1-1-1-1-lookup-failures-on-october-4th-2023-de-de/
Am 4. Oktober 2023 traten bei Cloudflare Probleme bei der DNS-Auflösung auf, die um 07:00 UTC begannen und um 11:00 UTC endeten. Einige Nutzer von 1.1.1.1 oder Produkten wie WARP, Zero Trust oder DNS-Resolvern von Drittanbietern, die 1.1.1.1 verwenden, haben möglicherweise SERVFAIL DNS-Antworten auf gültige Anfragen erhalten. Wir möchten uns vielmals für diesen Ausfall entschuldigen. Dieser Ausfall war ein interner Softwarefehler und nicht das Ergebnis eines Angriffs. In diesem Blogartikel werden wir erläutern, was der Fehler war, warum er auftrat und was wir unternehmen, um sicherzustellen, dass sich so etwas nicht wiederholt.
Hintergrund
Im Domain Name System (DNS) existiert jeder Domain-Name innerhalb einer DNS-Zone. Die Zone ist eine Sammlung von Domain-Namen und Host-Namen, die gemeinsam kontrolliert werden. So ist Cloudflare beispielsweise für die Domain cloudflare.com verantwortlich, die sich in der Zone „cloudflare.com“ befindet. Die Top-Level-Domain (TLD) .com gehört einer dritten Partei und befindet sich in der Zone „com“. Sie gibt Auskunft darüber, wie cloudflare.com zu erreichen ist. Über allen TLDs befindet sich die Root-Zone, die Hinweise darauf gibt, wie die TLDs erreicht werden. Das bedeutet, dass die Root-Zone wichtig ist, um alle anderen Domain-Namen auflösen zu können. Wie andere wichtige Teile des DNS ist auch die Root-Zone mit DNSSEC signiert, was bedeutet, dass die Root-Zone selbst kryptografische Signaturen enthält.
Die Root-Zone wird aufden Root-Servern, veröffentlicht, es ist jedoch auch üblich, dass DNS-Betreiber automatisch eine Kopie der Root-Zone abrufen und aufbewahren. Damit sind die Informationen in der Root-Zone auch dann noch verfügbar, wenn die Root-Server nicht erreichbar sind. Die rekursive DNS-Infrastruktur von Cloudflare verfolgt diesen Ansatz, da er auch den Auflösungsprozess beschleunigt. Neue Versionen der Root-Zone werden normalerweise zweimal täglich veröffentlicht. 1.1.1.1 verfügt über eine WebAssembly-Anwendung namens static_zone, die über der Haupt-DNS-Logik läuft und diese neuen Versionen bereitstellt, sobald sie verfügbar sind.
Was ist passiert?
Am 21. September wurde im Rahmen einer bekannten und geplanten Änderung der Verwaltung der Root-Zonen erstmals ein neuer Typ von Ressourceneintrag in die Root-Zonen aufgenommen. Der neue Ressourceneintrag trägt die Bezeichnung ZONEMD und ist im Grunde eine Prüfsumme für den Inhalt der Root-Zone.
Die Root-Zone wird von einer Software abgerufen, die im Kernnetzwerk von Cloudflare läuft. Anschließend wird sie an die Rechenzentren von Cloudflare auf der ganzen Welt weiterverteilt. Nach der Änderung wurde die Root-Zone, die den ZONEMD-Eintrag enthält, weiterhin wie gewohnt abgerufen und verteilt. Die 1.1.1.1-Resolver-Systeme, die diese Daten verwenden, hatten jedoch Probleme beim Parsen des ZONEMD-Eintrags. Da Zonen in ihrer Gesamtheit geladen und bereitgestellt werden müssen, bedeutete das Versagen des Systems beim Parsen von ZONEMD, dass die neuen Versionen der Root-Zone nicht in den Resolver-Systemen von Cloudflare verwendet wurden. Einige der Server, die die Resolver-Infrastruktur von Cloudflare hosten, gingen dazu über, die DNS-Root-Server direkt abzufragen, wenn sie die neue Root-Zone nicht erhalten haben. Andere verließen sich jedoch weiterhin auf die bekannte funktionierende Version der Root-Zone, die noch in ihrem Speichercache vorhanden war, d. h. die Version, die am 21. September vor der Änderung abgerufen wurde.
Am 4. Oktober 2023 um 07:00 UTC sind die DNSSEC-Signaturen in der Version der Root-Zone vom 21. September abgelaufen. Da es keine neuere Version gab, die die Cloudflare-Resolversysteme verwenden konnten, waren einige der Cloudflare-Resolversysteme nicht mehr in der Lage, DNSSEC-Signaturen zu validieren und begannen daher, Fehlerantworten (SERVFAIL) zu übermitteln. Die Rate, mit der Cloudflare-Resolver SERVFAIL-Antworten generierten, stieg um 12 %. Die folgenden Abbildungen veranschaulichen den Verlauf des Ausfalls und wie er für die Nutzer sichtbar wurde.
Zeitlicher Ablauf und Auswirkungen des Vorfalls
21. September 6:30 UTC: Letzter erfolgreicher Abruf (Pull) der Root-Zone
4. Oktober 7:00 UTC: DNSSEC-Signaturen in der Root-Zone, die am 21. September erhalten wurden, sind abgelaufen, was zu einem Anstieg der SERVFAIL-Antworten auf Client-Abfragen führt.
7:57: Erste externe Berichte über unerwartete SERVFAILs treffen ein.
8:03: Interner Cloudflare-Vorfall gemeldet.
8:50: Ein erster Versuch wird unternommen, den 1.1.1.1-Dienst mittels einer Override-Regel davon abzuhalten, Antworten mit der veralteten Root-Datei zu übermitteln.
10:30: 1.1.1.1 hat das Vorladen der Root-Zonendatei vollständig gestoppt.
10:32: Die Antworten sind wieder normal.
11:02: Vorfall abgeschlossen.
Das folgende Diagramm zeigt den zeitlichen Verlauf der Auswirkungen zusammen mit dem Prozentsatz der DNS-Abfragen, auf die ein SERVFAIL-Fehler ausgegeben wurde:
Bei normalem Traffic erwarten wir ein bestimmtes Volumen an SERVFAIL-Fehlern im Normalbetrieb. Normalerweise liegt dieser Prozentsatz bei etwa 3 %. Diese SERVFAILs können durch legitime Probleme in der DNSSEC-Kette, Fehler bei der Verbindung zu autoritativen Servern, zu lange Antwortzeiten der autoritativen Server und viele andere Faktoren verursacht werden. Während des Vorfalls erreichte die Anzahl der SERVFAILs einen Spitzenwert von 15 % der gesamten Abfragen, obwohl die Auswirkungen nicht gleichmäßig über die Welt verteilt waren und sich hauptsächlich auf unsere größeren Rechenzentren wie Ashburn, Virginia, Frankfurt und Singapur konzentrierten.
Warum es zu diesem Vorfall kam
Warum das Parsen des ZONEMD-Eintrags fehlgeschlagen ist
DNS hat ein binäres Format für die Speicherung von Ressourceneinträgen. In diesem Binärformat wird der Typ des Ressourceneintrags (TYPE) als 16-Bit-Integer gespeichert. Der Typ des Ressourceneintrags bestimmt, wie die Ressourcendaten (RDATA) geparst werden. Wenn der Eintragstyp 1 ist, bedeutet dies, dass es sich um einen A-Eintrag handelt und die RDATA als IPv4-Adresse geparst werden kann. Eintragstyp 28 ist ein AAAA-Eintrag, dessen RDATA stattdessen als IPv6-Adresse geparst werden kann. Wenn ein Parser auf einen unbekannten Ressourcentyp stößt, weiß er nicht, wie er dessen RDATA parsen soll, aber glücklicherweise muss er das auch nicht: Das Feld RDLENGTH gibt an, wie lang das RDATA-Feld ist, so dass der Parser es als undurchsichtiges Datenelement behandeln kann.
                                   1  1  1  1  1  1
      0  1  2  3  4  5  6  7  8  9  0  1  2  3  4  5
    +--+--+--+--+--+--+--+--+--+--+--+--+--+--+--+--+
    |                                               |
    /                                               /
    /                      NAME                     /
    |                                               |
    +--+--+--+--+--+--+--+--+--+--+--+--+--+--+--+--+
    |                      TYPE                     |
    +--+--+--+--+--+--+--+--+--+--+--+--+--+--+--+--+
    |                     CLASS                     |
    +--+--+--+--+--+--+--+--+--+--+--+--+--+--+--+--+
    |                      TTL                      |
    |                                               |
    +--+--+--+--+--+--+--+--+--+--+--+--+--+--+--+--+
    |                   RDLENGTH                    |
    +--+--+--+--+--+--+--+--+--+--+--+--+--+--+--+--|
    /                     RDATA                     /
    /                                               /
    +--+--+--+--+--+--+--+--+--+--+--+--+--+--+--+--+
Warum static_zone den neuen ZONEMD-Eintrag noch nicht unterstützte? Weil wir uns bisher dafür entschieden hatten, die Root-Zone intern in ihrem Darstellungsformat und nicht im Binärformat zu verteilen. Ein Blick auf die Textdarstellung einiger Ressourceneinträge zeigt, dass es bei der Darstellung der verschiedenen Datensätze sehr viel mehr Unterschiede gibt.
.			86400	IN	SOA	a.root-servers.net. nstld.verisign-grs.com. 2023100400 1800 900 604800 86400
.			86400	IN	RRSIG	SOA 8 0 86400 20231017050000 20231004040000 46780 . J5lVTygIkJHDBt6HHm1QLx7S0EItynbBijgNlcKs/W8FIkPBfCQmw5BsUTZAPVxKj7r2iNLRddwRcM/1sL49jV9Jtctn8OLLc9wtouBmg3LH94M0utW86dKSGEKtzGzWbi5hjVBlkroB8XVQxBphAUqGxNDxdE6AIAvh/eSSb3uSQrarxLnKWvHIHm5PORIOftkIRZ2kcA7Qtou9NqPCSE8fOM5EdXxussKChGthmN5AR5S2EruXIGGRd1vvEYBrRPv55BAWKKRERkaXhgAp7VikYzXesiRLdqVlTQd+fwy2tm/MTw+v3Un48wXPg1lRPlQXmQsuBwqg74Ts5r8w8w==
.			518400	IN	NS	a.root-servers.net.
.			86400	IN	ZONEMD	2023100400 1 241 E375B158DAEE6141E1F784FDB66620CC4412EDE47C8892B975C90C6A102E97443678CCA4115E27195B468E33ABD9F78C
Wenn wir auf einen unbekannten Ressourceneintrag stoßen, ist es nicht immer einfach zu wissen, wie wir damit umgehen sollen. Aus diesem Grund unternimmt die Bibliothek, die wir zum Parsen der Root-Zone an der Edge verwenden, keinen entsprechenden Versuch und gibt stattdessen einen Parser-Fehler aus.
Warum eine veraltete Version der Root-Zone verwendet wurde
Die static_zone-App, die mit dem Laden und Parsen der Root-Zone beauftragt ist, um die Root-Zone lokal bereitzustellen (RFC 7706), speichert die neueste Version im Speicher. Wenn eine neue Version veröffentlicht wird, parst sie diese und verwirft bei erfolgreichem Parsen die alte Version. Da das Parsen jedoch fehlschlug, wechselte die static_zone-App nie zu einer neueren Version, sondern verwendete stattdessen weiterhin die alte Version auf unbestimmte Zeit. Wenn der 1.1.1.1-Dienst zum ersten Mal gestartet wird, hat die static_zone-App keine bestehende Version im Speicher. Wenn sie versucht, die Root-Zone zu analysieren, schlägt dies fehl, aber da sie nicht auf eine ältere Version der Root-Zone zurückgreifen kann, fragt sie die Root-Server direkt nach eingehenden Anfragen ab.
Warum der erste Versuch, static_zone zu deaktivieren, nicht funktioniert hat
Zunächst versuchten wir, die static_zone-App durch Überschreibungsregeln zu deaktivieren, ein Mechanismus, mit dem wir einige Verhaltensweisen von 1.1.1.1 programmatisch ändern können. Die von uns angewandte Regel lautete:
phase = pre-cache set-tag rec_disable_static
Bei jeder eingehenden Anfrage fügt diese Regel das Tag rec_disable_static zur Anfrage hinzu. In der static_zone-App wird auf dieses Tag geprüft, und wenn es gesetzt ist, wird keine Antwort aus der gecachten, statischen Root-Zone ausgegeben. Zur Verbesserung der Cache-Performance werden Abfragen jedoch manchmal an einen anderen Knoten weitergeleitet, wenn der aktuelle Knoten die Antwort nicht in seinem eigenen Cache finden kann. Leider ist das rec_disable_static-Tag nicht in den Abfragen enthalten, die an andere Knoten weitergeleitet werden, was dazu führte, dass die static_zone-App weiterhin mit veralteten Informationen antwortete, bis wir die App schließlich ganz deaktivierten.
Warum die Auswirkungen nur teilweise eintraten
Cloudflare führt regelmäßig fortlaufende Neustarts der Server durch, auf denen unsere Dienste gehostet werden, um Aufgaben wie Kernel-Updates durchzuführen, die nur nach einem vollständigen Neustart des Systems wirksam werden können. Zum Zeitpunkt dieses Ausfalls trugen Resolver-Server-Instanzen, die zwischen der ZONEMD-Änderung und der DNSSEC-Ungültigmachung neu gestartet wurden, nicht zu den Auswirkungen bei. Hätten sie während dieses zweiwöchigen Zeitraums neu gestartet, hätten sie die Root-Zone beim Start nicht geladen und stattdessen DNS-Abfragen an Root-Server gesendet. Darüber hinaus verwendet der Resolver eine Technik namens „serve stale“ (RFC 8767) mit dem Ziel, beliebte Einträge aus einem möglicherweise veralteten Cache weiter zu übermitteln, um die Auswirkungen zu begrenzen. Ein Eintrag gilt als veraltet, wenn die TTL-Sekundenzahl seit dem Abruf des Eintrags aus dem vorgelagerten Bereich verstrichen ist. Dadurch konnte ein Totalausfall verhindert werden; die Auswirkungen waren vor allem in unseren größten Rechenzentren zu spüren, in denen viele Server standen, die den 1.1.1.1-Dienst in diesem Zeitraum nicht neu gestartet hatten.
Abhilfe- und Folgemaßnahmen
Dieser Vorfall hatte weitreichende Auswirkungen, und wir nehmen die Verfügbarkeit unserer Dienste sehr ernst. Wir haben mehrere Bereiche identifiziert, in denen Verbesserungen möglich sind, und werden weiter daran arbeiten, weitere Lücken aufzudecken, die einen erneutes Auftreten verursachen könnten.
An diesen Aspekten arbeiten wir sofort:
Sichtbarkeit: Wir fügen Warnungen hinzu, um zu benachrichtigen, wenn static_zone eine veraltete Root-Zonendatei bereitstellt. Es hätte nicht sein dürfen, dass das Bereitstellen einer veralteten Root-Zonendatei so lange unbemerkt bleibt, wie es der Fall war. Hätten wir dies besser überwacht, hätte es dank der vorhandenen Zwischenspeicherung keine Auswirkungen gegeben. Unser Ziel ist es, unsere Kunden und deren Nutzer vor vorgelagerten Änderungen zu schützen.
Ausfallsicherheit: Wir werden neu bewerten, wie wir die Root-Zone intern einlesen und verteilen. Unsere Aufnahme- und Verteilungspipelines sollten neue RRTYPEs nahtlos verarbeiten, und jede kurze Unterbrechung der Pipeline sollte für Endnutzer nicht sichtbar sein.
Tests: Obwohl wir Tests zu diesem Problem durchgeführt haben, einschließlich Tests zu noch nicht veröffentlichten Änderungen beim Parsen der neuen ZONEMD-Einträge, haben wir nicht ausreichend getestet, was passiert, wenn die Root-Zone nicht geparst werden kann. Wir werden den Testumfang und die damit verbundenen Prozesse verbessern.
Architektur: Wir sollten ab einem bestimmten Punkt keine veralteten Kopien der Root-Zone mehr verwenden. Es ist zwar möglich, veraltete Root-Zonendaten für eine begrenzte Zeit weiter zu verwenden, aber ab einem bestimmten Punkt gibt es inakzeptable Betriebsrisiken. Wir werden Maßnahmen ergreifen, um sicherzustellen, dass die Lebensdauer von gecachten Root-Zonendaten besser verwaltet wird, wie in „RFC 8806: Running a Root Server Local to a Resolver“ beschrieben.
Fazit
Wir bedauern zutiefst, dass es zu diesem Vorfall gekommen ist. Aus diesem Vorfall ergibt sich eine klare Botschaft: Gehen Sie niemals davon aus, dass sich etwas nicht ändern wird! Viele moderne Systeme bestehen aus einer langen Kette von Bibliotheken, die in die endgültige ausführbare Datei einfließen. Jede dieser Bibliotheken kann Fehler enthalten oder nicht früh genug aktualisiert werden, damit die Programme bei Änderungen der Eingaben korrekt funktionieren. Wir wissen, wie wichtig gute Tests sind, die es ermöglichen, Regressionen zu erkennen und Systeme und Komponenten zu entwickeln, die bei Änderungen der Eingaben zuverlässig versagen. Wir verstehen, dass wir immer davon ausgehen müssen, dass „Format“-Änderungen in den kritischsten Systemen des Internets (DNS und BGP) Auswirkungen haben werden.
Wir haben intern viel zu klären und arbeiten rund um die Uhr, um sicherzustellen, dass sich so etwas nicht wiederholt.
Fallos de la búsqueda de 1.1.1.1 del 4 de octubre de 2023
Post Syndicated from Ólafur Guðmundsson original http://blog.cloudflare.com/es-es/1-1-1-1-lookup-failures-on-october-4th-2023-es-es/
El 4 de octubre de 2023, Cloudflare sufrió problemas en la resolución de DNS entre las 07:00 y las 11:00 UTC. Algunos usuarios de 1.1.1.1 o de productos como WARP, Zero Trust o de solucionadores DNS externos que utilicen 1.1.1.1 pueden haber recibido respuestas SERVFAIL DNS a consultas válidas. Lamentamos mucho esta interrupción. Fue debido a un error interno del software y no fue consecuencia de ningún ataque. En esta publicación del blog, hablaremos acerca de en qué consistió el fallo, por qué se produjo y qué estamos haciendo para garantizar que no se repita.
Antecedentes
En el sistema de nombres de dominio (DNS), cada nombre de dominio existe en una zona DNS, que está formada por un conjunto de nombres de dominio y nombres de servidor que se controlan juntos. Por ejemplo, Cloudflare es responsable del nombre de dominio cloudflare.com, que decimos que está en la zona “cloudflare.com”. El dominio de nivel superior (TLD) .com es propiedad de un tercero y está en la zona “com”. Proporciona indicaciones acerca de cómo llegar a cloudflare.com. Por encima de todos los TLD se encuentra la zona raíz, que ofrece indicaciones acerca de cómo llegar a los TLD. Esto significa que la zona raíz es importante para poder resolver todos los demás nombres de dominio. Al igual que otros componentes importantes del DNS, la zona raíz está firmada con DNSSEC, lo que significa que la propia zona raíz contiene firmas criptográficas.
La zona raíz se publica en los servidores raíz, pero también es habitual que los operadores de DNS recuperen y conserven automáticamente una copia de la zona raíz. De esta forma, en el caso de que no se pueda contactar con los servidores raíz, la información de la zona raíz seguirá estando disponible. La infraestructura DNS recursiva de Cloudflare adopta este enfoque, ya que también acelera el proceso de resolución. Las nuevas versiones de la zona raíz suelen publicarse dos veces al día. 1.1.1.1 tiene una aplicación WebAssembly denominada static_zone que se ejecuta sobre la lógica de DNS principal que entrega estas nuevas versiones cuando están disponibles.
Qué pasó
El 21 de septiembre, como parte de un cambio conocido y planificado en la gestión de las zonas raíz, se incluyó por primera vez en ellas un nuevo registro de recurso, denominado ZONEMD, que en realidad es una suma de comprobación del contenido de la zona raíz.
La zona raíz se recupera mediante software que se ejecuta en la red principal de Cloudflare. A continuación se redistribuye a los centros de datos de Cloudflare en todo el mundo. Tras el cambio, la recuperación y distribución de la zona raíz que contenía el registro ZONEMD continuaron con normalidad. Sin embargo, los sistemas de resolución de 1.1.1.1 que utilizan estos datos tuvieron problemas al analizar el registro ZONEMD. Debido a que las zonas se deben cargar y entregar en su totalidad, el hecho de que el sistema no pudiera analizar el registro ZONEMD significó que las nuevas versiones de la zona raíz no se utilizaban en los sistemas de resolución de Cloudflare. Algunos de los servidores que alojan la infraestructura de resolución de Cloudflare, al no recibir la nueva zona raíz, pasaron a consultar los servidores raíz DNS directamente a nivel individual para cada solicitud. No obstante, otros continuaron confiando en la versión funcional conocida de la zona raíz aún disponible en su caché de memoria, que era la versión obtenida el 21 de septiembre antes del cambio.
El 4 de octubre de 2023 a las 07:00 UTC, las firmas DNSSEC en la versión de la zona raíz del 21 de septiembre caducaron. Puesto que no había ninguna versión más nueva que los sistemas de resolución de Cloudflare pudieran utilizar, algunos de ellos dejaron de poder validar las firmas DNSSEC y, como resultado, empezaron a enviar respuestas de error (SERVFAIL). La velocidad a la que los solucionadores de Cloudflare generaron respuestas SERVFAIL aumentó un 12 %. Los diagramas siguientes muestran la evolución del fallo y cómo se visualizó para los usuarios.
Cronología e impacto del incidente
21 de septiembre 6:30 UTC: última extracción correcta de la zona raíz.
4 de octubre 7:00 UTC: las firmas DNSSEC en la zona raíz obtenidas el 21 de septiembre caducan, lo que causa un incremento de las respuestas SERVFAIL a las consultas de los clientes.
7:57: se empiezan a recibir las primeras notificaciones externas acerca de respuestas SERVFAIL inesperadas.
8:03: se declara un incidente interno de Cloudflare.
8:50: se realiza un intento inicial con una regla de anulación para evitar que 1.1.1.1 entregue respuestas utilizando el archivo de zona raíz obsoleto.
10:30: se evita que 1.1.1.1 precargue el archivo de zona raíz en su totalidad.
10:32: las respuestas vuelven a la normalidad.
11:02: se cierra el incidente.
El gráfico siguiente muestra la cronología del impacto del incidente junto con el porcentaje de consultas DNS que se devolvieron con un error SERVFAIL:
Esperamos un volumen de línea base de errores SERVFAIL para el tráfico habitual durante el funcionamiento normal. Ese porcentaje suele girar en torno al 3 %. Estos errores SERVFAIL pueden ser debidos a problemas reales en la cadena DNSSEC, a la imposibilidad de conectarse a los servidores autoritativos, a que los servidores autoritativos tardan demasiado en responder y a muchos otros motivos. Durante el incidente, el número máximo de errores SERVFAIL fue del 15 % del total de consultas, aunque la repercusión no fue uniforme en todo el mundo y se concentró principalmente en nuestros centros de datos más grandes, como los de Ashburn (Virginia), Fráncfort (Alemania) y Singapur.
Por qué se produjo este incidente
Por qué falló el análisis del registro ZONEMD
DNS tiene un formato binario para el almacenamiento de registros de recursos. En este formato binario, el tipo del registro de recurso (TYPE) se almacena como un entero de 16 bits. El tipo de registro de recurso determina cómo se analizan los datos del recurso (RDATA). Cuando el tipo de registro es 1, esto significa que es un registro A, y que RDATA se puede analizar como una dirección IPv4. En cambio, el tipo de registro 28 es un registro AAAA, cuyo RDATA se puede analizar como una dirección IPv6. Cuando un analizador se encuentra con un tipo de recurso desconocido, no sabrá cómo analizar su RDATA, pero afortunadamente no tiene que hacerlo: el campo RDLENGTH indica la longitud del campo RDATA, lo que permite al analizador tratarlo como un elemento de datos opaco.
                                   1  1  1  1  1  1
      0  1  2  3  4  5  6  7  8  9  0  1  2  3  4  5
    +--+--+--+--+--+--+--+--+--+--+--+--+--+--+--+--+
    |                                               |
    /                                               /
    /                      NAME                     /
    |                                               |
    +--+--+--+--+--+--+--+--+--+--+--+--+--+--+--+--+
    |                      TYPE                     |
    +--+--+--+--+--+--+--+--+--+--+--+--+--+--+--+--+
    |                     CLASS                     |
    +--+--+--+--+--+--+--+--+--+--+--+--+--+--+--+--+
    |                      TTL                      |
    |                                               |
    +--+--+--+--+--+--+--+--+--+--+--+--+--+--+--+--+
    |                   RDLENGTH                    |
    +--+--+--+--+--+--+--+--+--+--+--+--+--+--+--+--|
    /                     RDATA                     /
    /                                               /
    +--+--+--+--+--+--+--+--+--+--+--+--+--+--+--+--+
El motivo por el que static_zone no admitió el nuevo registro ZONEMD es porque hasta ahora habíamos optado por distribuir la zona raíz internamente en su formato de presentación, en lugar de en formato binario. Si miramos la representación de texto de algunos registros de recursos, podemos ver que hay mucha variación en cómo se presentan los distintos recursos.
.			86400	IN	SOA	a.root-servers.net. nstld.verisign-grs.com. 2023100400 1800 900 604800 86400
.			86400	IN	RRSIG	SOA 8 0 86400 20231017050000 20231004040000 46780 . J5lVTygIkJHDBt6HHm1QLx7S0EItynbBijgNlcKs/W8FIkPBfCQmw5BsUTZAPVxKj7r2iNLRddwRcM/1sL49jV9Jtctn8OLLc9wtouBmg3LH94M0utW86dKSGEKtzGzWbi5hjVBlkroB8XVQxBphAUqGxNDxdE6AIAvh/eSSb3uSQrarxLnKWvHIHm5PORIOftkIRZ2kcA7Qtou9NqPCSE8fOM5EdXxussKChGthmN5AR5S2EruXIGGRd1vvEYBrRPv55BAWKKRERkaXhgAp7VikYzXesiRLdqVlTQd+fwy2tm/MTw+v3Un48wXPg1lRPlQXmQsuBwqg74Ts5r8w8w==
.			518400	IN	NS	a.root-servers.net.
.			86400	IN	ZONEMD	2023100400 1 241 E375B158DAEE6141E1F784FDB66620CC4412EDE47C8892B975C90C6A102E97443678CCA4115E27195B468E33ABD9F78C
Cuando nos encontramos con un registro de recurso desconocido, no siempre es fácil saber cómo gestionarlo. Por este motivo, la biblioteca que utilizamos para analizar la zona raíz en el perímetro no intenta hacer esto, y en su lugar devuelve un error del analizador.
Por qué se utilizó una versión obsoleta de la zona raíz
La aplicación static_zone, cuya tarea es cargar y analizar la zona raíz con la finalidad de entregar la zona raíz a nivel local (RFC 7706), almacena la última versión en memoria. Cuando se publica una nueva versión la analiza y, cuando ha completado correctamente el análisis, descarta la versión anterior. Sin embargo, puesto que el análisis falló, la aplicación static_zone nunca cambió a la nueva versión, y continuó utilizando la versión anterior indefinidamente. Cuando el servicio 1.1.1.1 se inicia por primera vez, la aplicación static_zone no tiene ninguna versión existente en memoria. Cuando intenta analizar la zona raíz, el análisis falla, pero puesto que no tiene ninguna versión anterior de la zona raíz de reserva, recurre a consultar los servidores raíz directamente para las solicitudes entrantes.
Por qué el intento inicial de desactivar static_zone no funcionó
En un principio, intentamos desactivar la aplicación static_zone mediante reglas de anulación, un mecanismo que nos permite modificar mediante programación determinados comportamientos de 1.1.1.1. La regla que implementamos fue la siguiente:
phase = pre-cache set-tag rec_disable_static
Para toda solicitud entrante, esta regla añade la etiqueta rec_disable_static a la solicitud. En la aplicación static_zone, buscamos esta etiqueta y, si está establecida, no devolvemos una respuesta desde la zona raíz estática en caché. No obstante, a fin de mejorar el rendimiento de la caché las consultas a veces se reenvían a otro nodo en el caso de que el nodo actual no pueda encontrar la respuesta en su propia caché. Lamentablemente, la etiqueta rec_disable_static no está incluida en las consultas que se reenvían a otros nodos, por lo que la aplicación static_zone continuó respondiendo con información obsoleta hasta que finalmente desactivamos la aplicación por completo.
Por qué el impacto fue parcial
Cloudflare realiza periódicamente reinicios secuenciales de los servidores que alojan nuestros servicios a fin de realizar tareas como las actualizaciones de kernel, que requieren un reinicio completo del sistema para entrar en vigor. Cuando se produjo esta interrupción, las instancias de servidor de solucionador que se habían reiniciado entre el cambio de ZONEMD y la invalidación de DNSSEC no contribuyeron al impacto. Si se hubieran reiniciado durante este plazo de dos semanas, no habrían podido cargar la zona raíz al iniciarse y habrían recurrido para la resolución a enviar las consultas DNS a los servidores raíz. Además, el solucionador utiliza una técnica denominada serve-stale (RFC 8767) con la finalidad de poder continuar entregando registros populares desde una caché potencialmente obsoleta a fin de limitar el impacto. Se considera que un registro está obsoleto cuando ha transcurrido el número de segundos de TTL desde la recuperación del registro de los niveles superiores. Esto evitó una interrupción total; los afectados fueron principalmente nuestros centros de datos más grandes, donde había muchos servidores que no habían reiniciado el servicio 1.1.1.1 en ese periodo.
Medidas de corrección y seguimiento
Este incidente tuvo una amplia repercusión, y nos tomamos la disponibilidad del servicio muy en serio. Hemos identificado varias áreas de mejora y seguiremos trabajando para descubrir cualquier otra vulnerabilidad que pudiera causar una repetición del incidente.
Estamos trabajando de forma inmediata en lo siguiente:
Visibilidad: hemos añadido alertas que notifican cuando static_zone entrega un archivo de zona raíz obsoleto. Esta entrega de un archivo de zona raíz obsoleto que se ha producido no debería haber pasado inadvertida durante tanto tiempo. Con una mejor supervisión y con el almacenamiento en caché existente, esto no habría tenido ninguna repercusión. Nuestro objetivo global es proteger a nuestros clientes y sus usuarios de los cambios en los niveles superiores.
Resiliencia: reevaluaremos cómo absorbemos y distribuimos la zona raíz internamente. Nuestros procesos de ingesta y distribución deberían gestionar nuevos RRTYPE sin problemas, y cualquier breve interrupción del proceso debería ser invisible para los usuarios finales.
Pruebas: a pesar de realizar pruebas en torno a este problema, incluidas pruebas relacionadas con cambios aún no publicados en el análisis de los nuevos registros ZONEMD, no probamos adecuadamente lo que sucede cuando falla el análisis de la zona raíz. Mejoraremos la cobertura de nuestras pruebas y los procesos relacionados.
Arquitectura: no deberíamos utilizar copias obsoletas de la zona raíz pasado cierto punto. Aunque sin duda es posible continuar utilizando datos de la zona raíz obsoleta durante cierto tiempo, pasado cierto punto esto implica riesgos operativos inaceptables. Tomaremos medidas para garantizar una mejor gestión de la duración de los datos de zona raíz en caché, tal como se describe en RFC 8806: Running a Root Server Local to a Resolver.
Conclusión
Lamentamos mucho este incidente. Y la lección está clara: no debemos asumir nunca que algo no va a cambiar. Muchos sistemas modernos se han desarrollado con una larga cadena de bibliotecas que se añaden al ejecutable final, cada una de las cuales puede contener errores o no haberse actualizado con antelación suficiente para que los programas funcionen correctamente cuando se produzcan cambios en los datos de entrada. Comprendemos la importancia de realizar pruebas adecuadas a fin de poder detectar regresiones y los sistemas y componentes que fallan cuando hay cambios en los datos de entrada. Comprendemos que necesitamos suponer siempre que los cambios de “formato” en los sistemas más críticos de Internet (DNS y BGP) van a tener repercusiones.
Debemos realizar un exhaustivo seguimiento interno y vamos a trabajar sin descanso para garantizar que este tipo de incidente no se repita.
2023年10月4日の1.1.1.1ルックアップ障害
Post Syndicated from Ólafur Guðmundsson original http://blog.cloudflare.com/ja-jp/1-1-1-1-lookup-failures-on-october-4th-2023-ja-jp/
2023年10月4日、Cloudflareで07:00~11:00 (協定世界時) にかけてDNS解決に関する障害が発生しました。一部の1.1.1.1の利用者、または1.1.1.1を使用するWarp 、Zero Trust、サードパーティDNSリゾルバなどの製品の一部の利用者が、有効なクエリに対して「SERVFAIL DNS」応答を受信した可能性があります。この度は、ご迷惑をおかけして大変申し訳ございませんでした。この障害は内部的なソフトウェアのエラーであり、攻撃によるものではありません。このブログでは、障害の経緯、発生理由、そして再発防止に対する当社の取り組みについて説明します。
背景
ドメインネームシステム(DNS)の仕組みでは、すべてのドメイン名はDNSゾーン内に存在します。ゾーンには、ドメイン名とホスト名のセットの集合体が管理されています。たとえば、Cloudflareはcloudflare.comというドメイン名を管理しており、これは「cloudflare.com」ゾーンにあると言えます。トップレベルドメイン(TLD)「.com」はサードパーティが所有し、「com」ゾーンにあります。comによってcloudflare.comへのアクセス方法が示されます。すべてのTLDの上位には各TLDへのアクセス方法を示す、ルートゾーンがあります。そのため、ルートゾーンは他のすべてのドメイン名を解決できるようにするために重要な存在です。DNSの他の重要な部分と同様に、ルートゾーンもDNSSECで署名されており、ルートゾーン自体には暗号署名が含まれています。
ルートゾーンはルートサーバーによって公開されていますが、多くのDNS運用者は一般的にルートサーバーに到達できない場合でもルートゾーンの情報を利用できるようにルートゾーンのコピーを自動的に取得して保持するようにしています。 Cloudflareの再帰DNSインフラストラクチャも解決プロセスを高速化するため、このアプローチを採用しています。ルートゾーンの新バージョンは通常1日2回公開されます。1.1.1.1では、 static_zoneと呼ばれるWebAssemblyアプリがメインのDNSロジックの上で動作しており、新バージョンが公開された段階で新バージョンを提供できるようにしています。
障害発生の原因
9月21日、ルートゾーン管理における既知の計画済みの変更の内容に、ルートゾーンに初めて、チェックサムとして機能する新たなリソースレコードタイプ「ZONEMD」が追加されるというものがありました。
ルートゾーンの情報は、Cloudflareのコアネットワークで動作するソフトウェアによって取得されます。その後、世界中のCloudflareのデータセンターに再配布されます。変更後も、ZONEMDレコードを含むルートゾーンは通常通り取得および配布は継続して実行されていました。しかし、そのデータを利用する1.1.1.1のリゾルバシステムに問題があり、ZONEMDレコードを解析することができませんでした。ゾーンは全体をロードして提供する必要があるため、システムがZONEMDを解析できなかったことにより、ルートゾーンの新バージョンをCloudflareのリゾルバシステムで使用することができなくなりました。Cloudflareのリゾルバインフラストラクチャをホストしているサーバーの中には、新しいルートゾーンの情報を受信できなかった場合、リクエストの都度、DNSルートサーバーに直接問い合わせるようにフェイルオーバーするものもあります。しかし、他のサーバーは、メモリキャッシュに保存されたルートゾーンの既知の動作バージョン(変更前の9月21日に引き出されたバージョン)の利用を続けました。
2023年10月4日7時(協定世界時)、9月21日バージョンのルートゾーンのDNSSECの有効期限が切れました。Cloudflareのリゾルバシステムで利用可能な新しいバージョンが無くなり、Cloudflareの一部のリゾルバシステムがDNSSECシグネチャを検証できなくなり、その結果、エラーレスポンス(SERVFAIL)を送信するようになりました。CloudflareリゾルバのSERVFAILレスポンス生成割合が12%増加する事態となりました。以下の図は、障害の進行と、ユーザーへの影響が表面化した経緯を示しています。
インシデントのタイムラインと影響
9月21 日6:30(協定世界時):ルートゾーンからの最後の情報引き出しの成功
10月4日7:00(協定世界時):9月21日に取得したルートゾーンのDNSSEC署名が期限切れとなり、クライアントからの問い合わせに対するSERVFAIL応答が増加。
7:57:予期せぬSERVFAILに対する最初の外部報告が入り始める。
06:32:Cloudflare社内でインシデントが宣言される。
8:50:オーバーライドルールを使用して、1.1.1.1が古いルートゾーンファイルを使用した応答を提供するのを防ぐ最初の試みを実施。
10:30:1.1.1.1のルートゾーンファイルの事前読み込みを完全に停止。10:32:応答が正常に回復。
11:02:インシデントをクローズ。
この下のグラフは、影響とSERVFAILエラーで返されたDNS問い合わせのパーセンテージを時系列で表したものです:
私たちは、平常時のトラフィックにおけるSERVFAILエラーの基準量(通常値)を3%程度と想定しています。この場合のSERVFAILは、DNSSECチェーンにおける正当な問題、権威サーバーへの接続の失敗、権威サーバーの応答のタイムアウト、その他多くの要因によって引き起こされる可能性があります。インシデントの間、SERVFAILの量は総クエリの15%でピークに達しましたが、その影響は世界中に均等に分散されたわけではなく、アッシュバーン(バージニア州)、フランクフルト(ドイツ)、シンガポールのような大規模なデータセンターに主に集中しました。
インシデント発生の理由
ZONEMDレコードの解析に失敗した理由
DNSは、リソースレコードの格納にバイナリ形式を採用しています。このバイナリ形式では、リソースレコードのタイプ(TYPE)は16ビットの整数として格納されます。リソースレコードのタイプが、リソースデータ(RDATA)の解析方法を決定します。レコードタイプ「1」はAレコードであることを意味し、RDATAはIPv4アドレスとして解析されます。レコードタイプ「28」はAAAAレコードを意味し、RDATAはIPv6アドレスとして解析されます。解析が未知のリソースタイプに遭遇した場合、RDATAの解析方法を判断することができないが、RDLENGTHフィールドがRDATAフィールドの長さを示すため、解析はそれを不明なデータ要素として扱うことができます。
                                   1  1  1  1  1  1
      0  1  2  3  4  5  6  7  8  9  0  1  2  3  4  5
    +--+--+--+--+--+--+--+--+--+--+--+--+--+--+--+--+
    |                                               |
    /                                               /
    /                      NAME                     /
    |                                               |
    +--+--+--+--+--+--+--+--+--+--+--+--+--+--+--+--+
    |                      TYPE                     |
    +--+--+--+--+--+--+--+--+--+--+--+--+--+--+--+--+
    |                     CLASS                     |
    +--+--+--+--+--+--+--+--+--+--+--+--+--+--+--+--+
    |                      TTL                      |
    |                                               |
    +--+--+--+--+--+--+--+--+--+--+--+--+--+--+--+--+
    |                   RDLENGTH                    |
    +--+--+--+--+--+--+--+--+--+--+--+--+--+--+--+--|
    /                     RDATA                     /
    /                                               /
    +--+--+--+--+--+--+--+--+--+--+--+--+--+--+--+--+
static_zoneが新しいZONEMDレコードをサポートしなかった理由は、これまで私たちがルートゾーンをバイナリ形式ではなく、プレゼンテーション形式で内部配布することを選んできたためです。リソースレコードのテキスト表現をいくつか見てみると、異なるレコードの表示形式には、さらに多くのバリエーションがあることがわかります。
.			86400	IN	SOA	a.root-servers.net. nstld.verisign-grs.com. 2023100400 1800 900 604800 86400
.			86400	IN	RRSIG	SOA 8 0 86400 20231017050000 20231004040000 46780 . J5lVTygIkJHDBt6HHm1QLx7S0EItynbBijgNlcKs/W8FIkPBfCQmw5BsUTZAPVxKj7r2iNLRddwRcM/1sL49jV9Jtctn8OLLc9wtouBmg3LH94M0utW86dKSGEKtzGzWbi5hjVBlkroB8XVQxBphAUqGxNDxdE6AIAvh/eSSb3uSQrarxLnKWvHIHm5PORIOftkIRZ2kcA7Qtou9NqPCSE8fOM5EdXxussKChGthmN5AR5S2EruXIGGRd1vvEYBrRPv55BAWKKRERkaXhgAp7VikYzXesiRLdqVlTQd+fwy2tm/MTw+v3Un48wXPg1lRPlQXmQsuBwqg74Ts5r8w8w==
.			518400	IN	NS	a.root-servers.net.
.			86400	IN	ZONEMD	2023100400 1 241 E375B158DAEE6141E1F784FDB66620CC4412EDE47C8892B975C90C6A102E97443678CCA4115E27195B468E33ABD9F78C
未知のリソースレコードに遭遇した際の処理方法の判断は必ずしも単純なものではありません。このため、私たちがエッジで使用するルートゾーン解析用のライブラリは、解析を行わずに代わりに解析エラーを返します。
ルートゾーンの古いバージョンが使用された理由
static_zoneアプリは、ルートゾーンをローカルに提供(FC 7706)する目的で、ルートゾーンの読み込みと解析を行い、最新バージョンをメモリに保存します。新バージョンが公開されると、static_zoneアプリがそれを解析し、解析に成功すると旧バージョンを削除します。しかし、static_zoneアプリは解析に失敗し、新しいバージョンに切り替えることができないため、古いバージョンを延々と使用し続けることになりました。1.1.1.1サービスが最初に起動されたとき、static_zoneアプリは既存のバージョンをメモリ内に持ち合わせていません。ルートゾーンを解析しようとすると失敗するものの、ルートゾーンの古いバージョンも持ち合わせていないため、ルートサーバーに直接リクエストを問い合わせることになります。
static_zoneを無効にする最初の試みがうまくいかなかった理由
当初、1.1.1.1の動作をプログラム的に変更可能な仕組みであるオーバーライドルールによってstatic_zoneアプリの無効化が試行されました。私たちが展開したルールは以下のとおりです:
phase = pre-cache set-tag rec_disable_static
このルールは、受信したリクエストに「rec_disable_static」タグを付加します。static_zoneアプリの内部でこのタグをチェックし、設定されている場合、キャッシュされた静的ルートゾーンから応答を返しません。ただし、現在のノードが自身のキャッシュから応答を見つけられない場合、キャッシュパフォーマンス向上のために、問い合わせが別のノードに転送されることがあります。残念ながら、他のノードに転送される問い合わせにはrec_disable_staticタグが含まれないため、最終的にアプリを完全に無効にするまで、static_zoneアプリは古い情報を返し続けることとなりました。
影響が部分的だった理由
Cloudflareでは、カーネルアップデートなどのシステムを完全に再起動することで有効になるタスクのため、当社のサービスをホストするサーバーを定期的に順次の再起動を実施しています。今回の障害発生時、ZONEMDの変更とDNSSECの無効化の間に再起動されたリゾルバサーバインスタンスは、影響に寄与していません。もしこの2週間の間に再起動されていた場合、起動時にルートゾーンのロードに失敗し、代わりにルートサーバーにDNSクエリを送信して解決を試みることになったでしょう。加えて、リゾルバはserve-stale(RFC 8767)と呼ばれる技法を用い、影響を抑制する目的で、アクセス数の多いレコードを、最新ではない可能性のあるキャッシュから提供し続けることになります。レコードが上流から取得されてからTTL秒数が経過すると、そのレコードは最新ではないとみなされます。これにより、完全な停止を防ぎました。影響は主に、その時間枠内に1.1.1.1サービスを再起動しなかった多数サーバーを抱える最大規模のデータセンターで発生しました。
改善とフォローアップ手順
今回のインシデントは広範囲に影響を及ぼしており、当社では当社のサービスの可用性について非常に重く受け止めております。当社はいくつかの領域における改善点の特定に至りましたが、今後も再発の原因となるその他のギャップの発見に努めてまいります。
当社が直後から取り組んでいる内容は以下のとおりです。
可視性:static_zoneが古いルートゾーンファイルを提供した場合に通知するアラートを追加しました。古いルートゾーンファイルが提供された場合に長期間気づかれないという事態は防がれるべき事象でした。もし私たちがこの件をもっときちんと監視し、キャッシングが存在していれば、影響はなかったでしょう。上流で行われた変更からお客様とそのユーザーをお守りすることが私たちの目標です。
耐障害性:内部的なルートゾーンの取得と配布方法を見直します。取得および配布のパイプラインは、新しいRRTYPEをシームレスに処理し、パイプラインの短時間の中断はエンドユーザーが気付かない程度に抑える必要があります。
テスト:新しいZONEMDレコードの解析における未公表の変更に関連するテストを含め、この問題に関するテストを実施しているにもかかわらず、ルートゾーンの解析に失敗した場合のテスト内容が不十分でした。そのため、カバレッジと関連するプロセスを改善していきます。
設計:特定の期限を過ぎたルートゾーンの古いコピーを使用すべきではありません。古いルートゾーンデータも限られた時間であれば使用し続けることは確かに可能ですが、ある時点を過ぎると、許容できない運用上のリスクが生じます。RFC 8806「Running a Root Server Local to a Resolver(ルートサーバーをリゾルバに対してローカルで実行する)」に記述されているように、キャッシュされたルートゾーンデータの有効期間をより適切に管理するための対策を講じます。
まとめ
このようなインシデントを起こしてしまったことを深くお詫び申し上げます。このインシデントから学ぶべき教訓は「変更はないだろう」と思い込まないことです。現代のシステムの多くは、最終的な実行ファイルに組み込まれる長いライブラリ群の連鎖で構築されており、そのひとつひとつにバグがあったり、変更があっても更新に遅延が発生してプログラムが正しく動作しないなどと言った事象が発生することがあります。私たちは、変更によるリグレッションを適切に検出する優れたテストや、変更に対して正常に失敗するシステムやコンポーネントを用意することがいかに重要であるかを理解しています。私たちは、インターネットの最も重要なシステム(DNSやBGP)における「形式」の変更が影響を及ぼすことを常に想定する必要があることを理解しています。
社内でフォローアップすべきことはたくさんあり、私たちは現在、このようなことを二度と起こさないよう24時間体制で取り組んでいます。
2023 年 10 月 4 日 1.1.1.1 查詢失敗
Post Syndicated from Ólafur Guðmundsson original http://blog.cloudflare.com/zh-tw/1-1-1-1-lookup-failures-on-october-4th-2023-zh-tw/
2023 年 10 月 4 日,Cloudflare 於世界標準時 7:00 開始至 11:00 結束期間遇到 DNS 解析問題。1.1.1.1 或 Warp 、 Zero Trust 等產品的一些使用者,或使用 1.1.1.1 的第三方 DNS 解析程式可能已經收到對有效查詢的 SERVFAIL DNS 回應。對於此次服務中斷,我們深感抱歉。此次服務中斷為內部軟體錯誤,而非攻擊造成的結果。在這篇部落格中,我們將討論失敗的內容、發生的原因,以及我們可以採取哪些措施來確保這種情況不再發生。
背景
在 Domain Name System (DNS) 中,每一個網域名稱存在於 DNS 區域內。區域是在一起接受控制的網域名稱和主機名稱的集合。例如,Cloudflare 負責網域 cloudflare.com,我們稱之為「cloudflare.com」區域。頂級網域 (TLD) .com 由第三方擁有,位於「com」區域。它提供如何連線 cloudflare.com 的指示。所有 TLD 之上為根區域,提供如何連線 TLD 的指示。這意味著根區域對於解析所有其他網域名稱很重要。與 DNS 的其他重要部分一樣,根區域使用 DNSSEC 進行簽署,這也意味著根區域本身包含加密簽章。
根區域發布於根伺服器上,但 DNS 營運商自動擷取並保留根區域副本的情況也很常見, 以便在無法連線根伺服器的情況下,根區域中的資訊仍然可供使用。Cloudflare 的遞迴 DNS 基礎架構會採用此方法,因為它還可加速解析程序。新版根區域通常一天發布兩次。1.1.1.1 具有稱為 static_zone 的 WebAssembly 應用程式,該應用程式執行於主 DNS 邏輯之上,當新版本可供使用時,即可提供這些新的版本。
狀況說明
9 月 21 日,作為根區域管理中的已知計畫內變更的一部分,新的資源記錄類型首次納入根區域。新資源記錄稱為 ZONEMD,實際上是根區域內容的總和檢查碼。
藉由執行於 Cloudflare 核心網路的軟體來擷取根區域。隨後,根區域被重新分散到 Cloudflare 在世界各地的資料中心。變更之後,可繼續正常擷取和分散包含 ZONEMD 記錄的根區域。然而,使用該資料的 1.1.1.1 解析程式系統在剖析 ZONEMD 記錄時遇到問題。由於區域必須完整載入和提供,因此系統無法剖析 ZONEMD,這意味著新版根區域未在 Cloudflare 的解析程式系統中使用。若託管 Cloudflare 解析程式基礎架構的某些伺服器未收到新的根區域,則會發生容錯移轉,直接逐個請求地查詢 DNS 根伺服器。不過,其他伺服器會繼續依賴其記憶體快取仍然可用的已知工作版根區域,這是在變更之前於 9 月 21 日提取的版本。
2023 年 10 月 4 日世界標準時 7:00,根區域版本中自 9 月 21 日開始的 DNSSEC 簽章到期。由於 Cloudflare 解析程式系統沒有能夠使用的更新版本,某些 Cloudflare 解析程式系統無法驗證 DNSSEC 簽章,並因此開始傳送錯誤回應 (SERVFAIL)。Cloudflare 解析程式產生 SERVFAIL 回應的速度提升了 12%。下圖說明了失敗的進度,以及如何顯示給使用者。
事件時間表和影響
9 月 21 日世界標準時 6:30:根區最後一次成功提取
10 月 4 日世界標準時 7:00:根區域中於 9 月 21 日取得的 DNSSEC 簽章到期,導致對用戶端查詢的 SERVFAIL 回應增加。
7:57︰第一個外部非預期 SERVFAIL 報告開始出現。
8:03︰正式宣佈發生內部 Cloudflare 事件。
8:50:初次嘗試阻止 1.1.1.1 使用具有覆寫規則的過時根區域檔案來提供回應。
10:30:完全阻止 1.1.1.1 預先載入根區域檔案。
10:32:回應恢復正常。
11:02︰事件結束。
下圖顯示了影響時間表,以及傳回 SERVFAIL 錯誤的 DNS 查詢百分比:
我們預計,在正常操作期間,常規流量的 SERVFAIL 錯誤數量會達到基準。該比例通常在 3% 左右。這些 SERVFAIL 可能是由於 DNSSEC 鏈中的合法問題、無法連線至權威伺服器、權威伺服器回應時間太長,以及其他因素引起。在事件發生期間,SERVFAIL 數量達到峰值,佔查詢總計的 15%,但影響在全球範圍內的分佈並不均勻,且主要集中在較大型的資料中心,例如維吉尼亞州阿什本、德國法蘭克福和新加坡。
為什麼會發生這一事件
剖析 ZONEMD 記錄失敗的原因
DNS 採用二進位格式來儲存資源記錄。在此二進位格式中,資源記錄 (TYPE) 的類型儲存為 16 位元整數。資源記錄的類型確定剖析資源資料 (RDATA) 的方式。當記錄類型為 1 時,這意味著它是 A 記錄,RDATA 可以解析為 IPv4 位址。記錄類型 28 為 AAAA 記錄,而其 RDATA 則剖析為 IPv6 位址。當剖析器遇到未知的資源類型時,它不知道如何剖析其 RDATA,但幸運的是它不必這樣做:RDLENGTH 欄位表示 RDATA 欄位的長度,允許剖析器將其視為 OPAQUE 資料元素。
                                   1  1  1  1  1  1
      0  1  2  3  4  5  6  7  8  9  0  1  2  3  4  5
    +--+--+--+--+--+--+--+--+--+--+--+--+--+--+--+--+
    |                                               |
    /                                               /
    /                      NAME                     /
    |                                               |
    +--+--+--+--+--+--+--+--+--+--+--+--+--+--+--+--+
    |                      TYPE                     |
    +--+--+--+--+--+--+--+--+--+--+--+--+--+--+--+--+
    |                     CLASS                     |
    +--+--+--+--+--+--+--+--+--+--+--+--+--+--+--+--+
    |                      TTL                      |
    |                                               |
    +--+--+--+--+--+--+--+--+--+--+--+--+--+--+--+--+
    |                   RDLENGTH                    |
    +--+--+--+--+--+--+--+--+--+--+--+--+--+--+--+--|
    /                     RDATA                     /
    /                                               /
    +--+--+--+--+--+--+--+--+--+--+--+--+--+--+--+--+
之所以 static_zone 不支援新的 ZONEMD 記錄,是因為到目前為止,我們選擇以其呈現格式(而非二進位格式)在內部分散根區域。查看一些資源記錄的文字呈現時,我們可以看到不同記錄的呈現方式有很多變化版本。
.			86400	IN	SOA	a.root-servers.net. nstld.verisign-grs.com. 2023100400 1800 900 604800 86400
.			86400	IN	RRSIG	SOA 8 0 86400 20231017050000 20231004040000 46780 . J5lVTygIkJHDBt6HHm1QLx7S0EItynbBijgNlcKs/W8FIkPBfCQmw5BsUTZAPVxKj7r2iNLRddwRcM/1sL49jV9Jtctn8OLLc9wtouBmg3LH94M0utW86dKSGEKtzGzWbi5hjVBlkroB8XVQxBphAUqGxNDxdE6AIAvh/eSSb3uSQrarxLnKWvHIHm5PORIOftkIRZ2kcA7Qtou9NqPCSE8fOM5EdXxussKChGthmN5AR5S2EruXIGGRd1vvEYBrRPv55BAWKKRERkaXhgAp7VikYzXesiRLdqVlTQd+fwy2tm/MTw+v3Un48wXPg1lRPlQXmQsuBwqg74Ts5r8w8w==
.			518400	IN	NS	a.root-servers.net.
.			86400	IN	ZONEMD	2023100400 1 241 E375B158DAEE6141E1F784FDB66620CC4412EDE47C8892B975C90C6A102E97443678CCA4115E27195B468E33ABD9F78C
當我們遇到未知的資源記錄時,並不總是能輕鬆知道如何處理。因此,我們用於剖析邊緣根區域的程式庫不會嘗試這樣做,而是傳回剖析器錯誤。
為什麼使用過時版根區域
static_zone 應用程式的任務是載入和剖析根區域,以便在本機提供根區域 (RFC 7706),並將最新版本儲存在記憶體中。當新版本發布時,它會對其進行剖析,並在成功完成後捨棄舊版本。然而,由於剖析失敗,static_zone 應用程式絕不會轉換至更新版本,而是無限期地繼續使用舊版本。當 1.1.1.1 服務首次啟動時,static_zone 應用程式的記憶體中沒有現有版本。當它嘗試剖析根區域時,剖析會失敗,但由於沒有可回復的舊版根區域,它會直接回復到查詢根伺服器的傳入請求。
為什麼停用 static_zone 的初始嘗試不起作用
最初,我們嘗試透過覆寫規則來停用 static_zone 應用程式,這是一種允許我們以程式設計方式變更 1.1.1.1 某些行為的機制。我們的部署規則是:
phase = pre-cache set-tag rec_disable_static
針對任何傳入的請求,此規則都會將標籤 rec_disable_static 新增至請求。在 static_zone 應用程式內,我們會檢查此標籤,如果已設定,我們不會透過快取的靜態根區域傳回回應。但是,為了改善快取效能,如果目前節點在自己的快取中找不到回應,有時會將查詢轉傳至另一個節點。遺憾的是,轉傳至其他節點的查詢中不包括 rec_disable_static 標籤,這會導致 static_zone 應用程式繼續使用過時的資訊進行回覆,直至我們最終完全停用該應用程式。
為什麼影響是局部的
Cloudflare 會定期對託管我們服務的伺服器執行滾動重啟,以執行核心更新等任務,這些任務只能在系統完全重新啟動後才會生效。在此服務中斷期間,在發生 ZONEMD 變更與 DNSSEC 無效期間重新啟動的解析程式伺服器執行個體不會造成影響。如果它們在這兩週期間重新啟動,則無法在啟動時載入根區域,而是藉由向根伺服器傳送 DNS 查詢來回復到解析。此外,解析程式使用一種稱為「提供過時」(RFC 8767) 的技術,目的是能夠繼續從可能過時的快取中提供常用的記錄,以限制影響。自透過上游擷取記錄以來,一旦達到 TTL 秒數,該記錄就會被視為過時。這避免了完全的服務中斷;影響主要發生在我們最大型的資料中心,其中有許多伺服器在該時間範圍內沒有重新啟動 1.1.1.1 服務。
補救措施和後續步驟
該事件產生了廣泛的影響,我們極其重視服務的可用性。我們已經確定了幾個需要改進的領域,並將繼續努力發現可能導致事件再次發生的任何其他漏洞。
下面是我們立即採取的措施:
可見度:我們新增了警示,以便在 static_zone 提供過時的根區域檔案時發出通知。只要提供過時的根區域檔案,都不應被忽視。如果我們利用現有的快取更好地監控此問題,就不會有影響。我們的目標是保護我們的客戶及其使用者免受上游變更的影響。
復原能力:我們將重新評估在內部擷取和分散根區域的方式。我們的擷取和分散管道應無縫處理新的 RRTYPE,並且管道的任何短暫服務中斷都應不為最終使用者所見。
測試:儘管圍繞此問題設置了測試,包括與剖析新 ZONEMD 記錄時未發布變更相關的測試,但我們沒有對根區域剖析失敗時發生的情況進行充分測試。我們將改善測試覆蓋範圍和相關程序。
架構:我們不應使用超過某種程度的根區域過時副本。雖然在有限的時間內,繼續使用過時的根區域資料當然是可能的,但超過某種程度,就會出現不可接受的操作風險。我們將採取各種措施,確保快取的根區域資料生命週期得到更好的管理,如 RFC 8806:對解析程式本機執行根伺服器中所述。
結論
對於這次發生的事件,我們深感抱歉。這一事件傳遞了一個明確的訊息:永遠不要認為事情不會改變!許多現代系統都是使用一長串程式庫構建,這些程式庫被提取至最終的可執行檔中,其中的每個程式庫都可能存在錯誤,或者可能沒有足夠早地更新,使得程式在輸入發生變更時無法正確運作。我們瞭解,設置良好的測試非常重要,以便在輸入變更時進行迴歸偵測,以及偵測正常失敗的系統和元件。我們還瞭解,我們需要始終認為網際網路中最關鍵的系統(DNS 和 BGP)發生「格式」變更將會產生影響。
在內部,我們還有很多事情要跟進,我們正在夜以繼日的處理,以確保此類事件不會再次發生。
2023 年 10 月 4 日 1.1.1.1 查询失败
Post Syndicated from Ólafur Guðmundsson original http://blog.cloudflare.com/zh-cn/1-1-1-1-lookup-failures-on-october-4th-2023-zh-cn/
在 2023 年 10 月 4 日,从 7:00 UTC 到 11:00 UTC 的这段时间里,Cloudflare 出现了 DNS 解析问题。1.1.1.1 或 Warp、Zero Trust 等产品或使用 1.1.1.1 的第三方 DNS 解析器的一些用户可能会收到对有效查询的 SERVFAIL DNS 响应。对于本次故障,我们深表歉意。本次故障是内部软件错误造成的,不是遭到攻击所致。在这篇博文中,我们将讨论出现了什么故障、发生原因以及我们采取了哪些措施来确保这种情况不再发生。
背景
在域名系统 (DNS) 中,每个域名都位于一个 DNS 区域中。区域是一起控制的域名和主机名的集合。例如,Cloudflare 负责域名 cloudflare.com,我们称其为在 “cloudflare.com” 区域中。.com 顶级域名 (TLD) 归第三方所有,位于 “com” 区域中。它提供如何访问 cloudflare.com 的指示。对于 TLD,最重要的是根区,它提供如何访问 TLD 的指示。这意味着根区对于解析所有其他域名非常重要。与 DNS 的其他重要部分一样,根区也使用 DNSSEC 进行签名,这意味着根区本身包含加密签名。
根区在根服务器上发布,但 DNS 运营商通常也会自动检索并保留根区的副本,使得万一根服务器无法访问时,根区中的信息仍然可用。Cloudflare 的递归 DNS 基础设施也采用了这种方法,因为它还可以加快解析过程。根区的新版本通常每天发布两次。1.1.1.1 有一个名为 static_zone 的 WebAssembly 应用程序,它在主 DNS 逻辑的基础上运行,在新版本可用时为它们提供服务。
究竟发生了什么
在 9 月 21 日,作为根区管理已知和计划变更的一部分,根区中首次加入了一种新的资源记录类型。新资源记录名为 ZONEMD,实际上是根区内容的校验和。
根区通过在 Cloudflare 核心网络中运行的软件检索。随后,它被重新分配到 Cloudflare 遍布全球的数据中心。更改后,包含 ZONEMD 记录的根区仍可正常检索和分配。但是,使用该数据的 1.1.1.1 解析器系统在解析 ZONEMD 记录时遇到了问题。由于区域必须完整加载并提供,如果系统无法解析 ZONEMD,则意味着 Cloudflare 解析器系统未使用新版本的根区。一些托管 Cloudflare 解析器基础架构的服务器在未收到新的根区时,无法逐个请求直接查询 DNS 根服务器。然而,继续依赖于根区的已知正常工作版本的其他用户在内存缓存中仍可使用该版本,即在变更前于 9 月 21 日提取的版本。
在 2023 年 10 月 4 日 07:00 UTC,9 月 21 日发布的根区版本中的 DNSSEC 签名已过期。由于 Cloudflare 解析器系统无法使用本来应该可以使用的较新版本,Cloudflare 的一些解析器系统无法验证 DNSSEC 签名,因此开始发送错误响应 (SERVFAIL)。Cloudflare 解析器生成 SERVFAIL 响应的比率增长了 12%。下图说明了故障的发展过程以及用户如何看到故障。
事件时间线和影响
9 月 21 日 6:30 UTC:最后一次成功提取根区
10 月 4 日 7:00 UTC:在 9 月 21 日获得的根区中的 DNSSEC 签名过期,导致对客户端查询的 SERVFAIL 响应增加。
7:57:开始收到第一份关于意外 SERVFAIL 的外部报告。
8:03:宣布内部 Cloudflare 事件。
8:50:首次尝试通过覆盖规则阻止 1.1.1.1 使用过期的根区文件提供响应。10:30:完全阻止 1.1.1.1 预装根区文件。
10:32:响应恢复正常。
11:02:事件关闭。
下图显示了受影响的时间以及返回 SERVFAIL 错误的 DNS 查询的百分比:
在正常运行期间,我们预计常规流量会出现 SERVFAIL 错误。通常这一比例在 3% 左右。造成这些 SERVFAIL 可能原因有 DNSSEC 链中的正当合理的问题、无法连接到权威性服务器、权威性服务器响应时间过长等等。在本次事件中,SERVFAIL 数量峰值达到总查询量的 15%,但其影响并不是全球均匀分布,主要集中在我们较大的数据中心,如弗吉尼亚州阿什本、德国法兰克福和新加坡。
发生本次事件的原因
解析 ZONEMD 记录失败的原因
DNS 采用二进制格式存储资源记录。在这种二进制格式中,资源记录的类型 (TYPE) 存储为16 位整数。资源记录的类型决定了资源数据 (RDATA) 的解析方式。当记录类型为 1 时,表示这是一条 A 记录,其 RDATA 可被解析为 IPv4 地址。记录类型 28 是 AAAA 记录,其 RDATA 可被解析为 IPv6 地址。当解析器遇到未知资源类型时,它不知道如何解析其 RDATA,但幸运的是,解析不是必需的:RDLENGTH 字段指出了 RDATA 字段的长度,从而允许解析器将其视为不透明数据元素。
                                   1  1  1  1  1  1
      0  1  2  3  4  5  6  7  8  9  0  1  2  3  4  5
    +--+--+--+--+--+--+--+--+--+--+--+--+--+--+--+--+
    |                                               |
    /                                               /
    /                      NAME                     /
    |                                               |
    +--+--+--+--+--+--+--+--+--+--+--+--+--+--+--+--+
    |                      TYPE                     |
    +--+--+--+--+--+--+--+--+--+--+--+--+--+--+--+--+
    |                     CLASS                     |
    +--+--+--+--+--+--+--+--+--+--+--+--+--+--+--+--+
    |                      TTL                      |
    |                                               |
    +--+--+--+--+--+--+--+--+--+--+--+--+--+--+--+--+
    |                   RDLENGTH                    |
    +--+--+--+--+--+--+--+--+--+--+--+--+--+--+--+--|
    /                     RDATA                     /
    /                                               /
    +--+--+--+--+--+--+--+--+--+--+--+--+--+--+--+--+
static_zone 之所以不支持新的 ZONEMD 记录,是因为到目前为止,我们一直选择在内部以根区的展示格式分发根区,而不是二进制格式。在查看一些资源记录的文本表述时,我们可以发现不同记录的表述方式存在更多差异。
.			86400	IN	SOA	a.root-servers.net. nstld.verisign-grs.com. 2023100400 1800 900 604800 86400
.			86400	IN	RRSIG	SOA 8 0 86400 20231017050000 20231004040000 46780 . J5lVTygIkJHDBt6HHm1QLx7S0EItynbBijgNlcKs/W8FIkPBfCQmw5BsUTZAPVxKj7r2iNLRddwRcM/1sL49jV9Jtctn8OLLc9wtouBmg3LH94M0utW86dKSGEKtzGzWbi5hjVBlkroB8XVQxBphAUqGxNDxdE6AIAvh/eSSb3uSQrarxLnKWvHIHm5PORIOftkIRZ2kcA7Qtou9NqPCSE8fOM5EdXxussKChGthmN5AR5S2EruXIGGRd1vvEYBrRPv55BAWKKRERkaXhgAp7VikYzXesiRLdqVlTQd+fwy2tm/MTw+v3Un48wXPg1lRPlQXmQsuBwqg74Ts5r8w8w==
.			518400	IN	NS	a.root-servers.net.
.			86400	IN	ZONEMD	2023100400 1 241 E375B158DAEE6141E1F784FDB66620CC4412EDE47C8892B975C90C6A102E97443678CCA4115E27195B468E33ABD9F78C
当我们遇到未知的资源记录时,往往不知道如何处理它。因此,我们用来解析边缘根区的库不会尝试解析,而是返回解析器错误。
为什么会使用过期版本的根区
static_zone 应用程序负责加载和解析根区,以便在本地提供根区服务 (RFC 7706),它将最新版本存储在内存中。当有新版本发布时,它会解析新版本,并在解析成功后丢弃旧版本。然而,由于解析失败,static_zone 应用程序未能切换到较新的版本,而是无限期地继续使用旧版本。当 1.1.1.1 服务首次启动时,static_zone 应用程序的内存中没有现有版本。当它尝试解析根区时会失败,但是由于没有旧版本的根区作为后备,它只能针对传入请求直接查询根服务器。
为什么最初尝试禁用 static_zone 时没有成功
起初,我们尝试通过覆盖规则禁用 static_zone 应用程序(覆盖规则是一种允许我们以编程方式更改 1.1.1.1 的某些行为的机制)。我们制定的规则如下:
phase = pre-cache set-tag rec_disable_static
对于任何接收到的请求,此规则都会在请求中添加 rec_disable_static 标记。在 static_zone 应用程序中,我们会检查该标记,如果设置了该标记,我们就不会从缓存的静态根区返回响应。但是,为了提高缓存性能,如果当前节点无法在自己的缓存中找到响应,查询有时会被转发到另一个节点。不幸的是,rec_disable_static 标记并没有包含在转发到其他节点的查询中,这导致 static_zone 应用程序继续以陈旧的信息回复,直到我们最终完全禁用该应用程序。
为什么影响是局部的
Cloudflare 会定期对托管我们服务的服务器进行滚动重新启动,以执行内核更新等任务,这些更新只有在系统完全重新启动后才能生效。在本次故障发生时,在 ZONEMD 更改和 DNSSEC 失效之间重新启动的解析器服务器实例不会造成影响。如果它们在这两周内重新启动,它们将无法在启动时加载根区,而只能通过向根服务器发送 DNS 查询来进行解析。此外,解析器还使用了一种称为“过期服务”(serve stale) (RFC 8767) 的技术,目的是能够继续从可能过期的缓存中提供当前的记录,以限制影响。一旦从上游检索记录的 TTL 秒数已过,该记录就会被视为过期记录。这避免了全面中断;受影响的主要是我们最大的数据中心,这些数据中心有许多服务器在该时间段内没有重新启动 1.1.1.1 服务。
补救及后续步骤
这一事件产生了广泛的影响,而我们非常重视我们服务的可用性。我们已经确定了几个改进的领域,并将继续努力发现任何其他可能导致复发的缺陷。
如下是我们目前进行中的工作:
可见性:我们会添加警报功能,以便在 static_zone 提供过期的根区文件时发出通知。这种长时间提供过期的根区文件而毫无所觉的情况不应该发生。如果我们能更好地进行监控,再加上现有的缓存,就不会产生任何影响。我们的目标是保护客户及其用户免受上游变更的影响。
恢复能力:我们将重新评估如何在内部摄取和分发根区。我们的摄取和分发管道应无缝处理新的 RRTYPE,最终用户应看不到管道的任何短暂中断。
测试:尽管围绕这个问题进行了测试,包括与解析新 ZONEMD 记录的未发布变更相关的测试,但我们并未充分测试当根区解析失败时会发生什么情况。我们将改进测试范围和相关流程。
架构:某个时间点过后,我们不应使用过期的根区副本。在有限的时间内继续使用过期的根区数据当然是可能的,但超过一定时间就会产生不可接受的运行风险。我们将采取措施,确保按照 RFC 8806:在解析器本地运行根服务器中所述,更好地管理缓存的根区数据的生命周期 。
总结
我们对本次事件的发生深表遗憾。本次事件给了我们一个明确的启示:永远不要认为有些东西会一成不变!许多现代系统都有一长串的库,这些库被提取到最终的可执行文件中,每一个库都可能存在错误,或者未能及早更新以在输入发生变化时可以正确运行。我们明白,进行良好的测试是多么重要,它可以检测出在输入发生变化时从容失败回归、系统和组件。我们知道,我们需要始终认为互联网最关键系统(DNS 和 BGP)中的“格式”变化会产生影响。
我们内部有很多事情需要跟进,正在夜以继日地工作,以确保类似事件不再发生。
Unlock data across organizational boundaries using Amazon DataZone – now generally available
Post Syndicated from Shikha Verma original https://aws.amazon.com/blogs/big-data/unlock-data-across-organizational-boundaries-using-amazon-datazone-now-generally-available/
We are excited to announce the general availability of Amazon DataZone. Amazon DataZone enables customers to discover, access, share, and govern data at scale across organizational boundaries, reducing the undifferentiated heavy lifting of making data and analytics tools accessible to everyone in the organization. With Amazon DataZone, data users like data engineers, data scientists, and data analysts can share and access data across AWS accounts using a unified data portal, allowing them to discover, use, and collaborate on this data across their teams and organizations. Additionally, data owners and data stewards can make data discovery simpler by adding business context to data while balancing access governance to the data via pre-defined approval workflows in the user interface.
In this blog post, we share what we heard from our customers that led us to create Amazon DataZone and discuss specific customer use cases and quotes from customers who tried Amazon DataZone during our public preview. Then we explain the benefits of Amazon DataZone and walk you through key features.
Common pain points of data management and governance:
- Discovery of data, especially data distributed across accounts and regions – Finding the data to use for analysis is challenging because organizations often have petabytes of data spread across tens or even thousands of data sources.
- Access to data – Data access control is hard, managed differently across organizations, and often requires manual approvals which can be time-consuming process and hard to keep up to date, resulting in analysts not having access to the data they need.
- Access to tools – Data users want to use different tools of choice with the same governed data. This is challenging because access to data is managed differently by each of the tools.
- Collaboration – Analysts, data scientists, and data engineers often own different steps within the end-to-end analytics journey but do not have an simple way to collaborate on the same governed data, using the tools of their choice.
- Data governance – Constructs to govern data are hidden within individual tools and managed differently by different teams, preventing organizations from having traceability on who’s accessing what and why.
Three core benefits of Amazon DataZone
Amazon DataZone enables customers to discover, share, and govern data at scale across organizational boundaries.
- Govern data access across organizational boundaries. Help ensure that the right data is accessed by the right user for the right purpose—in accordance with your organization’s security regulations—without relying on individual credentials. Provide transparency on data asset usage and approve data subscriptions with a governed workflow. Monitor data assets across projects through usage auditing capabilities.
- Connect data people through shared data and tools to drive business insights. Increase your business team’s efficiency by collaborating seamlessly across teams and providing self-service access to data and analytics tools. Use business terms to search, share, and access cataloged data, making data accessible to all the configured users to learn more about data they want to use with the business glossary.
- Automate data discovery and cataloging with machine learning (ML). Reduce the time needed to manually enter data attributes into the business data catalog and minimize the introduction of errors. More and richer data in the data catalog improves the search experience, too. Reduce your time searching for and using data from weeks to days.
Here are the core benefits Amazon DataZone provides to its customers.

Figure 1: Benefits of Amazon DataZone
To provide theses benefits, let’s see what capabilities are built into this service.

Figure 2: Capabilities of Amazon DataZone
Amazon DataZone provides the following detailed capabilities.
- Business-driven domains – A DataZone domain represents the distinct boundary of a line of business (LOB) or a business area within an organization that can manage its own data, including its own data assets, its own definition of data or business terminology, and may have its own governing standards. Domain is the starting point of a customer’s journey with Amazon DataZone. When you first start using DataZone, you create a domain, and all core components, such as business data catalog, projects, and environments, that will exist within a domain.
- An Amazon DataZone domain contains an associated business data catalog for search and discovery, a set of metadata definitions to decorate the data assets that are used for discovery purposes, and data projects with integrated analytics and ML tools for users and groups to consume and publish data assets.
- An Amazon DataZone domain can span across multiple AWS accounts by connecting and pulling data lake or data warehouse data in these accounts (for example, AWS Glue Data Catalog) to form a data mesh or creating and running projects and environments in these accounts across the supported AWS Regions.
- Amazon DataZone domains bring along the capabilities of AWS Resource Access Manager (AWS RAM) to securely share resources across accounts.
- After an Amazon DataZone domain is created, the domain provides a browser-based web application where the organization’s configured users can go to catalog, discover, govern, share, and analyze data in a self-service fashion. The data portal supports identity providers through the AWS IAM Identity Center (successor to AWS Single Sign-On) and AWS Identity and Access Management (IAM) principals for authentication.
- For example, a marketing team can create a domain with name “Marketing” and have full ownership over it. Similarly, a sales team can create a domain with name “Sales” and have full ownership over it. When sales wants to share data with marketing, the marketing team can give access to a sales account by associating that account with the marketing domain, and the sales user can use the marketing domain’s Amazon DataZone portal link to share their data with the marketing team.
- Organization-wide business data catalog – You can make data visible with business context for your users to find and understand data quickly and efficiently. The core of the catalog is focused on cataloging data from different sources and augmenting that metadata with additional business context to build trust, and facilitate better decision-making for consumers looking for data.
- Standardize on terminology – You can standardize your business terminology to communicate among data publishers and consumers by creating glossaries and including detailed descriptions for terms along with the term relationships. These terms can be mapped to assets and columns and help to standardize the description of these assets and assist in the discovery and understanding the details of the underlying data.
- Building blocks to customize business metadata – To make it simple to build your catalog with extensibility, Amazon DataZone introduces some foundational building blocks that can be expanded to your needs. The metadata forms types, and asset types can be used as templates for defining your assets. These types can be customized to augment additional context and details to suit the requirements of a domain. In this release, Amazon DataZone provides some out-of-the-box metadata form types such as AWS Glue table form, Amazon Redshift table form, Amazon Simple Storage Service (Amazon S3) object form to support the out-of-box asset types such as AWS Glue tables and views, Amazon Redshift tables and views, and S3 objects.
- Catalog structured, unstructured, and custom assets – You can now catalog not only AWS Glue data catalogs or Amazon Redshift tables but also catalog custom assets using Amazon DataZone APIs. Cataloged assets can represent a consumable unit of asset that may include a table, a dashboard, an ML model, or a SQL code block that shows the query behind the dashboard. With custom assets, Amazon DataZone provides the ability to attach metadata form types to an asset type and then augment it with business context, including standardized business glossary terms for better consumption of those assets. In addition, for AWS Glue data catalogs and Amazon Redshift tables, you can use the Amazon DataZone data sources to bring the technical metadata of the datasets into the business data catalog in a managed fashion on a schedule. Assets also now support revisions, allowing users to identify changes to business and technical metadata.
- Automated business name generation – Enriching the technical catalog ingested with business context can be time-consuming, cumbersome, and error-prone. To make it simpler, we are introducing the first feature that brings generative artificial intelligence (AI) capabilities to Amazon DataZone to automate the generation of the name and column names of an asset. Amazon DataZone recommends to be added to the asset, and then delegates control to the producer to accept or reject those recommendations.
- Federated governance using data projects – Amazon DataZone data projects simplify access to AWS analytics by creating business usecase-based groupings of users, data assets, and analytics tools. Data projects provide a space where project members can collaborate, exchange data, and share artifacts. Projects are secure so that only users who are added to the project can collaborate together. With projects, Amazon DataZone decentralizes data ownership among teams depending on who owns the data and also federates access management to those owners when consumers request access to data. Core capabilities made available in projects include:
- Ownership and user management – In an organization, the roles and responsibilities made available to different personas vary. To customize defining what a user or group can do when working with Amazon DataZone entities, projects now also serve as a user management or roles mechanism. Every entity in Amazon DataZone, such as glossaries, metadata forms, and assets, is owned by projects.
- Projects and environments – Projects are now decoupled from infrastructure – there’s project creation that handles the set up of users as either project owners or contributors, and then the set up of resources named environments. Environments handle infrastructure (for example, AWS Glue database) needed for users to work with the data. This split enables the project to be the use case container, whereas environment gives the flexibility to branch off into different infrastructure environments (for example, data lakes or data warehouses using Amazon Redshift). Administrators can determine what kind of infrastructure should be available for what kind of projects.
- Bring your own IAM role for subscription – You can now bring an existing IAM principal by registering it as a subscription target and get data access approval for that IAM user or role. With this mechanism, projects extend support for working with data in other AWS services because you can allow users to discover data, get the necessary approval, and access the data in a service the user has prior authorization to.
- Subscribe workflow with access management – The subscription workflow secures data between producers and consumers to verify only the right data is accessed by the right users for the right purpose, enabling self-service data analytics. This capability also allows you to quickly audit who has access to your datasets for what business use case as well as monitor usage and costs across projects and lines of business. Access management for assets published in the catalog is managed using AWS Lake Formation or Amazon Redshift, and you will get notified (in the portal or in Amazon CloudWatch) if your subscription request was approved and granted. For data that is not managed by AWS Lake Formation or Amazon Redshift, you can manage the subscription approval in Amazon DataZone and complete the access granted workflow with custom logic using Amazon EventBridge events and then report back to Amazon DataZone using API once the grant is completed. This ensures that the consumer will only interface with one service to discover, understand, and subscribe to data that is needed for their analysis.
- Analytics tools – Out of the box, the Amazon DataZone portal provides integration with Amazon Athena query editor and Amazon Redshift query editor as tools to process the data. This integration provides seamless access to the query tools and enables the users to use data assets that were subscribed to within the project. This is accomplished using Amazon DataZone environments that can be deployed according to the resource configuration definitions in built-in blueprints.
- APIs – Amazon DataZone now has external APIs to work with the system programmatically. You can add Amazon DataZone to your existing architecture. For example, to use your data pipelines to catalog data in Amazon DataZone and enable consumers to search, find, subscribe, and access that data seamlessly. In this release, Amazon DataZone introduces a new data model for the catalog. The catalog APIs support a type system–based model that allows you to define and manage the types of entities in the catalog. Using this type system model, users will have a flexible and scalable catalog that can represent different types of objects and associate metadata to the object (asset or column). Similarly, actions in the UI now have APIs that you can use if you want to work with Amazon DataZone programmatically.
Common customer use cases for Amazon DataZone
Let’s look at some use cases that our preview customers enabled with Amazon DataZone.
Use case 1: Data discoverability

“Bristol Myers Squibb is actively pursuing an initiative to reduce the time it takes to discover and develop drugs by more than 30%. A key component of this strategy is addressing data sharing challenges and optimizing data availability. Engaging with AWS, we found that Amazon DataZone helped us create our data products, catalog them, and govern them, making our data more findable, accessible, interoperable, and reusable (FAIR). We’re currently assessing the broader applicability of Amazon DataZone within our enterprise framework to determine if it aligns with our operational goals.”
—David Y. Liu, Director, Research IT Solution Architecture. Bristol Myers Squibb.
Use case 2: Share governed data for generative AI initiatives

“By harmonizing data across multiple business domains, we can foster a culture of data sharing. To this end, we have been using Amazon DataZone to free up our developers from building and maintaining a platform, allowing them to focus on tailored solutions. Utilizing an AWS managed service was important to us for several reasons—combining capabilities within the AWS ecosystem, quicker time to obtain business insights from data analysis, standardized data definitions, and leveraging the potential of generative AI. We look forward to our continued partnership with AWS to generate better outcomes for Guardant Health and the patients we serve. This is more than mere data; it’s our dynamic journey.”
—Rajesh Kucharlapati, Senior Director of Data, CRM and Analytics, Guardant Health
Use case 3: Federated data governance

“Being data-driven is one of our main corporate objectives, always guided by best practices in data governance, data privacy, and security. At Itaú, data is treated as one of our main assets; good data management and definition are core parts of our solutions, in every use of AWS analytics services. Together with the AWS team, we were able to experiment with Amazon DataZone in preview, proposing features aligned with our technological and business needs. One example is data by domain, a simplification of data governance processes and distribution of responsibilities among business units. With Amazon DataZone generally available to our contributors, we expect to be able to quickly and easily set up rules across domains for teams composed of data analysts, engineers, and scientists, fostering experimentation with data hypothesis across multiple business use cases, with simplified governance.”
—Priscila Cardoso Ferreira, Data Governance and Privacy Superintendent, Itaú Unibanco
Use case 4: Decentralized ownership

“At Holaluz, unifying data across our businesses while having distributed ownership with individual teams to share and govern their data are our key priorities. Our data is owned by different teams, and sharing has typically meant the central team has to grant access, which created a bottleneck in our processes. We needed a faster way to analyze data with decentralized ownership, where data access can be approved by the owning team. We have validated the use cases in Amazon DataZone preview and are looking forward to getting started when it is generally available to build a robust business data catalog. Our consumers will be able to find, subscribe, and publish back their newly created assets for others to discover and use, enabling a data flywheel.”
—Danny Obando, Lead Data Architect, Holaluz
Use case #5: Managed service versus Do-It-Yourself (DIY) platform

“At BTG Pactual, unifying data across our businesses and allowing for data sharing at scale while enforcing oversight is one of our key priorities. While we are building custom solutions to do this ourselves, we prefer having an AWS native service to enable these capabilities so we can focus our development efforts and resources on solving BTG Pactual’s specific governance challenges—rather than building and maintaining the platform. We have validated the use cases in Amazon DataZone preview and will use it to build a robust business data catalog and data sharing workflow. It will provide complete visibility into who is using what data for what purposes without adding additional workload or inhibiting the decentralized ownership we’ve established to make data discoverable and accessible to all our data users across the organization.”
—João Mota, Head of Data Platform, BTG Pactual
Solution walkthrough
Let’s take an example of how an organization can get started with Amazon DataZone. In this example, we build a unified environment for data producers and data consumers to access, share, and consume data in a governed manner.
Take a product marketing team that wants to drive a campaign on product adoption. To be successful in that campaign, they want to tap into the customer data in a data warehouse, click-stream data in the data lake, and performance data of other campaigns in applications like Salesforce. Roberto is a data engineer who knows this data very well. So, let’s see how Roberto will make this data discoverable to others in the organization.
The administrator for the company has already set up a domain called “Marketing” for the team to use. The administrator has also set up some resource templates called “Blueprints” to allow data people to set up environments to work with data. The administrator has also set up users who can sign in using the corporate credentials to the Amazon DataZone portal, a web application outside of AWS Console. The administrator sets up all the AWS resources so the data people do not have to struggle with the technical barriers.
So, let’s now get into the details of how Roberto is able to publish the data in the catalog.
- Roberto signs in to the Amazon DataZone portal using his corporate credentials.
- He creates a project and environment that he can use to publish data. He knows the data sources he wants to catalog, so he creates a connection to the AWS Glue Catalog that has all the click-stream data.
- He provides a name and description for the data source run and then selects databases and specifics of what table he wants to bring.
- He chooses the automated metadata generation option to get ML-generated business names for the technical table and column names. He then schedules the run to keep the asset in sync with the source.
- Within a few minutes, the click-stream data and the customer information from Amazon Redshift metadata, such as table names, schema, and other source metadata, will be available in Amazon DataZone’s inventory, ready for curation.
- Roberto can now enrich the metadata to provide additional business context using glossary and metadata forms to make it simple for Veronica, adata analyst, and other data people to understand the data. Roberto can accept or reject the automatically generated recommendations to autocomplete the business-friendly names. He can also provide descriptions, classify terms, and any other useful information to that particular asset.
- Once done, Roberto can publish the asset and make it available to data consumers in Amazon DataZone.
Now, let’s take a look at how Veronica, the marketing analyst, can start discovering and working with the data.
- Now that the data is published and available in the catalog, Veronica can sign in to the Amazon DataZone portal using her corporate credentials and start searching for data. She types “click campaign” in the search, and all relevant assets are returned.
- She notices that the assets come from various sources and contexts. She uses filters to curate the search list using facets such as glossary terms and data sources and sorts results based on relevance and time.
- To start working with data, she will have to create a new project and an environment that provides the tools she needs. Creating the project provides an quick way for her to collaborate with her teammates and automatically provide them with the correct level of permissions to work with data and tools.
- Veronica finds the data she needs access to. She now requests access by clicking on Subscribe to inform the data publisher or owner that she needs access to the data. While subscribing, she also provides a reason why she needs access to that data.
- This sends a notification to Roberto and his project members that someone is looking for access, and they can review the request to accept or reject it. Robert is signed in to the portal, sees the notification, and approves the request because the reason was very clear.
- With the approved subscription, Veronica also gets access to data as Amazon DataZone automatically does it for Roberto. Now Veronica and her team can start working on their analysis to find the right campaign to increase adoption.
Therefore, the entire data discovery and access lifecycle and usage is happening through Amazon DataZone. You get complete visibility and control over how the data is being shared, who is using it, and who authorized it. Essentially, Amazon DataZone allows you to give members of your organization the freedom they always wanted, with the confidence of the right governance around it.
Here is a screenshot of Amazon DataZone’s portal for users to login to catalog, publish, discover, understand, and subscribe to data that is needed for their analysis.

Conclusion
In this post, we discussed the challenges, core capabilities, and a few common use cases. With a sample scenario, we demonstrated how you can get started. Amazon DataZone is now generally available. For more information, see What’s New in Amazon DataZone or Amazon DataZone.
Check out the YouTube playlist for some of the latest demos of Amazon DataZone and short descriptions of the capabilities available.
About the authors
 Shikha Verma is Head of Product for Amazon DataZone at AWS.
 Steve McPherson is a General Manager with Amazon DataZone at AWS.
 Priya Tiruthani is a Senior Product Manager with Amazon DataZone at AWS.
Amazon DataZone Now Generally Available – Collaborate on Data Projects across Organizational Boundaries
Post Syndicated from Channy Yun original https://aws.amazon.com/blogs/aws/amazon-datazone-now-generally-available-collaborate-on-data-projects-across-organizational-boundaries/
Today, we’re announcing the general availability of Amazon DataZone, a new data management service to catalog, discover, analyze, share, and govern data between data producers and consumers in your organization.
 At AWS re:Invent 2022, we preannounced Amazon DataZone, and in March 2023, we previewed it publicly.
During the keynote of the last re:Invent, Swami Sivasubramanian, vice president of Databases, Analytics, and Machine Learning at AWS said “I have had the benefit of being an early customer of DataZone to run the AWS weekly business review meeting where we assemble data from our sales pipeline and revenue projections to inform our business strategy.”
During the keynote, a demo led by Shikha Verma, head of product for Amazon DataZone, demonstrated how organizations can use the product to create more effective advertising campaigns and get the most out of their data.
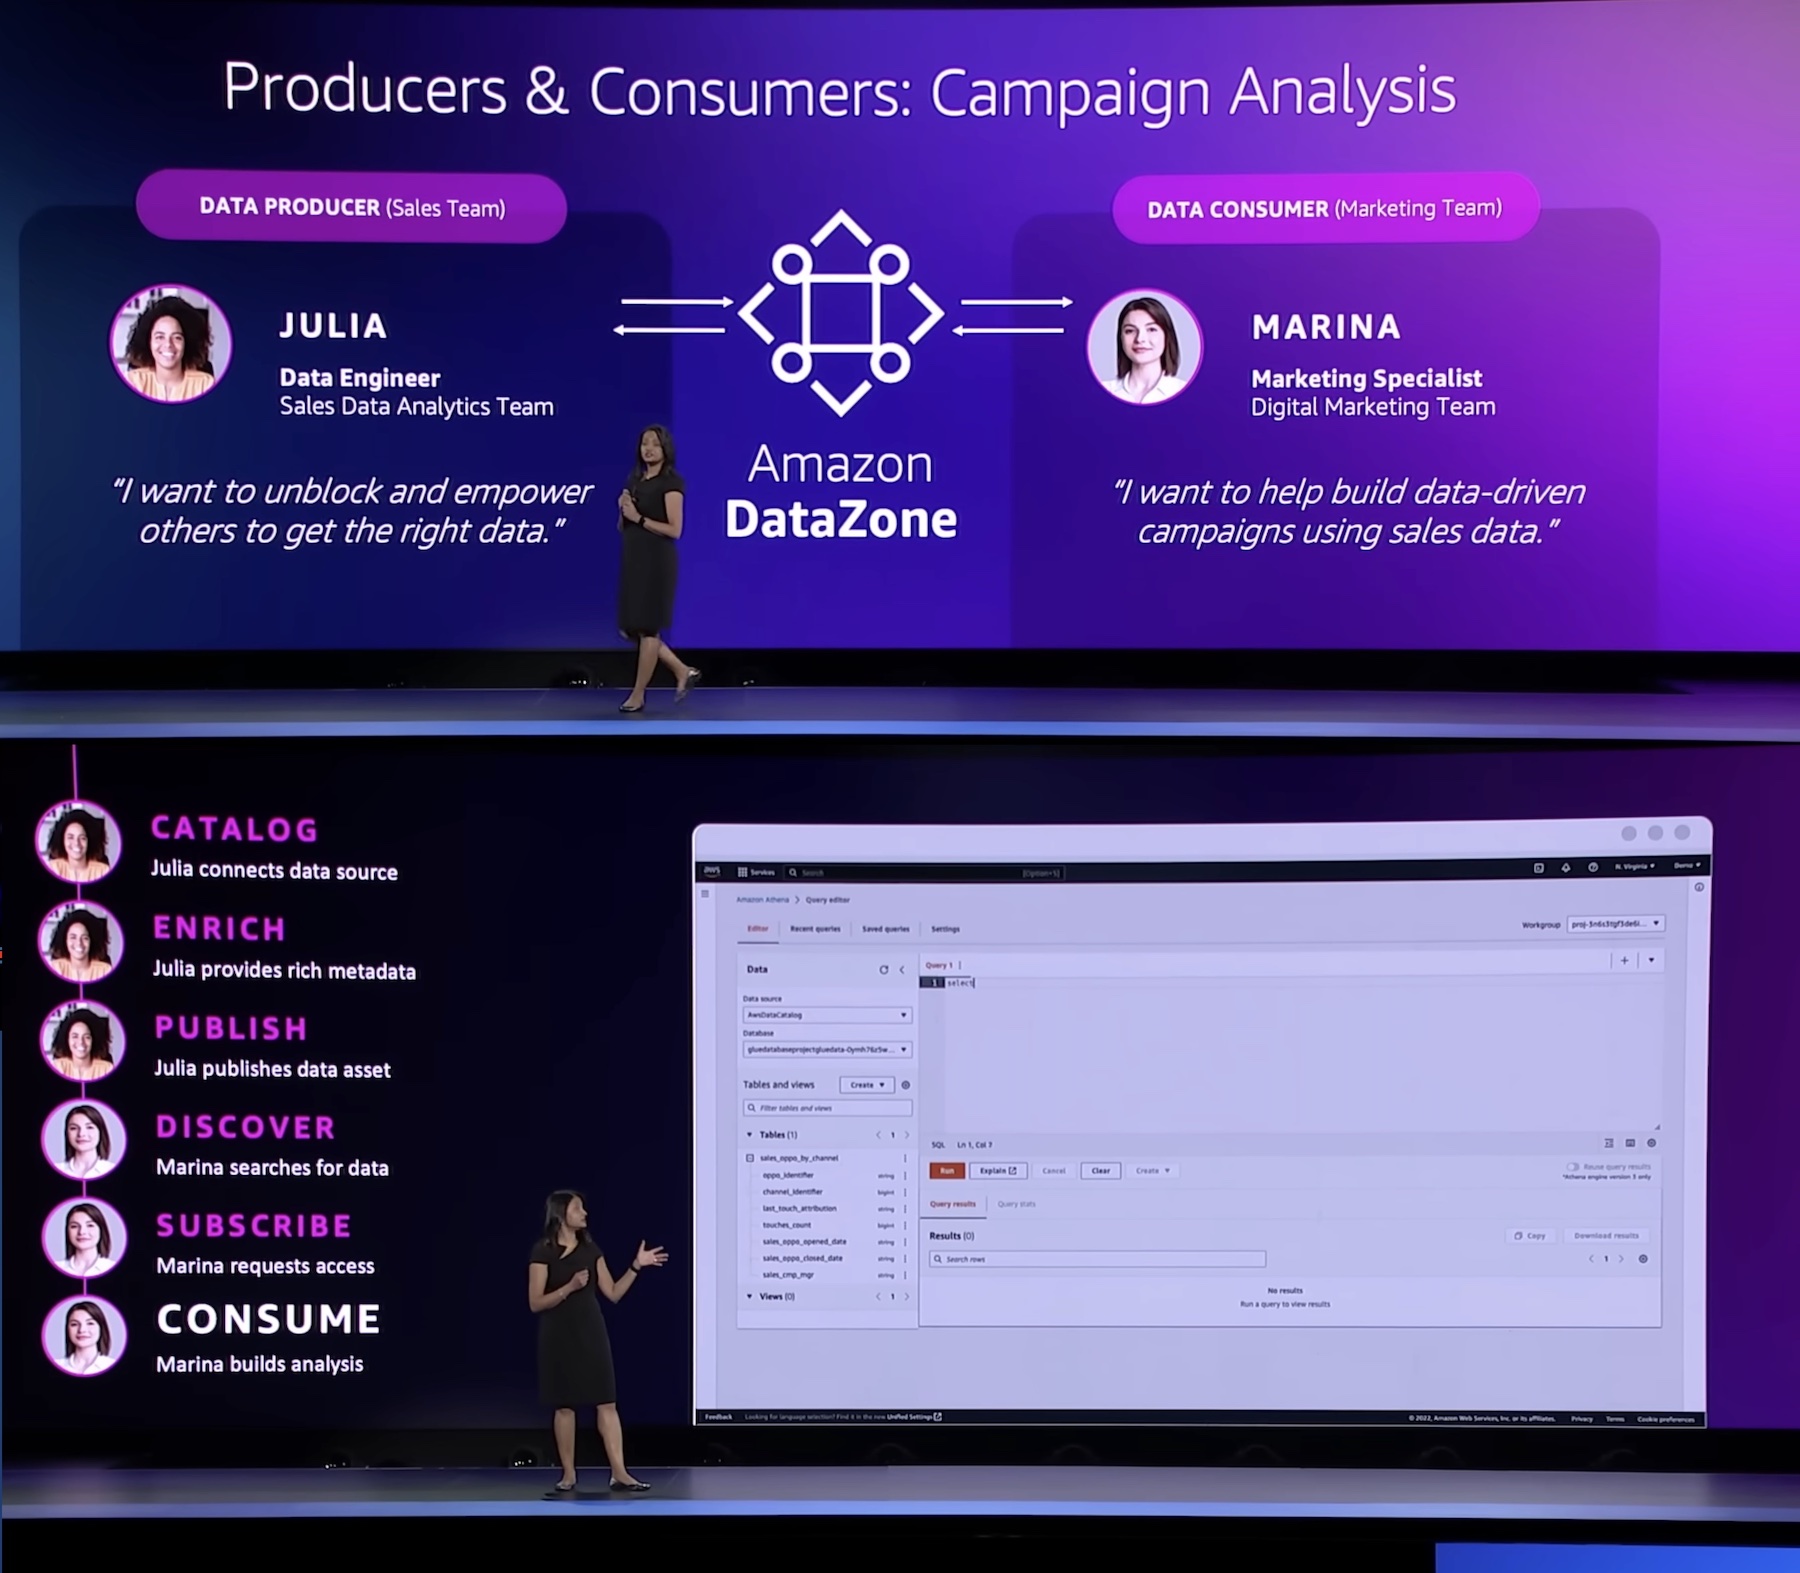
“Every enterprise is made up of multiple teams that own and use data across a variety of data stores. Data people have to pull this data together but do not have an easy way to access or even have visibility to this data. DataZone provides a unified environment where everyone in an organization—from data producers to consumers, can go to access and share data in a governed manner.”
With Amazon DataZone, data producers populate the business data catalog with structured data assets from AWS Glue Data Catalog and Amazon Redshift tables. Data consumers search and subscribe to data assets in the data catalog and share with other business use case collaborators. Consumers can analyze their subscribed data assets with tools—such as Amazon Redshift or Amazon Athena query editors—that are directly accessed from the Amazon DataZone portal. The integrated publishing-and-subscription workflow provides access-auditing capabilities across projects.
Introducing Amazon DataZone
For those of you who aren’t yet familiar with Amazon DataZone, let me introduce you to its key concept and capabilities.
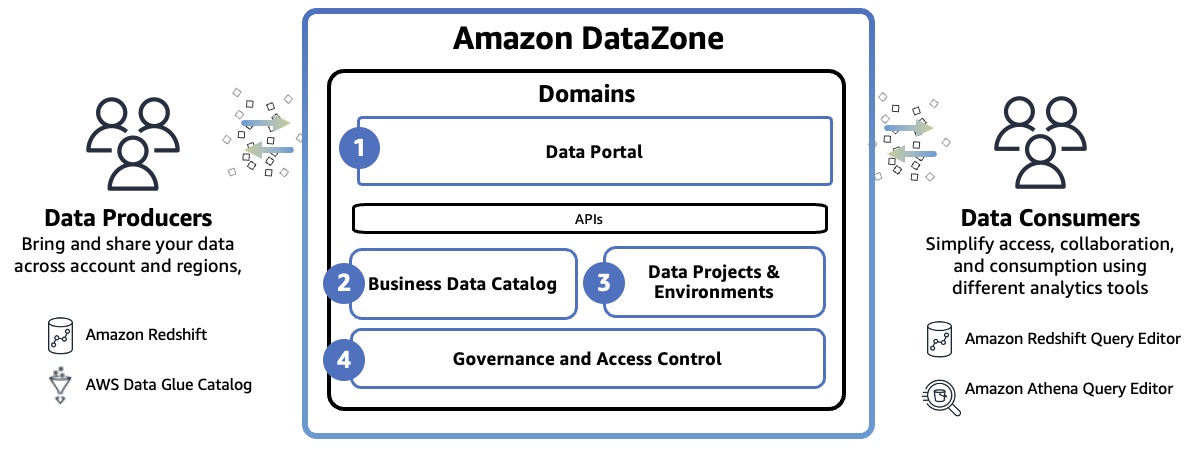
Amazon DataZone Domain represents the distinct boundary of a line of business (LOB) or a business area within an organization that can manage it’s own data, including it’s own data assets and its own definition of data or business terminology, and may have it’s own governing standards. The domain includes all core components such as the data portal, business data catalog, projects and environments, and built-in workflows.
- Data portal (outside the AWS Management Console) – This is a web application where different users can go to catalog, discover, govern, share, and analyze data in a self-service fashion. The data portal authenticates users with AWS Identity and Access Manager (IAM) credentials or existing credentials from your identity provider through the AWS IAM Identity Center.
- Business data catalog – In your catalog, you can define the taxonomy or the business glossary. You can use this component to catalog data across your organization with business context and thus enable everyone in your organization to find and understand data quickly.
- Data projects & environments – You can use projects to simplify access to the AWS analytics by creating business use case–based groupings of people, data assets, and analytics tools. Amazon DataZone projects provide a space where project members can collaborate, exchange data, and share data assets. Within projects, you can create environments that provide the necessary infrastructure to project members such as analytics tools and storage so that project members can easily produce new data or consume data they have access to.
- Governance and access control – You can use built-in workflows that allow users across the organization to request access to data in the catalog and owners of the data to review and approve those subscription requests. Once a subscription request is approved, Amazon DataZone can automatically grant access by managing permission at underlying data stores such as AWS Lake Formation and Amazon Redshift.
To learn more, see Amazon DataZone Terminology and Concepts.
Getting Started with Amazon DataZone
To get started, consider a scenario where a product marketing team wants to run campaigns to drive product adoption. To do this, they need to analyze product sales data owned by a sales team. In this walkthrough, the sales team, which acts as the data producer, publishes sales data in Amazon DataZone. Then the marketing team, which acts as the data consumer, subscribes to sales data and analyzes it in order to build a campaign strategy.
To understand how the DataZone works, let’s walk through a condensed version of the Getting started guide for Amazon DataZone.
1. Create a Domain
When you first start using DataZone, you start by creating a domain and all core components such as business data catalog, projects, and environments in the data portal, then exist within that domain. Go to the Amazon DataZone console and choose Create domain.
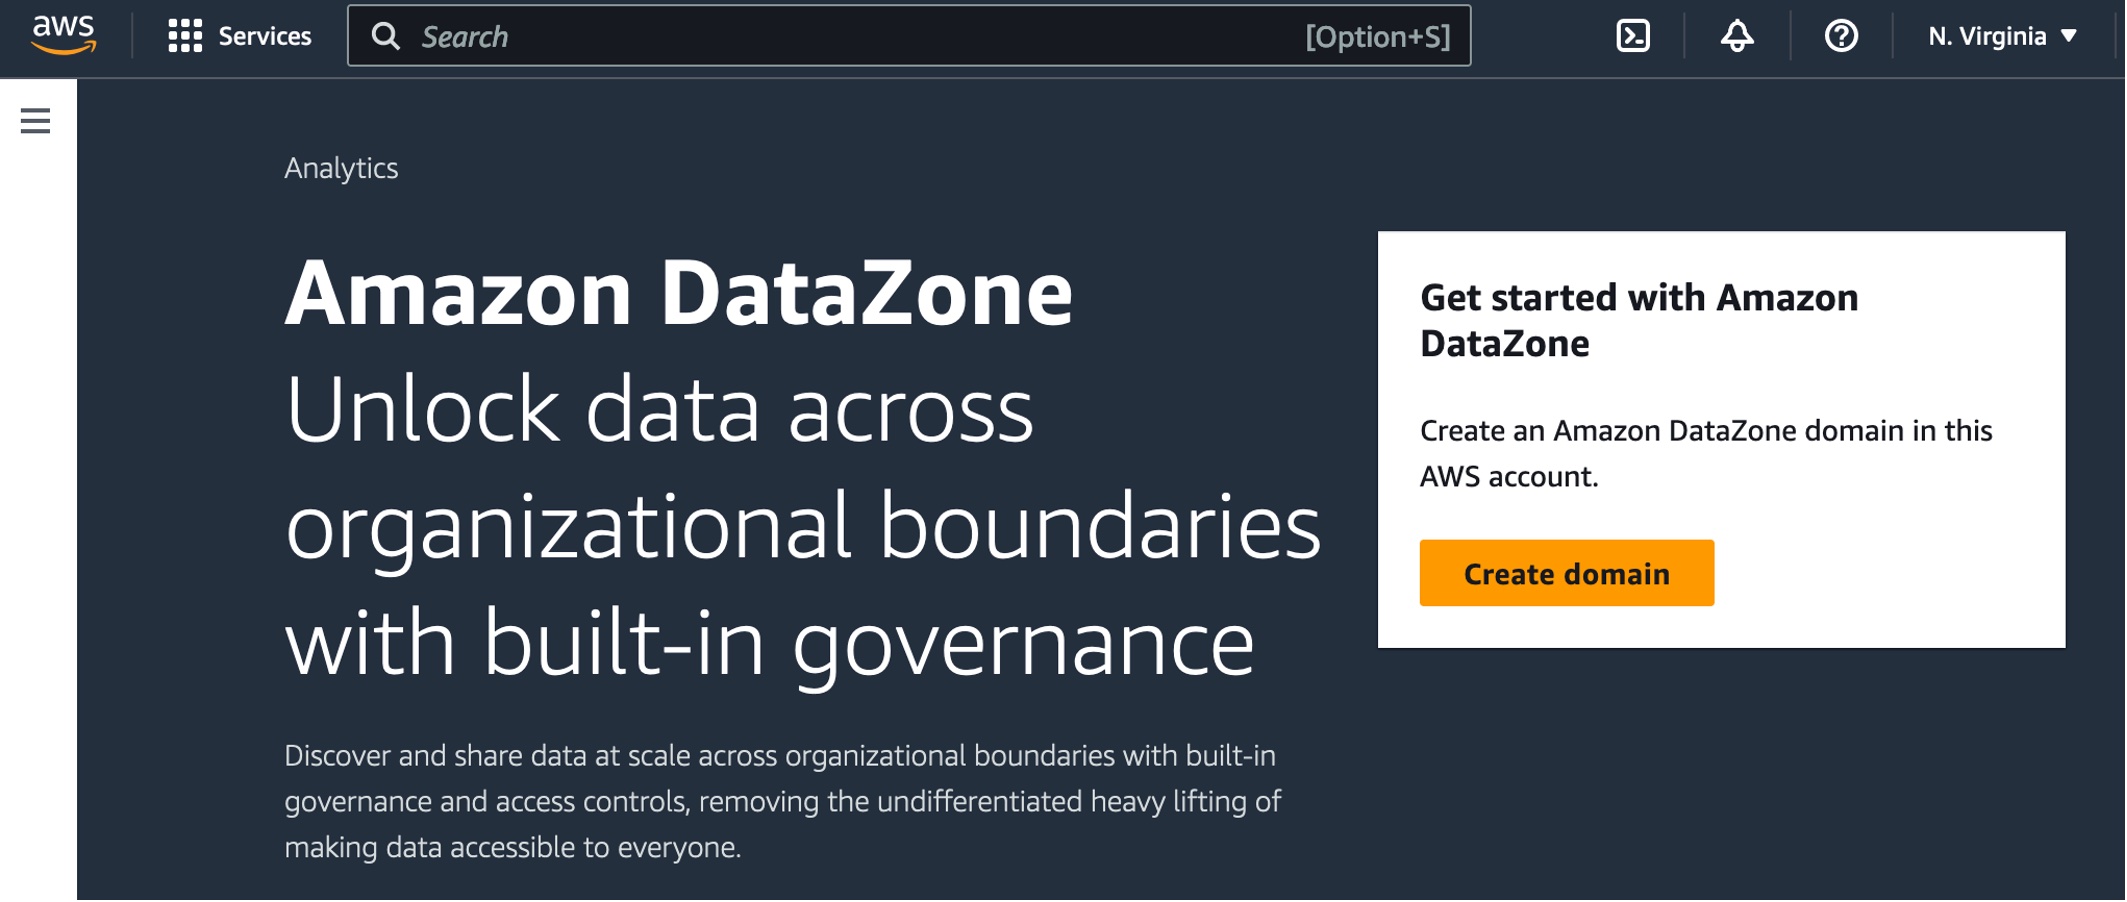
Enter Domain name and a descrption and leave all other values as default.
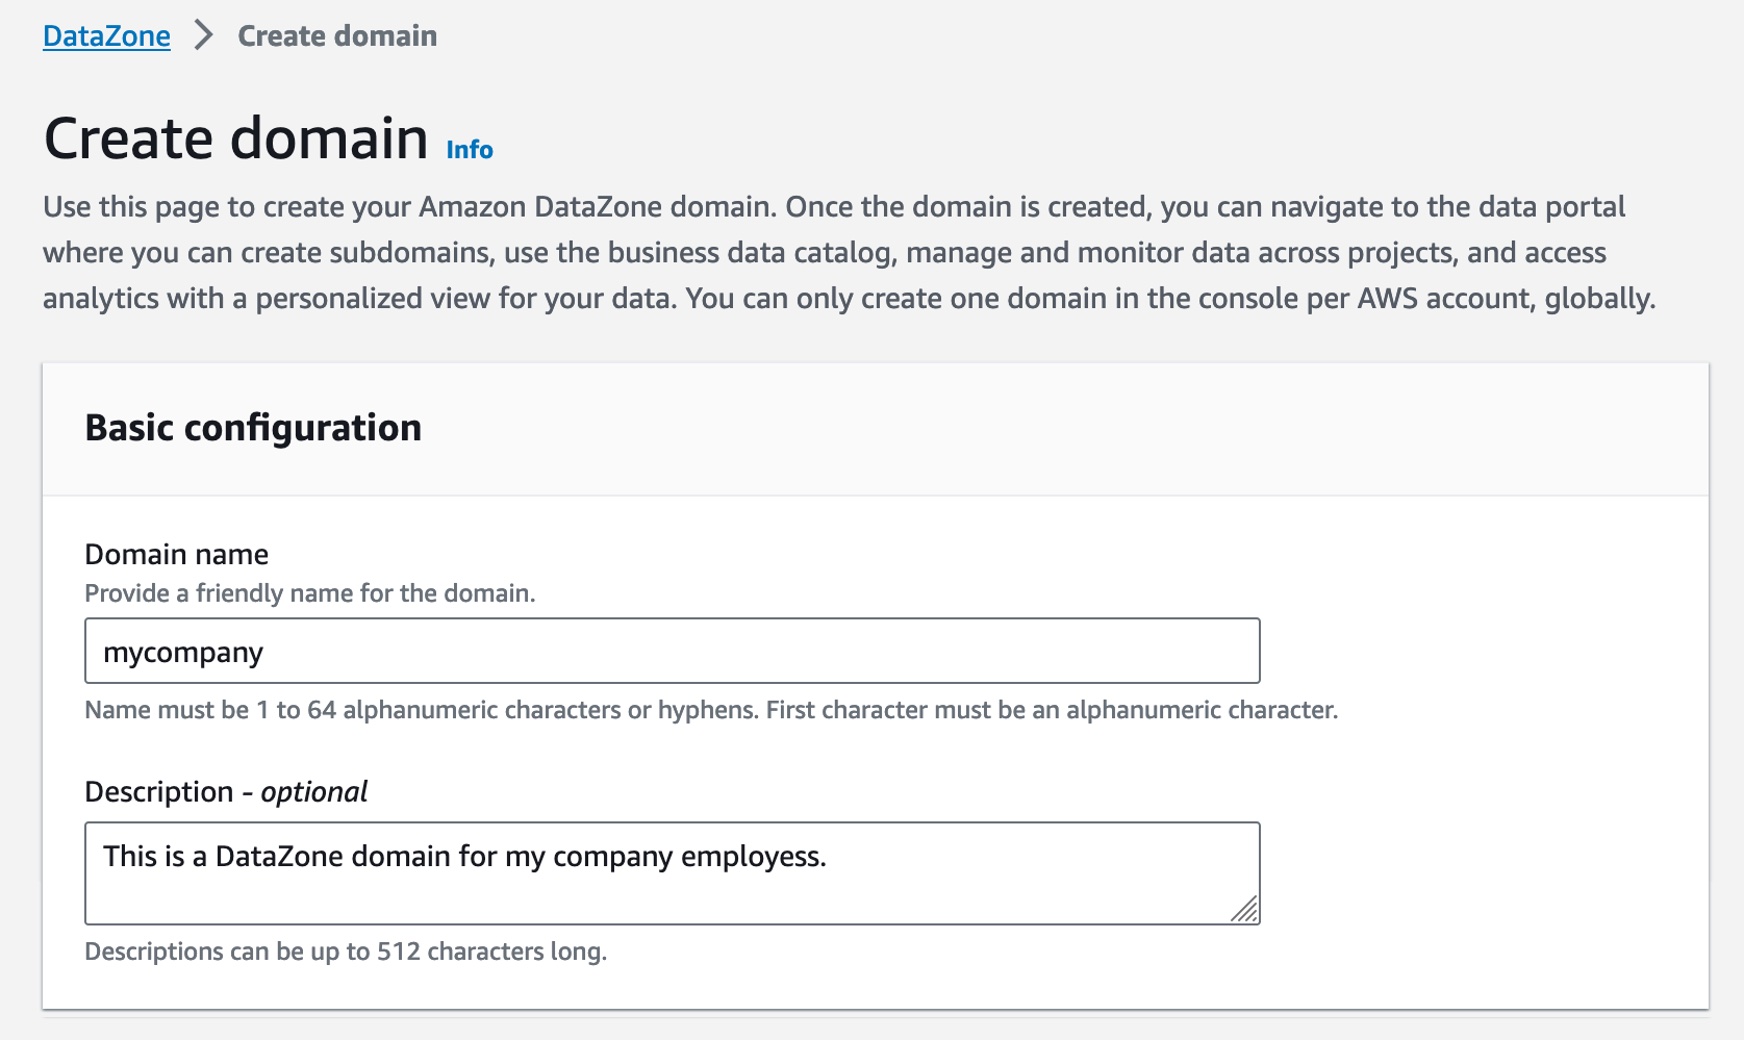
For example, in the Service access section, if you choose Create and use a new role by default, Amazon DataZone will automatically create a new role with necessary permissions that authorize DataZone to make API calls on behalf of users within the domain. Check the Quick setup option where DataZone can take care of all the setup steps.
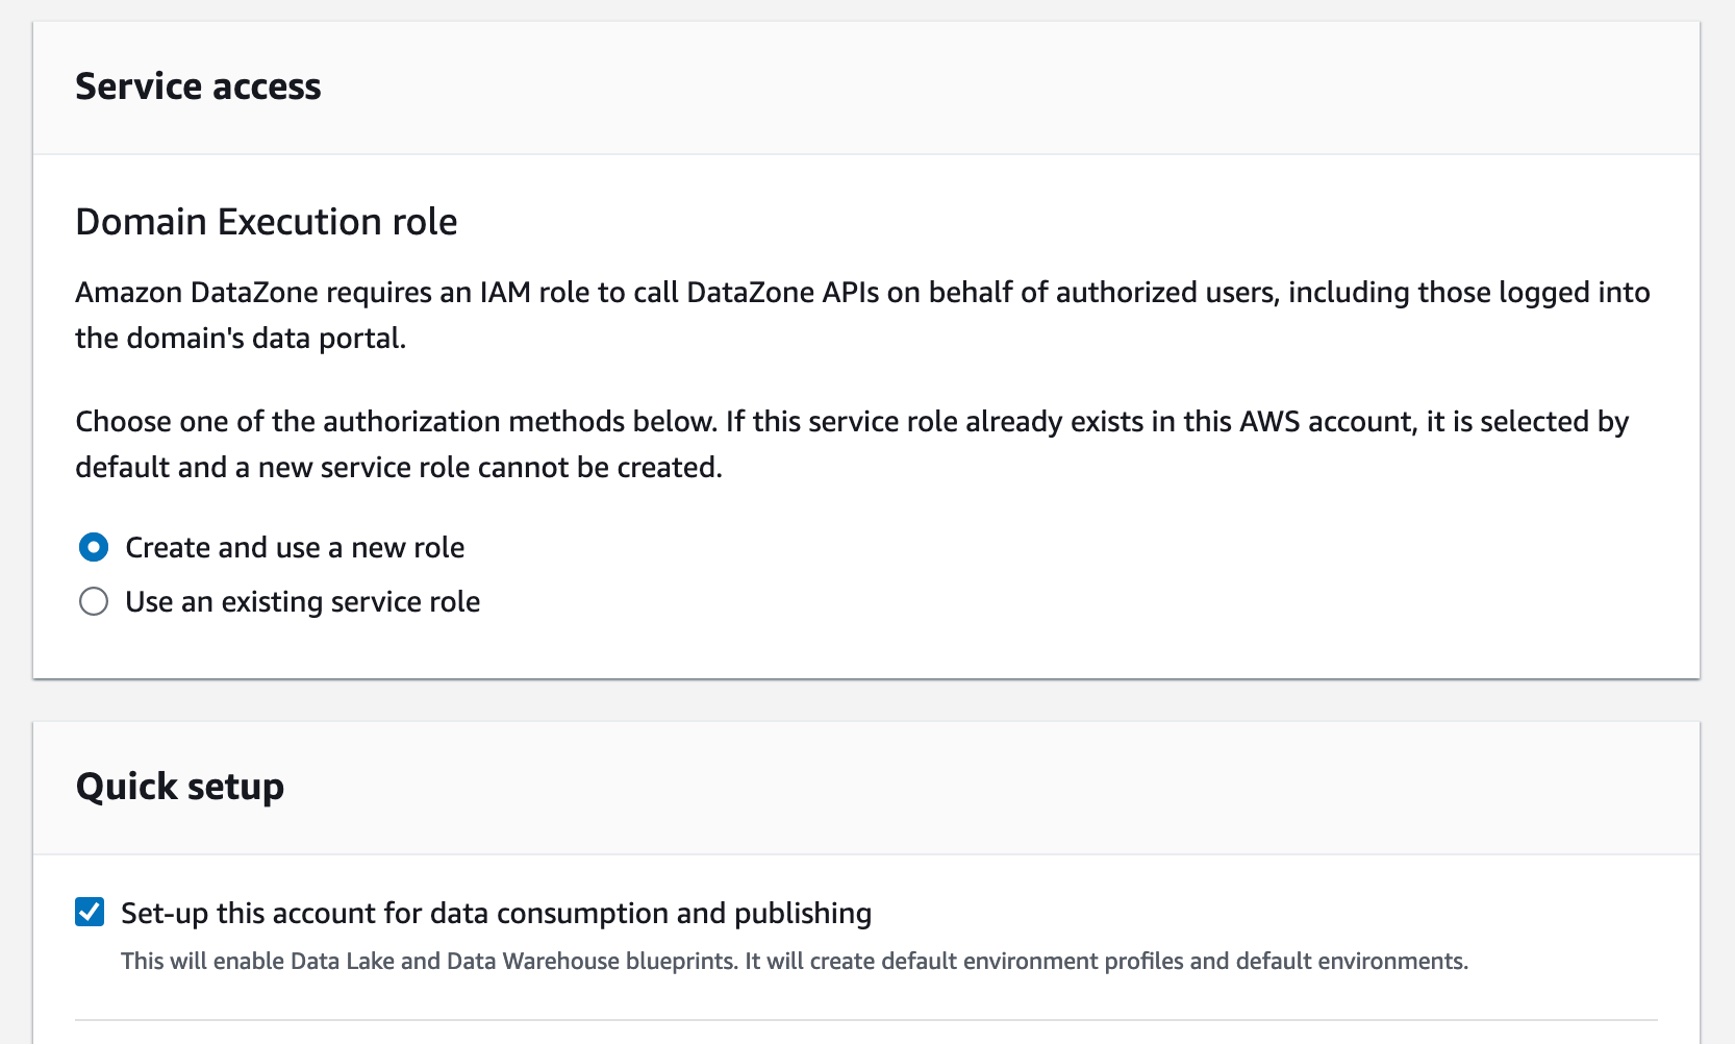
Finally, choose Create domain. Amazon DataZone creates the necessary IAM roles and enables this domain to use resources within your account such as AWS Glue Data Catalog, Amazon Redshift, and Amazon Athena. Domain creation can take several minutes to complete. Wait for the domain to have a status of Available.
2. Create a Project and Environment in the Data Portal
After the domain is successfully created, select it, and on the domain’s summary page, note the data portal URL for the root domain. You can use this URL to access your Amazon DataZone data portal. Choose Open data portal.
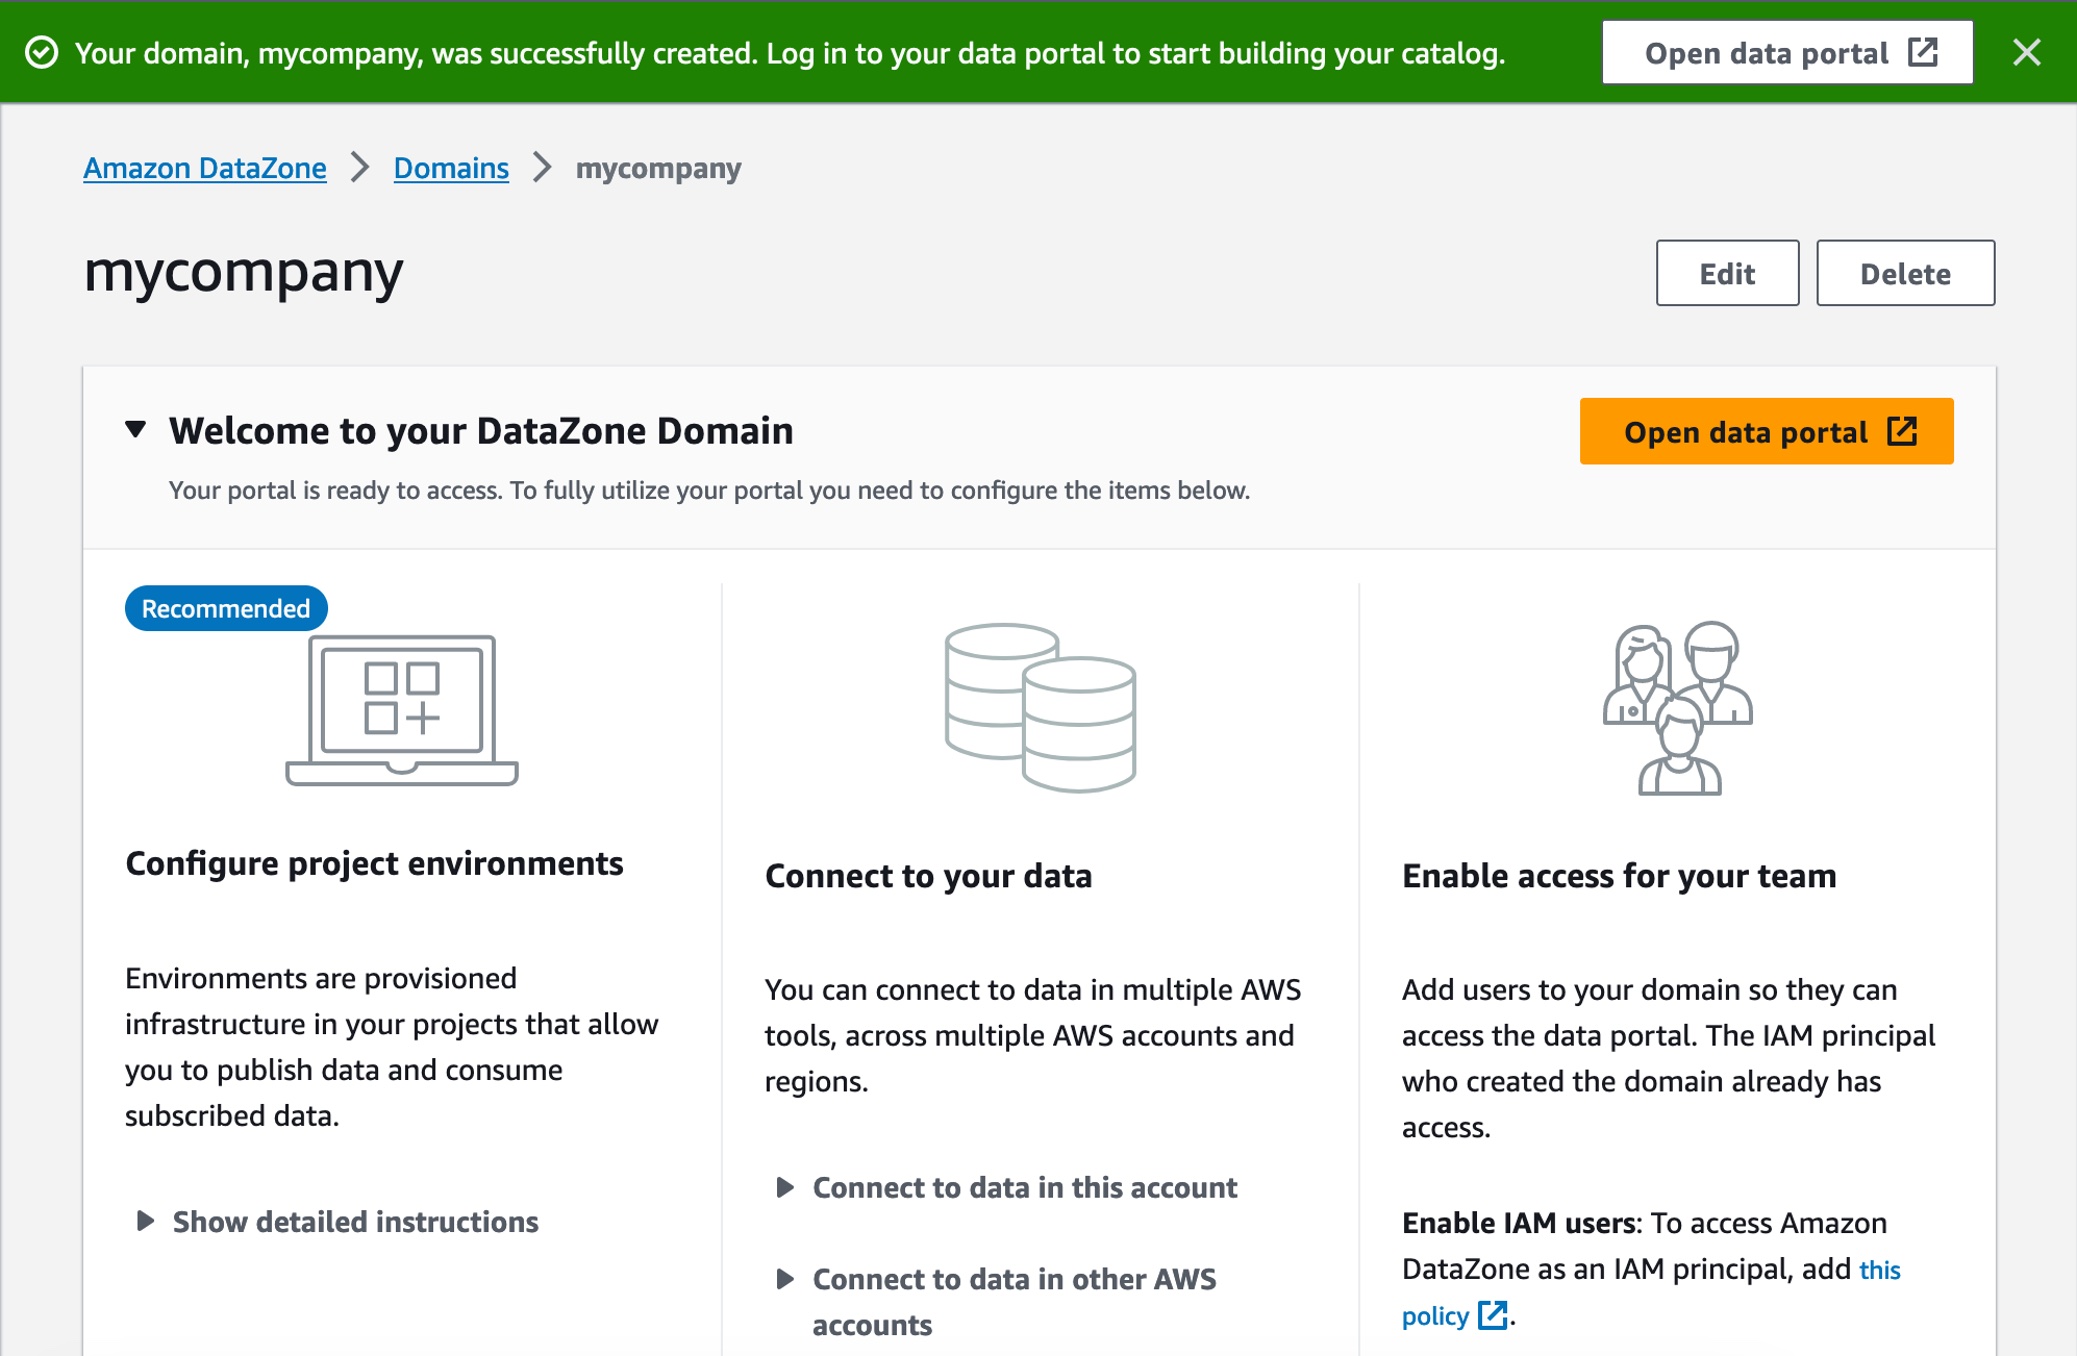
To create a new data project as the sales team to publish sales data, choose Create Project.

In the dialogbox, enter “Sales producer project” as the Name, then enter a Description for this project and choose Create.

Once you have the project, you need to create a environment to work with data and analytics tools such as Amazon Athena or Amazon Redshift in this project. Choose Create environment in the overview page or after clicking the Environment tab.

Enter “publish-environment” as the Name, then enter a Description for this environment and choose Environment profile. An environment profile is a pre-defined template that includes technical details required to create an environment such as which AWS account, Region, VPC details, and resources and tools are added to the project.
You can select a couple of default environment profiles. Choosing DataLakeProfile enables you to publish data from your Amazon S3 and AWS Glue based data lakes. It also simplifies querying the AWS Glue tables that you have access to using Amazon Athena.

Next, ignore all the optional parameters and choose Create environment. It takes about a minute for the environment to create certain resources in your AWS account such as IAM roles, an Amazon S3 suffix, AWS Glue databases, and an Athena workgroup, which makes it easier for members of a project to produce and consume data in the data lake.
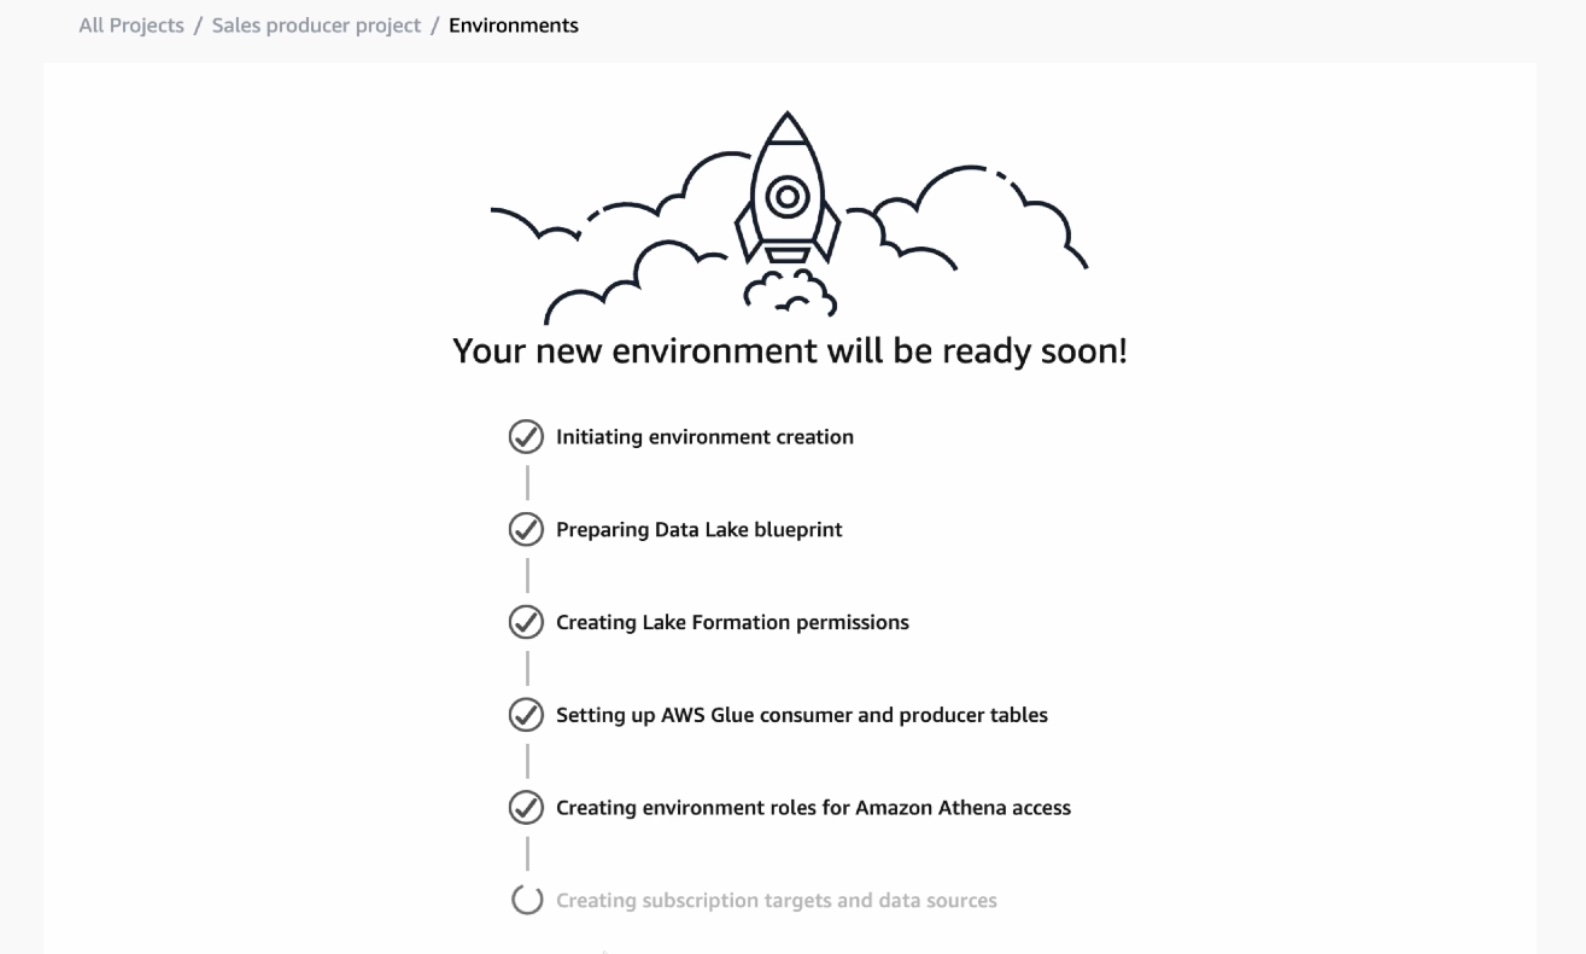
3. Publish Data in the Data Portal
You have the environment to publish your data in your AWS Glue table. To create this table in Amazon Athena, choose Query data with the Athena link on the right-hand side of the Environments page.
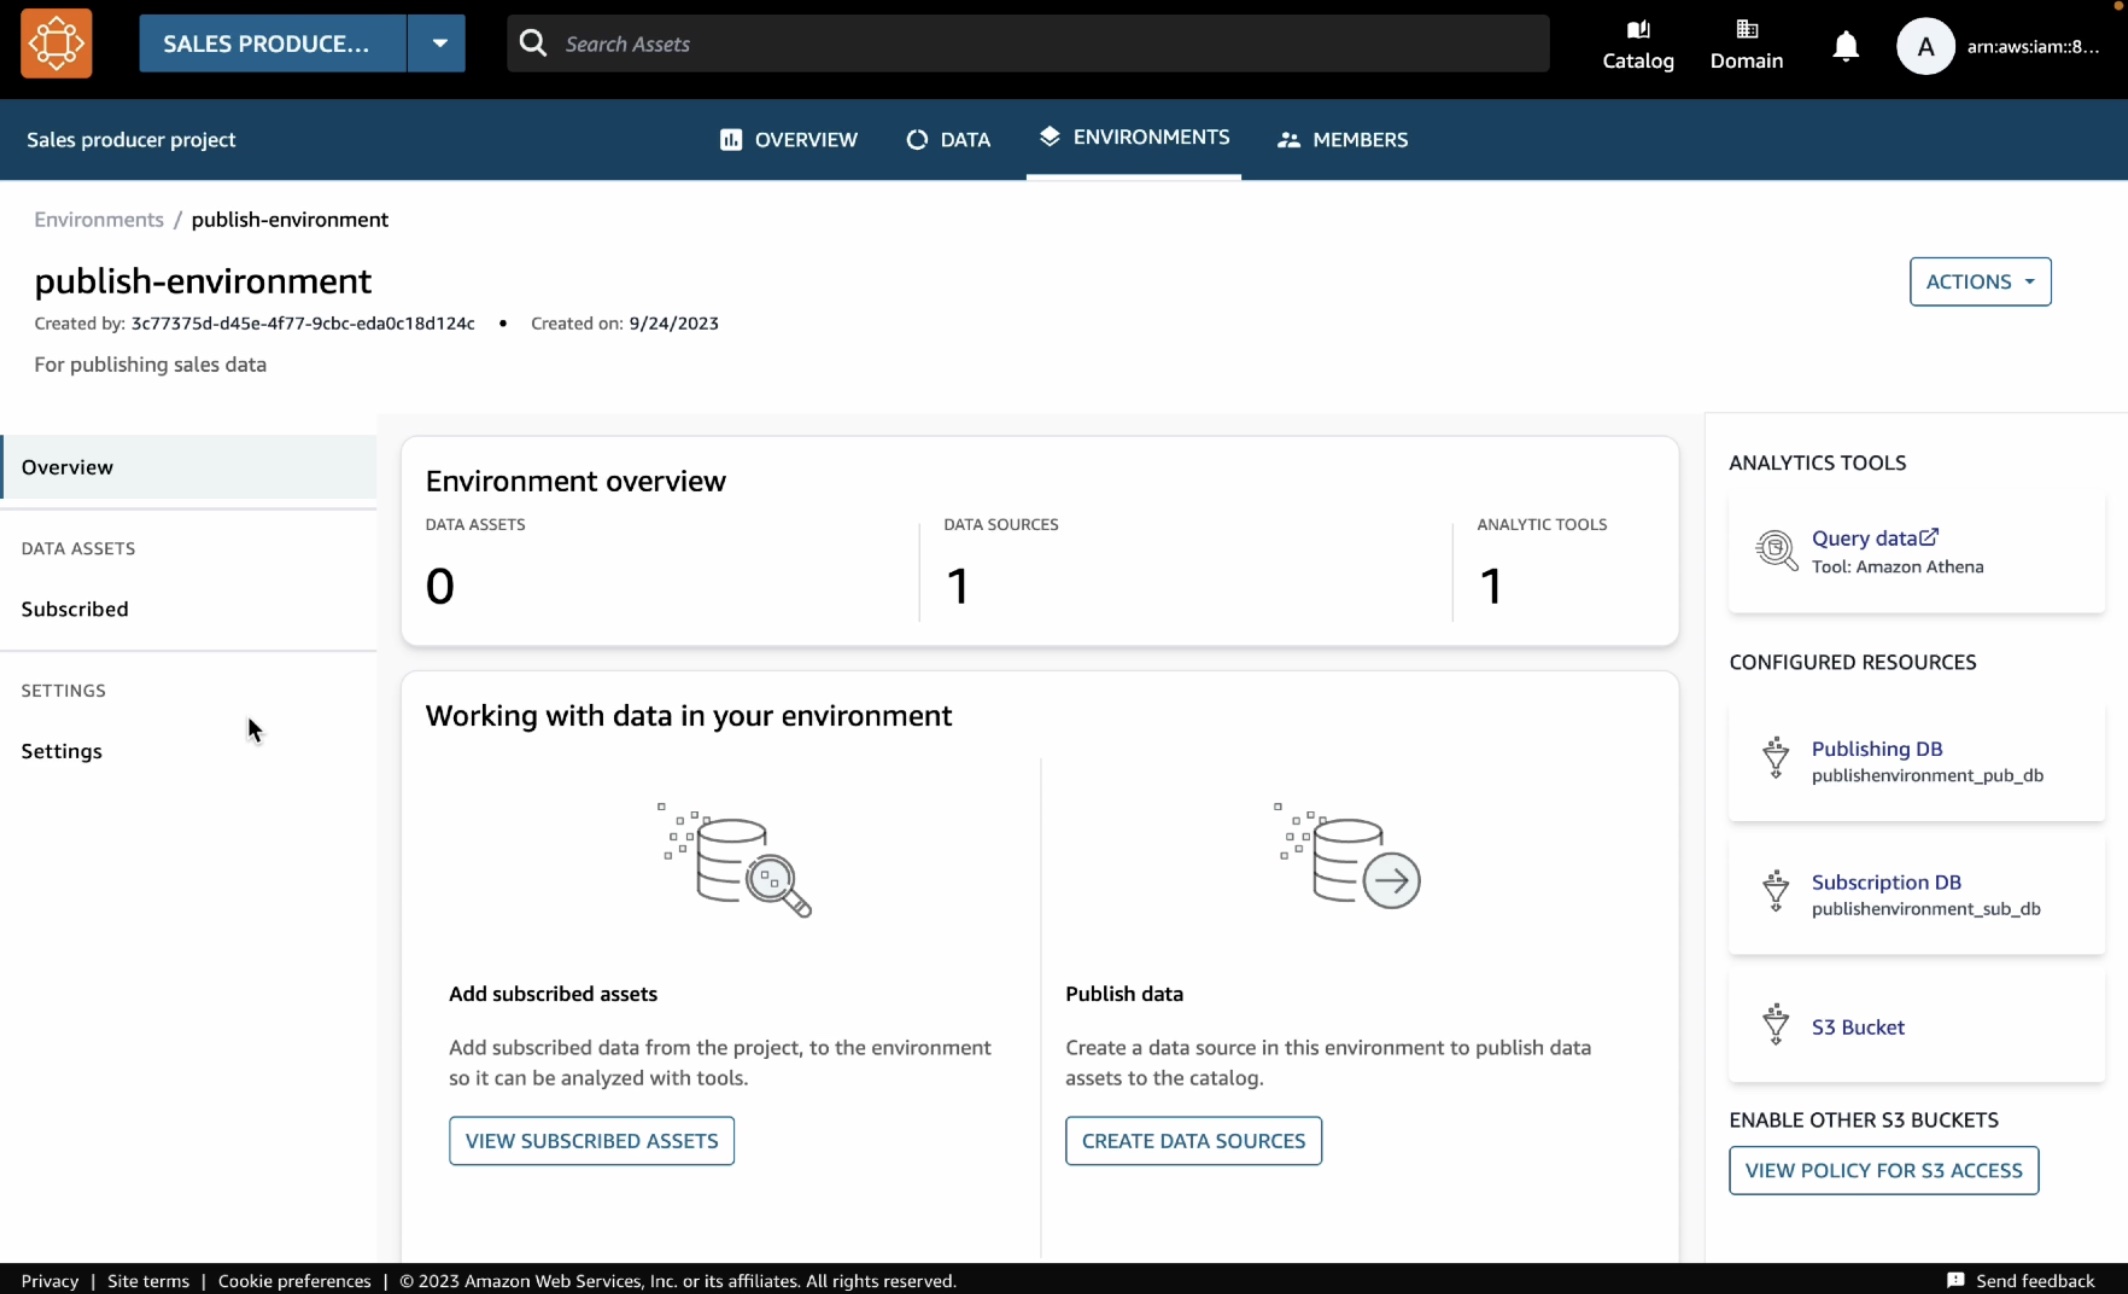
This opens the Athena query editor in a new tab. Select publishenvironment_pub_db from the database dropdown and then paste the following query into the query editor. This will create a table called catalog_sales in the environment’s AWS Glue database.
CREATE TABLE catalog_sales AS
SELECT 146776932 AS order_number, 23 AS quantity, 23.4 AS wholesale_cost, 45.0 as list_price, 43.0 as sales_price, 2.0 as discount, 12 as ship_mode_sk,13 as warehouse_sk, 23 as item_sk, 34 as catalog_page_sk, 232 as ship_customer_sk, 4556 as bill_customer_sk
UNION ALL SELECT 46776931, 24, 24.4, 46, 44, 1, 14, 15, 24, 35, 222, 4551
UNION ALL SELECT 46777394, 42, 43.4, 60, 50, 10, 30, 20, 27, 43, 241, 4565
UNION ALL SELECT 46777831, 33, 40.4, 51, 46, 15, 16, 26, 33, 40, 234, 4563
UNION ALL SELECT 46779160, 29, 26.4, 50, 61, 8, 31, 15, 36, 40, 242, 4562
UNION ALL SELECT 46778595, 43, 28.4, 49, 47, 7, 28, 22, 27, 43, 224, 4555
UNION ALL SELECT 46779482, 34, 33.4, 64, 44, 10, 17, 27, 43, 52, 222, 4556
UNION ALL SELECT 46779650, 39, 37.4, 51, 62, 13, 31, 25, 31, 52, 224, 4551
UNION ALL SELECT 46780524, 33, 40.4, 60, 53, 18, 32, 31, 31, 39, 232, 4563
UNION ALL SELECT 46780634, 39, 35.4, 46, 44, 16, 33, 19, 31, 52, 242, 4557
UNION ALL SELECT 46781887, 24, 30.4, 54, 62, 13, 18, 29, 24, 52, 223, 4561
You can see the two databases in the dropdown menu. The publishenvironment_pub_db is to provide you with a space to produce new data and choose to publish it to the DataZone catalog. The other one, publishenvironment_sub_db is for project members when they subscribe to or access to data in the catalog within that project.
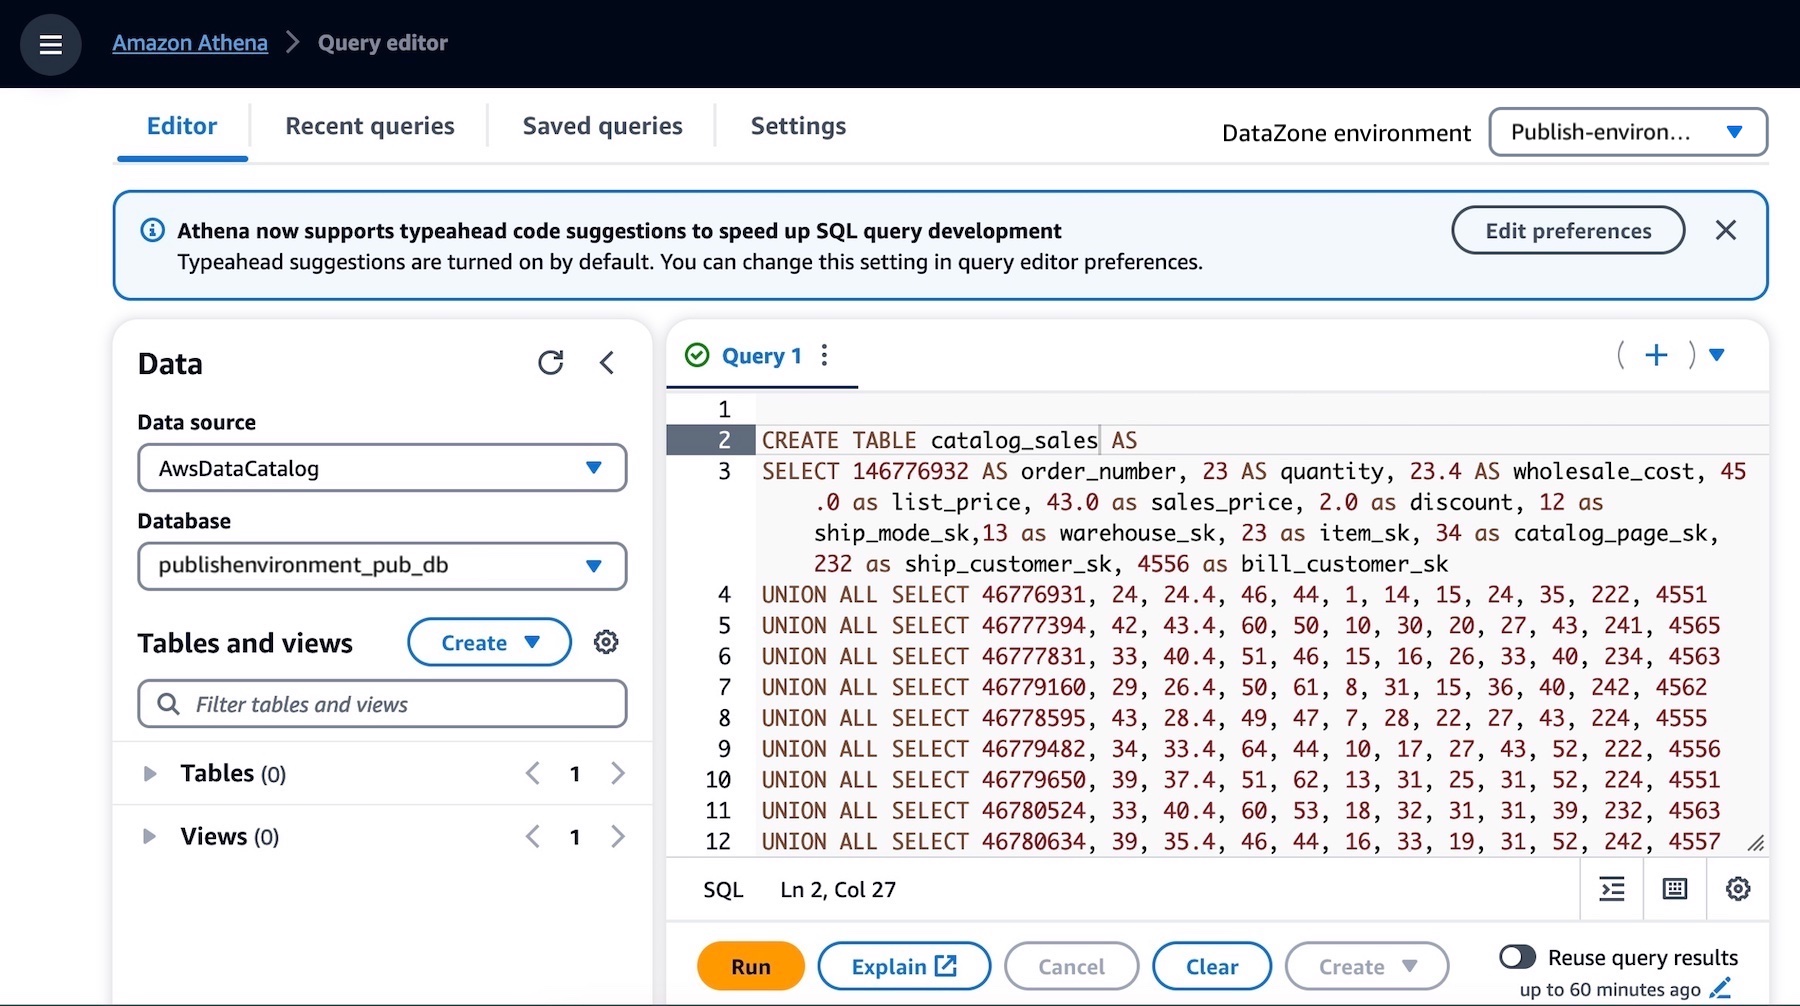
Make sure that the catalog_sales table is successfully created. Now you have a data asset that can be published into the Amazon DataZone catalog.
As the data producer, you can now go back to the data portal and publish this table into the DataZone catalog. Choose the Data tab in the top menu and Data sources in the left navigation pane.
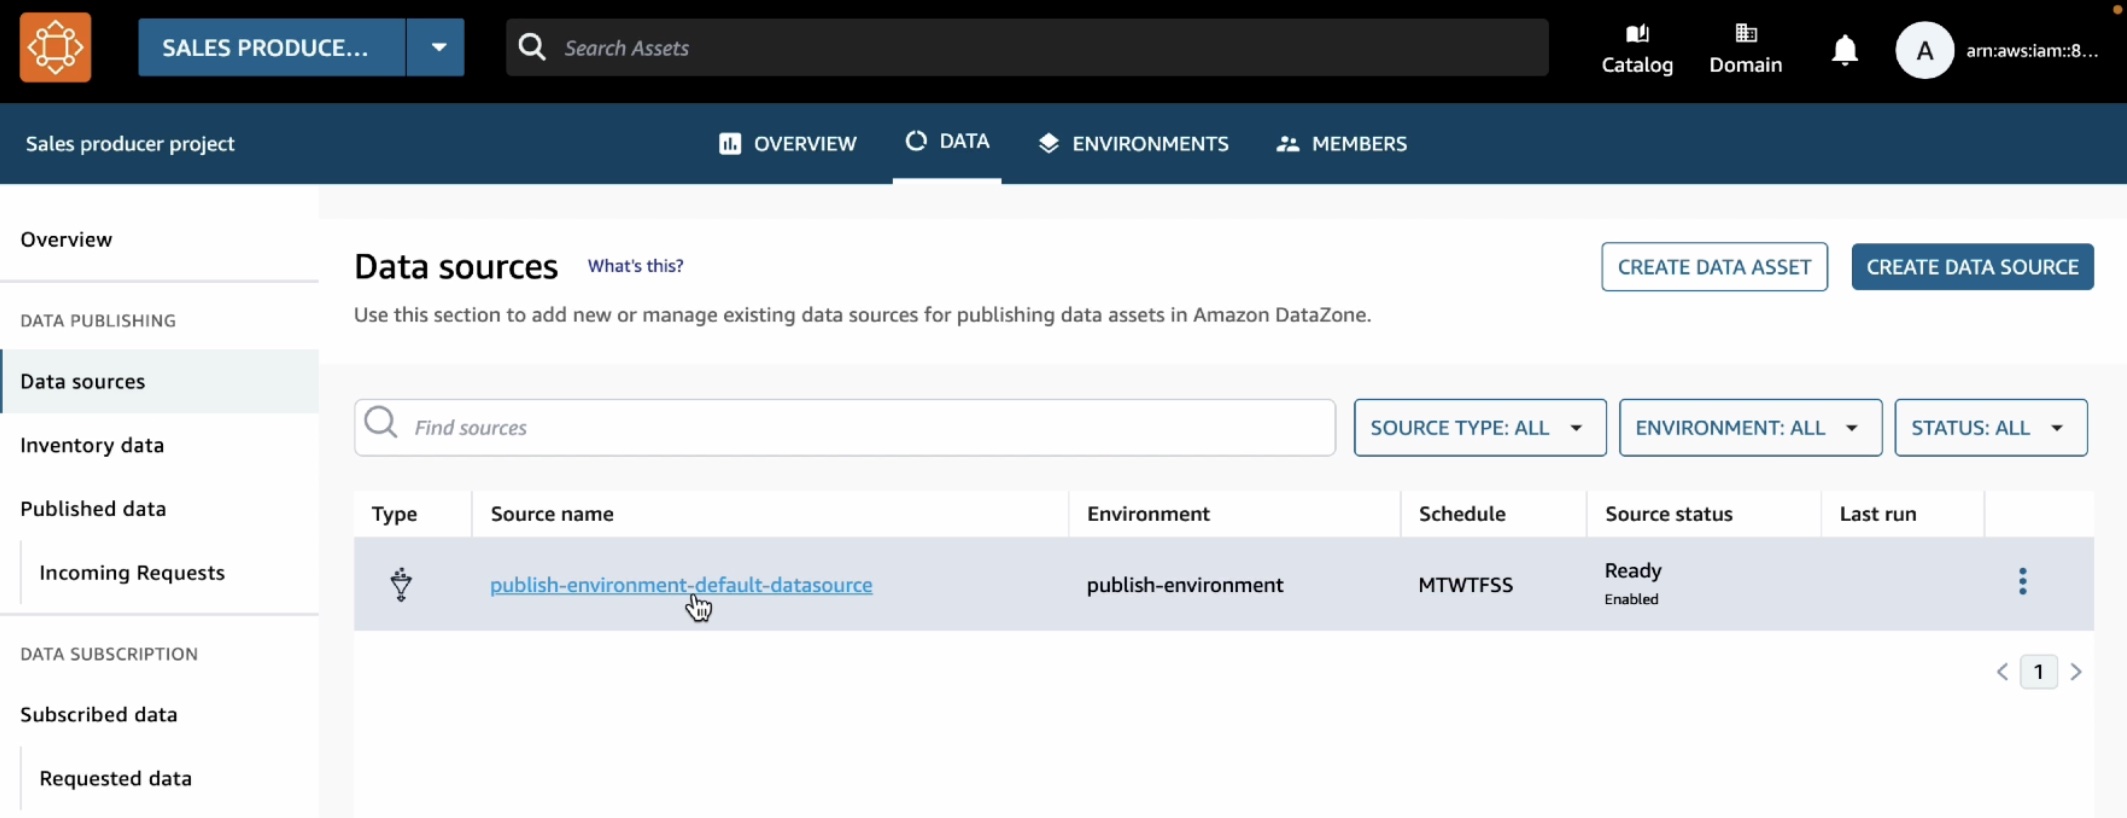
You can see a default data source automatically created in your environment. When you open this data source, you will see your environments’ publishing database where we just created the catalog_sales table.
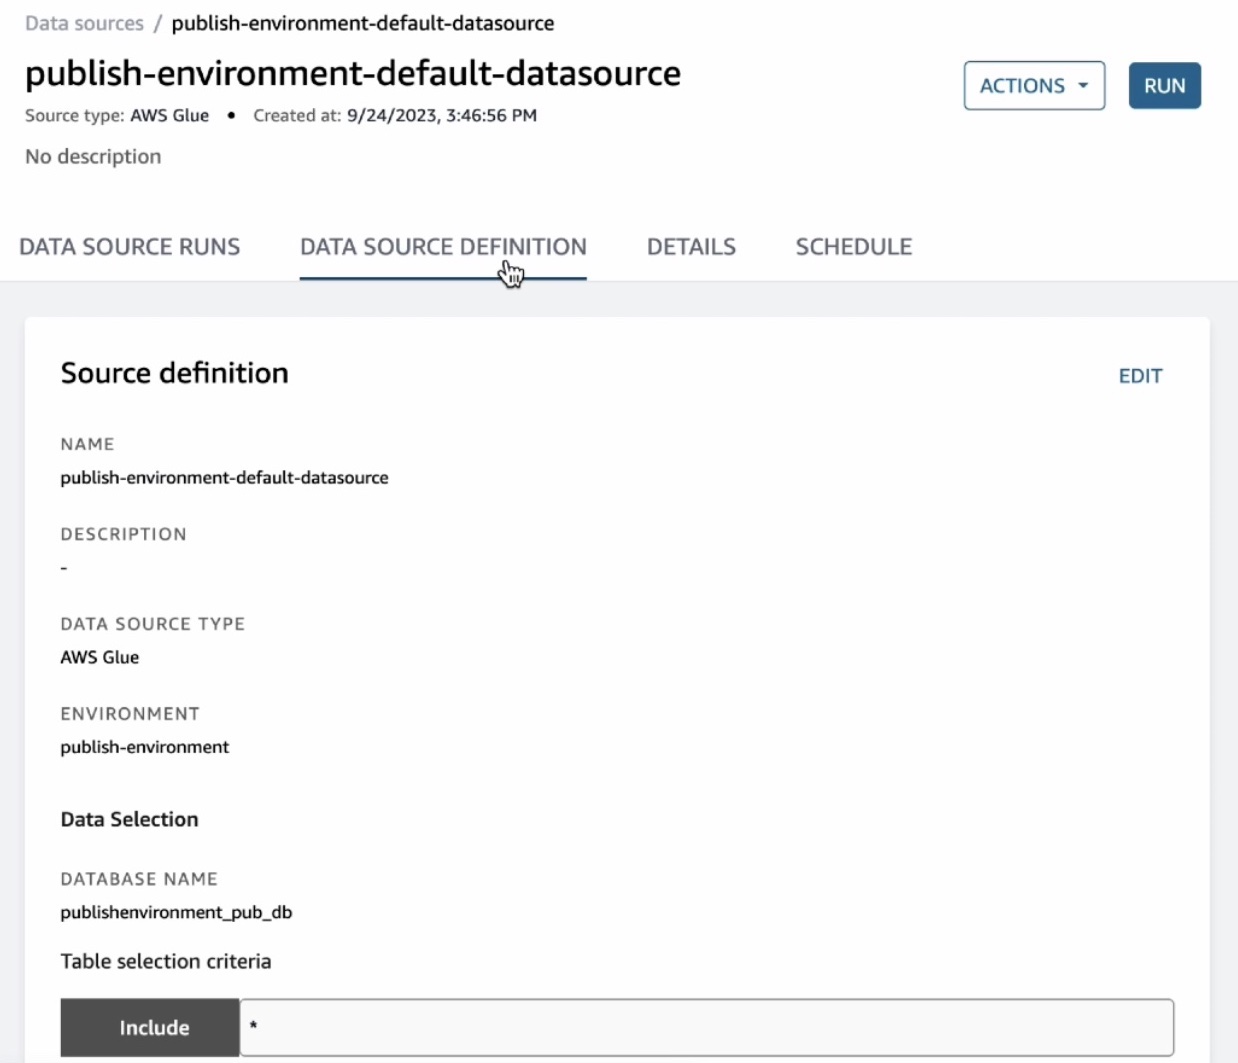
This data source will bring in all the tables it finds in the publishing database into the DataZone. By default, automated metadata generation is enabled, which means that any asset that the data source bring into the DataZone will automatically generate the business names of the table and columns for that asset. Choose Run in this data source.
Once the data source has finished running, you can see the catalog sales table in the Data Source Runs.
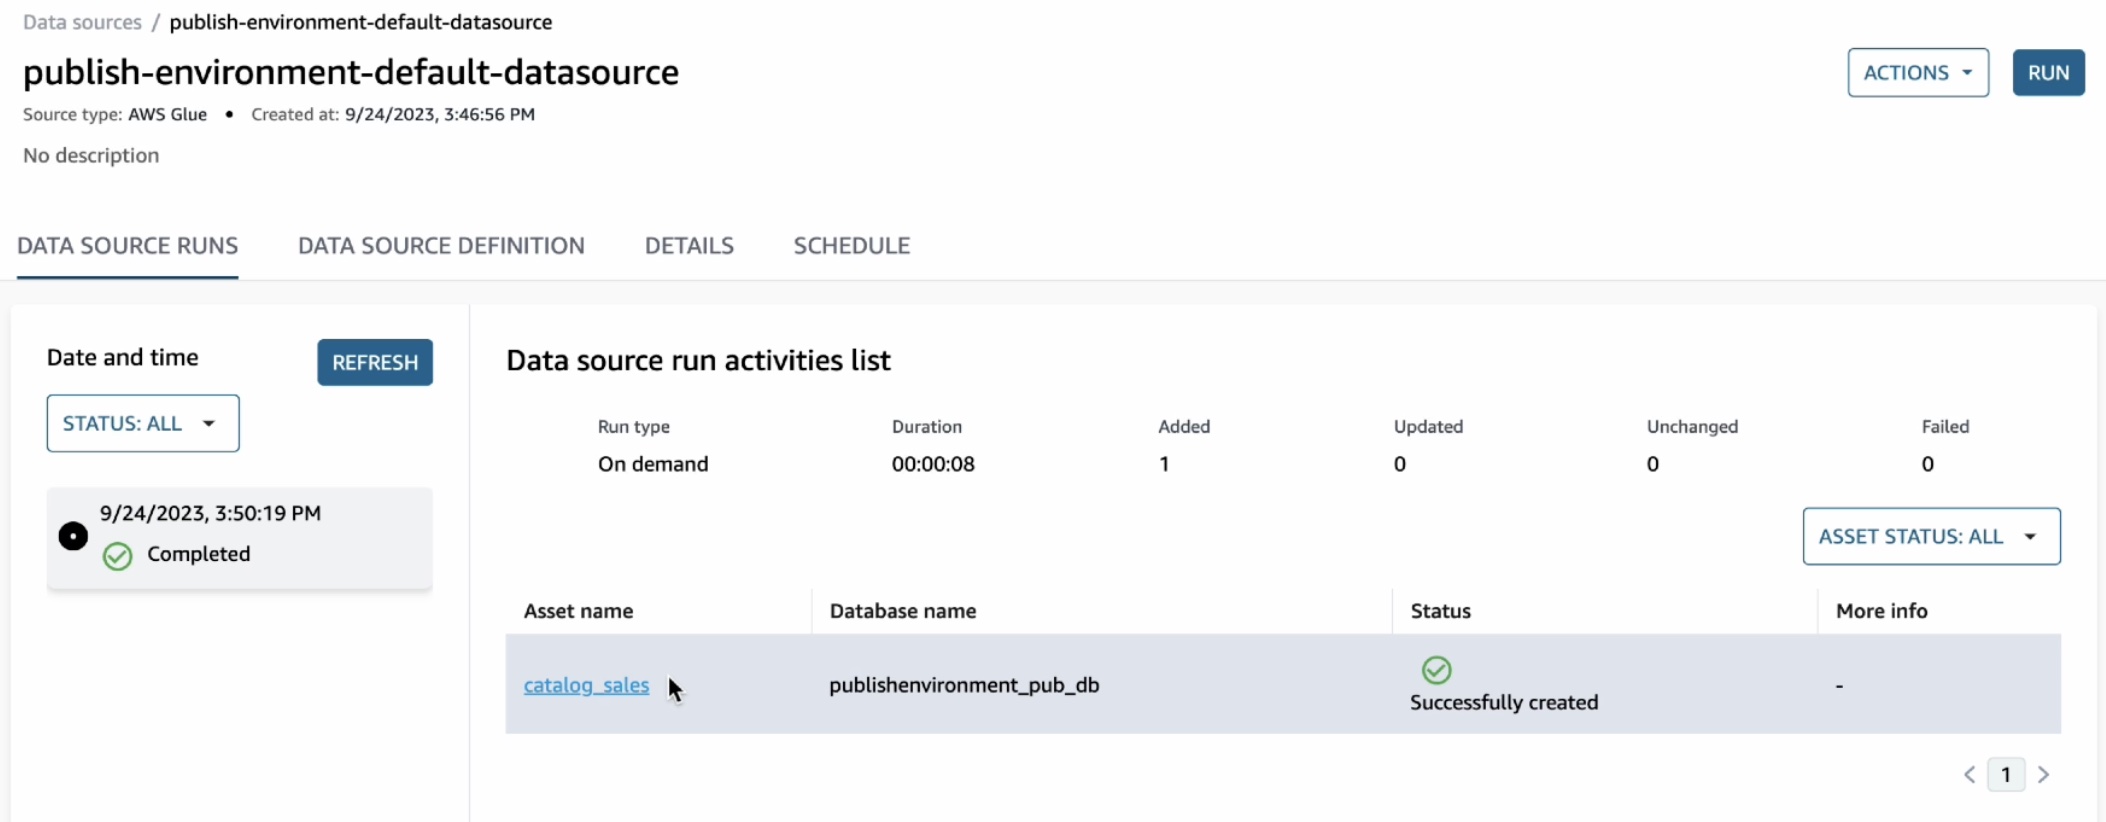
You can open this asset and see that the publishing job could automatically extract the technical metadata including the schema of the table and several other technical details such as AWS account, Region, and physical location of the data.
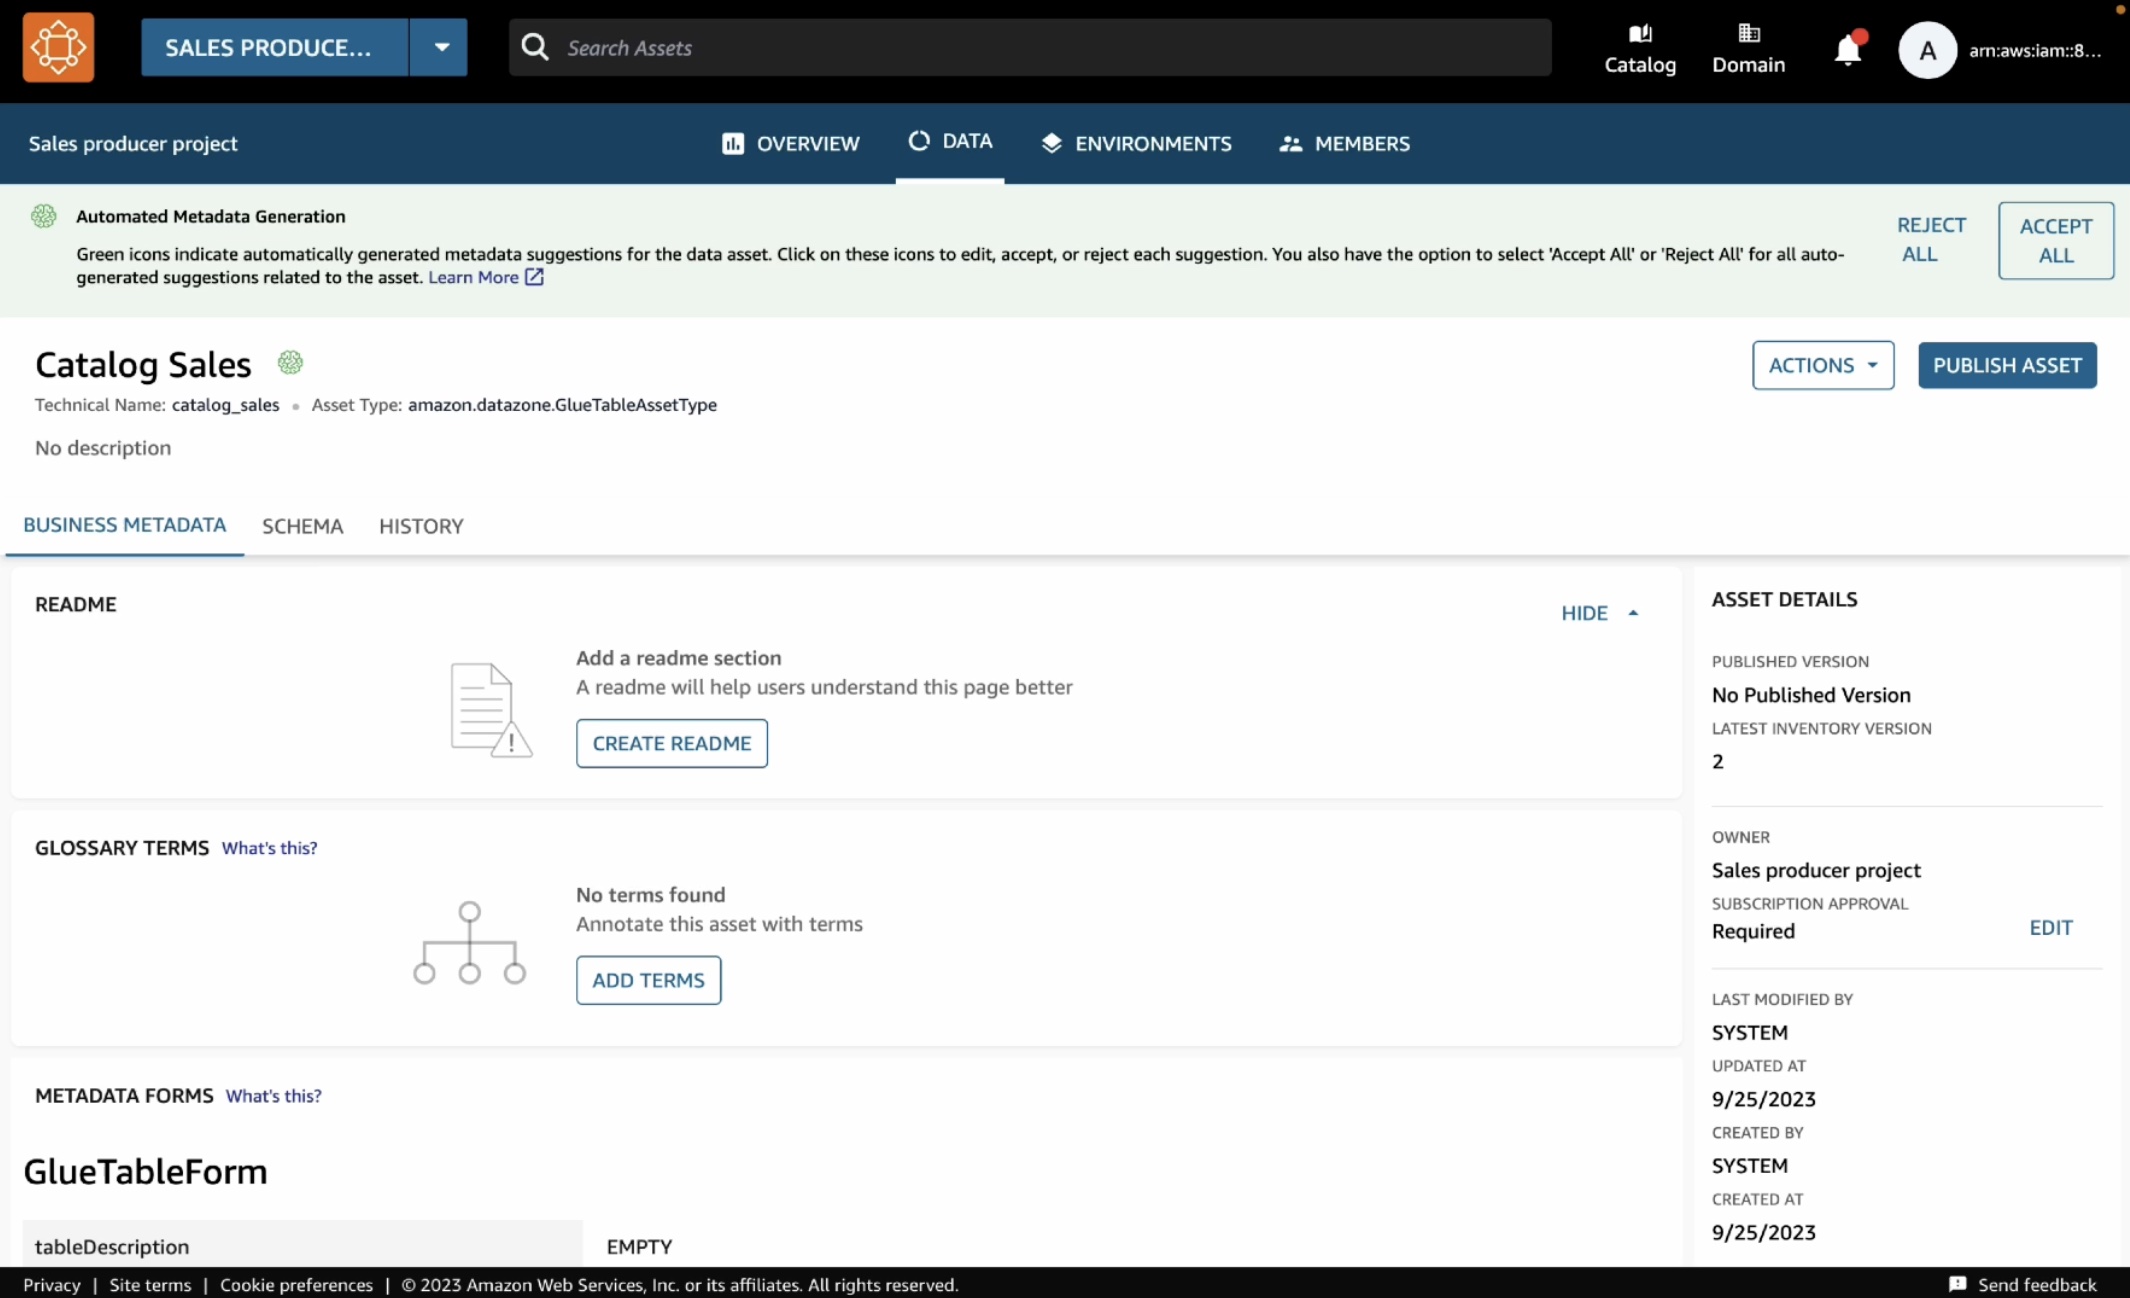
If they look correct, you can simply accept these recommendations either by clicking the brain icon in each recommended item or the Accept all button for all recommendations. When you are ready to publish, choose Publish asset and reconfirm in the dialog box.
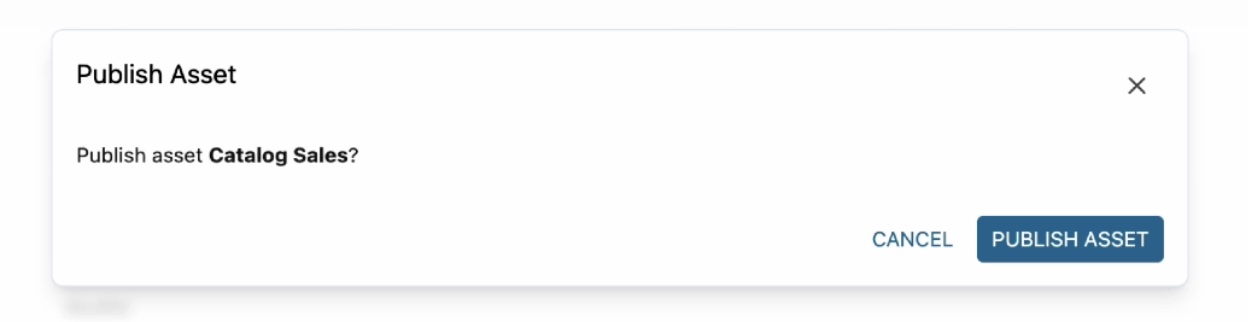
4. Subscribe Data as a Data Consumer
Now let’s switch the role to a marketing team and see how you can subscribe to or request access this table. Repeat to create a new project called “Marketing consumer project” and a new environment called “subscriber-environment” as the data consumer using the same steps as before.
In the new created project, when you type “catalog sales” in the search bar, you can see the published table in the search results. Choose the Catalog Sales Data.
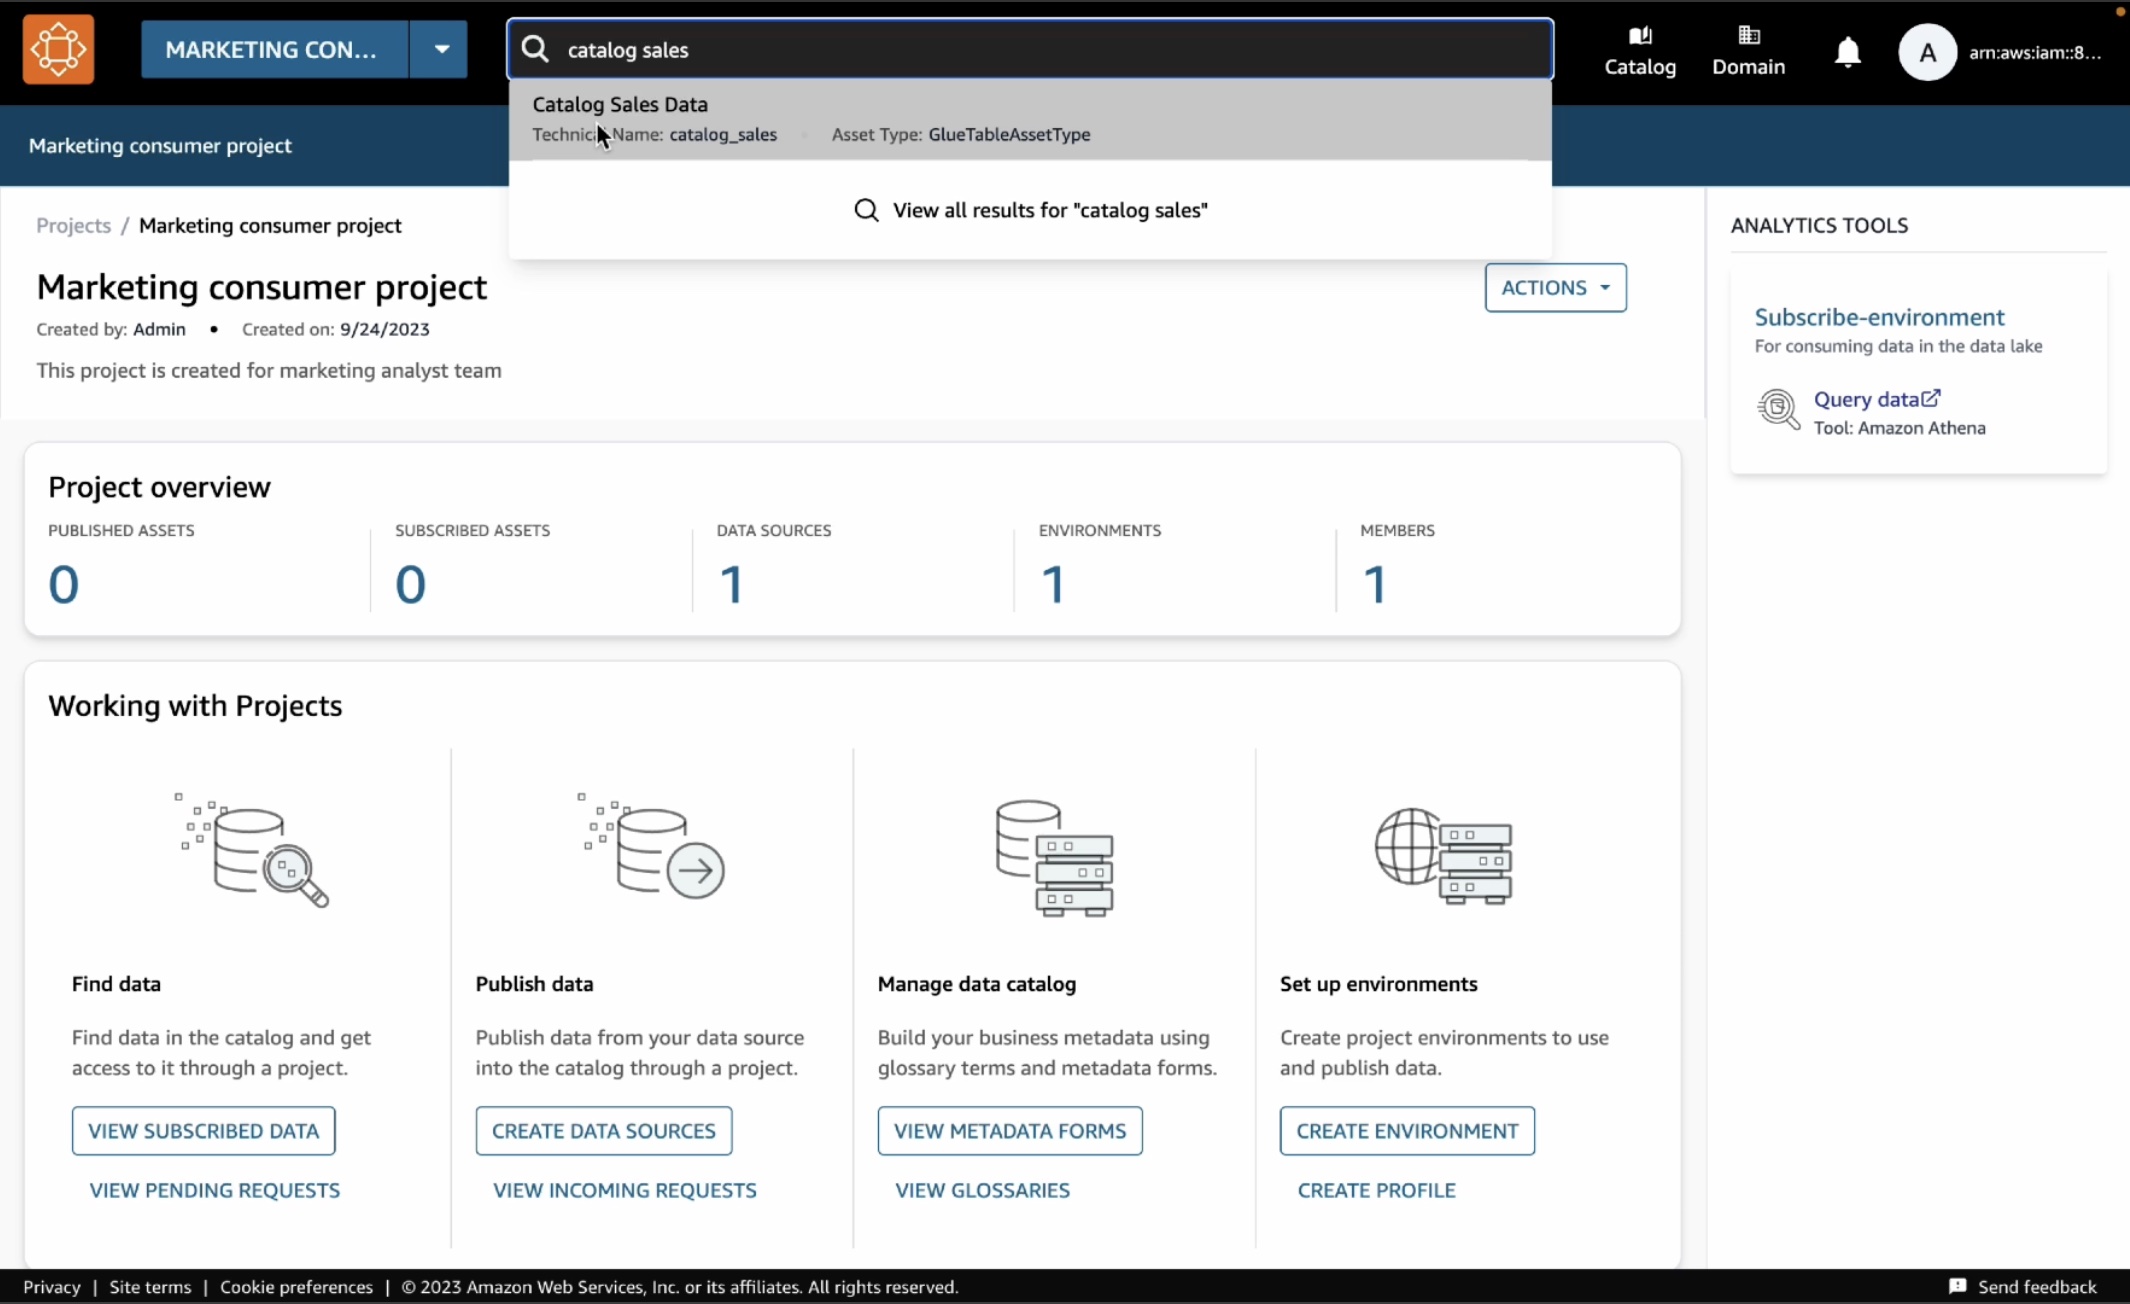
In the catalog, choose Subscribe.
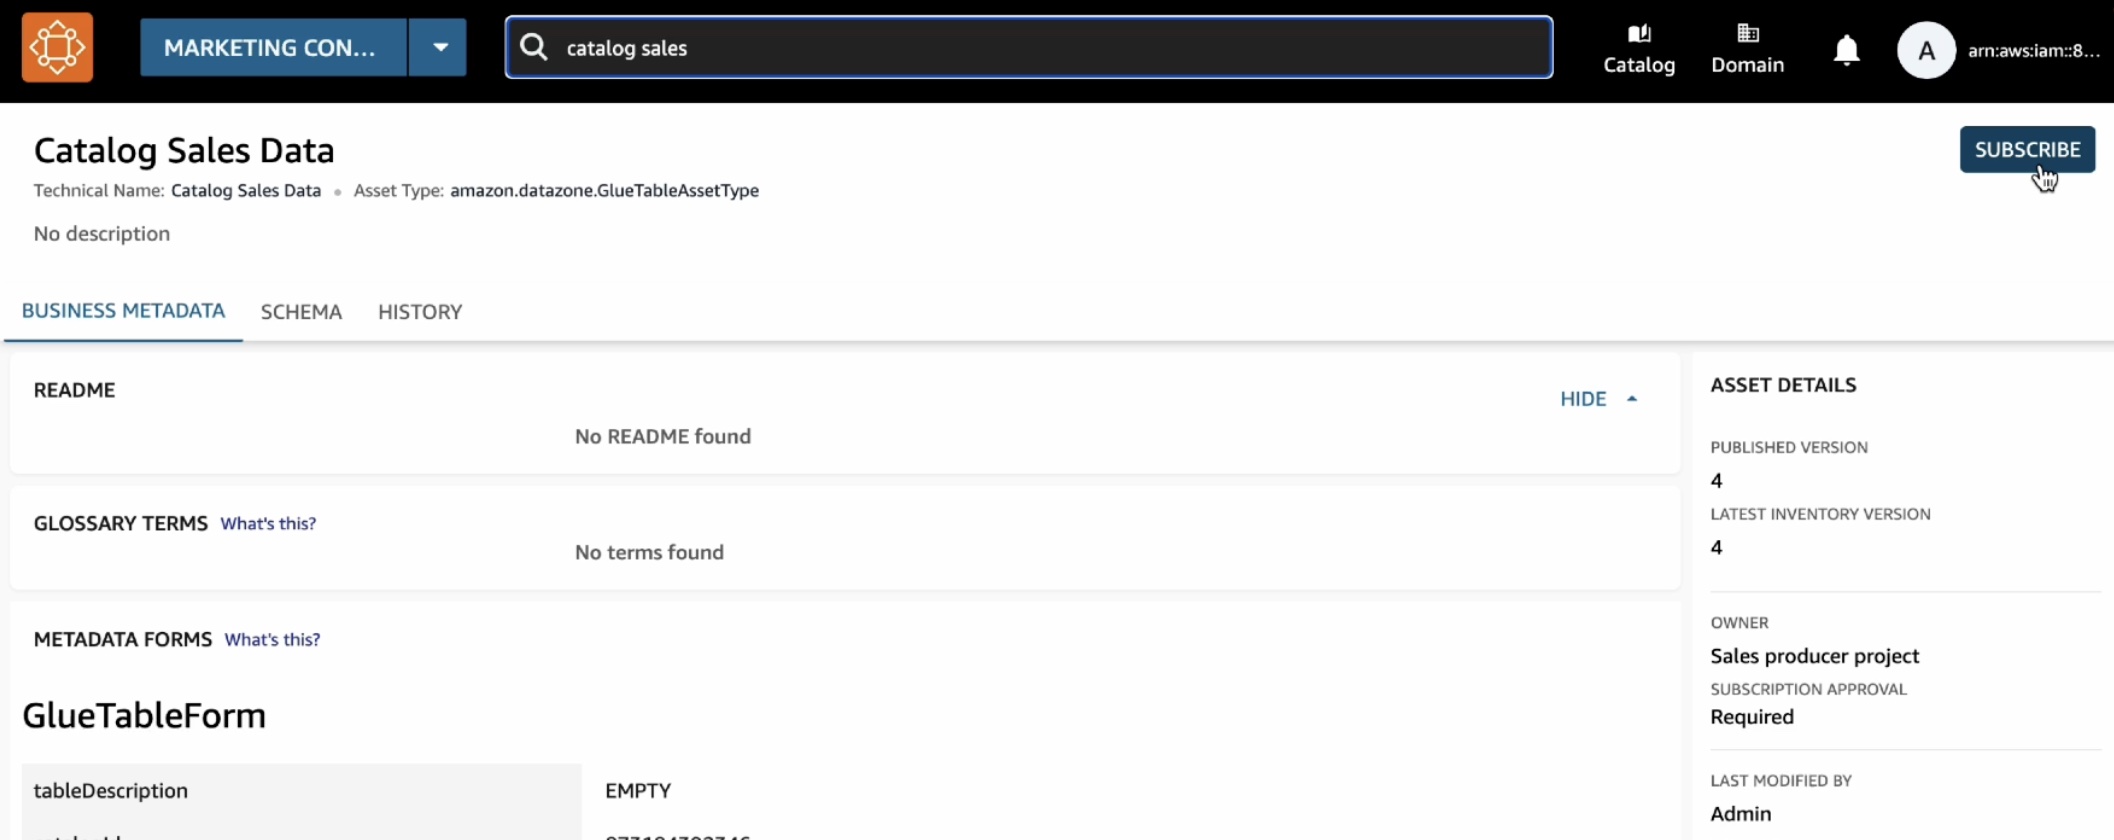
In the Subscribe to Catalog Sales Data window, select your marketing consumer project, provide a reason for the subscription request, and then choose Subscribe.
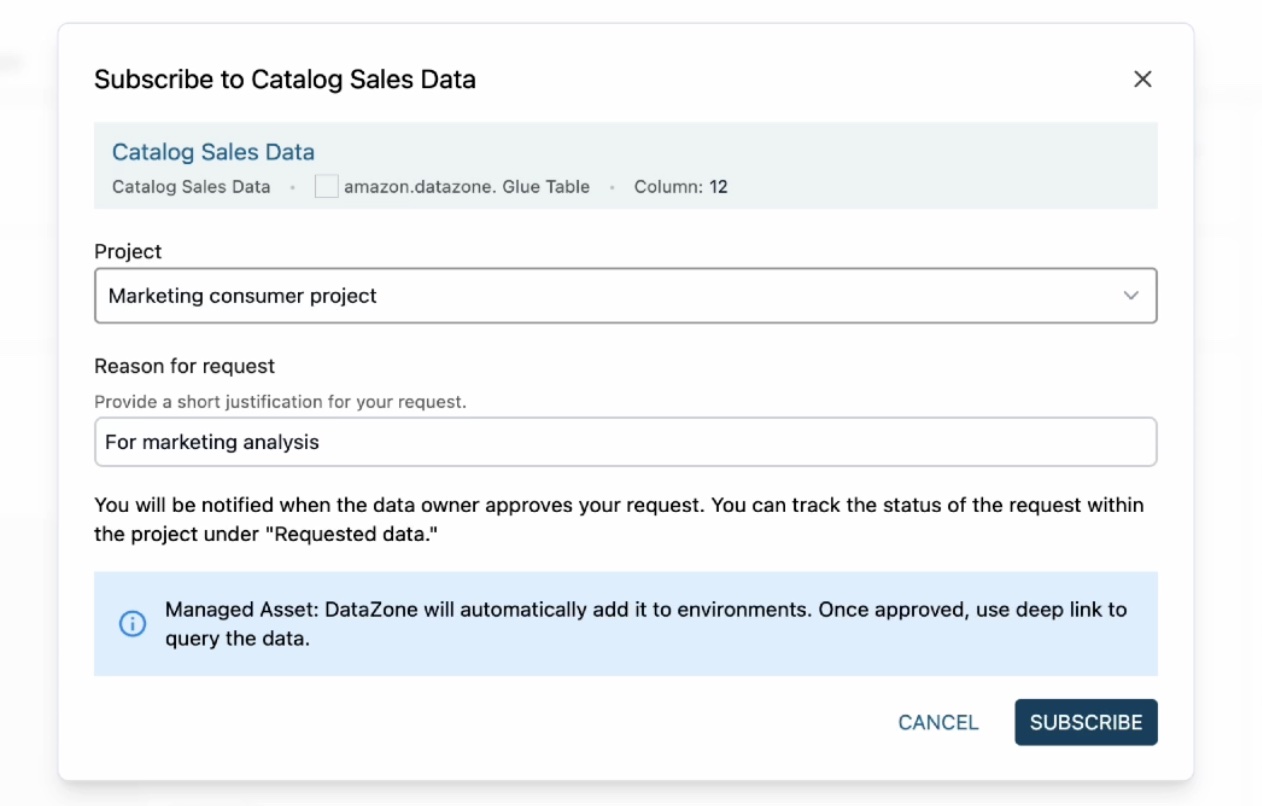
When you get a subscription request as a data producer, it will notify you through a task in the sales producer project. Since you are acting as both subscriber and publisher here, you will see a notification.
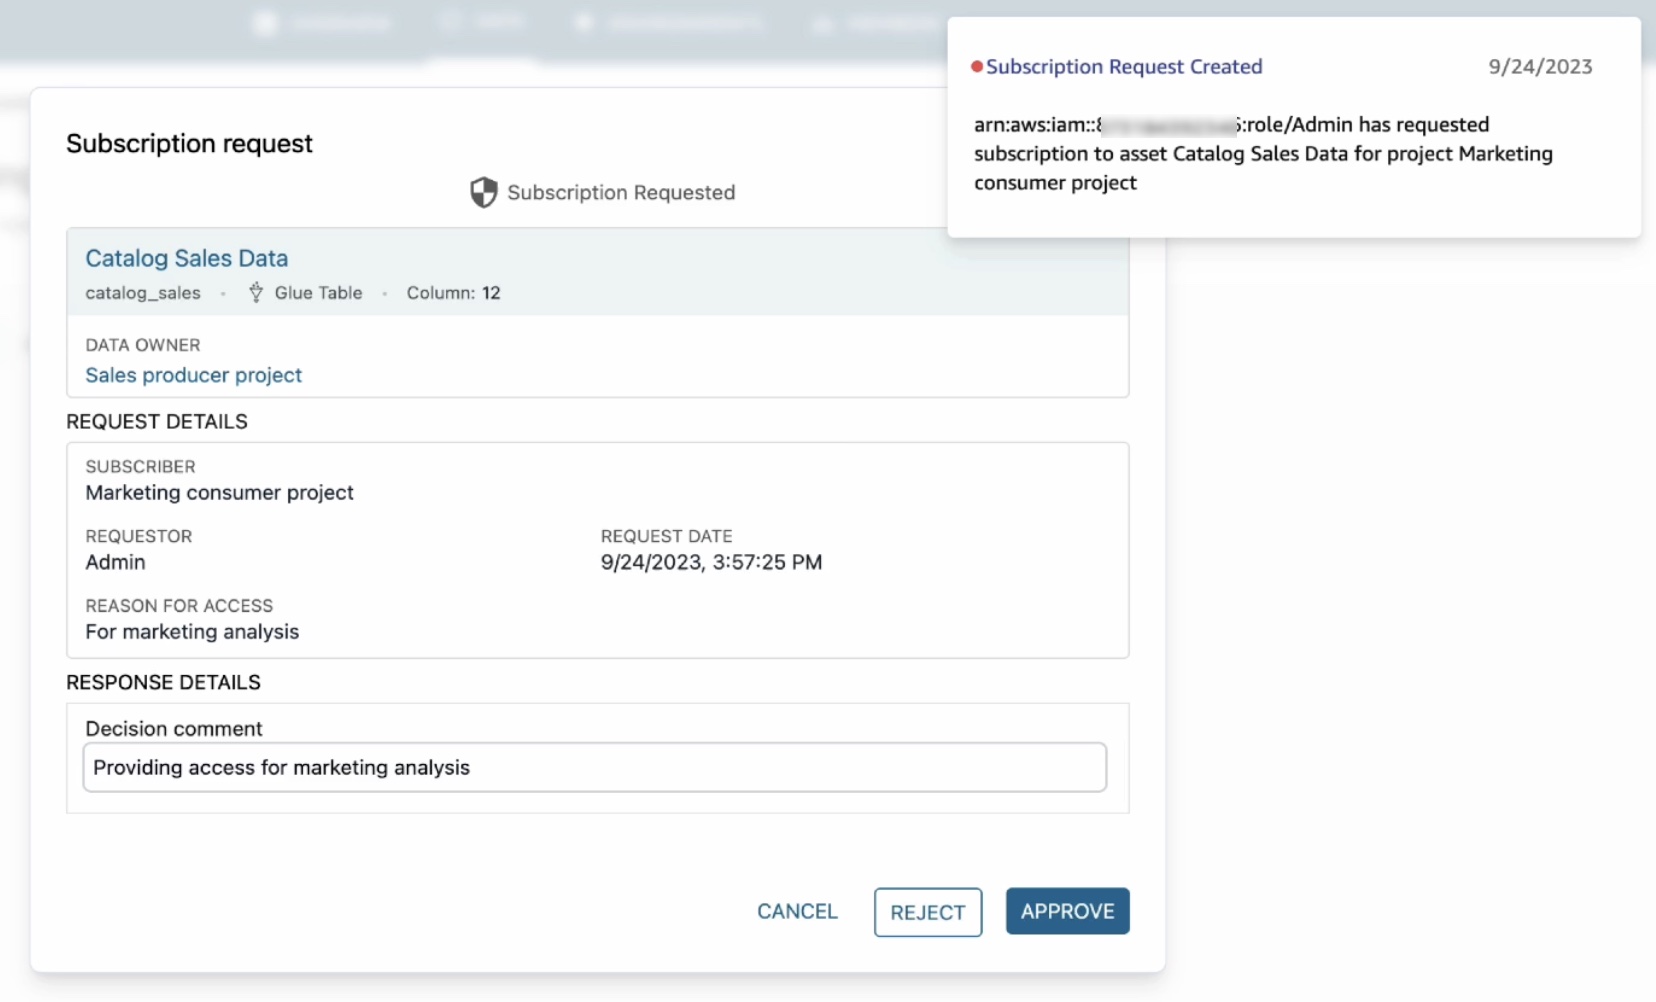
When you click on this notification, it will open the subscription request including which project has requested access, who the requestor is, and why they need access. Choose Approve and provide a reason for approval.
Now that subscription has been approved, you can see catalog sales data in your marketing consumer project. To confirm this, choose the Data tab in the top menu and Data sources in the left navigation pane.
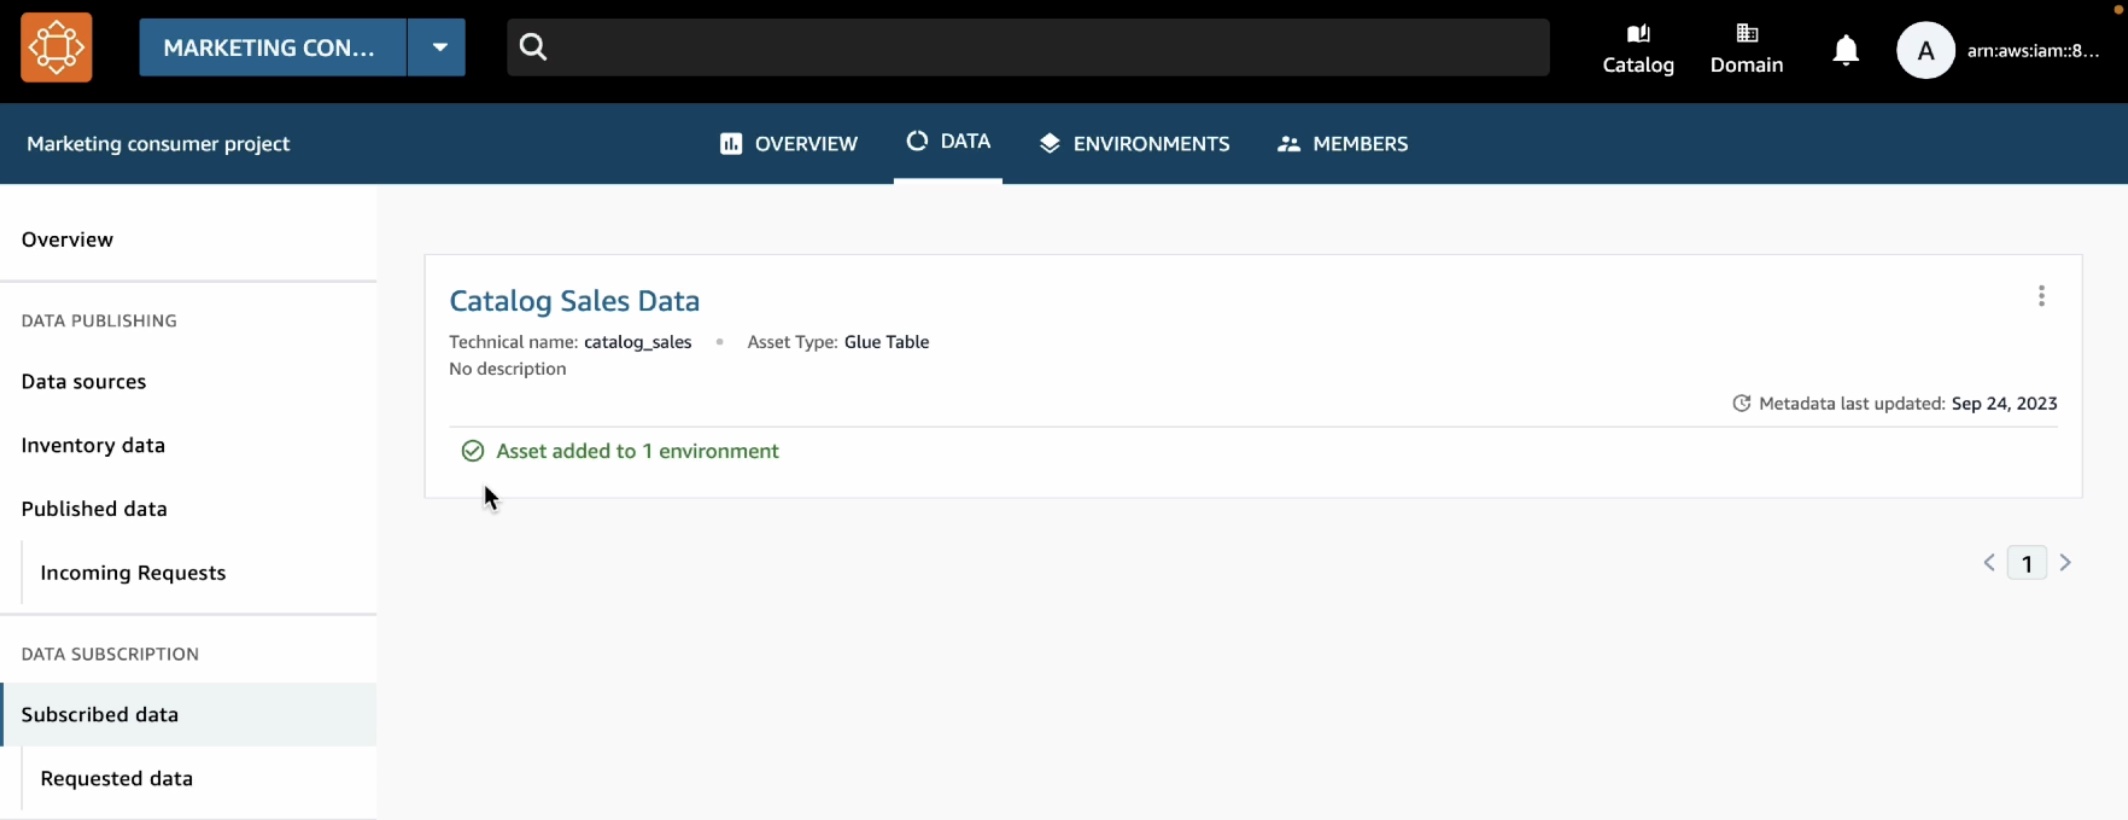
To analyze your subscribe data, choose the Environments tab in the top menu and Subscribe-environment you created in the marketing consumer project. It shows a new Query Data link in the right pane.
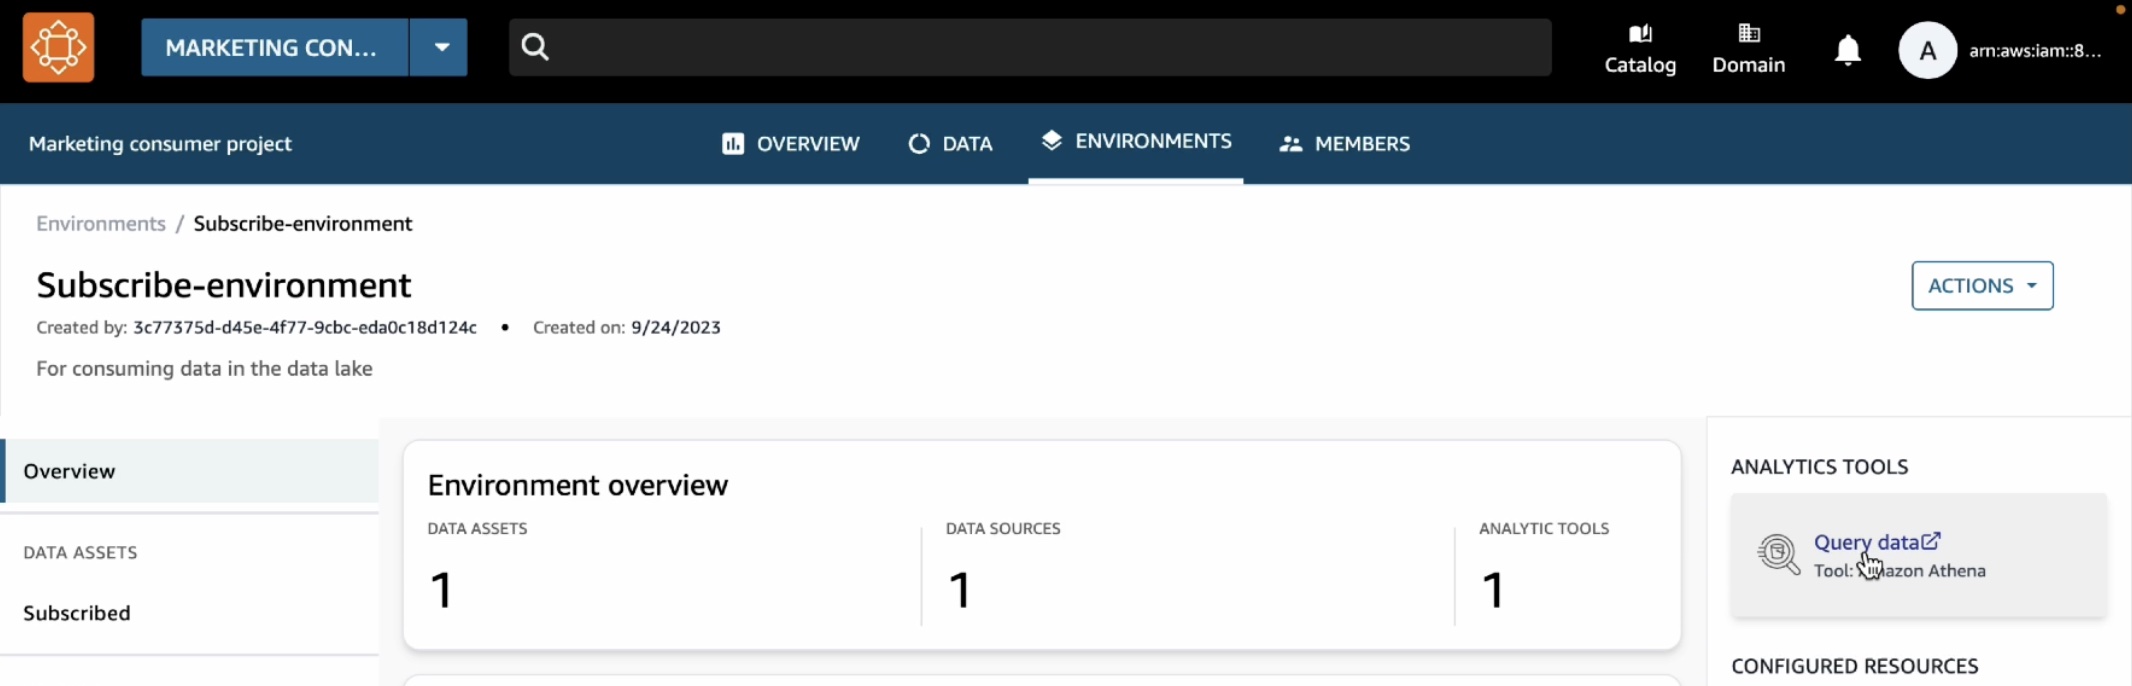
We can see that the catalog sales table is showing up under subscription database.
To make sure that we have access to this table, we can preview it and we can see that the query executes successfully.
This opens the Athena query editor in a new tab. Select subscribeenvironment_sub_db from the database dropdown, and then enter your query into the query editor.
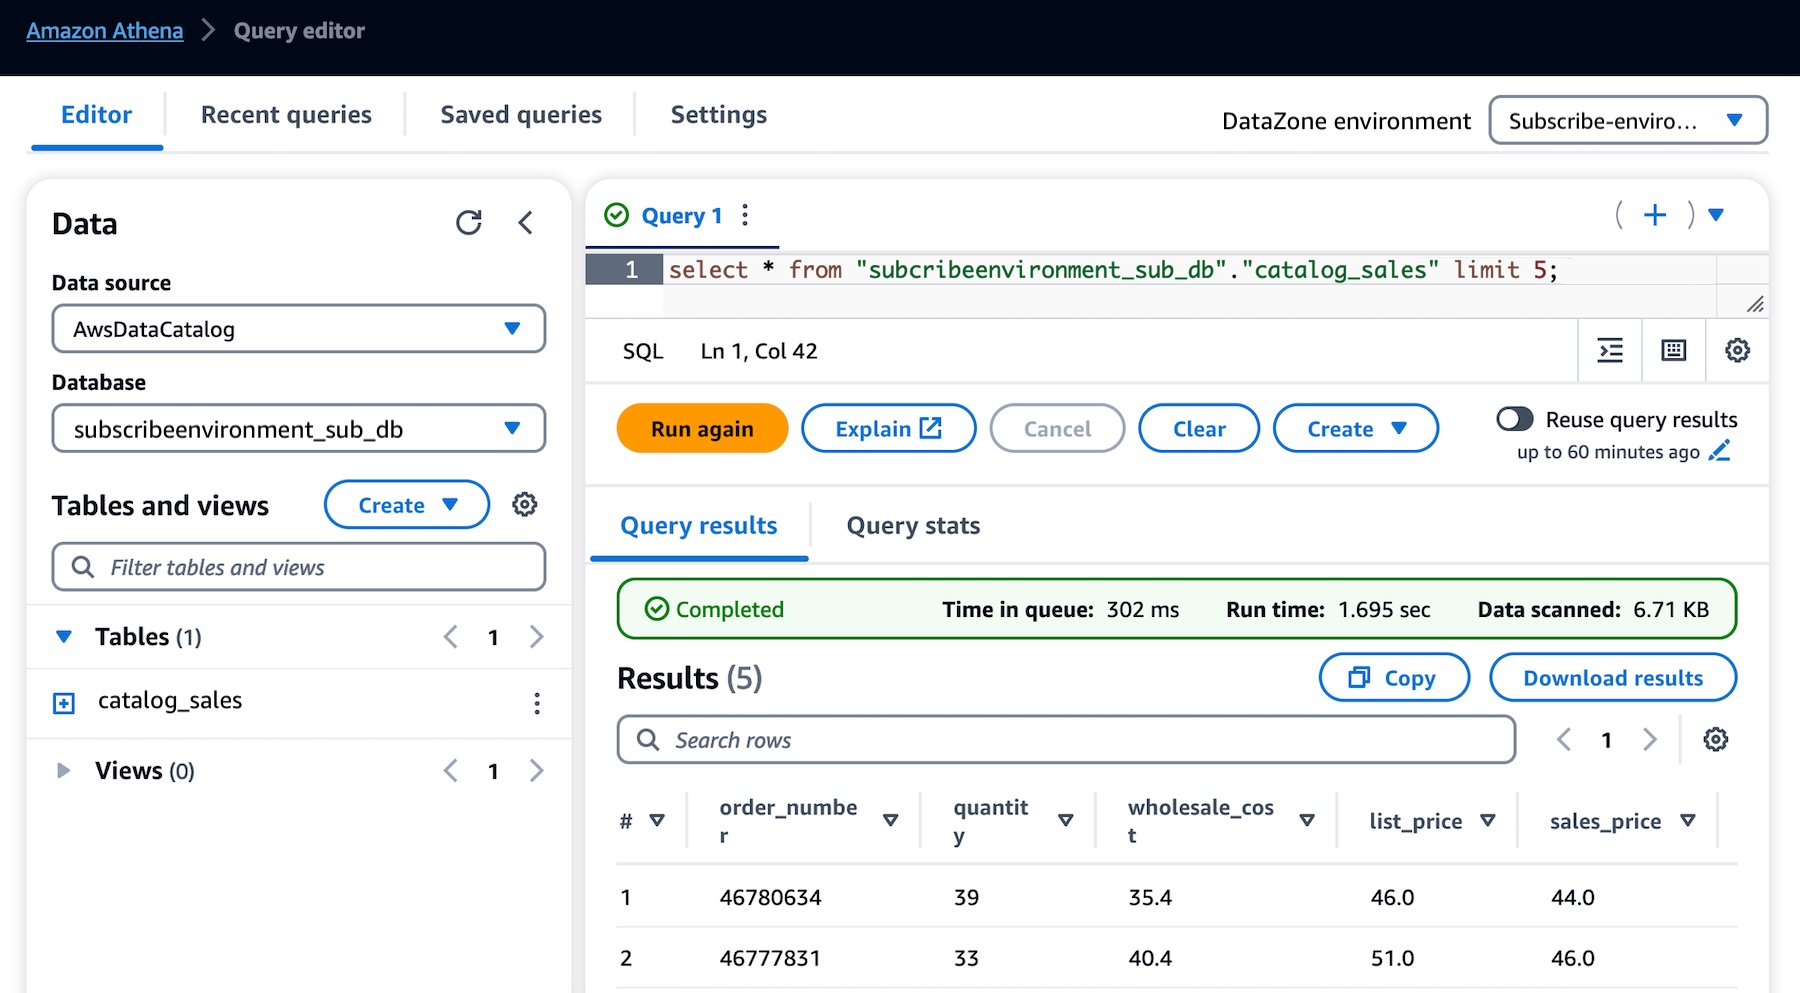
You can now run any queries on the sales data table that you have subscribed to as a consumer (marketing team) and that was published into the business data catalog by a producer (sales team).
For more detailed demos such as publishing AWS Glue tables and Amazon Redshift tables and view, see the YouTube playlist.
What’s New at GA?
During the preview, we had lots of interest and great feedback from customers. I want to quickly review the features and introduce some improvements:
Enterprise-Ready Business Catalog – To add business context and make data discoverable by everyone in the organization, you can customize the catalog with automated metadata generation which uses machine learning to automatically generate business names of data assets and columns within those assets. We also improved metadata curation functionality. At GA, you can attach multiple business glossary terms to assets and glossary terms to individual columns in the asset.
Self-Service for Data Users – To provide data autonomy for users to publish and consume data, you can customize and bring any type of asset to the catalog using APIs. Data publishers can automate metadata discovery through ingestion jobs or manually publish files from Amazon Simple Storage Service (Amazon S3). Data consumers can use faceted search to quickly find and understand the data. Users can be notified of updates in the system or actions to be taken. These events are emitted to the customer’s event bus using Amazon EventBridge to customize actions.
Simplified Access to analysis – At GA, projects will serve as business use case-based logical containers. You can create a project and collaborate on specific business use case-based groupings of people, data, and analytics tools. Within the project, you can create an environment that provides the necessary infrastructure to project members such as analytics tools and storage so that project members can easily produce new data or consume data they have access to. This allows users to add multiple capabilities and analytics tools to the same project depending on their needs.
Governed Data Sharing – Data producers own and manage access to data with a subscription approval workflow that allows consumers to request access and data owners to approve. You can now set up subscription terms to be attached to assets when published and automate subscription grant fulfillment for AWS managed data lakes and Amazon Redshift with customizations using EventBridge events for other sources.
Now Available
Amazon DataZone is now generally available in eleven AWS Regions: US East (Ohio), US East (N. Virginia), US West (Oregon), Asia Pacific (Singapore), Asia Pacific (Sydney), Asia Pacific (Tokyo), Canada (Central), Europe (Frankfurt), Europe (Ireland), Europe (Stockholm), and South America (São Paulo).
You can use the free trial of Amazon DataZone, which includes 50 users at no additional cost for the first 3 calendar months of usage. The free trial starts when you first create an Amazon DataZone domain in an AWS account. If you exceed the number of monthly users during your trial, you will be charged at the standard pricing.
To learn more, visit the product page and user guide. You can send feedback to AWS re:Post for Amazon DataZone or through your usual AWS Support contacts.
— Channy
Automate legacy ETL conversion to AWS Glue using Cognizant Data and Intelligence Toolkit (CDIT) – ETL Conversion Tool
Post Syndicated from Deepak Singh original https://aws.amazon.com/blogs/big-data/automate-legacy-etl-conversion-to-aws-glue-using-cognizant-data-and-intelligence-toolkit-cdit-etl-conversion-tool/
This blog post is co-written with Govind Mohan and Kausik Dhar from Cognizant.
Migrating on-premises data warehouses to the cloud is no longer viewed as an option but a necessity for companies to save cost and take advantage of what the latest technology has to offer. Although we have seen a lot of focus toward migrating data from legacy data warehouses to the cloud and multiple tools to support this initiative, data is only part of the journey. Successful migration of legacy extract, transform, and load (ETL) processes that acquire, enrich, and transform the data plays a key role in the success of any end-to-end data warehouse migration to the cloud.
The traditional approach of manually rewriting a large number of ETL processes to cloud-native technologies like AWS Glue is time consuming and can be prone to human error. Cognizant Data & Intelligence Toolkit (CDIT) – ETL Conversion Tool automates this process, bringing in more predictability and accuracy, eliminating the risk associated with manual conversion, and providing faster time to market for customers.
Cognizant is an AWS Premier Tier Services Partner with several AWS Competencies. With its industry-based, consultative approach, Cognizant helps clients envision, build, and run more innovative and efficient businesses.
In this post, we describe how Cognizant’s Data & Intelligence Toolkit (CDIT)- ETL Conversion Tool can help you automatically convert legacy ETL code to AWS Glue quickly and effectively. We also describe the main steps involved, the supported features, and their benefits.
Solution overview
Cognizant Data & Intelligence Toolkit (CDIT): ETL Conversion Tool automates conversion of ETL pipelines and orchestration code from legacy tools to AWS Glue and AWS Step Functions and eliminates the manual processes involved in a customer’s ETL cloud migration journey.
It comes with an intuitive user interface (UI). You can use these accelerators by selecting the source and target ETL tool for conversion and then uploading an XML file of the ETL mapping to be converted as input.
The tool also supports continuous monitoring of the overall progress, and alerting mechanisms are in place in the event of any failures, errors, or operational issues.
Cognizant Data & Intelligence Toolkit (CDIT): ETL Conversion Tool internally uses many native AWS services, such as Amazon Simple Storage Service (Amazon S3) and Amazon Relational Database Service (Amazon RDS) for storage and metadata management; Amazon Elastic Compute Cloud (Amazon EC2) and AWS Lambda for processing; Amazon CloudWatch, AWS Key Management Service (AWS KMS), and AWS IAM Identity Center (successor to AWS Single Sign-On) for monitoring and security; and AWS CloudFormation for infrastructure management. The following diagram illustrates this architecture.

How to use CDIT: ETL Conversion Tool for ETL migration.
Cognizant Data & Intelligence Toolkit (CDIT): ETL Conversion Tool supports the following legacy ETL tools as source and supports generating corresponding AWS Glue ETL scripts in both Python and Scala:
- Informatica
- DataStage
- SSIS
- Talend
Let’s look at the migration steps in more detail.
Assess the legacy ETL process
Cognizant Data & Intelligence Toolkit (CDIT): ETL Conversion Tool enables you to assess in bulk the potential automation percentage and complexity of a set of ETL jobs and workflows that are in scope for migration to AWS Glue. The assessment option helps you understand what kind of saving can be achieved using Cognizant Data & Intelligence Toolkit (CDIT): ETL Conversion Tool, the complexity of the ETL mappings, and the extent of manual conversion needed, if any. You can upload a single ETL mapping or a folder containing multiple ETL mappings as input for assessment and generate an assessment report, as shown in the following figure.

Convert the ETL code to AWS Glue
To convert legacy ETL code, you upload the XML file of the ETL mapping as input to the tool. User inputs are stored in the internal metadata repository of the tool and Cognizant Data & Intelligence Toolkit (CDIT): ETL Conversion Tool parses these XML input files and breaks them down to a patented canonical model, which is then forward engineered into the target AWS Glue scripts in Python or Scala. The following screenshot shows an example of the Cognizant Data & Intelligence Toolkit (CDIT): ETL Conversion Tool GUI and Output Console pane.

If any part of the input ETL job couldn’t be converted completely to the equivalent AWS Glue script, it’s tagged between comment lines in the output so that it can be manually fixed.

Convert the workflow to Step Functions
The next logical step after converting the legacy ETL jobs is to orchestrate the run of these jobs in the logical order. Cognizant Data & Intelligence Toolkit (CDIT): ETL Conversion Tool lets you automate the conversion of on-premises ETL workflows by converting them to corresponding Step Functions workflows. The following figure illustrates a sample input Informatica workflow.

Workflow conversion follows the similar pattern as that of the ETL mapping. XML files for ETL workflows are uploaded as input and Cognizant Data & Intelligence Toolkit (CDIT): ETL Conversion Tool it generates the equivalent Step Functions JSON file based on the input XML file data.

Benefits of using Cognizant Data & Intelligence Toolkit (CDIT): ETL Conversion Tool
The following are the key benefits of using Cognizant Data & Intelligence Toolkit (CDIT): ETL Conversion Tool to automate legacy ETL conversion:
- Cost reduction – You can reduce the overall migration effort by as much as 80% by automating the conversion of ETL and workflows to AWS Glue and Step Functions
- Better planning and implementation – You can assess the ETL scope and determine automation percentage, complexity, and unsupported patterns before the start of the project, resulting in accurate estimation and timelines
- Completeness – Cognizant Data & Intelligence Toolkit (CDIT): ETL Conversion Tool offers one solution with support for multiple legacy ETL tools like Informatica, DataStage, Talend, and more.
- Improved customer experience – You can achieve migration goals seamlessly without errors caused by manual conversion and with high automation percentage
Case study: Cognizant Data & Intelligence Toolkit (CDIT): ETL Conversion Tool proposed implementation
A large US-based insurance and annuities company wanted to migrate their legacy ETL process in Informatica to AWS Glue as part of their cloud migration strategy.
As part of this engagement, Cognizant helped the customer successfully migrate their Informatica based data acquisition and integration ETL jobs and workflows to AWS. A proof of concept (PoC) using Cognizant Data & Intelligence Toolkit (CDIT): ETL Conversion Tool was completed first to showcase and validate automation capabilities.
Cognizant Data & Intelligence Toolkit (CDIT): ETL Conversion Tool was used to automate the conversion of over 300 Informatica mappings and workflows to equivalent AWS Glue jobs and Step Functions workflows, respectively. As a result, the customer was able to migrate all legacy ETL code to AWS as planned and retire the legacy application.
The following are key highlights from this engagement:
- Migration of over 300 legacy Informatica ETL jobs to AWS Glue
- Automated conversion of over 6,000 transformations from legacy ETL to AWS Glue
- 85% automation achieved using CDIT: ETL Conversion Tool
- The customer saved licensing fees and retired their legacy application as planned
Conclusion
In this post, we discussed how migrating legacy ETL processes to the cloud is critical to the success of a cloud migration journey. Cognizant Data & Intelligence Toolkit (CDIT): ETL Conversion Tool enables you to perform an assessment of the existing ETL process to derive complexity and automation percentage for better estimation and planning. We also discussed the ETL technologies supported by Cognizant Data & Intelligence Toolkit (CDIT): ETL Conversion Tool and how ETL jobs can be converted to corresponding AWS Glue scripts. Lastly, we demonstrated how to use existing ETL workflows to automatically generate corresponding Step Functions orchestration jobs.
To learn more, please reach out to Cognizant.

About the Authors
 Deepak Singh is a Senior Solutions Architect at Amazon Web Services with 20+ years of experience in Data & AIA. He enjoys working with AWS partners and customers on building scalable analytical solutions for their business outcomes. When not at work, he loves spending time with family or exploring new technologies in analytics and AI space.
 Piyush Patra is a Partner Solutions Architect at Amazon Web Services where he supports partners with their Analytics journeys and is the global lead for strategic Data Estate Modernization and Migration partner programs.
 Govind Mohan is an Associate Director with Cognizant with over 18 year of experience in data and analytics space, he has helped design and implement multiple large-scale data migration, application lift & shift and legacy modernization projects and works closely with customers in accelerating the cloud modernization journey leveraging Cognizant Data and Intelligence Toolkit (CDIT) platform.
 Kausik Dhar is a technology leader having more than 23 years of IT experience – primarily focused on Data & Analytics, Data Modernization, Application Development, Delivery Management, and Solution Architecture. He has played a pivotal role in guiding clients through the designing and executing large-scale data and process migrations, in addition to spearheading successful cloud implementations. Kausik possesses expertise in formulating migration strategies for complex programs and adeptly constructing data lake/Lakehouse architecture employing a wide array of tools and technologies.
Query big data with resilience using Trino in Amazon EMR with Amazon EC2 Spot Instances for less cost
Post Syndicated from Ashwini Kumar original https://aws.amazon.com/blogs/big-data/query-big-data-with-resilience-using-trino-in-amazon-emr-with-amazon-ec2-spot-instances-for-less-cost/
Amazon Elastic Compute Cloud (Amazon EC2) Spot Instances offer spare compute capacity available in the AWS Cloud at steep discounts compared to On-Demand prices. Amazon EMR provides a managed Hadoop framework that makes it straightforward, fast, and cost-effective to process vast amounts of data using EC2 instances. Amazon EMR with Spot Instances allows you to reduce costs for running your big data workloads on AWS. Amazon EC2 can interrupt Spot Instances with a 2-minute notification whenever Amazon EC2 needs to reclaim capacity for On-Demand customers. Spot Instances are best suited for running stateless and fault-tolerant big data applications such as Apache Spark with Amazon EMR, which are resilient against Spot node interruptions.
Trino (formerly PrestoSQL) is an open-source, highly parallel, distributed SQL query engine to run interactive queries as well as batch processing on petabytes of data. It can perform in-place, federated queries on data stored in a multitude of data sources, including relational databases (MySQL, PostgreSQL, and others), distributed data stores (Cassandra, MongoDB, Elasticsearch, and others), and Amazon Simple Storage Service (Amazon S3), without the need for complex and expensive processes of copying the data to a single location.
Before Project Tardigrade, Trino queries failed whenever any of the nodes in Trino clusters failed, and there was no automatic retry mechanism with iterative querying capability. Also, failed queries had to be restarted from scratch. Due to this limitation, the cost of failures of long-running extract, transform, and load (ETL) and batch queries on Trino was high in terms of completion time, compute wastage, and spend. Spot Instances were not appropriate for long-running queries with Trino clusters and only suited for short-lived Trino queries.
In October 2022, Amazon EMR announced a new capability in the Trino engine to detect 2-minute Spot interruption notifications and determine if the existing queries can complete within 2 minutes on those nodes. If the queries can’t finish, Trino will fail them quickly and retry the queries on different nodes. Also, Trino doesn’t schedule new queries on these Spot nodes, which are about to be reclaimed. In November 2022, Amazon EMR added support for Project Tardigrade’s fault-tolerant option in the Trino engine with Amazon EMR 6.8 and above. Enabling this feature mitigates Trino task failures caused by worker node failures due to Spot interruptions or On-Demand node stops. Trino now retries failed tasks using intermediate exchange data checkpointed on Amazon S3 or HDFS.
These new enhancements in Trino with Amazon EMR provide improved resiliency for running ETL and batch workloads on Spot Instances with reduced costs. This post showcases the resilience of Amazon EMR with Trino using fault-tolerant configuration to run long-running queries on Spot Instances to save costs. We simulate Spot interruptions on Trino worker nodes by using AWS Fault Injection Simulator (AWS FIS).
Trino architecture overview
Trino runs a query by breaking up the run into a hierarchy of stages, which are implemented as a series of tasks distributed over a network of Trino workers. This pipelined execution model runs multiple stages in parallel and streams data from one stage to another as the data becomes available. This parallel architecture reduces end-to-end latency and makes Trino a fast tool for ad hoc data exploration and ETL jobs over very large datasets. The following diagram illustrates this architecture.

In a Trino cluster, the coordinator is the server responsible for parsing statements, planning queries, and managing workers. The coordinator is also the node to which a client connects and submits statements to run. Every Trino cluster must have at least one coordinator. The coordinator creates a logical model of a query involving a series of stages, which is then translated into a series of connected tasks running on Trino workers. In Amazon EMR, the Trino coordinator runs on the EMR primary node and workers run on core and task nodes.
Faster insights with lower costs with EC2 Spot
You can save significant costs for your ETL and batch workloads running on EMR Trino clusters with a blend of Spot and On-Demand Instances. You can also reduce time-to-insight with faster query runs with lower costs by running more worker nodes on Spot Instances, using the parallel architecture of Trino.
For example, a long-running query on EMR Trino that takes an hour can be finished faster by provisioning more worker nodes on Spot Instances, as shown in the following figure.

Fault-tolerant Trino configuration in Amazon EMR
Fault-tolerant execution in Trino is disabled by default; you can enable it by setting a retry policy in the Amazon EMR configuration. Trino supports two types of retry policies:
- QUERY – The QUERY retry policy instructs Trino to retry the whole query automatically when an error occurs on a worker node. This policy is only suitable for short-running queries because the whole query is retried from scratch.
- TASK – The TASK retry policy instructs Trino to retry individual query tasks in the event of failure. This policy is recommended for long-running ETL and batch queries.
With fault-tolerant execution enabled, intermediate exchange data is spooled on an exchange manager so that another worker node can reuse it in the event of a node failure to complete the query run. The exchange manager uses a storage location on Amazon S3 or Hadoop Distributed File System (HDFS) to store and manage spooled data, which is spilled beyond in-memory buffer size of worker nodes. By default, Amazon EMR release 6.9.0 and later uses HDFS as an exchange manager.
Solution overview
In this post, we create an EMR cluster with following architecture.

We provision the following resources using Amazon EMR and AWS FIS:
- An EMR 6.9.0 cluster with the following configuration:
- Apache Hadoop, Hue, and Trino applications
- EMR instance fleets with the following:
- One primary node (On-Demand) as the Trino coordinator
- Two core nodes (On-Demand) as the Trino workers and exchange manager
- Four task nodes (Spot Instances) as Trino workers
- Trino’s fault-tolerant configuration with following:
- TPCDS connector
- The TASK retry policy
- Exchange manager directory on HDFS
- Optional recommended settings for query performance optimization
- An FIS experiment template to target Spot worker nodes in the Trino cluster with interruptions to demonstrate fault-tolerance of EMR Trino with Spot Instances
We use the new Amazon EMR console to create an EMR 6.9.0 cluster. For more information about the new console, refer to Summary of differences.
Create an EMR 6.9.0 cluster
Complete the following steps to create your EMR cluster:
- On the Amazon EMR console, create an EMR 6.9.0 cluster named emr-trino-cluster with Hadoop, Hue, and Trino applications using the Custom application bundle.
We need Hue’s web-based interface for submitting SQL queries to the Trino engine and HDFS on core nodes to store intermediate exchange data for Trino’s fault-tolerant runs.

Using multiple Spot capacity pools (each instance type in each Availability Zone is a separate pool) is a best practice to increase your chances of getting large-scale Spot capacity and minimize the impact of a specific instance type being reclaimed in EMR clusters. The Amazon EMR console allows you to configure up to 5 instance types for your core fleet and 15 instance types for your task fleet with the Spot allocation strategy, which allows up to 30 instance types for each fleet from the AWS Command Line Interface (AWS CLI) or Amazon EMR API.
- Configure the primary, core, and task fleets with primary and core nodes with On-Demand Instances (m5.xlarge) and task nodes with Spot Instances using multiple instance types.

When you use the Amazon EMR console, the number of vCPUs of the EC2 instance type are used as the count towards the total target capacity of a core or task fleet by default. For example, an m5.xlarge instance type with 4 vCPUs is considered as 4 units of capacity by default.
- On the Actions menu under Core or Task fleet, choose Edit weighted capacity.

- Because each instance type with 4 vCPUs (xlarge size) is 4 units of capacity, let’s set the cluster size with 8 core units (2 nodes) with On-Demand and 16 task units (4 nodes) with Spot.
Unlike core and task fleets, the primary fleet is always one instance, so no sizing configuration is needed or available for the primary node on the Amazon EMR console.

- Select Price-capacity optimized as your Spot allocation strategy, which launches the lowest-priced Spot Instances from your most available pools.

- Configure Trino’s fault-tolerant settings in the Software settings section:
Alternatively, you can create a JSON config file with the configuration, store it in an S3 bucket, and select the file path from its S3 location by selecting Load JSON from Amazon S3.

Let’s understand some optional settings for query performance optimization that we have configured:
- “exchange.compression-enabled”:”true” – This is recommended to enable compression to reduce the amount of data spooled on exchange manager.
- “query.low-memory-killer.delay”: “0s” – This will reduce the low memory killer delay to allow the Trino engine to unblock nodes running short on memory faster.
- “query.remote-task.max-error-duration”: “1m” – By default, Trino waits for up to 5 minutes for the task to recover before considering it lost and rescheduling it. This timeout can be reduced for faster retrying of the failed tasks.
For more details of Trino’s fault-tolerant configuration parameters, refer to Fault-tolerant execution.
- Let’s also add a tag key called
Namewith the valueMyTrinoClusterto launch EC2 instances with this tag name.
We’ll use this tag to target Spot Instances in the cluster with AWS FIS.

The EMR cluster will take few minutes to be ready in the Waiting state.
Configure an FIS experiment template to target Spot Instances with interruptions in the EMR Trino cluster
We now use the AWS FIS console to simulate interruptions of Spot Instances in the EMR Trino cluster and showcase the fault-tolerance of the Trino engine. Complete the following steps:
- On the AWS FIS console, create an experiment template.

- Under Actions, choose Add action.
- Create an AWS FIS action with Action type as aws:ec2:send-spot-instance-interruptions and Duration Before Interruption as 2 minutes.
- Choose Save.
This means FIS will interrupt targeted Spot Instances after 2 minutes of running the experiment.

- Under Targets, choose Edit to target all Spot Instances running in the EMR cluster.
- For Resource tags, use
Name= MyTrinoCluster. - For Resource filters, use as
State.Name=running. - For Selection mode, set to ALL.
- Choose Save.

- Create a new AWS Identity and Access Management (IAM) role automatically to provide permissions to AWS FIS.

- Choose Create experiment template.
Launch Hue and Trino web interfaces
When your EMR cluster is in the Waiting state, connect to the Hue web interface for Trino queries and the Trino web interface for monitoring. Alternatively, you can submit your Trino queries using trino-cli after connecting via SSH to your EMR cluster’s primary node. In this post, we will use the Hue web interface for running queries on the EMR Trino engine.
- To connect to Hue interface on the primary node from your local computer, navigate to the EMR cluster’s Properties, Network and security, and EC2 security groups (firewall) section.
- Edit the primary node security group’s inbound rule to add your IP address and port (port 22).
- Retrieve your EMR cluster’s primary node public DNS from your EMR cluster’s Summary tab.
Refer to View web interfaces hosted on Amazon EMR clusters for details on connecting to web interfaces in the primary node from your local computer. You can set up an SSH tunnel with dynamic port forwarding between your local computer and the EMR primary node. Then you can configure proxy settings for your internet browser by using an add-ons such as FoxyProxy for Firefox or SwitchyOmega for Chrome to manage your SOCKS proxy settings.
- Connect to Hue by copying the URL (
http://<youremrcluster-primary-node-public-dns>:8888/) in your web browser. - Create an account with your choice of user name and password.

After you log in to your account, you can see the query editor on Hue’s web interface.

By default, Amazon EMR configures the Trino web interface on the Trino coordinator (EMR primary node) to use port 8889.
- To connect to the Trino web interface, copy the URL (
http://<youremrcluster-primary-node-public-dns>:8889/) in your web browser, where you can monitor the Trino cluster and query performance.
In the following screenshot, we can see six active Trino workers (two core and four task nodes of EMR cluster) and no running queries.

- Let’s run the Trino query
We can see all cluster nodes are in the active state.

Test fault tolerance on Spot interruptions
To test the fault tolerance on Spot interruptions, complete the following steps:
- Run the following Trino query using Hue’s query editor:
When you go to the Trino web interface, you can see the query running on six active worker nodes (two core On-Demand and four task nodes on Spot Instances).

- On the AWS FIS console, choose Experiment templates in the navigation pane.
- Select the experiment template
EMR_Trino_Interrupterand choose Start experiment.

After a few seconds, the experiment will be in the Completed state and it will trigger stopping all four Spot Instances (four Trino workers) after 2 minutes.

After some time, we can observe in the Trino web UI that we have lost four Trino workers (task nodes running on Spot Instances) but the query is still running with the two remaining On-Demand worker nodes (core nodes). Without the fault-tolerant configuration in EMR Trino, the whole query would fail with even a single worker node failure.

- Run the
select * from system.runtime.nodesquery again in Hue to check the Trino cluster nodes status.
We can see four Spot worker nodes with the status shutting_down.

Trino starts shutting down the four Spot worker nodes as soon as they receive the 2-minute Spot interruption notification sent by the AWS FIS experiment. It will start retrying any failed tasks of these four Spot workers on the remaining active workers (two core nodes) of the cluster. The Trino engine will also not schedule tasks of any new queries on Spot worker nodes in the shutting_down state.
The Trino query will keep running on the remaining two worker nodes and succeed despite the interruption of the four Spot worker nodes. Soon after the Spot nodes stop, Amazon EMR will replenish the stopped capacity (four task nodes) by launching four replacement Spot nodes.
Achieve faster query performance for lower cost with more Trino workers on Spot
Now let’s increase Trino workers capacity from 6 to 10 nodes by manually resizing EMR task nodes on Spot Instances (from 4 to 8 nodes).
We run the same query on a larger cluster with 10 Trino workers. Let’s compare the query completion time (wall time in the Trino Web UI) with the earlier smaller cluster with six workers. We can see 32% faster query performance (1.57 minutes vs. 2.33 minutes).


You can run more Trino workers on Spot Instances to run queries faster to meet your SLAs or process a larger number of queries. With Spot Instances available at discounts up to 90% off On-Demand prices, your cluster costs will not increase significantly vs. running the whole compute capacity on On-Demand Instances.
Clean up
To avoid ongoing charges for resources, navigate to the Amazon EMR console and delete the cluster emr-trino-cluster.
Conclusion
In this post, we showed how you can configure and launch EMR clusters with the Trino engine using its fault-tolerant configuration. With the fault tolerant feature, Trino worker nodes can be run as EMR task nodes on Spot Instances with resilience. You can configure a well-diversified task fleet with multiple instance types using the price-capacity optimized allocation strategy. This will make Amazon EMR request and launch task nodes from the most available, lower-priced Spot capacity pools to minimize costs, interruptions, and capacity challenges. We also demonstrated the resilience of EMR Trino against Spot interruptions using an AWS FIS Spot interruption experiment. EMR Trino continues to run queries by retrying failed tasks on remaining available worker nodes in the event of any Spot node interruption. With fault-tolerant EMR Trino and Spot Instances, you can run big data queries with resilience, while saving costs. For your SLA-driven workloads, you can also add more compute on Spot to adhere to or exceed your SLAs for faster query performance with lower costs compared to On-Demand Instances.
About the Authors
 Ashwini Kumar is a Senior Specialist Solutions Architect at AWS based in Delhi, India. Ashwini has more than 18 years of industry experience in systems integration, architecture, and software design, with more recent experience in cloud architecture, DevOps, containers, and big data engineering. He helps customers optimize their cloud spend, minimize compute waste, and improve performance at scale on AWS. He focuses on architectural best practices for various workloads with services including EC2 Spot, AWS Graviton, EC2 Auto Scaling, Amazon EKS, Amazon ECS, and AWS Fargate.
 Dipayan Sarkar is a Specialist Solutions Architect for Analytics at AWS, where he helps customers modernize their data platform using AWS Analytics services. He works with customers to design and build analytics solutions, enabling businesses to make data-driven decisions.
Validate IAM policies with Access Analyzer using AWS Config rules
Post Syndicated from Anurag Jain original https://aws.amazon.com/blogs/security/validate-iam-policies-with-access-analyzer-using-aws-config-rules/
You can use AWS Identity and Access Management (IAM) Access Analyzer policy validation to validate IAM policies against IAM policy grammar and best practices. The findings generated by Access Analyzer policy validation include errors, security warnings, general warnings, and suggestions for your policy. These findings provide actionable recommendations that help you author policies that are functional and conform to security best practices.
You can use the IAM Policy Validator for AWS CloudFormation and the IAM Policy Validator for Terraform solutions to integrate Access Analyzer policy validation in a proactive manner within your continuous integration and continuous delivery CI/CD pipeline before deploying IAM policies to your Amazon Web Service (AWS) environment. Customers requested a similar capability to validate policies already deployed within their environments as part of the defense-in-depth strategy.
In this post, you learn how to set up and continuously validate and report on compliance of the IAM policies in your environment using AWS Config. AWS Config evaluates the configuration settings of your AWS resources with the help of AWS Config rules, which represent your ideal configuration settings. AWS Config continuously tracks the configuration changes that occur among your resources and checks whether these changes conform to the conditions in your rules. If a resource doesn’t conform to a rule, AWS Config flags the resource and the rule as noncompliant.
You can use this solution to validate identity-based and resource-based IAM policies attached to resources in your AWS environment that might have grammatical or syntactical errors or might not follow AWS best practices. The code used in this post is hosted in a GitHub repository.
Prerequisites
Before you get started, you need:
- An AWS account
- Basic knowledge of AWS Config, AWS CloudFormation and Amazon Simple Storage Service
- AWS Command Line Interface (AWS CLI) installed
- An Amazon S3 bucket
Step 1: Enable AWS Config to monitor global resources
To get started, enable AWS Config in your AWS account by following the instructions in the AWS Config Developer Guide.
Next, enable the recording of global resources:
- Open the AWS Management Console and go to the AWS Config console.
- Go to Settings and choose Edit to see the AWS Config recorder settings.
- Under General settings, select the Include globally recorded resource types to enable AWS Config to monitor IAM configuration items.
- Leave the other settings at their defaults.
- Choose Save.

Figure 1: AWS Config settings page showing inclusion of globally recorded resource types
- After choosing Save, you should see Recording is on at the top of the window.
Figure 2: AWS Config settings page showing recorder settings
Note: You only need to enable globally recorded resource types in the AWS Region where you’ve configured AWS Config because they aren’t tied to a specific Region and can be used in other Regions. The globally recorded resource types that AWS Config supports are IAM users, groups, roles, and customer managed policies.


Step 2: Deploy the CloudFormation template
In this section, you deploy and test a sample AWS CloudFormation template that creates the following:
- An AWS Config rule that reports the compliance of IAM policies.
- An AWS Lambda function that implements and then makes the requests to IAM Access Analyzer and returns the policy validation findings.
- An IAM role that’s used by the Lambda function with permissions to validate IAM policies using the Access Analyzer ValidatePolicy API.
- An optional Amazon CloudWatch alarm and Amazon Simple Notification Service (Amazon SNS) topic to provide notification of Lambda function errors.
Follow the steps below to deploy the AWS CloudFormation template:
- To deploy the CloudFormation template using the following command, you must have the AWS Command Line Interface (AWS CLI) installed.
- Make sure you have configured your AWS CLI credentials.
- Clone the solution repository.
- Navigate to the iam-access-analyzer-config-rule folder of the cloned repository.
- Deploy the CloudFormation template using the AWS CLI.
Note: Change the Region for the parameter — RegionToValidateGlobalResources — to the Region you enabled for global resources in Step 1. Optionally, you can add an email address if you want to receive notifications if the AWS Config rule stops working. Use the code that follows, replacing <us-east-1> with the Region you enabled and <EMAIL_ADDRESS> with your chosen address.
- After successful deployment, you will see the message Successfully created/updated stack – iam-policy-validation-config-rule.

Figure 3: Successful CloudFormation stack creation reported on the terminal
Note: If the CloudFormation stack creation fails, go to the CloudFormation console and select the iam-policy-validation-config-rule stack. Choose Events to review the failure reason.
- After deployment, open the CloudFormation console and select the iam-policy-validation-config-rule stack.
- Choose Resources to see the resources created by the template.

Step 3: Check noncompliant resources discovered by AWS Config
The AWS Config rule is designed to mark resources that have IAM policies as noncompliant if the resources have validation findings found using the IAM Access Analyzer ValidatePolicy API.
- Open the AWS Config console
- Choose Rules from the navigation pane on the left and select policy-validation-config-rule.
Figure 4: AWS Config rules page showing the rule details
- Scroll down on the page and filter Resources in Scope to see the noncompliant resources.
Figure 5: AWS Config rules page showing noncompliant resources
Note: If the AWS Config rule isn’t invoked yet, you can choose Actions and select Re-evaluate to invoke it.
Figure 6: AWS Config rules page showing evaluation invocation


Step 4: Modify the AWS Config rule for exceptions
You might want to exempt certain resources from specific policy validation checks. For example, you might need to deploy a more privileged role—such as an administrator role—to your environment and you don’t want that role’s policies to have policy validation findings.
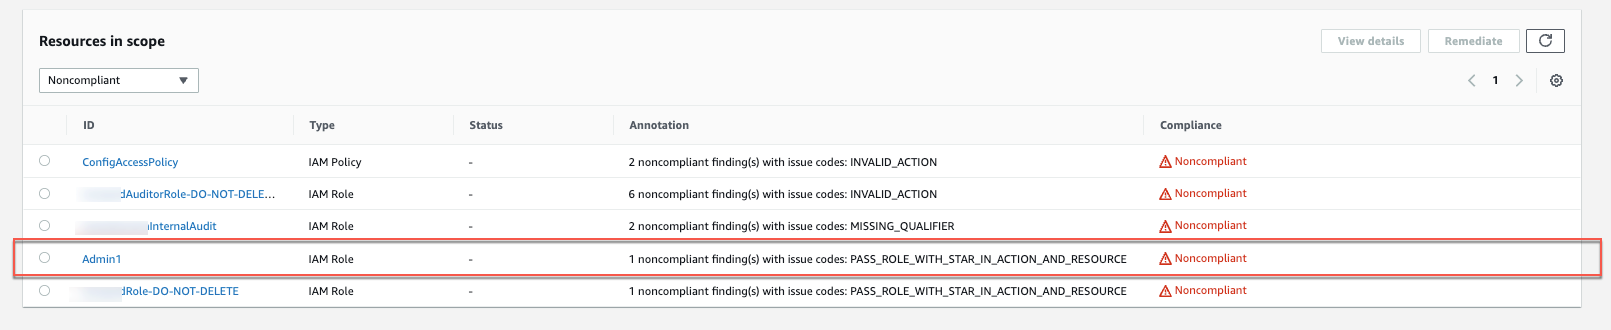
Figure 7: AWS Config rules page showing a noncompliant administrator role
This section shows you how to configure an exceptions file to exempt specific resources.
- Start by configuring an exceptions file similar to the one that follows to log general warning findings across the accounts in your organization to make sure your policies conform to best practices by setting ignoreWarningFindings to False.
- Additionally, you might want to create an exception that allows administrator roles to use the iam:PassRole action on another role. This combination of action and resource is usually reserved for privileged users. The example file below shows an exception for all the roles created with Administrator in the role path from account 12345678912.
Example exceptions file:
{ "global":{ "ignoreWarningFindings":false }, "12345678912":{ "ignoreFindingsWith":[ { "issueCode":"PASS_ROLE_WITH_STAR_IN_ACTION_AND_RESOURCE", "resourceType":"AWS::IAM::Role", "resourceName":"Administrator/*" } ] } } - After the exceptions file is ready, upload the JSON file to the S3 bucket you created as a part of the prerequisites.
You can manage this exceptions file by hosting it in a central Git repository. When teams need to exempt a particular resource from these policy validation checks, they can submit a pull request to the central repository. An approver can then approve or reject this request and, if approved, deploy the updated exceptions file.
- Modify the bucket policy so that the bucket is accessible to your AWS Config rule if the rule is operating in a different account than the bucket was created in. Below is an example of a bucket policy that allows the accounts in your organization to read the exceptions file.
Note: For more examples visit example policy validation exceptions file contents.
- Deploy the CloudFormation template again using the ExceptionsS3BucketName and ExceptionsS3FilePrefix parameters. The file prefix should be the full prefix of the S3 object exceptions file.
- After you see the Successfully created/updated stack – iam-policy-validation-config-rule message on the terminal or command line and the AWS Config rule has been re-evaluated, the resources mentioned in the exception file should show as Compliant.
Figure 8: Resource exception result

You can find additional customization options in the exceptions file schema.
Cleanup
To avoid recurring charges and to remove the resources used in testing the solution outlined in this post, use the CloudFormation console to delete the iam-policy-validation-config-rule CloudFormation stack.
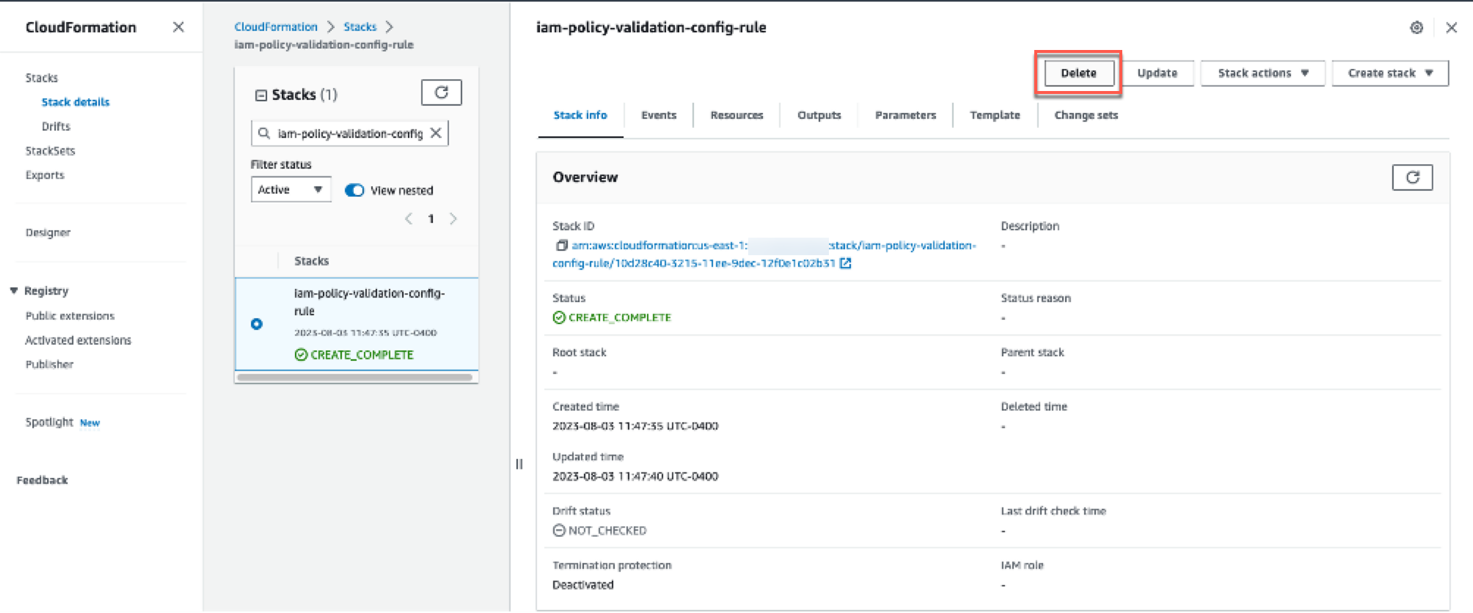
Figure 9: AWS CloudFormation stack deletion
Conclusion
In this post, we demonstrated how you can set up a centralized compliance and monitoring workflow using AWS IAM Access Analyzer policy validation with AWS Config rules to validate identity-based and resource-based policies attached to resources in your account. Using this solution, you can create a single pane of glass to monitor resources and govern centralized compliance for AWS Config-supported resources across accounts. You can also build and maintain exceptions customized to your environment as shown in the example policy validation exceptions file. You can visit the Access Analyzer policy checks reference page for a complete list of policy check validation errors and resolutions.
If you have feedback about this post, submit comments in the Comments section below. If you have questions about this post, contact AWS Support.
Want more AWS Security news? Follow us on Twitter.
How to communicate like a GitHub engineer: our principles, practices, and tools
Post Syndicated from Ben Balter original https://github.blog/engineering/engineering-principles/how-to-communicate-like-a-github-engineer-our-principles-practices-and-tools/
As a company that’s been remote-first since day one, GitHub Engineering has learned a lot about how to communicate effectively across time zones, teams, and tools. We’ve distilled our experience into a set of guidelines that we call “How we communicate,” and we’re sharing them with you today. We hope that by sharing our communication practices publicly, we can help other organizations that are embracing remote work or want to improve their collaboration culture.
Read on to learn more about how we use GitHub to build GitHub, how we turned our guiding communications principles into prescriptive practices to manage our internal communications signal-to-noise ratio, and how you can contribute to the ongoing conversation.
Using GitHub to build GitHub
Unlike many companies that made the transition to remote work during the pandemic, GitHub has been majority remote since its founding 15 years ago. GitHub’s remote-first communication style originally drew inspiration from the open source community. Open source development rarely requires the global community of collaborators and contributors to be in a certain place, at a certain time, in order to participate in the ongoing conversation. This is the same approach GitHub Engineering takes to our own internal communication. We believe that asynchronous communication is the best way to work globally and at scale, and as a result, we’ve built our culture around it.
We’ve always used GitHub to build GitHub. GitHub is not only the place where we host and review code, but also where we plan, discuss, and document our work. We use issues, pull requests, projects, and discussions to track work, collaborate on features, and share information across teams. Many of these communications patterns grew organically, as developers adopted practices from the open source community for our own internal collaboration needs. We believe open practices are the best way to work with a global and diverse team, and to make decisions that are informed, inclusive, and scalable.
While asynchronous collaboration is deeply embedded in GitHub’s DNA, we have also long had a culture of each team enjoying a great deal of autonomy in deciding how they communicate day to day. This freedom has allowed teams to experiment and uncover novel practices, but it has also meant that working across teams previously required first negotiating a meta-conversation around how to communicate before any substantive work could occur–much like a new open source project negotiating with its newfound community. Having an open set of shared expectations within the engineering organization allows us to be more effective, mindful, and inclusive about how and where we communicate, leading us to make more well-informed decisions in a way that takes into account different needs, preferences, and time zones.
“How we communicate”
To define this set of shared expectations, the GitHub Engineering Operations and Culture team collaborated with more than 100 people across the engineering organization in the first half of 2023 to create guidance on “How we communicate.” This document was intended to encourage consistency over preference by outlining a common core of shared internal communication practices for all of GitHub Engineering in the form of opinionated guidance. Teams are still encouraged to adapt the practices for their unique circumstances, while maintaining a common “API” to interface with other teams.
Today, we are publishing our “How we communicate” guidance under a CC-BY-4.0 license, in the hopes that you’ll find it useful, especially if you’re evolving your own remote-first or remote-friendly culture; we welcome you to fork, modify, and use the documentation with attribution. We expect our guidance (lightly edited for the community, primarily to remove internal URLs and references) will evolve over time along with our organization, and, of course, pull requests are always welcome.
From guiding principles to prescriptive practices
To begin with our “How we communicate” guidance, we established eight guiding principles:
- Be asynchronous first.
- Write things down.
- Make work visible and overcommunicate.
- Prefer GitHub tools and workflows.
- Embrace collaboration.
- Foster a culture that values documentation maintenance.
- Communicate openly, honestly, and authentically.
- Remember, practicality beats purity.
From there, we began to define the specific practices that would help us live up to these principles. We started with the most common forms of communication, such as chat, discussions, issues, project boards, and pull requests, and went on to collaboratively author suggestions on how to manage notifications, run effective meetings, and schedule more inclusively.
Managing the signal-to-noise ratio
With well over 1,500 engineers across a number of functions, we faced a challenge not unique to any organization: how to keep everyone informed and engaged without overwhelming them with notifications. We wanted to create a system that allowed everyone to opt-in, rather than opt-out, and to get the information they needed in a digestible and skimmable way. As it was, either you got everything (which we jokingly referred to as the “fire hose” of notifications), or you opted out entirely (and ignored everything). Either way, Hubbers were likely to miss important information. We set out to create a system that minimized notification fatigue, while allowing people to subscribe to the topics they cared about.
We rely on GitHub Discussions heavily to share information within and across teams. It’s a natural choice, since engineers are already working on GitHub.com, and with things like comments, upvotes, and emoji reactions, discussions are a great way to start an asynchronous conversation on just about any topic.
Opt-in
To start, we encouraged teams to begin posting their discussions to the most logical repository, instead of directly to the main github/engineering repository. (For example, if a post was about GitHub Copilot, it should go in the github/copilot repository; if it was about GitHub Actions, it should go in the github/actions repository.) That way, those interested could subscribe to the repositories they cared about, and get email or web notifications when new discussions were posted. And the volume of notifications coming through github/engineering to the whole organization would be reduced.
Amplify widely
But some posts are rightfully intended for all of GitHub Engineering. Things like staff ships (early access to new features for staff), required actions, promotions, and updates to Engineering priorities are written with a broad audience in mind. To ensure we were still surfacing the most important information to the organization, we established a small set of “magic labels” that if applied to a post, would add it to a daily content roundup, automatically amplify the message in various places for all of GitHub Engineering to see.
For a peek at our taxonomy, here’s an excerpt from our GitHub Actions workflow that makes it easy for everyone to add the set of “magic labels” to their repositories:
label:
          - name: eng-action-required
            description: Upcoming process/workflow changes/activities requiring Engineering Hubbers to take action
          - name: eng-availability
            description: Discussions about availability, incident response, et al
          - name: eng-celebrations
            description: Celebrating Hubber promotions and other amazingness
          - name: eng-feedback-request
            description: Posts requesting feedback from the Engineering organization
          - name: eng-org-change
            description: Announcements related to organizational changes
          - name: eng-priorities
            description: Discussions related to Engineering priorities
          - name: eng-roundup
            description: Newsletters, weekly digests, and other content and team roundups
          - name: eng-show-and-tell
            description: Share what you've learned or show off something you've made
          - name: eng-staff-ship
            description: Announcements for features made available to Hubbers for feedback and early access
          - name: eng-strategy
            description: Discussions related to strategy and vision
Automate all the things!
We used GitHub Actions to schedule a workflow to automatically create daily and weekly roundups of activity across the organization based on those “magic labels,” posting the digests as discussion posts in the github/engineering repository.

Like any other discussion post, these content roundups trigger web and email notifications from GitHub.com, and they’re also amplified in Slack channels. However, rather than receiving multiple notifications a day, these roundups reduce the daily notification to one (and also make it much easier to catch up on everything that happens while you’re out of the office!). To support the needs of those who prefer receiving notifications for every discussion post individually, rather than waiting for a daily roundup (aka to instead “drink from the fire hose”), we created an #engineering-discussions-firehose Slack channel, which streams every labeled post as it is posted.
Experiment with AI
With notifications reduced in our main github/engineering repository and discussions being posted in more logical repositories, enabling people to subscribe to more frequent notifications for specific topics, the last remaining step was to increase quick skimmability to allow for greater situational awareness without anyone having to spend all day reading teams’ discussion posts.
As part of our writing style, most of us include TL;DRs at the top of posts (internet slang for “too long, didn’t read,” a short summary of longer writing), but not every post author includes one. For posts that don’t have a human-authored TL;DR, we use Azure’s OpenAI service to draft a brief summary for us. That way, readers can quickly skim the daily digest (or fire hose) and decide if they want to click through to read more.
Here’s an excerpt of the prompt we use to summarize discussion posts:
// OpenAI
export const encodingModel = "gpt-3.5-turbo";
export const openaiModel = "gpt-35-turbo";
export const openaiPrompt = `
  The following is an internal discussion post from the engineering department at GitHub formatted in GitHub flavored Markdown. Please write a short summary appropriate for inclusion in a digest of internal discussion posts with the following requirements:

  - The summary should be no more than 3 sentences
  - The summary should focus on the most important and impactful information from the post, including key points and any calls to action
  - The summary should be detailed, thorough, to-the-point, and written for a technical audience, while maintaining clarity and conciseness
  - The communications style should be professional, but informal
  - The summary should use emoji where appropriate, but use emoji sparingly
  - The summary should be formatted in GitHub Flavored Markdown with no line breaks
  - DO NOT use the phrases "the engineering department" or "at GitHub"; instead, whenever possible, name the specific team in reference, or else use "we" to refer to the team or engineering department. For example, use, "We recently shipped a feature", and NOT, "The engineering department at GitHub recently shipped a feature".
  - Employees at GitHub are referred to as "Hubbers"
  - GitHub is ALWAYS capitalized as "GitHub", never "Github"
  - Teams are referred to as "the Actions team" or "the Copilot team", never just "actions team" or "copilot team"
`;

export const estimatedPromptTokens = 300;
export const completionTokens = 300;
Ironically, we relied heavily on GitHub Copilot to build the GitHub Actions workflow (it’s been a while since these Hubbers have written “production-worthy” code), meaning robots helped humans to teach robots how to summarize the work of humans, which other robots then published out to other humans.  Summarization is a core workflow for AI, and so far, while it’s not always perfect, it’s been working well. If you’re interested in the prompt we’re using (or want to help us improve it!), you can find it here.
Let’s build from here
We’re excited to share our “How we communicate” guidance with you, and we hope that it will inspire you to adopt or improve some of the practices we’ve found useful. Here are some suggestions to get you started:
- Principles: Establish a set of guiding principles for your organization’s internal communications (fork and clone our guidelines for a head start!). What core values do you want to promote, and how can you ensure everyone is aligned around those values so there’s a common “API” across teams?
- Practices: Use those principles to develop practices. What specific practices can you adopt to help you live up to your principles, and how can you ensure those practices are adopted across the organization?
- Experimentations: Experiment with automation and emerging technologies to improve your practices. How can you use AI and other tools (like GitHub Actions) to automate your workflows and improve the signal-to-noise ratio?
We recognize communication is an ongoing and evolving process, and different teams and cultures may have different needs and preferences. We welcome your feedback, suggestions, and contributions to our public repository: https://github.com/github/how-engineering-communicates
Happy communicating! 
The post How to communicate like a GitHub engineer: our principles, practices, and tools appeared first on The GitHub Blog.
All Cloudflare Customers Protected from Atlassian Confluence CVE-2023-22515
Post Syndicated from Himanshu Anand original http://blog.cloudflare.com/all-cloudflare-customers-protected-atlassian-cve-2023-22515/


On 2023-10-04 at 13:00 UTC, Atlassian released details of the zero-day vulnerability described as “Privilege Escalation Vulnerability in Confluence Data Center and Server” (CVE-2023-22515), a zero-day vulnerability impacting Confluence Server and Data Center products.
Cloudflare was warned about the vulnerability before the advisory was published and worked with Atlassian to proactively apply protective WAF rules for all customers. All Cloudflare customers, including Free, received the protection enabled by default. On 2023-10-03 14:00 UTC Cloudflare WAF team released the following managed rules to protect against the first variant of the vulnerability observed in real traffic.
When CVE-2023-22515 is exploited, an attacker could access public Confluence Data Center and Server instances to create unauthorized Confluence administrator accounts to access the instance. According to the advisory the vulnerability is assessed by Atlassian as critical. At the moment of writing a CVSS score is not yet known. More information can be found in the security advisory, including what versions of Confluence Server are affected.