[$] Two LLM-assisted memory-management patch sets

Post Syndicated from corbet original https://lwn.net/Articles/1080162/

The kernel community (like many other free-software projects) has recently
seen a large influx of patches developed with the assistance of large
language models (LLMs). Those patches tend to come from developers who
were previously unknown to the community. At the moment, though, the
memory-management developers are evaluating two large patch sets, developed
with LLM assistance, that were submitted by established and well-respected
developers. The rather different reception accorded to that work may give
insights into how LLM-generated contributions will be handled going
forward.

Formalizing Red Teaming Offensive Methodology as a Multi-Agent AI Architecture

Post Syndicated from Brian Bartholomew original https://www.rapid7.com/blog/post/so-red-teaming-offensive-methodology-multi-agent-ai-architecture

Threat actors are integrating AI into their exploit chains, accelerating reconnaissance, automating vulnerability discovery, and scaling social engineering in ways that compress the timeline between initial access and impact. The barrier to sophisticated offensive operations is dropping fast.

Rapid7’s Red Team is doing the same. Over the past year we formalized our approach into a structured multi-agent system that follows our penetration testing methodology end-to-end from scoping an engagement to validating findings to generating reports. We built it as a production system, not a proof of concept, and the process of designing and operating it taught us as much about defending against AI-enhanced attacks as it did about conducting them.

The system also proved its value as part of Anthropic’s Project Glasswing initiative. Glasswing is a program that gives leading security companies early access to frontier cyber models before they reach wider availability, enabling security research that stays ahead of malicious adoption. We infused our red team architecture with Claude Mythos, applying it across penetration testing, vulnerability research, and red team operations. The combination of our formalized multi-agent architecture with a frontier-class model produced exceptional results in vulnerability analysis and exploit chain development. This validated both the architecture’s design and the importance of getting these capabilities into defenders’ hands first.

This post covers the architecture, the key design decisions, and what we learned along the way.

Why Rapid7’s Red Team built a multi-agent system

Penetration testing is labor-intensive by nature as a significant portion of any engagement is spent on structured, repeatable work like enumerating attack surfaces, tracing data flows through source code, checking security headers, documenting findings in a consistent format. The actual judgement — deciding what to test next, assessing exploitability, understanding business impact — remains deeply human.

The opportunity was straightforward: offload the mechanical work to AI agents while maintaining human insight at decision points where it matters most. Those decision points are where engagements succeed or fail: scoping what’s in and out of bounds, choosing which attack paths to pursue based on business context, assessing whether a vulnerability is genuinely exploitable in a given environment, deciding when a finding is significant enough to escalate, and interpreting results in ways that translate to actionable risks. None of that is mechanical, it requires experience, judgement, and context that models routinely get wrong. And as an internal security team, we don’t just report vulnerabilities, we’re accountable for coverage. If something ships with an exploitable flaw we missed, that’s on us. The bar for confidence is high, and that’s why humans stay in the loop at every point that matters.

We also had a secondary motivation. Building a system that follows a structured offensive methodology gives us direct architectural insight into how AI agents behave in adversarial contexts including the capabilities, the limitations, and the failure modes. That understanding now informs how we assess and secure Rapid7’s own AI-powered products.

The architecture: Orchestration, not autonomy

The system isn’t a single monolithic agent but a team of specialist agents coordinated by an orchestrator that mirrors how human red teams operate. The orchestrator doesn’t test anything. It assesses the current state of the engagement, determines what needs to happen next, routes work to the appropriate specialist, and processes the results. Specialist agents handle enumeration, code review, dynamic testing, and reporting.Each with defined inputs, outputs, and constraints.

The architectural choice to use supervisor-style orchestration rather than a monolithic agent separates routing decisions from execution. This makes the system more predictable, auditable, and controllable,properties that matter when the agent is operating in sensitive environments.

The key design decision that made this work was methodological, not technical. We reverse-engineered the agent’s architecture directly from our team’s daily task lists. The to-do items our testers tracked during real engagements became the specification: which tasks repeat, in what sequence, where decisions branch, and what triggers a return to an earlier phase. The methodology we’d built over years of engagements became the orchestration logic.

Scope decomposition: Giving every target full attention

One of the earliest lessons we learned was that throwing an entire engagement scope at an AI agent produces shallow, scattered results. LLMs have finite context windows and finite attention. A complex application with dozens of endpoints, multiple authentication flows, and layered business logic overwhelms a single-pass analysis and important details get lost in the noise.

The solution was deliberate scope decomposition. Before the agent begins any technical work, the engagement scope is broken into discrete, manageable chunks.  The scope includes individual components, feature areas, or functional boundaries. Each chunk flows through the full architecture independently: enumeration, code review, dynamic testing, and reporting. The orchestrator tracks which chunks are complete, which are in progress, and which are queued.

This achieves two things. First, it ensures depth over breadth as each component receives the agent’s full analytical attention rather than competing for context space with everything else. Second, it creates natural parallelization opportunities and clear progress tracking. A tester can see exactly which areas have been thoroughly assessed and which remain.

The principal maps directly to how experienced pentesters already work by breaking the target into logical units, going deep on each one, then synthesizing across them. Making the principal explicit and enforceable in the orchestration logic was the design contribution.

Feedback loops: Why linear pipelines fail

Real penetration tests don’t follow a straight line. Code review reveals new endpoints that need enumeration. Dynamic testing uncovers an attack surface that wasn’t visible from source alone. Validated findings sometimes expose entirely new subsystems.

The agent handles this natively. The orchestrator maintains a routing table with progression gates — criteria that must be met before advancing — and feedback triggers that route the engagement backward when new actionable data emerges. This creates a directed graph with re-entry points, not a waterfall.

Guardrails: Maintaining safety in a malicious context

Building an AI agent that can hack is relatively straightforward but building one that operates safely within defined boundaries is a challenge. So it was an area where we invested significant design effort.

The system uses a tiered safety model:

  • Scope enforcement — every action is validated against the engagement’s authorized scope before execution. Out-of-scope discoveries are reported but never probed.

  • Action classification — before execution, every proposed dynamic test is categorized as non-destructive, destructive, or ambiguous. Destructive and ambiguous actions require human approval.

  • Human-in-the-loop by default — in our current deployment, a tester reviews and approves every dynamic test. The agent proposes; the human decides.

The system is designed with a path toward semi-automated operation where low-risk, read-only actions execute autonomously while state-modifying operations still require human approval. The decision about where to sit on that spectrum is context-dependent. Internal labs can tolerate more autonomy while client engagements demand more oversight.

Token efficiency: Making AI practical

AI agents are expensive to run at scale. Every enumeration step, every code block analyzed, every HTTP request reasoned about will consume tokens. It is a practical concern that shaped several design decisions. 

The approach was to identify mechanical tasks that don’t require LLM reasoning and replace them with deterministic scripts and MCP servers. DNS lookups, header checks, input field probing, and certificate enumeration produce structured data that the agent consumes, but the data collection itself doesn’t need intelligence. This reduced token consumption dramatically for enumeration-heavy phases while letting the AI focus its reasoning budget on analysis, correlation, and judgement.

Not every step in an AI workflow needs AI. Knowing where to draw that line was the difference between a demo and a production system for us.

Securing AI from the inside out

There’s a dimension to this work that goes beyond offensive operations. Rapid7 builds AI-powered products. As the internal security team, we’re responsible for securing those systems and building a complex multi-agent architecture gave us direct insight into where the weak points live.

Designing the orchestrated system taught us exactly how prompt injection can propagate between agents, where trust boundaries blur when one agent’s output becomes another’s input, how guardrails can be bypassed through indirect manipulation, and what happens when scope enforcement relies on instruction-following rather than programmatic controls.

We now test Rapid7’s AI features with the same architectural intuition we developed building this system. We know where to look because we’ve built the same patterns and felt where they flex. When we assess an AI system’s safety, we’re thinking like the orchestrator — looking for the routing decision that can be subverted, the progression gate that can be skipped, the feedback loop that can be poisoned.

Building offensive AI made us materially better at defending the AI we ship to customers.

What we learned operating the multi-agent system

A few observations from our team:

Methodology is the differentiator

The LLMs are commodities. The orchestration patterns are emerging in open literature. What makes an AI agent effective at penetration testing is the methodology it follows and that’s built from years of institutional knowledge. Formalizing our methodology into explicit, machine-executable logic was the most valuable part of the project.

Building AI builds intuition for securing AI

The architectural understanding we developed — trust boundaries, prompt propagation, scope enforcement failures — translates directly into more effective security assessments of production AI systems. This was an unexpected but significant return on the investment.

The automation spectrum is context dependent

Full autonomy isn’t a goal; it’s one end of a spectrum. The right level of automation depends on the context.Internal labs, client engagements, and product integrations each have different risk profiles. Designing for the spectrum rather than a fixed endpoint kept the system flexible.

What’s next for Rapid7 Red Teaming in the age of AI

We’re continuing to develop the system, refining the methodology mapping, expanding specialist capabilities, and exploring where purpose-built models could replace general-purpose LLM calls for specific tasks (such as severity classification, report writing, payload selection). We’re also using what we learn from operating this system to inform how Rapid7 detects and responds to AI-enhanced offensive activity in the wild.

You can learn more about Vector Command, Rapid7’s continuous red-teaming solution, here.
Security updates for Thursday

Post Syndicated from jzb original https://lwn.net/Articles/1080956/

Security updates have been issued by AlmaLinux (giflib, kernel, mariadb:10.11, mod_http2, php, rrdtool, ruby, ruby:3.3, and ruby:4.0), Debian (jq and node-lodash), Fedora (caddy, hut, ipp-usb, kernel, opkssh, rclone, thunderbird, and transmission), SUSE (389-ds, 7zip, alsa, amazon-ecs-init, avahi, cadvisor, cosign, cups, dnsdist, docker, dracut, firefox, firewalld, giflib, glib-networking, glycin-loaders, google-cloud-sap-agent, google-guest-agent, gsasl, hauler, helm, ImageMagick, kernel, keylime, krb5, libaom, libexif, libgcrypt, libnfs, libssh2_org, loupe, lrzip, mutt, ncurses, nodejs22, openCryptoki, openssh, openssl-3, pacemaker, perl-Config-IniFiles, perl-CSS-Minifier-XS, perl-DBI, perl-JavaScript-Minifier-XS, perl-libwww-perl, postfix, python-click, python-idna, python-Markdown, python-joblib, python-handy-archives, python-apache-libcloud, python-WebOb, python-PyGithub, python-soupsieve, python-pip, python-pytest-html, python-python-dotenv, python-python-multipart, python-starlette, python-tornado6, python-zeroconf, python311, python311-jupyter-server, rpcbind, sed, sg3_utils, tar, tiff, and util-linux), and Ubuntu (kernel, linux, linux-aws, linux-aws-5.15, linux-aws-fips, linux-azure, linux-azure-5.15, linux-azure-fde-5.15, linux-fips, linux-gcp, linux-gcp-fips, linux-gke, linux-gkeop, linux-hwe-5.15, linux-ibm, linux-ibm-5.15, linux-intel-iot-realtime, linux-intel-iotg, linux-kvm, linux-lowlatency, linux-lowlatency-hwe-5.15, linux-nvidia, linux-nvidia-tegra, linux-nvidia-tegra-5.15, linux-nvidia-tegra-igx, linux-oracle, linux-realtime, linux, linux-aws, linux-aws-fips, linux-gcp, linux-gcp-fips, linux-ibm, linux-nvidia, linux-nvidia-6.8, linux-oracle, linux-realtime, linux-realtime-6.8, linux-oem-6.17, and linux-oem-7.0).

Cybersecurity Mission Creep in the US

Post Syndicated from Bruce Schneier original https://www.schneier.com/blog/archives/2026/07/cybersecurity-mission-creep-in-the-us.html

Interesting paper: “Cybersecurity Mission Creep.”

Abstract: Cybersecurity is experiencing mission creep. Policymakers are casting more and more problems as issues of cybersecurity. So reframed, wildly different policy issues, from misinformation, to child social media safety laws, to antitrust regulations, to alleged journalist misconduct, to anti-sex trafficking statutes become what this Article calls “cybersecuritized.” Before this reframing, these issues present as important but not existential. But once cybersecuritization positions the issues as threats intensified by their technological nature, they gain access to the politics and law of urgency and exceptionalism and invite troubling governance responses.

Positioned as security threats, cybersecuritized issues become endowed with the apparent normative power to override countervailing considerations, oversimplifying the problem. Cybersecuritization’s oversimplification similarly risks unidimensional solutions and invites use of argumentative trump cards, like First Amendment challenges. Cybersecuritization also invites deference to purported specialists and their proposed solutions. Together, the reductive tendencies of cybersecuritization and the deference it prompts to specialists renders ultimate governance choices more opaque. And this opacity can erode public trust and political legitimacy.

This Article surfaces the phenomenon of cybersecuritization and offers a novel framework for analyzing and critiquing it. Mining cases from across criminal and civil domains, the account also demonstrates the insidiousness of cybersecuritization and the likelihood that it will continue to expand. Confronting cybersecuritization is crucial. If we continue to ignore it, we risk abdicating further responsibility for difficult choices to the trump card of cybersecurity. This Article’s analysis and critique aim to help reclaim the hard work of governance for our hands.

[$] LWN.net Weekly Edition for July 2, 2026

Post Syndicated from jzb original https://lwn.net/Articles/1079457/

Inside this week’s LWN.net Weekly Edition:

  • Front: Xsnow protestware; Git 2.55; Rhombus; kernel hardening; More LSFMM+BPF coverage; 7.2 merge window; Secure Boot certificate expiration; Ceph and Garage; OSPM 2026.
  • Briefs: Akrites; Mageia 10; Git 2.55.0; Podman 6.0; systemd v261; Creative Commons chat; Quotes; …
  • Announcements: Newsletters, conferences, security updates, patches, and more.

Run log analytics for a fraction of the cost with the new engine for Amazon OpenSearch Service

Post Syndicated from Jagadish Kumar original https://aws.amazon.com/blogs/big-data/run-log-analytics-for-a-fraction-of-the-cost-with-the-new-engine-for-amazon-opensearch-service/

Amazon OpenSearch Service is a real-time retrieval engine for AI, search, and analytics at any scale. As log volumes grow 30–40 percent year over year, organizations face rising infrastructure costs and slower analytical queries across their observability data. Teams are forced to choose between retaining the data they need and staying within budget.

We’re introducing a purpose-built log analytics engine for Amazon OpenSearch Service. This new engine delivers up to 4x price performance, 2x faster data ingestion, up to 2x faster analytical queries, and up to 70 percent lower storage costs. You get all of this without sacrificing search capabilities on the same data.

In this post, you learn how to take advantage of these benefits, see how to get started, and review benchmark results at billion-document scale.

How the optimized engine works

The optimized engine is a new engine mode within the same Amazon OpenSearch Service domain. You use the same console, APIs, security model, and networking configuration that you already use with the general-purpose engine.

OpenSearch Service stores all data in Apache Parquet format. For fields configured as searchable, OpenSearch Service also writes the data to the inverted index. Apache Calcite parses and optimizes each query, then routes operations to the engine best suited to execute them: Apache DataFusion for analytical operations on columnar data, or Lucene for search predicates. The two hand off mid-query, so a single query can search log content and aggregate the results without additional roundtrips.

You ingest data through the same REST APIs and client libraries you use today and you don’t need to change your agents or pipelines. The optimized engine supports two query languages: Piped Processing Language (PPL) and SQL. Both execute natively through the vectorized engine. The Domain Specific Language (DSL) query API is not supported on the optimized engine at launch.

Getting started

At launch, the optimized engine is a domain-level setting selected at creation time. You can’t add the optimized engine to an existing domain or enable it on individual indices or fields within a general-purpose domain. To adopt the optimized engine, create a new domain and migrate your ingestion pipelines to it.

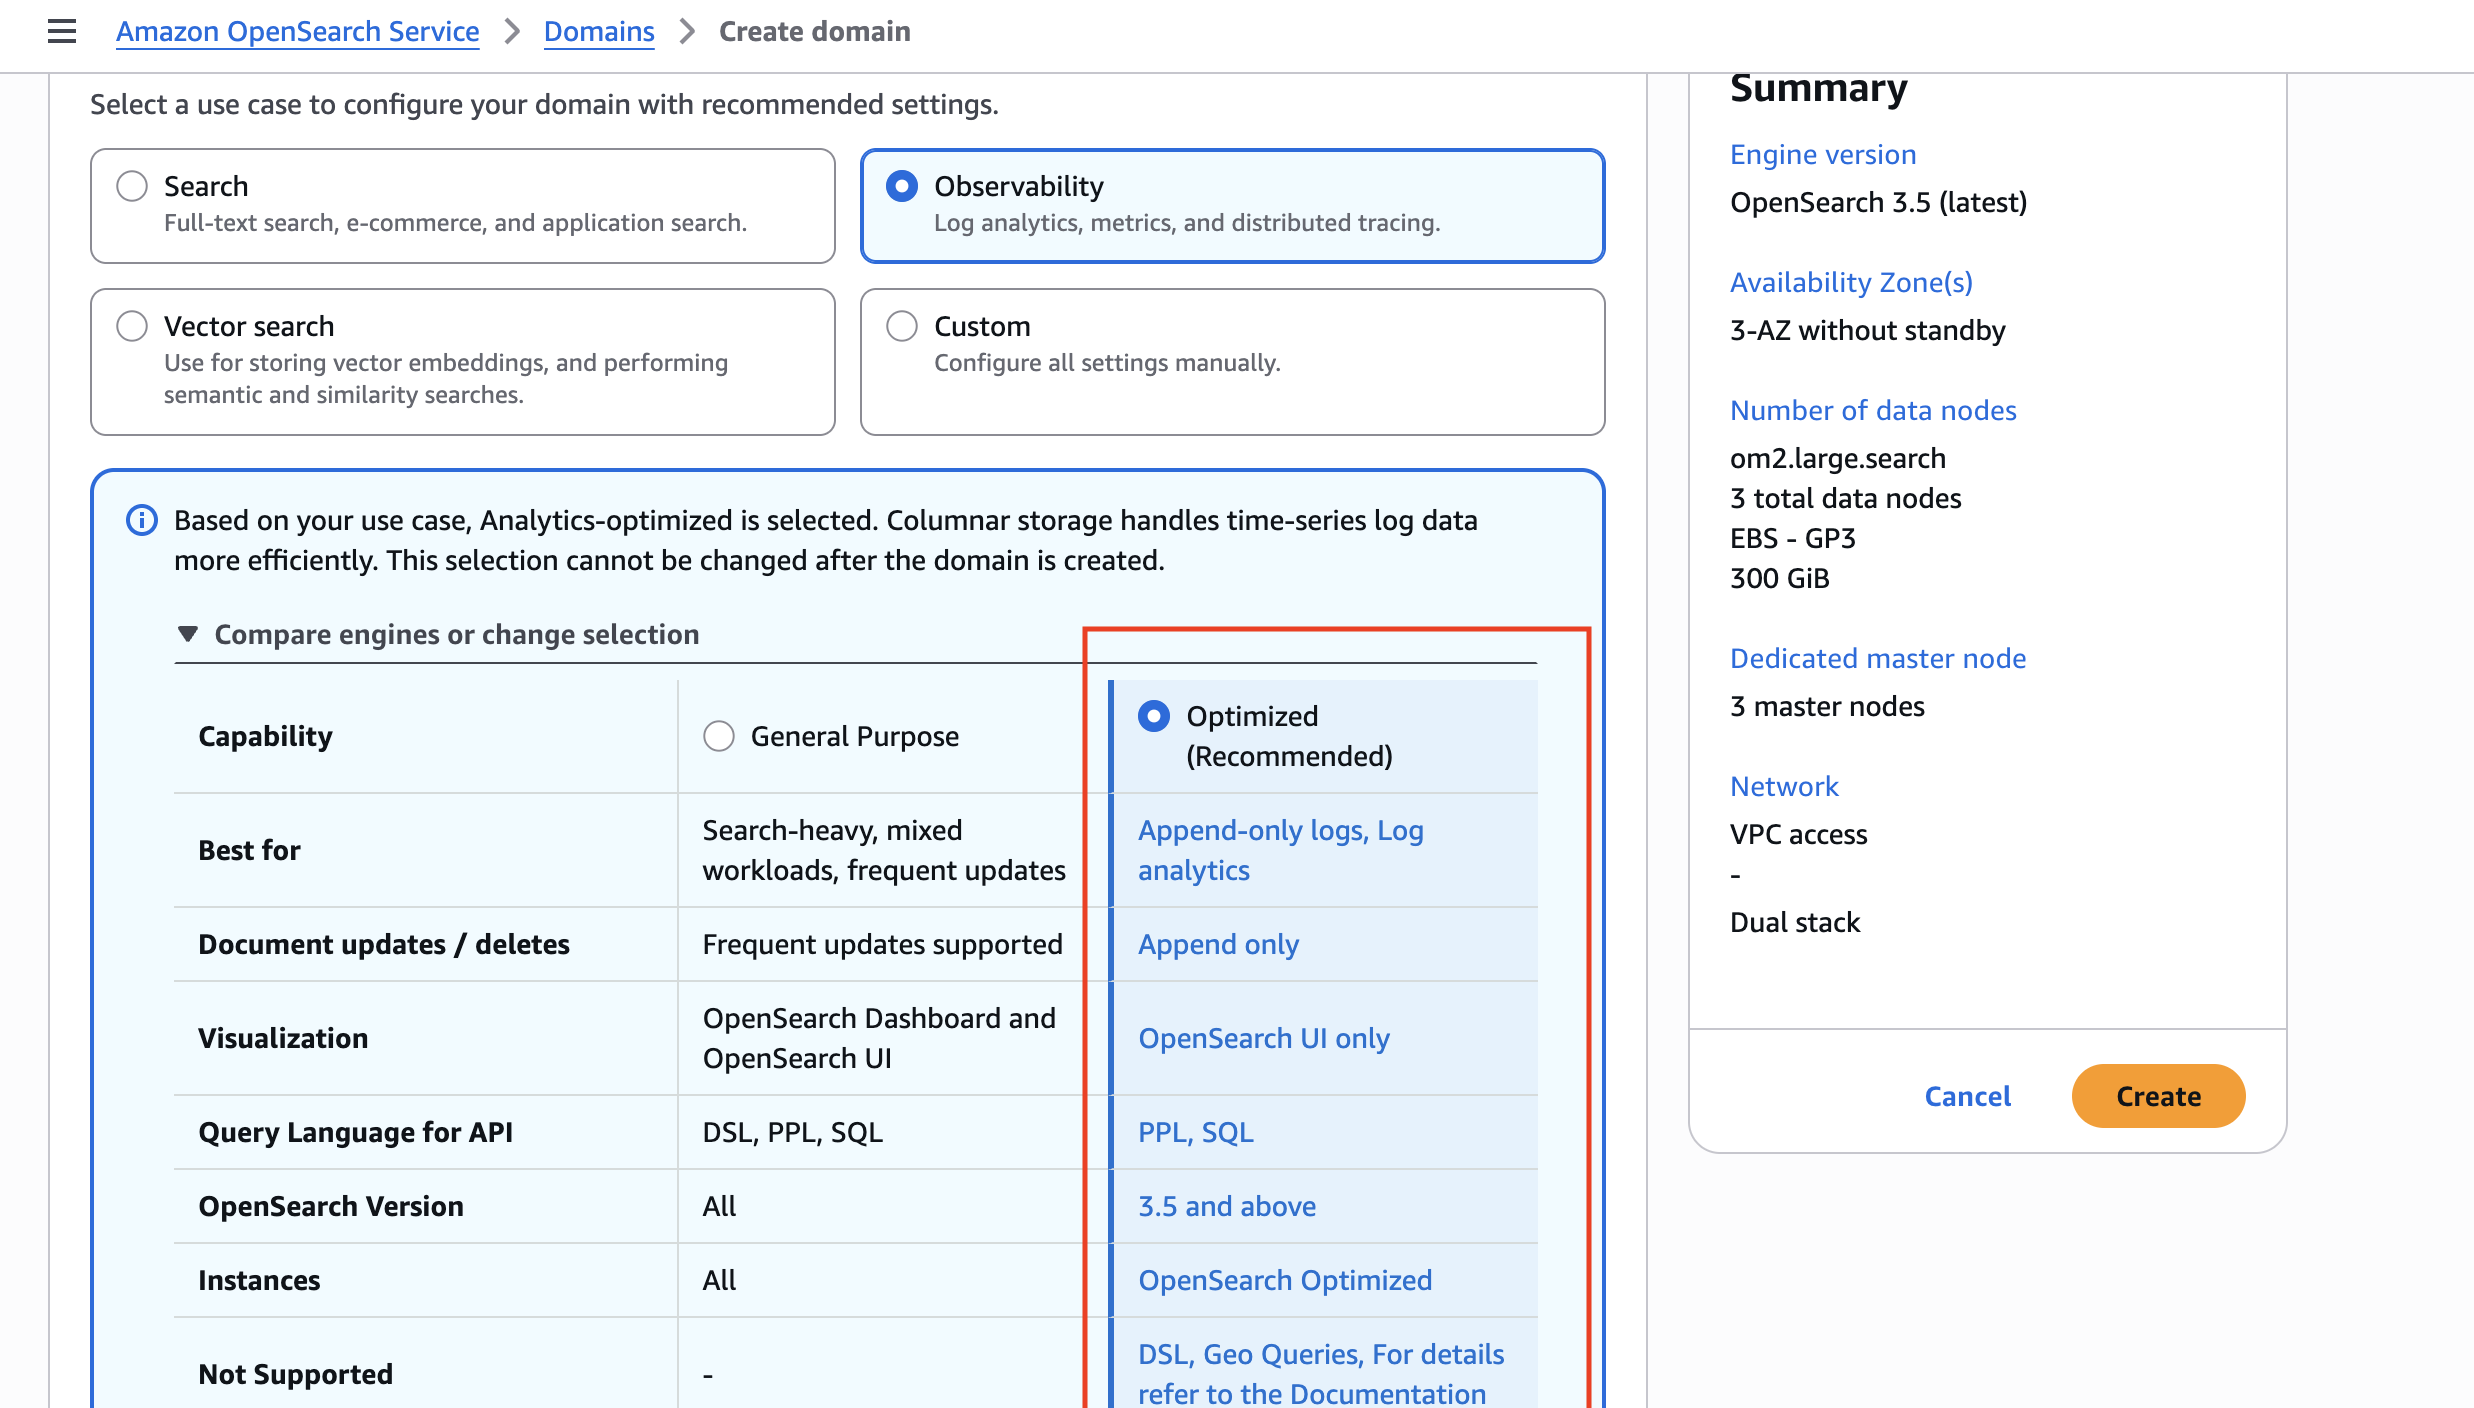
Create a new domain in the Amazon OpenSearch Service console and select Observability as your use case. The optimized engine is enabled by default. The console provides a side-by-side comparison of capabilities to help you choose.

Amazon OpenSearch Service console showing the Observability use case selected with a side-by-side comparison of engine capabilities

After your domain is ready, ingest JSON documents through the same Bulk API and client libraries you use today. No changes to your ingestion pipelines or application code are required.

Benefits of the optimized engine for log analytics

The optimized engine for log analytics introduces the following performance and cost improvements:

  • Up to 4x better price-performance compared to the existing general-purpose engine on internal benchmarks, while retaining full-text search for incident investigation.
  • Up to 2x faster analytical queries. The engine uses a vectorized query execution path that processes data in columnar batches for fast results across large datasets.
  • Up to 2x higher ingestion throughput. The append-only columnar write path increases sustained ingestion rates.
  • Up to 70 percent lower storage with columnar storage for aggregation workloads. You can retain up to 3x more data at the same cost.

To demonstrate these improvements, we benchmarked observability workloads at billion-document scale. In the following sections, we explore the benchmark methodology, test environment, and results. We recommend testing the optimized engine with your own workload to validate the gains for your use case.

Benchmark methodology

We used the Telemetry Generator for OpenTelemetry to generate synthetic traces and logs at scale, producing three observability datasets: OTEL traces, OTEL logs, and web server access logs. We stored the generated data as bulk-format NDJSON in Amazon Simple Storage Service (Amazon S3). We then ingested it through a pipeline on Amazon Elastic Container Service (Amazon ECS) with AWS Fargate. The pipeline reads chunks from Amazon S3, transforms timestamps, and writes to the OpenSearch Bulk API, simulating a production observability flow.

We benchmarked on two OpenSearch Service domains running OpenSearch 3.5, each with 9 data nodes in a 3-Availability Zone configuration:

Configuration Optimized Engine Standard Lucene
Instance type 9x or2.4xlarge.search 9x r8g.4xlarge.search
Leader nodes 3x m7g.large.search 3x m7g.large.search
EBS 2,500 GB gp3, 7,500 IOPS, 500 MB/s per node 2,500 GB gp3, 7,500 IOPS, 500 MB/s per node
Engine mode OPTIMIZED General Purpose (best_compression)

We ingested three data sets totaling 24.4 billion documents and 9.5 TB of raw JSON. All indices used 9 primary shards, 1 replica, and Index State Management (ISM)-managed rollover at 50 GB per primary shard. The Lucene baseline used best_compression (zstd) codec with _source enabled, representing the default customer configuration.

The ingestion pipeline ran on 90 Fargate tasks (16 vCPU, 120 GB RAM each, 48 writer threads per task, bulk size of 3,000 documents) in the same virtual private cloud (VPC) as the OpenSearch Service domains.

Results

Ingestion throughput

The optimized engine’s append-only columnar storage writes segments in bulk-optimized batches without per-document stored field overhead.

Metric Optimized Engine Lucene Baseline
Peak throughput 1.78M docs/sec ~647K docs/sec
Cluster CPU at peak 62% 72%
Write rejections 0 0
Total documents ingested 24.4 billion 15.7 billion

The optimized engine sustained 1.78 million documents per second at matched concurrency, approximately 2x the throughput of the Lucene baseline, while consuming less CPU. Both domains ran with zero write rejections. For teams ingesting terabytes per day, the throughput advantage translates to fewer nodes for the same volume, or longer retention on the same infrastructure.

Storage compression

The columnar Parquet format compresses observability data through dictionary encoding of repeated fields, tight packing of numeric columns, and elimination of per-document JSON overhead.

Measured across 24.4 billion documents:

Dataset Documents Source Optimized Engine Lucene (default)

Compression

vs.

source

Savings vs. Lucene
Web logs 8.76B 2,360 GB 254 GB 614 GB 89% 59%
OTEL logs 8.20B 3,720 GB 815 GB 1,549 GB 78% 47%
OTEL traces 7.43B 4,131 GB 841 GB 1,790 GB 80% 53%
Total 24.4B 9,539 GB 1,910 GB 3,953 GB 80% 52%

The optimized engine stores the same data at 5x compression versus raw JSON (80 percent savings). Against the default Lucene configuration (_source enabled, what most domains run), the optimized engine uses roughly half the storage. The optimized engine derives _source from Parquet columns on read, eliminating the need to store the raw JSON blob while still allowing document retrieval.

Analytical query performance

We measured query latency on a typical observability dashboard pattern: analytical aggregations scoped to a 15-minute time window over billions of log events. The optimized engine uses row-group pruning on the @timestamp column to skip data outside the query window, reading only the relevant subset.

Query pattern Dataset Optimized Engine Lucene baseline Speedup
Error count by service OTEL logs 717 ms 2.8 s 3.9x
Log volume by host OTEL logs 252 ms 17.6 s 70x
5xx errors by service and method OTEL logs 171 ms 885 ms 5.2x
Top services by error OTEL traces 635 ms 569 ms ~1x
Point lookup (single traceId) OTEL traces 394 ms 783 ms 2x

All queries scoped to a 15-minute window. Index sizes: 8.2 billion OTEL log events, 7.4 billion OTEL trace spans.

The optimized engine completes time-filtered analytical queries in 171 ms to 717 ms over billions of documents. The advantage is most pronounced on unfiltered aggregations (log volume by host: 70x) where the columnar engine reads only the columns needed. On queries where the Lucene inverted index provides strong predicate selectivity (top services by error on traces), performance is comparable between the two engines.

Search and point lookups

The optimized engine retains the Lucene inverted index alongside columnar storage. When the query planner recognizes a selective lookup (such as retrieving a single trace by ID), the planner routes the query to the inverted index rather than scanning columnar data. In our benchmark, a single traceId lookup across 7.4 billion spans returned in 165 ms.

This means a real investigation can use both engines in sequence: broad aggregations to localize the problem, then a point lookup to pull the offending trace, all from the same domain.

Now available

The optimized engine for Amazon OpenSearch Service is generally available today in all commercial AWS Regions (Regions other than the AWS GovCloud (US) Regions and the China Regions) where OpenSearch Optimized Instances are available.

Pricing follows standard Amazon OpenSearch Service rates for instances and storage, with no additional premium for the optimized engine. For more information, see Amazon OpenSearch Service Pricing.

To learn more about configuring and using the optimized engine, see Optimized for Log Analytics in the Amazon OpenSearch Service documentation. For an overview of the service, visit Amazon OpenSearch Service Log Analytics.

Give it a try and send feedback to AWS re:Post for Amazon OpenSearch Service or through your usual AWS Support contacts.


About the authors

Jagadish Kumar

Jagadish Kumar

Jagadish is a Senior Solutions Architect at Amazon Web Services, focused on OpenSearch and analytics workloads.

Rohin Bhargava

Rohin Bhargava

Rohin is a Senior Product Manager for Amazon OpenSearch Service.

Michael Supangkat

Michael Supangkat

Michael is a Solutions Architect at Amazon Web Services specializing in search and observability.

Маргарита Доровска: Средата не е даденост, ние ѝ влияем

Post Syndicated from Ина Иванова original https://www.toest.bg/margarita-dorovska-sredata-ne-e-dadenost-nie-i-vliyaem/

Маргарита Доровска: Средата не е даденост, ние ѝ влияем

Точно от едно десетилетие Маргарита Доровска работи в Габрово. Другият начин да се опише професионалният ѝ път е: между Габрово, София и още няколко големи европейски града, защото споделянето и преживяването на изкуството, средата и общността са важни за емоционалното и менталното оцеляване, убедена е тя.

В продължение на седем години Маргарита е директор на Музея на хумора и сатирата в Габрово, а след това оглавява Центъра за съвременно изкуство „Кристо и Жан-Клод“. Идеята за подобен център в родния град на Кристо Явашев датира от 90-те години, Общинският съвет одобрява инициативата през 2008-ма, а от 2016-та с проекта е ангажирана и Маргарита Доровска.

Тя е завършила културология в Софийския университет и магистратура по куриране на съвременно изкуство в Кралския колеж по изкуства в Лондон (Royal College of Art) – престижно учебно заведение, отгледало арт директори и куратори на водещи световни музеи и галерии. Да работиш за публични институции не е комерсиално ориентирана работа – фокусът е върху културните политики. Това, което Маргарита категорично си взема оттам, е

нагласата. Отношението към това кое е публичното и какво дължим на обществото. Тоест съзнанието, че институциите работят за публиката и че нейният интерес, който е много трудно да бъде дефиниран, трябва да бъде представен. Важно е как комуникираш една идея, как я приближаваш, как отговаряш на времето – ти всъщност правиш изложби, които реагират на съвремието.

Центърът „Кристо и Жан-Клод“ е разположен в сградата на бившата Професионална текстилна гимназия (закрита през 2009 г.). Просторните работилници с високи тавани ще бъдат трансформирани в изложбени зали и пространства за създаване на изкуство и сътрудничество. С програмата си от временни и постоянни изложби, ателиета, резидентски програми, прожекции и беседи Центърът ще акцентира върху образованието и обучението на млади хора и изобщо върху развитието на общността.

В по-малките градове имаш много по-плътен контакт с публиката. И много по-лесно получаваш обратна връзка – разбира се, ако я търсиш и тя те интересува. Така че не става въпрос да угаждаш на посетителите, аз съм категорична, че трябва да намираме добрия начин да комуникираме, но да правим това, което ние смятаме за важно. Ако за теб е истински интересно, ще стане такова и за други хора. Нещо като детския блясък в очите: виж какво намерих, чакай сега да ти го покажа.

В по-малките населени места подкрепата е много по-голяма, а сътрудничеството– по-лесно, убедена е Маргарита Доровска и разказва как при технически проблем за откриването на Центъра е получила помощ от частна строителна фирма и от пожарната, които със съвместни усилия са решили инфарктна ситуация със старо съоръжение, застинало във въздуха. Помощта е точно на един телефон разстояние, ако общността те е припознала.

Разбира се, аз имах огромния късмет да попадна в знакова за идентичността на града институция, каквато е Музеят на хумора и сатирата. Това е място, което габровци може да не са посещавали от 15 години, обаче то е важно за тях, скъпо им е, свързано е с идентичността им и те са готови да го бранят. Всъщност това е истинска възможност за развитие на публики, защото хората започват да се интересуват от онова, което правиш.

В момента е обявен двуетапен конкурс от Община Габрово, за да бъде намерено най-доброто архитектурно решение за реконструкция на сградата на Центъра „Кристо и Жан-Клод“. Първата фаза е открит анонимен конкурс за изготвяне на идейна концепция с предвиден награден фонд за класираните първи пет проекта.

Тук е моментът да кажем, че конкурсите, макар да са отворена и демократична среда или инструмент за проектиране, всъщност са много изискващи – ти предпоставяш, че немалък брой екипи ще седнат и ще работят с дни. Има много архитектурни студиа, които не участват в конкурси, защото шансът да спечелиш е малък. И той наистина е малък статистически, а подобен проект е разход на човешка енергия. Затова направихме конкурса на етапи.

Сградата е разположена край Янтра и е свързана с основния предмет на бившето училище – текстила, който е неизменна част и от изкуството на Кристо. Впрочем семейната история на Явашеви също е свързана с тъканите – баща му е бил текстилен инженер.

Идеята за свързаността на концепции и пространства сякаш е част от професионалната биография на Маргарита Доровска.

Аз дълбоко вярвам, че архитектурата и дизайнът, интериорът и екстериорът, градските връзки, които се създават, влияят на нашето поведение. За да имаш добре работеща институция, трябва да създадеш добра среда, в която да се случват изложбите и процесите, заложени от теб.

Желанието и амбицията един проект да бъде изпълнен възможно най-добре на всички нива са обичайният modus operandi за Маргарита Доровска. Тя разказва за показателна ситуация от следването си в Лондон, при която екипът от бъдещи магистри подготвя предстояща реална изложба. Британската система на администриране изисква всяка стъпка да бъде одобрена и подписана на по-високо ниво. Така се оказва, че буквално в последния момент прессъобщението е връщано неколкократно с различни предложения за редактиране, и групата, отговорна за текста, редактира отново и отново, докато не получи одобрение – до последната точка и запетая. Защото така се прави.

Този перфекционизъм, мисълта, че трябва да извървиш всичко до последната крачка, някак се оказа доста полезен за мен,

казва Маргарита.

А изкуството има свойството исторически да напипва пулса и да предсказва времето. Има го, разбира се, и момента, в който това може да бъде фрустриращо, защото понякога подхващаш проекти, които са изпреварили времето си, а ти вярваш силно в тях. Фрустрацията идва от невъзможността – ти си убеден в нещо, виждаш го, обаче обществото не го разпознава и ти не успяваш да го комуникираш, както си се надявал.

Маргарита Доровска вярва, че за да настъпи промяна в нагласите на публиката, трябва да се натрупа критична маса от събития и никой не е единствен пророк. Съвременното изкуство все още среща предразсъдъци. За своя цел тя припознава възможността хората да се чувстват добре дошли. По особен начин тази идея влиза в диалог с каузата на Кристо и Жан-Клод, които замислят, подготвят, координират и деинсталират амбициозните си проекти, включвайки различни групи хора. Всички помним милионната аудитория на последните им работи, усещането за лично свързване и приобщаване, вълнението.

Маргарита Доровска насочва вниманието ни и към един филм, създаден в края на 70-те години – „Бягащата ограда“ (Running Fence). Филмът проследява усилията да бъде „построена“ близо 40-километрова ограда от бяло платно над хълмовете на Калифорния. Преди реализирането на проекта Кристо и Жан-Клод срещат съпротива от щатските власти въпреки съгласието, дадено от фермерите, през чиито земи ще мине оградата. Четири години по-късно идеята е осъществена.

Реализирането на проекта е документирано от братя Мейзълс. Там виждаш начина, по който Кристо и Жан-Клод работят и как приобщават общността, заживяват с общността, за да стане тя на свой ред част от изкуството им. Хората да го искат и да се борят за това изкуство.

Днес истински важно е културните организации да бъдат способни да се променят, твърди Маргарита. Всички сме наясно доколко автоматизирането на алгоритмите започва да замества хората в рутинната работа. Но промяната не се прави през ежедневния мениджмънт, тя се прави през проекти.

Заедно с организационни психолози сме правили тиймбилдинги, на които разказваме за Кристо и Жан-Клод. След това оставяме хората да си минат през своите упражнения – вече завладени и спечелени, вдъхновени. Можем само да си мечтаем организации и бизнеси да работят така, както се случват проектите на Кристо и Жан-Клод – толкова предвидливо към детайлите.

Изкуството на Кристо и Жан-Клод е много интересно за разказване. Работим интензивно и с деца, имаме работилници, в които се опитваме да ги научим, че не трябва да приемат средата за даденост, да не са пасивни участници, а да знаят, че могат да ѝ повлияят.

Изкуството е там, където можем да учим, играейки.

Правим ателие, на което им даваме познати локации и казваме: ето сега, както Кристо е правил подготвителни рисунки на проектите си, ти какво искаш да сложиш в този пейзаж? Можеш да лепиш, да режеш, да рисуваш. Можеш всичко. Имаме и друго ателие, което подготвихме с боядисани консервни кутии, приличащи на малки варели. След това започва едно редене на мастаба, както е в проекта на Кристо. А ако някой някъде нещо обърка, може точно преди финала цялата мастаба да се срути. Всичко е много физическо, но и дава възможност да говорим за философията на съвременното изкуство.

В края на септември в Центъра „Кристо и Жан-Клод“ предстои мащабен проект, свързан със скейт културата. Събитието ще включва изложба, филмови прожекции, демонстрации и история на скейтбординга. В България първите самоделни дъски се появяват през 70-те, а в края на 80-те години тази субкултура получава подкрепата (и контрола) на Комсомола, тъй като духът вече е излязъл от бутилката, а и част от децата на партийните първенци са били извън страната и искат да живеят друг живот, казва Маргарита Доровска.

Всъщност е много интересно да намериш начин да разкажеш една субкултура, без да я нарушиш. Скейтърите са свързани и с градското изкуство, с дизайна, модата, фотографията, музиката. Едновременно с това около тях има доста предразсъдъци, те не са долюбвани, мисли се, че са вандали, че тяхното каране вреди на градската среда – но тя се чупи, когато не е добре изпълнена.

Да събужда любопитството и да провокира сетивата и ума – това е мисията на съвременния куратор. Да напомня, че в изкуството няма „верен отговор“. Още повече когато предубежденията и инерцията са твърде силни. Това успява да прави екипът на Маргарита Доровска в Габрово. И макар тя да е наясно, че събитийният интензитет в столицата е по-силен, вижда, че работата им предизвиква внимание. Или, казано на езика на вълнението, което изкуството разпалва:

Да събудим любопитството и да дадем увереността на хората, че са добре дошли.


Хората, които тихо и кротко променят средата, формират общности и задават посоки, в които има смисъл да тръгнем заедно. Тук ви срещаме с тях. Това са „Тези хора“.

Secure Amazon container workloads using container attribute-based rules in AWS Network Firewall

Post Syndicated from Amit Gaur original https://aws.amazon.com/blogs/security/secure-amazon-container-workloads-using-container-attribute-based-rules-in-aws-network-firewall/

Today, you can use AWS Network Firewall to protect traffic flowing to and from containerized applications on Amazon Elastic Kubernetes Service (Amazon EKS) and Amazon Elastic Container Service (Amazon ECS) clusters. If you run AI and machine learning (ML) workloads on Amazon EKS—such as model inference, RAG pipelines, or JupyterHub—your containerized workloads require the same firewall protections you enforce for traditional applications. However, traditional firewall rules rely on IP addresses, and pod IPs in Kubernetes change frequently as containers scale or restart. Writing and maintaining static firewall rules based on these ephemeral IPs, CIDRs, and subnets is difficult and error-prone, which can leave gaps in your security posture.

Kubernetes Network Policies offer basic traffic control at the namespace level, operating at layers 3 and 4. Depending on your security requirements, you might need additional capabilities beyond what network policies provide: Layer 7 inspection, FQDN-based filtering, and protection from threats detected by managed IDS/IPS rules. Visibility into which pod or service generates blocked traffic is equally important, so you can troubleshoot faster and meet audit requirements.

You can use container attribute-based rules for Network Firewall to define firewall rules for your containerized workloads on both Amazon EKS and Amazon ECS using native container attributes, rather than relying on ephemeral IP addresses. For Amazon EKS, these attributes include namespaces, pod names, cluster names, and labels. This reduces the need to maintain IP-based rules in dynamic container environments. While this capability supports both Amazon EKS and Amazon ECS, this post focuses on Amazon EKS. Your containerized workloads get the same Network Firewall capabilities you use today.

There is no additional charge for the feature itself, because it’s included in the base tier of Network Firewall.

How it works

When you create a container association and link it to your EKS cluster, Network Firewall automatically discovers and tracks the pods that match your defined attributes (namespace, labels, cluster name) and resolves them to their current IP addresses. As pods scale up or restart, the firewall dynamically updates the IP-to-attribute mapping in near real-time and no manual rule updates are required. This approach keeps your firewall rules accurate in dynamic environments while minimizing performance impact on the EKS cluster. In multi-cluster environments, this feature enables centralized cross-cluster traffic inspection for any traffic that passes through the firewall.

Container attribute-based rules also enrich firewall alert logs with container context. Alert logs now include a new metadata field with the container association name associated with the matched rule. This gives security teams the ability to trace blocked, allowed, or alerted traffic directly back to the originating workload. Network Firewall exports these enriched logs to Amazon CloudWatch Logs and Amazon Simple Storage Service (Amazon S3), from where you can forward them to the SIEM of your choice. To bind these attribute groups to running workloads, Network Firewall continuously watches your EKS cluster for pod lifecycle events (create and delete) across the namespaces covered by your container association definition. This definition is stored in a container association, keyed by attribute name and value.

When published, you reference these @ aliases in stateful Suricata rules. The following are some common patterns:

  • Pod group rules: Allow only payment-service pods to reach the external payment gateway over TLS:
    pass tls @ecommerce_pods any -> any 443 (msg:"allow ecommerce to payment gateway"; tls.sni; content:“checkip.amazonaws.com”; flow:to_server,established; sid:1; rev:1;)

  • Layer 7 application rules : Enforce block from all pods from reaching malicious destinations:
    drop tls @all-pods any -> $EXTERNAL_NET any (msg:"Block malicious sites"; aws_domain_category:malicious-sites; sid:10; rev:1;)

At packet evaluation time, Network Firewall expands each @ reference against the current catalog. When pods scale, restart, or move between nodes, the controller refreshes group membership, and the firewall picks up the new IPs, hence no rule edits or operator intervention is required. Each match—whether alert, pass, or drop—streams to the logging destination of your choice with container context. This gives your team a real-time, auditable view of policy effectiveness and a feedback loop for tuning rules and pod-group definitions over time.

Getting started

The Network Firewall container attribute-based rules for Amazon container workloads can be configured using the AWS Management Console for Amazon Virtual Private Cloud (Amazon VPC), AWS Command Line Interface (AWS CLI), or AWS SDK by creating a container association. This container association then can be used to create attribute-based Network Firewall rules.

Prerequisites

This walkthrough requires an existing Network Firewall configured to filter traffic through your Amazon VPC. If you haven’t set one up yet, see Getting started with AWS Network Firewall.

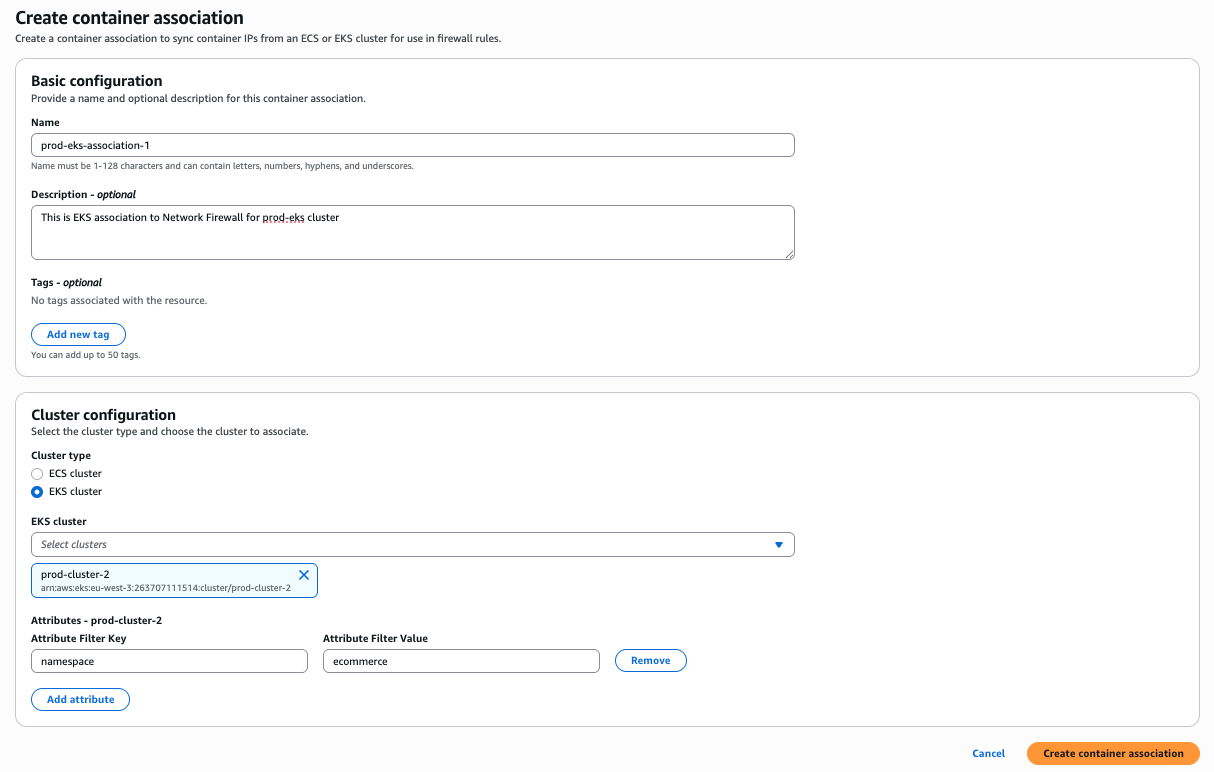
Step 1 – Create a container association:

  1. In the AWS VPC console, navigate to Network Firewall, select Container associations. Choose Create container association.
  2. Enter a Name and optional Description for this container association.
  3. Under Cluster configuration, select the Cluster type and select your EKS cluster from the Cluster drop down.
  4. For Attribute filters, configure the EKS attribute to identify which pods to associate:
    • Attribute key: Enter the attribute key defined in your EKS cluster (for example, namespace, pod, cluster, or custom label key).
    • Attribute value: Enter an attribute key value defined in your EKS cluster.
Figure 1: Create container association

Figure 1: Create container association

Step 2 – Create an attribute-based firewall rule:

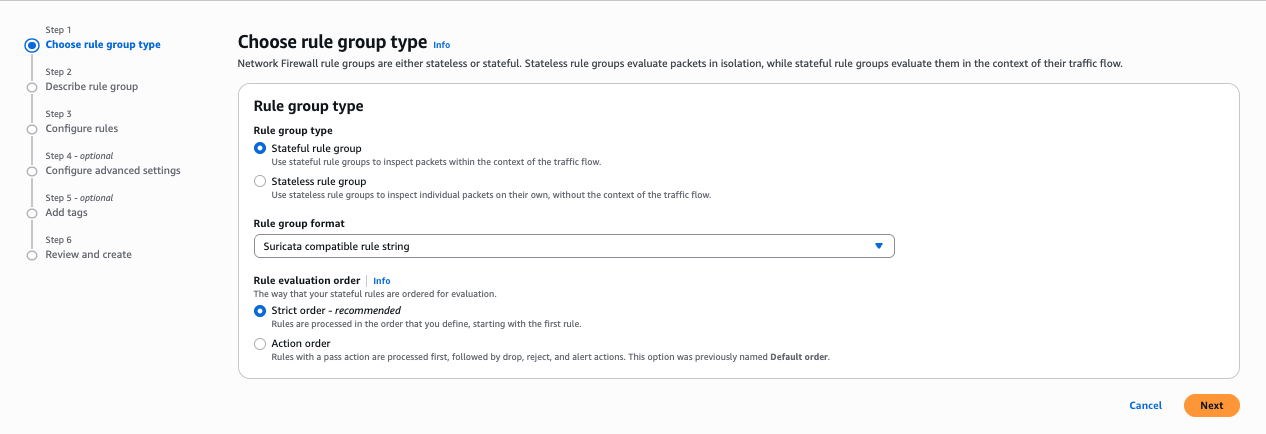
  1. In the AWS VPC console, navigate to Network Firewall, then select Network Firewall rule groups.
  2. Select Create rule group.
  3. For Rule group type, select Stateful rule group.
  4. For Rule group format, select Suricata compatible rule string.
    Figure 2: Rule group selection

    Figure 2: Rule group selection

  5. For Rule evaluation order, select Strict order. Choose Next.
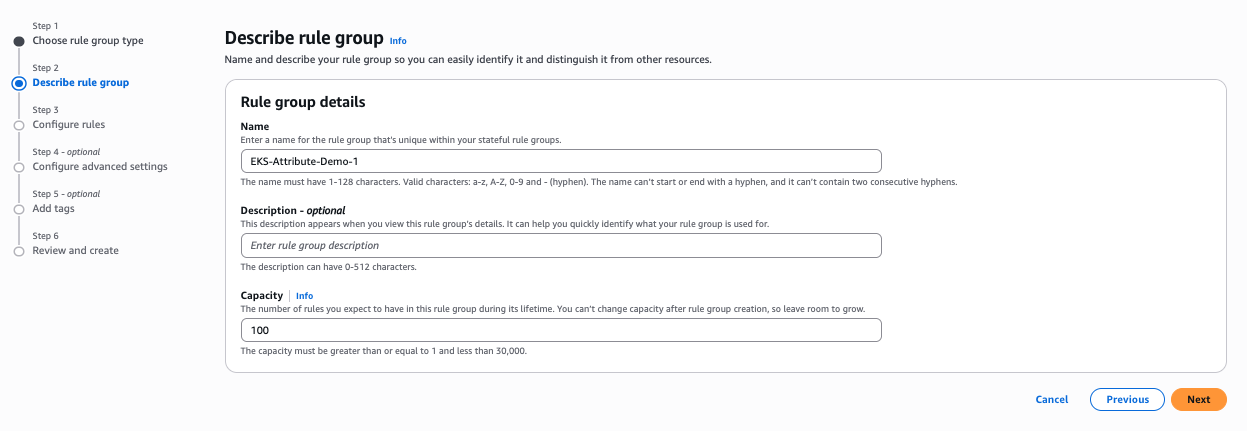
  6. Under Describe rule group, enter a Name, Description, and Capacity for the rule group. Choose Next.
    Figure 3: Describe rule group

    Figure 3: Describe rule group

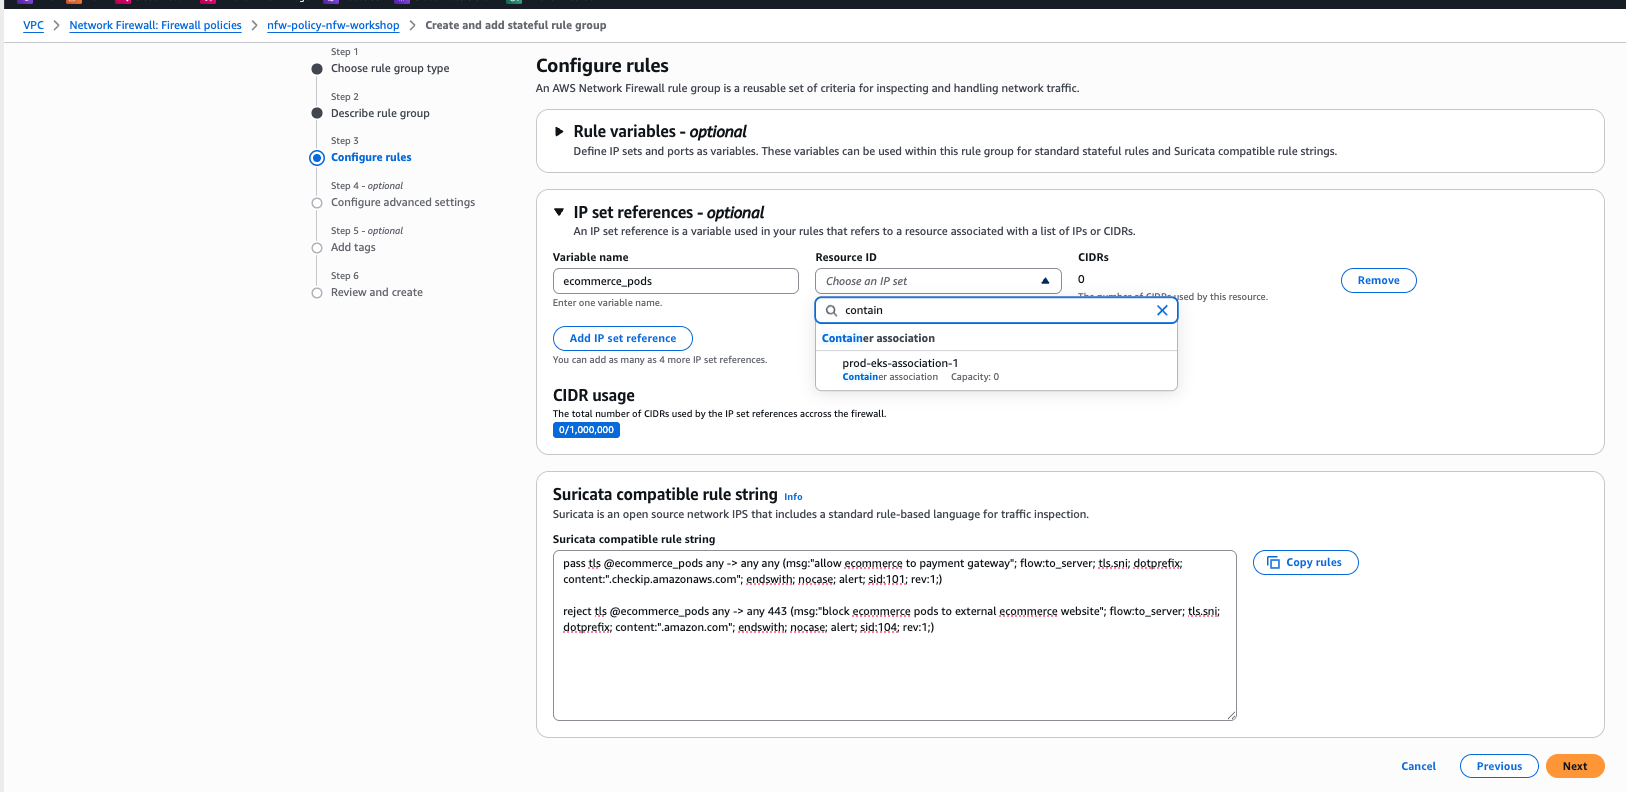
  7. Under IP set references, enter a variable name and from the resource ID drop-down, select the container association created in step 1.
  8. Under Suricata compatible rule string, enter your Suricata rule string. The following is a sample string used for this post:
    pass tls @ecommerce_pods any -> any any (msg:"allow ecommerce to payment gateway"; flow:to_server; tls.sni; dotprefix; content:".checkip.amazonaws.com"; endswith; nocase; alert; sid:101; rev:1;)
    
    reject tls @ecommerce_pods any -> any 443 (msg:"block ecommerce pods to external ecommerce website"; flow:to_server; tls.sni; dotprefix; content:".amazon.com"; endswith; nocase; alert; sid:104; rev:1;)

    Figure 4: Configure rules

    Figure 4: Configure rules

  9. Choose Next.
  10. Enter the details if required on the next options. For this post, we’re using the default values.
  11. On the review and create page, choose Create rule group.

Tests and results

To verify these rules are working as expected, test using the curl command on a pod in the ecommerce namespace. A curl request to www.amazon.comshould fail, because action=rejectis defined in the Suricata rule string. Similarly, a request to the payment gateway URL should succeed, because action=passis defined in the Suricata rule string.

Test 1 – Allowed traffic:

kubectl exec -n ecommerce deployment/payment-service -- curl -sk --max-time 5 -w "\nHTTP_CODE:%{http_code}\n" https://checkip.amazonaws.com/

HTTP_CODE:200

Test 2 – Blocked traffic:

kubectl exec -n ecommerce deployment/payment-service -- curl -sk --max-time 5 https://www.amazon.com 2>&1

curl: (35) Recv failure: Connection reset by peer
command terminated with exit code 35

Container association can also be used in a Standard stateful rules format.

Considerations

There are several important considerations when adopting this feature.

  1. Source NAT (SNAT) must be disabled so that the Network Firewall can see pod IP addresses. If SNAT remains enabled, only the node IP will be visible, preventing granular pod-level egress controls.
  2. This feature can’t enforce security on pod-to-pod traffic within the same node, because that traffic doesn’t traverse the Network Firewall endpoint. A separate solution is needed for this use case.
  3. Performance impact can vary based on rule complexity and traffic volume.

Conclusion

In this post, you learned how container attribute-based rules for AWS Network Firewall solve the challenge of securing dynamic containerized workloads. You explored how the feature maps Kubernetes attributes such as namespaces, pod names, cluster names, and labels to firewall rules, eliminating the need to track ephemeral IP addresses. You walked through how to create a container association to link your EKS cluster attributes to Network Firewall, and then how to reference that association using IP set references in Suricata compatible rule strings. This gives you granular traffic control of your Amazon EKS workloads with the same Network Firewall capabilities as traditional applications including layer 7 inspection, FQDN filtering, TLS decryption, and managed IDS/IPS rules along with enriched logging that traces traffic back to the originating workload.

If you have feedback about this post, submit comments in the Comments section below.


Amit Gaur

Amit Gaur

Amit, a Cloud Infrastructure Architect at AWS, brings his passion for technology and knowledge-sharing to the networking community. Specializing in network architecture design, he helps customers build highly scalable and resilient environments on AWS. Through technical guidance and architectural expertise, Amit enables customers to accelerate their cloud adoption journey while making sure their systems are built for scale and reliability.

Preetkumar Shah

Preetkumar Shah

Preetkumar is a Technical Account Manager at AWS, based in Atlanta, GA. He specializes in helping customers design and operate secure, scalable network architectures in the cloud. At AWS, he works with SMB customers and collaborates closely with service teams to proactively resolve complex challenges and ensure customers get the most from their AWS environment. Outside of work, his interests include spending time with family and going on trails.

Akash Kuman Sinha

Akash Kumar Sinha

Akash is a DevOps Consultant and GenAI Ambassador at AWS, where he helps customers transform their cloud operations through containerization and modern delivery practices. He specializes in container orchestration and DevOps automation, and is a regular speaker at AWS events across Europe. Outside of work, Akash is passionate about knowledge-sharing and exploring the intersection of generative AI and cloud-native innovation.

Amish Shah

Amish is a seasoned product leader with over 15 years of experience in developing innovative and scalable solutions for networking, security, and cloud use cases. He currently leads the AWS Network Firewall service, where he helps to develop security solutions that protect AWS workloads. Outside of work, Amish enjoys playing cricket and soccer, loves to travel, and has recently started collecting niche fragrances.

AI-powered performance recommendations for Amazon Redshift

Post Syndicated from Steve Phillips original https://aws.amazon.com/blogs/big-data/ai-powered-performance-recommendations-for-amazon-redshift/

Data platform teams running Amazon Redshift collect performance telemetry across system views like SYS_QUERY_HISTORY, SVV_TABLE_INFO, and SVV_ALTER_TABLE_RECOMMENDATIONS, plus Amazon CloudWatch metrics for capacity, query execution, and storage. The challenge is interpretation. Correlating a spike in QueryRuntimeBreakdown commit time with hundreds of small INSERT statements, or connecting high disk spill with undersized compute, takes deep expertise and hours of manual analysis.

In this post, you learn how to build an AI-powered solution that collects the telemetry, pre-computes performance signals, correlates them with CloudWatch, and uses Amazon Bedrock to generate prioritized recommendations. The source code is in the accompanying GitHub repository: sample-ai-performance-advisor-for-amazon-redshift.

The signal-based design is what makes this solution produce precise recommendations rather than generic advice. Instead of dumping raw system view output into the large language model (LLM) prompt, the collector pre-computes boolean and threshold-based findings, pairs them with CloudWatch correlations, and hands the model a structured context. The model then cross-references specific query IDs, table names, and metric values in its output.

Solution overview

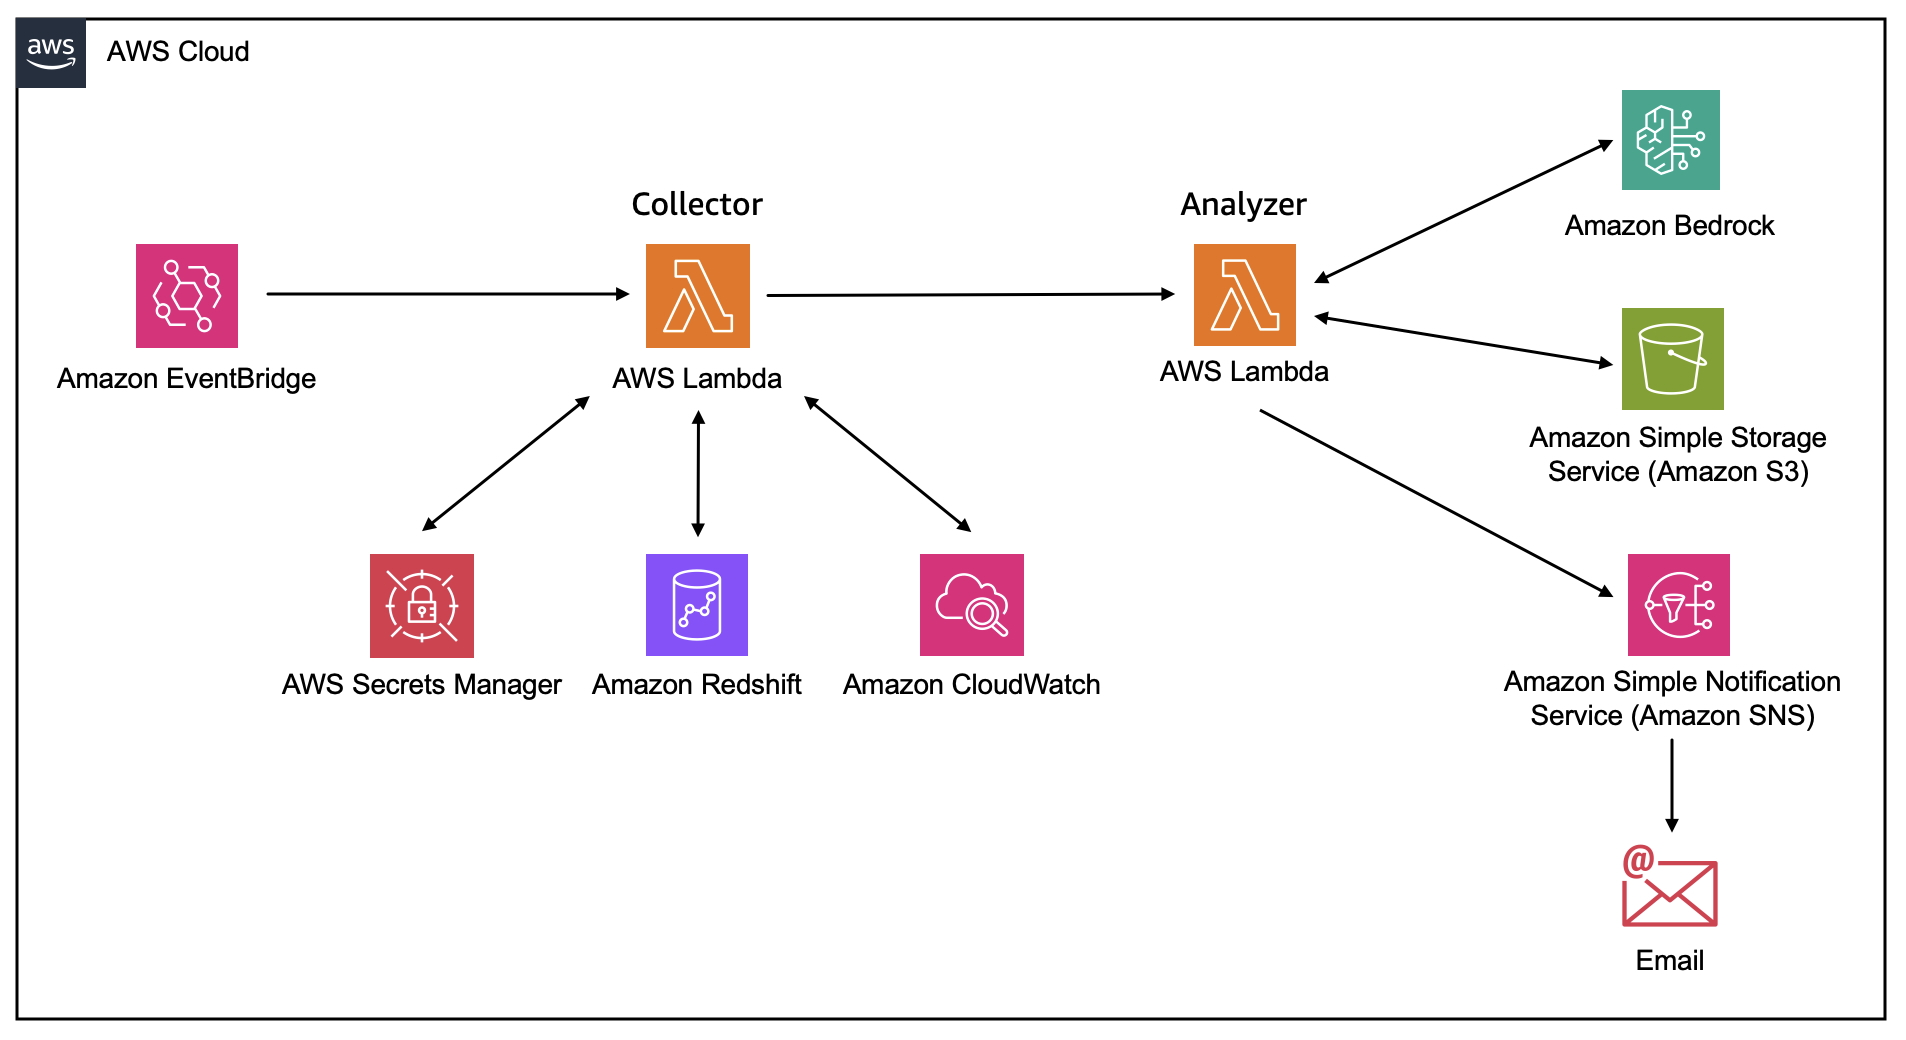
Two AWS Lambda functions run on a 24-hour Amazon EventBridge schedule:

  • The collector Lambda runs 13 diagnostic SQL queries against Amazon Redshift Serverless and reads the workgroup’s Workload Management (WLM) configuration. It also collects CloudWatch metrics across capacity, query execution, WLM, connections, and storage. From these inputs, it computes the performance signals. Finally, it writes a telemetry JSON file to Amazon Simple Storage Service (Amazon S3).
  • The analyzer Lambda reads the telemetry from Amazon S3, builds a structured prompt with inline CloudWatch-to-signal correlations. Using the correlations, the analyzer calls Amazon Bedrock (Anthropic Claude Sonnet 4.6), and writes the resulting recommendations JSON back to Amazon S3.
  • An Amazon Simple Notification Service (Amazon SNS) topic sends an email summary of the top recommendations to subscribers.
AWS architecture diagram showing an automated Redshift analysis pipeline within the AWS Cloud. Amazon EventBridge triggers a “Collector” AWS Lambda function, which interacts bidirectionally with AWS Secrets Manager, Amazon Redshift, and Amazon CloudWatch to gather data. The Collector passes results to an “Analyzer” AWS Lambda function, which exchanges data with Amazon Bedrock and reads/writes to Amazon S3. The Analyzer then publishes to Amazon Simple Notification Service (SNS), which delivers an email notification.

Figure 1 – Architecture diagram

Prerequisites

Before deploying the solution, make sure the following are in place.

  • An Amazon Redshift Serverless workgroup with a database and query history.
  • An Amazon Redshift database administrator user (superuser). The collector reads views that only a superuser can query (SVV_TABLE_INFO, SVV_ALTER_TABLE_RECOMMENDATIONS, SVV_MV_INFO, SYS_SERVERLESS_USAGE, SYS_AUTO_TABLE_OPTIMIZATION).
    Store the admin credentials in AWS Secrets Manager and pass the secret ARN to the collector.
    Alternatively, have an existing superuser run ALTER USER "IAMR:redshift-performance-recommendations-role" CREATEUSER;
    once to grant the Lambda role superuser privileges.
  • Amazon Bedrock model access for the model of choice. For this solution, a us.anthropic.claude-* model is recommended for multi-region inference. The solution doesn’t depend on a single model.
  • The AWS Command Line Interface (AWS CLI) installed and configured, and a clone of the GitHub repository.

Create the supporting resources

You need an Amazon S3 bucket, an Amazon SNS topic, an AWS Secrets Manager secret, and an AWS Identity and Access Management (IAM) role before the Lambda functions can run.

Create the Amazon S3 bucket

The Amazon S3 bucket will host the output report.

  • Open the Amazon S3 console and choose Create bucket.
  • Enter a globally unique name (for example, amzn-s3-demo-bucket), keep the default settings, and choose Create bucket.

The collector writes telemetry JSON under the telemetry/ prefix and the analyzer writes recommendations under the recommendations/ prefix.

Create the Amazon SNS topic and subscription

Use Amazon SNS to generate notifications once reports are created.

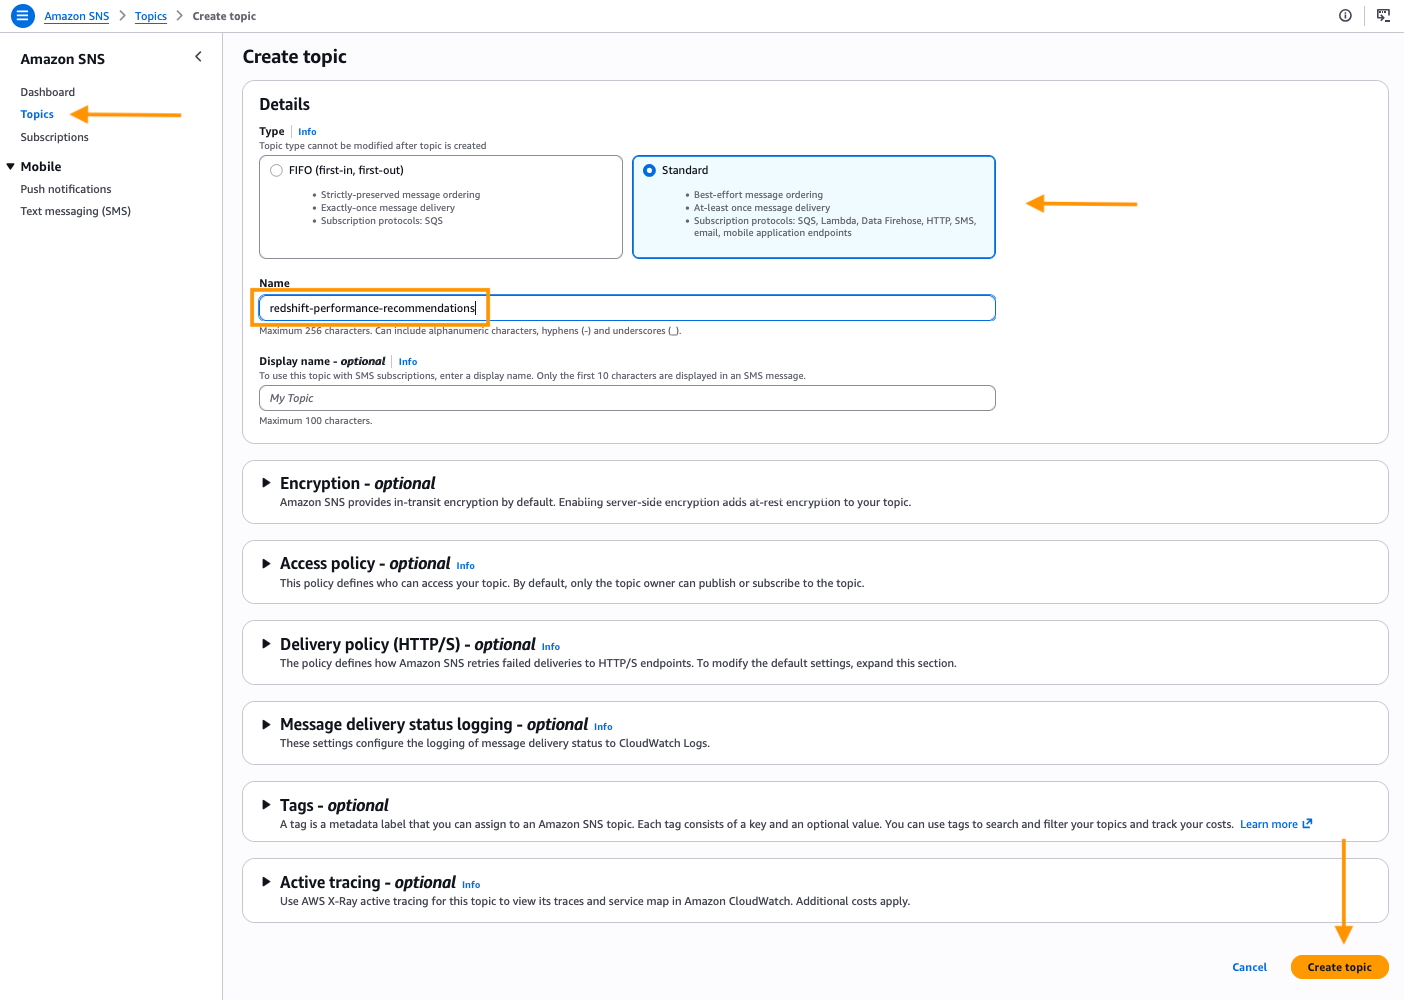
  • Open the Amazon SNS console and choose Topics, Create topic.
  • Select Standard, and enter the name redshift-performance-recommendations.
  • Choose Create topic.
  • On the topic detail page, choose Create subscription.
  • Select Email as the protocol, enter your email address, and choose Create subscription.
  • Open the confirmation email from AWS Notifications and choose Confirm subscription.
Amazon SNS “Create topic” console page. The Type is set to Standard (selected over FIFO), and the Name field contains “redshift-performance-recommendations.” Annotation arrows highlight the Topics nav item, the Standard topic type, the entered name, and the “Create topic” button in the lower right. Optional sections for Encryption, Access policy, Delivery policy, Message delivery status logging, Tags, and Active tracing are collapsed below.

Figure 2 – Create SNS Topic

Store the admin credentials in AWS Secrets Manager

To avoid using hard-coded credentials, create an AWS Secrets Manager secret to connect to Amazon Redshift.

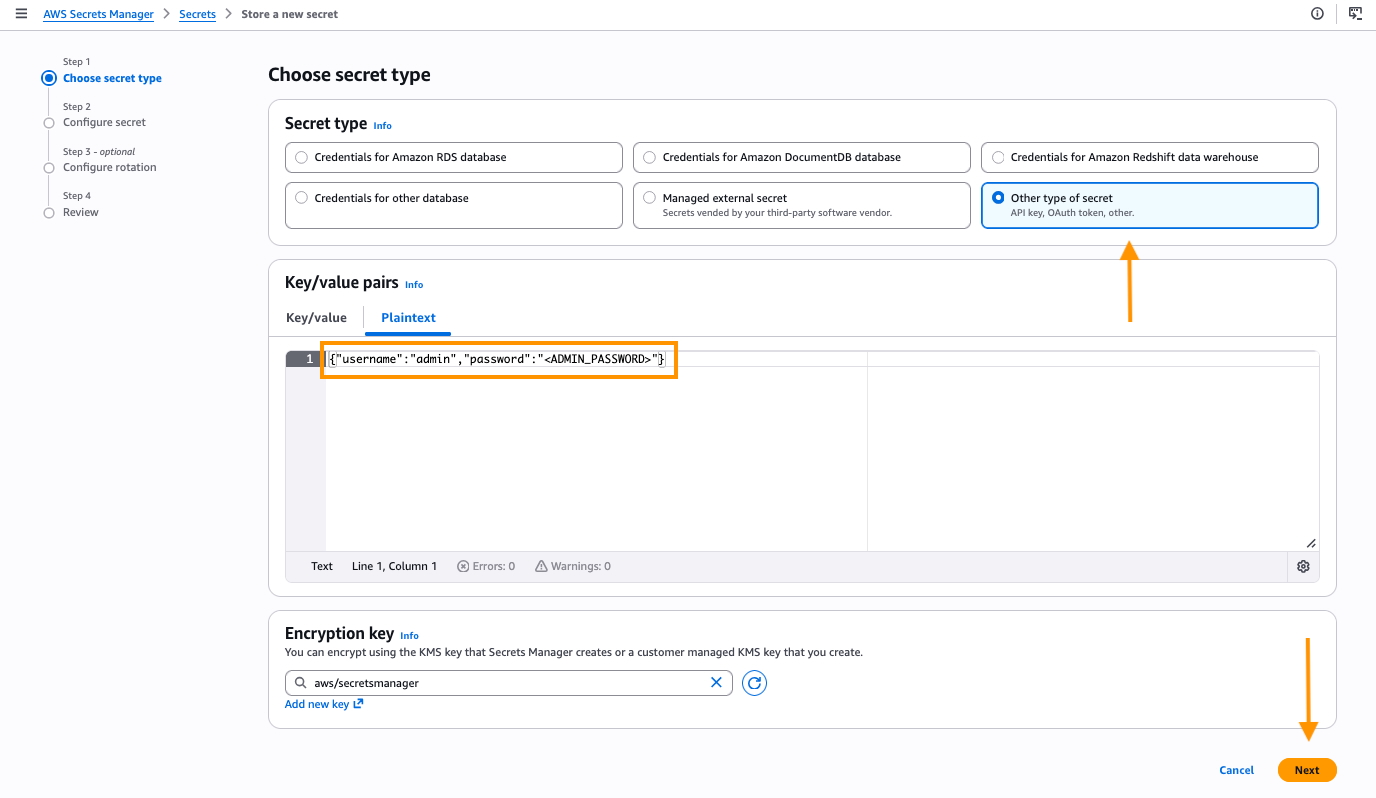
  • Open the AWS Secrets Manager console and choose Store a new secret.
  • Select Other type of secret, choose the Plaintext tab, and paste the following, replacing <ADMIN_PASSWORD> with the workgroup’s admin password:
    {"username":"admin","password":"<ADMIN_PASSWORD>"}

  • Choose Next, enter redshift-performance-admin as the secret name, then choose Next, Next, and Store.
  • Copy the secret Amazon Resource Name (ARN) from the secret detail page. You pass it to the collector in a later step.
AWS Secrets Manager “Store a new secret” page, Step 1: Choose secret type. “Other type of secret” is selected, and the Plaintext tab shows the key-value pair {“username”:“admin”,“password”:“”}. The encryption key is set to aws/secretsmanager. Annotation arrows highlight the secret type selection, the plaintext credentials, and the “Next” button in the lower right.

Figure 3 – Create secret

Create the IAM role and attach the policy

The repository includes a trust policy in iam/trust-policy.json (allowing lambda.amazonaws.com to assume the role) and the least-privilege permission policy in iam/lambda-role-policy.json. Replace the <ACCOUNT_ID>, <REGION>, <YOUR_BUCKET>, and SNS topic ARN placeholders in the permission policy with your values, then create the role in the AWS Management Console or with this AWS CLI command:

aws iam create-role --role-name redshift-performance-recommendations-role \
    --assume-role-policy-document file://iam/trust-policy.json

aws iam put-role-policy --role-name redshift-performance-recommendations-role \
    --policy-name redshift-performance-policy \
    --policy-document file://iam/lambda-role-policy.json

The permission policy grants the Amazon Redshift Data API, Amazon S3, Amazon SNS, Amazon Bedrock, AWS Lambda invoke, AWS Secrets Manager, and Amazon CloudWatch Logs permissions that both Lambda functions require.

Deploy the Lambda functions

The collector source is in lambda/collector.py and it loads the SQL files in sql/ at runtime. The deployment package must contain both.

Package the collector

Open a terminal or shell window and execute a command to copy the collector code, supporting SQL into a folder and archive.

mkdir -p build/collector/sql
cp lambda/collector.py build/collector/
cp sql/*.sql build/collector/sql/
(cd build/collector && zip -qr ../collector.zip .)

Create the collector function

Using the AWS Management Console, navigate to AWS Lambda.

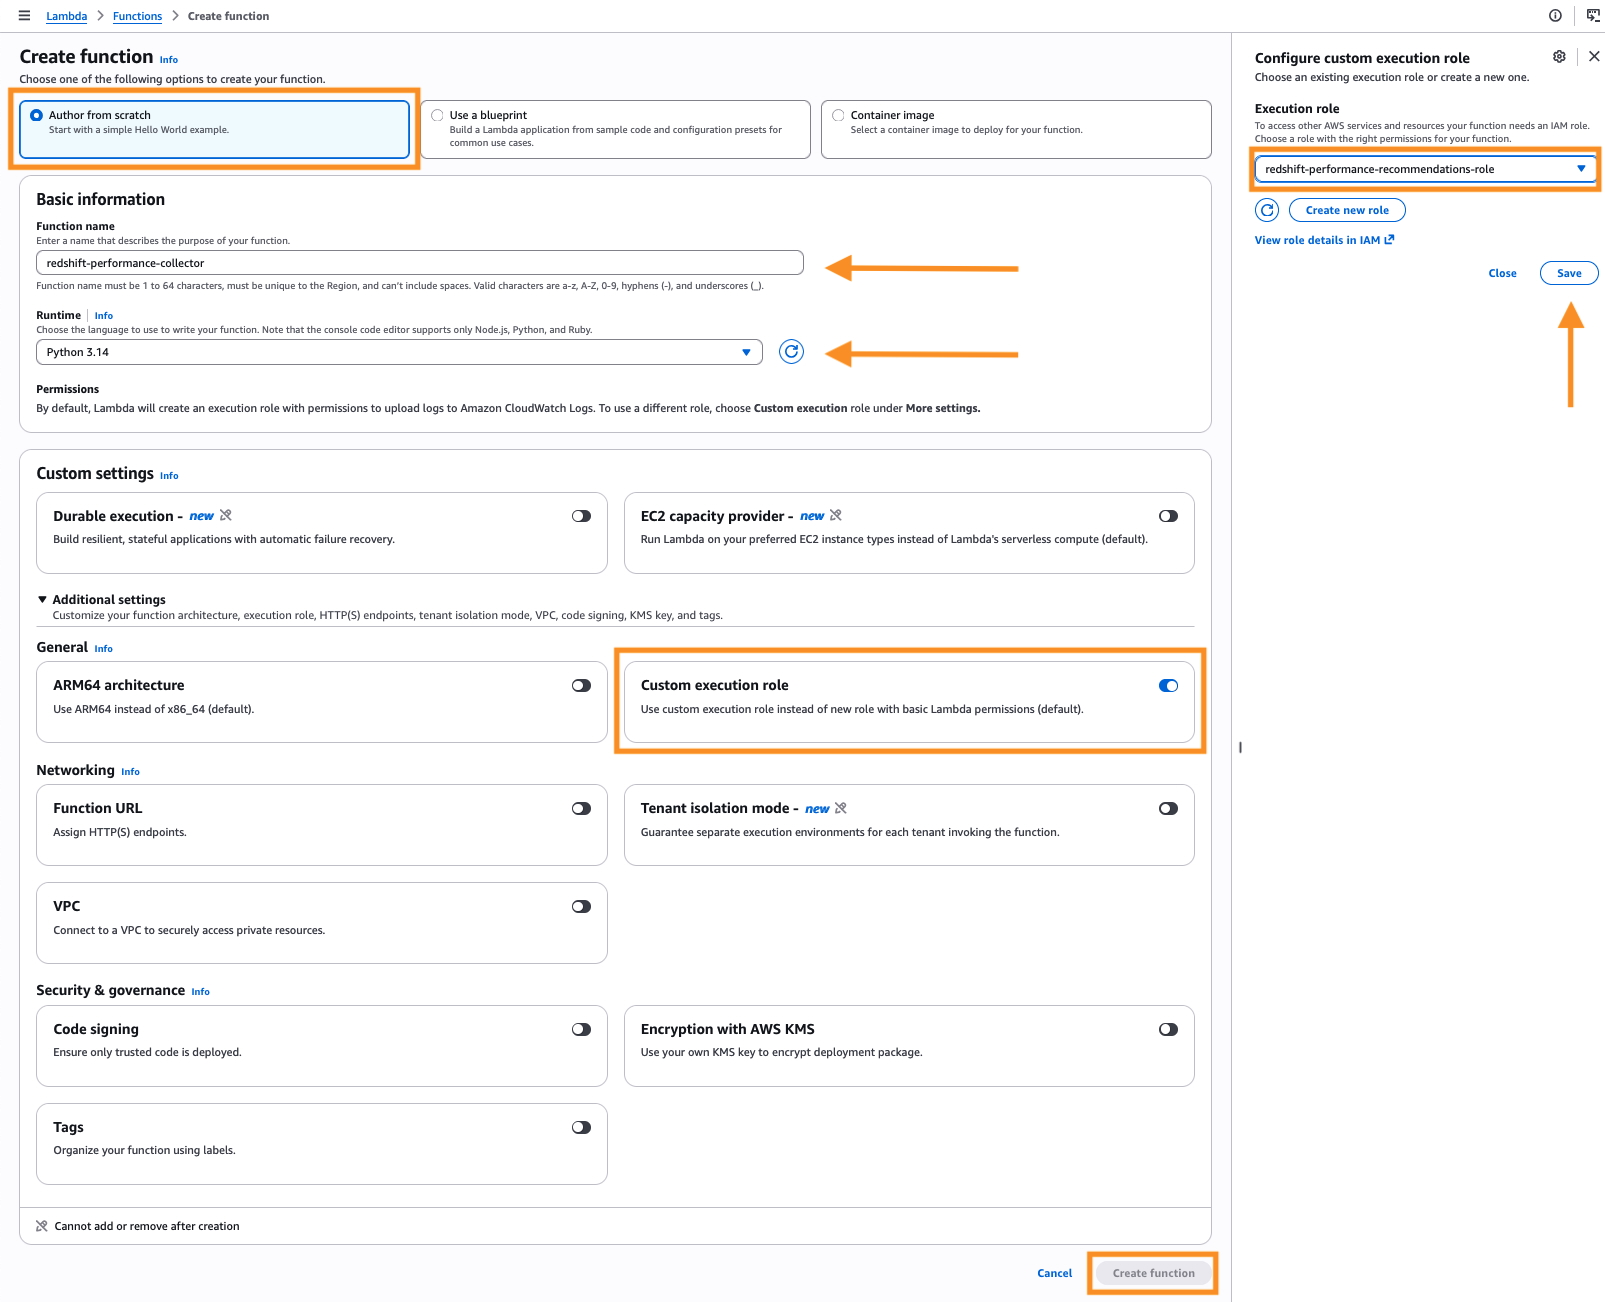
  • Choose Create function.

    AWS Lambda “Create function” console page with the “Configure custom execution role” panel open on the right. “Author from scratch” is selected, the function name is “redshift-performance-collector,” and the runtime is Python 3.14. Under Additional settings, the “Custom execution role” toggle is enabled, and the execution role list is set to “redshift-performance-recommendations-role.” Annotation highlights mark the Author from scratch option, function name, runtime, custom execution role toggle, the selected role, the Save button, and the “Create function” button.

    Figure 4 – Create AWS Lambda function

  • Select Author from scratch, enter redshift-performance-collector as the name, and select Python 3.14.
  • Expand Custom settings, toggle Custom execution role, choose an existing role, select redshift-performance-recommendations-role, and choose Save.
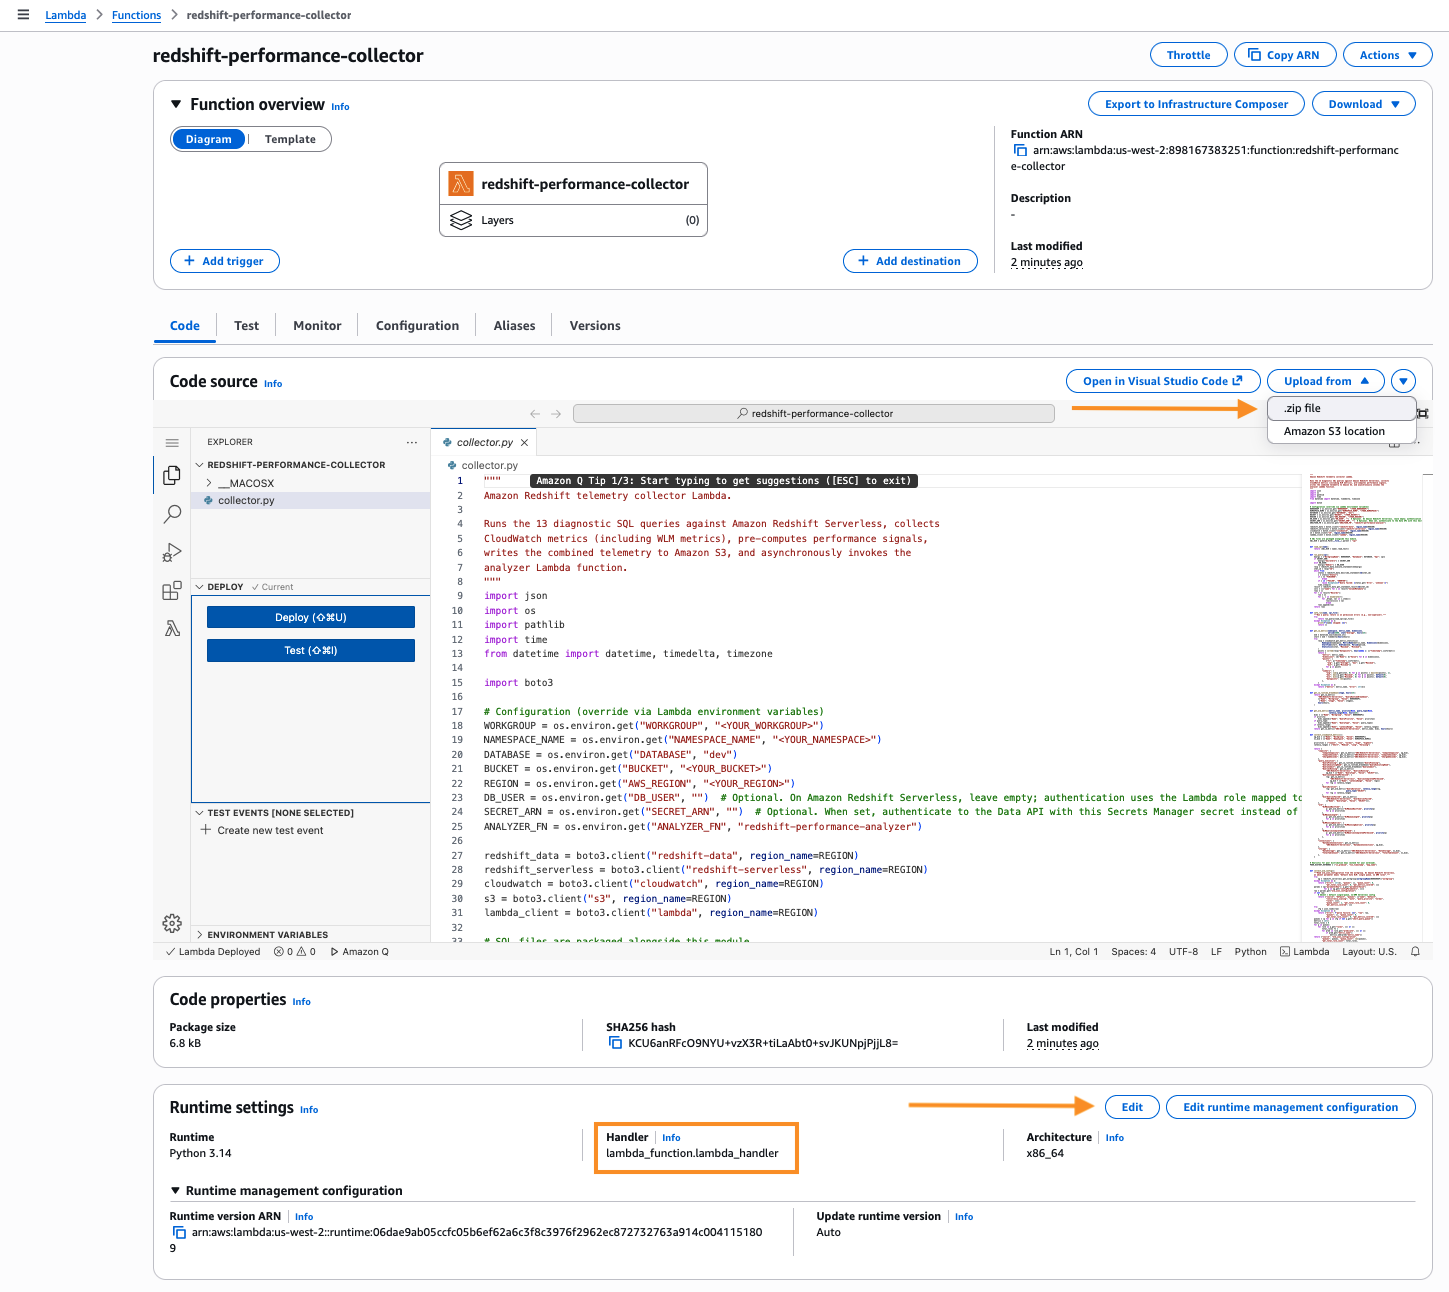
  • On the function page, choose Upload from, .zip file, and upload build/collector.zip.
  • In Runtime settings, select Edit, and set the Handler to collector.lambda_handler.

    Lambda console for the “redshift-performance-collector” function, Code tab. The code editor shows collector.py — a Python file that runs diagnostic SQL queries against Amazon Redshift Serverless, collects CloudWatch metrics, writes telemetry to Amazon S3, and invokes the analyzer Lambda. The Runtime settings section below shows the Handler highlighted as “lambda_function.lambda_handler,” with an arrow pointing to the Edit button and the “Upload from .zip file” option highlighted.

    Figure 5 – Set AWS Lambda handler

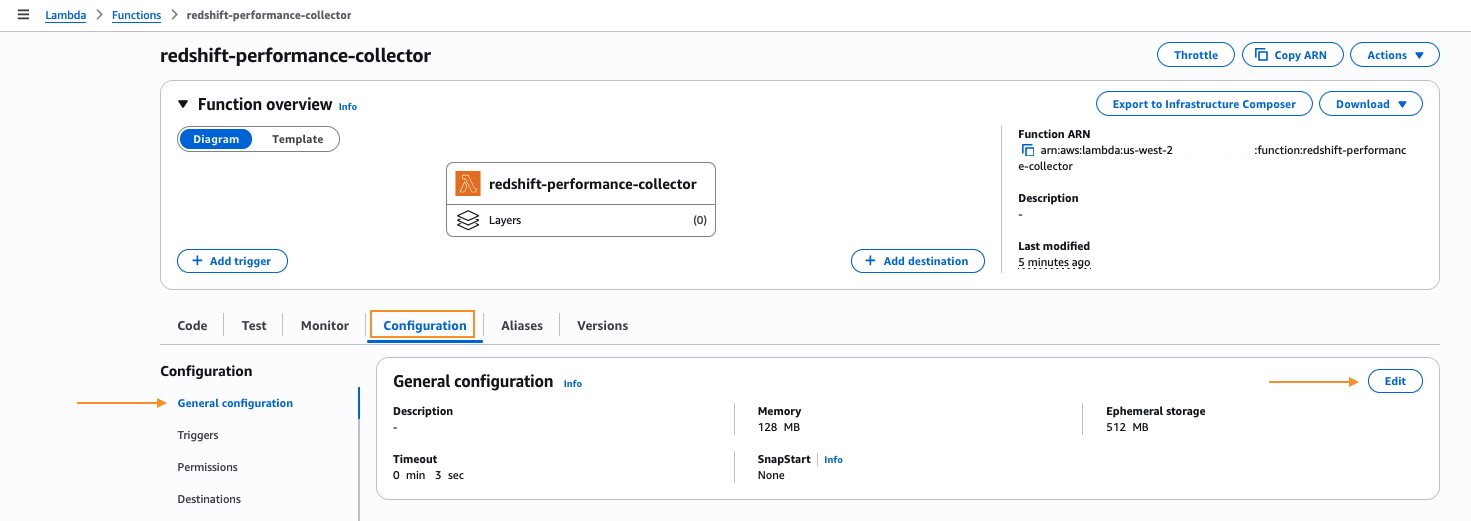
  • Choose Configuration, Edit, set timeout to 5 minutes, and memory to 256 MB.

    Lambda console for “redshift-performance-collector,” Configuration tab with “General configuration” selected. The panel shows Memory 128 MB, Ephemeral storage 512 MB, and Timeout 0 min 3 sec, with SnapStart set to None. Annotation arrows point to the General configuration menu item and the Edit button.

    Figure 6 – Set AWS Lambda timeout and memory

  • Under Configuration, select Environment variables, and add the following keys:
    • WORKGROUP: your Amazon Redshift Serverless workgroup name.
    • NAMESPACE_NAME: the namespace the workgroup belongs to.
    • DATABASE: dev (or your target database).
    • BUCKET: the Amazon S3 bucket name you created earlier.
    • SECRET_ARN: the AWS Secrets Manager secret ARN you copied earlier.
    • ANALYZER_FN: redshift-performance-analyzer.

Package and create the analyzer

Repeat the same steps for the analyzer, using lambda/analyzer.py with a 15-minute timeout:

(cd lambda && zip -q ../build/analyzer.zip analyzer.py)

Use the Lambda console to create redshift-performance-analyzer with handler analyzer.lambda_handler, timeout 15 minutes, memory 256 MB, the same execution role, and these environment variables:

  • BUCKET: the same Amazon S3 bucket.
  • SNS_TOPIC: the SNS topic ARN.
  • MODEL_ID: us.anthropic.claude-sonnet-4-6.

The analyzer creates the Amazon Bedrock client with read_timeout=600 and max_tokens=16384 to handle large prompts and long responses. Anthropic Claude inference on a full telemetry payload typically takes 2–4 minutes.

How the signals and the prompt work

You don’t write any custom code for signal computation or prompt construction. Both computation and construction live in the repository.

The compute_signals() function in lambda/collector.py scans the telemetry for Boolean and threshold-based anti-patterns. At the table level, it looks for row skew, ghost rows, stale statistics, unsorted data, sub-optimal sort or distribution keys, and oversized VARCHAR columns. It also flags runtime and workload issues such as disk spill, small-insert bursts, high Data Definition Language (DDL) executions, and unoptimized COPY file size. Beyond that, it catches Amazon Redshift Spectrum queries that fail to prune partitions and data sharing materialized views doing full refresh. It also flags WLM configurations that lack Query Monitoring Rules (QMR), such as limits on blocks spilled to disk and query execution time. The full set of signals and thresholds is defined inline in the function. To tune a threshold or add a custom signal, edit this function and redeploy.

The build_prompt() function in lambda/analyzer.py constructs the Amazon Bedrock prompt in four sections. The first section lists the triggered signals. The second adds CloudWatch metrics, annotated with >> CORRELATION lines that pair each signal with its supporting metric. The third includes the filtered supporting data, limited to the table and query rows that triggered a signal. The fourth gives explicit instructions to return a pipe delimited text where every recommendation references specific table names, query IDs, and metric values. This structure is why the model produces targeted output rather than generic best-practice advice.

Schedule daily runs

Use the Amazon EventBridge console to trigger the collector every 24 hours.

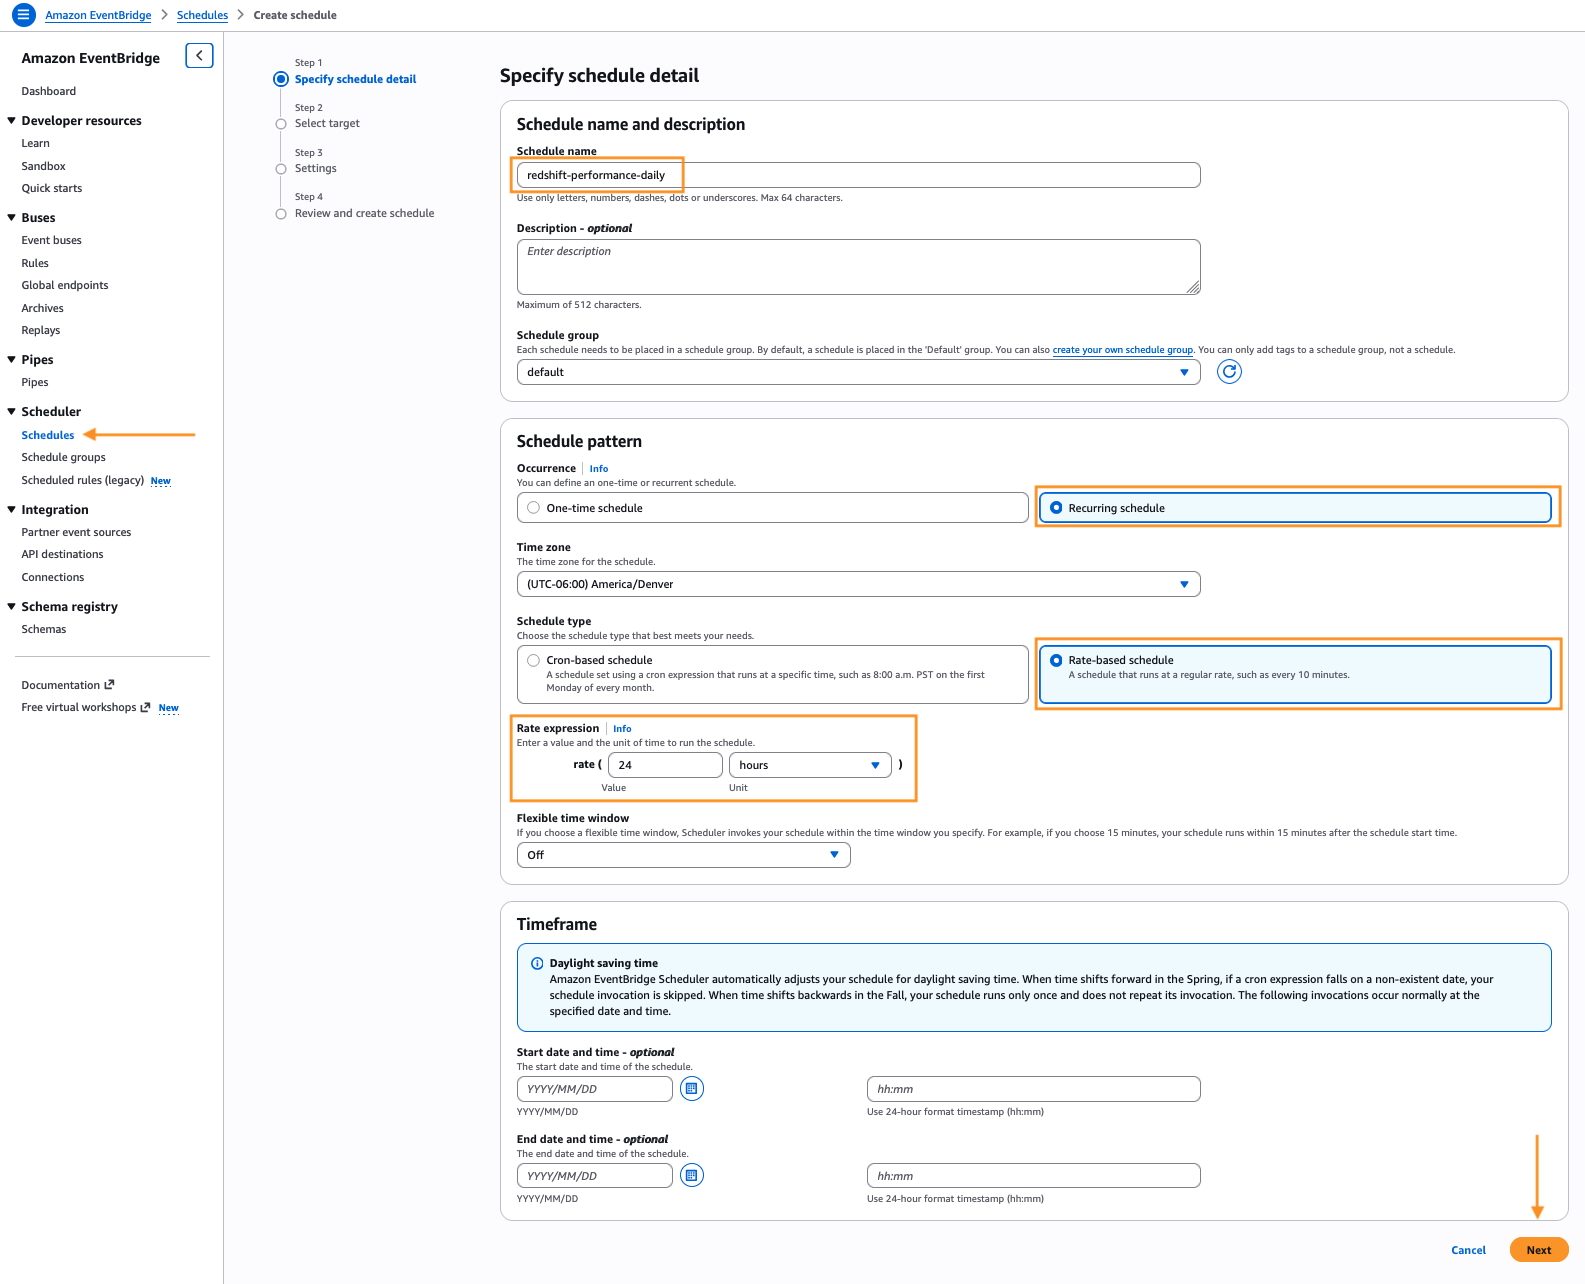
  • Open the EventBridge console and choose Schedules under Scheduler, Create schedule.
  • Enter the name redshift-performance-daily for Schedule name, toggle Recurring schedule and Rate-based schedule.
  • Under Rate expression, enter 24 and select hours.
  • For Flexible time window, choose Off, and select Next.
    Amazon EventBridge Scheduler “Create schedule” page, Step 1: Specify schedule detail. The schedule name is “redshift-performance-daily.” Under Schedule pattern, “Recurring schedule” and “Rate-based schedule” are selected, with a rate expression of 24 hours, and the time zone set to (UTC-06:00) America/Denver. Annotation highlights mark the Schedules nav item, the recurring/rate-based selections, the rate expression, and the Next button.

    Figure 7 – Create Amazon EventBridge schedule


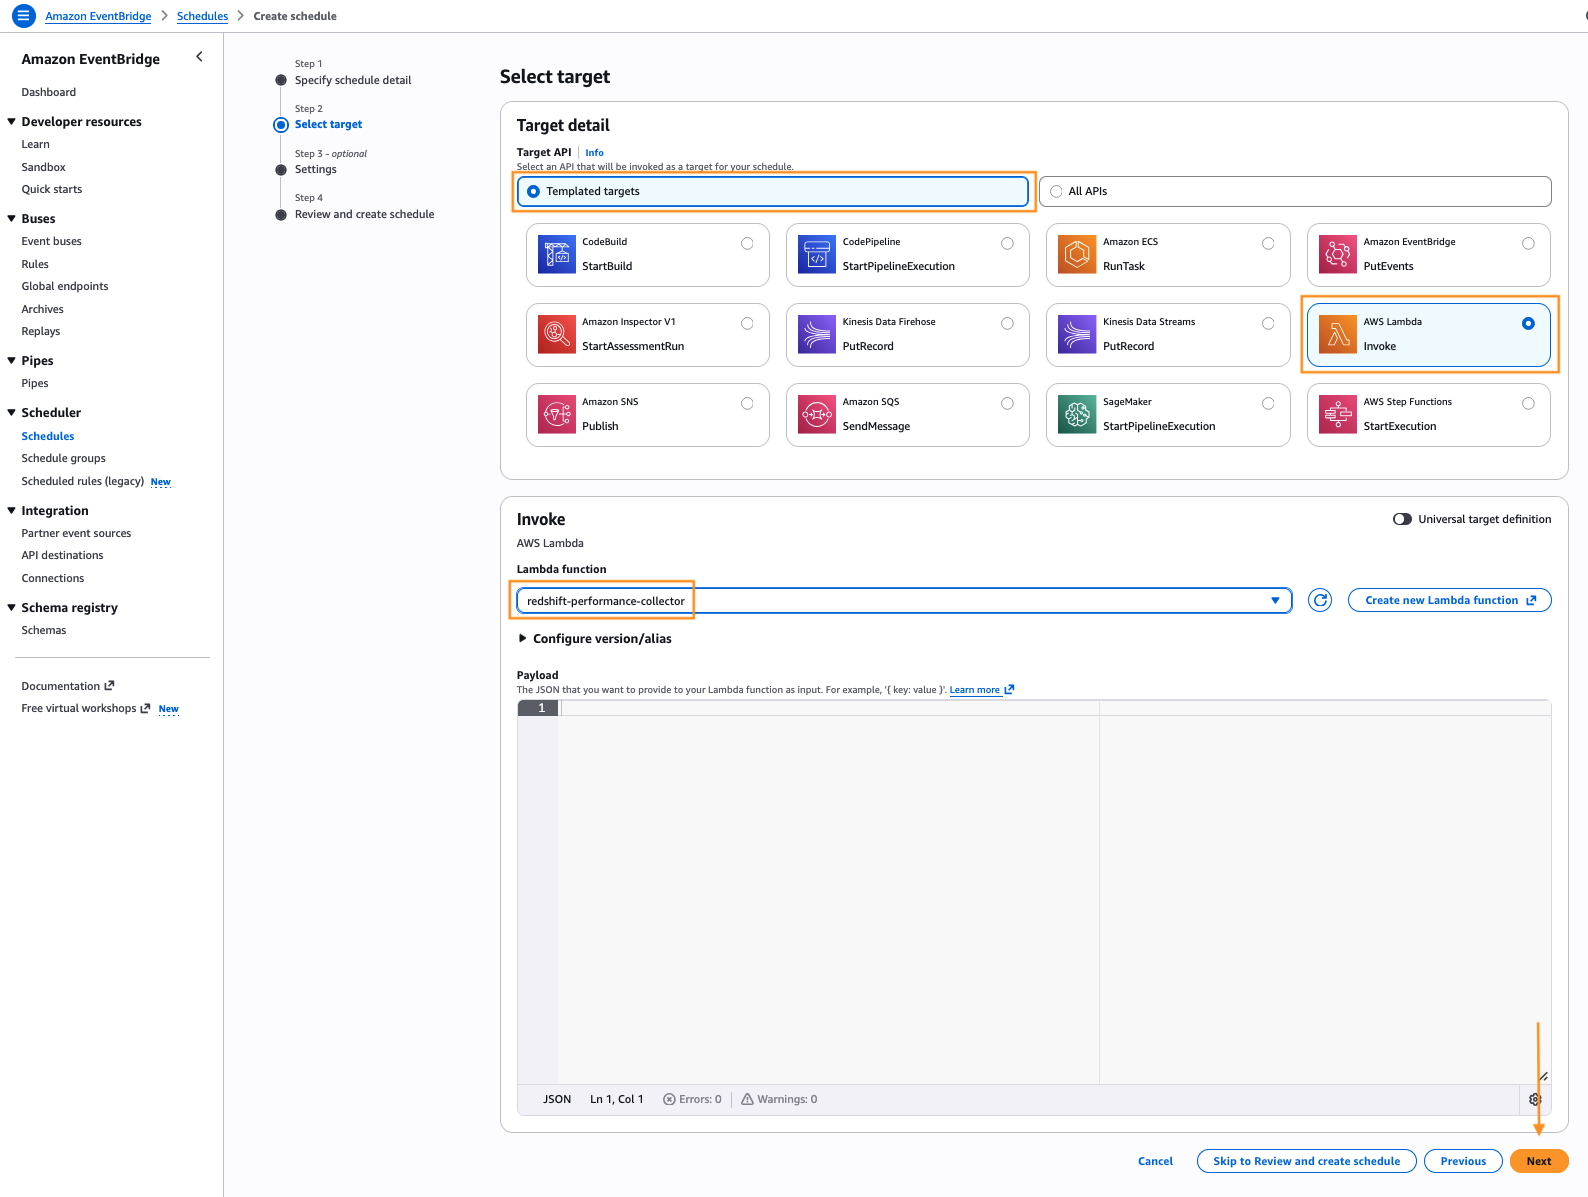
  • On the Select target page, choose AWS Lambda, select the redshift-performance-collector function, and choose Next.

    EventBridge Scheduler “Create schedule” page, Step 2: Select target. “Templated targets” is selected and the AWS Lambda “Invoke” target is chosen from the grid of target options. In the Invoke section, the Lambda function list is set to “redshift-performance-collector” with an empty JSON payload. Annotation highlights mark the Templated targets toggle, the AWS Lambda Invoke target, the selected function, and the Next button.

    Figure 8 – Select Amazon EventBridge schedule target

  • Accept the defaults for Settings and select Next. EventBridge automatically adds a resource-based permission on the Lambda function so the rule can invoke it.
  • Choose Create schedule.

Run it once and review the output

Invoke the collector manually to confirm the pipeline works end-to-end.

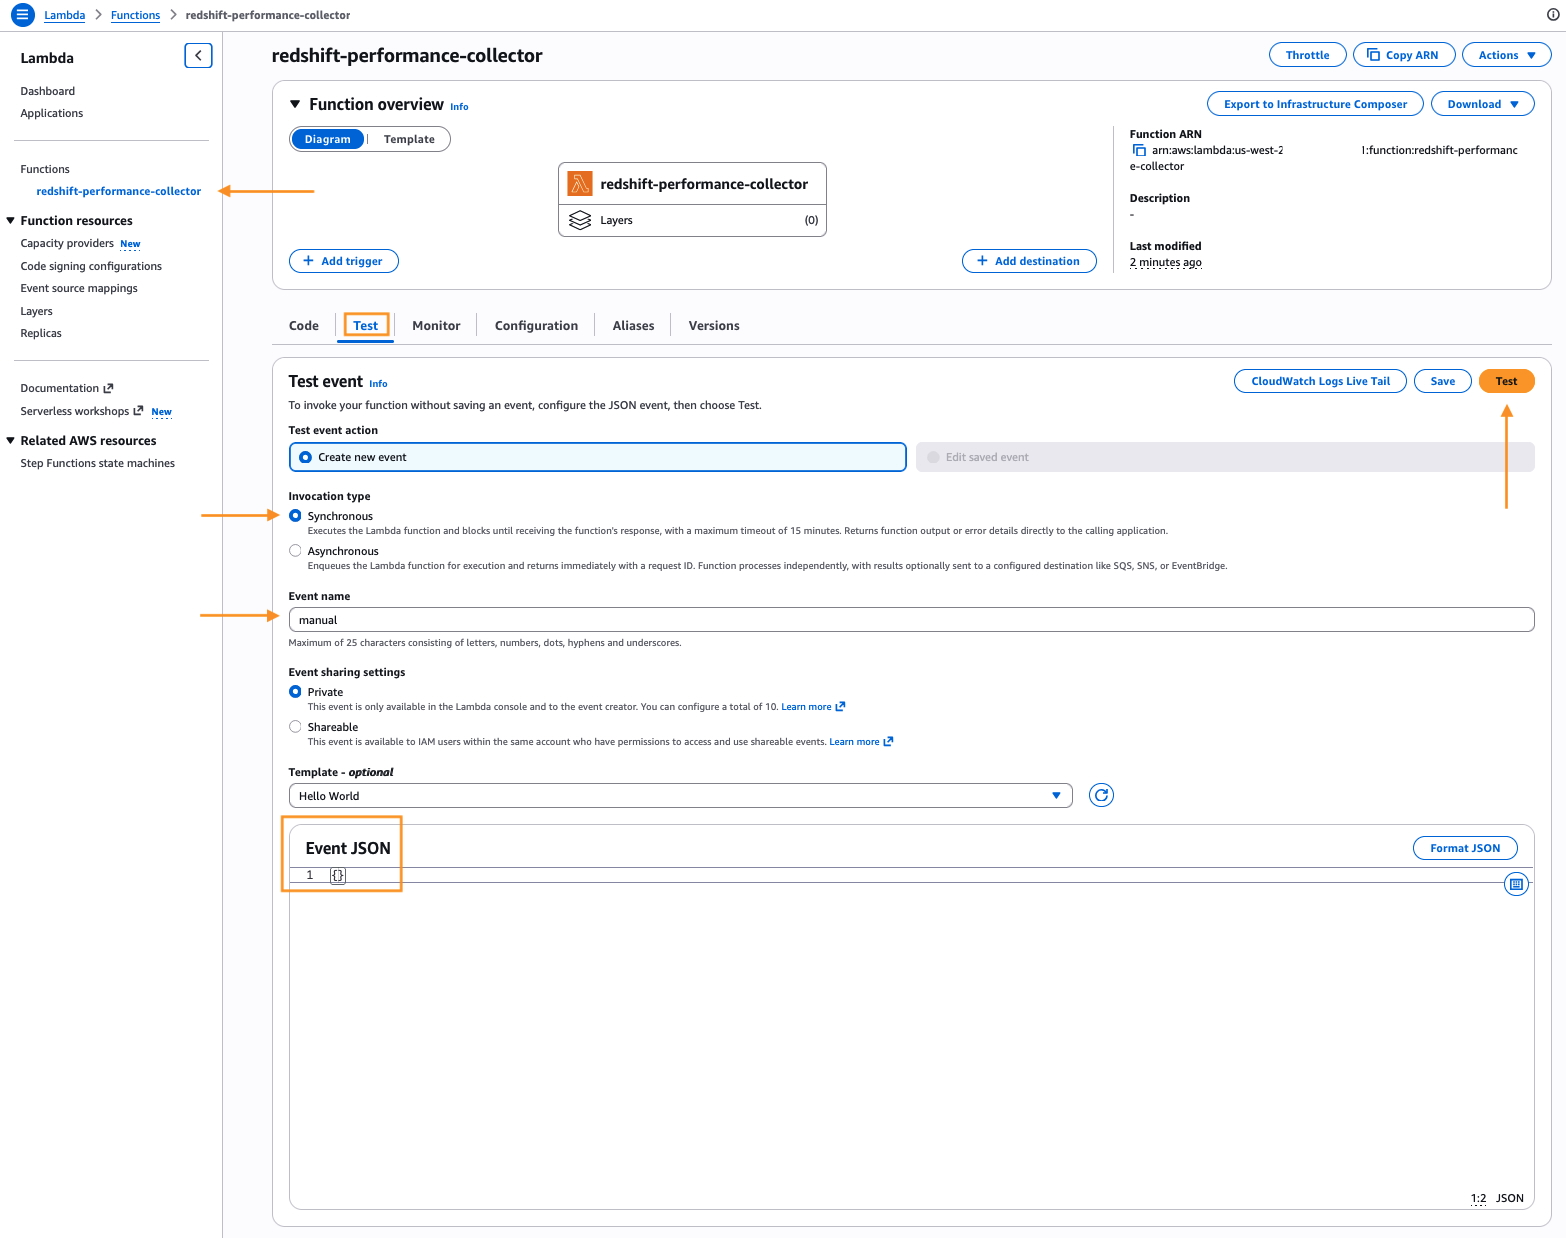
  • In the Lambda console, open the redshift-performance-collector function and choose Test. Create a test event named manual with the body {} and choose Test.

    Lambda console for “redshift-performance-collector,” Test tab. A new test event named “manual” is being configured with Invocation type set to Synchronous, event sharing set to Private, the “Hello World” template selected, and an empty {} Event JSON body. Annotation arrows point to the function in the left nav, the Synchronous option, the event name, the Event JSON field, and the Test button.

    Figure 9 – Test end-to-end workflow

  • The function completes in under a minute. Check the Monitor tab for the invocation log via the CloudWatch live logs link.
  • In the Amazon S3 console, open your bucket. Confirm that the telemetry/ prefix contains a JSON file with the current timestamp.
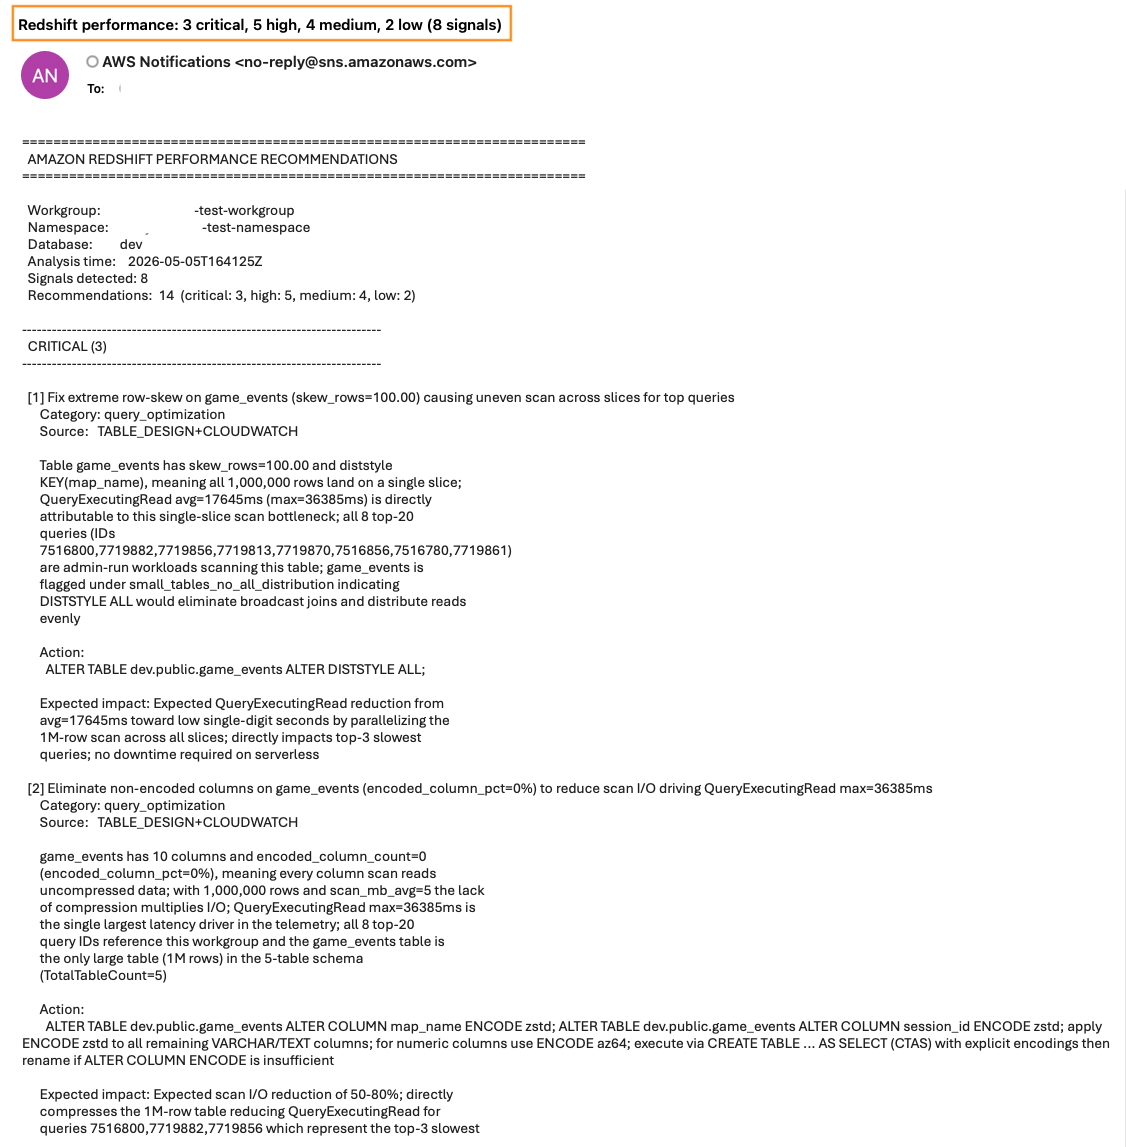
  • Within 2–4 minutes, the analyzer publishes a message to the SNS topic. Check the email address you subscribed for the summary with the top 10 recommendations. Confirm that the recommendations/ prefix in Amazon S3 contains the full JSON.

Each recommendation has a priority (critical, high, medium, low) and a category (query_optimization, table_design, capacity, wlm, maintenance, or ingestion). It also includes a signal_source that names the signals and CloudWatch metrics that triggered it, a plain-language explanation, a specific SQL or configuration action, and an expected impact estimate.

Email notification from AWS Notifications with the subject “Redshift performance: 3 critical, 5 high, 4 medium, 2 low (8 signals)” highlighted. The body is a plain-text “Amazon Redshift Performance Recommendations” report listing workgroup, namespace, database, analysis time, and 14 recommendations. Two critical items are shown for the game_events table: fixing extreme row-skew via DISTSTYLE ALL, and eliminating non-encoded columns with column compression, each with a category, source, explanation, SQL action, and expected impact.

Figure 10 – Sample analyzer emailed output

Best practices

  • Tune thresholds to your workload. The default thresholds in compute_signals() come from the Amazon Redshift operational review playbook. For high-velocity ingestion or small-cluster environments, consider lowering the small-insert threshold, widening the stale-statistics window, or adding custom signals for your own tables.
  • Keep the signal-to-metric correlations current. When you add a signal, also add a matching correlation in build_correlations(). The inline >> CORRELATION lines are what make the model connect an infrastructure metric to an application-level symptom.
  • Review recommendations before you act. The analyzer produces prioritized suggestions, but VACUUM, ANALYZE, and ALTER TABLE actions change table state. Read the explanation and action on each recommendation, validate the SQL against your schema, and run it during a maintenance window.

Cleaning up

To avoid ongoing charges, delete the resources you created for this solution:

  • The two AWS Lambda functions: redshift-performance-collector and redshift-performance-analyzer.
  • The Amazon EventBridge rule: redshift-performance-daily.
  • The Amazon SNS topic and its email subscription: redshift-performance-recommendations.
  • The Amazon S3 bucket, including the telemetry/ and recommendations/ objects.
  • The AWS Secrets Manager secret: redshift-performance-admin.
  • The IAM role and its inline policy: redshift-performance-recommendations-role.

Conclusion

You now have a daily performance review for Amazon Redshift Serverless that runs entirely on AWS Lambda, stores every run in Amazon S3, and delivers prioritized recommendations by email. The signal-based prompt pattern keeps the Amazon Bedrock cost low and the recommendations specific to your workload.

To learn more, see the following resources:


About the authors

Steve Phillips

Steve Phillips

Steve is a Principal Technical Account Manager and Analytics specialist at AWS in the North America region. Steve currently focuses on data warehouse architectural design, AI/ML data foundations, data lakes, data ingestion pipelines, and cloud distributed architectures.

Richard Raseley

Richard Raseley

Richard is a Senior Technical Account Manager in North America who works with Games customers. He is passionate about applying his background in automation, cloud computing, networking, and storage to help customers build AI solutions.

Upgrade Amazon EKS clusters with confidence using Kubernetes version rollbacks

Post Syndicated from Micah Walter original https://aws.amazon.com/blogs/aws/upgrade-amazon-eks-clusters-with-confidence-using-kubernetes-version-rollbacks/

Upgrading a Kubernetes control plane has long been a one way door. Open source Kubernetes doesn’t support control plane rollback, so once you upgrade, there’s no going back. The community is making real progress here, and KEP-4330 introduces emulated versions to ease rollback. But in practice this constraint has pushed organizations to build elaborate compensating mechanisms like bake periods, stagger groups, automated sign offs, and months long upgrade cycles. With Kubernetes releasing three minor versions per year, teams managing hundreds of clusters, especially in regulated environments, often delay upgrades entirely because they aren’t confident they can recover if something goes wrong. The result is clusters stuck on older versions, missing security patches, and eventually running up against extended support timelines.

Today, we’re announcing Kubernetes version rollbacks for Amazon Elastic Kubernetes Service (Amazon EKS), a new feature that gives cluster administrators a safety net when performing cluster upgrades. With version rollbacks, you can reverse a Kubernetes version upgrade within seven days if you encounter issues after upgrading, returning your cluster to its previous working state.

Where approaches like emulated versions keep a cluster in a transitional holding state, EKS version rollback returns your cluster to a fully validated previous version that ran in production, not an emulation of it. Now, if you upgrade a cluster from, say, Kubernetes 1.34 to 1.35 and discover a compatibility issue, you can roll back to 1.34 within seven days. There’s no need to rebuild your cluster or scramble to troubleshoot under pressure. Think of it as an undo button for Kubernetes version upgrades.

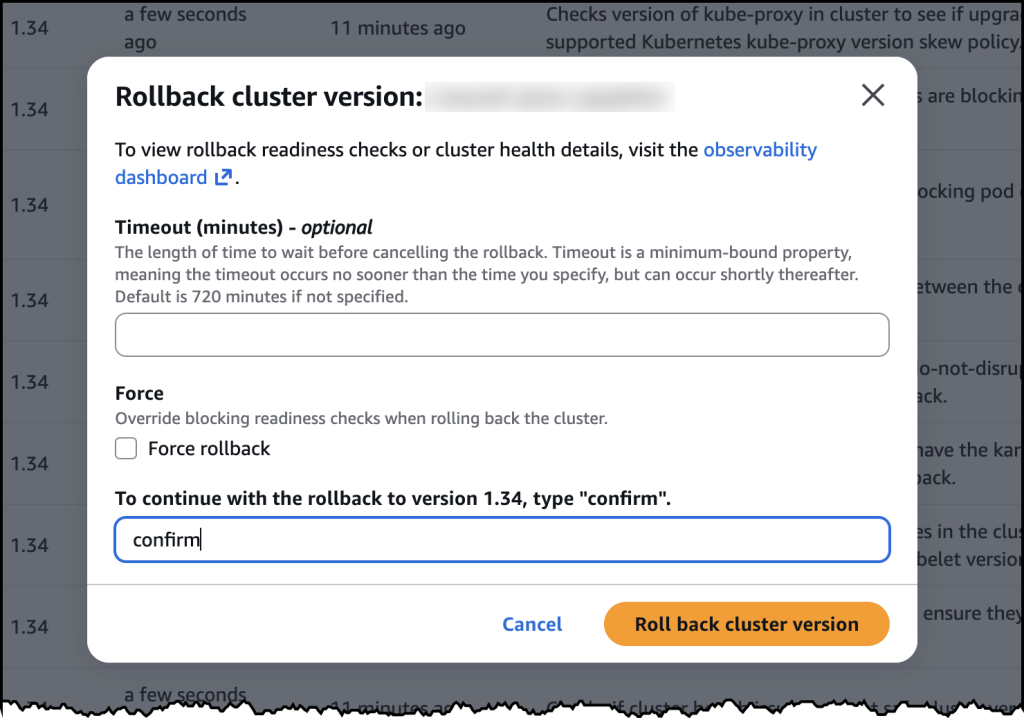
The feature supports rolling back one minor version at a time, matching the same incremental approach EKS uses for upgrades. And to help you roll back safely, EKS automatically evaluates your cluster’s rollback readiness through cluster insights, flagging items like node version compatibility or add-on dependencies before you proceed. If you’ve already assessed the situation and want to move quickly, you can use the --force flag to bypass those checks. The above applies to all EKS clusters, whether you manage your own nodes or let AWS handle them. But for customers who have embraced fully managed infrastructure, rollback goes a step further.

Rollback for EKS Auto Mode
EKS Auto Mode gives you one click deployment of production ready Kubernetes clusters, automating compute, networking, and storage management so you can focus on your applications rather than infrastructure. EKS Auto Mode introduces additional considerations for version rollbacks because both the control plane and managed nodes need to be rolled back together. Since node rollbacks respect your pod disruption budgets, the process can take time depending on your configuration.

To give you control over this process, we’ve introduced a cancel API that lets you stop a node rollback at any point. If you decide the rollback is taking too long or you want to change your approach, you can cancel and adjust your disruption budgets to accelerate things, or choose a different path forward.

By default, EKS never bypasses your disruption budgets during a rollback because we prioritize workload stability. You can always choose to modify or remove disruption budgets yourself to speed up the process if needed.

Let’s try it out
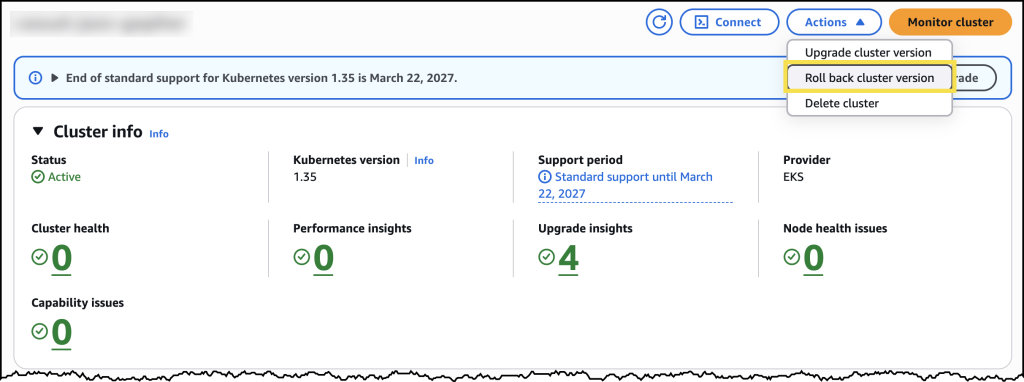
To try version rollbacks, I navigated to the Amazon EKS console and selected one of my clusters that I had recently upgraded.

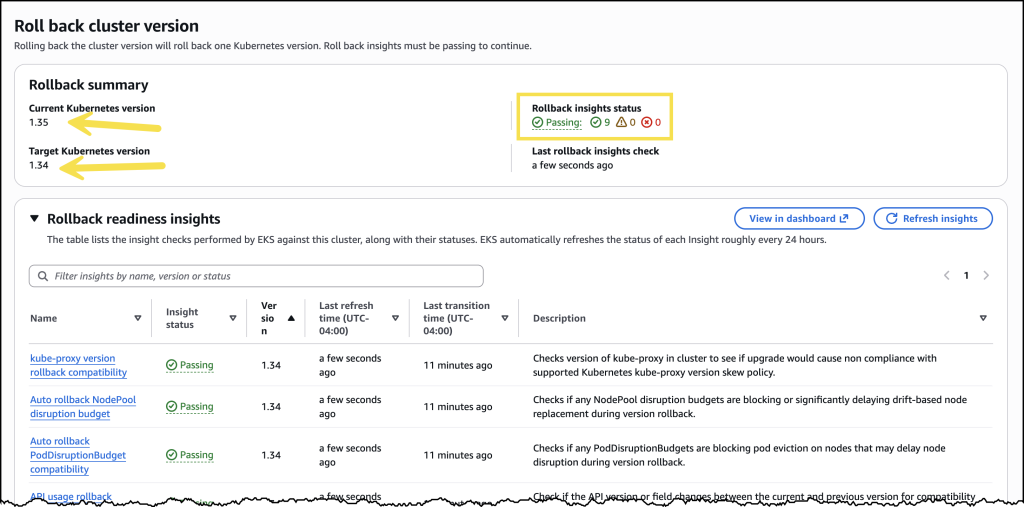
From the cluster’s configuration page, I can see the option to initiate a version rollback, along with information about my current rollback window.

Before initiating the rollback, I reviewed the rollback insights to check for any potential issues. The insights showed me the status of my nodes and flagged anything I should address before proceeding.

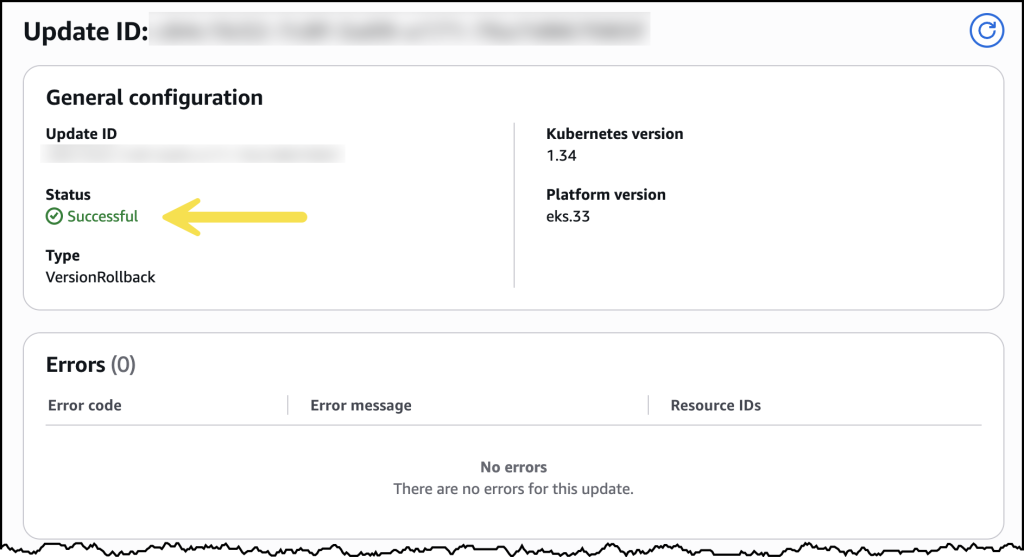
After confirming, the rollback began. My cluster remained functional throughout the process. The control plane rollback took about 20 minutes, similar to a standard upgrade. For my EKS Auto Mode cluster, the nodes rolled back gracefully according to my disruption budget settings.

Once complete, my cluster was back on the previous Kubernetes version, running as expected.

Now available
Kubernetes version rollbacks for Amazon EKS are available today at no additional cost in all commercial AWS Regions where Amazon EKS is available. You pay only for the standard EKS and compute costs you would normally incur. There are no extra charges for using the rollback capability.

Control plane rollbacks are available for all EKS clusters, and node rollbacks are available for clusters running EKS Auto Mode. Version rollbacks support clusters running Kubernetes versions available in EKS standard support and extended support.

To get started, visit the Amazon EKS documentation or try it out directly in the Amazon EKS console.

[$] Efficient access to local storage for BPF programs

Post Syndicated from daroc original https://lwn.net/Articles/1078968/

When a BPF program is used to filter or redirect packets in the networking
subsystem, the program will often want to associate data with each packet as it
moves through the kernel. The kernel’s

local BPF storage API
, which
associates extra data with some kernel objects, provides a way to do that. (See also
the BPF map types that end
in STORAGE.)
Amery Hung and Jakub Sitnicki led two sessions
at the 2026

Linux Storage, Filesystem, Memory-Management, and BPF Summit

about how to make accesses to local storage data more efficient. Hung spoke
about general performance problems related to locking, while Sitnicki examined
the use of local storage in the networking subsystem in particular.

The collective thoughts of the interwebz