This post demonstrates how to create, publish, and download private npm packages using AWS CodeArtifact, allowing you to share code across your organization without exposing your packages to the public.
The ability to control CodeArtifact repository access using AWS Identity and Access Management (IAM) removes the need to manage additional credentials for a private npm repository when developers already have IAM roles configured.
You can use private npm packages for a variety of use cases, such as:
In this post, you create a private scoped npm package containing a sample function that can be used across your organization. You create a second project to download the npm package. You also learn how to structure your npm package to make logging in to CodeArtifact automatic when you want to build or publish the package.
The code covered in this post is available on GitHub:
You can create your npm package in three easy steps: set up the project, create your npm script for authenticating with CodeArtifact, and publish the package.
Setting up your project
Create a directory for your new npm package. We name this directory my-package because it serves as the name of the package. We use an npm scope for this package, where @myorg represents the scope all of our organization’s packages are published under. This helps us distinguish our internal private package from external packages. See the following code:
Running this script updates your npm configuration to use your CodeArtifact repository and sets your authentication token, which expires after 12 hours.
To test our new script, enter the following command:
npm run co:login
The following code is the output:
> aws codeartifact login --tool npm --repository my-repo --domain my-domain
Successfully configured npm to use AWS CodeArtifact repository https://my-domain-<ACCOUNT ID>.d.codeartifact.us-east-1.amazonaws.com/npm/my-repo/
Login expires in 12 hours at 2020-09-04 02:16:17-04:00
Add a prepare script to our package.json to run our login command:
This configures our project to automatically authenticate and generate an access token anytime npm install or npm publish run on the project.
If you see an error containing Invalid choice, valid choices are:, you need to update the AWS CLI according to the versions listed in the perquisites of this post.
Publishing your package
To publish our new package for the first time, run npm publish.
The following screenshot shows the output.
If we navigate to our CodeArtifact repository on the CodeArtifact console, we now see our new private npm package ready to be downloaded.
Installing your private npm package
To install your private npm package, you first set up the project and add the CodeArtifact configs. After you install your package, it’s ready to use.
Setting up your project
Create a directory for a new application and name it my-app. This is a sample project to download our private npm package published in the previous step. You can apply this pattern to all repositories you intend on installing your organization’s npm packages in.
npm init -y
{
"name": "my-app",
"version": "1.0.0",
"description": "A sample application consuming a private scoped npm package",
"main": "index.js",
"scripts": {
"test": "echo \"Error: no test specified\" && exit 1"
}
}
Adding CodeArtifact configs
Copy the npm scripts prepare and co:login created earlier to your new project:
{
"name": "my-app",
"version": "1.0.0",
"description": "A sample application consuming a private scoped npm package",
"main": "index.js",
"scripts": {
"prepare": "npm run co:login",
"co:login": "aws codeartifact login --tool npm --repository my-repo --domain my-domain",
"test": "echo \"Error: no test specified\" && exit 1"
}
}
Installing your new private npm package
Enter the following command:
npm install @myorg/my-package
Your package.json should now list @myorg/my-package in your dependencies:
Remove the changes made to your user profile’s npm configuration by running npm config delete registry, this will remove the CodeArtifact repository from being set as your default npm registry.
Conclusion
In this post, you successfully published a private scoped npm package stored in CodeArtifact, which you can reuse across multiple teams and projects within your organization. You can use npm scripts to streamline the authentication process and apply this pattern to save time.
About the Author
Ryan Sonshine is a Cloud Application Architect at Amazon Web Services. He works with customers to drive digital transformations while helping them architect, automate, and re-engineer solutions to fully leverage the AWS Cloud.
In this two-part blog series, I show how serverlessland.com is built. This is a static website that brings together all the latest blogs, videos, and training for AWS serverless. It automatically aggregates content from a number of sources. The content exists in a static JSON file, which generates a new static site each time it is updated. The result is a low-maintenance, low-latency serverless website, with almost limitless scalability.
A companion blog post explains how to build an automated content aggregation workflow to create and update the site’s content. In this post, you learn how to build a static website with an automated deployment pipeline that re-builds on each GitHub commit. The site content is stored in JSON files in the same repository as the code base. The example code can be found in this GitHub repository.
The growing adoption of serverless technologies generates increasing amounts of helpful and insightful content from the developer community. This content can be difficult to discover. Serverless Land helps channel this into a single searchable location. By collating this into a static website, users can enjoy a browsing experience with fast page load speeds.
The serverless nature of the site means that developers don’t need to manage infrastructure or scalability. The use of AWS Amplify Console to automatically deploy directly from GitHub enables a regular release cadence with a fast transition from prototype to production.
Static websites
A static site is served to the user’s web browser exactly as stored. This contrasts to dynamic webpages, which are generated by a web application. Static websites often provide improved performance for end users and have fewer or no dependant systems, such as databases or application servers. They may also be more cost-effective and secure than dynamic websites by using cloud storage, instead of a hosted environment.
A static site generator is a tool that generates a static website from a website’s configuration and content. Content can come from a headless content management system, through a REST API, or from data referenced within the website’s file system. The output of a static site generator is a set of static files that form the website.
Serverless Land uses a static site generator for Vue.js called Nuxt.js. Each time content is updated, Nuxt.js regenerates the static site, building the HTML for each page route and storing it in a file.
The architecture
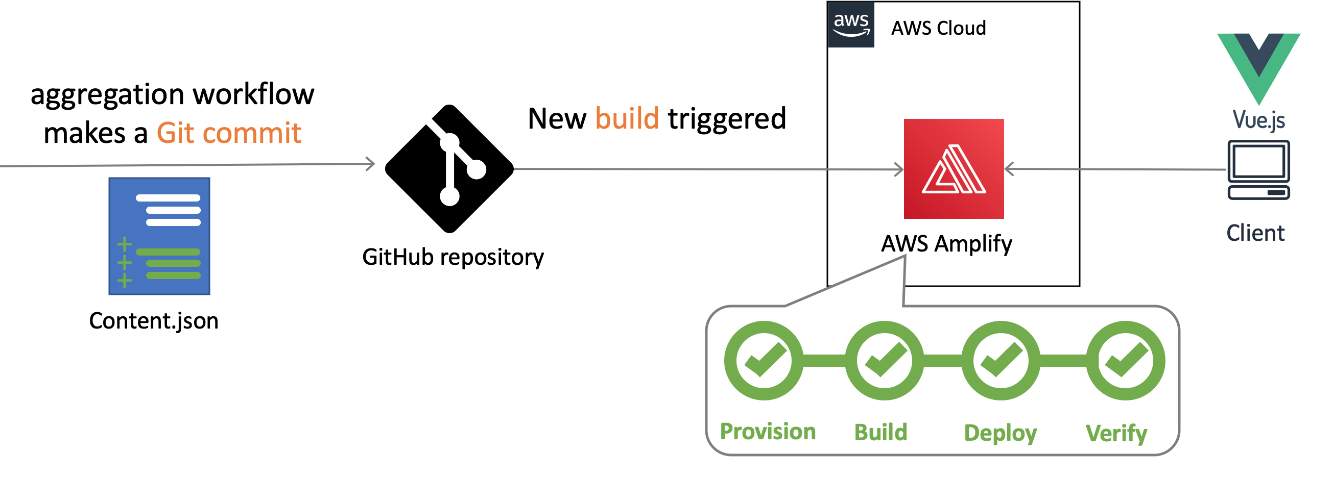
Serverless Land static website architecture
When the content.json file is committed to GitHub, a new build process is triggered in AWS Amplify Console.
Deploying AWS Amplify
AWS Amplify helps developers to build secure and scalable full stack cloud applications. AWS Amplify Console is a tool within Amplify that provides a user interface with a git-based workflow for hosting static sites. Deploy applications by connecting to an existing repository (GitHub, BitBucket Cloud, GitLab, and AWS CodeCommit) to set up a fully managed, nearly continuous deployment pipeline.
This means that any changes committed to the repository trigger the pipeline to build, test, and deploy the changes to the target environment. It also provides instant content delivery network (CDN) cache invalidation, atomic deploys, password protection, and redirects without the need to manage any servers.
Building the static website
To get started, use the Nuxt.js scaffolding tool to deploy a boiler plate application. Make sure you have npx installed (npx is shipped by default with npm version 5.2.0 and above).
$ npx create-nuxt-app content-aggregator
The scaffolding tool asks some questions, answer as follows:Nuxt.js scaffolding tool inputs
Navigate to the project directory and launch it with:
$ cd content-aggregator
$ npm run dev
The application is now running on http://localhost:3000.The pages directory contains your application views and routes. Nuxt.js reads the .vue files inside this directory and automatically creates the router configuration.
Create a new file in the /pages directory named blogs.vue:$ touch pages/blogs.vue
Copy the contents of this file into pages/blogs.vue.
Create a new file in /components directory named Post.vue :$ touch components/Post.vue
Copy the contents of this file into components/Post.vue.
Create a new file in /assets named content.json and copy the contents of this file into it.$ touch /assets/content.json
The blogs Vue component
The blogs page is a Vue component with some special attributes and functions added to make development of your application easier. The following code imports the content.json file into the variable blogPosts. This file stores the static website’s array of aggregated blog post content.
import blogPosts from '../assets/content.json'
An array named blogPosts is initialized:
data(){
return{
blogPosts: []
}
},
The array is then loaded with the contents of content.json.
mounted(){
this.blogPosts = blogPosts
},
In the component template, the v-for directive renders a list of post items based on the blogPosts array. It requires a special syntax in the form of blog in blogPosts, where blogPosts is the source data array and blog is an alias for the array element being iterated on. The Post component is rendered for each iteration. Since components have isolated scopes of their own, a :postprop is used to pass the iterated data into the Post component:
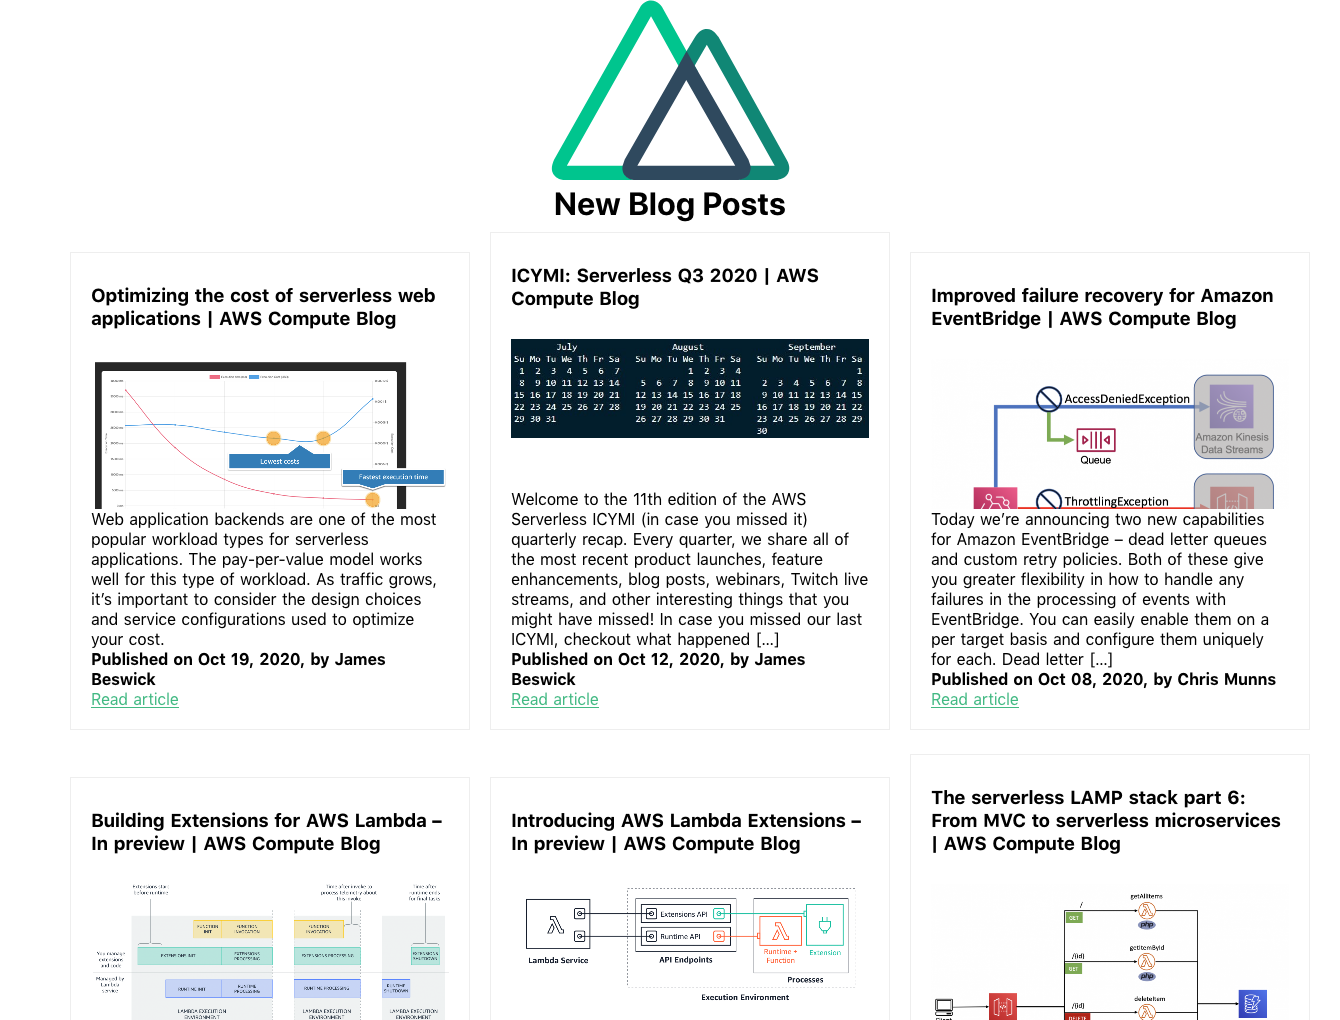
This forms the framework for the static website. The /blogs page displays content from /assets/content.json via the Post component. To view this, go to http://localhost:3000/blogs in your browser:
The /blogs page
Add a new item to the content.json file and rebuild the static website to display new posts on the blogs page. The previous content was generated using the aggregation workflow explained in this companion blog post.
Connect to Amplify Console
Clone the web application to a GitHub repository and connect it to Amplify Console to automate the rebuild and deployment process:
In the AWS Management Console, go to the Amplify Console and choose Connect app.
Choose GitHub then Continue.
Authorize to your GitHub account, then in the Recently updated repositories drop-down select the ‘content-aggregator’ repository.
In the Branch field, leave the default as master and choose Next.
In the Build and test settings choose edit.
Replace - npm run build with – npm run generate.
Replace baseDirectory: / with baseDirectory: dist This runs the nuxt generate command each time an application build process is triggered. The nuxt.config.js file has a target property with the value of static set. This generates the web application into static files. Nuxt.js creates a dist directory with everything inside ready to be deployed on a static hosting service.
Choose Save then Next.
Review the Repository details and App settings are correct. Choose Save and deploy.
Amplify Console deployment
Once the deployment process has completed and is verified, choose the URL generated by Amplify Console. Append /blogs to the URL, to see the static website blogs page.
Any edits pushed to the repository’s content.json file trigger a new deployment in Amplify Console that regenerates the static website. This companion blog post explains how to set up an automated content aggregator to add new items to the content.json file from an RSS feed.
Conclusion
This blog post shows how to create a static website with vue.js using the nuxt.js static site generator. The site’s content is generated from a single JSON file, stored in the site’s assets directory. It is automatically deployed and re-generated by Amplify Console each time a new commit is pushed to the GitHub repository. By automating updates to the content.json file you can create low-maintenance, low-latency static websites with almost limitless scalability.
This application framework is used together with this automated content aggregator to pull together articles for http://serverlessland.com. Serverless Land brings together all the latest blogs, videos, and training for AWS Serverless. Download the code from this GitHub repository to start building your own automated content aggregation platform.
The AWS Cloud Development Kit (AWS CDK) is an open-source software development framework to model and provision your cloud application resources using familiar programming languages.
In this post, we dive deeper into how you can perform these build commands as part of your AWS CDK build process by using the native AWS CDK bundling functionality.
If you’re working with Python, TypeScript, or JavaScript-based Lambda functions, you may already be familiar with the PythonFunction and NodejsFunction constructs, which use the bundling functionality. This post describes how to write your own bundling logic for instances where a higher-level construct either doesn’t already exist or doesn’t meet your needs. To illustrate this, I walk through two different examples: a Lambda function written in Golang and a static site created with Nuxt.js.
Concepts
A typical CI/CD pipeline contains steps to build and compile your source code, bundle it into a deployable artifact, push it to artifact stores, and deploy to an environment. In this post, we focus on the building, compiling, and bundling stages of the pipeline.
The AWS CDK has the concept of bundling source code into a deployable artifact. As of this writing, this works for two main types of assets: Docker images published to Amazon Elastic Container Registry (Amazon ECR) and files published to Amazon Simple Storage Service (Amazon S3). For files published to Amazon S3, this can be as simple as pointing to a local file or directory, which the AWS CDK uploads to Amazon S3 for you.
When you build an AWS CDK application (by running cdk synth), a cloud assembly is produced. The cloud assembly consists of a set of files and directories that define your deployable AWS CDK application. In the context of the AWS CDK, it might include the following:
To create a Golang-based Lambda function, you must first create a Lambda function deployment package. For Go, this consists of a .zip file containing a Go executable. Because we don’t commit the Go executable to our source repository, our CI/CD pipeline must perform the necessary steps to create it.
In the context of the AWS CDK, when we create a Lambda function, we have to tell the AWS CDK where to find the deployment package. See the following code:
In the preceding code, the lambda.Code.fromAsset() method tells the AWS CDK where to find the Golang executable. When we run cdk synth, it stages this Go executable in the cloud assembly, which it zips and publishes to Amazon S3 as part of the PublishAssets stage.
If we’re running the AWS CDK as part of a CI/CD pipeline, this executable doesn’t exist yet, so how do we create it? One method is CDK bundling. The lambda.Code.fromAsset() method takes a second optional argument, AssetOptions, which contains the bundling parameter. With this bundling parameter, we can tell the AWS CDK to perform steps prior to staging the files in the cloud assembly.
Breaking down the BundlingOptions parameter further, we can perform the build inside a Docker container or locally.
Building inside a Docker container
For this to work, we need to make sure that we have Docker running on our build machine. In AWS CodeBuild, this means setting privileged: true. See the following code:
image (required) – The Docker image to perform the build commands in
command (optional) – The command to run within the container
The AWS CDK mounts the folder specified as the first argument to fromAsset at /asset-input inside the container, and mounts the asset output directory (where the cloud assembly is staged) at /asset-output inside the container.
After we perform the build commands, we need to make sure we copy the Golang executable to the /asset-output location (or specify it as the build output location like in the preceding example).
This is the equivalent of running something like the following code:
docker run \
--rm \
-v folder-containing-source-code:/asset-input \
-v cdk.out/asset.1234a4b5/:/asset-output \
lambci/lambda:build-go1.x \
bash -c 'GOOS=linux go build -o /asset-output/main'
Building locally
To build locally (not in a Docker container), we have to provide the local parameter. See the following code:
The local parameter must implement the ILocalBundling interface. The tryBundle method is passed the asset output directory, and expects you to return a boolean (true or false). If you return true, the AWS CDK doesn’t try to perform Docker bundling. If you return false, it falls back to Docker bundling. Just like with Docker bundling, you must make sure that you place the Go executable in the outputDir.
Typically, you should perform some validation steps to ensure that you have the required dependencies installed locally to perform the build. This could be checking to see if you have go installed, or checking a specific version of go. This can be useful if you don’t have control over what type of build environment this might run in (for example, if you’re building a construct to be consumed by others).
If we run cdk synth on this, we see a new message telling us that the AWS CDK is bundling the asset. If we include additional commands like go test, we also see the output of those commands. This is especially useful if you wanted to fail a build if tests failed. See the following code:
$ cdk synth
Bundling asset GolangLambdaStack/MyGoFunction/Code/Stage...
✓ . (9ms)
✓ clients (5ms)
DONE 8 tests in 11.476s
✓ clients (5ms) (coverage: 84.6% of statements)
✓ . (6ms) (coverage: 78.4% of statements)
DONE 8 tests in 2.464s
Cloud Assembly
If we look at the cloud assembly that was generated (located at cdk.out), we see something like the following code:
$ cdk synth
Bundling asset GolangLambdaStack/MyGoFunction/Code/Stage...
✓ . (9ms)
✓ clients (5ms)
DONE 8 tests in 11.476s
✓ clients (5ms) (coverage: 84.6% of statements)
✓ . (6ms) (coverage: 78.4% of statements)
DONE 8 tests in 2.464s
It contains our GolangLambdaStack CloudFormation template that defines our Lambda function, as well as our Golang executable, bundled at asset.01cf34ff646d380829dc4f2f6fc93995b13277bde7db81c24ac8500a83a06952/main.
Let’s look at how the AWS CDK uses this information. The GolangLambdaStack.assets.json file contains all the information necessary for the AWS CDK to know where and how to publish our assets (in this use case, our Golang Lambda executable). See the following code:
The file contains information about where to find the source files (source.path) and what type of packaging (source.packaging). It also tells the AWS CDK where to publish this .zip file (bucketName and objectKey) and what AWS Identity and Access Management (IAM) role to use (assumeRoleArn). In this use case, we only deploy to a single account and Region, but if you have multiple accounts or Regions, you see multiple destinations in this file.
The GolangLambdaStack.template.json file that defines our Lambda resource looks something like the following code:
The S3Bucket and S3Key match the bucketName and objectKey from the assets.json file. By default, the S3Key is generated by calculating a hash of the folder location that you pass to lambda.Code.fromAsset(), (for this post, folder-containing-source-code). This means that any time we update our source code, this calculated hash changes and a new Lambda function deployment is triggered.
Nuxt.js static site
In this section, I walk through building a static site using the Nuxt.js framework. You can apply the same logic to any static site framework that requires you to run a build step prior to deploying.
To deploy this static site, we use the BucketDeployment construct. This is a construct that allows you to populate an S3 bucket with the contents of .zip files from other S3 buckets or from a local disk.
Typically, we simply tell the BucketDeployment construct where to find the files that it needs to deploy to the S3 bucket. See the following code:
To deploy a static site built with a framework like Nuxt.js, we need to first run a build step to compile the site into something that can be deployed. For Nuxt.js, we run the following two commands:
yarn install – Installs all our dependencies
yarn generate – Builds the application and generates every route as an HTML file (used for static hosting)
This creates a dist directory, which you can deploy to Amazon S3.
Just like with the Golang Lambda example, we can perform these steps as part of the AWS CDK through either local or Docker bundling.
Building inside a Docker container
To build inside a Docker container, use the following code:
For this post, we build inside the publicly available node:lts image hosted on DockerHub. Inside the container, we run our build commands yarn install && yarn generate, and copy the generated dist directory to our output directory (the cloud assembly).
The parameters are the same as described in the Golang example we walked through earlier.
Building locally works the same as the Golang example we walked through earlier, with one exception. We have one additional command to run that copies the generated dist folder to our output directory (cloud assembly).
Conclusion
This post showed how you can easily compile your backend and front-end applications using the AWS CDK. You can find the example code for this post in this GitHub repo. If you have any questions or comments, please comment on the GitHub repo. If you have any additional examples you want to add, we encourage you to create a Pull Request with your example!
Our code also contains examples of deploying the applications using CDK Pipelines, so if you’re interested in deploying the example yourself, check out the example repo.
About the author
Cory Hall
Cory is a Solutions Architect at Amazon Web Services with a passion for DevOps and is based in Charlotte, NC. Cory works with enterprise AWS customers to help them design, deploy, and scale applications to achieve their business goals.
If you’re managing a broker on premises or in the cloud with a dependent existing infrastructure, Amazon MQ can provide easily deployed, managed ActiveMQ brokers. These support a variety of messaging protocols that can offload operational overhead. That can be useful when deploying a serverless application that communicates with one or more external applications that also communicate with each other.
This post walks through deploying a serverless backend and an Amazon MQ broker in one step using the AWS Serverless Application Model (AWS SAM). It shows you how to publish to a topic using AWS Lambda and then how to create a client application to consume messages from the topic, using a supported protocol. As a result, the AWS services and features supported by AWS Lambda can now be delivered to an external application connected to an Amazon MQ broker using STOMP, AMQP, MQTT, OpenWire, or WSS.
Although many protocols are supported by Amazon MQ, this walkthrough focuses on one. MQTT is a lightweight publish–subscribe messaging protocol. It is built to work in a small code footprint and is one of the most well-supported messaging protocols across programming languages. The protocol also introduced quality of service (QoS) to ensure message delivery when a device goes offline. Using QoS features, you can limit failure states in an interdependent network of applications.
To simplify this configuration, I’ve provided an AWS Serverless Application Repository application that deploys AWS resources using AWS CloudFormation. Two resources are deployed, a single instance Amazon MQ broker and a Lambda function. The Lambda function uses Node.js and an MQTT library to act as a producer and publish to a message topic on the Amazon MQ broker. A provided sample Node.js client app can act as an MQTT client and subscribe to the topic to receive messages.
Prerequisites
The following resources are required to complete the walkthrough:
These are the credentials for the Amazon MQ broker. The admin credentials are assigned to environment variables used by the Lambda function to publish messages to the Amazon MQ broker. The client credentials are used in the Node.js client application.
Choose Deploy.
Creation can take up to 10 minutes. When completed, proceed to the next section.
Run a Node.js MQTT client application
The Amazon MQ broker supports OpenWire, AMQP, STOMP, MQTT, and WSS connections. This allows any supported programming language to publish and consume messages from an Amazon MQ queue or topic.
To demonstrate this, you can deploy the sample Node.js MQTT client application included in the GitHub project for the AWS Serverless Application Repository app. The client credentials created in the previous section are used here.
Open a terminal application and change to the client-app directory in the GitHub project folder by running the following command: cd ~/some-project-path/aws-sar-lambda-publish-amazonmq/client-app
Install the Node.js dependencies for the client application: npm install
The app requires a WSS endpoint to create an Amazon MQ broker MQTT WebSocket connection. This can be found on the broker page in the Amazon MQ console, under Connections.
The node app takes four arguments separated by spaces. Provide the user name and password of the client created on deployment, followed by the WSS endpoint and a topic, some/topic. node app.js "username" "password" "wss://endpoint:port" "some/topic"
After connected prints in the terminal, leave this app running, and proceed to the next section.
There are three important components run by this code to subscribe and receive messages:
Connecting to the MQTT broker.
Subscribing to the topic on a successful connection.
Creating a handler for any message events.
The following code example shows connecting to the MQTT broker.
const args = process.argv.slice(2)
let options = {
username: args[0],
password: args[1],
clientId: 'mqttLambda_' + uuidv1()
}
let mqEndpoint = args[2]
let topic = args[3]
let client = mqtt.connect( mqEndpoint, options)
The following code example shows subscribing to the topic on a successful connection.
// When connected, subscribe to the topic
client.on('connect', function() {
console.log("connected")
client.subscribe(topic, function (err) {
if(err) console.log(err)
})
})
The following code example shows creating a handler for any message events.
// Log messages
client.on('message', function (topic, message) {
console.log(`message received on ${topic}: ${message.toString()}`)
})
Send a test message from an AWS Lambda function
Now that the Amazon MQ broker, PublishMessage Lambda function, and the Node.js client application are running, you can test consuming messages from a serverless application.
In the Lambda console, select the newly created PublishMessage Lambda function. Its name begins with the name given to the AWS Serverless Application Repository application on deployment.
Choose Test.
Give the new test event a name, and optionally modify the message. Choose Create.
Choose Test to invoke the Lambda function with the test event.
If the execution is successful, the message appears in the terminal where the Node.js client-app is running.
Using composite destinations
The Amazon MQ broker uses an XML configuration to enable and configure ActiveMQ features. One of these features, composite destinations, makes one-to-many relationships on a single destination possible. This means that a queue or topic can be configured to forward to another queue, topic, or combination.
This is useful when fanning out to a number of clients, some of whom are consuming queues while others are consuming topics. The following steps demonstrate how you can easily modify the broker configuration and define multiple destinations for a topic.
On the Amazon MQ Configurations page, select the matching configuration from the list. It has the same stack name prefix as your broker.
Choose Edit configuration.
After the broker tag, add the following code example. It creates a new virtual composite destination where messages published to “some/topic” publishes to a queue “A.queue” and a topic “foo.”
After the reboot is complete, run another test of the Lambda function. Then, open and log in to the ActiveMQ broker web console, which can be found under Connections on the broker page. To log in, use the admin credentials created on deployment.
On the Queues page, a new queue “A.Queue” was generated because you published to some/topic, which has a composite destination configured.
Conclusion
It can be difficult to tackle architecting a solution with multiple client destinations and networked applications. Although there are many ways to go about solving this problem, this post showed you how to deploy a robust solution using ActiveMQ with a serverless workflow. The workflow publishes messages to a client application using MQTT, a well-supported and lightweight messaging protocol.
To accomplish this, you deployed a serverless application and an Amazon MQ broker in one step using the AWS Serverless Application Repository. You also ran a Node.js MQTT client application authenticated as a registered user in the Amazon MQ broker. You then used Lambda to test publishing a message to a topic on the Amazon MQ broker. Finally, you extended functionality by modifying the broker configuration to support a virtual composite destination, allowing delivery to multiple topic and queue destinations.
With the completion of this project, you can take things further by integrating other AWS services and third-party or custom client applications. Amazon MQ provides multiple protocol endpoints that are widely used across the software and platform landscape. Using serverless as an in-between, you can deliver features from services like Amazon EventBridge to your external applications, wherever they might be. You can also explore how to invoke an Lambda function from Amazon MQ.
We are excited to announce that you can now develop AWS Lambda functions using the Node.js 12.x runtime, which is the current Long Term Support (LTS) version of Node.js. Start using this new version today by specifying a runtime parameter value of nodejs12.x when creating or updating functions.
Language Updates
Here is a quick primer that highlights just some of the new or improved features that come with Node.js 12:
Updated V8 engine
Public class fields
Private class fields
TLS improvements
Updated V8 engine
Node.js 12.x is powered by V8 7.4, which is a significant upgrade from V8 6.8 powering the previous Node.js 10.x. This upgrade brings with it performance improvements for faster JavaScript execution, better memory management, and broader support for ECMAScript.
Public class fields
With the upgraded V8 version comes support for public class fields. This enhancement allows for public fields to be defined at the class level, providing cleaner code.
Before:
class User {
constructor(user){
this.firstName = user.firstName
this.lastName = user.lastName
this.id = idGenerator()
}
}
In addition to public class fields, Node.js also supports the use of private fields in a class. These fields are not accessible outside of the class and will throw a SyntaxError if an attempt is made. To mark a field as private in a class simply start the name of the field with a ‘#’.
class User {
#loginAttempt = 0;
increment() {
this.#loginAttempt++;
}
get loginAttemptCount() {
return this.#loginAttempt;
}
}
const user = new User()
console.log(user.loginAttemptCount) // returns 0
user.increment()
console.log(user.loginAttemptCount) // returns 1
console.log(user.#loginAttempt) // returns SyntaxError: Private field '#loginAttempt'
// must be declared in an enclosing class
TLS improvements
As a security improvement, Node.js 12 has also added support for TLS 1.3. This increases the security of TLS connections by removing hard to configure and often vulnerable features like SHA-1, RC4, DES, and AES-CBC. Performance is also increased because TLS 1.3 only requires a single round trip for a TLS handshake compared to earlier versions requiring at least two.
Multi-line log events in Node.js 12 will work the same way they did in Node.js 8.10 and before. Node.js 12 will also support exception stack traces in AWS X-Ray helping you to debug and optimize your application. Additionally, to help keep Lambda functions secure, AWS will update Node.js 12 with all minor updates released by the Node.js community.
Deprecation schedule
AWS will be deprecating Node.js 8.10 according to the end of life schedule provided by the community. Node.js 8.10 will reach end of life on December 31, 2019. After January 6, 2020, you can no longer create a Node.js 8.10 Lambda function and the ability to update will be disabled after February 3, 2020. More information on can be found here.
Existing Node.js 8.10 functions can be migrated to the new runtime by making any necessary changes to code for compatibility with Node.js 12, and changing the function’s runtime configuration to “nodejs12.x”. Lambda functions running on Node.js 12 will have 2 full years of support.
Amazon Linux 2
Node.js 12, like Node.js 10, Java 11, and Python 3.8, is based on an Amazon Linux 2 execution environment. Amazon Linux 2 provides a secure, stable, and high-performance execution environment to develop and run cloud and enterprise applications.
Next steps
Get started building with Nodejs 12 today by specifying a runtime parameter value of nodejs12.x when creating or updating your Lambda functions.
In this post, we’ll show you how to use the AWS Encryption SDK (“ESDK”) for JavaScript to handle an in-browser encryption workload for a hypothetical application. First, we’ll review some of the security and privacy properties of encryption, including the names AWS uses for the different components of a typical application. Then, we’ll discuss some of the reasons you might want to encrypt each of those components, with a focus on in-browser encryption, and we’ll describe how to perform that encryption using the ESDK. Lastly, we’ll talk about some of the security properties to be mindful of when designing an application, and where to find additional resources.
An overview of the security and privacy properties of encryption
Encryption is a technique that can restrict access to sensitive data by making it unreadable without a key. An encryption process takes data that is plainly readable or processable (“plaintext”) and uses principles of mathematics to obscure the contents so that it can’t be read without the use of a secret key. To preserve user privacy and prevent unauthorized disclosure of sensitive business data, developers need ways to protect sensitive data during the entire data lifecycle. Data needs to be protected from risks associated with unintentional disclosure as data flows between collection, storage, processing, and sharing components of an application. In this context, encryption is typically divided into two separate techniques: encryption at rest for storing data; and encryption in transit for moving data between entities or systems.
Many applications use encryption in transit to secure connections between their users and the services they provide, and then encrypt the data before it’s stored. However, as applications become more complex and data must be moved between more nodes and stored in more diverse places, there are more opportunities for data to be accidentally leaked or unintentionally disclosed. When a user enters their data in a browser, Transport Layer Security (TLS) can protect that data in transit between the user’s browser and a service endpoint. But in a distributed system, intermediary services between that endpoint and the service that processes that sensitive data might log or cache the data before transporting it. Encrypting sensitive data at the point of collection in the browser is a form of encryption at rest that minimizes the risk of unauthorized access and protects the data if it’s lost, stolen, or accidentally exposed. Encrypting data in the browser means that even if it’s completely exposed elsewhere, it’s unreadable and worthless to anyone without access to the key.
A typical web application
A typical web application will accept some data as input, process it, and then store it. When the user needs to access stored data, the data often follows the same path used when it was input. In our example there are three primary components to the path:
Data is collected (often by a web form or file upload)
Figure 1: A hypothetical web application where the application is composed of an end-user interacting with a browser front-end, a third party which processes data received from the browser, processing is performed in Amazon EC2, and storage happens in Amazon S3
An end-user interacts with the application using an interface in the browser.
As data is sent to Amazon EC2, it passes through the infrastructure of a third party which could be an Internet Service Provider, an appliance in the user’s environment, or an application running in the cloud.
The application on Amazon EC2 processes the data once it has been received.
Once the application is done processing data, it is stored in Amazon S3 until it is needed again.
As data moves between components, TLS is used to prevent inadvertent disclosure. But what if one or more of these components is a third-party service that doesn’t need access to sensitive data? That’s where encryption at rest comes in.
Encryption at rest is available as a server-side, client-side, and client-side in-browser protection. Server-side encryption (SSE) is the most commonly used form of encryption with AWS customers, and for good reason: it’s easy to use because it’s natively supported by many services, such as Amazon S3. When SSE is used, the service that’s storing data will encrypt each piece of data with a key (a “data key”) when it’s received, and then decrypt it transparently when it’s requested by an authorized user. This has the benefit of being seamless for application developers because they only need to check a box in Amazon S3 to enable encryption, and it also adds an additional level of access control by having separate permissions to download an object and perform a decryption operation. However, there is a security/convenience tradeoff to consider, because the service will allow any role with the appropriate permissions to perform a decryption. For additional control, many AWS services—including S3—support the use of customer-managed AWS Key Management Service (AWS KMS) customer master keys (CMKs) that allow you to specify key policies or use grants or AWS Identity and Access Management (IAM) policies to control which roles or users have access to decryption, and when. Configuring permission to decrypt using customer-managed CMKs is often sufficient to satisfy compliance regimes that require “application-level encryption.”
Some threat models or compliance regimes may require client-side encryption (CSE), which can add a powerful additional level of access control at the expense of additional complexity. As noted above, services perform server-side encryption on data after it has left the boundary of your application. TLS is used to secure the data in transit to the service, but some customers might want to only manage encrypt/decrypt operations within their application on EC2 or in the browser. Applications can use the AWS Encryption SDK to encrypt data within the application trust boundary before it’s sent to a storage service.
But what about a use case where customers don’t even want plaintext data to leave the browser? Or what if end-users input data that is passed through or logged by intermediate systems that belong to a third-party? It’s possible to create a separate application that only manages encryption to ensure that your environment is segregated, but using the AWS Encryption SDK for JavaScript allows you to encrypt data in an end-user browser before it’s ever sent to your application, so only your end-user will be able to view their plaintext data. As you can see in Figure 2 below, in-browser encryption can allow data to be safely handled by untrusted intermediate systems while ensuring its confidentiality and integrity.
Figure 2: A hypothetical web application with encryption where the application is composed of an end-user interacting with a browser front-end, a third party which processes data received from the browser, processing is performed in Amazon EC2, and storage happens in Amazon S3
The application in the browser requests a data key to encrypt sensitive data entered by the user before it is passed to a third party.
Because the sensitive data has been encrypted, the third party cannot read it. The third party may be an Internet Service Provider, an appliance in the user’s environment, an application running in the cloud, or a variety of other actors.
The application on Amazon EC2 can make a request to KMS to decrypt the data key so the data can be decrypted, processed, and re-encrypted.
The encrypted object is stored in S3 where a second encryption request is made so the object can be encrypted when it is stored server side.
How to encrypt in the browser
The first step of in-browser encryption is including a copy of the AWS Encryption SDK for JavaScript with the scripts you’re already sending to the user when they access your application. Once it’s present in the end-user environment, it’s available for your application to make calls. To perform the encryption, the ESDK will request a data key from the cryptographic materials provider that is used to encrypt, and an encrypted copy of the data key that will be stored with the object being encrypted. After a piece of data is encrypted within the browser, the ciphertext can be uploaded to your application backend for processing or storage. When a user needs to retrieve the plaintext, the ESDK can read the metadata attached to the ciphertext to determine the appropriate method to decrypt the data key, and if they have access to the CMK decrypt the data key and then use it to decrypt the data.
Important considerations
One common issue with browser-based applications is inconsistent feature support across different browser vendors and versions. For example, how will the application respond to browsers that lack native support for the strongest recommended cryptographic algorithm suites? Or, will there be a message or alternative mode if a user accesses the application using a browser that has JavaScript disabled? The ESDK for JavaScript natively supports a fallback mode, but it may not be appropriate for all use cases. Be sure to understand what kind of browser environments you will need to support to determine whether in-browser encryption is appropriate, and include support for graceful degradation if you expect limited browser support. Developers should also consider the ways that unauthorized users might monitor user actions via a browser extension, make unauthorized browser requests without user knowledge, or request a “downgraded” (less mathematically intensive) cryptographic operation.
It’s always a good idea to have your application designs reviewed by security professionals. If you have an AWS Account Manager or Technical Account Manager, you can ask them to connect you with a Solutions Architect to review your design. If you’re an AWS customer but don’t have an account manager, consider visiting an AWS Loft to participate in our “Ask an Expert” plan.
Software developers have their own preferred tools. Some use powerful editors, others Integrated Development Environments (IDEs) that are tailored for specific languages and platforms. In 2014 I created my first AWS Lambda function using the editor in the Lambda console. Now, you can choose from a rich set of tools to build and deploy serverless applications. For example, the editor in the Lambda console has been greatly enhanced last year when AWS Cloud9 was released. For .NET applications, you can use the AWS Toolkit for Visual Studio and AWS Tools for Visual Studio Team Services.
AWS Toolkits for PyCharm, IntelliJ, and Visual Studio Code
Today, we are announcing the general availability of the AWS Toolkit for PyCharm. We are also announcing the developer preview of the AWS Toolkits for IntelliJ and Visual Studio Code, which are under active development in GitHub. These open source toolkits will enable you to easily develop serverless applications, including a full create, step-through debug, and deploy experience in the IDE and language of your choice, be it Python, Java, Node.js, or .NET.
For example, using the AWS Toolkit for PyCharm you can:
Create a new, ready-to-deploy serverless application in your preferred runtime.
Locally test your code with step-through debugging in a Lambda-like execution environment.
Deploy your applications to the AWS region of your choice.
The AWS Toolkit for PyCharm is available via the IDEA Plugin Repository. To install it, in the Settings/Preferences dialog, click Plugins, search for “AWS Toolkit”, use the checkbox to enable it, and click the Install button. You will need to restart your IDE for the changes to take effect.
The AWS Toolkit for IntelliJ and Visual Studio Code are currently in developer preview and under active development. You are welcome to build and install these from the GitHub repositories:
After installing AWS SAM CLI and AWS Toolkit, I create a new project in PyCharm and choose SAM on the left to create a serverless application using the AWS Serverless Application Model. I call my project hello-world in the Location field. Expanding More Settings, I choose which SAM template to use as the starting point for my project. For this walkthrough, I select the “AWS SAM Hello World”.
In PyCharm you can use credentials and profiles from your AWS Command Line Interface (CLI) configuration. You can change AWS region quickly if you have multiple environments. The AWS Explorer shows Lambda functions and AWS CloudFormation stacks in the selected AWS region. Starting from a CloudFormation stack, you can see which Lambda functions are part of it.
The function handler is in the app.py file. After I open the file, I click on the Lambda icon on the left of the function declaration to have the option to run the function locally or start a local step-by-step debugging session.
First, I run the function locally. I can configure the payload of the event that is provided in input for the local invocation, starting from the event templates provided for most services, such as the Amazon API Gateway, Amazon Simple Notification Service (SNS), Amazon Simple Queue Service (SQS), and so on. You can use a file for the payload, or select the share checkbox to make it available to other team members. The function is executed locally, but here you can choose the credentials and the region to be used if the function is calling other AWS services, such as Amazon Simple Storage Service (S3) or Amazon DynamoDB.
A local container is used to emulate the Lambda execution environment. This function is implementing a basic web API, and I can check that the result is in the format expected by the API Gateway.
After that, I want to get more information on what my code is doing. I set a breakpoint and start a local debugging session. I use the same input event as before. Again, you can choose the credentials and region for the AWS services used by the function.
I step over the HTTP request in the code to inspect the response in the Variables tab. Here you have access to all local variables, including the event and the context provided in input to the function.
After that, I resume the program to reach the end of the debugging session.
Now I am confident enough to deploy the serverless application right-clicking on the project (or the SAM template file). I can create a new CloudFormation stack, or update an existing one. For now, I create a new stack called hello-world-prod. For example, you can have a stack for production, and one for testing. I select an S3 bucket in the region to store the package used for the deployment. If your template has parameters, here you can set up the values used by this deployment.
After a few minutes, the stack creation is complete and I can run the function in the cloud with a right-click in the AWS Explorer. Here there is also the option to jump to the source code of the function.
As expected, the result of the remote invocation is the same as the local execution. My serverless application is in production!
Using these toolkits, developers can test locally to find problems before deployment, change the code of their application or the resources they need in the SAM template, and update an existing stack, quickly iterating until they reach their goal. For example, they can add an S3 bucket to store images or documents, or a DynamoDB table to store your users, or change the permissions used by their functions.
I am really excited by how much faster and easier it is to build your ideas on AWS. Now you can use your preferred environment to accelerate even further. I look forward to seeing what you will do with these new tools!
Thanks to Greg Eppel, Sr. Solutions Architect, Microsoft Platform for this great blog that describes how to create a custom CodeBuild build environment for the .NET Framework. — AWS CodeBuild is a fully managed build service that compiles source code, runs tests, and produces software packages that are ready to deploy. CodeBuild provides curated build environments for programming languages and runtimes such as Android, Go, Java, Node.js, PHP, Python, Ruby, and Docker. CodeBuild now supports builds for the Microsoft Windows Server platform, including a prepackaged build environment for .NET Core on Windows. If your application uses the .NET Framework, you will need to use a custom Docker image to create a custom build environment that includes the Microsoft proprietary Framework Class Libraries. For information about why this step is required, see our FAQs. In this post, I’ll show you how to create a custom build environment for .NET Framework applications and walk you through the steps to configure CodeBuild to use this environment.
Build environments are Docker images that include a complete file system with everything required to build and test your project. To use a custom build environment in a CodeBuild project, you build a container image for your platform that contains your build tools, push it to a Docker container registry such as Amazon Elastic Container Registry (Amazon ECR), and reference it in the project configuration. When it builds your application, CodeBuild retrieves the Docker image from the container registry specified in the project configuration and uses the environment to compile your source code, run your tests, and package your application.
Step 1: Launch EC2 Windows Server 2016 with Containers
In the Amazon EC2 console, in your region, launch an Amazon EC2 instance from a Microsoft Windows Server 2016 Base with Containers AMI.
Increase disk space on the boot volume to at least 50 GB to account for the larger size of containers required to install and run Visual Studio Build Tools.
Run the following command in that directory. This process can take a while. It depends on the size of EC2 instance you launched. In my tests, a t2.2xlarge takes less than 30 minutes to build the image and produces an approximately 15 GB image.
docker build -t buildtools2017:latest -m 2GB .
Run the following command to test the container and start a command shell with all the developer environment variables:
docker run -it buildtools2017
Create a repository in the Amazon ECS console. For the repository name, type buildtools2017. Choose Next step and then complete the remaining steps.
Execute the following command to generate authentication details for our registry to the local Docker engine. Make sure you have permissions to the Amazon ECR registry before you execute the command.
aws ecr get-login
In the same command prompt window, copy and paste the following commands:
In the CodeCommit console, create a repository named DotNetFrameworkSampleApp. On the Configure email notifications page, choose Skip.
Clone a .NET Framework Docker sample application from GitHub. The repository includes a sample ASP.NET Framework that we’ll use to demonstrate our custom build environment.On the EC2 instance, open a command prompt and execute the following commands:
Navigate to the CodeCommit repository and confirm that the files you just pushed are there.
Step 4: Configure build spec
To build your .NET Framework application with CodeBuild you use a build spec, which is a collection of build commands and related settings, in YAML format, that AWS CodeBuild can use to run a build. You can include a build spec as part of the source code or you can define a build spec when you create a build project. In this example, I include a build spec as part of the source code.
In the root directory of your source directory, create a YAML file named buildspec.yml.
At this point, we have a Docker image with Visual Studio Build Tools installed and stored in the Amazon ECR registry. We also have a sample ASP.NET Framework application in a CodeCommit repository. Now we are going to set up CodeBuild to build the ASP.NET Framework application.
In the Amazon ECR console, choose the repository that was pushed earlier with the docker push command. On the Permissions tab, choose Add.
For Source Provider, choose AWS CodeCommit and then choose the called DotNetFrameworkSampleApp repository.
For Environment Image, choose Specify a Docker image.
For Environment type, choose Windows.
For Custom image type, choose Amazon ECR.
For Amazon ECR repository, choose the Docker image with the Visual Studio Build Tools installed, buildtools2017. Your configuration should look like the image below:
Choose Continue and then Save and Build to create your CodeBuild project and start your first build. You can monitor the status of the build in the console. You can also configure notifications that will notify subscribers whenever builds succeed, fail, go from one phase to another, or any combination of these events.
Summary
CodeBuild supports a number of platforms and languages out of the box. By using custom build environments, it can be extended to other runtimes. In this post, I showed you how to build a .NET Framework environment on a Windows container and demonstrated how to use it to build .NET Framework applications in CodeBuild.
We’re excited to see how customers extend and use CodeBuild to enable continuous integration and continuous delivery for their Windows applications. Feel free to share what you’ve learned extending CodeBuild for your own projects. Just leave questions or suggestions in the comments.
When I talk with customers and partners, I find that they are in different stages in the adoption of DevOps methodologies. They are automating the creation of application artifacts and the deployment of their applications to different infrastructure environments. In many cases, they are creating and supporting multiple applications using a variety of coding languages and artifacts.
The management of these processes and artifacts can be challenging, but using the right tools and methodologies can simplify the process.
In this post, I will show you how you can automate the creation and storage of application artifacts through the implementation of a pipeline and custom deploy action in AWS CodePipeline. The example includes a Node.js code base stored in an AWS CodeCommit repository. A Node Package Manager (npm) artifact is built from the code base, and the build artifact is published to a JFrogArtifactory npm repository.
I frequently recommend AWS CodePipeline, the AWS continuous integration and continuous delivery tool. You can use it to quickly innovate through integration and deployment of new features and bug fixes by building a workflow that automates the build, test, and deployment of new versions of your application. And, because AWS CodePipeline is extensible, it allows you to create a custom action that performs customized, automated actions on your behalf.
JFrog’s Artifactory is a universal binary repository manager where you can manage multiple applications, their dependencies, and versions in one place. Artifactory also enables you to standardize the way you manage your package types across all applications developed in your company, no matter the code base or artifact type.
If you already have a Node.js CodeCommit repository, a JFrog Artifactory host, and would like to automate the creation of the pipeline, including the custom action and CodeBuild project, you can use this AWS CloudFormationtemplate to create your AWS CloudFormation stack.
This figure shows the path defined in the pipeline for this project. It starts with a change to Node.js source code committed to a private code repository in AWS CodeCommit. With this change, CodePipeline triggers AWS CodeBuild to create the npm package from the node.js source code. After the build, CodePipeline triggers the custom action job worker to commit the build artifact to the designated artifact repository in Artifactory.
This blog post assumes you have already:
· Created a CodeCommit repository that contains a Node.js project.
· Configured a two-stage pipeline in AWS CodePipeline.
The Source stage of the pipeline is configured to poll the Node.js CodeCommit repository. The Build stage is configured to use a CodeBuild project to build the npm package using a buildspec.yml file located in the code repository.
If you do not have a Node.js repository, you can create a CodeCommit repository that contains this simple ‘Hello World’ project. This project also includes a buildspec.yml file that is used when you define your CodeBuild project. It defines the steps to be taken by CodeBuild to create the npm artifact.
If you do not already have a pipeline set up in CodePipeline, you can use this template to create a pipeline with a CodeCommit source action and a CodeBuild build action through the AWS Command Line Interface (AWS CLI). If you do not want to install the AWS CLI on your local machine, you can use AWS Cloud9, our managed integrated development environment (IDE), to interact with AWS APIs.
In your development environment, open your favorite editor and fill out the template with values appropriate to your project. For information, see the readme in the GitHub repository.
Use this CLI command to create the pipeline from the template:
It creates a pipeline that has a CodeCommit source action and a CodeBuild build action.
Integrating JFrog Artifactory
JFrog Artifactory provides default repositories for your project needs. For my NPM package repository, I am using the default virtual npm repository (named npm) that is available in Artifactory Pro. You might want to consider creating a repository per project but for the example used in this post, using the default lets me get started without having to configure a new repository.
I can use the steps in the Set Me Up -> npm section on the landing page to configure my worker to interact with the default NPM repository.
Describes the required values to run the custom action. I will define my custom action in the ‘Deploy’ category, identify the provider as ‘Artifactory’, of version ‘1’, and specify a variety of configurationProperties whose values will be defined when this stage is added to my pipeline.
Polls CodePipeline for a job, scanning for its action-definition properties. In this blog post, after a job has been found, the job worker does the work required to publish the npm artifact to the Artifactory repository.
{
"category": "Deploy",
"configurationProperties": [{
"name": "TypeOfArtifact",
"required": true,
"key": true,
"secret": false,
"description": "Package type, ex. npm for node packages",
"type": "String"
},
{ "name": "RepoKey",
"required": true,
"key": true,
"secret": false,
"type": "String",
"description": "Name of the repository in which this artifact should be stored"
},
{ "name": "UserName",
"required": true,
"key": true,
"secret": false,
"type": "String",
"description": "Username for authenticating with the repository"
},
{ "name": "Password",
"required": true,
"key": true,
"secret": true,
"type": "String",
"description": "Password for authenticating with the repository"
},
{ "name": "EmailAddress",
"required": true,
"key": true,
"secret": false,
"type": "String",
"description": "Email address used to authenticate with the repository"
},
{ "name": "ArtifactoryHost",
"required": true,
"key": true,
"secret": false,
"type": "String",
"description": "Public address of Artifactory host, ex: https://myexamplehost.com or http://myexamplehost.com:8080"
}],
"provider": "Artifactory",
"version": "1",
"settings": {
"entityUrlTemplate": "{Config:ArtifactoryHost}/artifactory/webapp/#/artifacts/browse/tree/General/{Config:RepoKey}"
},
"inputArtifactDetails": {
"maximumCount": 5,
"minimumCount": 1
},
"outputArtifactDetails": {
"maximumCount": 5,
"minimumCount": 0
}
}
There are seven sections to the custom action definition:
category: This is the stage in which you will be creating this action. It can be Source, Build, Deploy, Test, Invoke, Approval. Except for source actions, the category section simply allows us to organize our actions. I am setting the category for my action as ‘Deploy’ because I’m using it to publish my node artifact to my Artifactory instance.
configurationProperties: These are the parameters or variables required for your project to authenticate and commit your artifact. In the case of my custom worker, I need:
TypeOfArtifact: In this case, npm, because it’s for the Node Package Manager.
RepoKey: The name of the repository. In this case, it’s the default npm.
UserName and Password for the user to authenticate with the Artifactory repository.
EmailAddress used to authenticate with the repository.
Artifactory host name or IP address.
provider: The name you define for your custom action stage. I have named the provider Artifactory.
version: Version number for the custom action. Because this is the first version, I set the version number to 1.
entityUrlTemplate: This URL is presented to your users for the deploy stage along with the title you define in your provider. The link takes the user to their artifact repository page in the Artifactory host.
inputArtifactDetails: The number of artifacts to expect from the previous stage in the pipeline.
outputArtifactDetails: The number of artifacts that should be the result from the custom action stage. Later in this blog post, I define 0 for my output artifacts because I am publishing the artifact to the Artifactory repository as the final action.
After I define the custom action in a JSON file, I use the AWS CLI to create the custom action type in CodePipeline:
After I create the custom action type in the same region as my pipeline, I edit the pipeline to add a Deploy stage and configure it to use the custom action I created for Artifactory:
I have created a custom worker for the actions required to commit the npm artifact to the Artifactory repository. The worker is in Python and it runs in a loop on an Amazon EC2 instance. My custom worker polls for a deploy job and publishes the NPM artifact to the Artifactory repository.
The EC2 instance is running Amazon Linux and has an IAM instance role attached that gives the worker permission to access CodePipeline. The worker process is as follows:
Take the configuration properties from the custom worker and poll CodePipeline for a custom action job.
After there is a job in the job queue with the appropriate category, provider, and version, acknowledge the job.
Download the zipped artifact created in the previous Build stage from the provided S3 buckets with the provided temporary credentials.
Unzip the artifact into a temporary directory.
A user-defined Artifactory user name and password is used to receive a temporary API key from Artifactory.
To avoid having to write the password to a file, use that temporary API key and user name to authenticate with the NPM repository.
Publish the Node.js package to the specified repository.
Because I am running my custom worker on an Amazon Linux EC2 instance, I installed npm with the following command:
sudo yum install nodejs npm --enablerepo=epel
For my custom worker, I used pip to install the required Python libraries:
pip install boto3 requests
For a full Python package list, see requirements.txt in the GitHub repository.
Let’s take a look at some of the code snippets from the worker.
First, the worker polls for jobs:
def action_type():
ActionType = {
'category': 'Deploy',
'owner': 'Custom',
'provider': 'Artifactory',
'version': '1' }
return(ActionType)
def poll_for_jobs():
try:
artifactory_action_type = action_type()
print(artifactory_action_type)
jobs = codepipeline.poll_for_jobs(actionTypeId=artifactory_action_type)
while not jobs['jobs']:
time.sleep(10)
jobs = codepipeline.poll_for_jobs(actionTypeId=artifactory_action_type)
if jobs['jobs']:
print('Job found')
return jobs['jobs'][0]
except ClientError as e:
print("Received an error: %s" % str(e))
raise
When there is a job in the queue, the poller returns a number of values from the queue such as jobId, the input and output S3 buckets for artifacts, temporary credentials to access the S3 buckets, and other configuration details from the stage in the pipeline.
After successfully receiving the job details, the worker sends an acknowledgement to CodePipeline to ensure that the work on the job is not duplicated by other workers watching for the same job:
def job_acknowledge(jobId, nonce):
try:
print('Acknowledging job')
result = codepipeline.acknowledge_job(jobId=jobId, nonce=nonce)
return result
except Exception as e:
print("Received an error when trying to acknowledge the job: %s" % str(e))
raise
With the job now acknowledged, the worker publishes the source code artifact into the desired repository. The worker gets the value of the artifact S3 bucket and objectKey from the inputArtifacts in the response from the poll_for_jobs API request. Next, the worker creates a new directory in /tmp and downloads the S3 object into this directory:
def get_bucket_location(bucketName, init_client):
region = init_client.get_bucket_location(Bucket=bucketName)['LocationConstraint']
if not region:
region = 'us-east-1'
return region
def get_s3_artifact(bucketName, objectKey, ak, sk, st):
init_s3 = boto3.client('s3')
region = get_bucket_location(bucketName, init_s3)
session = Session(aws_access_key_id=ak,
aws_secret_access_key=sk,
aws_session_token=st)
s3 = session.resource('s3',
region_name=region,
config=botocore.client.Config(signature_version='s3v4'))
try:
tempdirname = tempfile.mkdtemp()
except OSError as e:
print('Could not write temp directory %s' % tempdirname)
raise
bucket = s3.Bucket(bucketName)
obj = bucket.Object(objectKey)
filename = tempdirname + '/' + objectKey
try:
if os.path.dirname(objectKey):
directory = os.path.dirname(filename)
os.makedirs(directory)
print('Downloading the %s object and writing it to disk in %s location' % (objectKey, tempdirname))
with open(filename, 'wb') as data:
obj.download_fileobj(data)
except ClientError as e:
print('Downloading the object and writing the file to disk raised this error: ' + str(e))
raise
return(filename, tempdirname)
Because the downloaded artifact from S3 is a zip file, the worker must unzip it first. To have a clean area in which to work, I extract the downloaded zip archive into a new directory:
def unzip_codepipeline_artifact(artifact, origtmpdir):
# create a new temp directory
# Unzip artifact into new directory
try:
newtempdir = tempfile.mkdtemp()
print('Extracting artifact %s into temporary directory %s' % (artifact, newtempdir))
zip_ref = zipfile.ZipFile(artifact, 'r')
zip_ref.extractall(newtempdir)
zip_ref.close()
shutil.rmtree(origtmpdir)
return(os.listdir(newtempdir), newtempdir)
except OSError as e:
if e.errno != errno.EEXIST:
shutil.rmtree(newtempdir)
raise
The worker now has the npm package that I want to store in my Artifactory NPM repository.
To authenticate with the NPM repository, the worker requests a temporary token from the Artifactory host. After receiving this temporary token, it creates a .npmrc file in the worker user’s home directory that includes a hash of the user name and temporary token. After it has authenticated, the worker runs npm config set registry <URL OF REPOSITORY> to configure the npm registry value to be the Artifactory host. Next, the worker runs npm publish –registry <URL OF REPOSITORY>, which publishes the node package to the NPM repository in the Artifactory host.
def push_to_npm(configuration, artifact_list, temp_dir, jobId):
reponame = configuration['RepoKey']
art_type = configuration['TypeOfArtifact']
print("Putting artifact into NPM repository " + reponame)
token, hostname, username = gen_artifactory_auth_token(configuration)
npmconfigfile = create_npmconfig_file(configuration, username, token)
url = hostname + '/artifactory/api/' + art_type + '/' + reponame
print("Changing directory to " + str(temp_dir))
os.chdir(temp_dir)
try:
print("Publishing following files to the repository: %s " % os.listdir(temp_dir))
print("Sending artifact to Artifactory NPM registry URL: " + url)
subprocess.call(["npm", "config", "set", "registry", url])
req = subprocess.call(["npm", "publish", "--registry", url])
print("Return code from npm publish: " + str(req))
if req != 0:
err_msg = "npm ERR! Recieved non OK response while sending response to Artifactory. Return code from npm publish: " + str(req)
signal_failure(jobId, err_msg)
else:
signal_success(jobId)
except requests.exceptions.RequestException as e:
print("Received an error when trying to commit artifact %s to repository %s: " % (str(art_type), str(configuration['RepoKey']), str(e)))
raise
return(req, npmconfigfile)
If the return value from publishing to the repository is not 0, the worker signals a failure to CodePipeline. If the value is 0, the worker signals success to CodePipeline to indicate that the stage of the pipeline has been completed successfully.
For the custom worker code, see npm_job_worker.py in the GitHub repository.
I run my custom worker on an EC2 instance using the command python npm_job_worker.py, with an optional --version flag that can be used to specify worker versions other than 1. Then I trigger a release change in my pipeline:
From my custom worker output logs, I have just committed a package named node_example at version 1.0.3:
On artifact: index.js
Committing to the repo: https://artifactory.myexamplehost.com/artifactory/api/npm/npm
Sending artifact to Artifactory URL: https:// artifactoryhost.myexamplehost.com/artifactory/api/npm/npm
npm config: 0
npm http PUT https://artifactory.myexamplehost.com/artifactory/api/npm/npm/node_example
npm http 201 https://artifactory.myexamplehost.com/artifactory/api/npm/npm/node_example
+ [email protected]
Return code from npm publish: 0
Signaling success to CodePipeline
After that has been built successfully, I can find my artifact in my Artifactory repository:
To help you automate this process, I have created this AWS CloudFormation template that automates the creation of the CodeBuild project, the custom action, and the CodePipeline pipeline. It also launches the Amazon EC2-based custom job worker in an AWS Auto Scaling group. This template requires you to have a VPC and CodeCommit repository for your Node.js project. If you do not currently have a VPC in which you want to run your custom worker EC2 instances, you can use this AWS QuickStart to create one. If you do not have an existing Node.js project, I’ve provided a sample project in the GitHub repository.
Conclusion
I‘ve shown you the steps to integrate your JFrog Artifactory repository with your CodePipeline workflow. I’ve shown you how to create a custom action in CodePipeline and how to create a custom worker that works in your CI/CD pipeline. To dig deeper into custom actions and see how you can integrate your Artifactory repositories into your AWS CodePipeline projects, check out the full code base on GitHub.
If you have any questions or feedback, feel free to reach out to us through the AWS CodePipeline forum.
Erin McGill is a Solutions Architect in the AWS Partner Program with a focus on DevOps and automation tooling.
This post courtesy of George Mao, AWS Senior Serverless Specialist – Solutions Architect
AWS Lambda and AWS CodeDeploy recently made it possible to automatically shift incoming traffic between two function versions based on a preconfigured rollout strategy. This new feature allows you to gradually shift traffic to the new function. If there are any issues with the new code, you can quickly rollback and control the impact to your application.
Previously, you had to manually move 100% of traffic from the old version to the new version. Now, you can have CodeDeploy automatically execute pre- or post-deployment tests and automate a gradual rollout strategy. Traffic shifting is built right into the AWS Serverless Application Model (SAM), making it easy to define and deploy your traffic shifting capabilities. SAM is an extension of AWS CloudFormation that provides a simplified way of defining serverless applications.
In this post, I show you how to use SAM, CloudFormation, and CodeDeploy to accomplish an automated rollout strategy for safe Lambda deployments.
Scenario
For this walkthrough, you write a Lambda application that returns a count of the S3 buckets that you own. You deploy it and use it in production. Later on, you receive requirements that tell you that you need to change your Lambda application to count only buckets that begin with the letter “a”.
Before you make the change, you need to be sure that your new Lambda application works as expected. If it does have issues, you want to minimize the number of impacted users and roll back easily. To accomplish this, you create a deployment process that publishes the new Lambda function, but does not send any traffic to it. You use CodeDeploy to execute a PreTraffic test to ensure that your new function works as expected. After the test succeeds, CodeDeploy automatically shifts traffic gradually to the new version of the Lambda function.
Your Lambda function is exposed as a REST service via an Amazon API Gateway deployment. This makes it easy to test and integrate.
Prerequisites
To execute the SAM and CloudFormation deployment, you must have the following IAM permissions:
cloudformation:*
lambda:*
codedeploy:*
iam:create*
You may use the AWS SAM Local CLI or the AWS CLI to package and deploy your Lambda application. If you choose to use SAM Local, be sure to install it onto your system. For more information, see AWS SAM Local Installation.
For this post, use SAM to define your resources because it comes with built-in CodeDeploy support for safe Lambda deployments. The deployment is handled and automated by CloudFormation.
SAM allows you to define your Serverless applications in a simple and concise fashion, because it automatically creates all necessary resources behind the scenes. For example, if you do not define an execution role for a Lambda function, SAM automatically creates one. SAM also creates the CodeDeploy application necessary to drive the traffic shifting, as well as the IAM service role that CodeDeploy uses to execute all actions.
Create a SAM template
To get started, write your SAM template and call it template.yaml.
Review the key parts of the SAM template that defines returnS3Buckets:
The AutoPublishAlias attribute instructs SAM to automatically publish a new version of the Lambda function for each new deployment and link it to the live alias.
The Policies attribute specifies additional policy statements that SAM adds onto the automatically generated IAM role for this function. The first statement provides the function with permission to call listBuckets.
The DeploymentPreference attribute configures the type of rollout pattern to use. In this case, you are shifting traffic in a linear fashion, moving 10% of traffic every minute to the new version. For more information about supported patterns, see Serverless Application Model: Traffic Shifting Configurations.
The Hooks attribute specifies that you want to execute the preTrafficHook Lambda function before CodeDeploy automatically begins shifting traffic. This function should perform validation testing on the newly deployed Lambda version. This function invokes the new Lambda function and checks the results. If you’re satisfied with the tests, instruct CodeDeploy to proceed with the rollout via an API call to: codedeploy.putLifecycleEventHookExecutionStatus.
The Events attribute defines an API-based event source that can trigger this function. It accepts requests on the /test path using an HTTP GET method.
'use strict';
const AWS = require('aws-sdk');
const codedeploy = new AWS.CodeDeploy({apiVersion: '2014-10-06'});
var lambda = new AWS.Lambda();
exports.handler = (event, context, callback) => {
console.log("Entering PreTraffic Hook!");
// Read the DeploymentId & LifecycleEventHookExecutionId from the event payload
var deploymentId = event.DeploymentId;
var lifecycleEventHookExecutionId = event.LifecycleEventHookExecutionId;
var functionToTest = process.env.NewVersion;
console.log("Testing new function version: " + functionToTest);
// Perform validation of the newly deployed Lambda version
var lambdaParams = {
FunctionName: functionToTest,
InvocationType: "RequestResponse"
};
var lambdaResult = "Failed";
lambda.invoke(lambdaParams, function(err, data) {
if (err){ // an error occurred
console.log(err, err.stack);
lambdaResult = "Failed";
}
else{ // successful response
var result = JSON.parse(data.Payload);
console.log("Result: " + JSON.stringify(result));
// Check the response for valid results
// The response will be a JSON payload with statusCode and body properties. ie:
// {
// "statusCode": 200,
// "body": 51
// }
if(result.body == 9){
lambdaResult = "Succeeded";
console.log ("Validation testing succeeded!");
}
else{
lambdaResult = "Failed";
console.log ("Validation testing failed!");
}
// Complete the PreTraffic Hook by sending CodeDeploy the validation status
var params = {
deploymentId: deploymentId,
lifecycleEventHookExecutionId: lifecycleEventHookExecutionId,
status: lambdaResult // status can be 'Succeeded' or 'Failed'
};
// Pass AWS CodeDeploy the prepared validation test results.
codedeploy.putLifecycleEventHookExecutionStatus(params, function(err, data) {
if (err) {
// Validation failed.
console.log('CodeDeploy Status update failed');
console.log(err, err.stack);
callback("CodeDeploy Status update failed");
} else {
// Validation succeeded.
console.log('Codedeploy status updated successfully');
callback(null, 'Codedeploy status updated successfully');
}
});
}
});
}
The hook is hardcoded to check that the number of S3 buckets returned is 9.
Review the key parts of the SAM template that defines preTrafficHook:
The Policies attribute specifies additional policy statements that SAM adds onto the automatically generated IAM role for this function. The first statement provides permissions to call the CodeDeploy PutLifecycleEventHookExecutionStatus API action. The second statement provides permissions to invoke the specific version of the returnS3Buckets function to test
This function has traffic shifting features disabled by setting the DeploymentPreference option to false.
The FunctionName attribute explicitly tells CloudFormation what to name the function. Otherwise, CloudFormation creates the function with the default naming convention: [stackName]-[FunctionName]-[uniqueID]. Name the function with the “CodeDeployHook_” prefix because the CodeDeployServiceRole role only allows InvokeFunction on functions named with that prefix.
Set the Timeout attribute to allow enough time to complete your validation tests.
Use an environment variable to inject the ARN of the newest deployed version of the returnS3Buckets function. The ARN allows the function to know the specific version to invoke and perform validation testing on.
Deploy the function
Your SAM template is all set and the code is written—you’re ready to deploy the function for the first time. Here’s how to do it via the SAM CLI. Replace “sam” with “cloudformation” to use CloudFormation instead.
First, package the function. This command returns a CloudFormation importable file, packaged.yaml.
sam package –template-file template.yaml –s3-bucket mybucket –output-template-file packaged.yaml
Now deploy everything:
sam deploy –template-file packaged.yaml –stack-name mySafeDeployStack –capabilities CAPABILITY_IAM
At this point, both Lambda functions have been deployed within the CloudFormation stack mySafeDeployStack. The returnS3Buckets has been deployed as Version 1:
SAM automatically created a few things, including the CodeDeploy application, with the deployment pattern that you specified (Linear10PercentEvery1Minute). There is currently one deployment group, with no action, because no deployments have occurred. SAM also created the IAM service role that this CodeDeploy application uses:
There is a single managed policy attached to this role, which allows CodeDeploy to invoke any Lambda function that begins with “CodeDeployHook_”.
An API has been set up called safeDeployStack. It targets your Lambda function with the /test resource using the GET method. When you test the endpoint, API Gateway executes the returnS3Buckets function and it returns the number of S3 buckets that you own. In this case, it’s 51.
Publish a new Lambda function version
Now implement the requirements change, which is to make returnS3Buckets count only buckets that begin with the letter “a”. The code now looks like the following (see returnS3BucketsNew.js in GitHub):
'use strict';
var AWS = require('aws-sdk');
var s3 = new AWS.S3();
exports.handler = (event, context, callback) => {
console.log("I am here! " + context.functionName + ":" + context.functionVersion);
s3.listBuckets(function (err, data){
if(err){
console.log(err, err.stack);
callback(null, {
statusCode: 500,
body: "Failed!"
});
}
else{
var allBuckets = data.Buckets;
console.log("Total buckets: " + allBuckets.length);
//callback(null, allBuckets.length);
// New Code begins here
var counter=0;
for(var i in allBuckets){
if(allBuckets[i].Name[0] === "a")
counter++;
}
console.log("Total buckets starting with a: " + counter);
callback(null, {
statusCode: 200,
body: counter
});
}
});
}
Repackage and redeploy with the same two commands as earlier:
sam package –template-file template.yaml –s3-bucket mybucket –output-template-file packaged.yaml
sam deploy –template-file packaged.yaml –stack-name mySafeDeployStack –capabilities CAPABILITY_IAM
CloudFormation understands that this is a stack update instead of an entirely new stack. You can see that reflected in the CloudFormation console:
During the update, CloudFormation deploys the new Lambda function as version 2 and adds it to the “live” alias. There is no traffic routing there yet. CodeDeploy now takes over to begin the safe deployment process.
The first thing CodeDeploy does is invoke the preTrafficHook function. Verify that this happened by reviewing the Lambda logs and metrics:
The function should progress successfully, invoke Version 2 of returnS3Buckets, and finally invoke the CodeDeploy API with a success code. After this occurs, CodeDeploy begins the predefined rollout strategy. Open the CodeDeploy console to review the deployment progress (Linear10PercentEvery1Minute):
Verify the traffic shift
During the deployment, verify that the traffic shift has started to occur by running the test periodically. As the deployment shifts towards the new version, a larger percentage of the responses return 9 instead of 51. These numbers match the S3 buckets.
A minute later, you see 10% more traffic shifting to the new version. The whole process takes 10 minutes to complete. After completion, open the Lambda console and verify that the “live” alias now points to version 2:
After 10 minutes, the deployment is complete and CodeDeploy signals success to CloudFormation and completes the stack update.
Check the results
If you invoke the function alias manually, you see the results of the new implementation.
aws lambda invoke –function [lambda arn to live alias] out.txt
You can also execute the prod stage of your API and verify the results by issuing an HTTP GET to the invoke URL:
Summary
This post has shown you how you can safely automate your Lambda deployments using the Lambda traffic shifting feature. You used the Serverless Application Model (SAM) to define your Lambda functions and configured CodeDeploy to manage your deployment patterns. Finally, you used CloudFormation to automate the deployment and updates to your function and PreTraffic hook.
Now that you know all about this new feature, you’re ready to begin automating Lambda deployments with confidence that things will work as designed. I look forward to hearing about what you’ve built with the AWS Serverless Platform.
Amazon Redshift is a data warehouse service that logs the history of the system in STL log tables. The STL log tables manage disk space by retaining only two to five days of log history, depending on log usage and available disk space.
To retain STL tables’ data for an extended period, you usually have to create a replica table for every system table. Then, for each you load the data from the system table into the replica at regular intervals. By maintaining replica tables for STL tables, you can run diagnostic queries on historical data from the STL tables. You then can derive insights from query execution times, query plans, and disk-spill patterns, and make better cluster-sizing decisions. However, refreshing replica tables with live data from STL tables at regular intervals requires schedulers such as Cron or AWS Data Pipeline. Also, these tables are specific to one cluster and they are not accessible after the cluster is terminated. This is especially true for transient Amazon Redshift clusters that last for only a finite period of ad hoc query execution.
In this blog post, I present a solution that exports system tables from multiple Amazon Redshift clusters into an Amazon S3 bucket. This solution is serverless, and you can schedule it as frequently as every five minutes. The AWS CloudFormation deployment template that I provide automates the solution setup in your environment. The system tables’ data in the Amazon S3 bucket is partitioned by cluster name and query execution date to enable efficient joins in cross-cluster diagnostic queries.
I also provide another CloudFormation template later in this post. This second template helps to automate the creation of tables in the AWS Glue Data Catalog for the system tables’ data stored in Amazon S3. After the system tables are exported to Amazon S3, you can run cross-cluster diagnostic queries on the system tables’ data and derive insights about query executions in each Amazon Redshift cluster. You can do this using Amazon QuickSight, Amazon Athena, Amazon EMR, or Amazon Redshift Spectrum.
You can find all the code examples in this post, including the CloudFormation templates, AWS Glue extract, transform, and load (ETL) scripts, and the resolution steps for common errors you might encounter in this GitHub repository.
Solution overview
The solution in this post uses AWS Glue to export system tables’ log data from Amazon Redshift clusters into Amazon S3. The AWS Glue ETL jobs are invoked at a scheduled interval by AWS Lambda. AWS Systems Manager, which provides secure, hierarchical storage for configuration data management and secrets management, maintains the details of Amazon Redshift clusters for which the solution is enabled. The last-fetched time stamp values for the respective cluster-table combination are maintained in an Amazon DynamoDB table.
The following diagram covers the key steps involved in this solution.
The solution as illustrated in the preceding diagram flows like this:
The Lambda function, invoke_rs_stl_export_etl, is triggered at regular intervals, as controlled by Amazon CloudWatch. It’s triggered to look up the AWS Systems Manager parameter store to get the details of the Amazon Redshift clusters for which the system table export is enabled.
The same Lambda function, based on the Amazon Redshift cluster details obtained in step 1, invokes the AWS Glue ETL job designated for the Amazon Redshift cluster. If an ETL job for the cluster is not found, the Lambda function creates one.
The ETL job invoked for the Amazon Redshift cluster gets the cluster credentials from the parameter store. It gets from the DynamoDB table the last exported time stamp of when each of the system tables was exported from the respective Amazon Redshift cluster.
The ETL job unloads the system tables’ data from the Amazon Redshift cluster into an Amazon S3 bucket.
The ETL job updates the DynamoDB table with the last exported time stamp value for each system table exported from the Amazon Redshift cluster.
The Amazon Redshift cluster system tables’ data is available in Amazon S3 and is partitioned by cluster name and date for running cross-cluster diagnostic queries.
Understanding the configuration data
This solution uses AWS Systems Manager parameter store to store the Amazon Redshift cluster credentials securely. The parameter store also securely stores other configuration information that the AWS Glue ETL job needs for extracting and storing system tables’ data in Amazon S3. Systems Manager comes with a default AWS Key Management Service (AWS KMS) key that it uses to encrypt the password component of the Amazon Redshift cluster credentials.
The following table explains the global parameters and cluster-specific parameters required in this solution. The global parameters are defined once and applicable at the overall solution level. The cluster-specific parameters are specific to an Amazon Redshift cluster and repeat for each cluster for which you enable this post’s solution. The CloudFormation template explained later in this post creates these parameters as part of the deployment process.
Parameter name
Type
Description
Global parameters—defined once and applied to all jobs
redshift_query_logs.global.s3_prefix
String
The Amazon S3 path where the query logs are exported. Under this path, each exported table is partitioned by cluster name and date.
redshift_query_logs.global.tempdir
String
The Amazon S3 path that AWS Glue ETL jobs use for temporarily staging the data.
redshift_query_logs.global.role>
String
The name of the role that the AWS Glue ETL jobs assume. Just the role name is sufficient. The complete Amazon Resource Name (ARN) is not required.
redshift_query_logs.global.enabled_cluster_list
StringList
A comma-separated list of cluster names for which system tables’ data export is enabled. This gives flexibility for a user to exclude certain clusters.
Cluster-specific parameters—for each cluster specified in the enabled_cluster_list parameter
redshift_query_logs.<<cluster_name>>.connection
String
The name of the AWS Glue Data Catalog connection to the Amazon Redshift cluster. For example, if the cluster name is product_warehouse, the entry is redshift_query_logs.product_warehouse.connection.
redshift_query_logs.<<cluster_name>>.user
String
The user name that AWS Glue uses to connect to the Amazon Redshift cluster.
redshift_query_logs.<<cluster_name>>.password
Secure String
The password that AWS Glue uses to connect the Amazon Redshift cluster’s encrypted-by key that is managed in AWS KMS.
For example, suppose that you have two Amazon Redshift clusters, product-warehouse and category-management, for which the solution described in this post is enabled. In this case, the parameters shown in the following screenshot are created by the solution deployment CloudFormation template in the AWS Systems Manager parameter store.
Solution deployment
To make it easier for you to get started, I created a CloudFormation template that automatically configures and deploys the solution—only one step is required after deployment.
Prerequisites
To deploy the solution, you must have one or more Amazon Redshift clusters in a private subnet. This subnet must have a network address translation (NAT) gateway or a NAT instance configured, and also a security group with a self-referencing inbound rule for all TCP ports. For more information about why AWS Glue ETL needs the configuration it does, described previously, see Connecting to a JDBC Data Store in a VPC in the AWS Glue documentation.
To start the deployment, launch the CloudFormation template:
CloudFormation stack parameters
The following table lists and describes the parameters for deploying the solution to export query logs from multiple Amazon Redshift clusters.
Property
Default
Description
S3Bucket
mybucket
The bucket this solution uses to store the exported query logs, stage code artifacts, and perform unloads from Amazon Redshift. For example, the mybucket/extract_rs_logs/data bucket is used for storing all the exported query logs for each system table partitioned by the cluster. The mybucket/extract_rs_logs/temp/ bucket is used for temporarily staging the unloaded data from Amazon Redshift. The mybucket/extract_rs_logs/code bucket is used for storing all the code artifacts required for Lambda and the AWS Glue ETL jobs.
ExportEnabledRedshiftClusters
Requires Input
A comma-separated list of cluster names from which the system table logs need to be exported.
DataStoreSecurityGroups
Requires Input
A list of security groups with an inbound rule to the Amazon Redshift clusters provided in the parameter, ExportEnabledClusters. These security groups should also have a self-referencing inbound rule on all TCP ports, as explained on Connecting to a JDBC Data Store in a VPC.
After you launch the template and create the stack, you see that the following resources have been created:
AWS Glue connections for each Amazon Redshift cluster you provided in the CloudFormation stack parameter, ExportEnabledRedshiftClusters.
All parameters required for this solution created in the parameter store.
The Lambda function that invokes the AWS Glue ETL jobs for each configured Amazon Redshift cluster at a regular interval of five minutes.
The DynamoDB table that captures the last exported time stamps for each exported cluster-table combination.
The AWS Glue ETL jobs to export query logs from each Amazon Redshift cluster provided in the CloudFormation stack parameter, ExportEnabledRedshiftClusters.
The IAM roles and policies required for the Lambda function and AWS Glue ETL jobs.
After the deployment
For each Amazon Redshift cluster for which you enabled the solution through the CloudFormation stack parameter, ExportEnabledRedshiftClusters, the automated deployment includes temporary credentials that you must update after the deployment:
Note the parameters <<cluster_name>>.user and redshift_query_logs.<<cluster_name>>.password that correspond to each Amazon Redshift cluster for which you enabled this solution. Edit these parameters to replace the placeholder values with the right credentials.
For example, if product-warehouse is one of the clusters for which you enabled system table export, you edit these two parameters with the right user name and password and choose Save parameter.
Querying the exported system tables
Within a few minutes after the solution deployment, you should see Amazon Redshift query logs being exported to the Amazon S3 location, <<S3Bucket_you_provided>>/extract_redshift_query_logs/data/. In that bucket, you should see the eight system tables partitioned by customer name and date: stl_alert_event_log, stl_dlltext, stl_explain, stl_query, stl_querytext, stl_scan, stl_utilitytext, and stl_wlm_query.
To run cross-cluster diagnostic queries on the exported system tables, create external tables in the AWS Glue Data Catalog. To make it easier for you to get started, I provide a CloudFormation template that creates an AWS Glue crawler, which crawls the exported system tables stored in Amazon S3 and builds the external tables in the AWS Glue Data Catalog.
Launch this CloudFormation template to create external tables that correspond to the Amazon Redshift system tables. S3Bucket is the only input parameter required for this stack deployment. Provide the same Amazon S3 bucket name where the system tables’ data is being exported. After you successfully create the stack, you can see the eight tables in the database, redshift_query_logs_db, as shown in the following screenshot.
Now, navigate to the Athena console to run cross-cluster diagnostic queries. The following screenshot shows a diagnostic query executed in Athena that retrieves query alerts logged across multiple Amazon Redshift clusters.
You can build the following example Amazon QuickSight dashboard by running cross-cluster diagnostic queries on Athena to identify the hourly query count and the key query alert events across multiple Amazon Redshift clusters.
How to extend the solution
You can extend this post’s solution in two ways:
Add any new Amazon Redshift clusters that you spin up after you deploy the solution.
Add other system tables or custom query results to the list of exports from an Amazon Redshift cluster.
Extend the solution to other Amazon Redshift clusters
To extend the solution to more Amazon Redshift clusters, add the three cluster-specific parameters in the AWS Systems Manager parameter store following the guidelines earlier in this post. Modify the redshift_query_logs.global.enabled_cluster_list parameter to append the new cluster to the comma-separated string.
Extend the solution to add other tables or custom queries to an Amazon Redshift cluster
The current solution ships with the export functionality for the following Amazon Redshift system tables:
stl_alert_event_log
stl_dlltext
stl_explain
stl_query
stl_querytext
stl_scan
stl_utilitytext
stl_wlm_query
You can easily add another system table or custom query by adding a few lines of code to the AWS Glue ETL job, <<cluster-name>_extract_rs_query_logs. For example, suppose that from the product-warehouse Amazon Redshift cluster you want to export orders greater than $2,000. To do so, add the following five lines of code to the AWS Glue ETL job product-warehouse_extract_rs_query_logs, where product-warehouse is your cluster name:
Get the last-processed time-stamp value. The function creates a value if it doesn’t already exist.
returnDF=functions.runQuery(query="select * from sales s join order o where o.order_amnt > 2000 and sale_timestamp > '{}'".format (salesLastProcessTSValue) ,tableName="mydb.sales_2000",job_configs=job_configs)
In this post, I demonstrate a serverless solution to retain the system tables’ log data across multiple Amazon Redshift clusters. By using this solution, you can incrementally export the data from system tables into Amazon S3. By performing this export, you can build cross-cluster diagnostic queries, build audit dashboards, and derive insights into capacity planning by using services such as Athena. I also demonstrate how you can extend this solution to other ad hoc query use cases or tables other than system tables by adding a few lines of code.
Karthik Sonti is a senior big data architect at Amazon Web Services. He helps AWS customers build big data and analytical solutions and provides guidance on architecture and best practices.
Thanks to Raja Mani, AWS Solutions Architect, for this great blog.
—
In this blog post, I’ll walk you through the steps for setting up continuous replication of an AWS CodeCommit repository from one AWS region to another AWS region using a serverless architecture. CodeCommit is a fully-managed, highly scalable source control service that stores anything from source code to binaries. It works seamlessly with your existing Git tools and eliminates the need to operate your own source control system. Replicating an AWS CodeCommit repository from one AWS region to another AWS region enables you to achieve lower latency pulls for global developers. This same approach can also be used to automatically back up repositories currently hosted on other services (for example, GitHub or BitBucket) to AWS CodeCommit.
This solution uses AWS Lambda and AWS Fargate for continuous replication. Benefits of this approach include:
The replication process can be easily setup to trigger based on events, such as commits made to the repository.
Setting up a serverless architecture means you don’t need to provision, maintain, or administer servers.
Note: AWS Fargate has a limitation of 10 GB for storage and is available in US East (N. Virginia) region. A similar solution that uses Amazon EC2 instances to replicate the repositories on a schedule was published in a previous blog and can be used if your repository does not meet these conditions.
Replication using Fargate
As you follow this blog post, you’ll set up an architecture that looks like this:
Any change in the AWS CodeCommit repository will trigger a Lambda function. The Lambda function will call the Fargate task that replicates the repository using a Git command line tool.
Let us assume a user wants to replicate a repository (Source) from US East (N. Virginia/us-east-1) region to a repository (Destination) in US West (Oregon/us-west-2) region. I’ll walk you through the steps for it:
Prerequisites
Create an AWS Service IAM role for Amazon EC2 that has permission for both source and destination repositories, IAM CreateRole, AttachRolePolicy and Amazon ECR privileges. Here is the EC2 role policy I used:
You need a Docker environment to build this solution. You can launch an EC2 instance and install Docker (or) you can use AWS Cloud9 that comes with Docker and Git preinstalled. I used an EC2 instance and installed Docker in it. Use the IAM role created in the previous step when creating the EC2 instance. I am going to refer this environment as “Docker Environment” in the following steps.
You need to install the AWS CLI on the Docker environment. For AWS CLI installation, refer this page.
You need to install Git, including a Git command line on the Docker environment.
Step 1: Create the Docker image
To create the Docker image, first it needs a Dockerfile. A Dockerfile is a manifest that describes the base image to use for your Docker image and what you want installed and running on it. For more information about Dockerfiles, go to the Dockerfile Reference.
1. Choose a directory in the Docker environment and perform the following steps in that directory. I used /home/ec2-user directory to perform the following steps.
2. Clone the AWS CodeCommit repository in the Docker environment. Open the terminal to the Docker environment and run the following commands to clone your source AWS CodeCommit repository (I ran the commands from /home/ec2-user directory):
Note: Change the URL marked in red to your source and destination repository URL.
3. Create a file called Dockerfile (case sensitive) with the following content (I created it in /home/ec2-user directory):
# Pull the Amazon Linux latest base image
FROM amazonlinux:latest
#Install aws-cli and git command line tools
RUN yum -y install unzip aws-cli
RUN yum -y install git
WORKDIR /home/ec2-user
RUN mkdir LocalRepository
WORKDIR /home/ec2-user/LocalRepository
#Copy Cloned CodeCommit repository to Docker container
COPY ./LocalRepository /home/ec2-user/LocalRepository
#Copy shell script that does the replication
COPY ./repl_repository.bash /home/ec2-user/LocalRepository
RUN chmod ugo+rwx /home/ec2-user/LocalRepository/repl_repository.bash
WORKDIR /home/ec2-user/LocalRepository
#Call this script when Docker starts the container
ENTRYPOINT ["/home/ec2-user/LocalRepository/repl_repository.bash"]
4. Copy the following shell script into a file called repl_repository.bash to the DockerFile directory location in the Docker environment (I created it in /home/ec2-user directory)
6. Verify whether the replication is working by running the repl_repository.bash script from the LocalRepository directory. Go to LocalRepository directory and run this command: . ../repl_repository.bash If it is successful, you will get the “Everything up-to-date” at the last line of the result like this:
$ . ../repl_repository.bash
Everything up-to-date
Step 2: Build the Docker Image
1. Build the Docker image by running this command from the directory where you created the DockerFile in the Docker environment in the previous step (I ran it from /home/ec2-user directory):
$ docker build . –t ccrepl
Output: It installs various packages and set environment variables as part of steps 1 to 3 from the Dockerfile. The steps 4 to 11 from the Dockerfile should produce an output similar to the following:
2. Run the following command to verify that the image was created successfully. It will display “Everything up-to-date” at the end if it is successful.
[[email protected] LocalRepository]$ docker run ccrepl
Everything up-to-date
Step 3: Push the Docker Image to Amazon Elastic Container Registry (ECR)
Perform the following steps in the Docker Environment.
1. Run the AWS CLI configure command and set default region as your source repository region (I used us-east-1).
$ aws configure set default.region <Source Repository Region>
2. Create an Amazon ECR repository using this command to store your ccrepl image (Note the repositoryUri in the output):
2. Create a role called AccessRoleForCCfromFG using the following command in the DockerEnvironment:
$ aws iam create-role --role-name AccessRoleForCCfromFG --assume-role-policy-document file://trustpolicyforecs.json
3. Assign CodeCommit service full access to the above role using the following command in the DockerEnvironment:
$ aws iam attach-role-policy --policy-arn arn:aws:iam::aws:policy/AWSCodeCommitFullAccess --role-name AccessRoleForCCfromFG
4. In the Amazon ECS Console, choose Repositories and select the ccrepl repository that was created in the previous step. Copy the Repository URI.
5. In the Amazon ECS Console, choose Task Definitions and click Create New Task Definition.
6. Select launch type compatibility as FARGATE and click Next Step.
7. In the create task definition screen, do the following:
In Task Definition Name, type ccrepl
In Task Role, choose AccessRoleForCCfromFG
In Task Memory, choose 2GB
In Task CPU, choose 1 vCPU
Click Add Container under Container Definitions in the same screen. In the Add Container screen, do the following:
Enter Container name as ccreplcont
Enter Image URL copied from step 4
Enter Memory Limits as 128 and click Add.
Note: Select TaskExecutionRole as “ecsTaskExecutionRole” if it already exists. If not, select create new role and it will create “ecsTaskExecutionRole” for you.
8. Click the Create button in the task definition screen to create the task. It will successfully create the task, execution role and AWS CloudWatch Log groups.
9. In the Amazon ECS Console, click Clusters and create cluster. Select template as “Networking only, Powered by AWS Fargate” and click next step.
10. Enter cluster name as ccreplcluster and click create.
Step 5: Create the Lambda Function
In this section, I used Amazon Elastic Container Service (ECS) run task API from Lambda to invoke the Fargate task.
1. In the IAM Console, create a new role called ECSLambdaRole with the permissions to AWS CodeCommit, Amazon ECS as well as pass roles privileges needed to run the ECS task. Your statement should look similar to the following (replace <your account id>):
2. In AWS management console, select VPC service and click subnets in the left navigation screen. Note down the Subnet IDs that you want to run the Fargate task in.
3. Create a new Lambda Node.js function called FargateTaskExecutionFunc and assign the role ECSLambdaRole with the following content:
Note: Replace subnets values (marked in red color) with the subnet IDs you identified as the subnets you wanted to run the Fargate task on in Step 2 of this section.
1. In the Lambda Console, click FargateTaskExecutionFunc under functions.
2. Under Add triggers in the Designer, select CodeCommit
3. In the Configure triggers screen, do the following:
Enter Repository name as Source (your source repository name)
Enter trigger name as LambdaTrigger
Leave the Events as “All repository events”
Leave the Branch names as “All branches”
Click Add button
Click Save button to save the changes
Step 6: Verification
To test the application, make a commit and push the changes to the source repository in AWS CodeCommit. That should automatically trigger the Lambda function and replicate the changes in the destination repository. You can verify this by checking CloudWatch Logs for Lambda and ECS, or simply going to the destination repository and verifying the change appears.
Conclusion
Congratulations! You have successfully configured repository replication of an AWS CodeCommit repository using AWS Lambda and AWS Fargate. You can use this technique in a deployment pipeline. You can also tweak the trigger configuration in AWS CodeCommit to call the Lambda function in response to any supported trigger event in AWS CodeCommit.
This post courtesy of Ed Lima, AWS Solutions Architect
We are excited to announce that you can now develop your AWS Lambda functions using the Node.js 8.10 runtime, which is the current Long Term Support (LTS) version of Node.js. Start using this new version today by specifying a runtime parameter value of nodejs8.10 when creating or updating functions.
Supporting async/await
The Lambda programming model for Node.js 8.10 now supports defining a function handler using the async/await pattern.
Asynchronous or non-blocking calls are an inherent and important part of applications, as user and human interfaces are asynchronous by nature. If you decide to have a coffee with a friend, you usually order the coffee then start or continue a conversation with your friend while the coffee is getting ready. You don’t wait for the coffee to be ready before you start talking. These activities are asynchronous, because you can start one and then move to the next without waiting for completion. Otherwise, you’d delay (or block) the start of the next activity.
Asynchronous calls used to be handled in Node.js using callbacks. That presented problems when they were nested within other callbacks in multiple levels, making the code difficult to maintain and understand.
Promises were implemented to try to solve issues caused by “callback hell.” They allow asynchronous operations to call their own methods and handle what happens when a call is successful or when it fails. As your requirements become more complicated, even promises become harder to work with and may still end up complicating your code.
Async/await is the new way of handling asynchronous operations in Node.js, and makes for simpler, easier, and cleaner code for non-blocking calls. It still uses promises but a callback is returned directly from the asynchronous function, just as if it were a synchronous blocking function.
Take for instance the following Lambda function to get the current account settings, using the Node.js 6.10 runtime:
let AWS = require('aws-sdk');
let lambda = new AWS.Lambda();
exports.handler = (event, context, callback) => {
let getAccountSettingsPromise = lambda.getAccountSettings().promise();
getAccountSettingsPromise.then(
(data) => {
callback(null, data);
},
(err) => {
console.log(err);
callback(err);
}
);
};
With the new Node.js 8.10 runtime, there are new handler types that can be declared with the “async” keyword or can return a promise directly.
This is how the same function looks like using async/await with Node.js 8.10:
let AWS = require('aws-sdk');
let lambda = new AWS.Lambda();
exports.handler = async (event) => {
return await lambda.getAccountSettings().promise() ;
};
Alternatively, you could have the handler return a promise directly:
let AWS = require('aws-sdk');
let lambda = new AWS.Lambda();
exports.handler = (event) => {
return new Promise((resolve, reject) => {
lambda.getAccountSettings(event)
.then((data) => {
resolve data;
})
.catch(reject);
});
};
The new handler types are alternatives to the callback pattern, which is still fully supported.
All three functions return the same results. However, in the new runtime with async/await, all callbacks in the code are gone, which makes it easier to read. This is especially true for those less familiar with promises.
Another great advantage of async/await is better error handling. You can use a try/catch block inside the scope of an async function. Even though the function awaits an asynchronous operation, any errors end up in the catch block.
You can improve your previous Node.js 8.10 function with this trusted try/catch error handling pattern:
let AWS = require('aws-sdk');
let lambda = new AWS.Lambda();
let data;
exports.handler = async (event) => {
try {
data = await lambda.getAccountSettings().promise();
}
catch (err) {
console.log(err);
return err;
}
return data;
};
While you now have a similar number of lines in both runtimes, the code is cleaner and more readable with async/await. It makes the asynchronous calls look more synchronous. However, it is important to notice that the code is still executed the same way as if it were using a callback or promise-based API.
Backward compatibility
You may port your existing Node.js 4.3 and 6.10 functions over to Node.js 8.10 by updating the runtime. Node.js 8.10 does include numerous breaking changes from previous Node versions.
Make sure to review the API changes between Node.js 4.3, 6.10, and Node.js 8.10 to see if there are other changes that might affect your code. We recommend testing that your Lambda function passes internal validation for its behavior when upgrading to the new runtime version.
You can use Lambda versions/aliases to safely test that your function runs as expected on Node 8.10, before routing production traffic to it.
New node features
You can now get better performance when compared to the previous LTS version 6.x (up to 20%). The new V8 6.0 engine comes with Turbofan and the Ignition pipeline, which leads to lower memory consumption and faster startup time across Node.js applications.
HTTP/2, which is subject to future changes, allows developers to use the new protocol to speed application development and undo many of HTTP/1.1 workarounds to make applications faster, simpler, and more powerful.
This video presents the project MoveLens: a voice controlled glasses with magnifying lens. It was the my entry for the Voice Activated context on unstructables. Check the step by step guide at Voice Controlled Glasses With Magnifying Lens. Source code: https://github.com/pichiliani/MoveLens Step by Step guide: https://www.instructables.com/id/Voice-Controlled-Glasses-With-Magnifying-Lens/
It’s a kind of magnification
We’ve all been there – that moment when you need another pair of hands to complete a task. And while these glasses may not hold all the answers, they’re a perfect addition to any hobbyist’s arsenal.
Introducing Mauro Pichilliani’s voice-activated glasses: a pair of frames with magnification lenses that can flip up and down in response to a voice command, depending on the task at hand. No more needing to put down your tools in order to put magnifying glasses on. No more trying to re-position a magnifying glass with the back of your left wrist, or getting grease all over your lenses.
As Mauro explains in his tutorial for the glasses:
Many professionals work for many hours looking at very small areas, such as surgeons, watchmakers, jewellery designers and so on. Most of the time these professionals use some kind of magnification glasses that helps them to see better the area they are working with and other tiny items used on the job. The devices that had magnifications lens on a form factor of a glass usually allow the professional to move the lens out of their eye sight, i.e. put aside the lens. However, in some scenarios touching the lens or the glass rim to move away the lens can contaminate the fingers. Also, it is cumbersome and can break the concentration of the professional.
Voice-controlled magnification glasses
Using a Raspberry Pi Zero W, a servo motor, a microphone, and the IBM Watson speech-to-text service, Mauro built a pair of glasses that lets users control the position of the magnification lenses with voice commands.
The glasses Mauro modified, before he started work on them; you have to move the lenses with your hands, like it’s October 2015
Mauro started by dismantling a pair of standard magnification glasses in order to modify the lens supports to allow them to move freely. He drilled a hole in one of the lens supports to provide a place to attach the servo, and used lollipop sticks and hot glue to fix the lenses relative to one another, so they would both move together under the control of the servo. Then, he set up a Raspberry Pi Zero, installing Raspbian and software to use a USB microphone; after connecting the servo to the Pi Zero’s GPIO pins, he set up the Watson speech-to-text service.
Finally, he wrote the code to bring the project together. Two Python scripts direct the servo to raise and lower the lenses, and a Node.js script captures audio from the microphone, passes it on to Watson, checks for an “up” or “down” command, and calls the appropriate Python script as required.
Your turn
You can follow the tutorial on the Instructables website, where Mauro entered the glasses into the Instructables Voice Activated Challenge. And if you’d like to take your first steps into digital making using the Raspberry Pi, take a look at our free online projects.
This post was contributed by Christoph Kassen, AWS Solutions Architect
With the emergence of microservices architectures, the number of services that are part of a web application has increased a lot. It’s not unusual anymore to build and operate hundreds of separate microservices, all as part of the same application.
Think of a typical e-commerce application that displays products, recommends related items, provides search and faceting capabilities, and maintains a shopping cart. Behind the scenes, many more services are involved, such as clickstream tracking, ad display, targeting, and logging. When handling a single user request, many of these microservices are involved in responding. Understanding, analyzing, and debugging the landscape is becoming complex.
AWS X-Ray provides application-tracing functionality, giving deep insights into all microservices deployed. With X-Ray, every request can be traced as it flows through the involved microservices. This provides your DevOps teams the insights they need to understand how your services interact with their peers and enables them to analyze and debug issues much faster.
With microservices architectures, every service should be self-contained and use the technologies best suited for the problem domain. Depending on how the service is built, it is deployed and hosted differently.
One of the most popular choices for packaging and deploying microservices at the moment is containers. The application and its dependencies are clearly defined, the container can be built on CI infrastructure, and the deployment is simplified greatly. Container schedulers, such as Kubernetes and Amazon Elastic Container Service (Amazon ECS), greatly simplify deploying and running containers at scale.
Running X-Ray on Kubernetes
Kubernetes is an open-source container management platform that automates deployment, scaling, and management of containerized applications.
This post shows you how to run X-Ray on top of Kubernetes to provide application tracing capabilities to services hosted on a Kubernetes cluster. Additionally, X-Ray also works for applications hosted on Amazon ECS, AWS Elastic Beanstalk, Amazon EC2, and even when building services with AWS Lambda functions. This flexibility helps you pick the technology you need while still being able to trace requests through all of the services running within your AWS environment.
The complete code, including a simple Node.js based demo application is available in the corresponding aws-xray-kubernetes GitHub repository, so you can quickly get started with X-Ray.
The sample application within the repository consists of two simple microservices, Service-A and Service-B. The following architecture diagram shows how each service is deployed with two Pods on the Kubernetes cluster:
Requests are sent to the Service-A from clients.
Service-A then contacts Service-B.
The requests are serviced by Service-B.
Service-B adds a random delay to each request to show different response times in X-Ray.
To test out the sample applications on your own Kubernetes cluster use the Dockerfiles provided in the GitHub repository, build the two containers, push them to a container registry and apply the yaml configuration with kubectl to your Kubernetes cluster.
Prerequisites
If you currently do not have a cluster running within your AWS environment, take a look at Amazon Elastic Container Service for Kubernetes (Amazon EKS), or use the instructions from the Manage Kubernetes Clusters on AWS Using Kops blog post to spin up a self-managed Kubernetes cluster.
Security Setup for X-Ray
The nodes in the Kubernetes cluster hosting web application Pods need IAM permissions so that the Pods hosting the X-Ray daemon can send traces to the X-Ray service backend.
The easiest way is to set up a new IAM policy allowing all worker nodes within your Kubernetes cluster to write data to X-Ray. In the IAM console or AWS CLI, create a new policy like the following:
Adjust the AWS account ID within the resource. Give the policy a descriptive name, such as k8s-nodes-XrayWriteAccess.
Next, attach the policy to the instance profile for the Kubernetes worker nodes. Therefore, select the IAM role assigned to your worker instances (check the EC2 console if you are unsure) and attach the IAM policy created earlier to it. You can attach the IAM permissions directly from the command line with the following command:
aws iam attach-role-policy --role-name k8s-nodes --policy-arn arn:aws:iam::000000000000:policy/k8s-nodes-XrayWriteAccess
Build the X-Ray daemon Docker image
The X-Ray daemon is available as a single, statically compiled binary that can be downloaded directly from the AWS website.
The first step is to create a Docker container hosting the X-Ray daemon binary and exposing port 2000 via UDP. The daemon is either configured via command line parameters or a configuration file. The most important option is to set the listen port to the correct IP address so that tracing requests from application Pods can be accepted.
To build your own Docker image containing the X-Ray daemon, use the Dockerfile shown below.
# Use Amazon Linux Version 1
FROM amazonlinux:1
# Download latest 2.x release of X-Ray daemon
RUN yum install -y unzip && \
cd /tmp/ && \
curl https://s3.dualstack.us-east-2.amazonaws.com/aws-xray-assets.us-east-2/xray-daemon/aws-xray-daemon-linux-2.x.zip > aws-xray-daemon-linux-2.x.zip && \
unzip aws-xray-daemon-linux-2.x.zip && \
cp xray /usr/bin/xray && \
rm aws-xray-daemon-linux-2.x.zip && \
rm cfg.yaml
# Expose port 2000 on udp
EXPOSE 2000/udp
ENTRYPOINT ["/usr/bin/xray"]
# No cmd line parameters, use default configuration
CMD ['']
This container image is based on Amazon Linux which results in a small container image. To build and tag the container image run docker build -t xray:latest.
Create an Amazon ECR repository
Create a repository in Amazon Elastic Container Registry (Amazon ECR) to hold your X-Ray Docker image. Your Kubernetes cluster uses this repository to pull the image from upon deployment of the X-Ray Pods.
Use the following CLI command to create your repository or alternatively the AWS Management Console:
Make sure that you configure the kubectl tool properly for your cluster to be able to deploy the X-Ray Pod onto your Kubernetes cluster. After the X-Ray Pods are deployed to your Kubernetes cluster, applications can send tracing information to the X-Ray daemon on their host. The biggest advantage is that you do not need to provide X-Ray as a sidecar container alongside your application. This simplifies the configuration and deployment of your applications and overall saves resources on your cluster.
To deploy the X-Ray daemon as Pods onto your Kubernetes cluster, run the following from the cloned GitHub repository:
kubectl apply -f xray-k8s-daemonset.yaml
This deploys and maintains an X-Ray Pod on each worker node, which is accepting tracing data from your microservices and routing it to one of the X-Ray pods. When deploying the container using a DaemonSet, the X-Ray port is also exposed directly on the host. This way, clients can connect directly to the daemon on your node. This avoids unnecessary network traffic going across your cluster.
Connecting to the X-Ray daemon
To integrate application tracing with your applications, use the X-Ray SDK for one of the supported programming languages:
Java
Node.js
.NET (Framework and Core)
Go
Python
The SDKs provide classes and methods for generating and sending trace data to the X-Ray daemon. Trace data includes information about incoming HTTP requests served by the application, and calls that the application makes to downstream services using the AWS SDK or HTTP clients.
By default, the X-Ray SDK expects the daemon to be available on 127.0.0.1:2000. This needs to be changed in this setup, as the daemon is not part of each Pod but hosted within its own Pod.
The deployed X-Ray DaemonSet exposes all Pods via the Kubernetes service discovery, so applications can use this endpoint to discover the X-Ray daemon. If you deployed to the default namespace, the endpoint is:
xray-service.default
Applications now need to set the daemon address either with the AWS_XRAY_DAEMON_ADDRESS environment variable (preferred) or directly within the SDK setup code:
To set up the environment variable, include the following information in your Kubernetes application deployment description YAML. That exposes the X-Ray service address via the environment variable, where it is picked up automatically by the SDK.
Sending tracing information from your application is straightforward with the X-Ray SDKs. The example code below serves as a starting point to instrument your application with traces. Take a look at the two sample applications in the GitHub repository to see how to send traces from Service A to Service B. The diagram below visualizes the flow of requests between the services.
Because your application is running within containers, enable both the EC2Plugin and ECSPlugin, which gives you information about the Kubernetes node hosting the Pod as well as the container name. Despite the name ECSPlugin, this plugin gives you additional information about your container when running your application on Kubernetes.
var app = express();
//...
var AWSXRay = require('aws-xray-sdk');
AWSXRay.config([XRay.plugins.EC2Plugin, XRay.plugins.ECSPlugin]);
app.use(AWSXRay.express.openSegment('defaultName')); //required at the start of your routes
app.get('/', function (req, res) {
res.render('index');
});
app.use(AWSXRay.express.closeSegment()); //required at the end of your routes / first in error handling routes
For more information about all options and possibilities to instrument your application code, see the X-Ray documentation page for the corresponding SDK information.
The picture below shows the resulting service map that provides insights into the flow of requests through the microservice landscape. You can drill down here into individual traces and see which path each request has taken.
From the service map, you can drill down into individual requests and see where they originated from and how much time was spent in each service processing the request.
You can also view details about every individual segment of the trace by clicking on it. This displays more details.
On the Resources tab, you will see the Kubernetes Pod picked up by the ECSPlugin, which handled the request, as well as the instance that Pod was running on.
Summary
In this post, I shared how to deploy and run X-Ray on an existing Kubernetes cluster. Using tracing gives you deep insights into your applications to ease analysis and spot potential problems early. With X-Ray, you get these insights for all your applications running on AWS, no matter if they are hosted on Amazon ECS, AWS Lambda, or a Kubernetes cluster.
We have been busy adding new features and capabilities to Amazon Redshift, and we wanted to give you a glimpse of what we’ve been doing over the past year. In this article, we recap a few of our enhancements and provide a set of resources that you can use to learn more and get the most out of your Amazon Redshift implementation.
In 2017, we made more than 30 announcements about Amazon Redshift. We listened to you, our customers, and delivered Redshift Spectrum, a feature of Amazon Redshift, that gives you the ability to extend analytics to your data lake—without moving data. We launched new DC2 nodes, doubling performance at the same price. We also announced many new features that provide greater scalability, better performance, more automation, and easier ways to manage your analytics workloads.
To see a full list of our launches, visit our what’s new page—and be sure to subscribe to our RSS feed.
Major launches in 2017
Amazon Redshift Spectrum—extend analytics to your data lake, without moving data
We launched Amazon Redshift Spectrum to give you the freedom to store data in Amazon S3, in open file formats, and have it available for analytics without the need to load it into your Amazon Redshift cluster. It enables you to easily join datasets across Redshift clusters and S3 to provide unique insights that you would not be able to obtain by querying independent data silos.
With Redshift Spectrum, you can run SQL queries against data in an Amazon S3 data lake as easily as you analyze data stored in Amazon Redshift. And you can do it without loading data or resizing the Amazon Redshift cluster based on growing data volumes. Redshift Spectrum separates compute and storage to meet workload demands for data size, concurrency, and performance. Redshift Spectrum scales processing across thousands of nodes, so results are fast, even with massive datasets and complex queries. You can query open file formats that you already use—such as Apache Avro, CSV, Grok, ORC, Apache Parquet, RCFile, RegexSerDe, SequenceFile, TextFile, and TSV—directly in Amazon S3, without any data movement.
“For complex queries, Redshift Spectrum provided a 67 percent performance gain,” said Rafi Ton, CEO, NUVIAD. “Using the Parquet data format, Redshift Spectrum delivered an 80 percent performance improvement. For us, this was substantial.”
DC2 nodes—twice the performance of DC1 at the same price
We launched second-generation Dense Compute (DC2) nodes to provide low latency and high throughput for demanding data warehousing workloads. DC2 nodes feature powerful Intel E5-2686 v4 (Broadwell) CPUs, fast DDR4 memory, and NVMe-based solid state disks (SSDs). We’ve tuned Amazon Redshift to take advantage of the better CPU, network, and disk on DC2 nodes, providing up to twice the performance of DC1 at the same price. Our DC2.8xlarge instances now provide twice the memory per slice of data and an optimized storage layout with 30 percent better storage utilization.
“Redshift allows us to quickly spin up clusters and provide our data scientists with a fast and easy method to access data and generate insights,” said Bradley Todd, technology architect at Liberty Mutual. “We saw a 9x reduction in month-end reporting time with Redshift DC2 nodes as compared to DC1.”
On average, our customers are seeing 3x to 5x performance gains for most of their critical workloads.
We introduced short query acceleration to speed up execution of queries such as reports, dashboards, and interactive analysis. Short query acceleration uses machine learning to predict the execution time of a query, and to move short running queries to an express short query queue for faster processing.
We launched results caching to deliver sub-second response times for queries that are repeated, such as dashboards, visualizations, and those from BI tools. Results caching has an added benefit of freeing up resources to improve the performance of all other queries.
We also introduced late materialization to reduce the amount of data scanned for queries with predicate filters by batching and factoring in the filtering of predicates before fetching data blocks in the next column. For example, if only 10 percent of the table rows satisfy the predicate filters, Amazon Redshift can potentially save 90 percent of the I/O for the remaining columns to improve query performance.
We launched query monitoring rules and pre-defined rule templates. These features make it easier for you to set metrics-based performance boundaries for workload management (WLM) queries, and specify what action to take when a query goes beyond those boundaries. For example, for a queue that’s dedicated to short-running queries, you might create a rule that aborts queries that run for more than 60 seconds. To track poorly designed queries, you might have another rule that logs queries that contain nested loops.
Customer insights
Amazon Redshift and Redshift Spectrum serve customers across a variety of industries and sizes, from startups to large enterprises. Visit our customer page to see the success that customers are having with our recent enhancements. Learn how companies like Liberty Mutual Insurance saw a 9x reduction in month-end reporting time using DC2 nodes. On this page, you can find case studies, videos, and other content that show how our customers are using Amazon Redshift to drive innovation and business results.
In addition, check out these resources to learn about the success our customers are having building out a data warehouse and data lake integration solution with Amazon Redshift:
You can enhance your Amazon Redshift data warehouse by working with industry-leading experts. Our AWS Partner Network (APN) Partners have certified their solutions to work with Amazon Redshift. They offer software, tools, integration, and consulting services to help you at every step. Visit our Amazon Redshift Partner page and choose an APN Partner. Or, use AWS Marketplace to find and immediately start using third-party software.
To see what our Partners are saying about Amazon Redshift Spectrum and our DC2 nodes mentioned earlier, read these blog posts:
If you are evaluating or considering a proof of concept with Amazon Redshift, or you need assistance migrating your on-premises or other cloud-based data warehouse to Amazon Redshift, our team of product experts and solutions architects can help you with architecting, sizing, and optimizing your data warehouse. Contact us using this support request form, and let us know how we can assist you.
If you are an Amazon Redshift customer, we offer a no-cost health check program. Our team of database engineers and solutions architects give you recommendations for optimizing Amazon Redshift and Amazon Redshift Spectrum for your specific workloads. To learn more, email us at [email protected].
Larry Heathcote is a Principle Product Marketing Manager at Amazon Web Services for data warehousing and analytics. Larry is passionate about seeing the results of data-driven insights on business outcomes. He enjoys family time, home projects, grilling out and the taste of classic barbeque.
AWS IoT is a managed cloud platform that lets connected devices easily and securely interact with cloud applications and other devices by using the Message Queuing Telemetry Transport (MQTT) protocol, HTTP, and the MQTT over the WebSocket protocol. Every connected device must authenticate to AWS IoT, and AWS IoT must authorize all requests to determine if access to the requested operations or resources is allowed. Until now, AWS IoT has supported two kinds of authentication techniques: the Transport Layer Security (TLS) mutual authentication protocol and the AWS Signature Version 4 algorithm. Callers must possess either an X.509 certificate or AWS security credentials to be able to authenticate their calls. The requests are authorized based on the policies attached to the certificate or the AWS security credentials.
However, many of our customers have their own systems that issue custom authorization tokens to their devices. These systems use different access control mechanisms such as OAuth over JWT or SAML tokens. AWS IoT now supports a custom authorizer to enable you to use custom authorization tokens for access control. You can now use custom tokens to authenticate and authorize HTTPS over the TLS server authentication protocol and MQTT over WebSocket connections to AWS IoT.
In this blog post, I explain the AWS IoT custom authorizer design and then demonstrate the end-to-end process of setting up a custom authorizer to authorize an HTTPS over TLS server authentication connection to AWS IoT using a custom authorization token. In this process, you configure an AWS Lambda function, which will validate the token and provide the policies necessary to control the access privileges on the connection.
Note: This post assumes you are familiar with AWS IoT and AWS Lambda enough to perform steps using the AWS CLI and OpenSSL. Make sure you are running the latest version of the AWS CLI.
Overview of the custom authorizer workflow
The following numbered diagram illustrates the custom authorizer workflow. The diagram is followed by explanations of the steps.
To explain the steps of the workflow as illustrated in the preceding diagram:
The connected device uses the AWS SDK or custom client to make an HTTPS or MQTT over WebSocket request to the AWS IoT gateway. The request includes a custom authorization token and the name of a preconfigured authorizer Lambda function that is to be invoked to validate the authorization token.
The AWS IoT gateway identifies the authorization token in the request and determines that it is a custom authorization request. The gateway checks if a Lambda authorization function is configured for the AWS account that owns the device. If yes, the gateway invokes the Lambda function by passing the authorization token.
The Lambda function verifies the authorization token and returns to the AWS IoT gateway a principal that identifies the connection and a set of AWS IoT policies that determine permissions for the requested operation. The Lambda function also returns two time-to-live values that determine the validity (in seconds) of the connection and policy documents.
The AWS IoT gateway invokes the AWS policy evaluation engine to authorize the requested operation against the set of policies that are received from the authorizer Lambda function.
The AWS policy evaluation engine evaluates the policy documents and returns the result to the AWS IoT gateway. The gateway then caches the policy documents.
If the policy evaluation allows the requested operation, the AWS IoT gateway serves the request. If the requested operation is denied, the AWS IoT gateway returns an AccessDenied exception with the status code of 403 to the device (the red line in the preceding diagram).
Outline of the steps to configure and use the custom authorizer
The following are the steps you will perform as part of the solution:
Create a Lambda function: Start by creating a Lambda function. The function takes the authorization token in the input, verifies it, and returns authorization policies to determine the caller’s permissions for the requested operation.
Create an authorizer: Create an authorizer in AWS IoT. An authorizer is an alternate data model pointing to a pre-created Lambda function. You can specify in the custom authorization request an authorizer name. AWS IoT invokes a corresponding Lambda function to verify the authorization token. You may update the authorizer to point to a different Lambda function and thus easily control which Lambda function to invoke to verify an authorization token.
Designate the default authorizer: You may designate one of your authorizers as the default authorizer. AWS IoT invokes the default authorizer implicitly when a custom authorization request does not include a specific authorizer name.
Add Lambda invocation permissions: AWS IoT needs to be able to call your Lambda function on your behalf to verify the token in the custom authorization request. You need to associate a resource policy with the Lambda function to allow this.
Test the Lambda function: When the Lambda function and the custom authorizer are configured, use the test function to verify that they are functioning correctly.
Invoke the custom authorizer: Finally, make an HTTPS request to the gateway that includes a custom authorization token. The request invokes the custom authorizer.
Deploy the solution
1. Create a Lambda function
In this step, I show you how to create a Lambda function that runs your custom authorizer code and returns a set of essential attributes to authorize the request.
Sign in to your AWS account and create from the Lambda console a Lambda function that takes as input an authorization token and performs whichever actions are necessary to validate the token, as shown in the following code example. The output, in JSON format, must contain the following attributes:
IsAuthenticated: This is a Boolean (true/false) attribute that indicates whether the request is authenticated.
PrincipalId: This is an alphanumeric string; the minimum length is 1 character, and the maximum length is 128 characters. This string acts as an identifier associated with the token that is received in the custom authorization request.
PolicyDocuments: This is a list of JSON formatted policy documents following the same conventions as an AWS IoT policy. The list contains at most 10 policy documents, each of which can be a maximum of 2,048 characters.
DisconnectAfterInSeconds: This indicates the maximum duration (in seconds) of the connection to the AWS IoT gateway, after which it will be disconnected. The minimum value is 300 seconds, and the maximum value is 86,400 seconds.
RefreshAfterInSeconds: This is the period between policy refreshes. When it lapses, the Lambda function is invoked again to allow for policy refreshes. The minimum value is 300 seconds, and the maximum value is 86,400 seconds.
The following code example is a Lambda function in Node.js 6.10 that authenticates a token.
// A simple authorizer Lambda function demonstrating
// how to parse auth token and generate response
exports.handler = function(event, context, callback) {
var token = event.token;
switch (token.toLowerCase()) {
case 'allow':
callback(null, generateAuthResponse(token, 'Allow'));
case 'deny':
callback(null, generateAuthResponse(token, 'Deny'));
default:
callback("Error: Invalid token");
}
};
// Helper function to generate authorization response
var generateAuthResponse = function(token, effect) {
// Invoke your preferred identity provider
// to get the authN and authZ response.
// Following is just for simplicity sake
var authResponse = {};
authResponse.isAuthenticated = true;
authResponse.principalId = 'principalId';
var policyDocument = {};
policyDocument.Version = '2012-10-17';
policyDocument.Statement = [];
var statement = {};
statement.Action = 'iot:Publish';
statement.Effect = effect;
statement.Resource = "arn:aws:iot:us-east-1:<your_aws_account_id>:topic/customauthtesting";
policyDocument.Statement[0] = statement;
authResponse.policyDocuments = [policyDocument];
authResponse.disconnectAfterInSeconds = 3600;
authResponse.refreshAfterInSeconds = 600;
return authResponse;
}
The preceding function takes an authorization token and returns an object containing the five attributes (a-e) described earlier in this step.
2. Create an authorizer
Now that you have created the Lambda function, you will create an authorizer with AWS IoT pointing to the Lambda function. You do this so that you can easily control which Lambda function to invoke to verify an authorization token. The following attributes are required to create an authorizer:
AuthorizerName: This is the name of the authorizer. It is a string; the minimum length is 1 character, and the maximum length is 128 characters.
AuthorizerFunctionArn: This is the Amazon Resource Name (ARN) of the Lambda function that you created in the previous step.
TokenKeyName: This specifies the key name that your device chooses, which indicates the token in the custom authorization HTTP request header. It is a string; the minimum length is 1 character, and the maximum length is 128 characters.
TokenSigningPublicKeys: This is a map of one (minimum) and two (maximum) public keys. It is a 2,048-bit key at minimum. You need to generate a key pair, sign the custom authorization token and include the digital signature in the request in order to be able to use custom authorization successfully. AWS IoT needs the corresponding public key to verify the digital signature. Therefore, you must provide the public key while creating an authorizer.
Status: This specifies the status (ACTIVE or INACTIVE) of the authorizer. It is optional. The default value is INACTIVE.
Run the following command in OpenSSL to create an RSA key pair that will be used to generate a token signature.
openssl genrsa -out private.pem 2048
Run the following command to create the public key out of the key pair generated in the previous step.
You need to store the key pair securely and pass the public key in the TokenSigningPublicKeys parameter when creating the authorizer in AWS IoT. You will use the private key in the key pair to sign the authorization token and include the signature in the custom authorization request.
Run the following command in the AWS CLI to create an authorizer.
You must set the authorizer in the ACTIVE status to be invoked. The describe-authorizer API returns the attributes of an existing authorizer. You can use the following command to verify if all the attributes in the authorizer are set correctly.
You can have multiple authorizers in your account. You can designate one of them as the default so that AWS IoT invokes it if the custom authorization request does not specify an authorizer name. Run the following command in the AWS CLI to designate a default authorizer.
AWS IoT needs to invoke your authorizer Lambda function to evaluate the custom authorizer token. You need to provide AWS IoT appropriate permissions to invoke your Lambda function when a custom authorization request is made. Use the AWS CLI with the AddPermission command to grant the AWS IoT service principal permission to call lambda:InvokeFunction, as shown in the following command.
Note that you are using the precreated AuthorizerArn as the SourceArn while granting the permission. The Lambda function gets triggered only if the source ARN provided by AWS IoT during the invocation matches with the SourceArn that you have given permission. Even if your Lambda function ARN is put in an authorizer owned by someone else, they cannot trigger the function causing illegitimate charge to you.
5. Test the Lambda function
To verify the configuration, test to see if AWS IoT can invoke the Lambda function and get the correct output. You can do this by using the TestInvokeAuthorizer API. The API takes the following input:
AuthorizerName: This is the name of the authorizer. It is a string; the minimum length is 1 character, and the maximum length is 128 characters.
Token: This specifies the custom authorization token to authorize the request to the AWS IoT gateway. It is a string; the minimum length is 1 character, and the maximum length is 1,024 characters.
TokenSignature: This is the token signature generated by using the private key with the SHA256withRSA algorithm. This is a string with a maximum length 2,560 characters. You must Base64-encode the signature while passing it as an input (the command follows).
Run the following command in OpenSSL to generate a signature for string, allow.
If AWS IoT is able to invoke the Lambda function successfully, the output of the TestInvokeAuthorizer API will be exactly the same as the output of the Lambda function. The following is sample output of the test-invoke-authorizer command for the Lambda function you created in Step 1 earlier in this post.
You can now make a custom authorization request to the AWS IoT gateway. Custom authorization is supported for HTTPS over TLS server authentication and MQTT over WebSocket connections. Regardless of the protocol, requests must include the following attributes in the header. Note that supplying these attributes through query parameters is not allowed for security reasons.
Token: This specifies the authorization token. The header name must be the same as the TokenKeyName of the authorizer.
TokenSignature: This specifies the Base64-encoded digital signature of the token string. The header name must be x-amz-customauthorizer-signature.
AuthorizerName: This specifies the name of one of the ACTIVE authorizers preconfigured in your account. The header name must be x-amz-customauthorizer-name. If this field is not present and you have preconfigured a default custom authorizer for your account, the AWS IoT gateway invokes the default authorizer to authenticate and authorize the request.
Run the following command in the AWS CLI to obtain your AWS account-specific AWS IoT endpoint. See the DescribeEndpoint API documentation for further details. You need to specify the endpoint when making requests to the AWS IoT gateway.
aws iot describe-endpoint
The following is sample output of the describe-endpoint command. It contains the endpointAddress.
Now, make an HTTPS request to the AWS IoT gateway to post a message. You may use your preferred HTTP client for the request. I use curl in the following example, which posts the message, “Hello from custom auth,” to an MQTT topic, customauthtesting, by using the token, allow.
If the command succeeds, you will see the following output.
HTTP/1.1 200 OK
content-type: application/json
content-length: 65
date: Sun, 07 Jan 2018 19:56:12 GMT
x-amzn-RequestId: e7c13873-6c61-a12c-1216-9a935901c130
connection: keep-alive
{"message":"OK","traceId":"e7c13873-6c61-a12c-1216-9a935901c130"}
Conclusion
In this blog post, I have shown how to configure a custom authorizer in your AWS account and use it to authorize an HTTPS over TLS server authentication connection and publish a message to a specific MQTT topic by using a custom authorization token. Similarly, you can use custom authorizers to authorize MQTT over WebSocket requests to the AWS IoT gateway to publish messages to a specific topic or subscribe to a topic filter.
If you have comments about this blog post, submit them in the “Comments” section below. If you have questions about or issues implementing this solution, start a new thread in the AWS IoT forum.
The Twelve-Factor App methodology is twelve best practices for building modern, cloud-native applications. With guidance on things like configuration, deployment, runtime, and multiple service communication, the Twelve-Factor model prescribes best practices that apply to a diverse number of use cases, from web applications and APIs to data processing applications. Although serverless computing and AWS Lambda have changed how application development is done, the Twelve-Factor best practices remain relevant and applicable in a serverless world.
In this post, I directly apply and compare the Twelve-Factor methodology to serverless application development with Lambda and Amazon API Gateway.
The Twelve Factors
As you’ll see, many of these factors are not only directly applicable to serverless applications, but in fact a default mechanism or capability of the AWS serverless platform. Other factors don’t fit, and I talk about how these factors may not apply at all in a serverless approach.
A general software development best practice is to have all of your code in revision control. This is no different with serverless applications.
For a single serverless application, your code should be stored in a single repository in which a single deployable artifact is generated and from which it is deployed. This single code base should also represent the code used in all of your application environments (development, staging, production, etc.). What might be different for serverless applications is the bounds for what constitutes a “single application.”
Here are two guidelines to help you understand the scope of an application:
If events are shared (such as a common Amazon API Gateway API), then the Lambda function code for those events should be put in the same repository.
Otherwise, break functions along event sources into their own repositories.
Following these two guidelines helps you keep your serverless applications scoped to a single purpose and help prevent complexity in your code base.
Code that needs to be used by multiple functions should be packaged into its own library and included inside your deployment package. Going back to the previous factor on codebase, if you find that you need to often include special processing or business logic, the best solution may be to try to create a purposeful library yourself. Every language that Lambda supports has a model for dependencies/libraries, which you can use:
Both Lambda and API Gateway allow you to set configuration information, using the environment in which each service runs.
In Lambda, these are called environment variables and are key-value pairs that can be set at deployment or when updating the function configuration. Lambda then makes these key-value pairs available to your Lambda function code using standard APIs supported by the language, like process.env for Node.js functions. For more information, see Programming Model, which contains examples for each supported language.
Lambda also allows you to encrypt these key-value pairs using KMS, such that they can be used to store secrets such as API keys or passwords for databases. You can also use them to help define application environment specifics, such as differences between testing or production environments where you might have unique databases or endpoints with which your Lambda function needs to interface. You could also use these for setting A/B testing flags or to enable or disable certain function logic.
For API Gateway, these configuration variables are called stage variables. Like environment variables in Lambda, these are key-value pairs that are available for API Gateway to consume or pass to your API’s backend service. Stage variables can be useful to send requests to different backend environments based on the URL from which your API is accessed. For example, a single configuration could support both beta.yourapi.com vs. prod.yourapi.com. You could also use stage variables to pass information to a Lambda function that causes it to perform different logic.
Because Lambda doesn’t allow you to run another service as part of your function execution, this factor is basically the default model for Lambda. Typically, you reference any database or data store as an external resource via HTTP endpoint or DNS name. These connection strings are ideally passed in via the configuration information, as previously covered.
The separation of build, release, and run stages follows the development best practices of continuous integration and delivery. AWS recommends that you have a CI &CD process no matter what type of application you are building. For serverless applications, this is no different. For more information, see the Building CI/CD Pipelines for Serverless Applications (SRV302) re:Invent 2017 session.
An example minimal pipeline (from presentation linked above)
This is inherent in how Lambda is designed so there is nothing more to consider. Lambda functions should always be treated as being stateless, despite the ability to potentially store some information locally between execution environment re-use. This is because there is no guaranteed affinity to any execution environment, and the potential for an execution environment to go away between invocations exists. You should always store any stateful information in a database, cache, or separate data store via a backing service.
This factor also does not apply to Lambda, as execution environments do not expose any direct networking to your functions. Instead of a port, Lambda functions are invoked via one or more triggering services or AWS APIs for Lambda. There are currently three different invocation models:
Lambda was built with massive concurrency and scale in mind. A recent post on this blog, titled Managing AWS Lambda Function Concurrency explained that for a serverless application, “the unit of scale is a concurrent execution” and that these are consumed by your functions.
Lambda automatically scales to meet the demands of invocations sent at your function. This is in contrast to a traditional compute model using physical hosts, virtual machines, or containers that you self-manage. With Lambda, you do not need to manage overall capacity or apply scaling policies.
Each AWS account has an overall AccountLimit value that is fixed at any point in time, but can be easily increased as needed. As of May 2017, the default limit is 1000 concurrent executions per AWS Region. You can also set and manage a reserved concurrency limit, which provides a limit to how much concurrency a function can have. It also reserves concurrency capacity for a given function out of the total available for an account.
Shutdown doesn’t apply to Lambda because Lambda is intrinsically event-driven. Invocations are tied directly to incoming events or triggers.
However, speed at startup does matter. Initial function execution latency, or what is called “cold starts”, can occur when there isn’t a “warmed” compute resource ready to execute against your application invocations. In the AWS Lambda Execution Model topic, it explains that:
“It takes time to set up an execution context and do the necessary “bootstrapping”, which adds some latency each time the Lambda function is invoked. You typically see this latency when a Lambda function is invoked for the first time or after it has been updated because AWS Lambda tries to reuse the execution context for subsequent invocations of the Lambda function.”
The Best Practices topic covers a number of issues around how to think about performance of your functions. This includes where to place certain logic, how to re-use execution environments, and how by configuring your function for more memory you also get a proportional increase in CPU available to your function. With AWS X-Ray, you can gather some insight as to what your function is doing during an execution and make adjustments accordingly.
Along with continuous integration and delivery, the practice of having independent application environments is a solid best practice no matter the development approach. Being able to safely test applications in a non-production environment is key to development success. Products within the AWS Serverless Platform do not charge for idle time, which greatly reduces the cost of running multiple environments. You can also use the AWS Serverless Application Model (AWS SAM), to manage the configuration of your separate environments.
SAM allows you to model your serverless applications in greatly simplified AWS CloudFormation syntax. With SAM, you can use CloudFormation’s capabilities—such as Parameters and Mappings—to build dynamic templates. Along with Lambda’s environment variables and API Gateway’s stage variables, those templates give you the ability to deploy multiple environments from a single template, such as testing, staging, and production. Whenever the non-production environments are not in use, your costs for Lambda and API Gateway would be zero. For more information, see the AWS Lambda Applications with AWS Serverless Application Model 2017 AWS online tech talk.
In a typical non-serverless application environment, you might be concerned with log files, logging daemons, and centralization of the data represented in them. Thankfully, this is not a concern for serverless applications, as most of the services in the platform handle this for you.
With Lambda, you can just output logs to the console via the native capabilities of the language in which your function is written. For more information about Go, see Logging (Go). Similar documentation pages exist for other languages. Those messages output by your code are captured and centralized in Amazon CloudWatch Logs. For more information, see Accessing Amazon CloudWatch Logs for AWS Lambda.
API Gateway provides two different methods for getting log information:
Execution logs Includes errors or execution traces (such as request or response parameter values or payloads), data used by custom authorizers, whether API keys are required, whether usage plans are enabled, and so on.
Access logs Provide the ability to log who has accessed your API and how the caller accessed the API. You can even customize the format of these logs as desired.
Capturing logs and being able to search and view them is one thing, but CloudWatch Logs also gives you the ability to treat a log message as an event and take action on them via subscription filters in the service. With subscription filters, you could send a log message matching a certain pattern to a Lambda function, and have it take action based on that. Say, for example, that you want to respond to certain error messages or usage patterns that violate certain rules. You could do that with CloudWatch Logs, subscription filters, and Lambda. Another important capability of CloudWatch Logs is the ability to “pivot” log information into a metric in CloudWatch. With this, you could take a data point from a log entry, create a metric, and then an alarm on a metric to show a breached threshold.
This is another factor that doesn’t directly apply to Lambda due to its design. Typically, you would have your functions scoped down to single or limited use cases and have individual functions for different components of your application. Even if they share a common invoking resource, such as an API Gateway endpoint and stage, you would still separate the individual API resources and actions to their own Lambda functions.
The Seven-and-a-Half–Factor model and you
As we’ve seen, Twelve-Factor application design can still be applied to serverless applications, taking into account some small differences! The following diagram highlights the factors and how applicable or not they are to serverless applications:
NOTE: Disposability only half applies, as discussed in this post.
Conclusion
If you’ve been building applications for cloud infrastructure over the past few years, the Twelve-Factor methodology should seem familiar and straight-forward. If you are new to this space, however, you should know that the general best practices and default working patterns for serverless applications overlap heavily with what I’ve discussed here.
It shouldn’t require much work to adhere rather closely to the Twelve-Factor model. When you’re building serverless applications, following the applicable points listed here helps you simplify development and any operational work involved (though already minimized by services such as Lambda and API Gateway). The Twelve-Factor methodology also isn’t all-or-nothing. You can apply only the practices that work best for you and your applications, and still benefit.
Microservice-application requirements have changed dramatically in recent years. These days, applications operate with petabytes of data, need almost 100% uptime, and end users expect sub-second response times. Typical N-tier applications can’t deliver on these requirements.
Reactive Manifesto, published in 2014, describes the essential characteristics of reactive systems including: responsiveness, resiliency, elasticity, and being message driven.
Being message driven is perhaps the most important characteristic of reactive systems. Asynchronous messaging helps in the design of loosely coupled systems, which is a key factor for scalability. In order to build a highly decoupled system, it is important to isolate services from each other. As already described, isolation is an important aspect of the microservices pattern. Indeed, reactive systems and microservices are a natural fit.
Implemented Use Case This reference architecture illustrates a typical ad-tracking implementation.
Many ad-tracking companies collect massive amounts of data in near-real-time. In many cases, these workloads are very spiky and heavily depend on the success of the ad-tech companies’ customers. Typically, an ad-tracking-data use case can be separated into a real-time part and a non-real-time part. In the real-time part, it is important to collect data as fast as possible and ask several questions including:, “Is this a valid combination of parameters?,””Does this program exist?,” “Is this program still valid?”
Because response time has a huge impact on conversion rate in advertising, it is important for advertisers to respond as fast as possible. This information should be kept in memory to reduce communication overhead with the caching infrastructure. The tracking application itself should be as lightweight and scalable as possible. For example, the application shouldn’t have any shared mutable state and it should use reactive paradigms. In our implementation, one main application is responsible for this real-time part. It collects and validates data, responds to the client as fast as possible, and asynchronously sends events to backend systems.
The non-real-time part of the application consumes the generated events and persists them in a NoSQL database. In a typical tracking implementation, clicks, cookie information, and transactions are matched asynchronously and persisted in a data store. The matching part is not implemented in this reference architecture. Many ad-tech architectures use frameworks like Hadoop for the matching implementation.
The system can be logically divided into the data collection partand the core data updatepart. The data collection part is responsible for collecting, validating, and persisting the data. In the core data update part, the data that is used for validation gets updated and all subscribers are notified of new data.
Components and Services
Main Application The main application is implemented using Java 8 and uses Vert.x as the main framework. Vert.x is an event-driven, reactive, non-blocking, polyglot framework to implement microservices. It runs on the Java virtual machine (JVM) by using the low-level IO library Netty. You can write applications in Java, JavaScript, Groovy, Ruby, Kotlin, Scala, and Ceylon. The framework offers a simple and scalable actor-like concurrency model. Vert.x calls handlers by using a thread known as an event loop. To use this model, you have to write code known as “verticles.” Verticles share certain similarities with actors in the actor model. To use them, you have to implement the verticle interface. Verticles communicate with each other by generating messages in a single event bus. Those messages are sent on the event bus to a specific address, and verticles can register to this address by using handlers.
With only a few exceptions, none of the APIs in Vert.x block the calling thread. Similar to Node.js, Vert.x uses the reactor pattern. However, in contrast to Node.js, Vert.x uses several event loops. Unfortunately, not all APIs in the Java ecosystem are written asynchronously, for example, the JDBC API. Vert.x offers a possibility to run this, blocking APIs without blocking the event loop. These special verticles are called worker verticles. You don’t execute worker verticles by using the standard Vert.x event loops, but by using a dedicated thread from a worker pool. This way, the worker verticles don’t block the event loop.
Our application consists of five different verticles covering different aspects of the business logic. The main entry point for our application is the HttpVerticle, which exposes an HTTP-endpoint to consume HTTP-requests and for proper health checking. Data from HTTP requests such as parameters and user-agent information are collected and transformed into a JSON message. In order to validate the input data (to ensure that the program exists and is still valid), the message is sent to the CacheVerticle.
This verticle implements an LRU-cache with a TTL of 10 minutes and a capacity of 100,000 entries. Instead of adding additional functionality to a standard JDK map implementation, we use Google Guava, which has all the features we need. If the data is not in the L1 cache, the message is sent to the RedisVerticle. This verticle is responsible for data residing in Amazon ElastiCache and uses the Vert.x-redis-client to read data from Redis. In our example, Redis is the central data store. However, in a typical production implementation, Redis would just be the L2 cache with a central data store like Amazon DynamoDB. One of the most important paradigms of a reactive system is to switch from a pull- to a push-based model. To achieve this and reduce network overhead, we’ll use Redis pub/sub to push core data changes to our main application.
Vert.x also supports direct Redis pub/sub-integration, the following code shows our subscriber-implementation:
vertx.eventBus().<JsonObject>consumer(REDIS_PUBSUB_CHANNEL_VERTX, received -> {
JsonObject value = received.body().getJsonObject("value");
String message = value.getString("message");
JsonObject jsonObject = new JsonObject(message);
eb.send(CACHE_REDIS_EVENTBUS_ADDRESS, jsonObject);
});
redis.subscribe(Constants.REDIS_PUBSUB_CHANNEL, res -> {
if (res.succeeded()) {
LOGGER.info("Subscribed to " + Constants.REDIS_PUBSUB_CHANNEL);
} else {
LOGGER.info(res.cause());
}
});
The verticle subscribes to the appropriate Redis pub/sub-channel. If a message is sent over this channel, the payload is extracted and forwarded to the cache-verticle that stores the data in the L1-cache. After storing and enriching data, a response is sent back to the HttpVerticle, which responds to the HTTP request that initially hit this verticle. In addition, the message is converted to ByteBuffer, wrapped in protocol buffers, and send to an Amazon Kinesis Data Stream.
The following example shows a stripped-down version of the KinesisVerticle:
Kinesis Consumer This AWS Lambda function consumes data from an Amazon Kinesis Data Stream and persists the data in an Amazon DynamoDB table. In order to improve testability, the invocation code is separated from the business logic. The invocation code is implemented in the class KinesisConsumerHandler and iterates over the Kinesis events pulled from the Kinesis stream by AWS Lambda. Each Kinesis event is unwrapped and transformed from ByteBuffer to protocol buffers and converted into a Java object. Those Java objects are passed to the business logic, which persists the data in a DynamoDB table. In order to improve duration of successive Lambda calls, the DynamoDB-client is instantiated lazily and reused if possible.
Redis Updater From time to time, it is necessary to update core data in Redis. A very efficient implementation for this requirement is using AWS Lambda and Amazon Kinesis. New core data is sent over the AWS Kinesis stream using JSON as data format and consumed by a Lambda function. This function iterates over the Kinesis events pulled from the Kinesis stream by AWS Lambda. Each Kinesis event is unwrapped and transformed from ByteBuffer to String and converted into a Java object. The Java object is passed to the business logic and stored in Redis. In addition, the new core data is also sent to the main application using Redis pub/sub in order to reduce network overhead and converting from a pull- to a push-based model.
The following example shows the source code to store data in Redis and notify all subscribers:
public void updateRedisData(final TrackingMessage trackingMessage, final Jedis jedis, final LambdaLogger logger) {
try {
ObjectMapper mapper = new ObjectMapper();
String jsonString = mapper.writeValueAsString(trackingMessage);
Map<String, String> map = marshal(jsonString);
String statusCode = jedis.hmset(trackingMessage.getProgramId(), map);
}
catch (Exception exc) {
if (null == logger)
exc.printStackTrace();
else
logger.log(exc.getMessage());
}
}
public void notifySubscribers(final TrackingMessage trackingMessage, final Jedis jedis, final LambdaLogger logger) {
try {
ObjectMapper mapper = new ObjectMapper();
String jsonString = mapper.writeValueAsString(trackingMessage);
jedis.publish(Constants.REDIS_PUBSUB_CHANNEL, jsonString);
}
catch (final IOException e) {
log(e.getMessage(), logger);
}
}
Similarly to our Kinesis Consumer, the Redis-client is instantiated somewhat lazily.
Infrastructure as Code As already outlined, latency and response time are a very critical part of any ad-tracking solution because response time has a huge impact on conversion rate. In order to reduce latency for customers world-wide, it is common practice to roll out the infrastructure in different AWS Regions in the world to be as close to the end customer as possible. AWS CloudFormation can help you model and set up your AWS resources so that you can spend less time managing those resources and more time focusing on your applications that run in AWS.
You create a template that describes all the AWS resources that you want (for example, Amazon EC2 instances or Amazon RDS DB instances), and AWS CloudFormation takes care of provisioning and configuring those resources for you. Our reference architecture can be rolled out in different Regions using an AWS CloudFormation template, which sets up the complete infrastructure (for example, Amazon Virtual Private Cloud (Amazon VPC), Amazon Elastic Container Service (Amazon ECS) cluster, Lambda functions, DynamoDB table, Amazon ElastiCache cluster, etc.).
Conclusion In this blog post we described reactive principles and an example architecture with a common use case. We leveraged the capabilities of different frameworks in combination with several AWS services in order to implement reactive principles—not only at the application-level but also at the system-level. I hope I’ve given you ideas for creating your own reactive applications and systems on AWS.
About the Author
Sascha Moellering is a Senior Solution Architect. Sascha is primarily interested in automation, infrastructure as code, distributed computing, containers and JVM. He can be reached at [email protected]
Message brokers can be used to solve a number of needs in enterprise architectures, including managing workload queues and broadcasting messages to a number of subscribers. Amazon MQ is a managed message broker service for Apache ActiveMQ that makes it easy to set up and operate message brokers in the cloud.
In this post, I discuss one approach to invoking AWS Lambda from queues and topics managed by Amazon MQ brokers. This and other similar patterns can be useful in integrating legacy systems with serverless architectures. You could also integrate systems already migrated to the cloud that use common APIs such as JMS.
For example, imagine that you work for a company that produces training videos and which recently migrated its video management system to AWS. The on-premises system used to publish a message to an ActiveMQ broker when a video was ready for processing by an on-premises transcoder. However, on AWS, your company uses Amazon Elastic Transcoder. Instead of modifying the management system, Lambda polls the broker for new messages and starts a new Elastic Transcoder job. This approach avoids changes to the existing application while refactoring the workload to leverage cloud-native components.
This solution uses Amazon CloudWatch Events to trigger a Lambda function that polls the Amazon MQ broker for messages. Instead of starting an Elastic Transcoder job, the sample writes the received message to an Amazon DynamoDB table with a time stamp indicating the time received.
Getting started
To start, navigate to the Amazon MQ console. Next, launch a new Amazon MQ instance, selecting Single-instance Broker and supplying a broker name, user name, and password. Be sure to document the user name and password for later.
For the purposes of this sample, choose the default options in the Advanced settings section. Your new broker is deployed to the default VPC in the selected AWS Region with the default security group. For this post, you update the security group to allow access for your sample Lambda function. In a production scenario, I recommend deploying both the Lambda function and your Amazon MQ broker in your own VPC.
After several minutes, your instance changes status from “Creation Pending” to “Available.” You can then visit the Details page of your broker to retrieve connection information, including a link to the ActiveMQ web console where you can monitor the status of your broker, publish test messages, and so on. In this example, use the Stomp protocol to connect to your broker. Be sure to capture the broker host name, for example:
<BROKER_ID>.mq.us-east-1.amazonaws.com
You should also modify the Security Group for the broker by clicking on its Security Group ID. Click the Edit button and then click Add Rule to allow inbound traffic on port 8162 for your IP address.
Deploying and scheduling the Lambda function
To simplify the deployment of this example, I’ve provided an AWS Serverless Application Model (SAM) template that deploys the sample function and DynamoDB table, and schedules the function to be invoked every five minutes. Detailed instructions can be found with sample code on GitHub in the amazonmq-invoke-aws-lambda repository, with sample code. I discuss a few key aspects in this post.
First, SAM makes it easy to deploy and schedule invocation of our function:
In the code, you include the URI, user name, and password for your newly created Amazon MQ broker. These allow the function to poll the broker for new messages on the sample queue.
stomp.connect(options, (error, client) => {
if (error) { /* do something */ }
let headers = {
destination: ‘/queue/SAMPLE_QUEUE’,
ack: ‘auto’
}
client.subscribe(headers, (error, message) => {
if (error) { /* do something */ }
message.readString(‘utf-8’, (error, body) => {
if (error) { /* do something */ }
let params = {
FunctionName: MyWorkerFunction,
Payload: JSON.stringify({
message: body,
timestamp: Date.now()
})
}
let lambda = new AWS.Lambda()
lambda.invoke(params, (error, data) => {
if (error) { /* do something */ }
})
}
})
})
Sending a sample message
For the purpose of this example, use the Amazon MQ console to send a test message. Navigate to the details page for your broker.
About midway down the page, choose ActiveMQ Web Console. Next, choose Manage ActiveMQ Broker to launch the admin console. When you are prompted for a user name and password, use the credentials created earlier.
At the top of the page, choose Send. From here, you can send a sample message from the broker to subscribers. For this example, this is how you generate traffic to test the end-to-end system. Be sure to set the Destination value to “SAMPLE_QUEUE.” The message body can contain any text. Choose Send.
You now have a Lambda function polling for messages on the broker. To verify that your function is working, you can confirm in the DynamoDB console that the message was successfully received and processed by the sample Lambda function.
First, choose Tables on the left and select the table name “amazonmq-messages” in the middle section. With the table detail in view, choose Items. If the function was successful, you’ll find a new entry similar to the following:
If there is no message in DynamoDB, check again in a few minutes or review the CloudWatch Logs group for Lambda functions that contain debug messages.
Alternative approaches
Beyond the approach described here, you may consider other approaches as well. For example, you could use an intermediary system such as Apache Flume to pass messages from the broker to Lambda or deploy Apache Camel to trigger Lambda via a POST to API Gateway. There are trade-offs to each of these approaches. My goal in using CloudWatch Events was to introduce an easily repeatable pattern familiar to many Lambda developers.
Summary
I hope that you have found this example of how to integrate AWS Lambda with Amazon MQ useful. If you have expertise or legacy systems that leverage APIs such as JMS, you may find this useful as you incorporate serverless concepts in your enterprise architectures.
To learn more, see the Amazon MQ website and Developer Guide. You can try Amazon MQ for free with the AWS Free Tier, which includes up to 750 hours of a single-instance mq.t2.micro broker and up to 1 GB of storage per month for one year.
The collective thoughts of the interwebz
By continuing to use the site, you agree to the use of cookies. more information
The cookie settings on this website are set to "allow cookies" to give you the best browsing experience possible. If you continue to use this website without changing your cookie settings or you click "Accept" below then you are consenting to this.