AWS Customer Compliance Guides now publicly available

Post Syndicated from Kevin Donohue original https://aws.amazon.com/blogs/security/aws-customer-compliance-guides-now-publicly-available/

The AWS Global Security & Compliance Acceleration (GSCA) Program has released AWS Customer Compliance Guides (CCGs) on the AWS Compliance Resources page to help customers, AWS Partners, and assessors quickly understand how industry-leading compliance frameworks map to AWS service documentation and security best practices.

CCGs offer security guidance mapped to 16 different compliance frameworks for more than 130 AWS services and integrations. Customers can select from the frameworks and services available to see how security “in the cloud” applies to AWS services through the lens of compliance.

CCGs focus on security topics and technical controls that relate to AWS service configuration options. The guides don’t cover security topics or controls that are consistent across AWS services or those specific to customer organizations, such as policies or governance. As a result, the guides are shorter and are focused on the unique security and compliance considerations for each AWS service.

We value your feedback on the guides. Take our CCG survey to tell us about your experience, request new services or frameworks, or suggest improvements.

CCGs provide summaries of the user guides for AWS services and map configuration guidance to security control requirements from the following frameworks:

  • National Institute of Standards and Technology (NIST) 800-53
  • NIST Cybersecurity Framework (CSF)
  • NIST 800-171
  • System and Organization Controls (SOC) II
  • Center for Internet Security (CIS) Critical Controls v8.0
  • ISO 27001
  • NERC Critical Infrastructure Protection (CIP)
  • Payment Card Industry Data Security Standard (PCI-DSS) v4.0
  • Department of Defense Cybersecurity Maturity Model Certification (CMMC)
  • HIPAA
  • Canadian Centre for Cyber Security (CCCS)
  • New York’s Department of Financial Services (NYDFS)
  • Federal Financial Institutions Examination Council (FFIEC)
  • Cloud Controls Matrix (CCM) v4
  • Information Security Manual (ISM-IRAP) (Australia)
  • Information System Security Management and Assessment Program (ISMAP) (Japan)

CCGs can help customers in the following ways:

  • Shorten the process of manually searching the AWS user guides to understand security “in the cloud” details and align configuration guidance to compliance requirements
  • Determine the scope of controls applicable in risk assessments or audits based on which AWS services are running in customer workloads
  • Assist customers who perform due diligence assessments on new AWS services under consideration for use in their organization
  • Provide assessors or risk teams with resources to identify which security areas are handled by AWS services and which are the customer’s responsibility to implement, which might influence the scope of evidence required for assessments or internal security checks
  • Provide a basis for developing security documentation such as control responses or procedures that might be required to meet various compliance documentation requirements or fulfill assessment evidence requests

The AWS Global Security & Compliance Acceleration (GSCA) Program connects customers with AWS partners that can help them navigate, automate, and accelerate building compliant workloads on AWS by helping to reduce time and cost. GSCA supports businesses globally that need to meet security, privacy, and compliance requirements for healthcare, privacy, national security, and financial sectors. To connect with a GSCA compliance specialist, complete the GSCA Program questionnaire.

 
If you have feedback about this post, submit comments in the Comments section below. If you have questions about this post, contact AWS Support.

Kevin Donohue

Kevin Donohue

Kevin is a Senior Security Partner Strategist in AWS World Wide Public Sector, specializing in helping customers meet their compliance goals. Kevin began his tenure with AWS in 2019 supporting U.S. government customers in AWS Security Assurance. He is based in Northern Virginia and enjoys spending time outdoors with his wife and daughter outside of work.

How AI code generation works

Post Syndicated from Jeimy Ruiz original https://github.blog/2024-02-22-how-ai-code-generation-works/


Generative AI coding tools are changing software production for enterprises. Not just for their code generation abilities—from vulnerability detection and facilitating comprehension of unfamiliar codebases, to streamlining documentation and pull request descriptions, they’re fundamentally reshaping how developers approach application infrastructure, deployment, and their own work experience.

We’re now witnessing a significant turning point. As AI models get better, refusing adoption would be like “asking an office worker to use a typewriter instead of a computer,” says Albert Ziegler, principal researcher and member of the GitHub Next research and development team.

In this post, we’ll dive into the inner workings of AI code generation, exploring how it functions, its capabilities and benefits, and how developers can use it to enhance their development experience while propelling your enterprise forward in today’s competitive landscape.

How to use AI to generate code

AI code generation refers to full or partial lines of code that are generated by machines instead of human developers. This emerging technology leverages advanced machine learning models, particularly large language models (LLMs), to understand and replicate the syntax, patterns, and paradigms found in human-generated code.

The AI models powering these tools, like ChatGPT and GitHub Copilot, are trained on natural language text and source code from publicly available sources that include a diverse range of code examples. This training enables them to understand the nuances of various programming languages, coding styles, and common practices. As a result, the AI can generate code suggestions that are syntactically correct and contextually relevant based on input from developers.

Favored by 55% of developers, our AI-powered pair programmer, GitHub Copilot, provides contextualized coding assistance based on your organization’s codebase across dozens of programming languages, and targets developers of all experience levels. With GitHub Copilot, developers can use AI to generate code in three ways:

1. Type code and AI can autocomplete the code

Autocompletions are the earliest version of AI code generation. John Berryman, a senior researcher of ML on the GitHub Copilot team, explains the user experience: “I’ll be writing code and taking a pause to think. While I’m doing that, the agent itself is also thinking, looking at surrounding code and content in neighboring tabs. Then it pops up on the screen as gray ‘ghost text’ that I can reject, partially accept, or fully accept and then, if necessary, modify.”

While every developer can reap the benefits of using AI coding tools, experienced programmers can often feel these gains even more so. “In many cases, especially for experienced programmers in a familiar environment, this suggestion speeds us up. I would have written the same thing. It’s just faster to hit ‘tab’ (thus accepting the suggestion) than it is to write out those 20 characters by myself,” says Johan Rosenkilde, principal researcher for GitHub Next.

Whether developers are new or highly skilled, they’ll often have to work in less familiar languages, and code completion suggestions using GitHub Copilot can lend a helping hand. “Using GitHub Copilot for code completion has really helped speed up my learning experience,” says Berryman. “I will often accept the suggestion because it’s something I wouldn’t have written on my own since I don’t know the syntax.”

Using an AI coding tool has become an invaluable skill in itself. Why? Because the more developers practice coding with these tools, the faster they’ll get at using them.

2. Explicit code comments codes using natural language to receive even better AI-generated code suggestions

For experienced developers in unfamiliar environments, tools like GitHub Copilot can even help jog their memories.

Let’s say a developer imports a new type of library they haven’t used before, or that they don’t remember. Maybe they’re looking to figure out the standard library function or the order of the argument. In these cases, it can be helpful to make GitHub Copilot more explicitly aware of where the developer wants to go by writing a comment.

“It’s quite likely that the developer might not remember the formula, but they can recognize the formula, and GitHub Copilot can remember it by being prompted,” says Rosenkilde. This is where natural language commentary comes into play: it can be a shortcut for explaining intent when the developer is struggling with the first few characters of code that they need.

If developers give specific names to their functions and variables, and write documentation, they can get better suggestions, too. That’s because GitHub Copilot can read the variable names and use them as an indicator for what that function should do.

Suddenly that changes how developers write code for the better, because code with good variable and function names are more maintainable. And oftentimes the main job of a programmer is to maintain code, not write it from scratch.

“When you push that code, someone is going to review it, and they will likely have a better time reviewing that code if it’s well named, if there’s even a hint of documentation in it, and so on,” says Rosenkilde. In this sense, the symbiotic relationship between the developer and the AI coding tool is not just beneficial for the developer, but for the entire team.

3. Chat directly with AI

With AI chatbots, code generation can be more interactive. GitHub Copilot Chat, for example, allows developers to interact with code by asking it to explain code, improve syntax, provide ideas, generate tests, and modify existing code—making it a versatile ally in managing coding tasks.

Rosenkilde uses the different functionalities of GitHub Copilot:

“When I want to do something and I can’t remember how to do it, I type the first few letters of it, and then I wait to see if Copilot can guess what I’m doing,” he says. “If that doesn’t work, maybe I delete those characters and I write a one liner in commentary and see whether Copilot can guess the next line. If that doesn’t work, then I go to Copilot Chat and explain in more detail what I want done.”

Typically, Copilot Chat returns with something much more verbose and complete than what you get from GitHub Copilot code completion. “Namely, it describes back to you what it is you want done and how it can be accomplished. It gives you code examples, and you can respond and say, oh, I see where you’re going. But actually I meant it like this instead,” says Rosenkilde.

But using AI chatbots doesn’t mean developers should be hands off. Mistakes in reasoning could lead the AI down a path of further mistakes if left unchecked. Berryman recommends that users should interact with the chat assistant in much the same way that you would when pair programming with a human. “Go back and forth with it. Tell the assistant about the task you are working on, ask it for ideas, have it help you write code, and critique and redirect the assistant’s work in order to keep it on the right track.”

The importance of code reviews

GitHub Copilot is designed to empower developers to execute their ideas. As long as there is some context for it to draw on, it will likely generate the type of code the developer wants. But this doesn’t replace code reviews between developers.

Code reviews play an important role in maintaining code quality and reliability in software projects, regardless of whether AI coding tools are involved. In fact, the earlier developers can spot bugs in the code development process, the cheaper it is by orders of magnitude.

Ordinary verification would be: does the code parse? Do the tests work? With AI code generation, Ziegler explains that developers should, “Scrutinize it in enough detail so that you can be sure the generated code is correct and bug-free. Because if you use tools like that in the wrong way and just accept everything, then the bugs that you introduce are going to cost you more time than you save.”

Rosenkilde adds, “A review with another human being is not the same as that, right? It’s a conversation between two developers about whether this change fits into the kind of software they’re building in this organization. GitHub Copilot doesn’t replace that.”

The advantages of using AI to generate code

When developer teams use AI coding tools across the software development cycle, they experience a host of benefits, including:

Faster development, more productivity

AI code generation can significantly speed up the development process by automating repetitive and time-consuming tasks. This means that developers can focus on high-level architecture and problem-solving. In fact, 88% of developers reported feeling more productive when using GitHub Copilot.

Rosenkilde reflects on his own experience with GitHub’s AI pair programmer: “95% of the time, Copilot brings me joy and makes my day a little bit easier. And this doesn’t change the code I would have written. It doesn’t change the way I would have written it. It doesn’t change the design of my code. All it does is it makes me faster at writing that same code.” And Rosenkilde isn’t alone: 60% of developers feel more fulfilled with their jobs when using GitHub Copilot.

Mental load alleviated

The benefits of faster development aren’t just about speed: they’re also about alleviating the mental effort that comes with completing tedious tasks. For example, when it comes to debugging, developers have to reverse engineer what went wrong. Detecting a bug can involve digging through an endless list of potential hiding places where it might be lurking, making it repetitive and tedious work.

Rosenkilde explains, “Sometimes when you’re debugging, you just have to resort to creating print statements that you can’t get around. Thankfully, Copilot is brilliant at print statements.”

A whopping 87% of developers reported spending less mental effort on repetitive tasks with the help of GitHub Copilot.

Less context switching

In software development, context switching is when developers move between different tasks, projects, or environments, which can disrupt their workflow and decrease productivity. They also often deal with the stress of juggling multiple tasks, remembering syntax details, and managing complex code structures.

With GitHub Copilot developers can bypass several levels of context switching, staying in their IDE instead of searching on Google or jumping into external documentation.

“When I’m writing natural language commentary,” says Rosenkilde, “GitHub Copilot code completion can help me. Or if I use Copilot Chat, it’s a conversation in the context that I’m in, and I don’t have to explain quite as much.”

Generating code with AI helps developers offload the responsibility of recalling every detail, allowing them to focus on higher-level thinking, problem-solving, and strategic planning.

Berryman adds, “With GitHub Copilot Chat, I don’t have to restate the problem because the code never leaves my trusted environment. And I get an answer immediately. If there is a misunderstanding or follow-up questions, they are easy to communicate with.”

What to look for in enterprise-ready AI code generation tools

Before you implement any AI into your workflow, you should always review and test tools thoroughly to make sure they’re a good fit for your organization. Here are a few considerations to keep in mind.

Compliance

  • Regulatory compliance. Does the tool comply with relevant regulations in your industry?
  • Compliance certifications. Are there attestations that demonstrate the tool’s compliance with regulations?

Security

  • Encryption. Is the data transmission and storage encrypted to protect sensitive information?
  • Access controls. Are you able to implement strong authentication measures and access controls to prevent unauthorized access?
  • Compliance with security standards. Is the tool compliant with industry standards?
  • Security audits. Does the tool undergo regular security audits and updates to address vulnerabilities?

Privacy

  • Data handling. Are there clear policies for handling user data and does it adhere to privacy regulations like GDPR, CCPA, etc.?
  • Data anonymization. Does the tool support anonymization techniques to protect user privacy?

Permissioning

  • Role-based access control. Are you able to manage permissions based on user roles and responsibilities?
  • Granular permissions. Can you control access to different features and functionalities within the tool?
  • Opt-in/Opt-out mechanisms. Can users control the use of their data and opt out if needed?

Pricing

  • Understand the pricing model. is it based on usage, number of users, features, or other metrics?
  • Look for transparency. Is the pricing structure clear with no hidden costs?
  • Scalability. Does the pricing scale with your usage and business growth?

Additionally, consider factors such as customer support, ease of integration with existing systems, performance, and user experience when evaluating AI coding tools. Lastly, it’s important to thoroughly assess how well the tool aligns with your organization’s specific requirements and priorities in each of these areas.

Visit the GitHub Copilot Trust Center to learn more around security, privacy, and other topics.

Can AI code generation be detected?

The short answer here is: maybe.

Let’s first give some context to the question. It’s never really the case that a whole code base is generated with AI, because large chunks of AI-generated code are very likely to be wrong. The standard code review process is a good way to avoid this, since large swaths of completely auto-generated code would stand out to a human developer as simply not working.

For smaller amounts of AI-generated code, there is no way at the moment to detect traces of AI in code with true confidence. There are offerings that purport to classify whether content has AI-generated text, but there are limited equivalents for code, since you’d need a dedicated model to do it. Ziegler explains, “Computer generated code is good enough that it doesn’t leave any particular traces and normally has no clear tells.”

At GitHub, the Copilot team makes use of a duplicate detection filter that detects exact duplicates in code. So, if you’re writing code and it’s an exact copy of something that exists elsewhere, then it’ll flag it.

Is AI code generation secure?

AI code generation is not any more insecure than human generated code. A combination of testing, manual code reviews, scanning, monitoring, and feedback loops can produce the same quality of code as your human-generated code.

When it comes to code generated by GitHub Copilot, developers can use tools like code scanning, which actively reviews your code for potential security issues in real-time and seamlessly integrates the findings into the developer workflow.

Ultimately, AI code generation will have vulnerabilities—but so does code written by human developers. As Ziegler explains, “It’s unclear whether computer generated code does particularly worse. So, the answer is not if you have GitHub Copilot, use a vulnerability checker. The answer is always use a vulnerability checker.”

Watch this video for more tips and words of advice around secure coding best practices with AI.

Empower your enterprise with AI code generation

While the benefits to using AI code generation tools can be significant, it’s important to note that human oversight remains crucial to ensure that the generated code aligns with project goals, coding standards, and business needs.

Tech leaders should embrace the use of AI code generation—not only to streamline development, but also to empower developer teams to collaborate, drive meaningful business outcomes, and deliver exceptional value to customers.

Learn more or get started with the world’s most widely adopted AI developer tool.

Want to learn how GitHub can help your organization do more with AI?

At GitHub Galaxy 2024, we’ll explore cutting-edge research and best practices in the rapidly evolving world of AI—empowering your business to maximize productivity and innovate at scale.

Register now >

The post How AI code generation works appeared first on The GitHub Blog.

New Image/Video Prompt Injection Attacks

Post Syndicated from Bruce Schneier original https://www.schneier.com/blog/archives/2024/02/new-image-video-prompt-injection-attacks.html

Simon Willison has been playing with the video processing capabilities of the new Gemini Pro 1.5 model from Google, and it’s really impressive.

Which means a lot of scary new video prompt injection attacks. And remember, given the current state of technology, prompt injection attacks are impossible to prevent in general.

[$] When ELF notes reveal too much

Post Syndicated from corbet original https://lwn.net/Articles/962782/

The Linux kernel uses a number of hardening techniques to try to protect
itself against compromise; one of those is kernel address-space layout
randomization (KASLR). But randomization is of little benefit if the
kernel spills the beans on where its code has ended up. As it happens, the
kernel has been doing exactly that — since 2007, in a behavior that
predates the addition of KASLR. Some changes are in the
works to close that hole, but it is illustrative of just how hard some
secrets are to keep.

Security updates for Thursday

Post Syndicated from jake original https://lwn.net/Articles/963205/

Security updates have been issued by CentOS (python-pillow), Debian (firefox-esr and imagemagick), Fedora (kernel, mbedtls, rust-asyncgit, rust-bat, rust-cargo-c, rust-eza, rust-git-absorb, rust-git-delta, rust-git2, rust-gitui, rust-libgit2-sys, rust-lsd, rust-pore, rust-pretty-git-prompt, rust-shadow-rs, rust-silver, rust-tokei, and rust-vergen), Gentoo (LibreOffice), Red Hat (kpatch-patch), Slackware (mozilla), SUSE (docker, python-pycryptodome, python3, and qemu), and Ubuntu (firefox and linux, linux-aws, linux-aws-5.4, linux-bluefield, linux-gcp, linux-gkeop,
linux-hwe-5.4, linux-ibm, linux-ibm-5.4, linux-iot, linux-kvm,
linux-oracle, linux-oracle-5.4, linux-raspi, linux-raspi-5.4,
linux-xilinx-zynqmp).

Enhancing security analysis with Cloudflare Zero Trust logs and Elastic SIEM

Post Syndicated from Corey Mahan original https://blog.cloudflare.com/enhancing-security-analysis-with-cloudflare-zero-trust-logs-and-elastic-siem


Today, we are thrilled to announce new Cloudflare Zero Trust dashboards on Elastic. Shared customers using Elastic can now use these pre-built dashboards to store, search, and analyze their Zero Trust logs.

When organizations look to adopt a Zero Trust architecture, there are many components to get right. If products are configured incorrectly, used maliciously, or security is somehow breached during the process, it can open your organization to underlying security risks without the ability to get insight from your data quickly and efficiently.

As a Cloudflare technology partner, Elastic helps Cloudflare customers find what they need faster, while keeping applications running smoothly and protecting against cyber threats. “I’m pleased to share our collaboration with Cloudflare, making it even easier to deploy log and analytics dashboards. This partnership combines Elastic’s open approach with Cloudflare’s practical solutions, offering straightforward tools for enterprise search, observability, and security deployment,” explained Mark Dodds, Chief Revenue Officer at Elastic.

Value of Zero Trust logs in Elastic

With this joint solution, we’ve made it easy for customers to seamlessly forward their Zero Trust logs to Elastic via Logpush jobs. This can be achieved directly via a Restful API or through an intermediary storage solution like AWS S3 or Google Cloud. Additionally, Cloudflare’s integration with Elastic has undergone improvements to encompass all categories of Zero Trust logs generated by Cloudflare.

Here are detailed some highlights of what the integration offers:

  • Comprehensive Visibility: Integrating Cloudflare Logpush into Elastic provides organizations with a real-time, comprehensive view of events related to Zero Trust. This enables a detailed understanding of who is accessing resources and applications, from where, and at what times. Enhanced visibility helps detect anomalous behavior and potential security threats more effectively, allowing for early response and mitigation.
  • Field Normalization: By unifying data from Zero Trust logs in Elastic, it’s possible to apply consistent field normalization not only for Zero Trust logs but also for other sources. This simplifies the process of search and analysis, as data is presented in a uniform format. Normalization also facilitates the creation of alerts and the identification of patterns of malicious or unusual activity.
  • Efficient Search and Analysis: Elastic provides powerful data search and analysis capabilities. Having Zero Trust logs in Elastic enables quick and precise searching for specific information. This is crucial for investigating security incidents, understanding workflows, and making informed decisions.
  • Correlation and Threat Detection: By combining Zero Trust data with other security events and data, Elastic enables deeper and more effective correlation. This is essential for detecting threats that might go unnoticed when analyzing each data source separately. Correlation aids in pattern identification and the detection of sophisticated attacks.
  • Prebuilt Dashboards: The integration provides out-of-the-box dashboards offering a quick start to visualizing key metrics and patterns. These dashboards help security teams visualize the security landscape in a clear and concise manner. The integration not only provides the advantage of prebuilt dashboards designed for Zero Trust datasets but also empowers users to curate their own visualizations.

What’s new on the dashboards

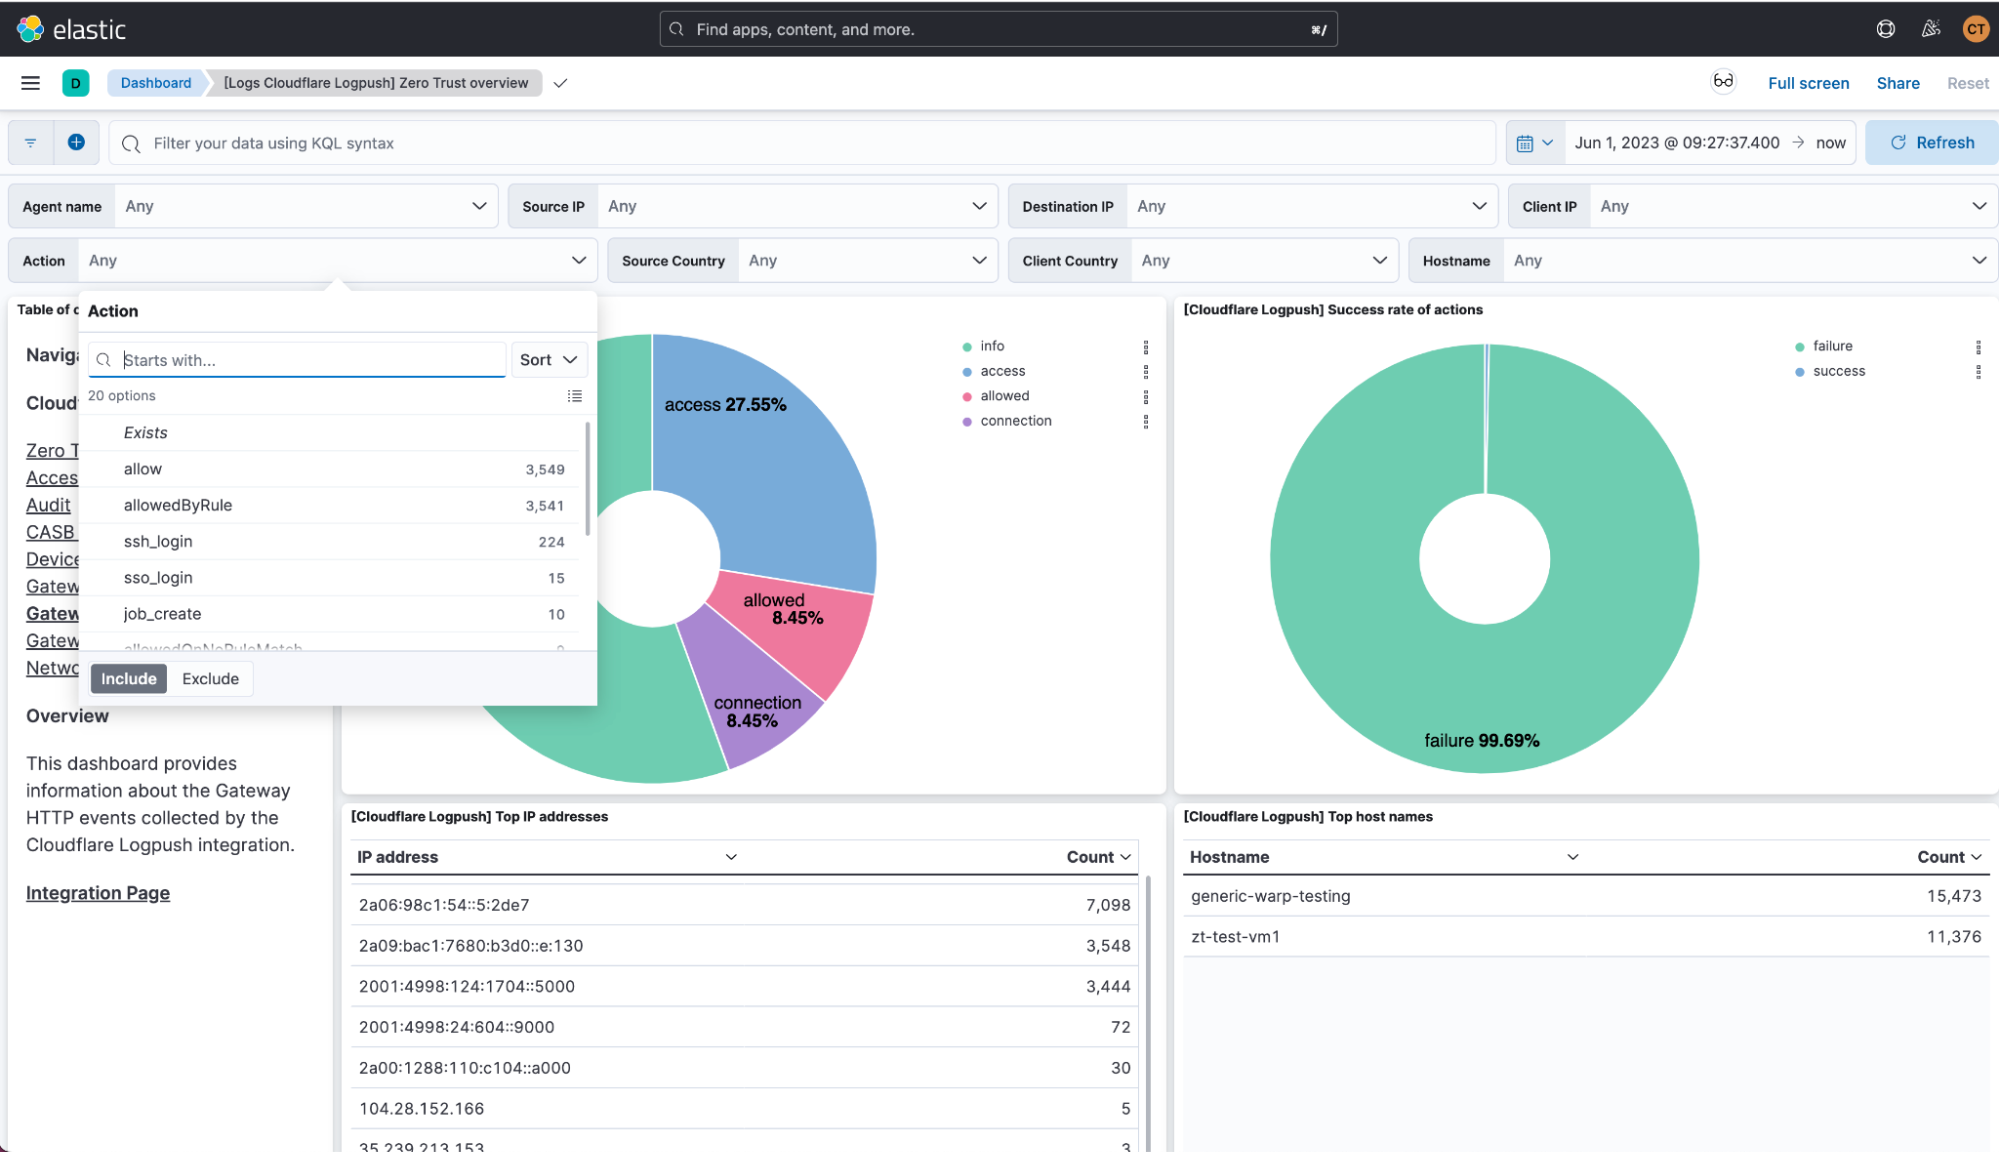
One of the main assets of the integration is the out-of-the-box dashboards tailored specifically for each type of Zero Trust log. Let’s explore some of these dashboards in more detail to find out how they can help us in terms of visibility.

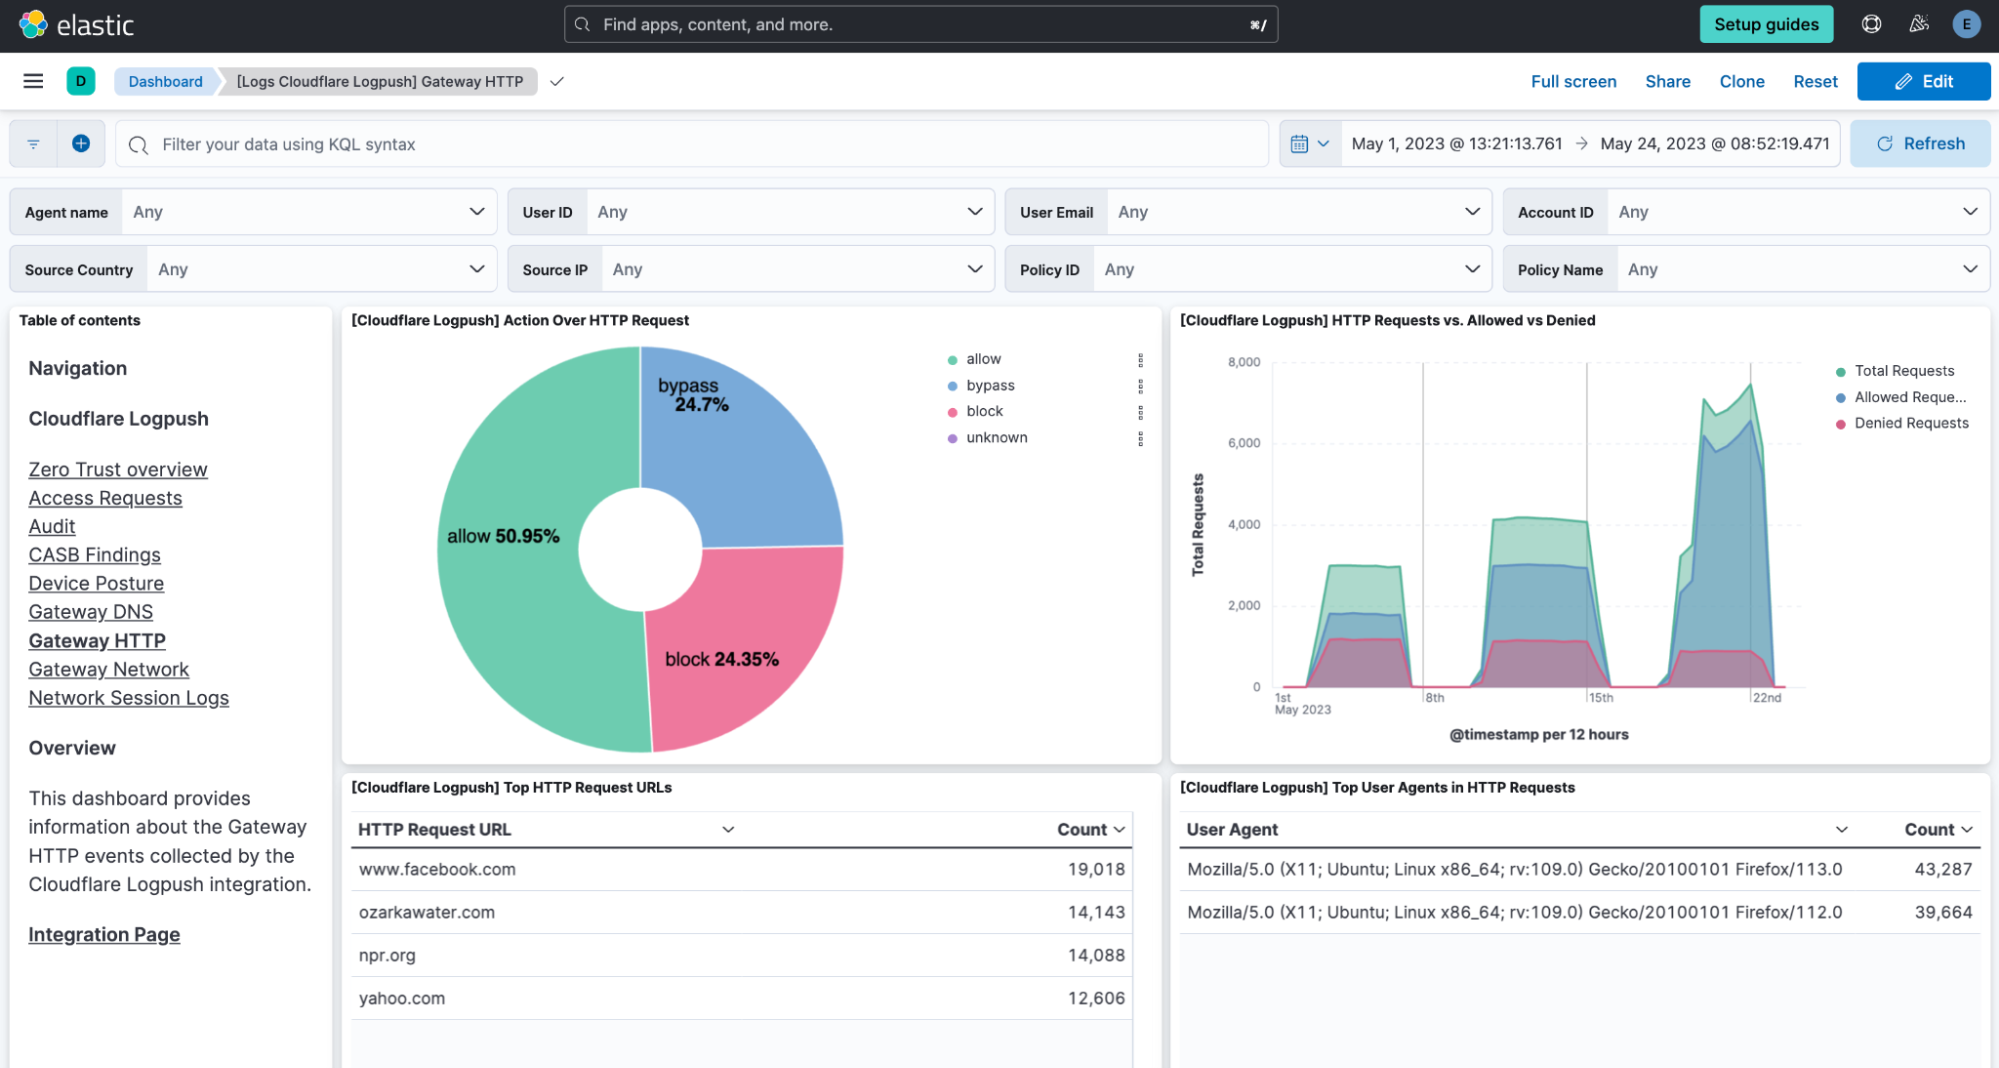
Gateway HTTP

This dashboard focuses on HTTP traffic and allows for monitoring and analyzing HTTP requests passing through Cloudflare’s Secure Web Gateway.

Here, patterns of traffic can be identified, potential threats detected, and a better understanding gained of how resources are being used within the network.

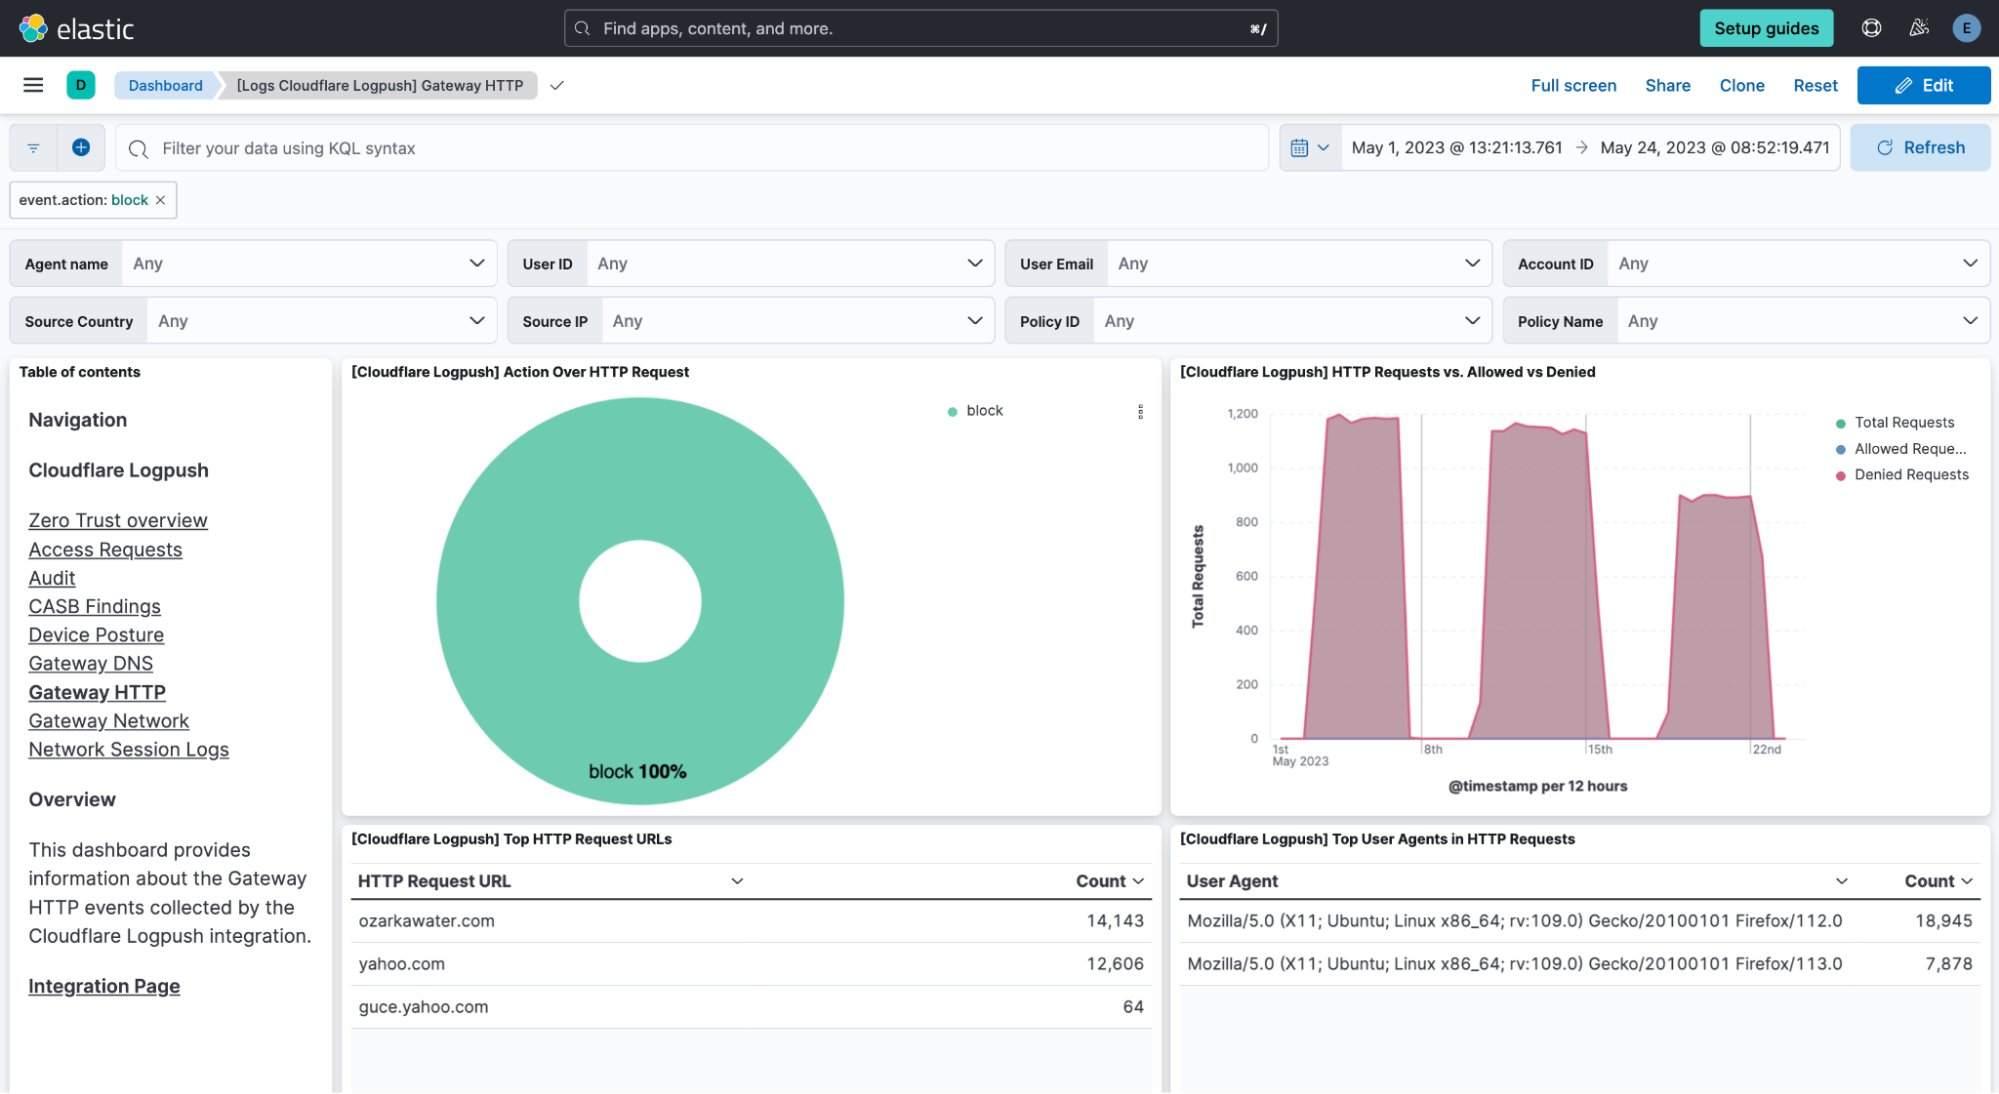
Every visualization in the stage is interactive. Therefore, the whole dashboard adapts to enabled filters, and they can be pinned across dashboards for pivoting. For instance, if clicking on one of the sections of the donut showing the different actions, a filter is automatically applied on that value and the whole dashboard is oriented around it.

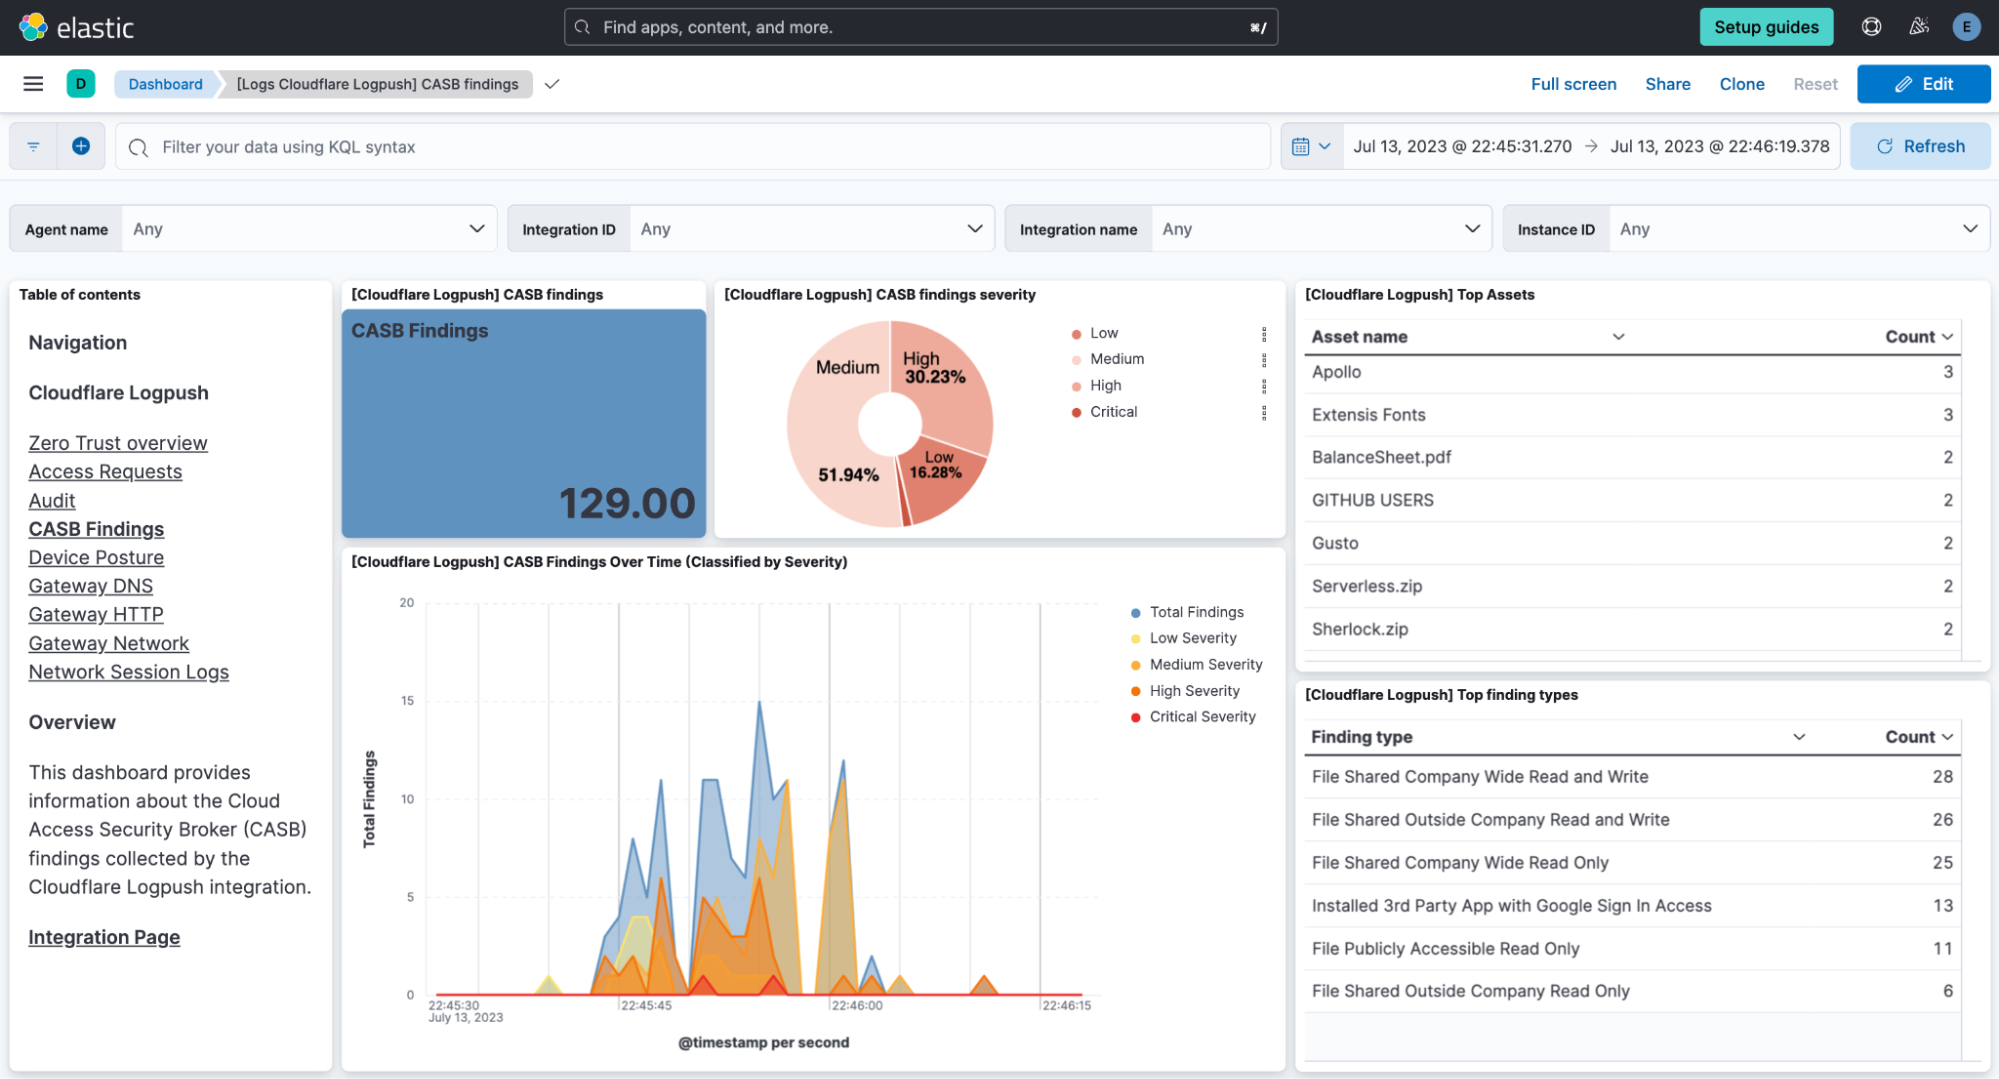
CASB

Following with a different perspective, the CASB (Cloud Access Security Broker) dashboard provides visibility over cloud applications used by users. Its visualizations are targeted to detect threats effectively, helping in the risk management and regulatory compliance.

These examples illustrate how dashboards in the integration between Cloudflare and Elastic offer practical and effective data visualization for Zero Trust. They enable us to make data-driven decisions, identify behavioral patterns, and proactively respond to threats. By providing relevant information in a visual and accessible manner, these dashboards strengthen security posture and allow for more efficient risk management in the Zero Trust environment.

How to get started

Setup and deployment is simple. Use the Cloudflare dashboard or API to create Logpush jobs with all fields enabled for each dataset you’d like to ingest on Elastic. There are eight account-scoped datasets available to use today (Access Requests, Audit logs, CASB findings, Gateway logs including DNS, Network, HTTP; Zero Trust Session Logs) that can be ingested into Elastic.

Setup Logpush jobs to your Elastic destination via one of the following methods:

  • HTTP Endpoint mode – Cloudflare pushes logs directly to an HTTP endpoint hosted by your Elastic Agent.
  • AWS S3 polling mode – Cloudflare writes data to S3 and Elastic Agent polls the S3 bucket by listing its contents and reading new files.
  • AWS S3 SQS mode – Cloudflare writes data to S3, S3 pushes a new object notification to SQS, Elastic Agent receives the notification from SQS, and then reads the S3 object. Multiple Agents can be used in this mode.

Enabling the integration in Elastic

  1. In Kibana, go to Management > Integrations
  2. In the integrations search bar type Cloudflare Logpush.
  3. Click the Cloudflare Logpush integration from the search results.
  4. Click the Add Cloudflare Logpush button to add Cloudflare Logpush integration.
  5. Enable the Integration with the HTTP Endpoint, AWS S3 input or GCS input.
  6. Under the AWS S3 input, there are two types of inputs: using AWS S3 Bucket or using SQS.
  7. Configure Cloudflare to send logs to the Elastic Agent.

What’s next

As organizations increasingly adopt a Zero Trust architecture, understanding your organization’s security posture is paramount. The dashboards help with necessary tools to build a robust security strategy, centered around visibility, early detection, and effective threat response.  By unifying data, normalizing fields, facilitating search, and enabling the creation of custom dashboards, this integration becomes a valuable asset for any cybersecurity team aiming to strengthen their security posture.

We’re looking forward to continuing to connect Cloudflare customers with our community of technology partners, to help in the adoption of a Zero Trust architecture.

Explore this new integration today.

The Zabbix/HackerOne Bug Bounty Program: A Year of Results

Post Syndicated from Michael Kammer original https://blog.zabbix.com/the-zabbix-hackerone-bug-bounty-program-a-year-of-results/27490/

As cyberattacks increase exponentially and the cost of maintaining dedicated internal security teams skyrockets, the popularity of the “bug bounty” program (which sees outside hackers paid by organizations to legally expose cybersecurity vulnerabilities) is exploding.

Organizations large and small are running programs to root out the security vulnerabilities in their products. Governments and policymakers are changing laws to make the approach easier to adopt, while private sector tech giants are also offering generous rewards – Apple alone has reportedly paid out more than $20 million via its bounty program, and the vendor offers up to $2 million to any hacker who reports a vulnerability that bypasses the protections of Lockdown Mode on its devices.

It’s an approach that dovetails perfectly with the Zabbix philosophy of “security first,” and it’s why as 2023 dawned we began working with HackerOne, the world leader in attack resistance management (ARM). ARM blends the security expertise of ethical hackers with asset discovery, continuous assessment, and process enhancement to find and close gaps in the digital attack surface.

Why HackerOne?

We knew from the start that we wanted to create a Zabbix-specific bug bounty program that would challenge the world’s best ethical hackers to find the weak spots in our cybersecurity armor – and let us know about them in time to fix them.

One of the biggest advantages of the HackerOne platform is the broad and diverse community of experts that they can call on. Adding Zabbix to HackerOne’s platform was a golden opportunity to test our security and vulnerabilities on a scale that we’d previously been unable to even imagine.

In contrast to an individual penetration test, which is the “old-school” industry standard security measure and is performed based on a pre-prepared scenario, we knew that HackerOne’s experts could discover vulnerabilities that a run-of-the-mill penetration test would never find.

At the same time, we knew that adding Zabbix to HackerOne was a bold decision that would test our faith in the security of our product. Put simply, teaming up with HackerOne was our way of confirming the quality of Zabbix and our desire to constantly improve it.

Getting started

We’ve known for a long time that HackerOne was the ideal partner for a bug bounty program, given their reputation for innovation and effectiveness. After an initial approach and agreement between HackerOne and Zabbix, it was time to consider what exactly a Zabbix bug bounty program would look like.

It was clear to everyone involved that if the reporting of vulnerabilities was to be meaningful and structured, we needed to develop new workflows that would provide a procedure for processing the received applications and handing them over for development. Another critical step was to register for the Common Vulnerabilities and Exposures (CVE) database, where all vulnerabilities discovered in Zabbix are currently registered.

The results

We’re pleased to report that as with any successful implementation, the numbers speak for themselves:

Data for the period 01.01.2023 – 25.01.2024

Submissions

• Reports submitted: 250
• Reports triaged: 3
• Reports closed as resolved: 16
• Reports rewarded: 19

Rewards

• Total rewards: $17,300.00
• Average reward: $865.00
• Median reward: $500.00

Submissions by severity

• Critical: 29
• High: 65
• Medium, low, none: 108
• Not severe: 48

We were pleasantly surprised at the sheer number of submissions alone – not all 250 submissions were severe or even actionable, but the number shows that our community is taking to the program, spreading the word, and doing their part to help us make sure that Zabbix is as secure as we can possibly make it. The fact that we were able to “squash” several bugs that will now never get a chance to bedevil our users is just the icing on the cake.

The results are impressive, but in keeping with the Zabbix ethos of continuous improvement, we’re confident that with a few refinements we can pay out even more in 2024. After all, any money that goes toward building a better, more secure product is money well spent! We’d like to close by extending a special and heartfelt thank you to everyone who has contributed to our bug bounty program and discovered vulnerabilities – keep up the great work!


The post The Zabbix/HackerOne Bug Bounty Program: A Year of Results appeared first on Zabbix Blog.

Какъв механизъм за скрининг за рискови чуждестранни инвестиции приехме

Post Syndicated from Bozho original https://blog.bozho.net/blog/4230

Приехме закон за скрининг на рискови чуждестранни инвестиции. Тъй като той е много важен за инвестиционния климат, по него имаше процедурни особености – мина два пъти на второ четене в комисия, за да сме сигурни, че няма да създадем административни пречки пред чуждестранните инвестиции.

Със закона (който въвежда текстове в Закона за насърчаване на инвестициите) се предвижда задължение за разрешение от междуведомственя комисия за скрининг за пряка чуждестранна инвестиция в секторите, свързани със сигурността и обществения ред. Приемането на закона е задължение на България по европейския Регламент (ЕС) 2019/452, но регламентът дава възможност на държавите да го адаптират спрямо своите приротитети и нужди. Скринингът цели да ограничи т.нар. корозивен капитал – капитал с неясен произход, със спорна пазарна ориентация, мотивиран от екплоатирането на административни пропуски в държавата, където се осъществява инвестицията и придобиване на контрол върху стратегически обекти. Тези рискови инвестиции, според регламента на ЕС, трябва да бъдат подложени на скрининг.

Това, което успяхме да постигнем (от ППДБ) за облекчение на инвестиционния процес, са следните неща:

  • скринингът да е само, когато дейността на дружеството, в което се инвестира, е в обхвата на регламента – т.е. сигурност и обществен ред. По принцип това само по себе си може да бъде тълкувано разширително от администрацията, което налага и останалите мерки по-долу.
  • на скрининг да не се полдагат държави, които смятаме за нискорискови , като такива се определят по два начина – единият е със списък, предложен от Министерски съвет и одобрен от парламента, а другият е с конкретен списък в закона – САЩ, Обединеното кралство, Япония, Корея, Канада, Нова Зеландия, Австралия, ОАЕ и Саудитска Арабия. Дали последните две са нискорискови е дълга тема, но там потенцеиалните проблеми не са свързани с т.нар. „корозивен капитал“, а евентуално с други рискове за финансовата система, които скрининга не решава така или иначе. Има дискусия дали списъците с държави са в съответсвие с всички международни договори, по които България е страна, но предвид, че на европейско ниво текат процеси по надграждане и уеднаквяване на скрининговите механизми, нашата временна мярка е с цел защита на инвестиционния климат от излишна бюрокрация.
  • сделки, които все пак подлежат на скрининг, се ползват от мълчаливо съгласие при изтичане на 45-дневния срок за издаване на разрешение. Мълчаливото съгласие по принцип е общият ред за такъв тип разрешителни режими, съгласно Закона за ограничаване на административното регулиране и административния контрол върху стопанската дейност, но тук го записахме изрично, за да не влиза администрацията в тълкуване дали се прилага. Мълчаливите съгласия са индивидуални административни актове, т.е. имат силата на изрично разрешение. Има рискове, произтичащи от връчването на решенията за скрининг (т.е. ако решение е взето преди срока, но е комуникирано след срока), но те се елиминират при използване на Системата за сигурно електронно връчване, при която връчването се случва в реално време и гарантира датата и часа на изпращане и получаване.
  • скрининговият процес не спира производствата за други лицензи и разрешения – т.е. не може процедурата по скрининг да се използва от КЗК, КЕВР, КФН, КРС или някой друг държавен орган за спиране или забавяне на прозиводства по техните специални закони. А много от сделките в обхвата на регламента са регулирани от някой такъв регулатор.
  • държавата ще носи отговорност за вреди по нейна вина, т.е. ако напр. след мълчаливо съгласие отвори ад-хок скрининг и това навреди на инвеститора, той може да осъди държавата за причинените вреди.
  • гарантиране, че всички становище, вкл. на службите за сигурност, са мотивирани, за да няма бланкетни становища от типа „препоръчва да не разреши инвестицията, поради налична информация в Държавна агенция „Национална сигурност““. Съответно решенията на съвета трябва да са мотивирани и пропорционални, а не бланкетни и прекомерни. Това на пръв поглед са декларативни текстове, но дават повече сигурност, че при съдебен процес, той ще бъде в полза на инвеститора, в случай, че държавен орган направомерно е ограничил дадена инвестиция.
  • съветът за скрнинг ще публикува данни за получените заявления за скрининг и за това какви решения е взел. По този начин ще е възможно да се следи как се движи процесът по скрининг и дали той не е прекалено рестриктивен.

На задължителен скриниг подлежат инвестиции от Русия и Беларус, както и от компании, в които има 25% собственост на лица от тези държави. Руските капитали са най-корозивни, и когато става дума за национална сигурност в контекста на войната, е нужен специален ред за тях. За останалите трети страни се прилага изискването за контрол – т.е. 50%+1, пряко или непряко, вкл. чрез група лица, всяко от които под 50%.

Регламентът предвижда задължителен скрининг на т.нар. „критични технологии“, като изкуствен интелект, роботика, киберсигурност и др. В нашия закон има специфична разпоредба за високотехнологични компании в секторите, свързани със сигурност и обществен ред, като единствената разлика спрямо останалите инвестиции е в праговете за скрининг. Но високотехнологични инвестиции от нискорискови държави също не подлежат на скрининг, така че технологичната ни индустрия няма да има повишена административна тежест за привличане на капитал.

Законът не е е перфектен, но тъй като такъв тип закони се въвеждат в Европа за първи път, все още европейските държави, вкл. България, намират правилния баланс. Смятам, че ние намерихме добър баланс между гарантиране на националната сигурност чрез ограничаване на корозивен капитал и свободата на движението на капитали и свободния инвестиционен климат.

Материалът Какъв механизъм за скрининг за рискови чуждестранни инвестиции приехме е публикуван за пръв път на БЛОГодаря.

NVIDIA Blows-out Earnings as Over 83 Percent of Revenue From the AI Data Center Boom

Post Syndicated from Patrick Kennedy original https://www.servethehome.com/nvidia-blows-out-earnings-as-over-83-percent-of-revenue-from-the-ai-data-center-boom/

NVIDIA is putting its gaming GPU company legacy to rest as the data center group is propelling the company on a wild growth trajectory

The post NVIDIA Blows-out Earnings as Over 83 Percent of Revenue From the AI Data Center Boom appeared first on ServeTheHome.

Simplify data streaming ingestion for analytics using Amazon MSK and Amazon Redshift

Post Syndicated from Sebastian Vlad original https://aws.amazon.com/blogs/big-data/simplify-data-streaming-ingestion-for-analytics-using-amazon-msk-and-amazon-redshift/

Towards the end of 2022, AWS announced the general availability of real-time streaming ingestion to Amazon Redshift for Amazon Kinesis Data Streams and Amazon Managed Streaming for Apache Kafka (Amazon MSK), eliminating the need to stage streaming data in Amazon Simple Storage Service (Amazon S3) before ingesting it into Amazon Redshift.

Streaming ingestion from Amazon MSK into Amazon Redshift, represents a cutting-edge approach to real-time data processing and analysis. Amazon MSK serves as a highly scalable, and fully managed service for Apache Kafka, allowing for seamless collection and processing of vast streams of data. Integrating streaming data into Amazon Redshift brings immense value by enabling organizations to harness the potential of real-time analytics and data-driven decision-making.

This integration enables you to achieve low latency, measured in seconds, while ingesting hundreds of megabytes of streaming data per second into Amazon Redshift. At the same time, this integration helps make sure that the most up-to-date information is readily available for analysis. Because the integration doesn’t require staging data in Amazon S3, Amazon Redshift can ingest streaming data at a lower latency and without intermediary storage cost.

You can configure Amazon Redshift streaming ingestion on a Redshift cluster using SQL statements to authenticate and connect to an MSK topic. This solution is an excellent option for data engineers that are looking to simplify data pipelines and reduce the operational cost.

In this post, we provide a complete overview on how to configure Amazon Redshift streaming ingestion from Amazon MSK.

Solution overview

The following architecture diagram describes the AWS services and features you will be using.

architecture diagram describing the AWS services and features you will be using

The workflow includes the following steps:

  1. You start with configuring an Amazon MSK Connect source connector, to create an MSK topic, generate mock data, and write it to the MSK topic. For this post, we work with mock customer data.
  2. The next step is to connect to a Redshift cluster using the Query Editor v2.
  3. Finally, you configure an external schema and create a materialized view in Amazon Redshift, to consume the data from the MSK topic. This solution does not rely on an MSK Connect sink connector to export the data from Amazon MSK to Amazon Redshift.

The following solution architecture diagram describes in more detail the configuration and integration of the AWS services you will be using.
solution architecture diagram describing in more detail the configuration and integration of the AWS services you will be using
The workflow includes the following steps:

  1. You deploy an MSK Connect source connector, an MSK cluster, and a Redshift cluster within the private subnets on a VPC.
  2. The MSK Connect source connector uses granular permissions defined in an AWS Identity and Access Management (IAM) in-line policy attached to an IAM role, which allows the source connector to perform actions on the MSK cluster.
  3. The MSK Connect source connector logs are captured and sent to an Amazon CloudWatch log group.
  4. The MSK cluster uses a custom MSK cluster configuration, allowing the MSK Connect connector to create topics on the MSK cluster.
  5. The MSK cluster logs are captured and sent to an Amazon CloudWatch log group.
  6. The Redshift cluster uses granular permissions defined in an IAM in-line policy attached to an IAM role, which allows the Redshift cluster to perform actions on the MSK cluster.
  7. You can use the Query Editor v2 to connect to the Redshift cluster.

Prerequisites

To simplify the provisioning and configuration of the prerequisite resources, you can use the following AWS CloudFormation template:

Complete the following steps when launching the stack:

  1. For Stack name, enter a meaningful name for the stack, for example, prerequisites.
  2. Choose Next.
  3. Choose Next.
  4. Select I acknowledge that AWS CloudFormation might create IAM resources with custom names.
  5. Choose Submit.

The CloudFormation stack creates the following resources:

  • A VPC custom-vpc, created across three Availability Zones, with three public subnets and three private subnets:
    • The public subnets are associated with a public route table, and outbound traffic is directed to an internet gateway.
    • The private subnets are associated with a private route table, and outbound traffic is sent to a NAT gateway.
  • An internet gateway attached to the Amazon VPC.
  • A NAT gateway that is associated with an elastic IP and is deployed in one of the public subnets.
  • Three security groups:
    • msk-connect-sg, which will be later associated with the MSK Connect connector.
    • redshift-sg, which will be later associated with the Redshift cluster.
    • msk-cluster-sg, which will be later associated with the MSK cluster. It allows inbound traffic from msk-connect-sg, and redshift-sg.
  • Two CloudWatch log groups:
    • msk-connect-logs, to be used for the MSK Connect logs.
    • msk-cluster-logs, to be used for the MSK cluster logs.
  • Two IAM Roles:
    • msk-connect-role, which includes granular IAM permissions for MSK Connect.
    • redshift-role, which includes granular IAM permissions for Amazon Redshift.
  • A custom MSK cluster configuration, allowing the MSK Connect connector to create topics on the MSK cluster.
  • An MSK cluster, with three brokers deployed across the three private subnets of custom-vpc. The msk-cluster-sg security group and the custom-msk-cluster-configuration configuration are applied to the MSK cluster. The broker logs are delivered to the msk-cluster-logs CloudWatch log group.
  • A Redshift cluster subnet group, which is using the three private subnets of custom-vpc.
  • A Redshift cluster, with one single node deployed in a private subnet within the Redshift cluster subnet group. The redshift-sg security group and redshift-role IAM role are applied to the Redshift cluster.

Create an MSK Connect custom plugin

For this post, we use an Amazon MSK data generator deployed in MSK Connect, to generate mock customer data, and write it to an MSK topic.

Complete the following steps:

  1. Download the Amazon MSK data generator JAR file with dependencies from GitHub.
    awslabs github page for downloading the jar file of the amazon msk data generator
  2. Upload the JAR file into an S3 bucket in your AWS account.
    amazon s3 console image showing the uploaded jar file in an s3 bucket
  3. On the Amazon MSK console, choose Custom plugins under MSK Connect in the navigation pane.
  4. Choose Create custom plugin.
  5. Choose Browse S3, search for the Amazon MSK data generator JAR file you uploaded to Amazon S3, then choose Choose.
  6. For Custom plugin name, enter msk-datagen-plugin.
  7. Choose Create custom plugin.

When the custom plugin is created, you will see that its status is Active, and you can move to the next step.
amazon msk console showing the msk connect custom plugin being successfully created

Create an MSK Connect connector

Complete the following steps to create your connector:

  1. On the Amazon MSK console, choose Connectors under MSK Connect in the navigation pane.
  2. Choose Create connector.
  3. For Custom plugin type, choose Use existing plugin.
  4. Select msk-datagen-plugin, then choose Next.
  5. For Connector name, enter msk-datagen-connector.
  6. For Cluster type, choose Self-managed Apache Kafka cluster.
  7. For VPC, choose custom-vpc.
  8. For Subnet 1, choose the private subnet within your first Availability Zone.

For the custom-vpc created by the CloudFormation template, we are using odd CIDR ranges for public subnets, and even CIDR ranges for the private subnets:

    • The CIDRs for the public subnets are 10.10.1.0/24, 10.10.3.0/24, and 10.10.5.0/24
    • The CIDRs for the private subnets are 10.10.2.0/24, 10.10.4.0/24, and 10.10.6.0/24
  1. For Subnet 2, select the private subnet within your second Availability Zone.
  2. For Subnet 3, select the private subnet within your third Availability Zone.
  3. For Bootstrap servers, enter the list of bootstrap servers for TLS authentication of your MSK cluster.

To retrieve the bootstrap servers for your MSK cluster, navigate to the Amazon MSK console, choose Clusters, choose msk-cluster, then choose View client information. Copy the TLS values for the bootstrap servers.

  1. For Security groups, choose Use specific security groups with access to this cluster, and choose msk-connect-sg.
  2. For Connector configuration, replace the default settings with the following:
connector.class=com.amazonaws.mskdatagen.GeneratorSourceConnector
tasks.max=2
genkp.customer.with=#{Code.isbn10}
genv.customer.name.with=#{Name.full_name}
genv.customer.gender.with=#{Demographic.sex}
genv.customer.favorite_beer.with=#{Beer.name}
genv.customer.state.with=#{Address.state}
genkp.order.with=#{Code.isbn10}
genv.order.product_id.with=#{number.number_between '101','109'}
genv.order.quantity.with=#{number.number_between '1','5'}
genv.order.customer_id.matching=customer.key
global.throttle.ms=2000
global.history.records.max=1000
value.converter=org.apache.kafka.connect.json.JsonConverter
value.converter.schemas.enable=false
  1. For Connector capacity, choose Provisioned.
  2. For MCU count per worker, choose 1.
  3. For Number of workers, choose 1.
  4. For Worker configuration, choose Use the MSK default configuration.
  5. For Access permissions, choose msk-connect-role.
  6. Choose Next.
  7. For Encryption, select TLS encrypted traffic.
  8. Choose Next.
  9. For Log delivery, choose Deliver to Amazon CloudWatch Logs.
  10. Choose Browse, select msk-connect-logs, and choose Choose.
  11. Choose Next.
  12. Review and choose Create connector.

After the custom connector is created, you will see that its status is Running, and you can move to the next step.
amazon msk console showing the msk connect connector being successfully created

Configure Amazon Redshift streaming ingestion for Amazon MSK

Complete the following steps to set up streaming ingestion:

  1. Connect to your Redshift cluster using Query Editor v2, and authenticate with the database user name awsuser, and password Awsuser123.
  2. Create an external schema from Amazon MSK using the following SQL statement.

In the following code, enter the values for the redshift-role IAM role, and the msk-cluster cluster ARN.

CREATE EXTERNAL SCHEMA msk_external_schema
FROM MSK
IAM_ROLE '<insert your redshift-role arn>'
AUTHENTICATION iam
CLUSTER_ARN '<insert your msk-cluster arn>';
  1. Choose Run to run the SQL statement.

redshift query editor v2 showing the SQL statement used to create an external schema from amazon msk

  1. Create a materialized view using the following SQL statement:
CREATE MATERIALIZED VIEW msk_mview AUTO REFRESH YES AS
SELECT
    "kafka_partition",
    "kafka_offset",
    "kafka_timestamp_type",
    "kafka_timestamp",
    "kafka_key",
    JSON_PARSE(kafka_value) as Data,
    "kafka_headers"
FROM
    "dev"."msk_external_schema"."customer"
  1. Choose Run to run the SQL statement.

redshift query editor v2 showing the SQL statement used to create a materialized view

  1. You can now query the materialized view using the following SQL statement:
select * from msk_mview LIMIT 100;
  1. Choose Run to run the SQL statement.

redshift query editor v2 showing the SQL statement used to query the materialized view

  1. To monitor the progress of records loaded via streaming ingestion, you can take advantage of the SYS_STREAM_SCAN_STATES monitoring view using the following SQL statement:
select * from SYS_STREAM_SCAN_STATES;
  1. Choose Run to run the SQL statement.

redshift query editor v2 showing the SQL statement used to query the sys stream scan states monitoring view

  1. To monitor errors encountered on records loaded via streaming ingestion, you can take advantage of the SYS_STREAM_SCAN_ERRORS monitoring view using the following SQL statement:
select * from SYS_STREAM_SCAN_ERRORS;
  1. Choose Run to run the SQL statement.redshift query editor v2 showing the SQL statement used to query the sys stream scan errors monitoring view

Clean up

After following along, if you no longer need the resources you created, delete them in the following order to prevent incurring additional charges:

  1. Delete the MSK Connect connector msk-datagen-connector.
  2. Delete the MSK Connect plugin msk-datagen-plugin.
  3. Delete the Amazon MSK data generator JAR file you downloaded, and delete the S3 bucket you created.
  4. After you delete your MSK Connect connector, you can delete the CloudFormation template. All the resources created by the CloudFormation template will be automatically deleted from your AWS account.

Conclusion

In this post, we demonstrated how to configure Amazon Redshift streaming ingestion from Amazon MSK, with a focus on privacy and security.

The combination of the ability of Amazon MSK to handle high throughput data streams with the robust analytical capabilities of Amazon Redshift empowers business to derive actionable insights promptly. This real-time data integration enhances the agility and responsiveness of organizations in understanding changing data trends, customer behaviors, and operational patterns. It allows for timely and informed decision-making, thereby gaining a competitive edge in today’s dynamic business landscape.

This solution is also applicable for customers that are looking to use Amazon MSK Serverless and Amazon Redshift Serverless.

We hope this post was a good opportunity to learn more about AWS service integration and configuration. Let us know your feedback in the comments section.


About the authors

Sebastian Vlad is a Senior Partner Solutions Architect with Amazon Web Services, with a passion for data and analytics solutions and customer success. Sebastian works with enterprise customers to help them design and build modern, secure, and scalable solutions to achieve their business outcomes.

Sharad Pai is a Lead Technical Consultant at AWS. He specializes in streaming analytics and helps customers build scalable solutions using Amazon MSK and Amazon Kinesis. He has over 16 years of industry experience and is currently working with media customers who are hosting live streaming platforms on AWS, managing peak concurrency of over 50 million. Prior to joining AWS, Sharad’s career as a lead software developer included 9 years of coding, working with open source technologies like JavaScript, Python, and PHP.

[$] Sudo and its alternatives

Post Syndicated from jake original https://lwn.net/Articles/962588/

Sudo is a ubiquitous tool for running
commands
with the privileges of another user on Unix-like operating systems. Over
the past decade or so,
some alternatives have
been developed; the base system of OpenBSD now comes with doas instead, sudo-rs is a subset of
sudo reimplemented in Rust, and, somewhat surprisingly, Microsoft also
recently announced
its own Sudo for Windows. Each of these offers a different approach to the
task of providing limited privileges to unprivileged users.

Combine AWS Glue and Amazon MWAA to build advanced VPC selection and failover strategies

Post Syndicated from Michael Greenshtein original https://aws.amazon.com/blogs/big-data/combine-aws-glue-and-amazon-mwaa-to-build-advanced-vpc-selection-and-failover-strategies/

AWS Glue is a serverless data integration service that makes it straightforward to discover, prepare, move, and integrate data from multiple sources for analytics, machine learning (ML), and application development.

AWS Glue customers often have to meet strict security requirements, which sometimes involve locking down the network connectivity allowed to the job, or running inside a specific VPC to access another service. To run inside the VPC, the jobs needs to be assigned to a single subnet, but the most suitable subnet can change over time (for instance, based on the usage and availability), so you may prefer to make that decision at runtime, based on your own strategy.

Amazon Managed Workflows for Apache Airflow (Amazon MWAA) is an AWS service to run managed Airflow workflows, which allow writing custom logic to coordinate how tasks such as AWS Glue jobs run.

In this post, we show how to run an AWS Glue job as part of an Airflow workflow, with dynamic configurable selection of the VPC subnet assigned to the job at runtime.

Solution overview

To run inside a VPC, an AWS Glue job needs to be assigned at least a connection that includes network configuration. Any connection allows specifying a VPC, subnet, and security group, but for simplicity, this post uses connections of type: NETWORK, which just defines the network configuration and doesn’t involve external systems.

If the job has a fixed subnet assigned by a single connection, in case of a service outage on the Availability Zones or if the subnet isn’t available for other reasons, the job can’t run. Furthermore, each node (driver or worker) in an AWS Glue job requires an IP address assigned from the subnet. When running many large jobs concurrently, this could lead to an IP address shortage and the job running with fewer nodes than intended or not running at all.

AWS Glue extract, transform, and load (ETL) jobs allow multiple connections to be specified with multiple network configurations. However, the job will always try to use the connections’ network configuration in the order listed and pick the first one that passes the health checks and has at least two IP addresses to get the job started, which might not be the optimal option.

With this solution, you can enhance and customize that behavior by reordering the connections dynamically and defining the selection priority. If a retry is needed, the connections are reprioritized again based on the strategy, because the conditions might have changed since the last run.

As a result, it helps prevent the job from failing to run or running under capacity due to subnet IP address shortage or even an outage, while meeting the network security and connectivity requirements.

The following diagram illustrates the solution architecture.

Prerequisites

To follow the steps of the post, you need a user that can log in to the AWS Management Console and has permission to access Amazon MWAA, Amazon Virtual Private Cloud (Amazon VPC), and AWS Glue. The AWS Region where you choose to deploy the solution needs the capacity to create a VPC and two elastic IP addresses. The default Regional quota for both types of resources is five, so you might need to request an increase via the console.

You also need an AWS Identity and Access Management (IAM) role suitable to run AWS Glue jobs if you don’t have one already. For instructions, refer to Create an IAM role for AWS Glue.

Deploy an Airflow environment and VPC

First, you’ll deploy a new Airflow environment, including the creation of a new VPC with two public subnets and two private ones. This is because Amazon MWAA requires Availability Zone failure tolerance, so it needs to run on two subnets on two different Availability Zones in the Region. The public subnets are used so the NAT Gateway can provide internet access for the private subnets.

Complete the following steps:

  1. Create an AWS CloudFormation template in your computer by copying the template from the following quick start guide into a local text file.
  2. On the AWS CloudFormation console, choose Stacks in the navigation pane.
  3. Choose Create stack with the option With new resources (standard).
  4. Choose Upload a template file and choose the local template file.
  5. Choose Next.
  6. Complete the setup steps, entering a name for the environment, and leave the rest of the parameters as default.
  7. On the last step, acknowledge that resources will be created and choose Submit.

The creation can take 20–30 minutes, until the status of the stack changes to CREATE_COMPLETE.

The resource that will take most of time is the Airflow environment. While it’s being created, you can continue with the following steps, until you are required to open the Airflow UI.

  1. On the stack’s Resources tab, note the IDs for the VPC and two private subnets (PrivateSubnet1 and PrivateSubnet2), to use in the next step.

Create AWS Glue connections

The CloudFormation template deploys two private subnets. In this step, you create an AWS Glue connection to each one so AWS Glue jobs can run in them. Amazon MWAA recently added the capacity to run the Airflow cluster on shared VPCs, which reduces cost and simplifies network management. For more information, refer to Introducing shared VPC support on Amazon MWAA.

Complete the following steps to create the connections:

  1. On the AWS Glue console, choose Data connections in the navigation pane.
  2. Choose Create connection.
  3. Choose Network as the data source.
  4. Choose the VPC and private subnet (PrivateSubnet1) created by the CloudFormation stack.
  5. Use the default security group.
  6. Choose Next.
  7. For the connection name, enter MWAA-Glue-Blog-Subnet1.
  8. Review the details and complete the creation.
  9. Repeat these steps using PrivateSubnet2 and name the connection MWAA-Glue-Blog-Subnet2.

Create the AWS Glue job

Now you create the AWS Glue job that will be triggered later by the Airflow workflow. The job uses the connections created in the previous section, but instead of assigning them directly on the job, as you would normally do, in this scenario you leave the job connections list empty and let the workflow decide which one to use at runtime.

The job script in this case is not significant and is just intended to demonstrate the job ran in one of the subnets, depending on the connection.

  1. On the AWS Glue console, choose ETL jobs in the navigation pane, then choose Script editor.
  2. Leave the default options (Spark engine and Start fresh) and choose Create script.
  3. Replace the placeholder script with the following Python code:
    import ipaddress
    import socket
    
    subnets = {
        "PrivateSubnet1": "10.192.20.0/24",
        "PrivateSubnet2": "10.192.21.0/24"
    }
    
    ip = socket.gethostbyname(socket.gethostname())
    subnet_name = "unknown"
    for subnet, cidr in subnets.items():
        if ipaddress.ip_address(ip) in ipaddress.ip_network(cidr):
            subnet_name = subnet
    
    print(f"The driver node has been assigned the ip: {ip}"
          + f" which belongs to the subnet: {subnet_name}")
    

  4. Rename the job to AirflowBlogJob.
  5. On the Job details tab, for IAM Role, choose any role and enter 2 for the number of workers (just for frugality).
  6. Save these changes so the job is created.

Grant AWS Glue permissions to the Airflow environment role

The role created for Airflow by the CloudFormation template provides the basic permissions to run workflows but not to interact with other services such as AWS Glue. In a production project, you would define your own templates with these additional permissions, but in this post, for simplicity, you add the additional permissions as an inline policy. Complete the following steps:

  1. On the IAM console, choose Roles in the navigation pane.
  2. Locate the role created by the template; it will start with the name you assigned to the CloudFormation stack and then -MwaaExecutionRole-.
  3. On the role details page, on the Add permissions menu, choose Create inline policy.
  4. Switch from Visual to JSON mode and enter the following JSON on the textbox. It assumes that the AWS Glue role you have follows the convention of starting with AWSGlueServiceRole. For enhanced security, you can replace the wildcard resource on the ec2:DescribeSubnets permission with the ARNs of the two private subnets from the CloudFormation stack.
    {
        "Version": "2012-10-17",
        "Statement": [
            {
                "Effect": "Allow",
                "Action": [
                    "glue:GetConnection"
                ],
                "Resource": [
                    "arn:aws:glue:*:*:connection/MWAA-Glue-Blog-Subnet*",
                    "arn:aws:glue:*:*:catalog"
                ]
            },
            {
                "Effect": "Allow",
                "Action": [
                    "glue:UpdateJob",
                    "glue:GetJob",
                    "glue:StartJobRun",
                    "glue:GetJobRun"
                ],
                "Resource": [
                    "arn:aws:glue:*:*:job/AirflowBlogJob",
                    "arn:aws:glue:*:*:job/BlogAirflow"
                ]
            },
            {
                "Effect": "Allow",
                "Action": [
                    "ec2:DescribeSubnets"
                ],
                "Resource": "*"
            },
            {
                "Effect": "Allow",
                "Action": [
                    "iam:GetRole",
                    "iam:PassRole"
                ],
                "Resource": "arn:aws:iam::*:role/service-role/AWSGlueServiceRole*"
            }
        ]
    }
    

  5. Choose Next.
  6. Enter GlueRelatedPermissions as the policy name and complete the creation.

In this example, we use an ETL script job; for a visual job, because it generates the script automatically on save, the Airflow role would need permission to write to the configured script path on Amazon Simple Storage Service (Amazon S3).

Create the Airflow DAG

An Airflow workflow is based on a Directed Acyclic Graph (DAG), which is defined by a Python file that programmatically specifies the different tasks involved and its interdependencies. Complete the following scripts to create the DAG:

  1. Create a local file named glue_job_dag.py using a text editor.

In each of the following steps, we provide a code snippet to enter into the file and an explanation of what is does.

  1. The following snippet adds the required Python modules imports. The modules are already installed on Airflow; if that weren’t the case, you would need to use a requirements.txt file to indicate to Airflow which modules to install. It also defines the Boto3 clients that the code will use later. By default, they will use the same role and Region as Airflow, that’s why you set up before the role with the additional permissions required.
    import boto3
    from pendulum import datetime, duration
    from random import shuffle
    from airflow import DAG
    from airflow.decorators import dag, task
    from airflow.models import Variable
    from airflow.providers.amazon.aws.operators.glue import GlueJobOperator
    
    glue_client = boto3.client('glue')
    ec2 = boto3.client('ec2')
    

  2. The following snippet adds three functions to implement the connection order strategy, which defines how to reorder the connections given to establish their priority. This is just an example; you can build your custom code to implement your own logic, as per your needs. The code first checks the IPs available on each connection subnet and separates the ones that have enough IPs available to run the job at full capacity and those that could be used because they have at least two IPs available, which is the minimum a job needs to start. If the strategy is set to random, it will randomize the order within each of the connection groups previously described and add any other connections. If the strategy is capacity, it will order them from most IPs free to fewest.
    def get_available_ips_from_connection(glue_connection_name):
        conn_response = glue_client.get_connection(Name=glue_connection_name)
        connection_properties = conn_response['Connection']['PhysicalConnectionRequirements']
        subnet_id = connection_properties['SubnetId']
        subnet_response = ec2.describe_subnets(SubnetIds=[subnet_id])
        return subnet_response['Subnets'][0]['AvailableIpAddressCount']
    
    def get_connections_free_ips(glue_connection_names, num_workers):
        good_connections = []
        usable_connections = []    
        for connection_name in glue_connection_names:
            try:
                available_ips = get_available_ips_from_connection(connection_name)
                # Priority to connections that can hold the full cluster and we haven't just tried
                if available_ips >= num_workers:
                    good_connections.append((connection_name, available_ips))
                elif available_ips >= 2: # The bare minimum to start a Glue job
                    usable_connections.append((connection_name, available_ips))                
            except Exception as e:
                print(f"[WARNING] Failed to check the free ips for:{connection_name}, will skip. Exception: {e}")  
        return good_connections, usable_connections
    
    def prioritize_connections(connection_list, num_workers, strategy):
        (good_connections, usable_connections) = get_connections_free_ips(connection_list, num_workers)
        print(f"Good connections: {good_connections}")
        print(f"Usable connections: {usable_connections}")
        all_conn = []
        if strategy=="random":
            shuffle(good_connections)
            shuffle(usable_connections)
            # Good connections have priority
            all_conn = good_connections + usable_connections
        elif strategy=="capacity":
            # We can sort both at the same time
            all_conn = good_connections + usable_connections
            all_conn.sort(key=lambda x: -x[1])
        else: 
            raise ValueError(f"Unknown strategy specified: {strategy}")    
        result = [c[0] for c in all_conn] # Just need the name
        # Keep at the end any other connections that could not be checked for ips
        result += [c for c in connection_list if c not in result]
        return result
    

  3. The following code creates the DAG itself with the run job task, which updates the job with the connection order defined by the strategy, runs it, and waits for the results. The job name, connections, and strategy come from Airflow variables, so it can be easily configured and updated. It has two retries with exponential backoff configured, so if the tasks fails, it will repeat the full task including the connection selection. Maybe now the best choice is another connection, or the subnet previously picked randomly is in an Availability Zone that is currently suffering an outage, and by picking a different one, it can recover.
    with DAG(
        dag_id='glue_job_dag',
        schedule_interval=None, # Run on demand only
        start_date=datetime(2000, 1, 1), # A start date is required
        max_active_runs=1,
        catchup=False
    ) as glue_dag:
        
        @task(
            task_id="glue_task", 
            retries=2,
            retry_delay=duration(seconds = 30),
            retry_exponential_backoff=True
        )
        def run_job_task(**ctx):    
            glue_connections = Variable.get("glue_job_dag.glue_connections").strip().split(',')
            glue_jobname = Variable.get("glue_job_dag.glue_job_name").strip()
            strategy= Variable.get('glue_job_dag.strategy', 'random') # random or capacity
            print(f"Connections available: {glue_connections}")
            print(f"Glue job name: {glue_jobname}")
            print(f"Strategy to use: {strategy}")
            job_props = glue_client.get_job(JobName=glue_jobname)['Job']            
            num_workers = job_props['NumberOfWorkers']
            
            glue_connections = prioritize_connections(glue_connections, num_workers, strategy)
            print(f"Running Glue job with the connection order: {glue_connections}")
            existing_connections = job_props.get('Connections',{}).get('Connections', [])
            # Preserve other connections that we don't manage
            other_connections = [con for con in existing_connections if con not in glue_connections]
            job_props['Connections'] = {"Connections": glue_connections + other_connections}
            # Clean up properties so we can reuse the dict for the update request
            for prop_name in ['Name', 'CreatedOn', 'LastModifiedOn', 'AllocatedCapacity', 'MaxCapacity']:
                del job_props[prop_name]
    
            GlueJobOperator(
                task_id='submit_job',
                job_name=glue_jobname,
                iam_role_name=job_props['Role'].split('/')[-1],
                update_config=True,
                create_job_kwargs=job_props,
                wait_for_completion=True
            ).execute(ctx)   
            
        run_job_task()
    

Create the Airflow workflow

Now you create a workflow that invokes the AWS Glue job you just created:

  1. On the Amazon S3 console, locate the bucket created by the CloudFormation template, which will have a name starting with the name of the stack and then -environmentbucket- (for example, myairflowstack-environmentbucket-ap1qks3nvvr4).
  2. Inside that bucket, create a folder called dags, and inside that folder, upload the DAG file glue_job_dag.py that you created in the previous section.
  3. On the Amazon MWAA console, navigate to the environment you deployed with the CloudFormation stack.

If the status is not yet Available, wait until it reaches that state. It shouldn’t take longer than 30 minutes since you deployed the CloudFormation stack.

  1. Choose the environment link on the table to see the environment details.

It’s configured to pick up DAGs from the bucket and folder you used in the previous steps. Airflow will monitor that folder for changes.

  1. Choose Open Airflow UI to open a new tab accessing the Airflow UI, using the integrated IAM security to log you in.

If there’s any issue with the DAG file you created, it will display an error on top of the page indicating the lines affected. In that case, review the steps and upload again. After a few seconds, it will parse it and update or remove the error banner.

  1. On the Admin menu, choose Variables.
  2. Add three variables with the following keys and values:
    1. Key glue_job_dag.glue_connections with value MWAA-Glue-Blog-Subnet1,MWAA-Glue-Blog-Subnet2.
    2. Key glue_job_dag.glue_job_name with value AirflowBlogJob.
    3. Key glue_job_dag.strategy with value capacity.

Run the job with a dynamic subnet assignment

Now you’re ready to run the workflow and see the strategy dynamically reordering the connections.

  1. On the Airflow UI, choose DAGs, and on the row glue_job_dag, choose the play icon.
  2. On the Browse menu, choose Task instances.
  3. On the instances table, scroll right to display the Log Url and choose the icon on it to open the log.

The log will update as the task runs; you can locate the line starting with “Running Glue job with the connection order:” and the previous lines showing details of the connection IPs and the category assigned. If an error occurs, you’ll see the details in this log.

  1. On the AWS Glue console, choose ETL jobs in the navigation pane, then choose the job AirflowBlogJob.
  2. On the Runs tab, choose the run instance, then the Output logs link, which will open a new tab.
  3. On the new tab, use the log stream link to open it.

It will display the IP that the driver was assigned and which subnet it belongs to, which should match the connection indicated by Airflow (if the log is not displayed, choose Resume so it gets updated as soon as it’s available).

  1. On the Airflow UI, edit the Airflow variable glue_job_dag.strategy to set it to random.
  2. Run the DAG multiple times and see how the ordering changes.

Clean up

If you no longer need the deployment, delete the resources to avoid any further charges:

  1. Delete the Python script you uploaded, so the S3 bucket can be automatically deleted in the next step.
  2. Delete the CloudFormation stack.
  3. Delete the AWS Glue job.
  4. Delete the script that the job saved in Amazon S3.
  5. Delete the connections you created as part of this post.

Conclusion

In this post, we showed how AWS Glue and Amazon MWAA can work together to build more advanced custom workflows, while minimizing the operational and management overhead. This solution gives you more control about how your AWS Glue job runs to meet special operational, network, or security requirements.

You can deploy your own Amazon MWAA environment in multiple ways, such as with the template used in this post, on the Amazon MWAA console, or using the AWS CLI. You can also implement your own strategies to orchestrate AWS Glue jobs, based on your network architecture and requirements (for instance, to run the job closer to the data when possible).


About the authors

Michael Greenshtein is an Analytics Specialist Solutions Architect for the Public Sector.

Gonzalo Herreros is a Senior Big Data Architect on the AWS Glue team.

The collective thoughts of the interwebz