Tag Archives: news

Monitor, Evaluate, and Demonstrate Backup Compliance with AWS Backup Audit Manager

Post Syndicated from Steve Roberts original https://aws.amazon.com/blogs/aws/monitor-evaluate-and-demonstrate-backup-compliance-with-aws-backup-audit-manager/

Today, I’m happy to announce the availability of AWS Backup Audit Manager, a new feature of AWS Backup that helps you monitor and evaluate the compliance status of your backups to meet business and regulatory requirements, and enables you to generate reports that help demonstrate compliance to auditors and regulators.

AWS Backup is a fully managed service that provides the ability to initiate policy-driven backups and restores of AWS applications, simplifying the process of protecting data at scale by removing the need for custom scripts and manual processes. However, customers still needed to use their own tooling for verifying that backup policies were being enforced and, as part of proving adherence to auditors, parsing backup transcripts to convert them into auditable reports.

With AWS Backup Audit Manager, you can now continuously and automatically track your backup activity, such as changes to a backup plan or backup vault, and generate automatic daily reports. AWS Backup Audit Manager provides built-in, customizable, compliance controls. Simply put, controls are procedures with backup policy parameters, for example the backup frequency or the retention period, that align with your business compliance and regulatory requirements.

You create a framework, scoped to an account and Region, and add the controls you need to it. Backup activities are tracked against the controls, automatically detecting violations of your defined data protection policies, enabling you to take quick corrective actions. To enable tracking of backup activities, AWS Backup Audit Manager requires you to enable monitoring through AWS Config for your backup plans (AWS::Backup::BackupPlan resource type), backup selection (AWS::Backup::BackupSelection), vaults (AWS::Backup::BackupVault), recovery points (AWS::Backup::RecoveryPoint), and AWS Config resource compliance (AWS::Config::ResourceCompliance). You can check the recording status of these resources in the AWS Backup console, using the Resource Tracking section of the Frameworks page.

Once you’ve added the controls you need to your framework, you deploy it. If you have different internal or regulatory standards to meet, you can create and deploy additional frameworks of controls. Once the framework is deployed, you can set up automatic daily reports of your backup activity. These are displayed in a dashboard, and you can also request on-demand reports at any time. You can also import your findings into AWS Audit Manager, a service I wrote about during AWS re:Invent 2020 in this news blog post.

This short video gives a brief overview of the new AWS Backup Audit Manager feature.

Available Controls and Backup Reports
AWS Backup Audit Manager provides five backup governance control templates and backup activity reporting on your backup jobs, copy jobs, and restore jobs. These reports improve visibility into backup activities for a single account and Region, helping you monitor your operational posture and identify failures that may need further action.

When creating a framework, you provide a name, an optional description, and you select whether to use the provided AWS Backup framework type, which includes five pre-defined controls, or you can opt to customize your framework.

Creating an AWS Backup Audit Manager framework

Choosing Custom framework expands the panel to show the available controls, their parameters, and the option to include or exclude them from your framework. The five available controls are titled Backup resources protected by backup plan, Backup plan minimum frequency and minimum retention, Backup prevent recovery point manual deletion, Backup recovery point encrypted, and Backup recovery point minimum retention. To the right of each control’s title you’ll find an info link that describes what the control evaluates, how frequently, and what it means for a resource to be compliant with the control.

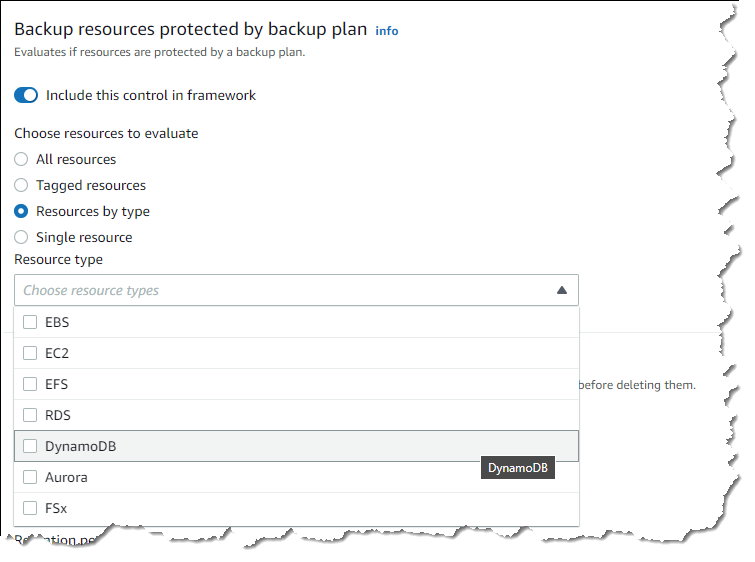
Let’s examine a couple of controls. The Backup resources protected by backup plan control enables you to select all supported resources, or those identified by a tag, by type, or a particular resource. This control helps identify gaps in your backup coverage.

Backup resources protected by backup plan control resource selection

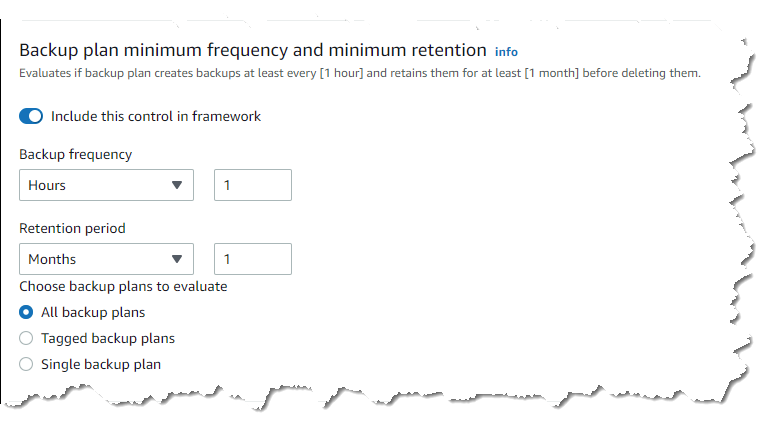
The Backup plan minimum frequency and minimum retention control has parameters governing how frequently the backup plan should be taking backups, and for how long recovery points should be maintained. The default settings require backups to occur every hour, and recovery points should be retained for a month, but you can customize the settings to meet your business compliance requirements.

Setting backup frequency and retention period controls

You complete your selections for the remaining controls, including them and setting appropriate parameter values for your needs, or excluding them from the framework, and then click Create framework to complete the process. The new framework will be created and deployed, which will take a few minutes. If needed, you can go back and edit the controls and parameters in a framework at any time.

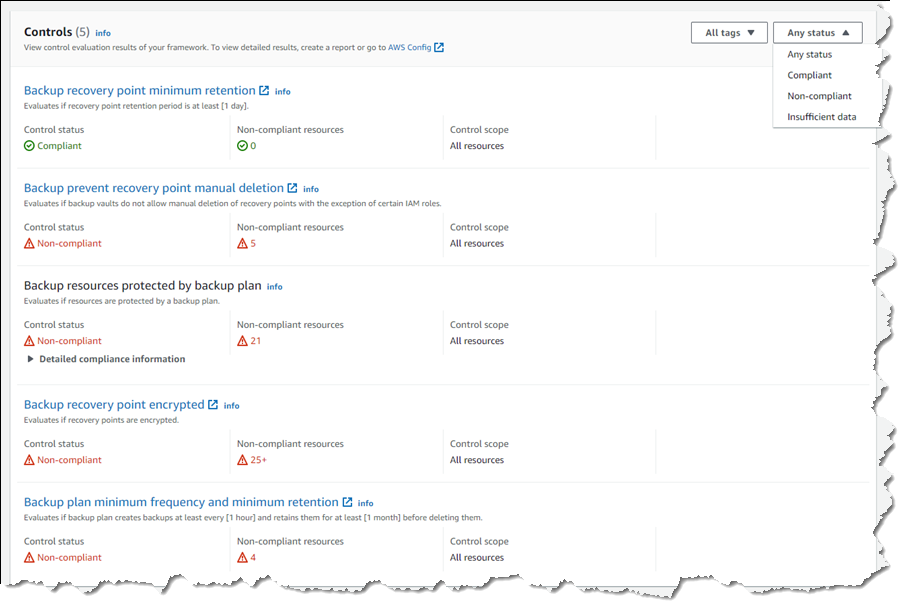
Once deployed, the controls in the framework will start to evaluate compliance and you can inspect compliance status in the console by selecting the framework. The summary section reports the overall compliance status of the framework and the number of controls in the framework that are compliant or non-compliant, based on your deployed control definitions.

Summary of framework and control compliance

Below the summary, you’ll find a list containing compliance details for each of the controls in the framework, which can be filtered by status. Each control details whether it’s compliant or non-compliant, and how many resources monitored by the control are non-compliant. Clicking a control title will take you directly to the AWS Config dashboard, where you can view more details on the resources identified by the control.

Control compliance detail

Automated reports on backup activity can be used to demonstrate compliance to auditors and regulators. To set up reports, first click the Reports entry in the navigation toolbar, and then click Create report plan. You’ll be asked to select a report template.

Selecting audit report template

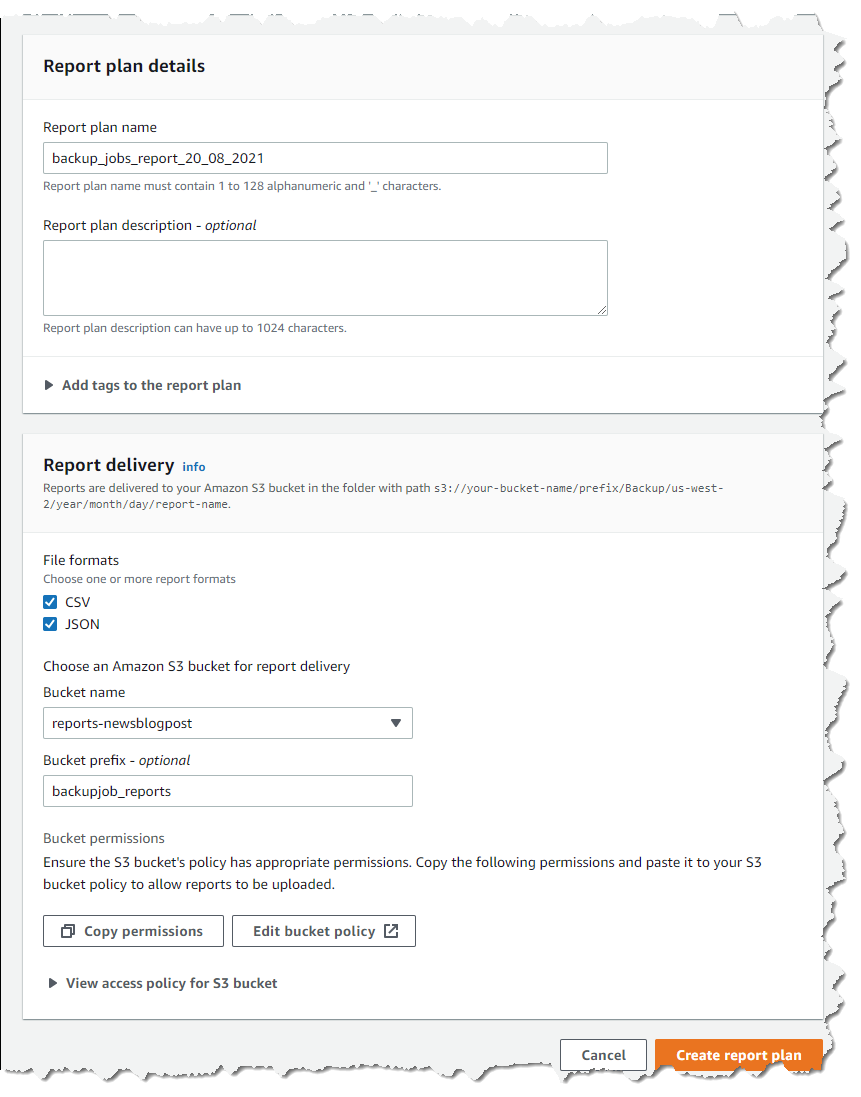
With the template selected (I chose Backup jobs report), you fill in a name and optional description, choose where in your Amazon Simple Storage Service (Amazon S3) buckets you want the report to be delivered, and the report file formats, and then click Create report plan. Your report will update every 24 hours, and you can run an on-demand report at any time.

Editing report settings

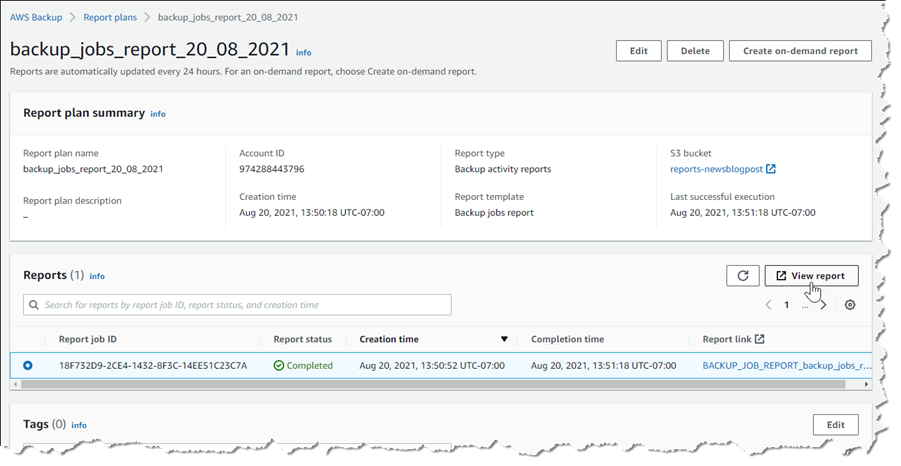
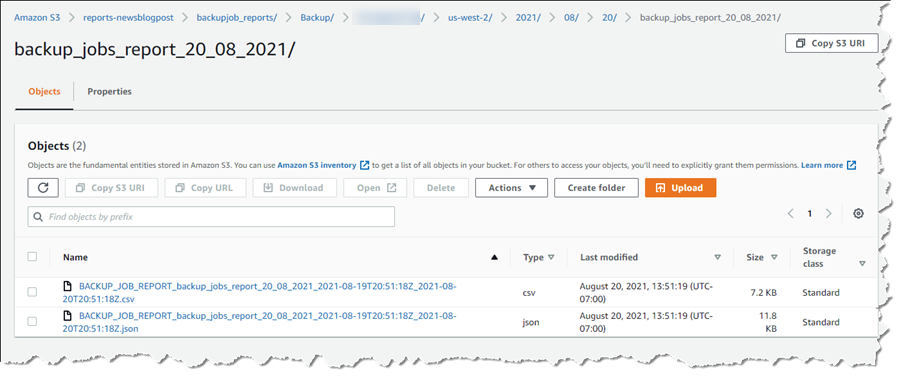
Once a report has been run, either automatically or on-demand, you can view the report data by first selecting the report in your Report plans list, followed by clicking View report. You’ll be taken directly to the chosen S3 location of the report files, where you’ll see one object (report) per chosen file type.

Selecting a report to view

Report files in Amazon S3

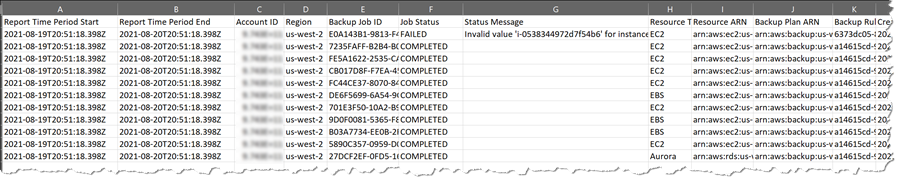
Downloading the file shows you the time period in which the resources were evaluated, the backup job details, failure or completion status, status messages, the resource type and backup plan, and more. Here I’ve opened the CSV format file in a spreadsheet.

Backup report data

Open Raven Launch Partnership
With this launch, we’re excited to have Open Raven join us as an AWS Backup partner. Open Raven is a cloud-native data security platform purpose-built for protecting modern data lakes and warehouses. From finding all data locations to proactively identifying exposure, their platform solves a broad spectrum of problems that organizations commonly face when living with large amounts of cloud-based data.

Open Raven Chief Technology Officer Mark Curphey had this to say about the new AWS Backup feature: “To successfully recover from a ransomware attack, organizations need to plan ahead by completing two foundational tasks, identifying critical data and systems and backing them up as per organizational requirements so that they can be protected and recovered. The combination of AWS Backup Audit Manager and Open Raven streamlines this effort, eliminating guesswork and hours of manual toil.”

Start Using AWS Backup Audit Manager Today
AWS Backup Audit Manager is available today in the US East (N. Virginia, Ohio), US West (N. California, Oregon), Canada (Central), EU (Frankfurt, Ireland, London, Paris, Stockholm), South America (Sao Paulo), Asia Pacific (Hong Kong, Mumbai, Seoul, Singapore, Sydney, Tokyo), and Middle East (Bahrain) Regions.

For more information about Backup Audit Manager, refer to this section in the AWS Backup Developer Guide. To get started, visit the AWS Backup console.

— Steve

Happy 15th Birthday Amazon EC2

Post Syndicated from Jeff Barr original https://aws.amazon.com/blogs/aws/happy-15th-birthday-amazon-ec2/

Fifteen years ago today I wrote the blog post that launched the Amazon EC2 Beta. As I recall, the launch was imminent for quite some time as we worked to finalize the feature set, the pricing model, and innumerable other details. The launch date was finally chosen and it happened to fall in the middle of a long-planned family vacation to Cabo San Lucas, Mexico. Undaunted, I brought my laptop along on vacation, and had to cover it with a towel so that I could see the screen as I wrote. I am not 100% sure, but I believe that I actually clicked Publish while sitting on a lounge chair near the pool! I spent the remainder of the week offline, totally unaware of just how much excitement had been created by this launch.

Preparing for the Launch
When Andy Jassy formed the AWS group and began writing his narrative, he showed me a document that proposed the construction of something called the Amazon Execution Service and asked me if developers would find it useful, and if they would pay to use it. I read the document with great interest and responded with an enthusiastic “yes” to both of his questions. Earlier in my career I had built and run several projects hosted at various colo sites, and was all too familiar with the inflexible long-term commitments and the difficulties of scaling on demand; the proposed service would address both of these fundamental issues and make it easier for developers like me to address widely fluctuating changes in demand.

The EC2 team had to make a lot of decisions in order to build a service to meet the needs of developers, entrepreneurs, and larger organizations. While I was not part of the decision-making process, it seems to me that they had to make decisions in at least three principal areas: features, pricing, and level of detail.

Features – Let’s start by reviewing the features that EC2 launched with. There was one instance type, one region (US East (N. Virginia)), and we had not yet exposed the concept of Availability Zones. There was a small selection of prebuilt Linux kernels to choose from, and IP addresses were allocated as instances were launched. All storage was transient and had the same lifetime as the instance. There was no block storage and the root disk image (AMI) was stored in an S3 bundle. It would be easy to make the case that any or all of these features were must-haves for the launch, but none of them were, and our customers started to put EC2 to use right away. Over the years I have seen that this strategy of creating services that are minimal-yet-useful allows us to launch quickly and to iterate (and add new features) rapidly in response to customer feedback.

Pricing – While it was always obvious that we would charge for the use of EC2, we had to decide on the units that we would charge for, and ultimately settled on instance hours. This was a huge step forward when compared to the old model of buying a server outright and depreciating it over a 3 or 5 year term, or paying monthly as part of an annual commitment. Even so, our customers had use cases that could benefit from more fine-grained billing, and we launched per-second billing for EC2 and EBS back in 2017. Behind the scenes, the AWS team also had to build the infrastructure to measure, track, tabulate, and bill our customers for their usage.

Level of Detail – This might not be as obvious as the first two, but it is something that I regularly think about when I write my posts. At launch time I shared the fact that the EC2 instance (which we later called the m1.small) provided compute power equivalent to a 1.7 GHz Intel Xeon processor, but I did not share the actual model number or other details. I did share the fact that we built EC2 on Xen. Over the years, customers told us that they wanted to take advantage of specialized processor features and we began to share that information.

Some Memorable EC2 Launches
Looking back on the last 15 years, I think we got a lot of things right, and we also left a lot of room for the service to grow. While I don’t have one favorite launch, here are some of the more memorable ones:

EC2 Launch (2006) – This was the launch that started it all. One of our more notable early scaling successes took place in early 2008, when Animoto scaled their usage from less than 100 instances all the way up to 3400 in the course of a week (read Animoto – Scaling Through Viral Growth for the full story).

Amazon Elastic Block Store (2008) – This launch allowed our customers to make use of persistent block storage with EC2. If you take a look at the post, you can see some historic screen shots of the once-popular ElasticFox extension for Firefox.

Elastic Load Balancing / Auto Scaling / CloudWatch (2009) – This launch made it easier for our customers to build applications that were scalable and highly available. To quote myself, “Amazon CloudWatch monitors your Amazon EC2 capacity, Auto Scaling dynamically scales it based on demand, and Elastic Load Balancing distributes load across multiple instances in one or more Availability Zones.”

Virtual Private Cloud / VPC (2009) – This launch gave our customers the ability to create logically isolated sets of EC2 instances and to connect them to existing networks via an IPsec VPN connection. It gave our customers additional control over network addressing and routing, and opened the door to many additional networking features over the coming years.

Nitro System (2017) – This launch represented the culmination of many years of work to reimagine and rebuild our virtualization infrastructure in pursuit of higher performance and enhanced security (read more).

Graviton (2018) -This launch marked the launch of Amazon-built custom CPUs that were designed for cost-sensitive scale-out workloads. Since that launch we have continued this evolutionary line, launching general purpose, compute-optimized, memory-optimized, and burstable instances powered by Graviton2 processors.

Instance Types (2006 – Present) -We launched with one instance type and now have over four hundred, each one designed to empower our customers to address a particular use case.

Celebrate with Us
To celebrate the incredible innovation we’ve seen from our customers over the last 15 years, we’re hosting a 2-day live event on August 23rd and 24th covering a range of topics. We kick off the event with today at 9am PDT with Vice President of Amazon EC2 Dave Brown’s keynote “Lessons from 15 Years of Innovation.

Event Agenda

August 23 August 24
Lessons from 15 Years of Innovation AWS Everywhere: A Fireside Chat on Hybrid Cloud
15 Years of AWS Silicon Innovation Deep Dive on Real-World AWS Hybrid Examples
Choose the Right Instance for the Right Workload AWS Outposts: Extending AWS On-Premises for a Truly Consistent Hybrid Experience
Optimize Compute for Cost and Capacity Connect Your Network to AWS with Hybrid Connectivity Solutions
The Evolution of Amazon Virtual Private Cloud Accelerating ADAS and Autonomous Vehicle Development on AWS
Accelerating AI/ML Innovation with AWS ML Infrastructure Services Accelerate AI/ML Adoption with AWS ML Silicon
Using Machine Learning and HPC to Accelerate Product Design Digital Twins: Connecting the Physical to the Digital World

Register here and join us starting at 9 AM PT to learn more about EC2 and to celebrate along with us!

— Jeff;

Introducing Amazon MemoryDB for Redis – A Redis-Compatible, Durable, In-Memory Database Service

Post Syndicated from Danilo Poccia original https://aws.amazon.com/blogs/aws/introducing-amazon-memorydb-for-redis-a-redis-compatible-durable-in-memory-database-service/

Interactive applications need to process requests and respond very quickly, and this requirement extends to all the components of their architecture. That is even more important when you adopt microservices and your architecture is composed of many small independent services that communicate with each other.

For this reason, database performance is critical to the success of applications. To reduce read latency to microseconds, you can put an in-memory cache in front of a durable database. For caching, many developers use Redis, an open-source in-memory data structure store. In fact, according to Stack Overflow’s 2021 Developer Survey, Redis has been the most loved database for five years.

To implement this setup on AWS, you can use Amazon ElastiCache for Redis, a fully managed in-memory caching service, as a low latency cache in front of a durable database service such as Amazon Aurora or Amazon DynamoDB to minimize data loss. However, this setup requires you to introduce custom code in your applications to keep the cache in sync with the database. You’ll also incur costs for running both a cache and a database.

Introducing Amazon MemoryDB for Redis
Today, I am excited to announce the general availability of Amazon MemoryDB for Redis, a new Redis-compatible, durable, in-memory database. MemoryDB makes it easy and cost-effective to build applications that require microsecond read and single-digit millisecond write performance with data durability and high availability.

Instead of using a low-latency cache in front of a durable database, you can now simplify your architecture and use MemoryDB as a single, primary database. With MemoryDB, all your data is stored in memory, enabling low latency and high throughput data access. MemoryDB uses a distributed transactional log that stores data across multiple Availability Zones (AZs) to enable fast failover, database recovery, and node restarts with high durability.

MemoryDB maintains compatibility with open-source Redis and supports the same set of Redis data types, parameters, and commands that you are familiar with. This means that the code, applications, drivers, and tools you already use today with open-source Redis can be used with MemoryDB. As a developer, you get immediate access to many data structures such as strings, hashes, lists, sets, sorted sets with range queries, bitmaps, hyperloglogs, geospatial indexes, and streams. You also get access to advanced features such as built-in replication, least recently used (LRU) eviction, transactions, and automatic partitioning. MemoryDB is compatible with Redis 6.2 and will support newer versions as they are released in open source.

One question you might have at this point is how MemoryDB compares to ElastiCache because both services give access to Redis data structures and API:

  • MemoryDB can safely be the primary database for your applications because it provides data durability and microsecond read and single-digit millisecond write latencies. With MemoryDB, you don’t need to add a cache in front of the database to achieve the low latency you need for your interactive applications and microservices architectures.
  • On the other hand, ElastiCache provides microsecond latencies for both reads and writes. It is ideal for caching workloads where you want to accelerate data access from your existing databases. ElastiCache can also be used as a primary datastore for use cases where data loss might be acceptable (for example, because you can quickly rebuild the database from another source).

Creating an Amazon MemoryDB Cluster
In the MemoryDB console, I follow the link on the left navigation pane to the Clusters section and choose Create cluster. This opens Cluster settings where I enter a name and a description for the cluster.

Console screenshot.

All MemoryDB clusters run in a virtual private cloud (VPC). In Subnet groups I create a subnet group by selecting one of my VPCs and providing a list of subnets that the cluster will use to distribute its nodes.

Console screenshot.

In Cluster settings, I can change the network port, the parameter group that controls the runtime properties of my nodes and clusters, the node type, the number of shards, and the number of replicas per shard. Data stored in the cluster is partitioned across shards. The number of shards and the number of replicas per shard determine the number of nodes in my cluster. Considering that for each shard there is a primary node plus the replicas, I expect this cluster to have eight nodes.

For Redis version compatibility, I choose 6.2. I leave all other options to their default and choose Next.

Console screenshot.

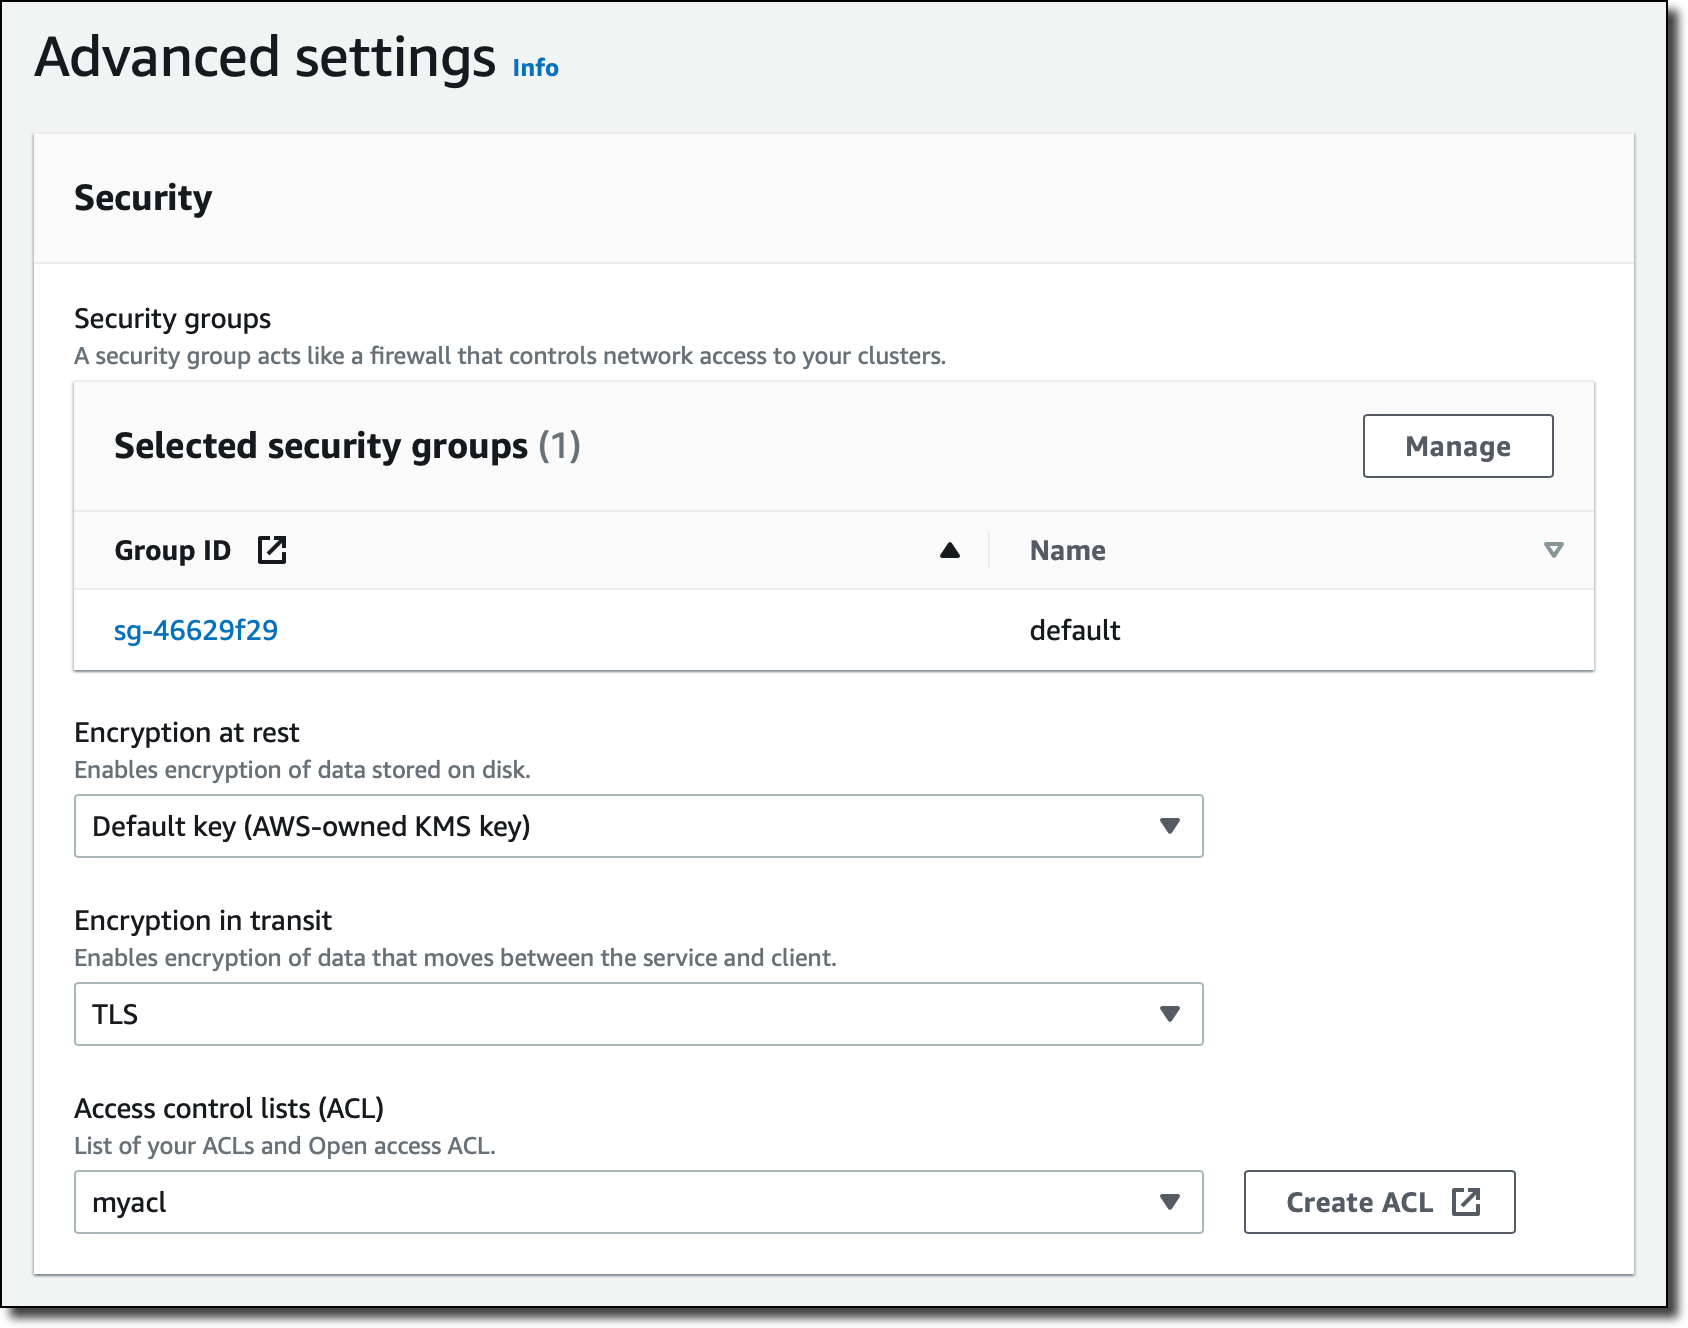
In the Security section of Advanced settings I add the default security group for the VPC I used for the subnet group and choose an access control list (ACL) that I created before. MemoryDB ACLs are based on Redis ACLs and provide user credentials and permissions to connect to the cluster.

Console screenshot.

In the Snapshot section, I leave the default to have MemoryDB automatically create a daily snapshot and select a retention period of 7 days.

Console screenshot.

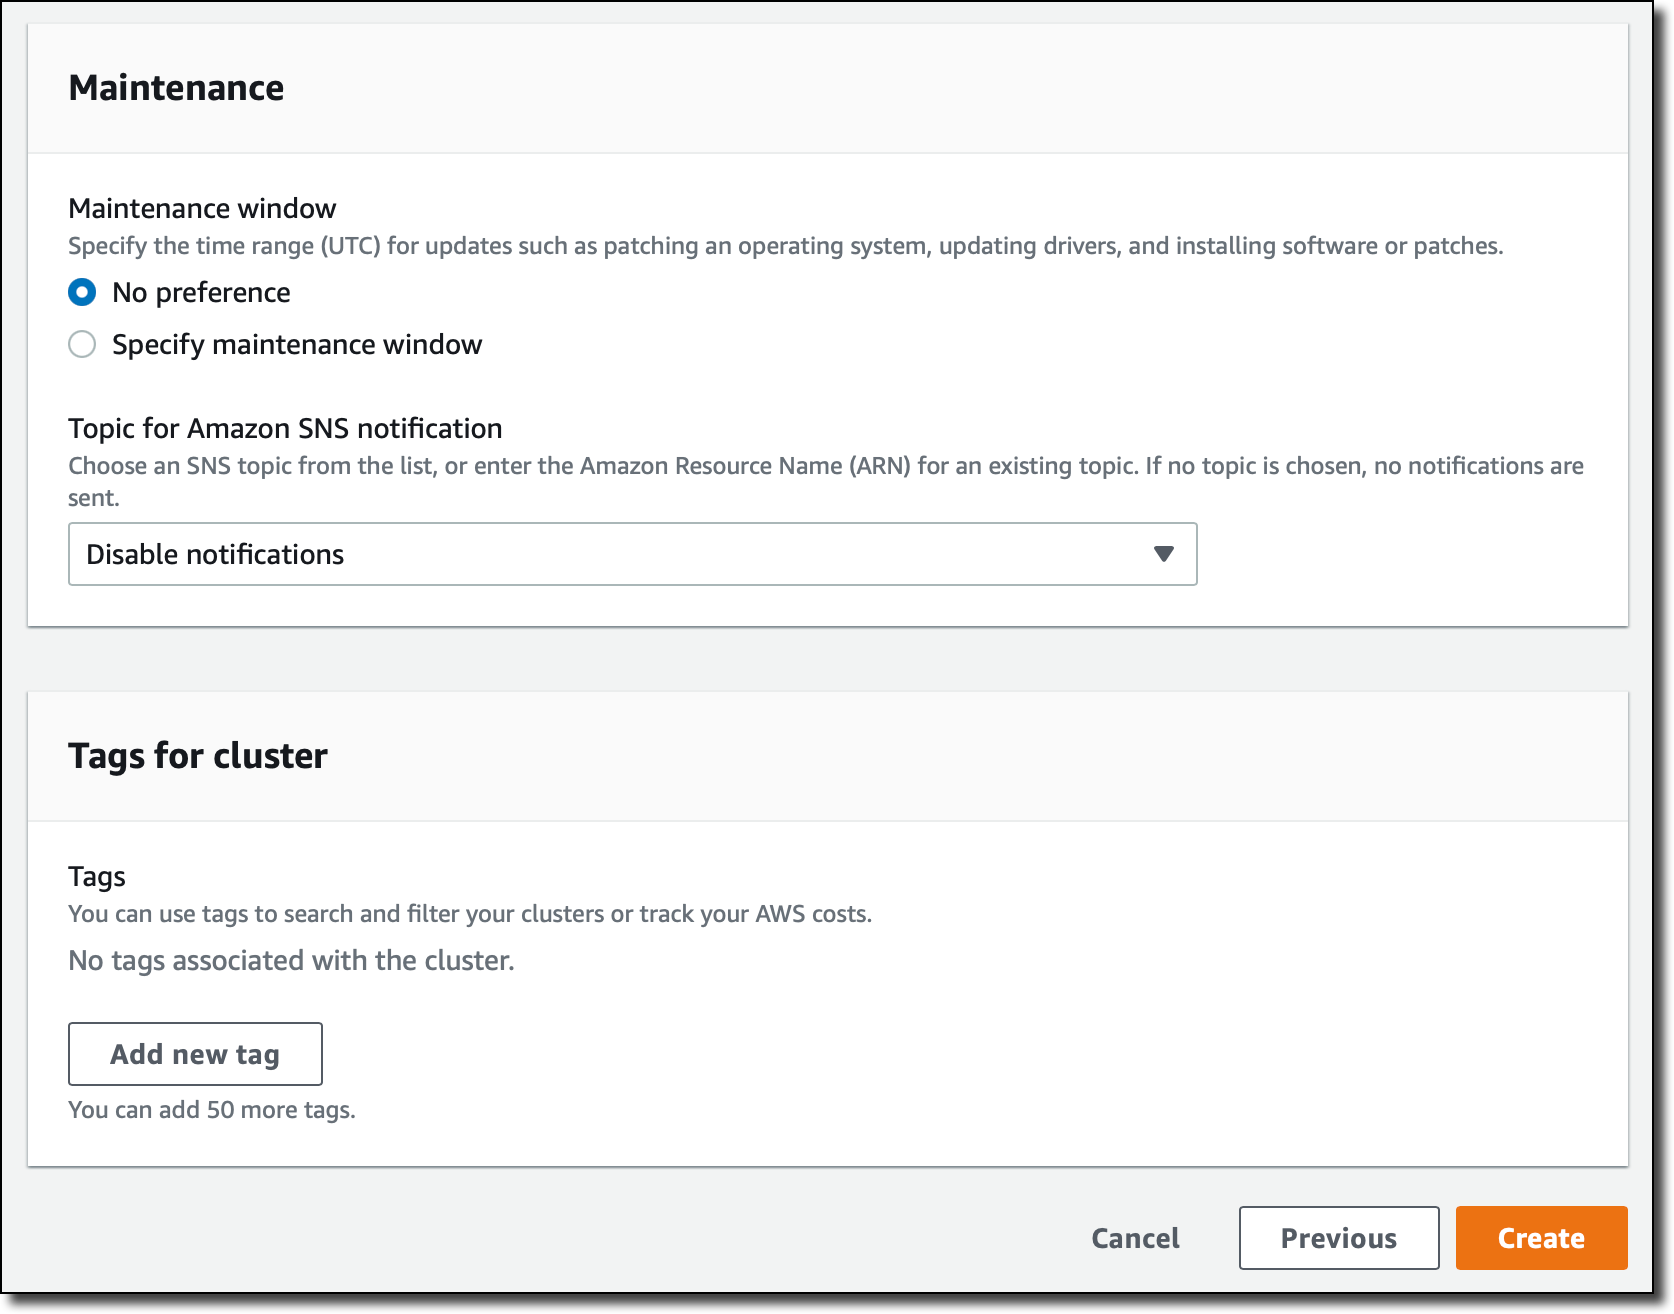
For Maintenance, I leave the defaults and then choose Create. In this section I can also provide an Amazon Simple Notification Service (SNS) topic to be notified of important cluster events.

Console screenshot.

After a few minutes, the cluster is running and I can connect using the Redis command line interface or any Redis client.

Using Amazon MemoryDB as Your Primary Database
Managing customer data is a critical component of many business processes. To test the durability of my new Amazon MemoryDB cluster, I want to use it as a customer database. For simplicity, let’s build a simple microservice in Python that allows me to create, update, delete, and get one or all customer data from a Redis cluster using a REST API.

Here’s the code of my server.py implementation:

from flask import Flask, request
from flask_restful import Resource, Api, abort
from rediscluster import RedisCluster
import logging
import os
import uuid

host = os.environ['HOST']
port = os.environ['PORT']
db_host = os.environ['DBHOST']
db_port = os.environ['DBPORT']
db_username = os.environ['DBUSERNAME']
db_password = os.environ['DBPASSWORD']

logging.basicConfig(level=logging.INFO)

redis = RedisCluster(startup_nodes=[{"host": db_host, "port": db_port}],
            decode_responses=True, skip_full_coverage_check=True,
            ssl=True, username=db_username, password=db_password)

if redis.ping():
    logging.info("Connected to Redis")

app = Flask(__name__)
api = Api(app)


class Customers(Resource):

    def get(self):
        key_mask = "customer:*"
        customers = []
        for key in redis.scan_iter(key_mask):
            customer_id = key.split(':')[1]
            customer = redis.hgetall(key)
            customer['id'] = customer_id
            customers.append(customer)
            print(customer)
        return customers

    def post(self):
        print(request.json)
        customer_id = str(uuid.uuid4())
        key = "customer:" + customer_id
        redis.hset(key, mapping=request.json)
        customer = request.json
        customer['id'] = customer_id
        return customer, 201


class Customers_ID(Resource):

    def get(self, customer_id):
        key = "customer:" + customer_id
        customer = redis.hgetall(key)
        print(customer)
        if customer:
            customer['id'] = customer_id
            return customer
        else:
            abort(404)

    def put(self, customer_id):
        print(request.json)
        key = "customer:" + customer_id
        redis.hset(key, mapping=request.json)
        return '', 204

    def delete(self, customer_id):
        key = "customer:" + customer_id
        redis.delete(key)
        return '', 204


api.add_resource(Customers, '/customers')
api.add_resource(Customers_ID, '/customers/<customer_id>')


if __name__ == '__main__':
    app.run(host=host, port=port)

This is the requirements.txt file, which lists the Python modules required by the application:

redis-py-cluster
Flask
Flask-RESTful

The same code works with MemoryDB, ElastiCache, or any Redis Cluster database.

I start a Linux Amazon Elastic Compute Cloud (Amazon EC2) instance in the same VPC as the MemoryDB cluster. To be able to connect to the MemoryDB cluster, I assign the default security group. I also add another security group that gives me SSH access to the instance.

I copy the server.py and requirements.txt files onto the instance and then install the dependencies:

pip3 install --user -r requirements.txt

Now, I start the microservice:

python3 server.py

In another terminal connection, I use curl to create a customer in my database with an HTTP POST on the /customers resource:

curl -i --header "Content-Type: application/json" --request POST \
     --data '{"name": "Danilo", "address": "Somewhere in London",
              "phone": "+1-555-2106","email": "[email protected]", "balance": 1000}' \
     http://localhost:8080/customers

The result confirms that the data has been stored and a unique ID (a UUIDv4 generated by the Python code) has been added to the fields:

HTTP/1.0 201 CREATED
Content-Type: application/json
Content-Length: 172
Server: Werkzeug/2.0.1 Python/3.7.10
Date: Wed, 11 Aug 2021 18:16:58 GMT

{"name": "Danilo", "address": "Somewhere in London",
 "phone": "+1-555-2106", "email": "[email protected]",
 "balance": 1000, "id": "3894e683-1178-4787-9f7d-118511686415"}

All the fields are stored in a Redis Hash with a key formed as customer:<id>.

I repeat the previous command a couple of times to create three customers. The customer data is the same, but each one has a unique ID.

Now, I get a list of all customer with an HTTP GET to the /customers resource:

curl -i http://localhost:8080/customers

In the code there is an iterator on the matching keys using the SCAN command. In the response, I see the data for the three customers:

HTTP/1.0 200 OK
Content-Type: application/json
Content-Length: 526
Server: Werkzeug/2.0.1 Python/3.7.10
Date: Wed, 11 Aug 2021 18:20:11 GMT

[{"name": "Danilo", "address": "Somewhere in London",
"phone": "+1-555-2106", "email": "[email protected]",
"balance": "1000", "id": "1d734b6a-56f1-48c0-9a7a-f118d52e0e70"},
{"name": "Danilo", "address": "Somewhere in London",
"phone": "+1-555-2106", "email": "[email protected]",
"balance": "1000", "id": "89bf6d14-148a-4dfa-a3d4-253492d30d0b"},
{"name": "Danilo", "address": "Somewhere in London",
"phone": "+1-555-2106", "email": "[email protected]",
"balance": "1000", "id": "3894e683-1178-4787-9f7d-118511686415"}]

One of the customers has just spent all his balance. I update the field with an HTTP PUT on the URL of the customer resource that includes the ID (/customers/<id>):

curl -i --header "Content-Type: application/json" \
     --request PUT \
     --data '{"balance": 0}' \
     http://localhost:8080/customers/3894e683-1178-4787-9f7d-118511686415

The code is updating the fields of the Redis Hash with the data of the request. In this case, it’s setting the balance to zero. I verify the update by getting the customer data by ID:

curl -i http://localhost:8080/customers/3894e683-1178-4787-9f7d-118511686415

In the response, I see that the balance has been updated:

HTTP/1.0 200 OK
Content-Type: application/json
Content-Length: 171
Server: Werkzeug/2.0.1 Python/3.7.10
Date: Wed, 11 Aug 2021 18:32:15 GMT

{"name": "Danilo", "address": "Somewhere in London",
"phone": "+1-555-2106", "email": "[email protected]",
"balance": "0", "id": "3894e683-1178-4787-9f7d-118511686415"}

That’s the power of Redis! I was able to create the skeleton of a microservice with just a few lines of code. On top of that, MemoryDB gives me the durability and the high availability I need in production without the need to add another database in the backend.

Depending on my workload, I can scale my MemoryDB cluster horizontally, by adding or removing nodes, or vertically, by moving to larger or smaller node types. MemoryDB supports write scaling with sharding and read scaling by adding replicas. My cluster continues to stay online and support read and write operations during resizing operations.

Availability and Pricing
Amazon MemoryDB for Redis is available today in US East (N. Virginia), EU (Ireland), Asia Pacific (Mumbai), and South America (Sao Paulo) with more AWS Regions coming soon.

You can create a MemoryDB cluster in minutes using the AWS Management Console, AWS Command Line Interface (CLI), or AWS SDKs. AWS CloudFormation support will be coming soon. For the nodes, MemoryDB currently supports R6g Graviton2 instances.

To migrate from ElastiCache for Redis to MemoryDB, you can take a backup of your ElastiCache cluster and restore it to a MemoryDB cluster. You can also create a new cluster from a Redis Database Backup (RDB) file stored on Amazon Simple Storage Service (Amazon S3).

With MemoryDB, you pay for what you use based on on-demand instance hours per node, volume of data written to your cluster, and snapshot storage. For more information, see the MemoryDB pricing page.

Learn More
Check out the video below for a quick overview.

Start using Amazon MemoryDB for Redis as your primary database today.

— Danilo

New – Amazon EC2 M6i Instances Powered by the Latest-Generation Intel Xeon Scalable Processors

Post Syndicated from Danilo Poccia original https://aws.amazon.com/blogs/aws/new-amazon-ec2-m6i-instances-powered-by-the-latest-generation-intel-xeon-scalable-processors/

Last year, we introduced the sixth generation of EC2 instances powered by AWS-designed Graviton2 processors. We’re now expanding our sixth-generation offerings to include x86-based instances, delivering price/performance benefits for workloads that rely on x86 instructions.

Today, I am happy to announce the availability of the new general purpose Amazon EC2 M6i instances, which offer up to 15% improvement in price/performance versus comparable fifth-generation instances. The new instances are powered by the latest generation Intel Xeon Scalable processors (code-named Ice Lake) with an all-core turbo frequency of 3.5 GHz.

You might have noticed that we’re now using the “i” suffix in the instance type to specify that the instances are using an Intel processor. We already use the suffix “a” for AMD processors (for example, M5a instances) and “g” for Graviton processors (for example, M6g instances).

Compared to M5 instances using an Intel processor, this new instance type provides:

  • A larger instance size (m6i.32xlarge) with 128 vCPUs and 512 GiB of memory that makes it easier and more cost-efficient to consolidate workloads and scale up applications.
  • Up to 15% improvement in compute price/performance.
  • Up to 20% higher memory bandwidth.
  • Up to 40 Gbps for Amazon Elastic Block Store (EBS) and 50 Gbps for networking.
  • Always-on memory encryption.

M6i instances are a good fit for running general-purpose workloads such as web and application servers, containerized applications, microservices, and small data stores. The higher memory bandwidth is especially useful for enterprise applications, such as SAP HANA, and high performance computing (HPC) workloads, such as computational fluid dynamics (CFD).

M6i instances are also SAP-certified. For over eight years SAP customers have been relying on the Amazon EC2 M-family of instances for their mission critical SAP workloads. With M6i instances, customers can achieve up to 15% better price/performance for SAP applications than M5 instances.

M6i instances are available in nine sizes (the m6i.metal size is coming soon):

Name vCPUs Memory
(GiB)
Network Bandwidth
(Gbps)
EBS Throughput
(Gbps)
m6i.large 2 8 Up to 12.5 Up to 10
m6i.xlarge 4 16 Up to 12.5 Up to 10
m6i.2xlarge 8 32 Up to 12.5 Up to 10
m6i.4xlarge 16 64 Up to 12.5 Up to 10
m6i.8xlarge 32 128 12.5 10
m6i.12xlarge 48 192 18.75 15
m6i.16xlarge 64 256 25 20
m6i.24xlarge 96 384 37.5 30
m6i.32xlarge 128 512 50 40

The new instances are built on the AWS Nitro System, which is a collection of building blocks that offloads many of the traditional virtualization functions to dedicated hardware, delivering high performance, high availability, and highly secure cloud instances.

For optimal networking performance on these new instances, upgrade your Elastic Network Adapter (ENA) drivers to version 3. For more information, see this article about how to get maximum network performance on sixth-generation EC2 instances.

M6i instances support Elastic Fabric Adapter (EFA) on the m6i.32xlarge size for workloads that benefit from lower network latency, such as HPC and video processing.

Availability and Pricing
EC2 M6i instances are available today in six AWS Regions: US East (N. Virginia), US West (Oregon), US East (Ohio), Europe (Ireland), Europe (Frankfurt), and Asia Pacific (Singapore). As usual with EC2, you pay for what you use. For more information, see the EC2 pricing page.

— Danilo

Deploying and configuring Zabbix 5.4 in a multi-tenant environment

Post Syndicated from Arturs Lontons original https://blog.zabbix.com/deploying-and-configuring-zabbix-5-4-in-a-multi-tenant-environment/15109/

In this post and the video, we will discuss deploying and configuring Zabbix 5.4 in a multi-tenant environment and how Zabbix is finally ready for real multi-tenant use cases thanks to multiple features.

Contents

I. Monitoring requirements of multi-tenant environments (0:30)
II. Supported monitoring approaches (2:32)

III. Zabbix and multi-tenant environment (5:56)

IV. To-do list (21:36)
V. Questions & Answers (23:32)

Monitoring requirements of multi-tenant environments

Before talking Zabbix, let us first analyze the core requirements behind multi-tenant environments. Such environments can be quite complex with a particular set of prerequisites that we have to be sure we can satisfy before continuing further.

  • The core idea behind multi-tenancy is support for multiple customers. Therefore we need to support granular role/permission schema. The ability to define different roles for different customers and limit what they can access is key to success for such deployments.
  • Multiple customers means a lot of data. No matter if we’re talking about a single Zabbix instance or scaling by deploying multiple Zabbix instances (say, for different regions) we need to have the ability to process large amounts of data. 
  • On top of that, we must be able to scale upwards, ideally – both horizontally and vertically. More customers, different requirements, varying amounts of data to process – all of this needs to be accounted for in advance.
  • Redundancy is another key factor for us. As service providers, we absolutely cannot afford any downtime or data loss. While this may be acceptable in our own home labs or classrooms, this is not the case here. Unscheduled downtime could potentially result in a loss of a customer.

Supported monitoring approaches

Now that we have covered the architectural requirements, let’s focus on data collection. No matter the monitoring solution, the easiest approach in most cases would simply be to tell our customer to deploy an agent and be done with it. Unfortunately, this often doesn’t sit will with the end user and their security team. Let us also not forget that it is simply not possible to deploy an agent on some devices or environments – what then? Having a vast selection of monitoring methods is key for successful deployment of a multi-tenant monitoring service.

Let us take a look at this in the context of Zabbix.

Agent

  • With Zabbix agents we can obtain data in two ways – in passive (polling) and active modes (trapping). This is extremely useful while working with multiple customers, since each of them will have different internal network security policies. I have personally seen cases where only one of these approaches is supported, while the other is restricted by the security policies.
  • Agents also support deployment on different platforms (Windows, Unix, etc.), as well as execution of external third-party scripts either by way of User parameters or system.run item key.
  • Active agents are also capable of reading log files and event logs on Windows environments. This can be extremely useful, since many applications, even in-house ones, can provide a lot of monitoring data by logging it.

Agent-supported deployment on various platforms


Since we need to stay flexible, there are many other monitoring approaches supported by Zabbix that we can utilize:

  • SNMP, HTTP, IPMI and SSH agentless monitoring.
  • Simple checks (ICMP pings, port statuses).
  • Database and Java application monitoring.
  • External scripts (executed by the Zabbix server, Zabbix proxy or Zabbix agent).
  • Aggregations and calculations of existing data.
  • VMware monitoring and integration.
  • Web monitoring by creating web scenarios.
  • Synthetic monitoring for simulating real life user transactions.

Latest improvements

Why are we putting emphasis on multi tenancy just now? The reason is a couple of great features added in the last few releases. These features can finally allow us to utilize Zabbix in a truly multitenant environment:

Added in Zabbix 5.2:

  • Ability to create customizable user roles based on user types;
  • Secrets can now be stored in an, highly secure external vault;
  • Improvements in configuring frontend were also added. For example, each user can now select their time zone for frontend data display. This will be relevant for users in different geographical locations.

Added in Zabbix 5.4:

  • Users now have the ability to send scheduled reports. This is extremely useful for customers who may wish to receive scheduled reports about their environments. Now, instead of utilizing third-party scripts to export data and generate reports, you can use the native Zabbix functionality.
  • Major performance improvements have also been added, especially for really large instances with tens of thousands of new incoming values per second.

Zabbix and multi-tenant environment

How do we use Zabbix in a multi-tenant environment? Essentially, we provide Zabbix as a service. We use the Zabbix monitoring tool to monitor our clients (ABC and BCD in the image). We monitor their network traffic, their operating system statistics, application statistics, log files, etc. For each tenant, these monitoring requirements are going to be different.

Multi-tenant environment

Zabbix proxy

Multi-tenancy would not be possible without Zabbix proxies. With Zabbix proxies we can deploy them in customer offices, data centers, organization branches and collect data locally. Since proxies also perform preprocessing, we can even utilize them to transform and normalize metrics or even discard some of the collected metrics before forwarding them to the central Zabbix backend server.

  • Proxies are capable of performing preprocessing ever since Zabbix version 5.0. This allows us to normalize and transform data, for example – change our textual data to numeric data, use throttling and other pre-processing approaches. Even custom JavaScript is supported nowadays to format or normalize the data before we send it to our central Zabbix backend server. So, instead of the server being responsible for all of the preprocessing and having quite a large preprocessing overhead, now the proxy can do it and then forward the data to the server.
  • In addition, on the proxy, the data gets compressed before forwarding to the server thus saving some network traffic overhead.
  • The proxy still continues collecting data and storing it in its own database even in case of a network outage on the customer’s site.
  • Once we collect the data by the proxy, it gets sent to the server via a single connection, which is a lot more feasible from the network security perspective. In this case we need to create only a single firewall rule as opposed to a wide array of rules if we were to monitor the customer’s site directly from the central Zabbix backend server.
  • We can execute remote scripts on the proxy.
  • We can also deploy multiple proxies to improve scalability. If a single proxy cannot handle the amount of data that we are gathering or preprocessing, we can always deploy an extra proxy. They are easy to deploy, and can even use out-of-the-box SQLite databases.

Passive and active proxies

With proxies can also select the direction of the connection. We can deploy passive proxies, which get polled by the Zabbix backend server. In that case, the Zabbix server pulls the data from the proxy. In this scenario the Zabbix server is the one responsible for establishing the connection to the proxy. This adds a minor performance overhead to the Zabbix backend server. On the other hand, we can also deploy active proxies, where we remove that overhead from the server and proxy sends the data autonomously to the server.

At the end of the day, similar to how it goes with agent requirements, the proxy mode will depend on the security policies of the customer. Don’t forget that we aren’t restricted to a single type of proxy –  we can have both of these proxy types running at the same time.

Selecting the connection direction

Data preprocessing — throttling

Preprocessing can help us not only normalize our data, but we can also utilize it to save up on storage and performance overhead, which is vital in large environments.

When monitoring a service or an application state, we are going to be obtaining discrete values such as 1, 2, or 3, or any number. These numbers have a tendency to repeat – if our server stays up, we are going to continue receiving a number which represents “Up”. By using the preprocessing method called throttling, we can decrease the amount of these numbers stored by discarding repeating values. Only status changes are stored, therefore we can potentially save some database space and remove unneeded data processing overhead.

Discarding unchanged values


At this point in time, this feature sees more and more usage in many Zabbix environments, though it was severely underutilized initially when Zabbix 5.0 came out. So, if you aren’t using throttling yet and you’re running on 5.0 or newer, I definitely suggest trying to implement it to some extent. It is available in Preprocessing section of the item configuration.

Permissions

Robust permission design is essential to a multi-tenant environment. Even though permission logic has seen an addition of roles, the user group to host group relations haven’t been abandoned and still play vital role in overall permission schema.

With roles we still have to utilize the three user types – Users, Admin, and Super admins.

User role overview

Here you can see the user role and the UI elements the user has access to together with API restrictions and the actions the user can perform.

Roles grant the ability to configure access to specific UI elements, actions and restrict API calls in a granular fashion. So, when you’re configuring a role, you will see a screen similar to the one below:

Configuring user roles

User roles

Here you can select User type. The user type restrictions still apply. Users can get access only to Monitoring and Inventory, Admins can get access to except the Administration section, and Super admins can get access to every section, including Administration.

With roles we can further restrict these user types. You can have Super admins with some limitations, so that they could only do specific actions and access specific UI sections.

This option has two core benefits. The first one is security as we can limit what our customers can do and what they can access. The other benefit is in the UX, as we can simplify the UI for our users, especially people not experienced with Zabbix. We can restrict the visibility of the sections that the end users don’t have access to, so they will not be concerned with navigating through multiple sections and subsections that they are not familiar with.

User groups

We still have user groups and user groups to host groups relations, which we have to take into consideration. Access to hosts is defined on User groups. So, we have to define our user groups and assign Full/Read only/Deny permissions on particular host groups. This is how we limit what specific customers can access.

User groups

In addition, we can have host groups defined in a hierarchical manner. For instance, if you have two customers each of then having a “Network Devices” subgroup, we can select to include the root group and all of its subgroups when assigning user group to host group permissions. This is a really elegant and quick way to give a User or an Admin on the customer’s side access to all of their hosts or limit a specific organizational unit to only access what they need, e.g.: only permit access to network devices for network administrators.

Using group hierarchy

High availability

The next important decision is the HA implementation. Going without some sort of HA solution is simply too risky and therefore is not an option with such environments.

  • HA can be used to minimize downtime and add redundancy.
  • Zabbix supporst Linux HA tools – PCS, Corosync, Pacemaker, which are used to enable HA. You are also welcome to try and use other third-party tools for HA.
  • Out-of-the-box HA is planned for Zabbix 6.0.

HA setup

To achieve a quorum in our HA environment, we will require an odd number of nodes. For Zabbix backend HA it is very much recommended to have at least three nodes. Does that mean that you have to deploy 3 Zabbix servers? Not really – our third node is going to be a really small arbitration node, which is simply going to be checking connections to the two other Zabbix nodes and giving a vote to achieve quorum in case of issues with one of the nodes.

In the end we will have three nodes:  Zabbix server A, Zabbix server B, and the Arbiter node

  • An odd number of nodes is recommended to achieve quorum.
  • Only Active/Passive cluster architecture is supported.
  • We cannot have two Zabbix nodes active running at the same time and talking to the same database. It is important to use some ‘shoot the other node in the head’ mechanism — STONITH to avoid such split-brain scenarios.

Failure to abide by these requirements can result in issues with database consistency, issues with underlying queries and cleaning up or inserting data. This can cause unexpected Zabbix backend server crashes down the line.

In addition, it is very common to have a requirement for proxies to be deployed with HA. Before implementing HA for proxies, we need to decide if we really do need it. HA adds a significant configuration management overhead. We can have hundreds if not thousands of proxies, and managing HA for each of those can add a significant overhead. Of course, the more comfortable you feel with the HA tools, the easier the deployment and the management of the environment.

Another approach for  Zabbix proxy HA can also be implemented by using Zabbix API scripts. We can essentially have two proxies running without the need to have the HA suite. In this case, if proxy A is down, we can use Zabbix API to move a host from proxy A to proxy B.

Using Zabbix API script to change the proxy

Here, host.massupdate is used to change the proxy on the hosts. Combine this with a robust scripting logic and you end up with a very viable approach to move your hosts between proxies in failover scenarios.

Database replication

We have covered the HA for Zabbix server backend and let’s remember that with frontend servers, we can simply bring up additional frontends, for instance, by utilizing Docker containers. But what about the DB redundancy?

  • Database replication can be used as a form of redundancy for the Zabbix DB. No matter the DB backend – Postgres, MySQL, Oracle, we can deploy multiple DB nodes and utilize the native DB replication or use third-party tools for replication, for instance, Galera Cluster.
  • I personally prefer using native replication tools as it is a bit more simple and you don’t have to concern yourself with another configuration and management layer that could potentially fail and be a bother to troubleshoot. But this will depend on your requirements, design and skillset.

Let’s look at an example with MySQL replication. You can set it up in many different ways as multiple replication approaches are supported: master/slave, master/master, or even have multiple masters replicating to one another. It is completely up to you how to implement replication, especially if you are already experienced with such deployments.

Which approach is best? At the end of the day it will all depend on your company policies, database backend and a compromise between simplicty and extra redundancy. I definitely suggest delving deeper and studying use cases and articles for the DB backend of your choice, before you decide to go with any particular approach.

Database replication

Database performance tuning

Database tuning is vital for the long term stability of your Zabbix instance. The database defaults might be sufficient for your home office, but for large multi-tenant environments with tens of thousands new values per second they will not suffice. The database defaults depend on the database backend and the database version used, but ideally, these should be tuned and tested, preferably during the design stage, before you have deployed your Zabbix instance in production.

After installing the database backend we need to take a look at the hardware resources available. Ideally, you have already estimated the hardware resources required for your instance and ensured that DB hosts have sufficient memory, CPU resources and storage has been selected according to the I/O requirements. Now, you can move on to tuning your database backend.

As an example with Postgres I used PGTune — an online database tuning tool. This is a simple estimate that should still provide you with a somewhat adequate configuration. Though ideally, you should have a DBA on board that is aware of what kind of data loads you will be dealing with to help you with an optimal database configuration.

Database performance tuning

History table partitioning

In such large environments, you will most likely see that housekeeper cannot keep up with the amount of data stored, unable to clean it up in a timely fashion with the housekeeper processes utilization reaching reaching 100 percent for 20-30 minutes at a time. This will have a negative effect on the overall database performance for the duration of housekeeping.

At this point, it is recommended to implement partitioning for history/trend tables. We can use Postgres with TimescaleDB plugin for this. Partitioning is supported out of the box, and you can configure it in Administration > General > Housekeeping.

For MySQL and Oracle backends we would have to rely on custom partitioning scripts or procedures. In addition, community-provided partitioning scripts are publicly available.

As always – don’t forget to test 3rd party scripts in a test environment before deploying it in production!

Community partitioning solution for MySQL

You can always create your own partitioning script, but you should be aware of what you’re doing and how things should be partitioned. We should always be partitioning only history and trend tables.

History table partitioning with TimescaleDB

  • TimescaleDB plugin for PostgreSQL DB backends supports out-of-the-box partitioning. You don’t have to rely on community scripts.
  • On TimescaleDB, we need to specify the chunk_time_interval parameter, which will define the partition chunk size.
  • In addition, we can also add compression of history/trends, which helps to reduce the history table size by 60-80 percent. Again, in such scenarios, your database is going to be huge — terabytes in size with hundreds of customers, each having thousands of metrics per second. So, compression is a really valuable asset.
  • The only thing we have to take into account is that compressed data is read-only and cannot be changed post-compression. So, no more changes or inserts are possible for the compressed chunks.

History and trends compression

To-do list

  • Deploy the latest available Zabbix version. Ideally stick with an LTS version.
  • Deploy proxy servers, define and configure HA/Replication on Zabbix proxies, as well as on Zabbix servers and databases.
  • Implement partitioning to improve database performance.
  • Implement throttling to reduce the volume of the incoming data.
  • Tune your database! Either use online guides or consult with your DBA.

With our to-do list completed, we can have our Zabbix environment with deployed with redundancy in mind, providing monitoring as a service for hundreds of customers, multiple proxies running for each of the customers, HA in place, and Zabbix performing up to our expectations.

Questions & Answers

Question. Will Zabbix have its native HA solution? Will it be the whole package or does it involve installing individual components and maintaining them?

Answer. It’s planned on the roadmap to have a native HA solution in Zabbix 6.0. You should be able to get your hands on it when the 6.0 beta version gets released. Hopefully, you’ll be able to get your hands on it, test it out yourselves and give us feedback. From the looks of it it should be very much plug-and-play and will remove a lot of management overhead when comparing it with current HA implementation. Right now this is being developed only for the Zabbix backend server. As for the frontend – nothing is stopping you from having multiple frontends pointed at the same DB/Zabbix backend server. 

Question. Can I run Zabbix on a single server and sell monitoring service to several customers with fully isolated environments, not just GUI, but also items, triggers, etc.

Answer. Yes, you can. You can have a single Zabbix instance and multiple customers being monitored by this instance. The only extra step that might be required is deploying proxies on the customer’s side. By using permission restrictions, proxy servers, roles, etc., we can then monitor multiple customers from a single Zabbix instance.

Question. When we change proxy, the agent configuration has to be updated. What about HA configuration on the proxy?

Answer. That really depends on the approach. If the agent is getting pointed at the virtual IP address and HA is managed by PCS, Corosync, or Pacemaker, then it should be fine as is and the VIP should just be on the currently active host. So, you’ll be essentially rerouted. With the HA by way of API approach, you can simply allow your agent to accept connections from both proxies. With ServerActive we can also specify multiple endpoints, so agents can actually be prepared for such an environment.

Question. How to merge two different instances into a single monitoring instance?

Answer. This is a complex task. First off, both instances need to have the same major Zabbix backend version. You might simply migrate the history from one instance to another, but then you will have some problems with underlying element IDs. So, in one instance you have your own set of items, triggers, users, etc. with your own set of IDs. These will most likely conflict with the set of IDs on the other instance.

You can do partial migration or use the export function to export your templates, hosts, value maps, network maps. I would try to export as much as I can as migration on SQL level will be a real pain. It is possible if you’re stubborn enough, but it can end up being a really complex task that can take days if not weeks to fully implement and test.

Question. Do subgroups relate to templates as well?

Answer. Subgroups relate to templates in a way where we can also define permissions to reading and modifying templates. For templates, you can also create per-customer templates and assign them to host groups. Users that have access to these host groups can then read or modify the templates.

AWS Named as a Leader for the 11th Consecutive Year in 2021 Gartner Magic Quadrant for Cloud Infrastructure & Platform Services (CIPS)

Post Syndicated from Danilo Poccia original https://aws.amazon.com/blogs/aws/aws-named-as-a-leader-for-the-11th-consecutive-year-in-2021-gartner-magic-quadrant-for-cloud-infrastructure-platform-services-cips/

In my job at AWS I have the privilege of working with many different teams, all focused to help our customers lower costs, become more agile, and innovate faster. It’s greatly rewarding to see these efforts recognized by our customers and by leading analysts.

Last year Gartner introduced a new Magic Quadrant for Cloud Infrastructure and Platform Services (CIPS), expanding the scope of their Magic Quadrant for Cloud Infrastructure as a Service (IaaS) to include additional platform as a service (PaaS) capabilities, and extend coverage for areas such as managed database services, serverless computing, and developer tools.

Today, I am happy to share that AWS has been named as a Leader for the eleventh consecutive year and has secured the highest and furthest position on the ability to execute and completeness of vision axes in the 2021 Magic Quadrant for Cloud Infrastructure and Platform Services.

An image showing AWS Named as a Leader in the 2021 Gartner Magic Quadrant for Cloud Infrastructure & Platform Services

Whether you’re a business leader, developer, or technology enthusiast, we hope this report can serve as a guide to choosing a cloud provider that meets your needs and helps you accomplish more.

Access the full report to see the features and factors that customers examine when choosing a cloud provider.

— Danilo

Gartner, Magic Quadrant for Cloud Infrastructure & Platform Services, Raj Bala, Bob Gill, Dennis Smith, Kevin Ji, David Wright, 27 July 2021. Gartner and Magic Quadrant are registered trademarks of Gartner, Inc. and/or its affiliates in the U.S. and internationally and is used herein with permission. All rights reserved. Gartner does not endorse any vendor, product or service depicted in its research publications, and does not advise technology users to select only those vendors with the highest ratings. Gartner research publications consist of the opinions of Gartner’s research organization and should not be construed as statements of fact. Gartner disclaims all warranties, expressed or implied, with respect to this research, including any warranties of merchantability or fitness for a particular purpose.

Heads-Up: AWS Support for Internet Explorer 11 is Ending

Post Syndicated from Jeff Barr original https://aws.amazon.com/blogs/aws/heads-up-aws-support-for-internet-explorer-11-is-ending/

If you are using Internet Explorer 11 (IE 11) to access the AWS Management Console, web-based services such as Amazon Chime or Amazon Honeycode, or other parts of the AWS web site (AWS Documentation, AWS Marketing, AWS Marketplace, or AWS Support), it is time to upgrade to a more modern & secure browser such as Edge, Firefox, or Chrome.

Here are the dates that you need to know:

July 31, 2021 – Effective today, we will no longer ensure that new AWS Management Console features and web pages function properly on IE 11. We will fix bugs that are specific to IE 11 for existing features and pages.

Late 2021 – Later this year you will receive a pop-up notification (and a reminder to upgrade your browser) if you use IE 11 to access any of the services or pages listed above.

July 31, 2022 – One year from today we will discontinue our support for IE 11 and you will need to use a browser that we support.

— Jeff;


AWS IoT SiteWise Edge Is Now Generally Available for Processing Industrial Equipment Data on Premises

Post Syndicated from Channy Yun original https://aws.amazon.com/blogs/aws/aws-iot-sitewise-edge-is-now-generally-available-for-processing-industrial-equipment-data-on-premises/

At AWS re:Invent 2020, we announced the preview of AWS IoT SiteWise Edge, a new feature of AWS IoT SiteWise that provides software that runs on premises at industrial sites and makes it easy to collect, process, and monitor equipment data locally before sending the data to AWS Cloud destinations. AWS IoT SiteWise Edge software can be installed on local hardware such as third-party industrial gateways and computers, or on AWS Outposts and AWS Snow Family compute devices. It uses AWS IoT Greengrass, an edge runtime that helps build, deploy, and manage applications.

With AWS IoT SiteWise Edge, you can organize and process your equipment data in the on-premises SiteWise gateway using AWS IoT SiteWise asset models. You can then read the equipment data locally from the gateway using the same application programming interfaces (APIs) that you use with AWS IoT SiteWise in the cloud. For example, you can compute metrics such as Overall Equipment Effectiveness (OEE) locally for use in a production-line monitoring dashboard on the factory floor.

You can use AWS IoT SiteWise Edge for these use cases to quickly assess and demonstrate the value of industrial IoT to your organization:

  • Localized testing of products: The testing of automotive, electronics, or aerospace products might generate thousands of data points per second from multiple sensors embedded in the product and the testing equipment. You can process data locally in the gateway for near-real-time dashboards and store just the results in the cloud to optimize your bandwidth and storage costs.
  • Lean manufacturing in the smart factory: You can compute key performance metrics such as OEE, Mean Time Between Failures (MTBF), and Mean Time to Resolution (MTTR) in the gateway and monitor local dashboards that must continue to work even if the connection of the factory to the cloud is temporarily interrupted. This ensures that factory staff can identify and identify the root cause of every bottleneck as soon as it arises.
  • Improving product quality: Your local applications can read equipment and sensor data from AWS IoT SiteWise Edge on the gateway as it is collected, and combine it with data from other sources like enterprise resource planning (ERP) systems and manufacturing execution systems to help catch defect-causing conditions. The data can be further processed through machine learning models to identify anomalies that are used to trigger alerts for staff on the factory floor.

To securely connect and read sensor data from historian databases or directly from equipment, AWS IoT SiteWise Edge supports three common industrial protocols: OPC-UA (Open Platform Communications Unified Architecture), Modbus TCP, and EtherNet/IP.

After data is collected by the gateway, you can filter, transform, and aggregate the data locally using asset models defined in the cloud. You can also run AWS Lambda functions locally on the gateway to customize how the data is processed. You can keep sensitive data on premises to help comply with data residency requirements, and you can send data to AWS IoT SiteWise or other AWS services in the cloud, such as Amazon S3 and Amazon Timestream, for long term storage and further analysis.

At GA, we added new features and made improvements based on customer feedback during the preview:

  • Easy setup with Edge Gateway Installer: You can obtain an edge device installer from the AWS IoT SiteWise console and run it on your industrial gateway to install AWS IoT SiteWise Edge software and all prerequisites, including the AWS IoT Greengrass v2 runtime, Docker, Python, and Java.
  • Support for AWS IoT Greengrass v2: The OPC-UA data collection and data processing pack will be supported on AWS IoT Greengrass version 2.
  • Integration with LDAP/Active Directory: Edge gateway now integrates with LDAP servers or a local user pool to authenticate users at the edge. These users will use their corporate or Linux credentials to authenticate themselves on OpsHub or monitor portals at the edge.

AWS IoT SiteWise Edge – Getting Started
To get started with AWS IoT SiteWise Edge, complete the following steps to create a gateway that connects to data servers to deliver your industrial data streams to the AWS Cloud:

  1. Create a gateway and an get edge installer.
  2. Install edge software onto your industrial gateway.
  3. Configure your edge gateway from the cloud.
  4. Configure your monitoring applications at the edge and in the cloud.

To create your gateway, from the left navigation pane of the AWS IoT SiteWise console, expand Edge, and choose Gateways. On the Gateways page, choose Create gateway. You can select Greengrass v2 to configure your gateway. If you are existing customer, you can select to make a gateway for Greengrass v1.

To configure your first gateway, enter your gateway name and core device name, and then choose Default setup to create a Greengrass core device for this gateway with default settings. Choose Next.

By default, AWS IoT SiteWise enables the data collection pack to collect and send your equipment data to the AWS Cloud. To compute metrics and transforms using asset models at the edge, choose Data processing pack. You can also give users access to manage this gateway through the command line or the local monitor dashboards of an OpsHub application from the LDAP/Active Directory in your organization. Choose Next.

Optionally, you can add existing OPC-UA data servers to ingest data to the gateway. You can add data sources later. For more information, see Configuring data sources in the AWS IoT SiteWise User Guide. Choose Next.

Review your gateway configuration and choose the operating system of your edge gateway. We currently support the Linux OS distributions of Amazon Linux, Red Hat, or Ubuntu. Choose Generate.

AWS IoT SiteWise will generate an installer with these configuration values for your gateway. We provide an install script that you can download, <Gateway-name>.deploy.sh, where <Gateway-name> is the name of the gateway you just created.

To set up AWS IoT SiteWise Edge on your device, run the install script and verify the AWS IoT Greengrass runtime for your gateway.

Once the gateway is created, you configure its data sources from the gateway detail page. You can configure OPC-UA, Modbus, and EtherNet/IP data sources. To learn more, please see Configuring data sources in AWS IoT SiteWise User Guide.

Now you can see the created gateway, its configuration, edge capabilities, and data sources. Once you have configured your data sources, deploy the AWS IoT Greengrass connectors with “SiteWise” in the title to your device. To learn more, see Configuring a gateway in AWS IoT SiteWise User Guide.

Processing Model Data and Monitoring the Gateway
You can use asset models defined in AWS IoT SiteWise to specify which data, transforms, and metrics to process in the gateway locally, and visualize equipment data using local AWS IoT SiteWise Monitor dashboards served from the gateway.

To add your models to the gateway, in the left navigation pane of the AWS IoT SiteWise console, expand Build, and then choose Models. On the Models page, choose Configure for edge.

There are three options for an edge configuration for an asset model: no edge configuration (that is, all properties are computed in the cloud), compute all properties at the edge, and custom edge configuration.

AWS IoT SiteWise gateway fetches all instances of the asset model from the service and processes all data it is able to collect for measurement. All you need to do is configure the asset models themselves and keep the load guidance in mind.

With AWS IoT SiteWise Edge, you can also deploy AWS IoT SiteWise Monitor web applications locally so users like process engineers can visualize equipment data in near-real time on the factory floor and use this information to improve the uptime of equipment, reduce waste, and increase production output.

At the GA release of AWS IoT SiteWise Edge, we improved the SiteWise Monitor configuration by allowing users to configure which dashboards they want to run at the edge, and to reduce clutter and bandwidth requirements, to make only those dashboards available locally. To learn more, see Getting started with AWS IoT SiteWise Monitor in the AWS IoT SiteWise Monitor Application Guide.

The OpsHub for AWS IoT SiteWise application can be installed on any Windows PC for monitoring and troubleshooting gateways entirely locally. The application connects directly to your gateway over the local network to monitor health metrics (for example, memory, CPU, cloud connectivity), status of edge software (for example, uptime of dashboard applications), and recent data collected from equipment.

We also improved the visualization of gateway health metrics and the ability to download gateway activity logs. To learn more, see Monitor data at the edge in the AWS IoT SiteWise User Guide.

Available Now
AWS IoT SiteWise Edge is available in all AWS Regions where AWS IoT SiteWise is available. AWS IoT SiteWise Edge provides the data collection and processing pack in the gateway for local applications. The data collection pack is free. The data processing pack is charged at $200 per active gateway, per month. See the AWS IoT SiteWise pricing page for details.

To learn more, visit the AWS IoT SiteWise Edge page or see Ingesting data using a gateway in the AWS IoT SiteWise User Guide.

You can send feedback through the AWS IoT SiteWise forum or through your usual AWS Support contacts.

– Channy

EC2-Classic is Retiring – Here’s How to Prepare

Post Syndicated from Jeff Barr original https://aws.amazon.com/blogs/aws/ec2-classic-is-retiring-heres-how-to-prepare/

Let’s go back to the summer of 2006 and the launch of EC2. We started out with one instance type (the venerable m1.small), security groups, and the venerable US East (N. Virginia) Region. The EC2-Classic network model was flat, with public IP addresses that were assigned at launch time.

Our initial customers saw the value right away and started to put EC2 to use in many different ways. We hosted web sites, supported the launch of Justin.TV, and helped Animoto to scale to a then-amazing 3400 instances when their Facebook app went viral.

Some of the early enhancements to EC2 focused on networking. For example, we added Elastic IP addresses in early 2008 so that addresses could be long-lived and associated with different instances over time if necessary. After that we added Auto Scaling, Load Balancing, and CloudWatch to help you to build highly scalable applications.

Early customers wanted to connect their EC2 instances to their corporate networks, exercise additional control over IP address ranges, and to construct more sophisticated network topologies. We launched Amazon Virtual Private Cloud in 2009, and in 2013 we made the VPC model essentially transparent with Virtual Private Clouds for Everyone.

Retiring EC2-Classic
EC2-Classic has served us well, but we’re going to give it a gold watch and a well-deserved sendoff! This post will tell you what you need to know, what you need to do, and when you need to do it.

Before I dive in, rest assured that we are going to make this as smooth and as non-disruptive as possible. We are not planning to disrupt any workloads and we are giving you plenty of lead time so that you can plan, test, and perform your migration. In addition to this blog post, we have tools, documentation, and people that are all designed to help.

Timing
We are already notifying the remaining EC2-Classic customers via their account teams, and will soon start to issue notices in the Personal Health Dashboard. Here are the important dates for your calendar:

  • All AWS accounts created after December 4, 2013 are already VPC-only, unless EC2-Classic was enabled as a result of a support request.
  • On October 30, 2021 we will disable EC2-Classic in Regions for AWS accounts that have no active EC2-Classic resources in the Region, as listed below. We will also stop selling 1-year and 3-year Reserved Instances for EC2-Classic.
  • On August 15, 2022 we expect all migrations to be complete, with no remaining EC2-Classic resources present in any AWS account.

Again, we don’t plan to disrupt any workloads and will do our best to help you to meet these dates.

Affected Resources
In order to fully migrate from EC2-Classic to VPC, you need to find, examine, and migrate all of the following resources:

In preparation for your migration, be sure to read Migrate from EC2-Classic to a VPC.

You may need to create (or re-create, if you deleted it) the default VPC for your account. To learn how to do this, read Creating a Default VPC.

In some cases you will be able to modify the existing resources; in others you will need to create new and equivalent resources in a VPC.

Finding EC2-Classic Resources
Use the EC2 Classic Resource Finder script to find all of the EC2-Classic resources in your account. You can run this directly in a single AWS account, or you can use the included multi-account-wrapper to run it against each account of an AWS Organization. The Resource Finder visits each AWS Region, looks for specific resources, and generates a set of CSV files. Here’s the first part of the output from my run:

The script takes a few minutes to run. I inspect the list of CSV files to get a sense of how much work I need to do:

And then I take a look inside to learn more:

Turns out that I have some stopped OpsWorks Stacks that I can either migrate or delete:

Migration Tools
Here’s an overview of the migration tools that you can use to migrate your AWS resources:

AWS Application Migration Service – Use AWS MGN to migrate your instances and your databases from EC2-Classic to VPC with minimal downtime. This service uses block-level replication and runs on multiple versions of Linux and Windows (read How to Use the New AWS Application Migration Service for Lift-and-Shift Migrations to learn more). The first 90 days of replication are free for each server that you migrate; see the AWS Application Service Pricing page for more information.

Support Automation Workflow – This workflow supports simple, instance-level migration. It converts the source instance to an AMI, creates mirrors of the security groups, and launches new instances in the destination VPC.

After you have migrated all of the resources within a particular region, you can disable EC2-Classic by creating a support case. You can do this if you want to avoid accidentally creating new EC2-Classic resources in the region, but it is definitely not required.

Disabling EC2-Classic in a region is intended to be a one-way door, but you can contact AWS Support if you run it and then find that you need to re-enable EC2-Classic for a region. Be sure to run the Resource Finder that mentioned earlier and make sure that you have not left any resources behind. These resources will continue to run and to accrue charges even after the account status has been changed.

IP Address Migration – If you are migrating an EC2 instance and any Elastic IP addresses associated with the instance, you can use move-address-to-vpc then attach the Elastic IP to the migrated instance. This will allow you to continue to reference the instance by the original DNS name.

Classic Load Balancers – If you plan to migrate a Classic Load Balancer and need to preserve the original DNS names, please contact AWS Support or your AWS account team.

Updating Instance Types
All of the instance types that are available in EC2-Classic are also available in VPC. However, many newer instance types are available only in VPC, and you may want to consider an update as part of your overall migration plan. Here’s a map to get you started:

EC2-Classic VPC
M1, T1 T2
M3 M5
C1, C3 C5
CC2 AWS ParallelCluster
CR1, M2, R3 R4
D2 D3
HS1 D2
I2 I3
G2 G3

Count on Us
My colleagues in AWS Support are ready to help you with your migration to VPC. I am also planning to update this post with additional information and other migration resources as soon as they become available.

— Jeff;


Microsoft SAM File Readability CVE-2021-36934: What You Need to Know

Post Syndicated from Caitlin Condon original https://blog.rapid7.com/2021/07/21/microsoft-sam-file-readability-cve-2021-36934-what-you-need-to-know/

Microsoft SAM File Readability CVE-2021-36934: What You Need to Know

On Monday, July 19, 2021, community security researchers began reporting that the Security Account Manager (SAM) file on Windows 10 and 11 systems was READ-enabled for all local users. The SAM file is used to store sensitive security information, such as hashed user and admin passwords. READ enablement means attackers with a foothold on the system can use this security-related information to escalate privileges or access other data in the target environment.

On Tuesday, July 20, Microsoft issued an out-of-band advisory for this vulnerability, which is now tracked as CVE-2021-36934. As of July 21, 2021, the vulnerability has been confirmed to affect Windows 10 version 1809 and later. A public proof-of-concept is available that allows non-admin users to retrieve all registry hives. Researcher Kevin Beaumont has also released a demo that confirms CVE-2021-36934 can be used to achieve remote code execution as SYSTEM on vulnerable targets (in addition to privilege escalation). The security community has christened this vulnerability “HiveNightmare” and “SeriousSAM.”

CERT/CC published in-depth vulnerability notes on CVE-2021-36934, which we highly recommend reading. Their analysis reveals that starting with Windows 10 build 1809, the BUILTIN\Users group is given RX permissions to files in the %windir%\system32\config directory. If a VSS shadow copy of the system drive is available, a non-privileged user may leverage access to these files to:

  • Extract and leverage account password hashes.
  • Discover the original Windows installation password.
  • Obtain DPAPI computer keys, which can be used to decrypt all computer private keys.
  • Obtain a computer machine account, which can be used in a silver ticket attack.

There is no patch for CVE-2021-36934 as of July 21, 2021. Microsoft has released workarounds for Windows 10 and 11 customers that mitigate the risk of immediate exploitation—we have reproduced these workarounds in the Mitigation Guidance section below. Please note that Windows customers must BOTH restrict access and delete shadow copies to prevent exploitation of CVE-2021-36934. We recommend applying the workarounds on an emergency basis.

Mitigation Guidance

1. Restrict access to the contents of %windir%\system32\config:

  • Open Command Prompt or Windows PowerShell as an administrator.
  • Run this command:
icacls %windir%\system32\config\*.* /inheritance:e

2. Delete Volume Shadow Copy Service (VSS) shadow copies:

  • Delete any System Restore points and Shadow volumes that existed prior to restricting access to %windir%\system32\config.
  • Create a new System Restore point if desired.

Windows 10 and 11 users must apply both workarounds to mitigate the risk of exploitation. Microsoft has noted that deleting shadow copies may impact restore operations, including the ability to restore data with third-party backup applications.

This story is developing quickly. We will update this blog with new information as it becomes available.

Resources

Amazon EBS io2 Block Express Volumes with Amazon EC2 R5b Instances Are Now Generally Available

Post Syndicated from Channy Yun original https://aws.amazon.com/blogs/aws/amazon-ebs-io2-block-express-volumes-with-amazon-ec2-r5b-instances-are-now-generally-available/

At AWS re:Invent 2020, we previewed Amazon EBS io2 Block Express volumes, the next-generation server storage architecture that delivers the first SAN built for the cloud. Block Express is designed to meet the requirements of the largest, most I/O-intensive, mission-critical deployments of Microsoft SQL Server, Oracle, SAP HANA, and SAS Analytics on AWS.

Today, I am happy to announce the general availability of Amazon EBS io2 Block Express volumes, with Amazon EC2 R5b instances powered by the AWS Nitro System to provide the best network-attached storage performance available on EC2. The io2 Block Express volumes now also support io2 features such as Multi-Attach and Elastic Volumes.

In the past, customers had to stripe multiple volumes together in order go beyond single-volume performance. Today, io2 volumes can meet the needs of mission-critical performance-intensive applications without striping and the management overhead that comes along with it. With io2 Block Express, customers can get the highest performance block storage in the cloud with four times higher throughput, IOPS, and capacity than io2 volumes with sub-millisecond latency, at no additional cost.

Here is a summary of the use cases and characteristics of the key Solid State Drive (SSD)-backed EBS volumes:

General Purpose SSD Provisioned IOPS SSD
Volume type gp2 gp3 io2 io2 Block Express
Durability 99.8%-99.9% durability 99.999% durability
Use cases General applications, good to start with when you do not fully understand the performance profile yet I/O-intensive applications and databases Business-critical applications and databases that demand highest performance
Volume size 1 GiB – 16 TiB 4 GiB – 16 TiB 4 GiB – 64 TiB
Max IOPS 16,000 64,000 ** 256,000
Max throughput 250 MiB/s * 1,000 MiB/s 1,000 MiB/s ** 4,000 MiB/s

* The throughput limit is between 128 MiB/s and 250 MiB/s, depending on the volume size.
** Maximum IOPS and throughput are guaranteed only on instances built on the Nitro System provisioned with more than 32,000 IOPS.

The new Block Express architecture delivers the highest levels of performance with sub-millisecond latency by communicating with an AWS Nitro System-based instance using the Scalable Reliable Datagrams (SRD) protocol, which is implemented in the Nitro Card dedicated for EBS I/O function on the host hardware of the instance. Block Express also offers modular software and hardware building blocks that can be assembled in many ways, giving you the flexibility to design and deliver improved performance and new features at a faster rate.

Getting Started with io2 Block Express Volumes
You can now create io2 Block Express volumes in the Amazon EC2 console, AWS Command Line Interface (AWS CLI), or using an SDK with the Amazon EC2 API when you create R5b instances.

After you choose the EC2 R5b instance type, on the Add Storage page, under Volume Type, choose Provisioned IOPS SSD (io2). Your new volumes will be created in the Block Express format.

Things to Know
Here are a couple of things to keep in mind:

  • You can’t modify the size or provisioned IOPS of an io2 Block Express volume.
  • You can’t launch an R5b instance with an encrypted io2 Block Express volume that has a size greater than 16 TiB or IOPS greater than 64,000 from an unencrypted AMI or a shared encrypted AMI. In this case, you must first create an encrypted AMI in your account and then use that AMI to launch the instance.
  • io2 Block Express volumes do not currently support fast snapshot restore. We recommend that you initialize these volumes to ensure that they deliver full performance. For more information, see Initialize Amazon EBS volumes in Amazon EC2 User Guide.

Available Now
The io2 Block Express volumes are available in all AWS Regions where R5b instances are available: US East (Ohio), US East (N. Virginia), US West (Oregon), Asia Pacific (Singapore), Asia Pacific (Tokyo), Europe (Frankfurt), with support for more AWS Regions coming soon. We plan to allow EC2 instances of all types to connect to io2 Block Volumes, and will have updates on this later in the year.

In terms of pricing and billing, io2 volumes and io2 Block Express volumes are billed at the same rate. Usage reports do not distinguish between io2 Block Express volumes and io2 volumes. We recommend that you use tags to help you identify costs associated with io2 Block Express volumes. For more information, see the Amazon EBS pricing page.

To learn more, visit the EBS Provisioned IOPS Volume page and io2 Block Express Volumes in the Amazon EC2 User Guide.

– Channy

Multi-Cloud and Hybrid Threat Protection with Sumo Logic Cloud SIEM Powered by AWS

Post Syndicated from Danilo Poccia original https://aws.amazon.com/blogs/aws/hybrid-threat-protection-with-sumo-logic-cloud-siem-powered-by-aws/

IT security teams need to have a real-time understanding of what’s happening with their infrastructure and applications. They need to be able to find and correlate data in this continuous flood of information to identify unexpected behaviors or patterns that can lead to a security breach.

To simplify and automate this process, many solutions have been implemented over the years. For example:

  • Security information management (SIM) systems collect data such as log files into a central repository for analysis.
  • Security event management (SEM) platforms simplify data inspection and the interpretation of logs or events.

Many years ago these two approaches were merged to address both information analysis and interpretation of events. These security information and event management (SIEM) platforms provide real-time analysis of security alerts generated by applications, network hardware, and domain specific security tools such as firewalls and endpoint protection tools).

Today, I’d like to introduce a solution created by one of our partners: Sumo Logic Cloud SIEM powered by AWS. Sumo Logic Cloud SIEM provides deep security analytics and contextualized threat data across multi-cloud and hybrid environments to reduce the time to detect and respond to threats. You can use this solution to quickly detect and respond to the higher-priority issues, including malicious activities that negatively impact your business or brand. The solution comes with more than 300 out-of-the-box integrations, including key AWS services, and can help reduce time and effort required to conduct compliance audits for regulations such as PCI and HIPAA.

Sumo Logic Cloud SIEM is available in AWS Marketplace and you can use a free trial to evaluate the solution. Before having a look at how this works in practice, let’s see how it’s being used.

Customer Case Study – Medidata
I had the chance to meet a very interesting customer to talk about how they use Sumo Logic Cloud SIEM. Scott Sumner is the VP and CISO at Medidata, a company that is redefining what’s possible in clinical trials. Medidata is processing patient data for clinical trials of the Moderna and Johnson & Johnson COVID-19 vaccines, so you can see why security is a priority for them. With such critical workloads, the company must keep the trust of the people participating in those trials.

Scott told me, “There is an old saying: If you can’t measure it, you can’t manage it.” In fact, when he joined Medidata in 2015, one of the first things Scott did was to implement a SIEM. Medidata has been using Sumo Logic for more than five years now. They appreciate that it’s a cloud-native solution, and that has made it easier for them to follow the evolution of the tool over the years.

“Not having transparency in the environment you process data is not good for security professionals.” Scott wanted his team to be able to respond quickly and, to do so, they needed to be able to look at a single screen that displays all IP calls, network flows, and any relevant information. For example, Medidata has very aggressive checks for security scans and any kind of external access. To do so, they have to look not just at the perimeter, but at the entire environment. Sumo Logic Cloud SIEM allows them to react without breaking anything in their corporate environment, including the resources they have in more than 45 AWS accounts.

“One of the metrics that is floated around by security specialists is that you have up to five hours to respond to a tentative intrusion,” Scott says. “With Sumo Logic Cloud SIEM, we can match that time aggressively, and most of the times we respond within five minutes.” The ability to respond quickly allows Medidata to keep patient trust. This is very important for them, because delaying a clinical trial can affect people’s health.

Medidata security response is managed by a global team through three levels. Level 1 is covered by a partner who is empowered to block simple attacks. For the next level of escalation, Level 2, Medidata has a team in each region. Beyond that there is Level 3: a hardcore team of forensics examiners distributed across the US, Europe, and Asia who deal with more complicated attacks.

Availability is also important to Medidata. In addition to providing the Cloud SIEM functionality, Sumo Logic helps them monitor availability issues, such as web server failover, and very quickly figure out possible problems as they happen. Interestingly, they use Sumo Logic to better understand how applications talk with each other. These different use cases don’t complicate their setup because the security and application teams are segregated and use Sumo Logic as a single platform to share information seamlessly between the two teams when needed.

I asked Scott Sumner if Medidata was affected by the move to remote work in 2020 due to the COVID-19 pandemic. It’s an important topic for them because at that time Medidata was already involved in clinical trials to fight the pandemic. “We were a mobile environment anyway. A significant part of the company was mobile before. So, we were ready and not being impacted much by working remotely. All our tools are remote, and that helped a lot. Not sure we’d done it easily with an on-premises solution.”

Now, let’s see how this solution works in practice.

Setting Up Sumo Logic Cloud SIEM
In AWS Marketplace I search for “Sumo Logic Cloud SIEM” and look at the product page. I can either subscribe or start the one-month free trial. The free trial includes 1GB of log ingest for security and observability. There is no automatic conversion to paid offer when the free trials expires. After the free trial I have the option to either buy Sumo Logic Cloud SIEM from AWS Marketplace or remain as a free user. I create and accept the contract and set up my Sumo Logic account.

Console screenshot.

In the setup, I choose the Sumo Logic deployment region to use. The Sumo Logic documentation provides a table that describes the AWS Regions used by each Sumo Logic deployment. I need this information later when I set up the integration between AWS security services and Sumo Logic Cloud SIEM. For now, I select US2, which corresponds to the US West (Oregon) Region in AWS.

When my Sumo Logic account is ready, I use the Sumo Logic Security Integrations on AWS Quick Start to deploy the required integrations in my AWS account. You’ll find the source files used by this Quick Start in this GitHub repository. I open the deployment guide and follow along.

This architecture diagram shows the environment deployed by this Quick Start:

Architectural diagram.

Following the steps in the deployment guide, I create an access key and access ID in my Sumo Logic account, and write down my organization ID. Then, I launch the Quick Start to deploy the integrations.

The Quick Start uses an AWS CloudFormation template to create a stack. First, I check that I am in the right AWS Region. I use US West (Oregon) because I am using US2 with Sumo Logic. Then, I leave all default values and choose Next. In the parameters, I select US2 as my Sumo Logic deployment region and enter my Sumo Logic access ID, access key, and organization ID.

Console screenshot.

After that, I enable and configure the integrations with AWS security services and tools such as AWS CloudTrail, Amazon GuardDuty, VPC Flow Logs, and AWS Config.

Console screenshot.

If you have a delegate administrator with GuardDuty, you can enabled multiple member accounts as long as they are a part of the same AWS organization. With that, all findings from member accounts are vended to the delegate administrator and then to Sumo Logic Cloud SIEM through the GuardDuty events processor.

In the next step, I leave the stack options to their default values. I review the configuration and acknowledge the additional capabilities required by this stack (such as the creation of IAM resources) and then choose Create stack.

When the stack creation is complete, the integration with Sumo Logic Cloud SIEM is ready. If I had a hybrid architecture, I could connect those resources for a single point of view and analysis of my security events.

Using Sumo Logic Cloud SIEM
To see how the integration with AWS security services works, and how security events are handled by the SIEM, I use the amazon-guardduty-tester open-source scripts to generate security findings.

First, I use the included CloudFormation template to launch an Amazon Elastic Compute Cloud (Amazon EC2) instance in an Amazon Virtual Private Cloud (VPC) private subnet. The stack also includes a bastion host to provide external access. When the stack has been created, I write down the IP addresses of the two instances from the stack output.

Console screenshot.

Then, I use SSH to connect to the EC2 instance in the private subnet through the bastion host. There are easy-to-follow instructions in the README file. I use the guardduty_tester.sh script, installed in the instance by CloudFormation, to generate security findings for my AWS account.

$ ./guardduty_tester.sh

SSH screenshot.

GuardDuty processes these findings and the events are sent to Sumo Logic through the integration I just set up. In the Sumo Logic GuardDuty dashboard, I see the threats ready to be analyzed and addressed.

Console screenshot.

Availability and Pricing
Sumo Logic Cloud SIEM powered by AWS is a multi-tenant Software as a Service (SaaS) available in AWS Marketplace that ingests data over HTTPS/TLS 1.2 on the public internet. You can connect data from any AWS Region and from multi-cloud and hybrid architectures for a single point of view of your security events.

Start a free trial of Sumo Logic Cloud SIEM and see how it can help your security team.

Read the Sumo Logic team’s blog post here for more information on the service. 

— Danilo

Amazon Simple Queue Service (SQS) – 15 Years and Still Queueing!

Post Syndicated from Jeff Barr original https://aws.amazon.com/blogs/aws/amazon-sqs-15-years-and-still-queueing/

Time sure does fly! I wrote about the production launch of Amazon Simple Queue Service (SQS) back in 2006, with no inkling that I would still be blogging fifteen years later, or that this service would still be growing rapidly while remaining fundamental to the architecture of so many different types of web-scale applications.

The first beta of SQS was announced with little fanfare in late 2004. Even though we have added many features since that beta, the original description (“a reliable, highly scalable hosted queue for buffering messages between distributed application components”) still applies. Our customers think of SQS as an infinite buffer in the cloud and use SQS queues to implement the connections between the functional parts of their application architecture.

Over the years, we have worked hard to keep the SQS interface simple and easy to use, even though there’s a lot of complexity inside. In order to make SQS scalable, durable, and reliable, messages are stored in a fleet that consists of thousands of servers in each AWS Region. Within a region, we save three copies of each message, taking care to distribute the messages across storage nodes and Availability Zones. In addition to this built-in redundant storage, SQS is self-healing and resilient to host failures & network interruptions. Even though SQS is now 15 years old, we continue to improve our scaling and load management applications so that you can always count on SQS to handle your mission-critical workloads.

SQS runs at an incredible scale. For example:

Amazon Product Fulfillment – During Prime Day 2021, traffic to SQS set a new record, peaking at 47.7 million messages per second.

Rapid7 – Amazon customer Rapid7 makes extensive use of SQS. According to Jeff Myers (Platform Software Architect):

Amazon SQS provides us with a simple to use, highly performant, and highly scalable messaging service without any management headaches. It is a crucial component of our architecture that has allowed us to scale to handle 10s of billions of messages per day.

You can visit the Amazon SQS home page to read about other high-scale use cases from NASA, BMW Group, Capital One, and other AWS customers.

Serverless Office Hours
Be sure to join us today (June 13th) for Serverless Office Hours at Noon PT on Twitch.tv. Rumor has it that there will be cake!

Back in Time
Here’s a quick recap of some of the major SQS milestones:

2006 – Production launch. An unlimited number of queues per account and items per queue, with each item up to 8 KB in length. Pay as you go pricing based on messages sent and data transferred.

2007 – Additional functions including control of the visibility timeout and access to the approximate number of queued messages.

2009 – SQS in Europe, and additional control over queue access via AddPermission and RemovePermission. This launch also marked the debut of what we then called the Access Policy Language, which has evolved into today’s IAM Policies.

2010 – A new free tier (100K requests/month then, since expanded to 1 million requests/month), configurable maximum message length (up to 64 KB), and configurable message retention time.

2011 – Additional CloudWatch Metrics for each SQS queue. Later that year we added batch operations (SendMessageBatch and DeleteMessageBatch), delay queues, and message timers.

2012 – Support for long polling, along with SDK support for request batching and client-side buffering.

2013 – Support for even larger payloads (256 KB) and a 50% price reduction.

2014 – Support for dead letter queues, to accept messages that have become stuck due to a timeout or to a processing error within your code.

2015 – Support for extended payloads (up to 2 GB) using the Extended Client Library.

2016 – Support for FIFO queues with exactly-once processing and deduplication and another price reduction.

2017 – Support for server-side encryption of messages and cost allocation tags.

2018 – Support for Amazon VPC Endpoints using AWS PrivateLink and the ability to invoke Lambda functions.

2019 – Support for Tag-on-Create and X-Ray tracing.

2020 – Support for 1-minute metrics for more fine-grained queue monitoring, a new console experience, and result pagination for the ListQueues and ListDeadLetterSourceQueues functions.

2021 – Tiered pricing so that you save money as your usage grows, and a High Throughput mode for FIFO queues.

Today, SQS remains simple, scalable, cost-effective, and highly reliable.

From the AWS Heroes
We asked some of the AWS Heroes to reflect on the success of SQS and to share some of their success stories. Here’s what we learned:

Eric Hammond (Serverless Hero) uses AWS Lambda Dead Letter Queues. They put alarms on the queues and send internal emails as alerts when problems need to be investigated.

Tom McLaughlin (Serverless Hero) has been using SQS since 2015. He said “My favorite use case is anytime someone wants a queue and I don’t want to manage a queuing platform. Which is always.”

Ken Collins (Serverless Hero) was not entirely sure how long he had been using SQS, and offered a range of 2 to 8 years! He uses it to power the Lambdakiq gem, which implements ActiveJob on SQS & Lambda.

Kyuhyun Byun (Serverless Hero) has been using SQS to power a push system that must sustain massive amounts of traffic, and tells us “Thanks to SQS, I don’t consider building a queuing system anymore.”

Prashanth HN (Serverless Hero) has been using SQS since 2017, and considers himself “late to the party.” He used SQS as part of his first serverless application, and finds that it is ideal for connecting services with differing throughput.

Ben Kehoe (Serverless Hero) told us that “I first saw the power of SQS when a colleague showed me how to retain state in a fleet of EC2 Spot instances by storing the state in SQS when an instance was getting shut down, and having new instances check the queue for state on startup.”

Jeremy Daly (Serverless Hero) started using SQS in 2010 as a lightweight queue that fed a facial recognition process on user-supplied images. Today, he often uses it as a buffer to throttle requests to downstream services that are not yet serverless.

Casey Lee (Container Hero) also started to use SQS in 2010 as a replacement for ActiveMQ between loosely coupled Java services. Casey implements auto scaling based on queue depth, and has found it to be an accurate way to handle the load.

Vlad Ionecsu (Container Hero) began his AWS journey with SQS back in 2014. Vlad found that the API was very easy to understand, and used SQS to power his thesis project.

Sheen Brisals (Serverless Hero) started to use SQS in 2018 while building a proof-of-concept that also used Lambda and S3. Sheen appreciates the ability to adjust the characteristics of each queue to create a good match for the message processing functions, and also makes use of both high and low priority queues.

Gojko Adzic (Serverless Hero) began to use SQS in 2013 as a task dispatch for exporters in MindMup. This online mind-mapping application allows large groups of users to collaborate, and requires strict ordering of updates to each document. Gojko used FIFO queues to allow them to process messages for different documents in parallel, with sequential order within each document.

Sebastian Müller (Serverless Hero) started to use SQS in 2016 by building a notification center for website-builder jimdo.com . The center ensures that customers are kept aware of events (orders, support messages, and contact requests) on a timely basis.

Luca Bianchi (Serverless Hero) first used SQS in 2012. He decoupled a pair of microservices running on AWS Elastic Beanstalk, and also created a fan-out processing system for a gamification platform. Today, his favorite SQS use case stores inference jobs and makes them available to a worker process running on Amazon SageMaker.

Peter Hanssens (Serverless Hero) uses SQS to offload tasks that do not need to be processed immediately. Several years ago, while assisting some data scientists, he created an event-driven batch-processing system that used a Lambda function to check a queue every 5 minutes and fire up EC2 instances to build models, while keeping strict control over the maximum number of running instances.

Serkan Ozal (Serverless Hero) has been using SQS since 2013 or so. He focuses on asynchronous message processing and counts on the ability of SQS to handle a huge number of events. He also makes uses of the message visibility feature so that he can re-process messages if necessary.

Matthieu Napoli (Serverless Hero) has been using SQS for about five years, starting out with EC2, and as a replacement for other queues. As he says, “Paired with Lambda, it gives massive parallelism out of the box without having to think too much about it. Plus the built-in failure handling makes it very robust.”

As you can see, there are a multitude of use cases for SQS.

SQS Resources
If you are not already using SQS, then it is time to get in the queue and get started. Here are some resources to help you find your way:

Happy queueing!

— Jeff;


Scheduled report generation in Zabbix 5.4

Post Syndicated from Arturs Lontons original https://blog.zabbix.com/scheduled-report-generation-in-zabbix-5-4/14776/

The release of version 5.4 grants Zabbix users the ability to receive scheduled PDF reports in their mailbox, which is a very sought-after feature. This post and the video will cover all-new report-related configuration parameters and walk you through setting up scheduled report generation.

Contents

I. Reporting in Zabbix 5.4 (0:45)
II. Scheduled reports (2:26)

III. Questions & Answers (13:28)

Reporting in Zabbix 5.4

Zabbix 5.4 is our first big step in bringing out-of-the-box reporting for our end users. With this feature, we now have a foundation to build upon in the future and make reporting more robust and versatile over time. Since reports are 100% based on dashboard widgets, it’s only a matter of time until more report-focused widgets get released, thus enabling not only better dashboards, but also improving the reporting functionality.

  • We have implemented a new web service component responsible for generating reports — of course, you can install this server in a quick and easy fashion by using the provided packages.
  • Reporting works out of the box without the need to deploy or develop any custom scripts.
  • The initial configuration is easy to understand and implement.
  • Reporting will use the existing Email media types to send out these reports.
  • The reports do respect your permissions, as well as roles introduced in Zabbix 5.2.
  • You will be able to test the report before implementing it as per our schedules just by clicking the Test button.

Scheduled reports

We have added a new  Scheduled report section, where the list of reports is available, displaying the report Name, their Owner, Repeats (daily, weekly, etc.), the Period for which the report is generated, and the Last sent date.

Scheduled reports

NOTE. When you configure new reports, and they have not been sent out yet, the Last sent date will be set to ‘Never.’

Creating a report

When you create a report, you will also have to fill in a couple of fields:

  • Owner,
  • Name of the report,
  • Dashboard, the report will be based on,
  • Period — if you send the report for the Previous day, Previous week, Previous month, of Previous year,
  • Cycle — how often you send the report Daily/Weekly/Monthly/ Yearly,
  • Start time (Zabbix server time is used here),
  • Start date and end date.

Creating reports

Receiving a report

When you receive a PDF report to your mailbox, you can also use the {TIME} macro to display server time both in the subject and the body of the message.

Receiving a report

In the PDF report, you can display any information from the included dashboard – Graphs, Problems, Latest data, and much more. Thanks to all of the available widgets, we will be able to customize our reports in a very granular fashion.

Receiving a report example

The report does respect user permissions. So, in the example above, the report shows only the data to which the user (either the recipient or the report creator) has access.

Permissions

After upgrading to Zabbix 5.4, you will see two new options in the User roles section:

  • Scheduled reports UI element. Under the UI elements, you can grant or deny access to the Scheduled reports section. This is accessible only to Super admin and Admin user Types.

Permissions

If the Scheduled reports UI element is unchecked for the role, the user won’t be able to access the Scheduled report section and will see an error message. The same behavior is true if you use a URL to access the Scheduled reports.

Access to scheduled reports denied message for the users of a user role

You can also manage scheduled report permissions in the Access to actions section by checking the Manage scheduled reports box. This action permission grants or denies the ability to create or edit scheduled reports and is also accessible to Admin and Super admin user types.

Manage scheduled reports

If this check box is unchecked, the users won’t be able to create new or edit existing reports, though they will be able to access the UI section and see the list of reports and how they are configured.

Access to Manage scheduled reports restricted

Recipients of scheduled reports

When you are defining a new report, you can select the recipient. Report subscription can contain a user or a user group.

  • When selecting a user, you can specify to include or exclude the user from the subscription.
  • User group to host group permissions still apply.
  • You can specify which user is going to be generating the report – recipient or the creator of the report.:

Report recipients

For example, if we need to send some extra information to our NOC team that might not be directly available to them, you can select Current user, and the report will be generated with the permissions of the report creator. Since it is the admin that is creating the report, you can add some extra information that wouldn’t be visible to your NOC team or other regular users. They still won’t be able to access it in Zabbix, but they’ll receive it in their mailbox if you configure the report for them.

Report prerequisites

Diving a bit deeper into the technical side of things, we need to set up two additional packages to enable the reports:

  • zabbix-web-service — the additional reporting service by default listening to port 10053. The service needs to be reachable from the Zabbix server and can be deployed on the same machine as our frontend or our server. We also have the option to deploy it on a completely separate machine. The zabbix-web-service package should be available if you have added the Zabbix repository.
#yum install zabbix-web-service
  • Google Chrome is required. However, on some distributions, Chromium is reported to also work, though this is not 100% tested. Note that Google Chrome packages are not included in Zabbix. The Google Chrome packages can simply be downloaded from the Google Chrome website and then installed on the zabbix-web-service host.
#wget https://dl.google.com/linux/direct/google-chrome-stable_current_x86_64.rpm

#yum install google-chrome-stable_current_x86_64.rpm

Configuring reports — Web service

We have a whole new configuration file for the web service. Web service supports many different configuration options:

  • Logging — similar to that for server and for proxy. You can set up debug levels, select the log types, rotations, and so on.
### Option: LogType –system (syslog), file, console (standard output)
### Option: LogFile–Log file location
### Option: LogFileSize -Size in MB before rotation
### Option: DebugLevel –0 -5
  • List of allowed server addresses that can access this web service.
### Option: AllowedIP List of comma delimited IP addresses, optionally in CIDR notation, or DNS names of Zabbix servers
  • Timeout settings
### Option: Timeout -Spend no more than Timeout seconds on processing (Default –3)
  • Listen port
### Option: ListenPort -Service will listen on this port for connections from the server
(Default -ListenPort=10053)
  • Encryption settings by using certificates. This way the communication with the web service can be secured.
### Option: TLSAccept –unencrypted or cert
### Option: TLSCAFile–pathname of a file containing top level CA(s) certificates
### Option: TLSCertFile–pathname of a file containing the service certificate
### Option: TLSKeyFile–pathname of a file containing the service private key

Configuring reports — Server

In addition, the server settings now contain report-related parameters:

  • The number of report writer instances.
### Option: StartReportWriters -Number of pre-forked report writer instances.
(Default –0)

NOTE. You need to have at least one StartReportWriter

NOTE. The number of the necessary report writers will depend on the number of reports and how often you generate them.

  • Zabbix Web Service URL (to be passed on to the server)
### Option: WebServiceURL -URL to Zabbix web service, used to perform web-related tasks. (No default value)
#Example: http://192.168.1.156:10053/report

You need to make sure that we can communicate with the Zabbix Web Service URL and permit the incoming traffic through this port to the web service.

Configuring reports — Frontend

As the last step, you need to enable communication between the frontend and the web service.

In Administration > General > Other, we have a new configuration parameter where you need to specify your frontend URL that will be reachable by the web service.

Frontend URL

Once this is done, we can create a report.

Reports — testing

After you have created the report, you can test it. You can click the Test button and send out your test report to see if it works. The users to which we’re sending the report need to have an Email media assigned to them in the User settings.

NOTE. Currently, {TIME} macros are resolved only with the scheduled generation and are not available in test reports, though this might change in the future.

Testing reports

Common issues

Some parameters can certainly be misconfigured, so let’s look at the most common issues:

  • Make sure that you have a properly configured Email media assigned to the user that should be receiving the report. Otherwise, they will fail to receive it.

— Make sure that the Email media type settings are properly configured.
— Once you define the media type, if you’re creating it from scratch, make sure that you test the media type and generate a test report.

Media configuration failed

NOTE. Sending out the report failed in this example siince no media is configured for the report recipients.

  • Make sure that the correct Web service address is configured on the Zabbix server in the WebServiceURL parameter.

— Confirm that the Zabbix server can connect to the Zabbix web service and that so that we can connect to the specified port/IP address.
— Check your firewall settings if the web service is running on a dedicated machine.
— Make sure that third-party security software, such as SELinux or firewalls don’t block the communication.

Wrong WebServiceURL parameter

Otherwise, you will receive an error message on the Frontend. The error messages should be sufficient enough to point you in the right direction.

  • Make sure that the Web service URL is configured without any typos. Otherwise, you will reach the web service, but the report page will output an error — ‘404 page not found’.
WebServiceURL=http://192.168.1.156:10053/reportwrong

Typos in configuration error message

NOTE. If you see this error message, check for typos in the Zabbix server configuration file for WebServiceURL.

  • Don’t forget to assign the Frontend URL in Administration > General > Other.

— If a URL is misconfigured, you might start receiving empty reports.
— If the URL syntax is wrong, you will receive an error message about the malformed URL.

Malformed URL error message

Frontend URL configuration parameter

  • Google Chrome is not pre-packaged with Zabbix,

— You need to have Google Chrome package installed separately. You can download Google Chrome from the official Google Chrome website, for instance, by using wget.

— Make sure that Google Chrome is available via $PATH environmental variable. If you don’t have it configured, you will receive the error message, so you will need to modify the path variable and make sure the executable is available there.

$PATH environmental variable error

Questions & Answers

Question. What are the possibilities to customize the page size like A4, A3?

Answer. It will be based on how you customize your Dashboard. Currently, you cannot customize the page and select portrait or landscape, for instance.


Scalability improvements

Post Syndicated from Sergey Simonenko original https://blog.zabbix.com/scalability-improvements/14832/

New improvements might be unnoticed by many Zabbix users since they come to scalability, rather than to new features or some aspects of the user interface experience. However, these improvements might be beneficial for those Zabbix users who run really large instances.

Contents

I. More efficient database use (1:15)

1. New worker processes (3:03)

2. In-memory trend cache (4:49)
3. More server resiliency (7:35)

II. Questions & Answers (10:54)

In case of large instances, the main performance bottleneck would be the database. Zabbix doesn’t establish ad-hoc connections and uses only persistent connections to the database. In Zabbix 5.4, the use of database connections has been further drastically optimized.

More efficient database use

  • In earlier versions, not only database syncers, but also pollers, and some other processes had a dedicated persistent connection to the database. These connections were necessary for calculated items and aggregate checks. These calculated items and aggregate checks are not real items, since they’re based on the queries to the database, particularly to history tables.

Connections were also required to update host availability status. Pollers (unreachable pollers, JMX pollers, as well as the IPMI manager) were updating it directly in the database.

  • In addition, in some cases, when proxies were used (that would be true for large instances) host availability was updated by the proxy poller, in case of a passive proxy, and trapper.

Why was it decided to avoid these connections in Zabbix 5.4?

  • First, they don’t really work smoothly with the default database configuration (PostgreSQL, Oracle). For instance, in PostgreSQL, max_connections is by default set to 100.
  • They can cause locking on the database side.
  • They also result in inefficient memory and CPU utilization.
  • Finally, in earlier versions, it was impossible to perfectly fine-tune the number of connections to the database.

New worker processes

In Zabbix 5.4, two new processes were introduced: history pollers and availability manager. If you have upgraded your Zabbix instance already when you log onto your server and run ps aux | grep zabbix_server, you will notice these new processes:

/usr/sbin/zabbix_server: history poller #1 [got 0 values in 0.000008 sec, idle 1 sec] 
/usr/sbin/zabbix_server: history poller #2 [got 2 values in 0.000186 sec, idle 1 sec] 
/usr/sbin/zabbix_server: history poller #3 [got 0 values in 0.000050 sec, idle 1 sec] 
/usr/sbin/zabbix_server: history poller #4 [got 0 values in 0.000010 sec, idle 1 sec] 
/usr/sbin/zabbix_server: history poller #5 [got 0 values in 0.000012 sec, idle 1 sec] 
/usr/sbin/zabbix_server: availability manager #1 [queued 0, processed 0 values, idle 5.016162 sec during 5.016415 sec]

History pollers

Since calculated items and aggregate checks represent a different types of items, now they have their own poller – history poller. History pollers are also used for several internal items (zabbix[*] item keys) as well.

New configuration parameters

History poller comes with a new configuration parameter. Here, it is important to keep in mind that more is not always better. So, the StartHistoryPollers value (how many history pollers are being pre-forked) should be increased only if history pollers are too busy according to internal self-monitoring, but should be kept as low as possible to avoid unnecessary connections to the database.

### Option: StartHistoryPollers
#     Number of pre-forked instances of history pollers.
#     Only required for calculated, aggregated and internal checks.
#     A database connection is required for each history poller instance.
#
# Mandatory: no
# Range: 0-1000
# Default:
# StartHistoryPollers=5

Availability manager

In earlier versions, pollers, unreachable pollers, JMX pollers, and the IPMI manager updated host availability directly in the database with a separate transaction for each host. Now, we have this separate availability manager, and all processes — pollers, trappers, etc. — communicate with the availability manager, and the statistics queue is flushed by the availability manager to the database every 5 seconds.

In-memory trend cache

Since Zabbix 5.2, new trigger functions like trendavg, trendmax, etc. were introduced, which operate with the trends data for long periods. Similarly to calculated items, these triggers used database queries to obtain the necessary data.

In Zabbix 5.4, finally, the trend cache has been implemented. It stores the results of calculated trends functions. If the value is not available in the cache yet, Zabbix will query the database and update the cache.

As with all newly introduced processes, this cache’s effectiveness can be monitored using internal check zabbix[tcache,cache,], which can be used to set the relevant TrendFunctionCacheSize parameter value.

### Option: TrendFunctionCacheSize
#           Size of trend function cache, in bytes.
#           Shared memory size for caching calculated trend function data.
#
# Mandatory: no
# Range: 128K-2G
# Default:
# TrendFunctionCacheSize=4M

To sum it up, with all these database-related optimizations:

  • Now it is possible to have as many database connections as you really need. So, if you, for instance, operate a very large instance and you need a hundred or more pollers, and at the same time, you don’t rely much on some calculated items or aggregate checks functionality, before Zabbix 5.4 you would end up with hundreds or more database connections that you didn’t need.

Moreover, with PostgreSQL with default configuration, if you increased the number of pollers, your database server could go down and bring down your Zabbix instance. For each PostgreSQL worker process, you would have had a limited work_mem as you had too many database connections. So, your overall database performance would have been sacrificed. That is not the case anymore.

  • In addition, if you are using trend functions with triggers using large periods of time, in the past you might have noticed, for instance, slow queries. Now, these changes will help you to drastically decrease the database load.

More server resiliency

  • Another important feature — graceful start. Active proxies can keep a backlog, which is useful if the communication between the server and the proxy breaks for any reason, for instance:

— server maintenance during upgrade to the next minor release;
— loss of Internet access at a remote site due to fiber cut, etc.

When communication restores, the proxies can easily overload the server after long downtimes, especially in large instances.

  • Since Zabbix 5.4, the server lets the proxies know if it’s busy, so the proxies throttle data sending.

Earlier, the data uploaded by the proxies was throttled when the history cache usage was 80% or greater. However, as the server was responsible for that task, all proxies were getting disabled in some situations. That meant the history data upload, as well as other tasks, such as processing of regular data and processing tasks, were getting suspended until the history cache utilization dropped lower than 80%.

This method was ineffective and unacceptable in large environments. Now, the proxies are responsible for checking whether the server can handle the data. When the history cache usage hits 80%, the following scenario is used:

  • the proxies send the data to the server and the data is accepted;
  • if the server thinks it’s busy it will respond with a special JSON tag upload set to ‘disable’;
  • the proxies will stop uploading history data, but will keep polling the server for tasks and uploading other data;
  • in a while, the proxies will upload data again;
  • if the server is not too busy, it will respond with the JSON tag upload set to ‘enable’.

Unlike the previous two scalability improvements which are based on serious architectural changes, this change was backported to earlier Zabbix versions — 5.0 and 5.2.

Questions & Answers

Question. Would you recommend using proxies even on the local site to allow for the server to be upgraded without losing data or for performance improvements?

Answer. Yes, in some cases there’re such setups. This idea mainly is to have a unified configuration, not only to improve performance. And in some cases, if you use a lot of proxies, you might want to monitor all the items only with the proxies. Such scenarios are used by many Zabbix customers.

Question. So, throttling can give you some noticeable performance benefits. Which version is required on the server and on the proxy for throttling?

Answer. All these changes have been backported to earlier versions, so you can use either Zabbix 5.4.0 released recently or the latest releases of Zabbix 5.0 or Zabbix 5.2.

Question. Is it possible to have two databases in a cluster and point the select queries to one database and, for instance, execution queries to another database? How would database clustering generally work? Is it of benefit to Zabbix? Can Zabbix utilize it?

Answer. In general, our HA setups use some basic features, which are built-in into database servers. They use replication. So, you have to use the servers that will provide some virtual IP for your cluster. That is completely transparent to Zabbix.

However, it is not recommended to split different queries on different nodes. They should still hit a single specific note. So, it is more of an HA approach rather than a horizontal scalability approach.

Question. Would you elaborate on what a large, or medium, or small instance means? What new values per second should we be looking at?

Answer. We can judge from large instances of our customers, and might not know about even larger instances managed by the customers themselves. Large instances can have, for instance, 100,000 NVPS and more. Sometimes, we upgrade really large instances with databases of dozens of terabytes. Some users like keeping really long records.

In my experience, large instances of 20,000 to 40,000 NPVS are quite common and they could benefit a lot from these changes.

Prime Day 2021 – Two Chart-Topping Days

Post Syndicated from Jeff Barr original https://aws.amazon.com/blogs/aws/prime-day-2021-two-chart-topping-days/

In what has now become an annual tradition (check out my 2016, 2017, 2019, and 2020 posts for a look back), I am happy to share some of the metrics from this year’s Prime Day and to tell you how AWS helped to make it happen.

This year I bought all sorts of useful goodies including a Toshiba 43 Inch Smart TV that I plan to use as a MagicMirror, some watering cans, and a Dremel Rotary Tool Kit for my workshop.

Powered by AWS
As in years past, AWS played a critical role in making Prime Day a success. A multitude of two-pizza teams worked together to make sure that every part of our infrastructure was scaled, tested, and ready to serve our customers. Here are a few examples:

Amazon EC2 – Our internal measure of compute power is an NI, or a normalized instance. We use this unit to allow us to make meaningful comparisons across different types and sizes of EC2 instances. For Prime Day 2021, we increased our number of NIs by 12.5%. Interestingly enough, due to increased efficiency (more on that in a moment), we actually used about 6,000 fewer physical servers than we did in Cyber Monday 2020.

Graviton2 Instances – Graviton2-powered EC2 instances supported 12 core retail services. This was our first peak event that was supported at scale by the AWS Graviton2 instances, and is a strong indicator that the Arm architecture is well-suited to the data center.

An internal service called Datapath is a key part of the Amazon site. It is highly optimized for our peculiar needs, and supports lookups, queries, and joins across structured blobs of data. After an in-depth evaluation and consideration of all of the alternatives, the team decided to port Datapath to Graviton and to run it on a three-Region cluster composed of over 53,200 C6g instances.

At this scale, the price-performance advantage of the Graviton2 of up to 40% versus the comparable fifth-generation x86-based instances, along with the 20% lower cost, turns into a big win for us and for our customers. As a bonus, the power efficiency of the Graviton2 helps us to achieve our goals for addressing climate change. If you are thinking about moving your workloads to Graviton2, be sure to study our very detailed Getting Started with AWS Graviton2 document, and also consider entering the Graviton Challenge! You can also use Graviton2 database instances on Amazon RDS and Amazon Aurora; read about Key Considerations in Moving to Graviton2 for Amazon RDS and Amazon Aurora Databases to learn more.

Amazon CloudFront – Fast, efficient content delivery is essential when millions of customers are shopping and making purchases. Amazon CloudFront handled a peak load of over 290 million HTTP requests per minute, for a total of over 600 billion HTTP requests during Prime Day.

Amazon Simple Queue Service – The fulfillment process for every order depends on Amazon Simple Queue Service (SQS). This year, traffic set a new record, processing 47.7 million messages per second at the peak.

Amazon Elastic Block Store – In preparation for Prime Day, the team added 159 petabytes of EBS storage. The resulting fleet handled 11.1 trillion requests per day and transferred 614 petabytes per day.

Amazon Aurora – Amazon Fulfillment Technologies (AFT) powers physical fulfillment for purchases made on Amazon. On Prime Day, 3,715 instances of AFT’s PostgreSQL-compatible edition of Amazon Aurora processed 233 billion transactions, stored 1,595 terabytes of data, and transferred 615 terabytes of data

Amazon DynamoDB – DynamoDB powers multiple high-traffic Amazon properties and systems including Alexa, the Amazon.com sites, and all Amazon fulfillment centers. Over the course of the 66-hour Prime Day, these sources made trillions of API calls while maintaining high availability with single-digit millisecond performance, and peaking at 89.2 million requests per second.

Prepare to Scale
As I have detailed in my previous posts, rigorous preparation is key to the success of Prime Day and our other large-scale events. If your are preparing for a similar event of your own, I can heartily recommend AWS Infrastructure Event Management. As part of an IEM engagement, AWS experts will provide you with architectural and operational guidance that will help you to execute your event with confidence.

— Jeff;

Triggers, calculated and aggregated items in Zabbix 5.4

Post Syndicated from Aigars Kadiķis original https://blog.zabbix.com/triggers-calculated-and-aggregated-items-in-zabbix-5-4/14880/

In earlier Zabbix versions, we had three categories of things we could manage inside the instance — triggers, calculated items, and aggregated items. Each of them had its own syntax, so we could not be sure what syntax to use in a certain case. That’s why we introduced the unified syntax for every category inside the monitoring tool that will ease up the documentation task and the configuration process. To appreciate the innovation, we need to recap these three categories in Zabbix.

Contents

I. What’s different in Zabbix 5.4? (1:52)
II. Examples (9:20)
III. Aggregated checks (14:09)
IV. Questions & Answers (19:08)

The trigger is a logic implying calculating some formula. If it is true, it will generate an event, a so-called problem. At the same time, calculated items are doing calculations as well, but at the end, they store a value inside the database. This value will be either an integer or a floating number. So, both these things are doing calculations, but before Zabbix 5.4 the syntax was different.

What’s different in Zabbix 5.4?

Each item has a tag:tagvalue

It all starts almost with the item as it is how we collect the metrics. Previously, it was always an application type of thing. Whenever we designed an item, it could be a memory-type of thing, a network, CPU, etc. Now, we have these column tags.

TAG:TAGVALUE

As you can see in this example, the tag value is ‘Application’. This really lets us have a flawless upgrade operation. The ‘Application’ field is completely gone, and now we have only tags on this item level.

Period and time shift is one argument now

Previously, whenever we were dealing with trigger functions, most of the time, the first argument was the interval to be used as an input. We had two arguments: we could analyze metrics for the specified period with <period> and, to go back in time and use <time shift> after comma — <period>,<time shift>.

We have decided to use one argument — <period:time shift>.

If you want to analyze data for yesterday, or last week, or last year, you can now use one argument:

  • <1h> — during the last one hour,
  • <1h:now-1d> — during the same hour one day ago,
  • <1d:now/d> — yesterday during the day.

STR(), REGEX(), IREGEX() => FIND()

Another big change — the functions searching for the data containing a string will now be converted into one function — find().

So, the string function — STR(), which was less CPU-intensive, could search for a string. If we needed a more complex pattern, we used REGEX() or, in case-sensitive cases, the regular expression function — IREGEX(). Now, we can use a single function covering all the needs, including case-sensitive search, — find().

It contains more arguments, which specify a string way to search, and consumes less CPU power. Or we might really need to utilize the regular expression thing.

New syntax

So, in the earlier Zabbix version, the trigger had a curly parenthesis at the beginning and at the end, the key in the middle, and the trigger function mathematical calculations with the dot in the middle: {host:key.max(15m)}.

The unified syntax will always start with the function. This lets us use recursions — as some functions support multiple arguments, we can put a function inside the function thus eliminating the previous limitations: max(/host/key,15m).

This syntax is very similar to that used in the Linux file system — it starts with the forward slash, then comes the host name, and the item key with the interval (including shifting) after the first comma.

Now, the same syntax is used for triggers and calculated items. In addition, previously, we did have the aggregated items. Now, if you want to do some aggregation, you’ll have to use calculated items inside the interface.

Examples

Now, there are many things you can accomplish, which were not possible before.

Absolute time periods

We might need to know what has happened today, for instance, whether the workstation is on at 10 a.m. We can do it by summing up the agent.ping items. So, if the agent.ping is zero, then it is still offline and no one has turned the workstation on. Otherwise, the agent.ping will be 1.

sum(/host/key, 1d:now/d+1d) = 0 and time() > 100000

  • We might need to find out the maximum workstation uptime yesterday. If the uptime is bigger than 10 hours, a person might have been working at the computer for too long and might need a reminder that there’s life outside.

trendmax(/host/key, 1d:now/d)>10h

  • When analyzing user sessions, we might search for the maximum peak last week. To do that, here we compare the last week’s peak with yesterday’s peak and find out that it has doubled. So, it’s a problem and we can get an event.

trendmax(/host/key, 1d:now/d) > trendmax(/host/key, 1d:now/w) / 2

  • We can also analyze activity, for instance, the stock module memory utilization per Windows machine for the previous month. So, we are looking at the maximum memory used during the previous month per server, not the workstation, and then compare the used memory with the memory available.

trendmax(/host/key1, 1M:now/M) < last(/host/key2) / 2

Here, the server is not utilizing half of the available memory, so we will get notified.

The beauty of this trigger is that the stock template already contains all those 12 items — a collection per-used memory, a collection per-total memory. All we need to do is go to the Trigger section, install this trigger, and as soon as one single metric comes in, it will generate the event about the last month as all the data is stored inside the database.

Compare string between two hosts

Now, we can compare text strings. We can use a different type of input, for instance, different servers (say, node 1, node 2), and compare the agent versions. If the version is different or the same, you can decide what the problem is. It will fire up an event, and we can indicate what the difference between those versions is in the event title.

last(/node1/agent.version) <> last(/node2/agent.version)

Aggregated checks

Aggregation on current host (foreach)

You might need to calculate something and store the data in the database.

In this example, if we have a website. we will have a template containing a web scenario, which consists of multiple steps, such as checking for pages. It will provide the Latest data page and the response time per page.

In the Templates, we can select this calculated item, and, for instance, aggregate all those built-in response time metrics.

Average web page response time: avg(last_foreach(//web.test.time[check performance,*,resp]))

The ‘*’, the wildcard, will tell Zabbix to aggregate all the items reflecting the response time, and the double forward slash means aggregation for the current host. ‘foreach’ will now be all over the place whenever we do the aggregation. This command is the same as used in the Windows PowerShell used to go through the different types of elements: either through the hosts, either through the items.

We might use a different type of aggregation using the same approach. For instance, when monitoring the disk space, we are capturing the used space by the Linux or Windows machine that can have different drives or different modes. Using one calculated item, we can aggregate the total used space per all the mounts or all the drives on the server. This might be useful, for instance, to estimate how much disk space you need if it’s time to purchase an SSD drive.

Total used space on all drives: sum(last_foreach(//vfs.fs.size[*,used]))

Aggregation by host group

Another type of functionality — aggregation by the host group.

You might have a group, for instance, ‘MySQL servers’ with the official solution looking for the queries per second. It will aggregate all the queries per second in one single item. If there is a pool of MySQL servers, then you will end up seeing the total number of these queries and afterward linking a trigger on this item.

MySQL queries per second: sum(last_foreach(/*/mysql.queries.rate?[group=”MySQL servers”]))

Aggregation by tag:value

You can do the aggregation not only by host group but also by utilizing the item Tags (tag name and tag value). It does not need to be a tag on the item level. You can mark your host element with the role on the host level. So, you create this item inside the template, and it will search for all these items, which belong to a specific host with this tag and tag value, and do the aggregation. You will end up with an item, which has used space metrics (domain controllers in this example).

Used space on domain controllers: sum(last_foreach(/*/vfs.fs.size[*,used]?[tag=”Role:Domain Controller”]))

Questions & Answers

Question. After the upgrade, what will happen with the trigger item syntax? Do we have to rebuild everything?

Answer. It gets upgraded automatically. However, as per the results of my testing in the test environment, some items have to be checked. I would highly suggest extracting the configuration and testing the upgrade process beforehand to learn how those items will affect the system (just to be on the safe side).

Question. Are there any changes or improvements in the predictive trigger syntax?

Answer. You should definitely take a look at the roadmap for the exact information.

Question. When we’re doing an aggregation, is it always going to be on a single host or can we specify a host group or a tag?

Answer. Surely. Aggregation by host group is possible as it was before. Still, it’s more flexible now. We need to specify a host, a wildcard for the host item, and then we can add additional value by using the host group or by specifying what kind of tag the item should have. Then your parameters will be respected. We can combine all those things, that is, filter by host group and by the tag name and tag value.

In addition, when we’re doing the upgrade, the prototype items and triggers for the low-level discovery rules are also going to be automatically switched over.


Customize and Package Dependencies With Your Apache Spark Applications on Amazon EMR on Amazon EKS

Post Syndicated from Channy Yun original https://aws.amazon.com/blogs/aws/customize-and-package-dependencies-with-your-apache-spark-applications-on-amazon-emr-on-amazon-eks/

Last AWS re:Invent, we announced the general availability of Amazon EMR on Amazon Elastic Kubernetes Service (Amazon EKS), a new deployment option for Amazon EMR that allows customers to automate the provisioning and management of Apache Spark on Amazon EKS.

With Amazon EMR on EKS, customers can deploy EMR applications on the same Amazon EKS cluster as other types of applications, which allows them to share resources and standardize on a single solution for operating and managing all their applications. Customers running Apache Spark on Kubernetes can migrate to EMR on EKS and take advantage of the performance-optimized runtime, integration with Amazon EMR Studio for interactive jobs, integration with Apache Airflow and AWS Step Functions for running pipelines, and Spark UI for debugging.

When customers submit jobs, EMR automatically packages the application into a container with the big data framework and provides prebuilt connectors for integrating with other AWS services. EMR then deploys the application on the EKS cluster and manages running the jobs, logging, and monitoring. If you currently run Apache Spark workloads and use Amazon EKS for other Kubernetes-based applications, you can use EMR on EKS to consolidate these on the same Amazon EKS cluster to improve resource utilization and simplify infrastructure management.

Developers who run containerized, big data analytical workloads told us they just want to point to an image and run it. Currently, EMR on EKS dynamically adds externally stored application dependencies during job submission.

Today, I am happy to announce customizable image support for Amazon EMR on EKS that allows customers to modify the Docker runtime image that runs their analytics application using Apache Spark on your EKS cluster.

With customizable images, you can create a container that contains both your application and its dependencies, based on the performance-optimized EMR Spark runtime, using your own continuous integration (CI) pipeline. This reduces the time to build the image and helps predicting container launches for a local development or test.

Now, data engineers and platform teams can create a base image, add their corporate standard libraries, and then store it in Amazon Elastic Container Registry (Amazon ECR). Data scientists can customize the image to include their application specific dependencies. The resulting immutable image can be vulnerability scanned, deployed to test and production environments. Developers can now simply point to the customized image and run it on EMR on EKS.

Customizable Runtime Images – Getting Started
To get started with customizable images, use the AWS Command Line Interface (AWS CLI) to perform these steps:

  1. Register your EKS cluster with Amazon EMR.
  2. Download the EMR-provided base images from Amazon ECR and modify the image with your application and libraries.
  3. Publish your customized image to a Docker registry such as Amazon ECR and then submit your job while referencing your image.

You can download one of the following base images. These images contain the Spark runtime that can be used to run batch workloads using the EMR Jobs API. Here is the latest full image list available.

Release Label Spark Hadoop Versions Base Image Tag
emr-5.32.0-latest Spark 2.4.7 + Hadoop 2.10.1 emr-5.32.0-20210129
emr-5.33-latest Spark 2.4.7-amzn-1 + Hadoop 2.10.1-amzn-1 emr-5.33.0-20210323
emr-6.2.0-latest Spark 3.0.1 + Hadoop 3.2.1 emr-6.2.0-20210129
emr-6.3-latest Spark 3.1.1-amzn-0 + Hadoop 3.2.1-amzn-3 emr-6.3.0:latest

These base images are located in an Amazon ECR repository in each AWS Region with an image URI that combines the ECR registry account, AWS Region code, and base image tag in the case of US East (N. Virginia) Region.

755674844232.dkr.ecr.us-east-1.amazonaws.com/spark/emr-5.32.0-20210129

Now, sign in to the Amazon ECR repository and pull the image into your local workspace. If you want to pull an image from a different AWS Region to reduce network latency, choose the different ECR repository that corresponds most closely to where you are pulling the image from US West (Oregon) Region.

$ aws ecr get-login-password --region us-west-2 | docker login --username AWS --password-stdin 895885662937.dkr.ecr.us-west-2.amazonaws.com
$ docker pull 895885662937.dkr.ecr.us-west-2.amazonaws.com/spark/emr-5.32.0-20210129

Create a Dockerfile on your local workspace with the EMR-provided base image and add commands to customize the image. If the application requires custom Java SDK, Python, or R libraries, you can add them to the image directly, just as with other containerized applications.

The following example Docker commands are for a use case in which you want to install useful Python libraries such as Natural Language Processing (NLP) using Spark and Pandas.

FROM 895885662937.dkr.ecr.us-west-2.amazonaws.com/spark/emr-5.32.0-20210129
USER root
### Add customizations here ####
RUN pip3 install pyspark pandas spark-nlp // Install Python NLP Libraries
USER hadoop:hadoop

In another use case, as I mentioned, you can install a different version of Java (for example, Java 11):

FROM 895885662937.dkr.ecr.us-west-2.amazonaws.com/spark/emr-5.32.0-20210129
USER root
### Add customizations here ####
RUN yum install -y java-11-amazon-corretto // Install Java 11 and set home
ENV JAVA_HOME /usr/lib/jvm/java-11-amazon-corretto.x86_64
USER hadoop:hadoop

If you’re changing Java version to 11, then you also need to change Java Virtual Machine (JVM) options for Spark. Provide the following options in applicationConfiguration when you submit jobs. You need these options because Java 11 does not support some Java 8 JVM parameters.

"applicationConfiguration": [ 
  {
    "classification": "spark-defaults",
    "properties": {
        "spark.driver.defaultJavaOptions" : "
		    -XX:OnOutOfMemoryError='kill -9 %p' -XX:MaxHeapFreeRatio=70",
        "spark.executor.defaultJavaOptions" : "
		    -verbose:gc -Xlog:gc*::time -XX:+PrintGCDetails -XX:+PrintGCDateStamps 
			-XX:OnOutOfMemoryError='kill -9 %p' -XX:MaxHeapFreeRatio=70 
			-XX:+IgnoreUnrecognizedVMOptions"
    }
  }
]

To use custom images with EMR on EKS, publish your customized image and submit a Spark workload in Amazon EMR on EKS using the available Spark parameters.

You can submit batch workloads using your customized Spark image. To submit batch workloads using the StartJobRun API or CLI, use the spark.kubernetes.container.image parameter.

$ aws emr-containers start-job-run \
    --virtual-cluster-id <enter-virtual-cluster-id> \
    --name sample-job-name \
    --execution-role-arn <enter-execution-role-arn> \
    --release-label <base-release-label> \ # Base EMR Release Label for the custom image
    --job-driver '{
        "sparkSubmitJobDriver": {
        "entryPoint": "local:///usr/lib/spark/examples/jars/spark-examples.jar",
        "entryPointArguments": ["1000"],
        "sparkSubmitParameters": [ "--class org.apache.spark.examples.SparkPi --conf spark.kubernetes.container.image=123456789012.dkr.ecr.us-west-2.amazonaws.com/emr5.32_custom"
		  ]
      }
  }'

Use the kubectl command to confirm the job is running your custom image.

$ kubectl get pod -n <namespace> | grep "driver" | awk '{print $1}'
Example output: k8dfb78cb-a2cc-4101-8837-f28befbadc92-1618856977200-driver

Get the image for the main container in the Driver pod (Uses jq).

$ kubectl get pod/<driver-pod-name> -n <namespace> -o json | jq '.spec.containers
| .[] | select(.name=="spark-kubernetes-driver") | .image '
Example output: 123456789012.dkr.ecr.us-west-2.amazonaws.com/emr5.32_custom

To view jobs in the Amazon EMR console, under EMR on EKS, choose Virtual clusters. From the list of virtual clusters, select the virtual cluster for which you want to view logs. On the Job runs table, select View logs to view the details of a job run.

Automating Your CI Process and Workflows
You can now customize an EMR-provided base image to include an application to simplify application development and management. With custom images, you can add the dependencies using your existing CI process, which allows you to create a single immutable image that contains the Spark application and all of its dependencies.

You can apply your existing development processes, such as vulnerability scans against your Amazon EMR image. You can also validate for correct file structure and runtime versions using the EMR validation tool, which can be run locally or integrated into your CI workflow.

The APIs for Amazon EMR on EKS are integrated with orchestration services like AWS Step Functions and AWS Managed Workflows for Apache Airflow (MWAA), allowing you to include EMR custom images in your automated workflows.

Now Available
You can now set up customizable images in all AWS Regions where Amazon EMR on EKS is available. There is no additional charge for custom images. To learn more, see the Amazon EMR on EKS Development Guide and a demo video how to build your own images for running Spark jobs on Amazon EMR on EKS.

You can send feedback to the AWS forum for Amazon EMR or through your usual AWS support contacts.

— Channy

Introducing a Public Registry for AWS CloudFormation

Post Syndicated from Steve Roberts original https://aws.amazon.com/blogs/aws/introducing-a-public-registry-for-aws-cloudformation/

AWS CloudFormation and the AWS Cloud Development Kit (CDK) provide scalable and consistent provisioning of AWS resources (for example, compute infrastructure, monitoring tools, databases, and more). We’ve heard from many customers that they’d like to benefit from the same consistency and scalability when provisioning resources from AWS Partner Network (APN) members, third-party vendors, and open-source technologies, regardless of whether they are using CloudFormation templates or have adopted the CDK to define their cloud infrastructure.

I’m pleased to announce a new public registry for CloudFormation, providing a searchable collection of extensions – resource types or modules – published by AWS, APN partners, third parties, and the developer community. The registry makes it easy to discover and provision these extensions in your CloudFormation templates and CDK applications in the same manner you use AWS-provided resources. Using extensions, you no longer need to create and maintain custom provisioning logic for resource types from third-party vendors. And, you are able to use a single infrastructure as code tool, CloudFormation, to provision and manage AWS and third-party resources, further simplifying the infrastructure provisioning process (the CDK uses CloudFormation under the hood).

Launch Partners
We’re excited to be joined by over a dozen APN Partners for the launch of the registry, with more than 35 extensions available for you to use today. Blog posts and announcements from the APN Partners who collaborated on this launch, along with AWS Quick Starts, can be found below (some will be added in the next few days).

Registries and Resource Types
In 2019, CloudFormation launched support for private registries. These enabled registration and use of resource providers (Lambda functions) in your account, including providers from AWS and third-party vendors. After you registered a provider you could use resource types, comprised of custom provisioning logic, from the provider in your CloudFormation templates. Resource types were uploaded by providers to an Amazon Simple Storage Service (Amazon S3) bucket, and you used the types by referencing the relevant S3 URL. The public registry provides consistency in the sourcing of resource types and modules, and you no longer need to use a collection of Amazon Simple Storage Service (Amazon S3) buckets.

Third-party resource types in the public registry also integrate with drift detection. After creating a resource from a third-party resource type, CloudFormation will detect changes to the resource from its template configuration, known as configuration drift, just as it would with AWS resources. You can also use AWS Config to manage compliance for third-party resources consumed from the registry. The resource types are automatically tracked as Configuration items when you have configured AWS Config to record them, and used CloudFormation to create, update, and delete them. Whether the resource types you use are third-party or AWS resources, you can view configuration history for them, in addition to being able to write AWS Config rules to verify configuration best practices.

The public registry also supports Type Configuration, enabling you to configure third-party resource types with API keys and OAuth tokens per account and region. Once set, the configuration is stored securely and can be updated. This also provides a centralized way to configure third-party resource types.

Publishing Extensions to the Public Registry
Extension publishers must be verified as AWS Marketplace sellers, or as GitHub or BitBucket users, and extensions are validated against best practices. To publish extensions (resource types or modules) to the registry, you must first register in an AWS Region, using one of the mentioned account types.

After you’ve registered, you next publish your extension to a private registry in the same Region. Then, you need to test that the extension meets publishing requirements. For a resource type extension, this means it must pass all the contract tests defined for the type. Modules are subject to different requirements, and you can find more details in the documentation. With testing complete, you can publish your extension to the public registry for your Region. See the user guide for detailed information on publishing extensions.

Using Extensions in the Public Registry
I decided to try a couple of extensions related to Kubernetes, contributed by AWS Quick Starts, to make configuration changes to a cluster. Personally, I don’t have a great deal of experience with Kubernetes and its API so this was a great chance to examine how extensions could save me significant time and effort. During the process of writing this post I learned from others that using the Kubernetes API (the usual way to achieve the changes I had in mind) would normally involve effort even for those with more experience.

For this example I needed a Kubernetes cluster, so I followed this tutorial to set one up in Amazon Elastic Kubernetes Service (EKS), using the Managed nodes – Linux node type. With my cluster ready, I want to make two configuration changes.

First, I want to add a new namespace to the cluster. A namespace is a partitioning construct that lets me deploy the same set of resources to different namespaces in the same cluster without conflict thanks to the isolation namespaces provide. Second, I want to set up and use Helm, a package manager for Kubernetes. I’ll use Helm to install the kube-state-metrics package from the Prometheus helm-charts repository for gathering cluster metrics. While I can use CloudFormation to provision clusters and compute resources, previously, to perform these two configuration tasks, I’d have had to switch to the API or various bespoke tool chains. With the registry, and these two extensions, I can now do everything using CloudFormation (and of course, as I mentioned earlier, I could also use the extensions with the CDK, which I’ll show later).

Before using an extension, it needs to be activated in my account. While activation is easy to do for single accounts using the console, as we’ll see in a moment, if I were using AWS Organizations and wanted to activate various third-party extensions across my entire organization, or for a specific organization unit (OU), I could achieve this using Service-Managed StackSets in CloudFormation. Using the resource type AWS::CloudFormation::TypeActivation in a template submitted to a Service-Managed StackSet, I can target an entire Organization, or a particular OU, passing the Amazon Resource Name (ARN) identifying the third-party extension to be activated. Activation of extensions is also very easy to achieve (whether using AWS Organizations or not) using the CDK with just a few lines of code, again making use of the aforementioned TypeActivation resource type.

To activate the extensions, I head to the CloudFormation console and click Public extensions from the navigation bar. This takes me to the Registry:Public extensions home page, where I switch to viewing third party resource type extensions.

Viewing third-party types in the registry

The extensions I want are AWSQS::Kubernetes::Resource and AWSQS::Kubernetes::Helm. The Resource extension is used to apply a manifest describing configuration changes to a cluster. In my case, the manifest requests a namespace be created. Clicking the name of the AWSQS::Kubernetes::Resource extension takes me to a page where I can view schema, configuration details, and versions for the extension.

Viewing details of the Resource extension

What happens if you deactivate an extension you’re using, or an extension is withdrawn by the publisher? If you deactivate an extension a stack depends on, any resources created from that extension won’t be affected, but you’ll be unable to perform further stack operations, such as Read, Update, Delete, and List (these will fail until the extension is re-activated). Publishers must request their extensions be withdrawn from the registry (there is no “delete” API). If the request is granted, customers who activated the extension prior to withdrawal can still perform Create/Read/Update/Delete/List operations, using what is effectively a snapshot of the extension in their account.

Clicking Activate takes me to a page where I need to specify the ARN of an execution role that CloudFormation will assume when it runs the code behind the extension. I create a role following this user guide topic, but the basic trust relationship is below for reference.

{
  "Version": "2012-10-17",
  "Statement": [
    {
      "Effect": "Allow",
      "Principal": {
        "Service": "resources.cloudformation.amazonaws.com"
      },
      "Action": "sts:AssumeRole"
    }
  ]
}

I also add permissions for the resource types I’m using to my execution role. Details on the permissions needed for the types I chose can be found on GitHub, for Helm, and for Kubernetes (note the GitHub examples include the trust relationship too).

When activating an extension, I can elect to use the default name, which is how I will refer to the type in my templates or CDK applications, or I can enter a new name. The name chosen has to be unique within my account, so if I’ve enabled a version of an extension with its default name, and want to enable a different version, I must change the name. Once I’ve filled in the details, and chosen my versioning strategy (extensions use semantic versioning, and I can elect to accept automatic updates for minor version changes, or to “lock” to a specific version) clicking Activate extension completes the process.

Activating an extension from the registry

That completes the process for the first extension, and I follow the same steps for the AWSQS::Kubernetes::Helm extension. Navigating to Activated extensions I can view a list of all my enabled extensions.

Viewing the list of enabled extensions

I have one more set of permissions to update. Resource types make calls to the Kubernetes API on my behalf so I need to update the aws-auth ConfigMap for my cluster to reference the execution role I just used, otherwise the calls made by the resource types I’m using will fail. To do this, I run the command kubectl edit cm aws-auth -n kube-system at a command prompt. In the text editor that opens, I update the ConfigMap with a new group referencing my CfnRegistryExtensionExecRole, shown below (if you’re following along, be sure to change the account ID and role name to match yours).

apiVersion: v1
data:
  mapRoles: |
    - groups:
      - system:bootstrappers
      - system:nodes
      rolearn: arn:aws:iam::111122223333:role/myAmazonEKSNodeRole
      username: system:node:{{EC2PrivateDNSName}}
    - groups:
      - system:masters
      rolearn: arn:aws:iam::111122223333:role/CfnRegistryExtensionExecRole
      username: cfnresourcetypes
kind: ConfigMap
metadata:
  creationTimestamp: "2021-06-04T20:44:24Z"
  name: aws-auth
  namespace: kube-system
  resourceVersion: "6355"
  selfLink: /api/v1/namespaces/kube-system/configmaps/aws-auth
  uid: dc91bfa8-1663-45d0-8954-1e841913b324

Now I’m ready to use the extensions to configure my cluster with a new namespace, Helm, and the kube-state-metrics package. I create a CloudFormation template that uses the extensions, adding parameters for the elements I want to specify when creating a stack: the name of the cluster to update, and the namespace name. The properties for the KubeStateMetrics resource reference the package I want Helm to install.

AWSTemplateFormatVersion: "2010-09-09"
Parameters:
  ClusterName:
    Type: String
  Namespace:
    Type: String
Resources:
  KubeStateMetrics:
    Type: AWSQS::Kubernetes::Helm
    Properties:
      ClusterID: !Ref ClusterName
      Name: kube-state-metrics
      Namespace: !GetAtt KubeNamespace.Name
      Repository: https://prometheus-community.github.io/helm-charts
      Chart: prometheus-community/kube-state-metrics
  KubeNamespace:
    Type: AWSQS::Kubernetes::Resource
    Properties:
      ClusterName: !Ref ClusterName
      Namespace: default
      Manifest: !Sub |
        apiVersion: v1
        kind: Namespace
        metadata:
          name: ${Namespace}
          labels:
            name: ${Namespace}

On the Stacks page of the CloudFormation console, I click Create stack, upload my template, and then give my stack a name and the values for my declared parameters.

Launching a stack with my activated extensions
I click Next to proceed through the rest of the wizard, leaving other settings at their default values, and then Create stack to complete the process.

Once stack creation is complete, I verify my changes using the kubectl command line tool. I first check that the new namespace, newsblog-sample-namespace, is present with the command kubectl get namespaces. I then run the kubectl get all --namespace newsblog-sample-namespace command to verify the kube-state-metrics package is installed.

Verifying the extensions applied by changes

Extensions can also be used with the AWS Cloud Development Kit. To wrap up this exploration of using the new registry, I’ve included an example below of a CDK application snippet in TypeScript that achieves the same effect, using the same extensions, as the YAML template I showed earlier (I could also have written this using any of the languages supported by the CDK – C#, Java, or Python).

import {Stack, Construct, CfnResource} from '@aws-cdk/core';
export class UnoStack extends Stack {
  constructor(scope: Construct, id: string) {
    super(scope, id);
    const clusterName = 'newsblog-cluster';
    const namespace = 'newsblog-sample-namespace';

    const kubeNamespace = new CfnResource(this, 'KubeNamespace', {
      type: 'AWSQS::Kubernetes::Resource',
      properties: {
        ClusterName: clusterName,
        Namespace: 'default',
        Manifest: this.toJsonString({
          apiVersion: 'v1',
          kind: 'Namespace',
          metadata: {
            name: namespace,
            labels: {
              name: namespace,
            }
          },
        }),
      },
    });
    
    new CfnResource(this, 'KubeStateMetrics', {
      type: 'AWSQS::Kubernetes::Helm',
      properties: {
        ClusterID: clusterName,
        Name: 'kube-state-metrics',
        Namespace: kubeNamespace.getAtt('Name').toString(),
        Repository: 'https://prometheus-community.github.io/helm-charts',
        Chart: 'prometheus-community/kube-state-metrics',
      },
    });
  }
};

As mentioned earlier in this post, I don’t have much experience with the Kubernetes API, and Kubernetes in general. However, by making use of the resource types in the public registry, in conjunction with CloudFormation, I was able to easily configure my cluster using a familiar environment, without needing to resort to the API or bespoke tool chains.

Get Started with the CloudFormation Public Registry
Pricing for the public registry is the same as for the existing registry and private resource types. There is no additional charge for using native AWS resource types; for third-party resource types you will incur charges based on the number of handler operations (add, delete, list, etc.) you run per month. For details, see the AWS CloudFormation Pricing page. The new public registry is available today in the US East (N. Virginia, Ohio), US West (Oregon, N. California), Canada (Central), Europe (Ireland, Frankfurt, London, Stockholm, Paris, Milan), Asia Pacific (Hong Kong, Mumbai, Osaka, Singapore, Sydney, Seoul, Tokyo), South America (Sao Paulo), Middle East (Bahrain), and Africa (Cape Town) AWS Regions.

For more information, see the AWS CloudFormation User Guide and User Guide for Extension Development, and start publishing or using extensions today!

— Steve

Migrate Your Workloads with the Graviton Challenge!

Post Syndicated from Steve Roberts original https://aws.amazon.com/blogs/aws/migrate-your-workloads-with-the-graviton-challenge/

Today, Dave Brown, VP of Amazon EC2 at AWS, announced the Graviton Challenge as part of his session on AWS silicon innovation at the Six Five Summit 2021. We invite you to take the Graviton Challenge and move your applications to run on AWS Graviton2. The challenge, intended for individual developers and small teams, is based on the experiences of customers who’ve already migrated. It provides a framework of eight, approximately four-hour chunks to prepare, port, optimize, and finally deploy your application onto Graviton2 instances. Getting your application running on Graviton2, and enjoying the improved price performance, aren’t the only rewards. There are prizes and swag for those who complete the challenge!

AWS Graviton2 is a custom-built processor from AWS that’s based on the Arm64 architecture. It’s supported by popular Linux operating systems including Amazon Linux 2, Red Hat Enterprise Linux, SUSE Linux Enterprise Server, and Ubuntu. Compared to fifth-generation x86-based Amazon Elastic Compute Cloud (Amazon EC2) instance types, Graviton2 instance types have a 20% lower cost. Overall, customers who have moved applications to Graviton2 typically see up to 40% better price performance for a broad range of workloads including application servers, container-based applications, microservices, caching fleets, data analytics, video encoding, electronic design automation, gaming, open-source databases, and more.

Before I dive in to talk more about the challenge, check out the fun introductory video below from Jeff Barr, Chief Evangelist, AWS and Dave Brown, Vice President, EC2. As Jeff mentions in the video: same exact workload, same or better performance, and up to 40% better price performance!

After you complete the challenge, we invite you to tell us about your adoption journey and enter the contest. If you post on social media with the hashtag #ITookTheGravitonChallenge, you’ll earn a t-shirt. To earn a hoodie, include a short video with your post.

To enter the competition, you’ll need to create a 5 to 10-minute video that describes your project and the application you migrated, any hurdles you needed to overcome, and the price performance benefits you realized.

All valid contest entries will each receive a $500 AWS credit (limited to 500 quantity). A panel of judges will evaluate the content entries and award additional prizes across six categories. All category winners will receive an AWS re:Invent 2021 conference pass, flight, and hotel for one company representative, and winners will be able to meet with senior members of the Graviton2 team at the conference. Here are additional category-specific prizes:

  • Best adoption – enterprise
    Based on the performance gains, total cost savings, number of instances the workload is running on, and time taken to migrate the workload (faster is better), for companies with over 1000 employees. The winner will also receive a chance to present at the conference.

  • Best adoption – small/medium business
    Based on the performance gains, total cost savings, number of instances the workload is running on, and time taken to migrate the workload (faster is better), for companies with 100-1000 employees. The winner will also receive a chance to present at the conference.
  • Best adoption – startup
    Based on the performance gains, total cost savings, number of instances the workload is running on, and time taken to migrate the workload (faster is better), for companies with fewer than 100 employees. The winner will also receive a chance to present at the conference.
  • Best new workload adoption
    Awarded to a workload that’s new to EC2 (migrated to Graviton2 from on-premises, or other cloud) based on the performance gains, total cost savings, number of instances the workload is running on, and time taken to migrate the workload (faster is better). The winner will also receive a chance to participate in a video or written case study.
  • Most impactful adoption
    Awarded to the workload with the biggest social impact based on details provided about what the workload/application does. Applications in this category are related to fields such as sustainability, healthcare and life sciences, conservation, learning/education, justice/equity. The winner will also receive a chance to participate in a video or written case study.
  • Most innovative adoption
    Applications in this category solve unique problems for their customers, address new use cases, or are groundbreaking. The award will be based on the workload description, price performance gains, and total cost savings. The winner will also receive a chance to participate in a video or written case study.

Competition submissions open on June 22 and close August 31. Winners will be announced on October 1 2021.

Identifying a workload to migrate
Now that you know what’s possible with Graviton2, you’re probably eager to get started and identify a workload to tackle as part of the challenge. The ideal workload is one that already runs on Linux and uses open-source components. This means you’ll have full access to the source code of every component and can easily make any required changes. If you don’t have an existing Linux workload that is entirely open-source based, you can, of course, move other workloads. A robust ecosystem of ISVs and AWS services already support Graviton2. However, if you are using software from a vendor that does not support Arm64/Graviton2, reach out to the Graviton Challenge Slack channel for support.

What’s involved in the challenge?
The challenge includes eight steps performed over four days (but you don’t have to do the challenge in four consecutive days). If you need assistance from Graviton2 experts, a dedicated Slack channel is available and you can sign up for emails containing helpful tips and guidance. In addition to support on Slack and supporting emails, you also get $25 AWS credit to cover the cost of the taking the challenge. Graviton2-based burstable T4g instances also have a free trial, available until December 31 2021, that can be used to qualify your workloads.

You can download the complete whitepaper can be downloaded from the Graviton Challenge page, but here is an outline of the process.

Day 1: Learn and explore
The first day you’ll learn about Graviton2 and then assess your selected workload. I recommend that you start by checking out the 2020 AWS re:Invent session, Deep dive on AWS Graviton2 processor-powered EC2 instances. The Getting Started with AWS Graviton GitHub repository will be a useful reference as you work through the challenge.

Assessment involves identifying the application’s dependencies and requirements. As with all preparatory work, the more thorough you are at this stage, the better positioned you are for success. So, don’t skimp on this task!

Day 2: Create a plan and start porting
On the second day, you’ll create a Graviton2 environment. You can use EC2 virtual machine instances with AWS-provided images or build your own custom images. Alternatively, you can go the container route, because both Amazon Elastic Container Service (Amazon ECS) and Amazon Elastic Kubernetes Service (EKS) support Graviton2-based instances.

After you have created your environment, you’ll bootstrap the application. The Getting Started Guide on GitHub contains language-specific getting started information. If your application uses Java, Python, Node.js, .NET, or other high-level languages, then it might run as-is or need minimal changes. Other languages like C, C++, or Go will need to be compiled for the 64-bit Arm architecture. For more information, see the guides on GitHub.

Day 3: Debug and optimize
Now that the application is running on a Graviton2 environment, it’s time to test and verify its functionality. When you have a fully functional application, you can test performance and compare it to x86-64 environments. If you don’t observe the expected performance, reach out to your account team, or get support on the Graviton Challenge Slack channel. We’re here to help analyze and resolve any potential performance gaps.

Day 4: Update infrastructure and start deployments
It’s shipping day! You’ll update your infrastructure to add Graviton2-based instances, and then start deploying. We recommend that you use canary or blue-green deployments so that a portion of your traffic is redirected to the new environments. When you’re comfortable, you can transition all traffic.

At this point, you can celebrate completing the challenge, publish a post on social media using the #ITookTheGravitonChallenge hashtag, let us know about your success, and consider entering the competition. Remember, entries for the competition are due by August 31, 2021.

Start the challenge today!
Now that you have some details about the challenge and rewards, it’s time to start your (migration) engines. Download the whitepaper from the Graviton Challenge landing page, familiarize yourself with the details, and off you go! And, if you do decide to enter the competition, good luck!

Footnote
In my role as a .NET Developer Advocate at AWS, I would be remiss if I failed to mention that this challenge is equally applicable to .NET applications using .NET Core or .NET 5 and later! In fact, .NET 5 includes ARM64-specific optimizations. For information about performance improvements my colleagues found for .NET applications running on AWS Graviton2, see the Powering .NET 5 with AWS Graviton2: Benchmarks blog post. There’s also a lab for .NET 5 on Graviton2. I invite you to check out the getting started material for .NET in the aws-graviton-getting-started GitHub repository and start migrating.

— Steve