By Akshay Sarma, Principal Engineer, Verizon Media & Brian Xiao, Software Engineer, Verizon Media
This is the first of an ongoing series of blog posts sharing releases and announcements for Bullet, an open-sourced lightweight, scalable, pluggable, multi-tenant query system.
Bullet allows you to query any data flowing through a streaming system without having to store it first through its UI or API. The queries are injected into the running system and have minimal overhead. Running hundreds of queries generally fit into the overhead of just reading the streaming data. Bullet requires running an instance of its backend on your data. This backend runs on common stream processing frameworks (Storm and Spark Streaming currently supported).
The data on which Bullet sits determines what it is used for. For example, our team runs an instance of Bullet on user engagement data (~1M events/sec) to let developers find their own events to validate their code that produces this data. We also use this instance to interactively explore data, throw up quick dashboards to monitor live releases, count unique users, debug issues, and more.
Since open sourcing Bullet in 2017, we’ve been hard at work adding many new features! We’ll highlight some of these here and continue sharing update posts for future releases.
Windowing
Bullet used to operate in a request-response fashion – you would submit a query and wait for the query to meet its termination conditions (usually duration) before receiving results. For short-lived queries, say, a few seconds, this was fine. But as we started fielding more interactive and iterative queries, waiting even a minute for results became too cumbersome.
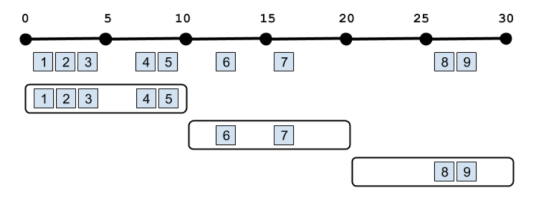
Enter windowing! Bullet now supports time and record-based windowing. With time windowing, you can break up your query into chunks of time over its duration and retrieve results for each chunk. For example, you can calculate the average of a field, and stream back results every second:
In the above example, the aggregation is operating on all the data since the beginning of the query, but you can also do aggregations on just the windows themselves. This is often called a Tumbling window:
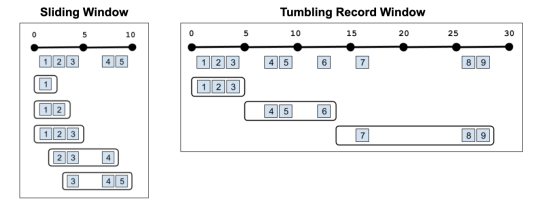
With record windowing, you can get the intermediate aggregation for each record that matches your query (a Sliding window). Or you can do a Tumbling window on records rather than time. For example, you could get results back every three records:
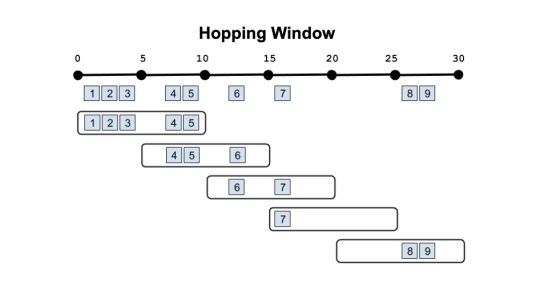
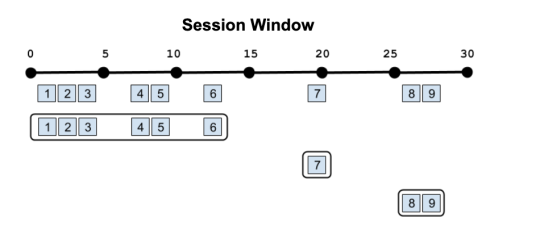
Overlapping windows in other ways (Hopping windows) or windows that reset based on different criteria (Session windows, Cascading windows) are currently being worked on. Stay tuned!
Apache Pulsar support as a native PubSub
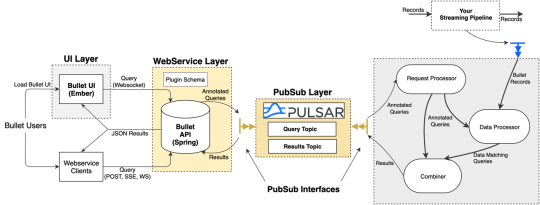
Bullet uses a PubSub (publish-subscribe) message queue to send queries and results between the Web Service and Backend. As with everything else in Bullet, the PubSub is pluggable. You can use your favorite pubsub by implementing a few interfaces if you don’t want to use the ones we provide. Until now, we’ve maintained and supported a REST-based PubSub and an Apache Kafka PubSub. Now we are excited to announce supporting Apache Pulsar as well! Bullet Pulsar will be useful to those users who want to use Pulsar as their underlying messaging service.
If you aren’t familiar with Pulsar, setting up a local standalone is very simple, and by default, any Pulsar topics written to will automatically be created. Setting up an instance of Bullet with Pulsar instead of REST or Kafka is just as easy. You can refer to our documentation for more details.
Plug your data into Bullet without code
While Bullet worked on any data source located in any persistence layer, you still had to implement an interface to connect your data source to the Backend and convert it into a record container format that Bullet understands. For instance, your data might be located in Kafka and be in the Avro format. If you were using Bullet on Storm, you would perhaps write a Storm Spout to read from Kafka, deserialize, and convert the Avro data into the Bullet record format. This was the only interface in Bullet that required our customers to write their own code. Not anymore! Bullet DSL is a text/configuration-based format for users to plug in their data to the Bullet Backend without having to write a single line of code.
Bullet DSL abstracts away the two major components for plugging data into the Bullet Backend. A Connector piece to read from arbitrary data-sources and a Converter piece to convert that read data into the Bullet record container. We currently support and maintain a few of these – Kafka and Pulsar for Connectors and Avro, Maps and arbitrary Java POJOs for Converters. The Converters understand typed data and can even do a bit of minor ETL (Extract, Transform and Load) if you need to change your data around before feeding it into Bullet. As always, the DSL components are pluggable and you can write your own (and contribute it back!) if you need one that we don’t support.
We appreciate your feedback and contributions! Explore Bullet on GitHub, use and help contribute to the project, and chat with us on Google Groups. To get started, try our Quickstarts on Spark or Storm to set up an instance of Bullet on some fake data and play around with it.
By Mohit Goenka, Gnanavel Shanmugam, and Lance Welsh
At Yahoo Mail, we’re constantly striving to upgrade our product experience. We do this not only by adding new features based on our members’ feedback, but also by providing the best technical solutions to power the most engaging experiences. As such, we’ve recently introduced a number of novel and unique revisions to the way in which we use Redux that have resulted in significant stability and performance improvements. Developers may find our methods useful in achieving similar results in their apps.
Improvements to product metrics
Last year Yahoo Mail implemented a brand new architecture using Redux. Since then, we have transformed the overall architecture to reduce latencies in various operations, reduce JavaScript exceptions, and better synchronized states. As a result, the product is much faster and more stable.
Stability improvements:
when checking for new emails – 20%
when reading emails – 30%
when sending emails – 20%
Performance improvements:
10% improvement in page load performance
40% improvement in frame rendering time
We have also reduced API calls by approximately 20%.
How we use Redux in Yahoo Mail
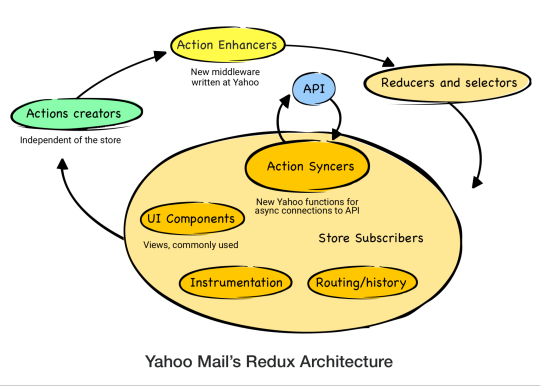
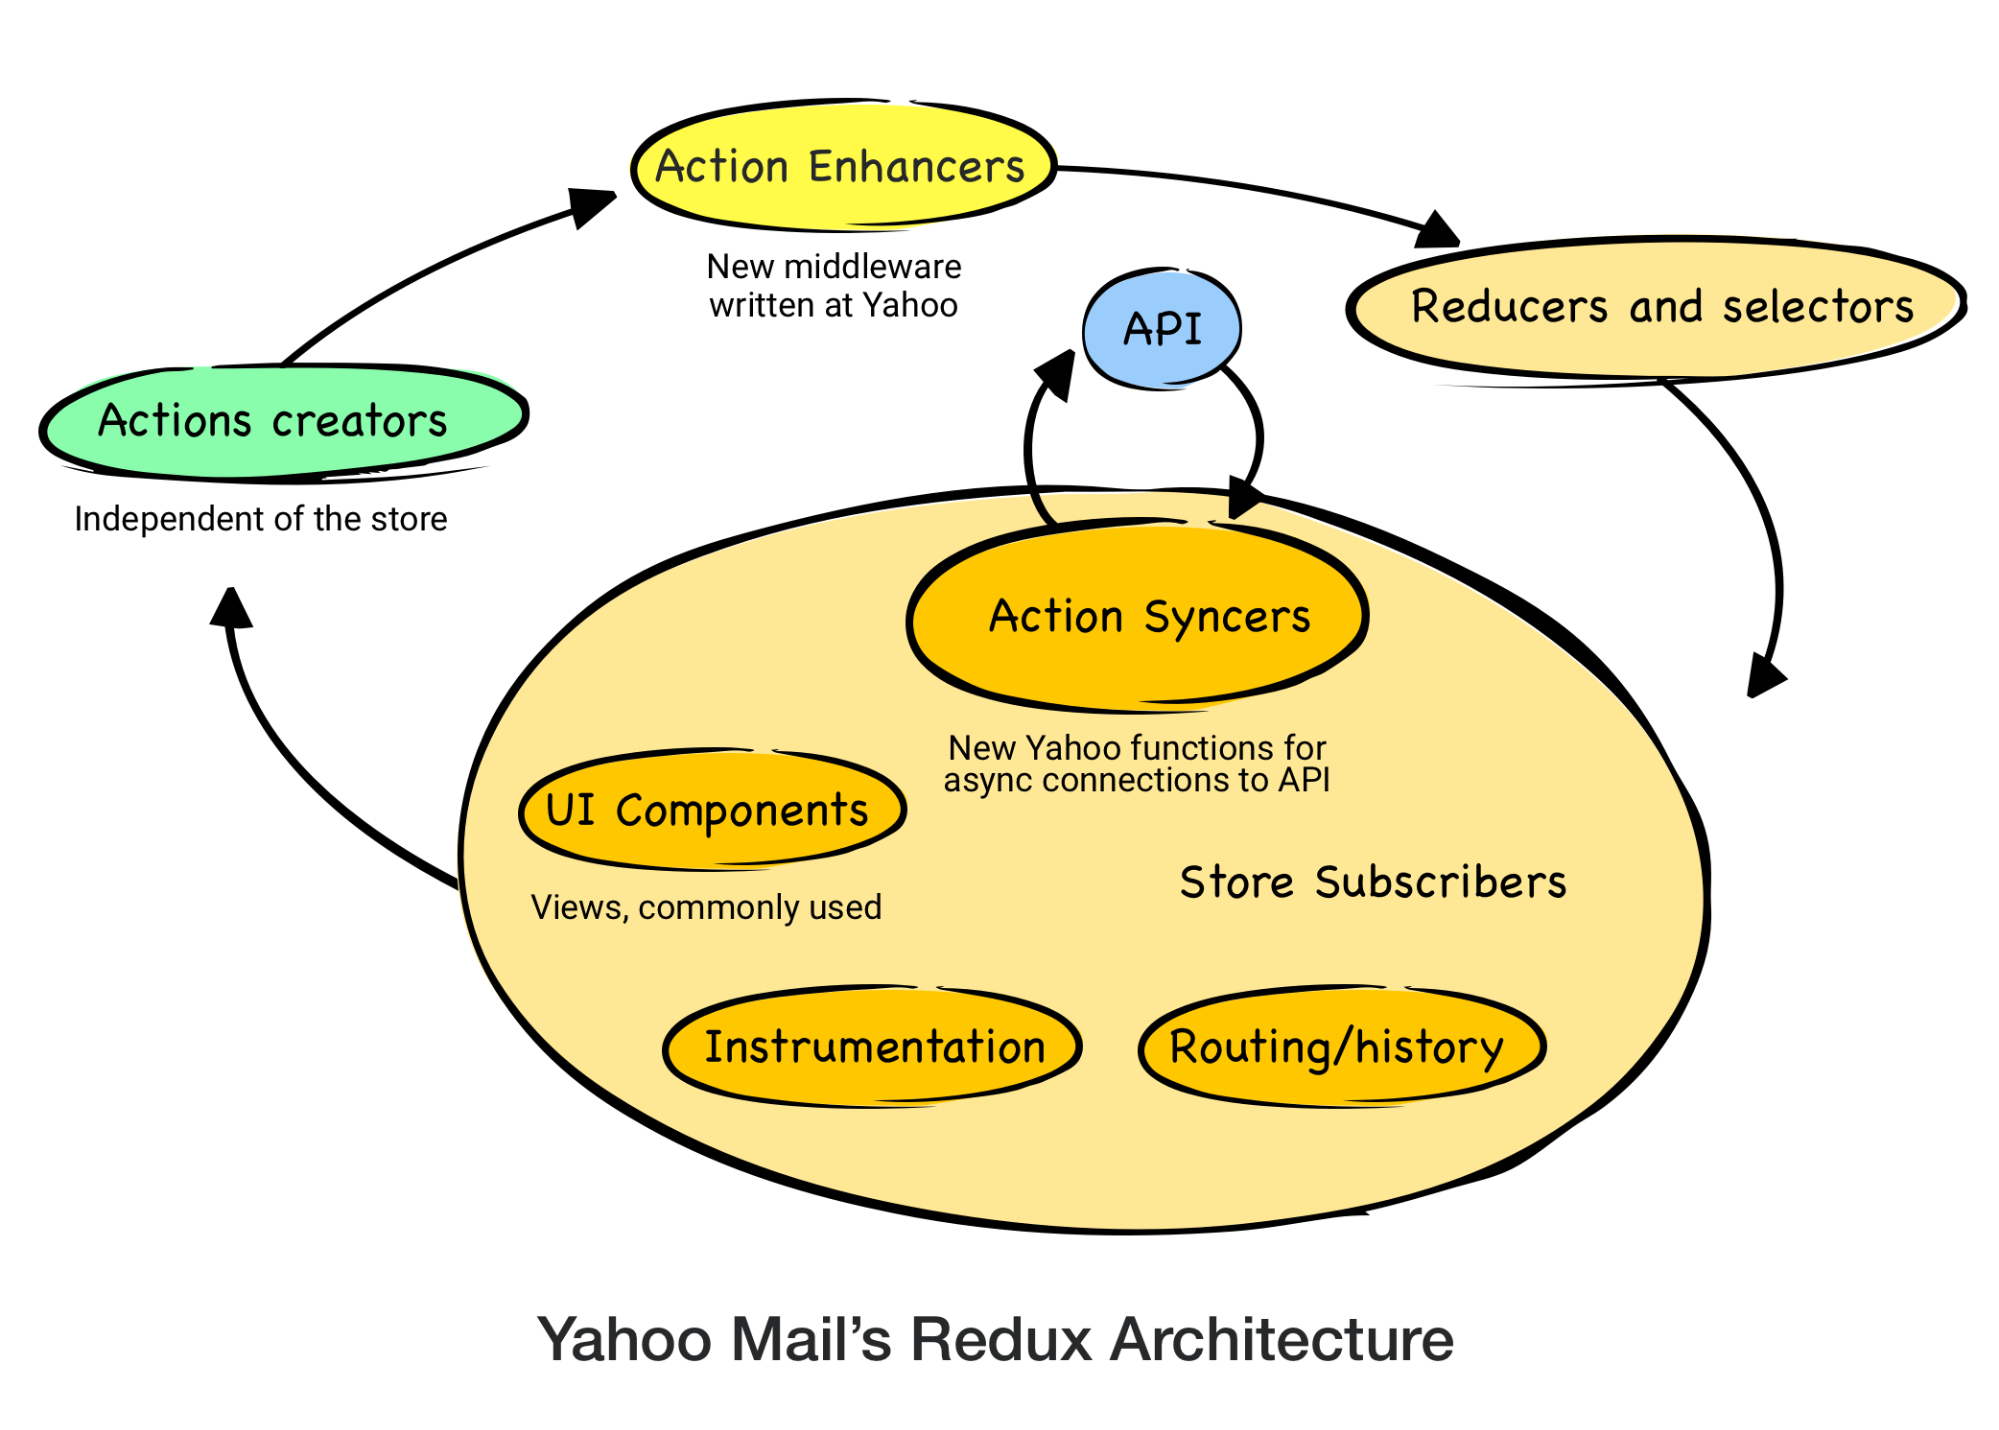
Redux architecture is reliant on one large store that represents the application state. In a Redux cycle, action creators dispatch actions to change the state of the store. React Components then respond to those state changes. We’ve made some modifications on top of this architecture that are atypical in the React-Redux community.
For instance, when fetching data over the network, the traditional methodology is to use Thunk middleware. Yahoo Mail fetches data over the network from our API. Thunks would create an unnecessary and undesirable dependency between the action creators and our API. If and when the API changes, the action creators must then also change. To keep these concerns separate we dispatch the action payload from the action creator to store them in the Redux state for later processing by “action syncers”. Action syncers use the payload information from the store to make requests to the API and process responses. In other words, the action syncers form an API layer by interacting with the store. An additional benefit to keeping the concerns separate is that the API layer can change as the backend changes, thereby preventing such changes from bubbling back up into the action creators and components. This also allowed us to optimize the API calls by batching, deduping, and processing the requests only when the network is available. We applied similar strategies for handling other side effects like route handling and instrumentation. Overall, action syncers helped us to reduce our API calls by ~20% and bring down API errors by 20-30%.
Another change to the normal Redux architecture was made to avoid unnecessary props. The React-Redux community has learned to avoid passing unnecessary props from high-level components through multiple layers down to lower-level components (prop drilling) for rendering. We have introduced action enhancers middleware to avoid passing additional unnecessary props that are purely used when dispatching actions. Action enhancers add data to the action payload so that data does not have to come from the component when dispatching the action. This avoids the component from having to receive that data through props and has improved frame rendering by ~40%. The use of action enhancers also avoids writing utility functions to add commonly-used data to each action from action creators.
In our new architecture, the store reducers accept the dispatched action via action enhancers to update the state. The store then updates the UI, completing the action cycle. Action syncers then initiate the call to the backend APIs to synchronize local changes.
Conclusion
Our novel use of Redux in Yahoo Mail has led to significant user-facing benefits through a more performant application. It has also reduced development cycles for new features due to its simplified architecture. We’re excited to share our work with the community and would love to hear from anyone interested in learning more.
Kuhu Shukla (bottom center) and team at the 2017 DataWorks Summit
By Kuhu Shukla
This post first appeared here on the Apache Software Foundation blog as part of ASF’s “Success at Apache” monthly blog series.
As I sit at my desk on a rather frosty morning with my coffee, looking up new JIRAs from the previous day in the Apache Tez project, I feel rather pleased. The latest community release vote is complete, the bug fixes that we so badly needed are in and the new release that we tested out internally on our many thousand strong cluster is looking good. Today I am looking at a new stack trace from a different Apache project process and it is hard to miss how much of the exceptional code I get to look at every day comes from people all around the globe. A contributor leaves a JIRA comment before he goes on to pick up his kid from soccer practice while someone else wakes up to find that her effort on a bug fix for the past two months has finally come to fruition through a binding +1.
Yahoo – which joined AOL, HuffPost, Tumblr, Engadget, and many more brands to form the Verizon subsidiary Oath last year – has been at the frontier of open source adoption and contribution since before I was in high school. So while I have no historical trajectories to share, I do have a story on how I found myself in an epic journey of migrating all of Yahoo jobs from Apache MapReduce to Apache Tez, a then-new DAG based execution engine.
Oath grid infrastructure is through and through driven by Apache technologies be it storage through HDFS, resource management through YARN, job execution frameworks with Tez and user interface engines such as Hive, Hue, Pig, Sqoop, Spark, Storm. Our grid solution is specifically tailored to Oath’s business-critical data pipeline needs using the polymorphic technologies hosted, developed and maintained by the Apache community.
On the third day of my job at Yahoo in 2015, I received a YouTube link on An Introduction to Apache Tez. I watched it carefully trying to keep up with all the questions I had and recognized a few names from my academic readings of Yarn ACM papers. I continued to ramp up on YARN and HDFS, the foundational Apache technologies Oath heavily contributes to even today. For the first few weeks I spent time picking out my favorite (necessary) mailing lists to subscribe to and getting started on setting up on a pseudo-distributed Hadoop cluster. I continued to find my footing with newbie contributions and being ever more careful with whitespaces in my patches. One thing was clear – Tez was the next big thing for us. By the time I could truly call myself a contributor in the Hadoop community nearly 80-90% of the Yahoo jobs were now running with Tez. But just like hiking up the Grand Canyon, the last 20% is where all the pain was. Being a part of the solution to this challenge was a happy prospect and thankfully contributing to Tez became a goal in my next quarter.
The next sprint planning meeting ended with me getting my first major Tez assignment – progress reporting. The progress reporting in Tez was non-existent – “Just needs an API fix,” I thought. Like almost all bugs in this ecosystem, it was not easy. How do you define progress? How is it different for different kinds of outputs in a graph? The questions were many.
I, however, did not have to go far to get answers. The Tez community actively came to a newbie’s rescue, finding answers and posing important questions. I started attending the bi-weekly Tez community sync up calls and asking existing contributors and committers for course correction. Suddenly the team was much bigger, the goals much more chiseled. This was new to anyone like me who came from the networking industry, where the most open part of the code are the RFCs and the implementation details are often hidden. These meetings served as a clean room for our coding ideas and experiments. Ideas were shared, to the extent of which data structure we should pick and what a future user of Tez would take from it. In between the usual status updates and extensive knowledge transfers were made.
Oath uses Apache Pig and Apache Hive extensively and most of the urgent requirements and requests came from Pig and Hive developers and users. Each issue led to a community JIRA and as we started running Tez at Oath scale, new feature ideas and bugs around performance and resource utilization materialized. Every year most of the Hadoop team at Oath travels to the Hadoop Summit where we meet our cohorts from the Apache community and we stand for hours discussing the state of the art and what is next for the project. One such discussion set the course for the next year and a half for me.
We needed an innovative way to shuffle data. Frameworks like MapReduce and Tez have a shuffle phase in their processing lifecycle wherein the data from upstream producers is made available to downstream consumers. Even though Apache Tez was designed with a feature set corresponding to optimization requirements in Pig and Hive, the Shuffle Handler Service was retrofitted from MapReduce at the time of the project’s inception. With several thousands of jobs on our clusters leveraging these features in Tez, the Shuffle Handler Service became a clear performance bottleneck. So as we stood talking about our experience with Tez with our friends from the community, we decided to implement a new Shuffle Handler for Tez. All the conversation points were tracked now through an umbrella JIRA TEZ-3334 and the to-do list was long. I picked a few JIRAs and as I started reading through I realized, this is all new code I get to contribute to and review. There might be a better way to put this, but to be honest it was just a lot of fun! All the whiteboards were full, the team took walks post lunch and discussed how to go about defining the API. Countless hours were spent debugging hangs while fetching data and looking at stack traces and Wireshark captures from our test runs. Six months in and we had the feature on our sandbox clusters. There were moments ranging from sheer frustration to absolute exhilaration with high fives as we continued to address review comments and fixing big and small issues with this evolving feature.
As much as owning your code is valued everywhere in the software community, I would never go on to say “I did this!” In fact, “we did!” It is this strong sense of shared ownership and fluid team structure that makes the open source experience at Apache truly rewarding. This is just one example. A lot of the work that was done in Tez was leveraged by the Hive and Pig community and cross Apache product community interaction made the work ever more interesting and challenging. Triaging and fixing issues with the Tez rollout led us to hit a 100% migration score last year and we also rolled the Tez Shuffle Handler Service out to our research clusters. As of last year we have run around 100 million Tez DAGs with a total of 50 billion tasks over almost 38,000 nodes.
In 2018 as I move on to explore Hadoop 3.0 as our future release, I hope that if someone outside the Apache community is reading this, it will inspire and intrigue them to contribute to a project of their choice. As an astronomy aficionado, going from a newbie Apache contributor to a newbie Apache committer was very much like looking through my telescope - it has endless possibilities and challenges you to be your best.
About the Author:
Kuhu Shukla is a software engineer at Oath and did her Masters in Computer Science at North Carolina State University. She works on the Big Data Platforms team on Apache Tez, YARN and HDFS with a lot of talented Apache PMCs and Committers in Champaign, Illinois. A recent Apache Tez Committer herself she continues to contribute to YARN and HDFS and spoke at the 2017 Dataworks Hadoop Summit on “Tez Shuffle Handler: Shuffling At Scale With Apache Hadoop”. Prior to that she worked on Juniper Networks’ router and switch configuration APIs. She likes to participate in open source conferences and women in tech events. In her spare time she loves singing Indian classical and jazz, laughing, whale watching, hiking and peering through her Dobsonian telescope.
When it comes to performance and reliability, there is perhaps no application where this matters more than with email. Today, we announced a new Yahoo Mail experience for desktop based on a completely rewritten tech stack that embodies these fundamental considerations and more.
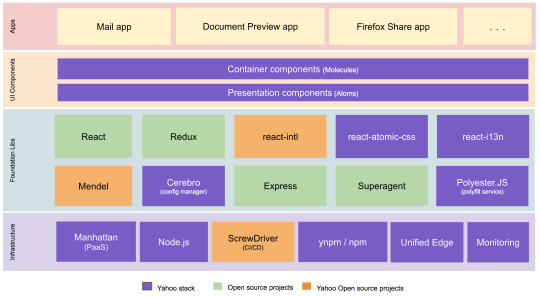
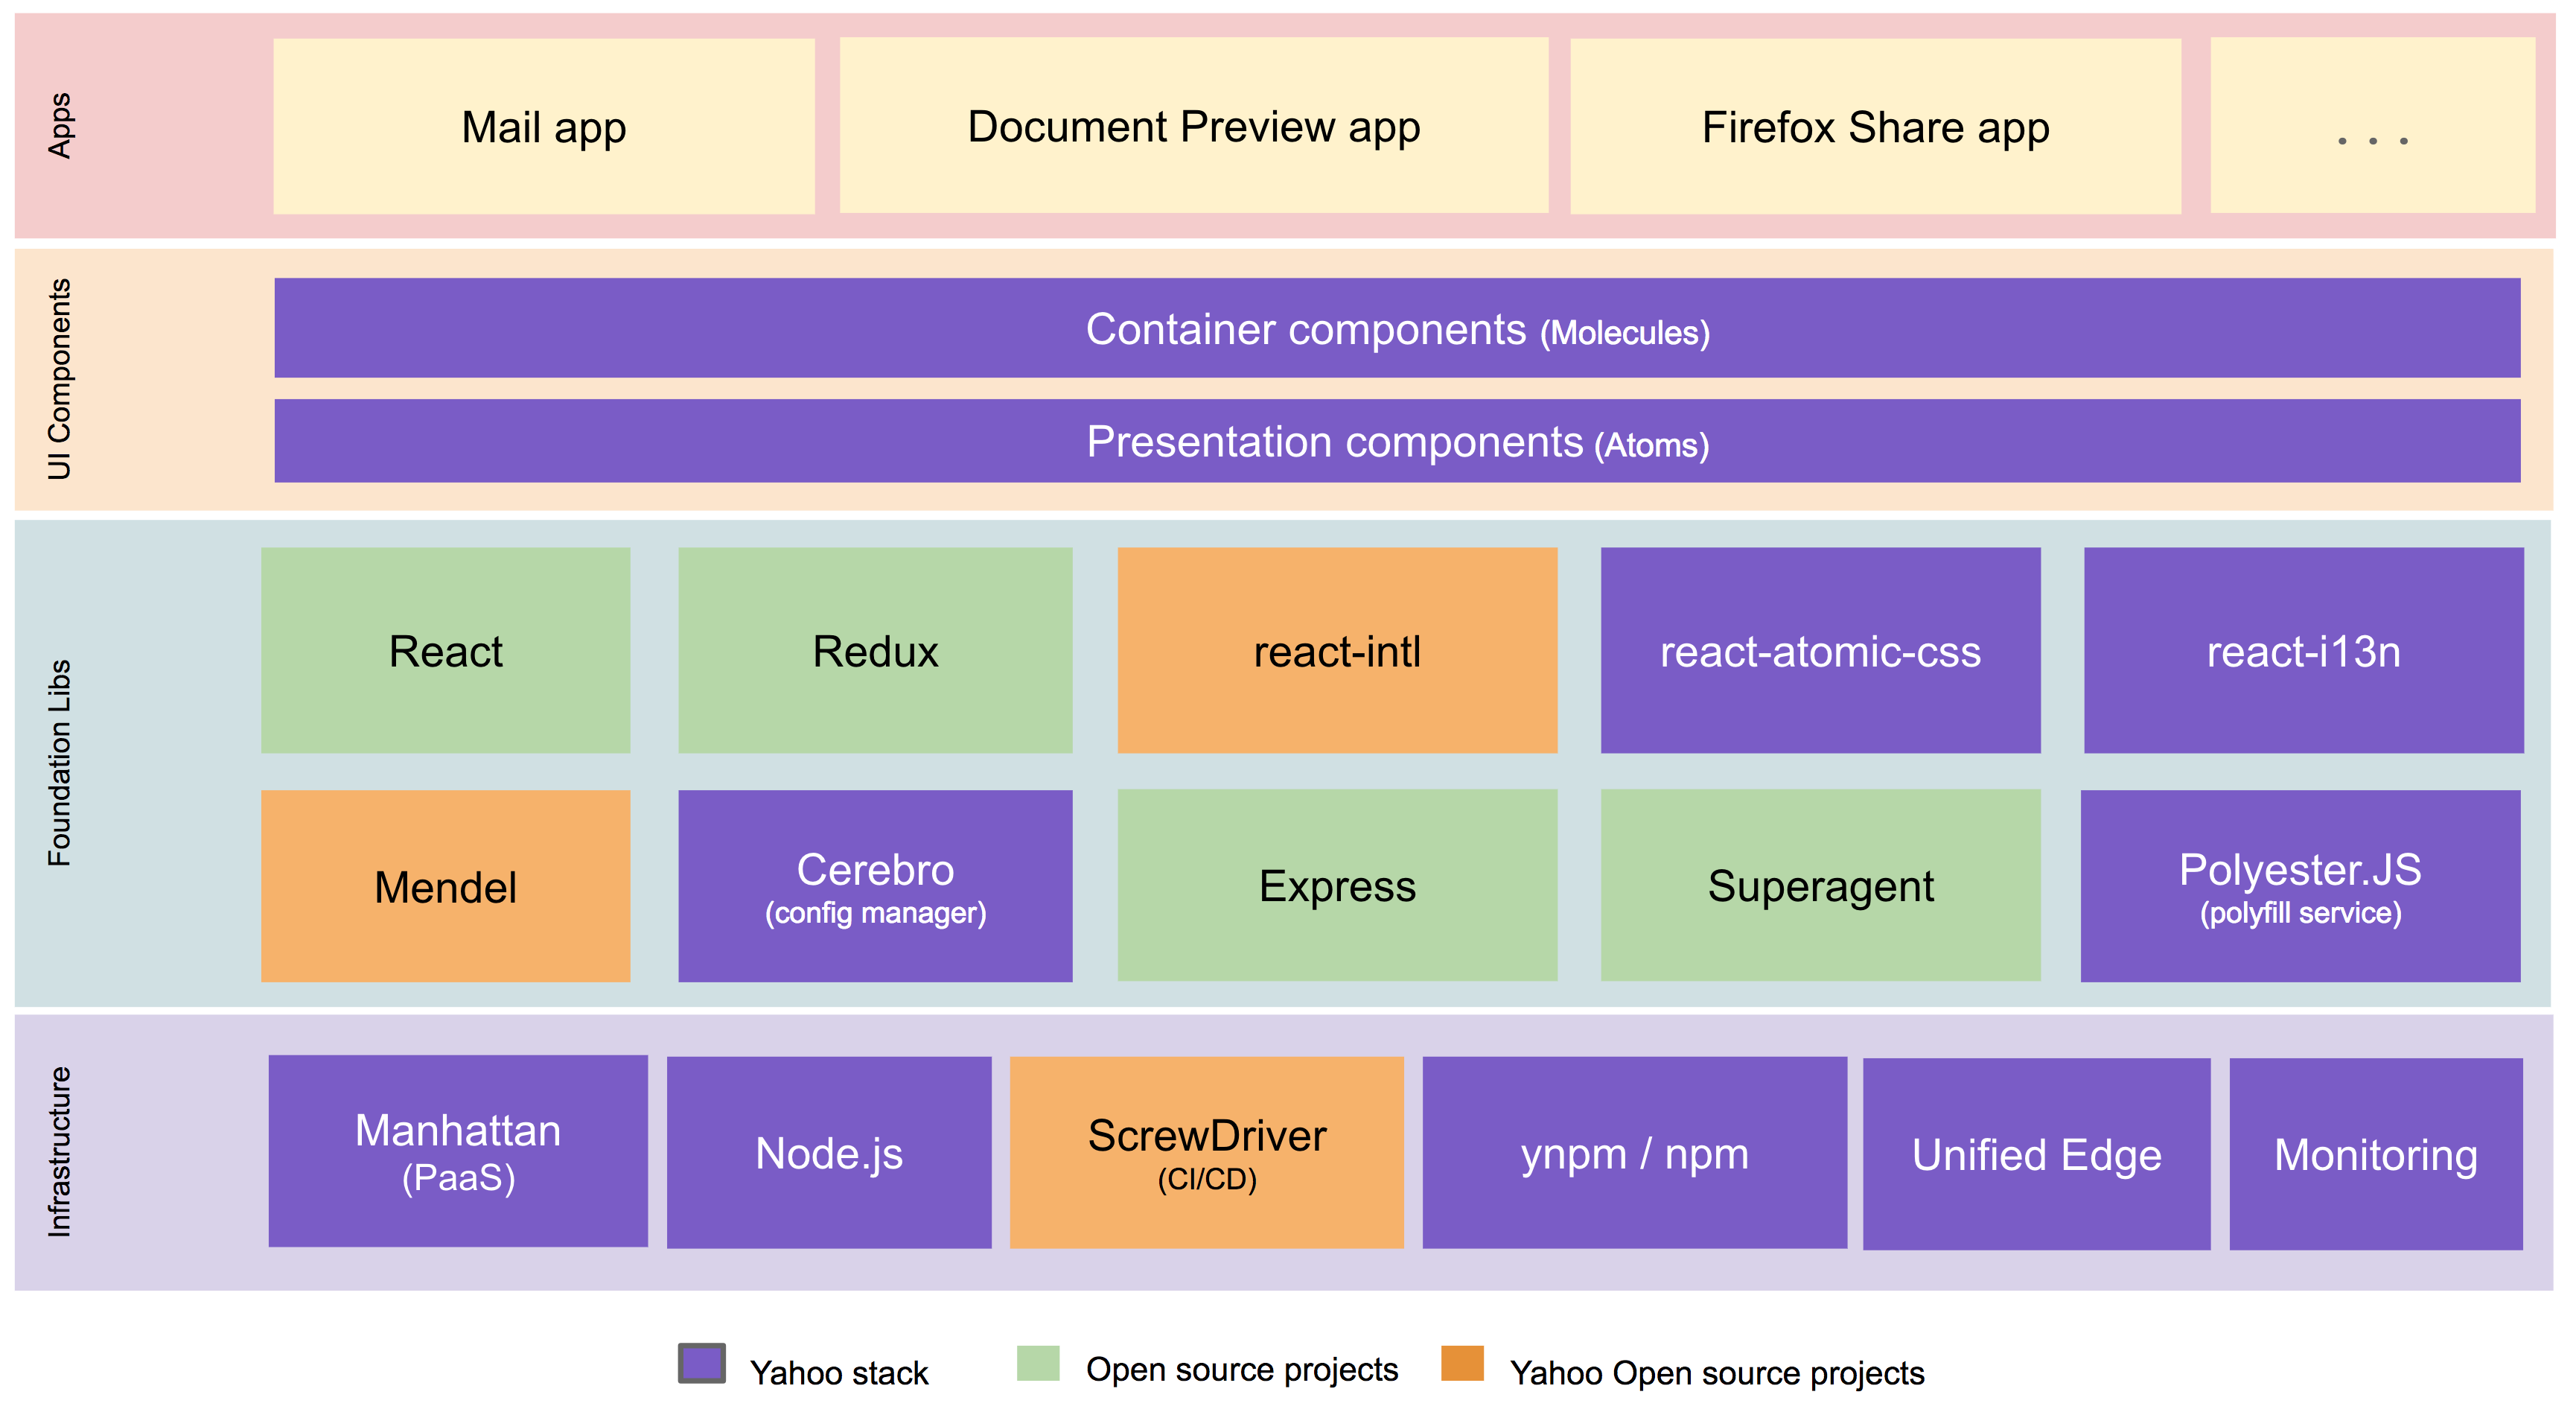
We built the new Yahoo Mail experience using a best-in-class front-end tech stack with open source technologies including React, Redux, Node.js, react-intl (open-sourced by Yahoo), and others. A high-level architectural diagram of our stack is below.
New Yahoo Mail Tech Stack
In building our new tech stack, we made use of the most modern tools available in the industry to come up with the best experience for our users by optimizing the following fundamentals:
Performance
A key feature of the new Yahoo Mail architecture is blazing-fast initial loading (aka, launch).
We introduced new network routing which sends users to their nearest geo-located email servers (proximity-based routing). This has resulted in a significant reduction in time to first byte and should be immediately noticeable to our international users in particular.
We now do server-side rendering to allow our users to see their mail sooner. This change will be immediately noticeable to our low-bandwidth users. Our application is isomorphic, meaning that the same code runs on the server (using Node.js) and the client. Prior versions of Yahoo Mail had programming logic duplicated on the server and the client because we used PHP on the server and JavaScript on the client.
Using efficient bundling strategies (JavaScript code is separated into application, vendor, and lazy loaded bundles) and pushing only the changed bundles during production pushes, we keep the cache hit ratio high. By using react-atomic-css, our homegrown solution for writing modular and scoped CSS in React, we get much better CSS reuse.
In prior versions of Yahoo Mail, the need to run various experiments in parallel resulted in additional branching and bloating of our JavaScript and CSS code. While rewriting all of our code, we solved this issue using Mendel, our homegrown solution for bucket testing isomorphic web apps, which we have open sourced.
Rather than using custom libraries, we use native HTML5 APIs and ES6 heavily and use PolyesterJS, our homegrown polyfill solution, to fill the gaps. These factors have further helped us to keep payload size minimal.
With all the above optimizations, we have been able to reduce our JavaScript and CSS footprint by approximately 50% compared to the previous desktop version of Yahoo Mail, helping us achieve a blazing-fast launch.
In addition to initial launch improvements, key features like search and message read (when a user opens an email to read it) have also benefited from the above optimizations and are considerably faster in the latest version of Yahoo Mail.
We also significantly reduced the memory consumed by Yahoo Mail on the browser. This is especially noticeable during a long running session.
Reliability
With this new version of Yahoo Mail, we have a 99.99% success rate on core flows: launch, message read, compose, search, and actions that affect messages. Accomplishing this over several billion user actions a day is a significant feat. Client-side errors (JavaScript exceptions) are reduced significantly when compared to prior Yahoo Mail versions.
Product agility and launch velocity
We focused on independently deployable components. As part of the re-architecture of Yahoo Mail, we invested in a robust continuous integration and delivery flow. Our new pipeline allows for daily (or more) pushes to all Mail users, and we push only the bundles that are modified, which keeps the cache hit ratio high.
Developer effectiveness and satisfaction
In developing our tech stack for the new Yahoo Mail experience, we heavily leveraged open source technologies, which allowed us to ensure a shorter learning curve for new engineers. We were able to implement a consistent and intuitive onboarding program for 30+ developers and are now using our program for all new hires. During the development process, we emphasise predictable flows and easy debugging.
Accessibility
The accessibility of this new version of Yahoo Mail is state of the art and delivers outstanding usability (efficiency) in addition to accessibility. It features six enhanced visual themes that can provide accommodation for people with low vision and has been optimized for use with Assistive Technology including alternate input devices, magnifiers, and popular screen readers such as NVDA and VoiceOver. These features have been rigorously evaluated and incorporate feedback from users with disabilities. It sets a new standard for the accessibility of web-based mail and is our most-accessible Mail experience yet.
Open source
We have open sourced some key components of our new Mail stack, like Mendel, our solution for bucket testing isomorphic web applications. We invite the community to use and build upon our code. Going forward, we plan on also open sourcing additional components like react-atomic-css, our solution for writing modular and scoped CSS in React, and lazy-component, our solution for on-demand loading of resources.
Many of our company’s best technical minds came together to write a brand new tech stack and enable a delightful new Yahoo Mail experience for our users.
We encourage our users and engineering peers in the industry to test the limits of our application, and to provide feedback by clicking on the Give Feedback call out in the lower left corner of the new version of Yahoo Mail.
By Michael Natkovich, Akshai Sarma, Nathan Speidel, Marcus Svedman, and Cat Utah
Big Data is no longer just Apache server logs. Nowadays, the data may be user engagement data, performance metrics, IoT (Internet of Things) data, or something else completely atypical. Regardless of the size of the data, or the type of querying patterns on it (exploratory, ad-hoc, periodic, long-term, etc.), everyone wants queries to be as fast as possible and cheap to run in terms of resources. Data can be broadly split into two kinds: the streaming (generally real-time) kind or the batched-up-over-a-time-interval (e.g., hourly or daily) kind. The batch version is typically easier to query since it is stored somewhere like a data warehouse that has nice SQL-like interfaces or an easy to use UI provided by tools such as Tableau, Looker, or Superset. Running arbitrary queries on streaming data quickly and cheaply though, is generally much harder… until now. Today, we are pleased to share our newly open sourced, forward-looking general purpose query engine, called Bullet, with the community on GitHub.
With Bullet, you can:
Powerful and nested filtering
Fetching raw data records
Aggregating data using Group Bys (Sum, Count, Average, etc.), Count Distincts, Top Ks
Getting distributions of fields like Percentiles or Frequency histograms
One of the key differences between how Bullet queries data and the standard querying paradigm is that Bullet does not store any data. In most other systems where you have a persistence layer (including in-memory storage), you are doing a look-back when you query the layer. Instead, Bullet operates on data flowing through the system after the query is started – it’s a look-forward system that doesn’t need persistence. On a real-time data stream, this means that Bullet is querying data after the query is submitted. This also means that Bullet does not query any data that has already passed through the stream. The fact that Bullet does not rely on a persistence layer is exactly what makes it extremely lightweight and cheap to run.
To see why this is better for the kinds of use cases Bullet is meant for – such as quickly looking at some metric, checking some assumption, iterating on a query, checking the status of something right now, etc. – consider the following: if you had a 1000 queries in a traditional query system that operated on the same data, these query systems would most likely scan the data 1000 times each. By the very virtue of it being forward looking, 1000 queries in Bullet scan the data only once because the arrival of the query determines and fixes the data that it will see. Essentially, the data is coming to the queries instead of the queries being farmed out to where the data is. When the conditions of the query are satisfied (usually a time window or a number of events), the query terminates and returns you the result.
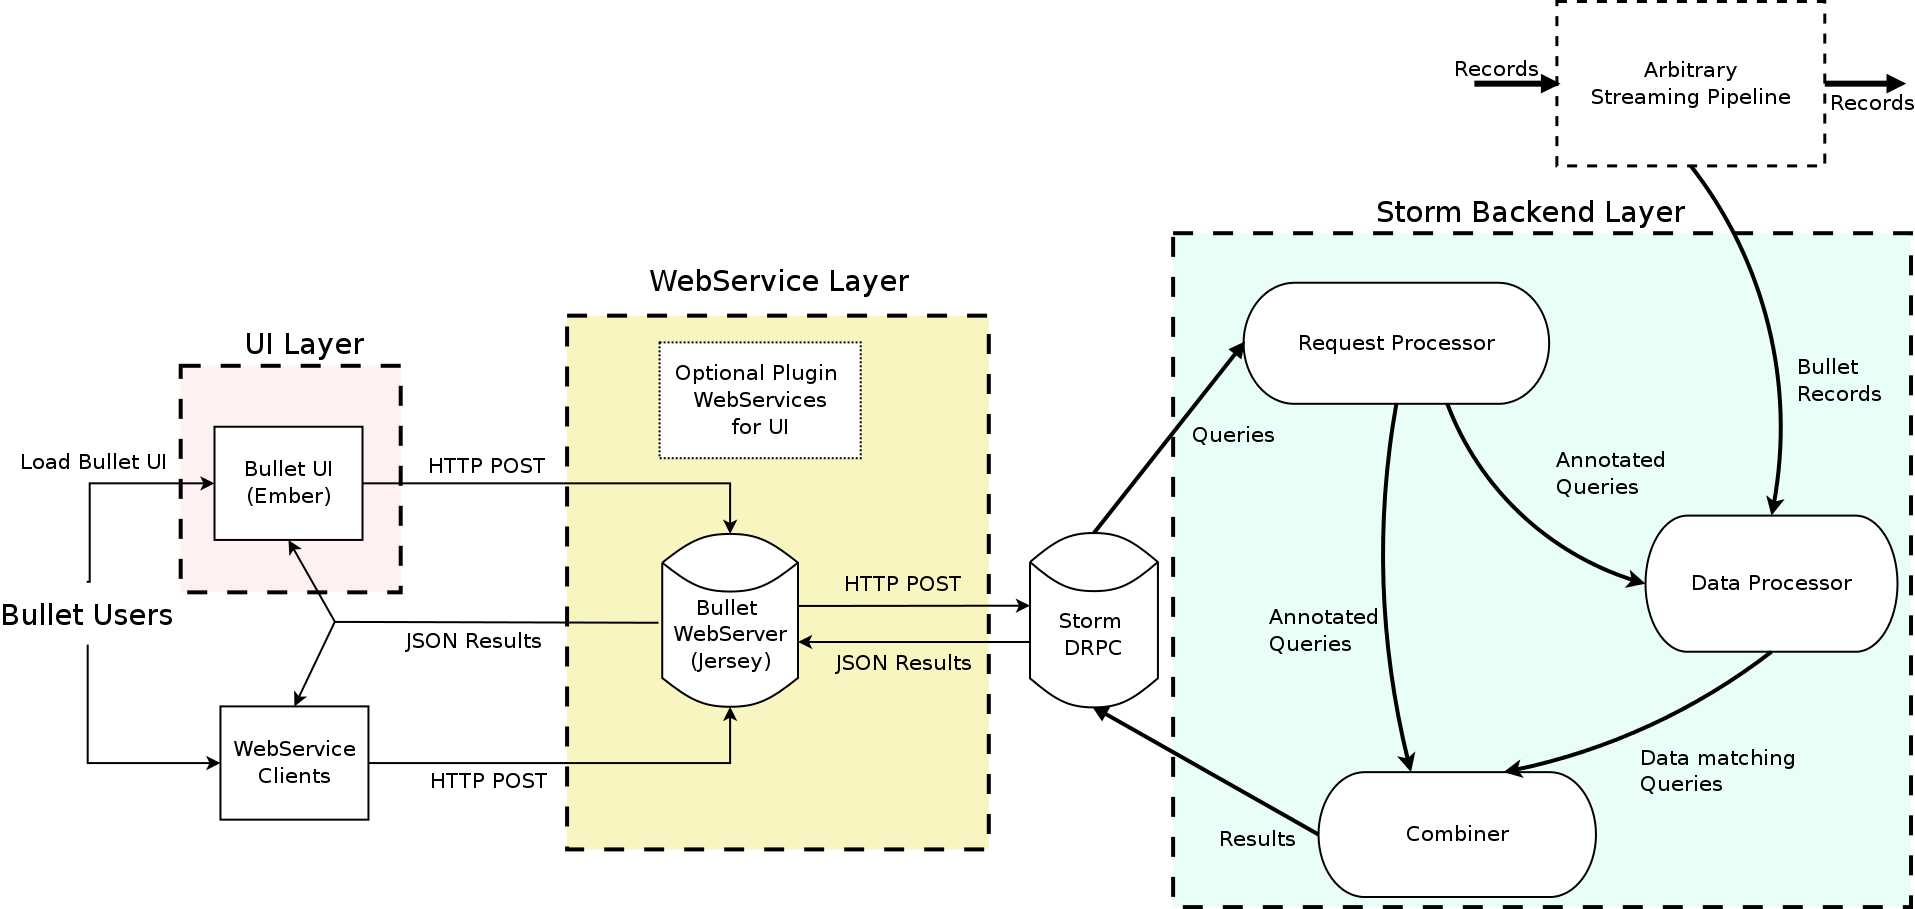
A Brief Architecture Overview
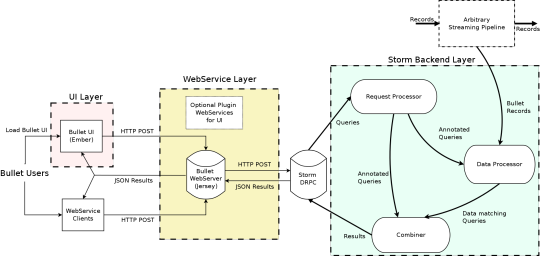
High Level Bullet Architecture
The Bullet architecture is multi-tenant, can scale linearly for more queries and/or more data, and has been tested to handle 700+ simultaneous queries on a data stream that had up to 1.5 million records per second, or 5-6 GB/s. Bullet is currently implemented on top of Storm and can be extended to support other stream processing engines as well, like Spark Streaming or Flink. Bullet is pluggable, so you can plug in any source of data that can be read in Storm by implementing a simple data container interface to let Bullet work with it.
The UI, web service, and the backend layers constitute your standard three-tier architecture. The Bullet backend can be split into three main subsystems:
Request Processor – receives queries, adds metadata, and sends it to the rest of the system
Data Processor – reads data from an input stream, converts it to a unified data format, and matches it against queries
Combiner – combines results for different queries, performs final aggregations, and returns results
The web service can be deployed on any servlet container, like Jetty. The UI is a Node-based Ember application that runs in the client browser. Our full documentation contains all the details on exactly how we perform computationally-intractable queries like Count Distincts on fields with cardinality in the millions, etc. (DataSketches).
Usage at Yahoo
An instance of Bullet is currently running at Yahoo in production against a small subset of Yahoo’s user engagement data stream. This data is roughly 100,000 records per second and is about 130 MB/s compressed. Bullet queries this with about 100 CPU Virtual Cores and 120 GB of RAM. This fits on less than 2 of our (64 Virtual Cores, 256 GB RAM each) test Storm cluster machines.
One of the most popular use cases at Yahoo is to use Bullet to manually validate the instrumentation of an app or web application. Instrumentation produces user engagement data like clicks, views, swipes, etc. Since this data powers everything we do from analytics to personalization to targeting, it is absolutely critical that the data is correct. The usage pattern is generally to:
Submit a Bullet query to obtain data associated with your mobile device or browser (filter on a cookie value or mobile device ID)
Open and use the application to generate the data while the Bullet query is running
Go back to Bullet and inspect the data
In addition, Bullet is also used programmatically in continuous delivery pipelines for functional testing instrumentation on product releases. Product usage is simulated, then data is generated and validated in seconds using Bullet. Bullet is orders of magnitude faster to use for this kind of validation and for general data exploration use cases, as opposed to waiting for the data to be available in Hive or other systems. The Bullet UI supports pivot tables and a multitude of charting options that may speed up analysis further compared to other querying options.
We also use Bullet to do a bunch of other interesting things, including instances where we dynamically compute cardinalities (using a Count Distinct Bullet query) of fields as a check to protect systems that can’t support extremely high cardinalities for fields like Druid.
What you do with Bullet is entirely determined by the data you put it on. If you put it on data that is essentially some set of performance metrics (data center statistics for example), you could be running a lot of queries that find the 95th and 99th percentile of a metric. If you put it on user engagement data, you could be validating instrumentation and mostly looking at raw data.
We hope you will find Bullet interesting and tell us how you use it. If you find something you want to change, improve, or fix, your contributions and ideas are always welcome! You can contact us here.
Today, we are pleased to offer Daytona, an open-source framework for automated performance testing and analysis, to the community. Daytona is an application-agnostic framework to conduct integrated performance testing and analysis with repeatable test execution, standardized reporting, and built-in profiling support.
Daytona gives you the capability to build a customized test harness in a single, unified framework to test and analyze the performance of any application. You’ll get easy repeatability, consistent reporting, and the ability to capture trends. Daytona’s UI accepts a performance testing script that can run on a command line. This includes websites, databases, networks, or any workload you need to test and tune for performance. You can submit tests to the scheduler queue from the Daytona UI or from your CI/CD tool. You can deploy Daytona as a hosted service in your on-prem environment or on the public cloud of your choice. In fact, you can even host test harnesses for multiple applications with a single centralized service so that developers, architects, and systems engineers from different parts of your organization can work together on a unified view and manage your performance analysis on a continuous basis.
Daytona’s differentiation lies in its ability to aggregate and present essential aspects of application, system, and hardware performance metrics with a simple and unified user interface. This helps you maintain your focus on performance analysis without changing context across various sources and formats of data. The overall goal of performance analysis is to find ways of maximizing application throughput with minimum hardware resource and the best user experience. Metrics and insights from Daytona help achieve this objective.
Prior to Daytona, we created multiple, heterogenous performance tools to meet the specific needs of various applications. This meant that we often stored test results inconsistently, making it harder to analyze performance in a comprehensive manner. We had a difficult time sharing results and analyzing differences in test runs in a standard manner, which could lead to confusion.
With Daytona, we are now able to integrate all our load testing tools under a single framework and aggregate test results in one common central repository. We are gaining insight into the performance characteristics of many of our applications on a continuous basis. These insights help us optimize our applications which results in better utilization of our hardware resources and helps improve user experience by reducing the latency to serve end-user requests. Ultimately, Daytona helps us reduce capital expenditure on our large-scale infrastructure and makes our applications more robust under load. Sharing performance results in a common format encourages the use of common optimization techniques that we can leverage across many different applications.
Daytona was built knowing that we would want to publish it as open source and share the technology with the community for validation and improvement of the framework. We hope the community can help extend its use cases and make it suitable for an even broader set of applications and workloads.
Architecture
Daytona is comprised of a centralized scheduler, a distributed set of agents running on SUTs (systems under test), a MySQL database to store all metadata for tests, and a PHP-based UI. A test harness can be customized by answering a simple set of questions about the application/workload. A test can be submitted to Daytona’s queue through the UI or through a CLI (Command Line Interface) from the CI/CD system. The scheduler process polls the database for a test to be run and sends all the actions associated with the execution of the test to the agent running on a SUT. An agent process executes the test, collects application and system performance metrics, and sends the metrics back as a package to the scheduler. The scheduler saves the test metadata in the database and test results in the local file system. Tests from multiple harnesses proceed concurrently.
Architecture and Life Cycle Of A Test
Looking Forward
Our goal is to integrate Daytona with popular open source CI/CD tools and we welcome contributions from the community to make that happen. It is available under Apache License Version 2.0. To evaluate Daytona, we provide simple instructions to deploy it on your in-house bare metal, VM, or public cloud infrastructure. We also provide instructions so you can quickly have a test and development environment up and running on your laptop with Docker. Please join us on the path of making application performance analysis an enjoyable and insightful experience. Visit the Daytona Yahoo repo to get started!
The collective thoughts of the interwebz
Manage Consent
To provide the best experiences, we use technologies like cookies to store and/or access device information. Consenting to these technologies will allow us to process data such as browsing behavior or unique IDs on this site. Not consenting or withdrawing consent, may adversely affect certain features and functions.
Functional
Always active
The technical storage or access is strictly necessary for the legitimate purpose of enabling the use of a specific service explicitly requested by the subscriber or user, or for the sole purpose of carrying out the transmission of a communication over an electronic communications network.
Preferences
The technical storage or access is necessary for the legitimate purpose of storing preferences that are not requested by the subscriber or user.
Statistics
The technical storage or access that is used exclusively for statistical purposes.The technical storage or access that is used exclusively for anonymous statistical purposes. Without a subpoena, voluntary compliance on the part of your Internet Service Provider, or additional records from a third party, information stored or retrieved for this purpose alone cannot usually be used to identify you.
Marketing
The technical storage or access is required to create user profiles to send advertising, or to track the user on a website or across several websites for similar marketing purposes.