As a founder of a security company, I’m constantly looking for open source tools to either incorporate in our offering, or get inspiration from, or provide integration with. And there are dozens of great open source security tools, so I decided to publish a list of them. This plethora of options is one of the reasons that security is so hard – they are many different ways to achieve something and it almost always involves headaches with configuring and connecting various “point solutions” (as marketers call them). So here’s the list in on apparent order (note that I’ve listed only defensive tools, offensive ones like metasploit, nmap, wireshark, etc. probably deserve a separate post):
I’m sure there are more (and I’d be happy to add them, e.g. this list suggested in reddit, or others in the reddit thread). Assessing each individual tool, its ease of use, its compliance aspects and the combination between multiple tools is a hard task (here’s a SANS paper on “stitching” multiple tools together). And making sense of the whole landscape (as I’ve tried previously) hints about the complexity of a security professional’s job.
So Richard Stallman is back at the FSF, on the board of directors this time
rather than as President. I’m not sure how significant this position is in the
day-to-day operations, but I’m not sure if that’s really important.
How anyone could have thought this was a good idea is beyond me. I’ve long
considered Stallman to be a poor representative of the community, and quite
frankly it baffles me that people do. I’m not sure what the politics were that
lead up to this decision; I had hoped that after Stallman’s departure the FSF
would move forward and shed off some of the Stallmanisms. It seems this hasn’t
happened.
To quickly recap why Stallman is a poor representative:
Actively turned many people off because he’s such a twat; on of the better examples I know of is from Keith Packard, explaining why X didn’t use the
GPL in spite of Packard already having used it for some of his projects
before:
Richard Stallman, the author of the GPL and quite an interesting individual
lived at 5405 DEC square, he lived up on the sixth floor I think? Had an
office up there; he did not have an apartment. And we knew him extremely
well. He was a challenging individual to get along with. He would regularly
come down to our offices and ask us, or kind of rail at us, for not using
the GPL.
This did not make a positive impression on me; this was my first
interactions with Richard directly and I remember thinking at the time,
“this guy is a little, you know, I’m not interesting in talking to him
because he’s so challenging to work with.”
And so, we should have listened to him then but we did not because, we know
him too well, I guess, and met him as well.
He really was right, we need to remember that!
His behaviour against women in particular is creepy. This is not a crime (he
has, as far as I know, never forced himself on anyone) but not a good quality
in a community spokesperson, to put it mildly.
His personal behaviour in general is … odd, to put it mildly. Now, you can
be as odd as you’d like as far as I’m concerned, but I also don’t think
someone like that is a good choice to represent an entire community.
Caused a major and entirely avoidable fracture of the community with the Open
Source movement; it’s pretty clear that Stallman, him specifically as a
person, was a major reason for the OSI people to start their own organisation.
Stallman still seems to harbour sour grapes over this more than 20 years
later.
Sidetracking of pointless issues (“GNU/Linux”, “you should not be using hacker
but cracker”, “Open Source misses the point”, etc.), as well as stubbornly
insisting on the term “Free Software” which is confusing and stands in the way
if communicating the ideals to the wider world. Everyone will think that an
article with “Free Software” in the title will be about software free of
charge. There is a general lack of priorities or pragmatism in almost
anything Stallman does.
Stallman’s views in general on computing are stuck somewhere about 1990.
Possibly earlier. The “GNU Operating System” (which does not exist, has never
existed, and most likely will never exist[1]) is not how to advance Free
Software in modern times. Most people don’t give a rat’s arse which OS they’re
using to access GitHub, Gmail, Slack, Spotify, Netflix, AirBnB, etc. The world
has changed and the strategy needs to change – but Stallman is still stuck in
1990.
Insisting on absolute freedom to the detriment of more freedom compared to
the status quo. No, people don’t want to run a “completely free GNU/Linux
operating system” if their Bluetooth and webcam doesn’t work and if they can’t
watch Netflix. That’s just how it is. Deal with it.
If [an install fest] upholds the ideals of freedom, by installing only free
software from 100%-free distros, partly-secret machines won’t become
entirely functional and the users that bring them will go away disappointed.
However, if the install fest installs nonfree distros and nonfree software
which make machines entirely function, it will fail to teach users to say no
for freedom’s sake. They may learn to like GNU/Linux, but they won’t learn
what the free software movement stands for.
[..]
My new idea is that the install fest could allow the devil to hang around,
off in a corner of the hall, or the next room. (Actually, a human being
wearing sign saying “The Devil,” and maybe a toy mask or horns.) The devil
would offer to install nonfree drivers in the user’s machine to make more
parts of the computer function, explaining to the user that the cost of this
is using a nonfree (unjust) program.
Aside from the huge cringe factor of having someone dressed up as a devil to
install a driver, the entire premise is profoundly wrong; people can
appreciate freedom while also not having absolute/maximum freedom. Almost the
entire community does this, with only a handful of purist exceptions. This
will accomplish nothing except turn people off.
Crippling software out of paranoia; for example Stallman refused to make gcc
print the AST – useful for the Emacs completion and other tooling –
because he was afraid someone might “abuse” it. He comes off as a gigantic
twat in that entire thread (e.g. this).
How do you get people to use Free Software? By making great software people
want to use. Not by offering some shitty crippled product where you can’t do
some common things you can already do in the propetariy alternatives.
Luckily, the backlash against this has been significant, including an An open
letter to remove Richard M. Stallman from all leadership positions. Good.
There are many things in the letter I can agree with. If there are parliamentary
hearings surrounding some Free Software law then you would you want Stallman to
represent you? Would you want Stallman to be left alone in a room with some
female lawmaker (especially an attractive one)? I sure wouldn’t; I’d be fearful
he’d leave a poor impression, or outright disgrace the entire community.
But there are also a few things that bother me, as are there in the general
conversation surrounding this topic. Quoting a few things from that letter:
[Stallman] has been a dangerous force in the free software community for a
long time. He has shown himself to be misogynist, ableist, and transphobic,
among other serious accusations of impropriety.
[..]
him and his hurtful and dangerous ideology
[..]
RMS and his brand of intolerance
Yikes! That sounds horrible. But closer examinations of the claims don’t really
bear out these strong claims.
The transphobic claim seems to hinge entirely on his eclectic opinion regarding
gender-neutral pronouns; he prefers some peculiar set of neologisms (“per”
and “pers”) instead of the singular “they”. You can think about his pronoun
suggestion what you will – I feel it’s rather silly and pointless at best – but
a disagreement on how to best change the common use of language to be more
inclusive does not strike me as transphobic. Indeed, it strikes me as the exact
opposite: he’s willing to spend time and effort to make language more
inclusive. That he doesn’t do it in the generally accepted way is not
transphobia, a “harmful ideology”, or “dangerous”. It’s really not.
Stallman’s penchant to make people feel unconformable has long been known; and
should hardly come as a surprise to anyone. Many who met him in person did not
leave with an especially good impression of him for one reason or the other. His
behaviour towards women in particular is pretty bad; many anecdotes have been
published and they’re pretty 😬
But … I don’t have the impression that Stallman dislikes or distrusts women,
or sees them as subservient to men. Basically, he’s just creepy. That’s not
good, but is it misogyny? His lack of social skills seem to be broad and not
uniquely directed towards women. He’s just a socially awkward guy in general. I
mean, this is a guy who will, when giving a presentation, will take off his
shoes and socks – which is already a rather weird thing to do – will then
proceed to rub his bare foot – even weirder – only to proceed to appear to eat something from his foot – wtf wtf wtf?!
If he can’t understand that this is just … wtf, then how can you expect him to
understand that some comment towards a woman is wtf?
Does all of this excuse bad behaviour? No. But it shines a rather different
light on things than phrases such as “misogynist”, “hurtful and dangerous
ideology”, and “his brand of intolerance” do. He hasn’t forced himself on
anyone, as far as I know, and most complaints are about him being creepy.
I don’t think it’s especially controversial to claim that Stallman would have
been diagnosed with some form of autism if he had been born several decades
later. This is not intended as an insult or some such, just to establish him as
a neurodivergent[2] individual. Someone like that is absolutely a poor choice
for a leadership position, but at the same time doesn’t diversity also mean
diversity of neurodivergent people, or at the very least some empathy and
understanding when people’s exhibit a lack of social skills and behaviour
considered creepy?
At what point is there a limit if someone’s neurodiversity drives people away? I
don’t know; there isn’t an easy answer to his. Stallman is clearly unsuitable
for a leadership role; but “misogynist”? I’m not really seeing it in Stallman.
The ableist claim seems to mostly boil down to a comment he posted on his
website regarding abortion of fetuses with Down’s syndrome:
A new noninvasive test for Down’s syndrome will eliminate the small risk of
the current test.
This mind lead more women to get tested, and abort fetuses that have Down’s
syndrome. Let’s hope so!
If you’d like to love and care for a pet that doesn’t have normal human mental
capacity, don’t create a handicapped human being to be your pet. Get a dog or
a parrot. It will appreciate your love, and it will never feel bad for being
less capable than normal humans.
A noninvasive test for Down’s syndrome eliminates the small risk of the old
test. This might lead more women to get tested, and abort fetuses that have
Down’s syndrome.
According to Wikipedia, Down’s syndrome is a combination of many kinds of
medical misfortune. Thus, when carrying a fetus that is likely to have Down’s
syndrome, I think the right course of action for the woman is to terminate the
pregnancy.
That choice does right by the potential children that would otherwise likely
be born with grave medical problems and disabilities. As humans, they are
entitled to the capacity that is normal for human beings. I don’t advocate
making rules about the matter, but I think that doing right by your children
includes not intentionally starting them out with less than that.
When children with Down’s syndrome are born, that’s a different situation.
They are human beings and I think they deserve the best possible care.
He also made a few other comments to the effect of “you should abort if you’re
pregnant with a fetus who has Down’s syndrome”.
That last paragraph of the original version was … not great, but the new
version seems okay to me. It is a women’s right to choose to have an abortion,
for any reason, including not wanting to raise a child with Down’s syndrome.
This is already commonplace in practice, with many women choosing to do so.
Labelling an entire person as ableist based only on this – and this is really
the only citation of ableism I’ve been able to find – seems like a stretch, at
best. It was a shitty comment, but he did correct it which is saying a lot in
Stallman ters, as I haven’t seen him do that very often.
Phrases like “a dangerous force”, “dangerous ideology”, and “brand of
intolerance” make it sound like he’s crusading on these kind of issues. Most of
these are just short notes on his personal site which few people seem to read.
Most of the issues surrounding Stallman seem to be about him thinking out loud,
not realizing when it is or is not appropriate to do so, being excessively
pedantic over minor details, or just severally lacking in social skills. This can
be inappropriate, offensive, or creepy – depending on the scenario – but that’s
just something different than being actively transphobic or dangerous. If
someone had read only this letter without any prior knowledge of Stallman they
would be left with the impression that Stallman is some sort of alt-right troll
writing for Breitbart or the like. This is hardly the case.
I think Stallman should resign of newly appointed post, and from GNU as well,
over his personal behaviour in particular. Stallman isn’t some random programmer
working on GNU jizamabob making the occasional awkward comment, he’s the face of
the entire movement. Appointing “a challenging individual to get along with” –
to quote Packard – is not the right person for the job. I feel the rest of the
FSF board has shown spectacular poor judgement in allowing Stallman to come
back.[3]
But I can not, in good conscience, sign the letter as phrased currently. It
vastly exaggerates things to such a degree that I feel it does a gross injustice
to Stallman. It’s grasping at straws to portray Stallman as the most horrible
human being possible, and I don’t think he is that. He seems clueless on some
topics and social interactions, and find him a bit of a twat in general, but
that doesn’t make you a horrible and dangerous person. I find the letter lacking
in empathy and deeply unkind.
In short, I feel Stallman’s aptitudes do not apply well for any sort of
leadership position and I would rather not have him represent the community I’m
a part of, even if he did start it and made many valuable contributions to it.
Just starting something does not give you perpetual ownership over it, and in
spite of all his hard work I feel he’s been very detrimental to the movement and
has been a net-negative contributor for a while. A wiser version of Stallman
would have realized his shortcomings and stepped down some time in the late 80s
to let someone else be the public face.
Overall I feel he’s not exactly a shining example of the human species, but then
again I’m probably not either. He is not the devil and the horrible person that
the letter makes him out to be. None of these exaggerations are even needed to
make the case that he should be removed, which makes it even worse.
It’s a shame, because instead of moving forward with Free Software we’re
debating this. Arguably I should just let this go as Stallman isn’t really
worth defending IMO, but on the other hand being unfair is being unfair, no
matter who the target may be.
Footnotes
A set of commandline utilities, libc, and a compiler are not an
operating system. Linux (the kernel) is not the “last missing piece of
the GNU operating system”. ↩
Neurodivergency is, in a nutshell, the idea that “normal” is a wide
range, and that not everyone who doesn’t fits with the majority should be
labelled as “there is something wrong with them” such as autism. While
some some people take this a bit too far (not every autist is
high-functioning; for some it really is debilitating) I think there’s
something to this. ↩
I guess this shouldn’t come as that much of a surprise, as the only people
willing and able to hang around Stallman’s FSF were probably similar-ish
people. It’s probably time to just give up on the FSF and move forward
with some new initiative (OSI is crap too, for different reasons). I swear
we’ve got to be the most dysfunctional community ever. ↩
In typical streaming pipelines, packaging is the step that happens just after encoding, as depicted in the figure below. The output of an encoder is a sequence of bytes, called an elementary stream, which can only be parsed with some understanding of the elementary stream syntax. For example, detecting frame boundaries in an AV1 video stream requires being able to parse so-called Open Bitstream Units (OBU) and identifying Temporal Delimiters OBU. However, high level operations performed on client devices, such as seeking, do not need to be aware of the elementary syntax and benefit from a codec-agnostic format. The packaging step aims at producing such a codec-agnostic sequence of bytes, called packaged format, or container format, which can be manipulated, to some extent, without a deep knowledge of the coding format.
Figure 1 — Simplified architecture of a streaming preparation pipeline
A key feature that our members rightfully deserve when playing audio, video, and timed text is synchronization. At Netflix, we strive to provide an experience where you never see the lips of the Queen of England move before you hear her corresponding dialog in The Crown. Synchronization is achieved by fundamental elements of signaling such as clocks or time lines, time stamps, and time scales that are provided in packaged content.
Our members don’t simply watch our series from beginning to end. They seek into Bridgerton when they resume watching. They rewind and replay their favorite chess move in The Queen’s Gambit. They skip introductions and recaps when they frantically binge-watch Lupin. They make playback decisions when they watch interactive titles such as You vs. Wild. Due to the nature of the audio or video compression techniques, a player cannot necessarily start decoding the stream exactly where our members want. Under the hood, players have to locate points in the stream where decoding can start, decode as quickly as they can, until the user seek point is reached before starting playback. This is another basic feature of packaging: signaling frame types and particularly Random Access Points.
When our members’ kids watch Carmen Sandiego in the back seats of their parents’ car or more generally when the network throughput varies, adaptive streaming technologies are applied to provide the best viewing experience under the network conditions. Adaptive streaming technologies require that streams of various qualities be encoded to common constraints but they also rely on another key feature of packaging to offer seamless quality switching, called indexing. Indexing lets the player fetch only the corresponding segments of the new stream.
Many other elements of signaling are provided in our packaged content to enable the viewing to start as quickly as possible and in the best possible conditions. Decryption modules need to be initialized with the appropriate scheme and initialization vector. Hardware video decoders need to know in advance the resolution and bit depth of the video streams to allocate their decoding buffers. Rendering pipelines need to know ahead of time the speaker configuration of audio streams or whether the video streams are HDR or SDR. Being able to signal all these elements is also a key feature of modern packaging formats.
The role of standards and open source software
Our 200+ million members watch Netflix on a wide variety of devices, from smartphones, to laptops, to TVs and many more, developed by a large number of partners. Reducing the friction when on-boarding a new device and making sure that our content will be playable on old devices for a long time is very important. That is where standards play a key role. The ISO Base Media File Format (ISOBMFF) is the key packaging standard in the entertainment industry as recently recognized with a Technology & Engineering Emmy® Award by the National Academy of Television Arts & Sciences (NATAS).
ISOBMFF provides all the key packaging features mentioned above, and as history proves, it is also versatile and extensible, in its capabilities of adding new signaling features and in its support of codec. Streams encoded with well-established codecs such as AVC and AAC can be carried in ISOBMFF files, but the specification is also regularly extended to support the latest codecs. The Media Systems team at Netflix actively contributes to the development, the maintenance, and the adoption of ISOBMFF. As an example, Netflix led the specification for the carriage of AOM’s AV1 video streams in ISOBMFF.
With 20+ years of existence, ISOBMFF accumulated a lot of technical tools for various use cases. Figure 2 illustrates the complexity of ISOBMFF today through the concept of ‘brands’, a concept similar to profiles in audio or video standards. Initially, limited and well-nested, the standard is now very broad and evolving in various directions.
Figure 2 — Illustrating the complexity of the 6th edition of ISOBMFF. Each rectangle represents a ‘brand’ (indicated by a four character code in bold), and its required set of tools (indicated by a ‘+’ line). Brands are nested. All the tools of inner brands are required by outer brands.
For the Netflix streaming service, we rely on a subset of these tools as identified by the Common Media Application Format (CMAF) standard, and the content protection tools defined in the Common Encryption (CENC) standard.
Multimedia standards like ISOBMFF, CMAF and CENC go hand in hand with open source software implementations. Open source software can demonstrate the features of the standard, enabling the industry to understand its benefits and broadening its adoption. Open source software can also help improve the quality of a standard by highlighting possible ambiguities through a neutral, reference implementation. The Media Systems team at Netflix maintains such a reference open source implementation, called Photon, for the SMPTE IMF standard. For ISOBMFF, Netflix uses MP4Box, the reference open source implementation from the GPAC team.
In this packaging ecosystem of standards and open source software, our work within the Media Systems team includes identifying the tools within the existing standards to address new streaming use cases. When such tools don’t exist, we define new standards or expand existing ones, including ISOBMFF and CMAF, and support open source software to match these standards. For example, when our video encoding colleagues design dynamically optimized encoding schemes producing streaming segments with variable durations, we modify our workflow to ensure that segments across video streams with different bit rates remain time aligned. Similarly, when our audio encoding colleagues introduce xHE-AAC, which obsoletes the old assumption that every audio frame is decodable, we guarantee that audio/video segments remain aligned too. Finally, when we want to help the industry converge to a common encryption scheme for new video codecs such as AV1, we coordinate the discussions to select the scheme, in this case pattern-based subsample encryption (a.k.a ‘cbcs’), and lead the way by providing reference bitstreams. And of course, our work includes handling the many types of devices in the field that don’t have proper support of the standards.
Conclusion
We hope that this post gave you a better understanding of a part of the work of the Media Systems team at Netflix, and hopefully next time you watch one of our award-winning shows, you will recognize the part played by ISOBMFF, a key, award-winning technology. If you want to explore another facet of the team’s work, have a look at the other award-winning technology, TTML, that we use for our Japanese subtitles.
Do you have a story to share about using CDK, about something funny/crazy/interesting/cool/another adjective? The CFPs are now open — the community wants to hear your stories; so go ahead and submit here!
Updates: Changes made across CDK
In January, the CDK Community and the AWS CDK team were together hard at work, bringing in new changes, features, or, as NetaNir likes to call them, many new “goodies” to the CDK!
AWS Construct Library and Core
The CDK Team announced General Availability of the EKS Module in CDK with PR#12640. Moving a CDK Module from Experimental to Stable requires substantial effort from both the CDK Community and Team — the appreciation for everyone that contributed to this effort cannot be understated. Take a look at the project milestone to explore some of the work that contributed to releasing the EKS constrcut to GA. Great job everyone!
External assets are now supported from PR#12259. With this change, you can now setup cdk-assets.json with Files, Archives, or even Docker Images built by external utilities. This is great if your CDK Application relies on assets from other sources, such as an internal pipeline, or if you want to pull the latest Docker Image built from some external utility.
CDK will now alert you if your stack hits the maximum number of CloudFormation Resources. If you’re deploying complex CDK Stacks, you’ll know that sometimes you will hit this cap which seems to only happen when you’ve walked away from your computer to make a coffee while your stack is deploying, only to come back with a latte and a command line full of exceptions. This wonderful quality-of-life change was merged in PR#12193.
AWS CodeBuild
AWS CodeBuild in CDK can now be configured with Standard 5.0 Runtime Environments, which now supports many new runtime environments, including support for Python 3.9 which means, for example, CodeBuild now natively understands the union operator in Python dictionaries you’ve been using to combine dictionaries in your project.
AWS EC2
There is now support for m6gd and r6gd Graviton EC2 Instances from CDK with PR#12302. Graviton Instances are a great way to utilize ARM Archicture at a lower cost.
Support for new io2 and and gp3 EBS Volumes were announced at re:Invent, followed up with a community contribution from leandrodamascena in PR#12074
AWS ElasticSearch
A big cost savings feature to support ElasticSearch UltraWarm nodes in CDK, now gives CDK users the opportunity to store data in S3 instead of an SSD with ElasticSearch, which can substantially reduce storage costs.
AWS S3
Securing S3 Buckets is a standard practice, and CDK has tightened its security on S3 Buckets by limiting the PutObject permission of Bucket.grantWrite() to just s3:PutObject instead of s3:PutObject*. This subtle change means that only the first permission is added to the IAM Principal, instead of any other IAM permission prefixed with PutObject (Such as s3:PutObjectAcl). You still have the flexibility to make this permission add-on if needed, though.
AWS StepFunctions
A member of the CDK Community, ayush987goyal, submitted PR#12436 for StepFunctions-Tasks. This feature now lets users specify the family and revision of a taskDefinitionFamily inside EcsRunTask, thanks to their effort. This modifies previous behavior of the construct where a user could only deploy the latest revision of a Task by supplying the ARN of the Task.
CloudFormation and new L1 Resources
As CDK synthesizes CloudFormation Templates, it’s important that CDK stays up to date with the CloudFormation Resource Specification these updates to our collection of L1 Constructs. Now that they’re here, the community and team can begin implementing beautiful L2 Constructs for these L1s. Interested in contributing an L2 from these L1s? Take a look at our CONTRIBUTING doc to get up and running.
My favorite of all these is ECR Public Repositories. Public Repositories support was just recently announced, in December at AWS re:Invent. Now you can deploy and manage a public repository with CDK as an L1 Construct. So, if you have an exciting Container Image that you’ve been wanting to share with the world with your own Public Repository, set it all up with CDK!
AWS has released a new training module for the CDK. This free 7 module course teaches users the fundamental concepts of the CDK, from explaining its core benefits, to defining the common language and terms, to tips for troubleshooting CDK Projects. This is a great course for developers, or related stakeholders who may be considering whether or not to adopt CDK in their team or organization.
Community Acknowledgements: Thanks for your hard work
We love highlighting Pull Requests from our community of CDK users. This month’s spotlight goes to Jacob-Doetsch, who submitted a fix when deploying Bastion Hosts backed by ARM Architecture. As ARM based architecture increases in usage across AWS, identifying and resolving these types of bugs helps CDK maintain the ability to help Developers continue moving quickly. Great job Jacob!
And finally, to round out the CDK Corner, a round of applause to the following users who merged their first Pull Request to CDK in January! The CDK Community appreciates your hard work and effort!
Today, in partnership with Grafana Labs, we are excited to announce in preview, Amazon Managed Service for Grafana (AMG), a fully managed service that makes it easy to create on-demand, scalable, and secure Grafana workspaces to visualize and analyze your data from multiple sources.
Grafana is one of the most popular open source technologies used to create observability dashboards for your applications. It has a pluggable data source model and support for different kinds of time series databases and cloud monitoring vendors. Grafana centralizes your application data from multiple open-source, cloud, and third-party data sources.
Many of our customers love Grafana, but don’t want the burden of self-hosting and managing it. AMG manages the provisioning, setup, scaling, version upgrades and security patching of Grafana, eliminating the need for customers to do it themselves. AMG automatically scales to support thousands of users with high availability.
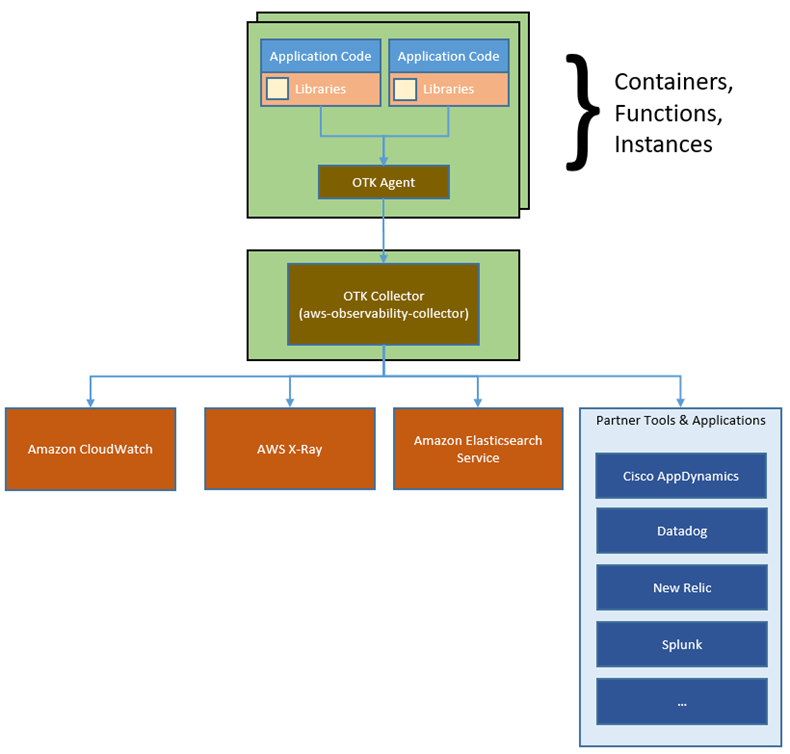
With AMG, you will get a fully managed and secure data visualization service where you can query, correlate, and visualize operational metrics, logs and traces across multiple data sources including cloud services such as AWS, Google, and Microsoft. AMG is integrated with AWS data sources, such as Amazon CloudWatch, Amazon Elasticsearch Service, AWS X-Ray, AWS IoT SiteWise, Amazon Timestream, and others to collect operational data in a simple way. Additionally, AMG also provides plug-ins to connect to popular third-party data sources, such as Datadog, Splunk, ServiceNow, and New Relic by upgrading to Grafana Enterprise directly from the AWS Console.
AMG integrates directly into your AWS Organizations. You can define a AMG workspace in one AWS account that allows you to discover and access datasources in all your accounts and regions across your AWS organization. Creating dashboards in Grafana is easy as all these different datasources are discoverable in one place.
Customers really like Grafana for the ease of creating dashboards, it comes with many built-in dashboards to use when you add a new data source, or you can take advantage of its broad community of pre-built dashboards. For example, you can see in the following image a really nice dashboard that AMG created for me from one of my AWS Lambda function.
One of my favorite things from AMG is the built-in security features. You can easily enable single sign-on using AWS Single Sign-On, restrict access to data sources and dashboards to the right users, and access audit logs via AWS CloudTrail for your hosted Grafana workspace. With AWS Single Sign-On you can leverage your existing corporate directories to enforce authentication and authorization permissions.
Another powerful feature that AMG has is support for Alerts. AMG integrates with Amazon Simple Notification Service (SNS) so customers can send Grafana alerts to SNS as a notification destination. It also has support for four other alert destinations including PagerDuty, Slack, VictorOps and OpsGenie.
There are no up-front investments required to use AMG, and you only pay a monthly active user license fee. This means that you can provision many users to access to your Grafana workspace, but will only be billed for active users that log in and use the workspace that month. Users granted access but that do not log in, will not be billed that month. You can also upgrade to Grafana Enterprise using AWS Marketplace, to get access to enterprise plugins, support, and training content directly from Grafana Labs.
Availability
This service is available in US East (N. Virginia) and Europe (Ireland) regions. To learn more visit the AMG service page, and be sure to join our re:Invent session tomorrow 12/16 from 8:00am – 8:30am PST for a demo!
Today, I’m particularly happy to announce that Amazon SageMaker now supports a new data parallelism library that makes it easier to train models on datasets that may be as large as hundreds or thousands of gigabytes.
As data sets and models grow larger and more sophisticated, machine learning (ML) practitioners working on large distributed training jobs have to face increasingly long training times, even when using powerful instances such as the Amazon Elastic Compute Cloud (EC2)p3 and p4 instances. For example, using a ml.p3dn.24xlarge instance equipped with 8 NVIDIA V100 GPUs, it takes over 6 hours to train advanced object detection models such as Mask RCNN and Faster RCNN on the publicly available COCO dataset. Likewise, training BERT, a state of the art natural language processing model, takes over 100 hours on the same instance. Some of our customers, such as autonomous vehicle companies, routinely deal with even larger training jobs that run for days on large GPU clusters.
As you can imagine, these long training times are a severe bottleneck for ML projects, hurting productivity and slowing down innovation. Customers asked us for help, and we got to work.
Introducing Data Parallelism in Amazon SageMaker Amazon SageMaker now helps ML teams reduce distributed training time and cost, thanks to the SageMaker Data Parallelism (SDP) library. Available for TensorFlow and PyTorch, SDP implements a more efficient distribution of computation, optimizes network communication, and fully utilizes our fastest p3 and p4 GPU instances.
Up to 90% of GPU resources can now be used for training, not for data transfer. Distributed training jobs can achieve up near-liner scaling efficiency, regardless of the number of GPUs involved. In other words, if a training job runs for 8 hours on a single instance, it will only take approximately 1 hour on 8 instances, with minimal cost increase. SageMaker effectively eliminates any trade-off between training cost and training time, allowing ML teams to get results sooner, iterate faster, and accelerate innovation.
During his keynote at AWS re:Invent 2020, Swami Sivasubramanian demonstrated the fastest training times to date for T5-3B and Mask-RCNN.
The T5-3B model has 3 billion parameters, achieves state-of-the-art accuracy on natural language processing benchmarks, and usually takes weeks of effort to train and tune for performance. We trained this model in 6 days on 256 ml.p4d.24xlarge instances.
Mask-RCNN continues to be a popular instance segmentation model used by our customers. Last year at re:Invent, we trained Mask-RCNN in 26 minutes on PyTorch, and in 27 minutes on TensorFlow. This year, we recorded the fastest training time to date for Mask-RCNN at 6:12 minutes on TensorFlow, and 6:45 minutes on PyTorch.
Before we explain how Amazon SageMaker is able to achieve such speedups, let’s first explain how data parallelism works, and why it’s hard to scale.
A Primer on Data Parallelism If you’re training a model on a single GPU, its full internal state is available locally: model parameters, optimizer parameters, gradients (parameter updates computed by backpropagation), and so on. However, things are different when you distribute a training job to a cluster of GPUs.
Using a technique named “data parallelism,” the training set is split in mini-batches that are evenly distributed across GPUs. Thus, each GPU only trains the model on a fraction of the total data set. Obviously, this means that the model state will be slightly different on each GPU, as they will process different batches. In order to ensure training convergence, the model state needs to be regularly updated on all nodes. This can be done synchronously or asynchronously:
Synchronous training: all GPUs report their gradient updates either to all other GPUs (many-to-many communication), or to a central parameter server that redistributes them (many-to-one, followed by one-to-many). As all updates are applied simultaneously, the model state is in sync on all GPUs, and the next mini-batch can be processed.
Asynchronous training: gradient updates are sent to all other nodes, or to a central server. However, they are applied immediately, meaning that model state will differ from one GPU to the next.
Unfortunately, these techniques don’t scale very well. As the number of GPUs increases, a parameter server will inevitably become a bottleneck. Even without a parameter server, network congestion soon becomes a problem, as n GPUs need to exchange n*(n-1) messages after each iteration, for a total amount of n*(n-1)*model size bytes. For example, ResNet-50 is a popular model used in computer vision applications. With its 26 million parameters, each 32-bit gradient update takes about 100 megabytes. With 8 GPUs, each iteration requires sending and receiving 56 updates, for a total of 5.6 gigabytes. Even with a fast network, this will cause some overhead, and slow down training.
A significant step forward was taken in 2017 thanks to the Horovod project. Horovod implemented an optimized communication algorithm for distributed training named “ring-allreduce,” which was soon integrated with popular deep learning libraries.
In a nutshell, ring-allreduce is a decentralized asynchronous algorithm. There is no parameter server: nodes are organized in a directed cycle graph (to put it simply, a one-way ring). For each iteration, a node receives a gradient update from its predecessor. Once a node has processed its own batch, it applies both updates (its own and the one it received), and sends the results to its neighbor. With n GPUs, each GPU processes 2*(n-1) messages before all GPUs have been updated. Accordingly, the total amount of data exchanged per GPU is 2*(n-1)*model size, which is much better than n*(n-1)*model size.
Still, as datasets keep growing, the network bottleneck issue often rises again. Enter SageMaker and its new AllReduce algorithm.
A New Data Parallelism Algorithm in Amazon SageMaker With the AllReduce algorithm, GPUs don’t talk to one another any more. Each GPU stores its gradient updates in GPU memory. When a certain threshold is exceeded, these updates are sharded, and sent to parameter servers running on the CPUs of the GPU instances. This removes the need for dedicated parameter servers.
Each CPU is responsible for a subset of the model parameters, and it receives updates coming from all GPUs. For example, with 3 training instances equipped with a single GPU, each GPU in the training cluster would send a third of its gradient updates to each one of the three CPUs.
Then, each CPU would apply all the gradient updates that it received, and it would distributes the consolidated result back to all GPUs.
Now that we understand how this algorithm works, let’s see how you can use it with your own code, without having to manage any infrastructure.
Training with Data Parallelism in Amazon SageMaker The SageMaker Data Parallelism API is designed for ease of use, and should provide seamless integration with existing distributed training toolkits. In most cases, all you have to change in your training code is the import statement for Horovod (TensorFlow), or for Distributed Data Parallel (PyTorch).
For PyTorch, this would look like this.
import smdistributed.dataparallel.torch.parallel.distributed as dist
dist.init_process_group()
Then, I need to pin each GPU to a single SDP process.
Finally, I instantiate my model, and use it to create a DistributedDataParallel object like so:
import torch
from smdistributed.dataparallel.torch.parallel.distributed import DistributedDataParallel as DDP
device = torch.device("cuda")
model = DDP(Net().to(device))
The rest of the code is vanilla PyTorch, and I can train it using the PyTorch estimator available in the SageMaker SDK. Here, I’m using an ml.p3.16xlarge instance with 8 NVIDIA V100 GPUs.
From then on, SageMaker takes over and provisions all required infrastructure. You can focus on other tasks while your training job runs.
Getting Started If your training jobs last for hours or days on multiple GPUs, we believe that the SageMaker Data Parallelism library can save you time and money, and help you experiment and innovate quicker. It’s available today at in all regions where SageMaker is available, at no additional cost.
Examples are available to get you started quickly. Give them a try, and let us know what you think. We’re always looking forward to your feedback, either through your usual AWS support contacts, or on the AWS Forum for SageMaker.
Way back in 1999, I wrote about open-source software:
First, simply publishing the code does not automatically mean that people will examine it for security flaws. Security researchers are fickle and busy people. They do not have the time to examine every piece of source code that is published. So while opening up source code is a good thing, it is not a guarantee of security. I could name a dozen open source security libraries that no one has ever heard of, and no one has ever evaluated. On the other hand, the security code in Linux has been looked at by a lot of very good security engineers.
We have some new research from GitHub that bears this out. On average, vulnerabilities in their libraries go four years before being detected. From a ZDNet article:
GitHub launched a deep-dive into the state of open source security, comparing information gathered from the organization’s dependency security features and the six package ecosystems supported on the platform across October 1, 2019, to September 30, 2020, and October 1, 2018, to September 30, 2019.
Only active repositories have been included, not including forks or ‘spam’ projects. The package ecosystems analyzed are Composer, Maven, npm, NuGet, PyPi, and RubyGems.
In comparison to 2019, GitHub found that 94% of projects now rely on open source components, with close to 700 dependencies on average. Most frequently, open source dependencies are found in JavaScript — 94% — as well as Ruby and .NET, at 90%, respectively.
On average, vulnerabilities can go undetected for over four years in open source projects before disclosure. A fix is then usually available in just over a month, which GitHub says “indicates clear opportunities to improve vulnerability detection.”
Open source means that the code is available for security evaluation, not that it necessarily has been evaluated by anyone. This is an important distinction.
Our customers have told us that they want to focus on building innovative solutions for their customers, and focus less on the heavy lifting of managing Kubernetes infrastructure. That is why Amazon Elastic Kubernetes Service (EKS) has been so popular; we remove the burden of managing Kubernetes while our customers glean the benefits.
However, not all customers choose to use Amazon EKS. For example, they may have existing infrastructure investments, data residency requirements or compliance obligations that lead them to operate Kubernetes on-premises. Customers in these situations tell us that they spend a lot of effort to track updates, figure out compatible versions of Kubernetes and the complicated matrix of underlying components, test them for compatibility, and keep pace with the Kubernetes release cadence, which can be as frequent as every three to four months. If customers are not able to maintain pace for testing and qualifying new versions, they risk breaking changes, version compatibility issues, and running unsupported versions of Kubernetes lacking critical security patches.
We have learned a lot while providing Amazon EKS at AWS and have developed a deep understanding of how to deliver Kubernetes with operational security, stability, and reliability. Today we are sharing Amazon EKS Distro, which we built using that knowledge.
EKS Distro is a distribution of the same version of Kubernetes deployed by Amazon EKS, which you can use to manually create your own Kubernetes clusters anywhere you choose. EKS Distro provides the installable builds and code of open source Kubernetes used by Amazon EKS, including the dependencies and AWS-maintained patches. Using a choice of cluster creation and management tooling, you can create EKS Distro clusters in AWS on Amazon Elastic Compute Cloud (EC2), in other clouds, and on your on-premises hardware.
EKS Distro includes upstream open source Kubernetes components and third-party tools including configuration database, network, and storage components necessary for cluster creation. They include Kubernetes control plane components (kube-controller-manager, etcd, and CoreDNS) and Kubernetes worker node components (kubelet, CNI plugins, CSI Sidecar images, Metrics Server and AWS-IAM-authenticator).
Building a Cluster The EKS Distro repository has everything you need to build and create Kubernetes clusters. The repository contains the raw documentation for EKS Distro, and it has been built and published at https://distro.eks.amazonaws.com.
To create a new cluster, I follow this section of the documentation. The guide explains how I can build all of the parts and ultimately deploy a cluster to some EC2 instances on AWS using the open source tool kOps. EKS Distro works with many other tools besides kOps. You can find the details in the partner section of the documentation, and many partners have released blogs today that explain how you can deploy using their tooling.
The guide explains that before I can build my cluster, I need to get several container images. I can get them from the EKS Distro Container repository, download them as a tarball, or build them from scratch. I opt to build my containers from scratch and follow the Build Guide. An hour later, I have managed to create twenty containers and have pushed them into Amazon Elastic Container Registry.
The instructions detail several prerequisites that are required by both the build and deploy stages. I follow the guide and install all of the tools suggested.
Next, as per the guide, I locate the kops.sh script in the development folder of the EKS Distro repository. After running the script, it prompts me to enter a Fully Qualified Domain Name (FQDN). I provide newsblog.thebeebs.net.
This script does several things, including creating an S3 bucket in my account to store artifacts required by kOps. Also, it creates a file called newsblog.thebeebs.net.yaml. I edit this file and replace the container Image URLs with ones that point to my images in Elastic Container Registry.
I continue to follow the guide, which now instructs me to run some kOps commands to create my cluster. These commands use the newsblog.thebeebs.net.yaml file, which was an output of the previous step.
One of these commands creates a file called aws-iam-authenticator.yaml. I will apply this file to my kubernetes cluster so that it works correctly with the aws-iam-authenticator.
kubectl apply -f aws-iam-authenticator.yaml
I can now verify that my Kubernetes cluster is using the EKS Distro images by using kubectl to list all of the namespaces.
kubectl get po --all-namespaces -o json | jq -r .items[].spec.containers[].image | sort
Lastly, I delete my cluster by using kOps and issuing a delete command.
kops delete -f ./newsblog.thebeebs.net.yaml --yes
Updates New versions of EKS Distro will be released soon after we make releases to Amazon EKS. The source code, open source tools, and settings are provided for reproducible builds so you can be assured EKS Distro matches what is deployed by Amazon EKS.
Things to Know EKS Distro supports the same versions of Kubernetes and point releases that Amazon EKS uses. EKS Distro provides the same upstream versions of Kubernetes and dependencies that operating system vendors have tested and confirmed work with Kubernetes. This means that EKS Distro already works with common operating systems, such as CentOS, Canonical Ubuntu, Red Hat Enterprise Linux, Suse, and more.
Pricing and Support EKS Distro is an open source project and will be distributed for free. Please collaborate with us on GitHub to make it even better. For example, if you find any issues, please submit them or create a pull request and we will fix them on a best effort basis. Partners will receive support through the Amazon Partner Network program and customers that adopt EKS Distro through partners will receive support from those providers.
What is Coming Next? In 2021 we will be launching EKS Anywhere, which will provide an installable software package for creating and operating Kubernetes clusters on-premises and automation tooling for cluster lifecycle support, it will enable you to centrally backup, recover, patch, and upgrade your production clusters with minimal disruption. EKS Anywhere creates clusters based on EKS Distro, and so you will have version consistency with Amazon EKS. This version and tooling consistency will reduce support costs, and eliminate the redundant effort of using multiple tools for managing your on-premises and Amazon EKS clusters.
Available Now EKS Distro is available today for download and you can get the source and builds from GitHub. To help you get started, check out the documentation.
Introducing gnmi-gateway: a modular, distributed, and highly available service for modern network telemetry via OpenConfig and gNMI
By: Colin McIntosh, Michael Costello
Netflix runs its own content delivery network, Open Connect, which delivers all streaming traffic to our members. A backbone network underlies a large portion of the CDN, and we also run the high capacity networks that support our studios and corporate offices. In order to design, operate, and measure these networks, we must collect metrics and state data from the thousands of devices that compose them.
Towards this end, we created gnmi-gateway, which we have released as an open source project. This article goes over some background on the project, why we created it, and how you can use it to monitor your own network.
Background
Traditional network management tools, namely SNMP and CLI screen-scraping, have been used for decades for this purpose, and there are numerous software packages, protocols, and libraries to choose from. As is common with mature technologies, any number of shortcomings have revealed themselves. The data itself is largely unstructured, untyped, and vendor-proprietary, and its format often changes between even minor software releases. The mechanisms by which the data is retrieved may not be inherently reliable (in the case of SNMP’s UDP transport) and always require active polling by the collector — which, for time series data, must be driven by a strict clock. Other shortcomings include a lack of source timestamps, support for multiple connections, and general scalability challenges.
Modern vendor APIs address some, but not all, of these shortcomings. For example, Arista’s EOS provides eAPI, a RESTful service using JSON payloads. Similarly, Juniper has its Junos XML API, utilizing NETCONF and XML. In both cases the data remains only semi-structured, both vendors format it differently, and collectors must actively poll.
To address the issues associated with polling, some vendors have developed implementations of streaming telemetry, a technology that pushes data from devices on a clock or when state changes rather than requiring polling. However, as with legacy protocols, different vendors implement streaming protocols and payloads differently, and the data is often still unstructured or untyped.
OpenConfig
A few years ago, an operator-driven working group, OpenConfig, was formed with the goal of solving all these problems. The result is a strongly typed vendor-agnostic data model that describes the state and configuration of network devices. The data model is arranged in a tree-like structure of various leaves. Here is a example of what some of these leaves may look like:
Tree example generated by pyang. Some leaves are removed for brevity.
This OpenConfig data model is defined in YANG and can be found on GitHub where the latest changes are published.
gNMI
While the OpenConfig data model describes the structure and state of network devices, the data itself is streamed from network devices at Netflix using the gRPC Network Management Interface (gNMI) protocol. gNMI is an open-source protocol specification created by the OpenConfig working group that is used to stream data to and from network devices, also known as gNMI targets. gNMI provides four RPC mechanisms:
Capabilities: Describes the services and data models supported by the target
Get: Allows clients to request the value of specific leaves in the tree
Set: Allows clients to set writable leaves in the tree
Subscribe: Streams state changes about the target to clients
Subscribe is the RPC that we’re primarily interested in to stream state from targets to our network management platform, and is the the RPC that gnmi-gateway supports today.
Here’s a diagram that will give you an idea of how OpenConfig and gNMI fit together:
At the bottom of the diagram is a normal gRPC connection over HTTP/2 and TLS. The gRPC code is auto-generated from the gNMI protobuf model and gNMI carries the data modeled in OpenConfig, which has some encoding.
When we talk about streaming telemetry at Netflix, we’re typically talking about all of the components in this stack.
Existing Systems
OpenConfig and gNMI streaming telemetry solve many of the problems that network operators encounter, but to date there have been no commercial or open source systems that provide scalable integration of this data into traditional network management tools. Where is Cacti for streaming telemetry? Although there are gnmi_collector, gNMI Plugin for Telegraf, and Cisco Big Muddy, none of these provide a distributed and highly available collection service that exports streaming data in a useful manner.
The Gateway
To fill these gaps — under the OpenConfig working group, Netflix has built and now introduces gnmi-gateway, a modular, distributed, and highly available service for OpenConfig modeled streaming telemetry data over gNMI.
Our goals in building a gateway to consume and distribute data from gNMI were similar to goals in services that we’ve built in the past for SNMP and CLI screen-scraping. We strived for a service that:
is tolerant to failure
dynamically loads/unloads metadata to form connections to network devices
can export data to our constantly-evolving suite of network management tools
uses existing code where possible
Additionally, we wanted to improve the accessibility of the gNMI protocol and OpenConfig data by enabling network operators everywhere to deploy the service with no additional software development (coding) required.
That said, we also didn’t want to limit the ability for network operators to further extend the functionality. Whenever possible, we enabled additional exporter and target loading plugins to be added with loose coupling and without the need to develop a complete gNMI client.
We chose to build gnmi-gateway in Golang given the first-class support for protobufs in Go and that much of the existing reference code for gNMI exists in Golang. Although we chose Golang, clients for the gNMI protocol can be generated for any language with Protobuf 3 tools. Network operators should feel encouraged to deploy gnmi-gateway to manage connections to gNMI targets and write consuming gNMI applications in the language that is most appropriate for their situation.
As mentioned earlier, we wanted to use existing code whenever possible. Within the openconfig/gnmi repo there are three specific components built by the OpenConfig community that we directly utilized:
gnmi/client: A fault-tolerant client for forming gNMI connections to targets
gnmi/cache and gnmi/subscribe: Libraries for aggregating gNMI messages from multiple targets and serving them in a consolidated stream
Addressing the Need for High Availability
One of the primary issues we found with existing software for gNMI was a lack of tolerance for failure. Most of the existing software was stateful and either required a mutable deployment or didn’t include any cluster awareness for failover or coordination.
To support better failure tolerance, we included clustering in gnmi-gateway that allows multiple instances of the service to coordinate and deduplicate connections to targets. We have many consumers interested in this streaming telemetry, but we only need a single connection to a target to receive it. By using this clustering functionality and replication, we’re able to avoid unnecessary duplicate gNMI connections to targets.
gnmi-gateway uses a shared lock per-target for coordinating these connections. We chose to build locking on Apache Zookeeper, which is included in Netflix’s paved road and provides all of the features necessary for cluster consensus. Although Zookeeper is the included clustering implementation, gnmi-gateway provides a Golang interface that can be used to implement connection coordination with systems other than Zookeeper.
After an instance of gnmi-gateway acquires a lock for a target and forms a connection, it begins to forward data into the local in-memory cache. To allow any instance of gnmi-gateway in the cluster to serve a subscription for any target in the cluster, gNMI messages are replicated from the instance with the lock to other instances in the cluster. This replication allows any clustered instance of gnmi-gateway to accept client requests for any known target.
With every instance in the cluster able to serve streams for each target, we’re able to load balance incoming clients connections among all of the cluster instances. The underlying transport for gNMI is, like most gRPC connections, HTTP/2 over TLS — so this allows us to use a simple Layer 4 load balancer between gnmi-gateway and our gNMI clients. Although we’ve chosen to use a Layer 4 load balancer, this could be substituted for a Layer 7 load balancer or an alternative load balancing solution, such as DNS load balancing.
Target Loaders
At Netflix, our network infrastructure is constantly changing. To allow network engineers to make changes on the network without needing to update the configuration of gnmi-gateway many times per day, we included a feature that loads our gNMI targets from our network management system (NMS) based on tags on network devices. Although our NMS (and therefore its API) is not open source, we included a Target Loader plugin for loading devices from NetBox as well as from watched files.
Here is an example of a simple target loader configuration file:
While gnmi-gateway allows us to form connections to our gNMI data sources (network devices) and serve gNMI streams to clients on the other side, we still need to integrate this data with our existing tooling, most of which does not support the gNMI protocol.
// Exporter is an interface to send data to other systems and
// protocols.
type Exporter interface {
  // Name must return unique exporter name that will be used for
  // registration and recording internal stats.
  Name() string
  // Start will be called once by the gateway.Gateway after
  // StartGateway is called. It will receive a pointer to the
  // cache.Cache that receives all of the updates from gNMI targets
  // that the gateway has a subscription for. If Start returns an
  // error the gateway will fail to start with an error.
  Start(*cache.Cache) error
  // Export will be called once for every gNMI notification that is
  // inserted into the cache.Cache. Export should complete as
  // quickly as possible to prevent delays in the system and
  // upstream gNMI clients. Export receives the leaf parameter
  // which is a *ctree.Leaf type and has a value of type
  // *gnmipb.Notification. You can access the notification with a
  // type assertion: leaf.Value().(*gnmipb.Notification)
  Export(leaf *ctree.Leaf)
}
To enable this integration, we included plug-in components in gnmi-gateway called Exporters, which are able to present data to non-gNMI systems. Exporters were designed to be easily extendable with a Golang interface, but to help users of gnmi-gateway get started without needing to write code, we’ve included a few to start.
Here’s an example of gnmi-gateway being started with a Kafka Exporter enabled:
To see additional Exporter functionality, take a look at another example in the GitHub repo here that will get you up and running with a development instance of Prometheus and gnmi-gateway.
You can try gnmi-gateway right now!
With all of these great features, we bet you’re itching to try gnmi-gateway right away! Good news — you can go grab a copy of gnmi-gateway right now and try it out for yourself. To get started you’ll need to have installed:
Golang 1.13 or later
git
openssl (or another tool to generate certificate pairs)
A target that supports gNMI and OpenConfig (see list in the Appendix)
In a new shell or terminal:
$ git clone github.com/openconfig/gnmi-gateway && cd gnmi-gateway
The gNMI specification requires that gNMI connections be encrypted with TLS, so you’ll need to create a few TLS certificates before you can start the gnmi-gateway server:
$ make tls
Make sure that the .crt and .key file were created successfully:
$ ls -al server.*
-rw-rw-r-- 1 user user 717 Sep  1 20:50 server.crt
-rw------- 1 user user 359 Sep  1 20:50 server.key
Next, you’ll need to define the target and paths that you want to subscribe to. First copy the example .yaml file which will be used with the ‘simple’ target loader:
$ cp targets-example.yaml targets.yaml
Edit the file to match the details of your router. Here we have a few predefined paths, but feel free to modify them to paths that you’re interested in seeing.
$ vim targets.yaml
At this point, you should be ready to start gnmi-gateway. Run gnmi-gateway with the ‘debug’ Exporter enabled to see all of the received messages logged to stdout.
Congratulations — you’re now collecting gNMI data with gnmi-gateway!
Simple streaming telemetry was originally published in Netflix TechBlog on Medium, where people are continuing the conversation by highlighting and responding to this story.
The solution described in this post automates the cross-account response and remediation lifecycle from executing the remediation action to resolving the findings in Security Hub and notifying users of the remediation via Amazon Simple Notification Service (Amazon SNS). You can also deploy these automated playbooks as custom actions in Security Hub, which allows analysts to run them on-demand against specific findings. You can deploy these remediations as custom actions or as fully automated remediations.
Figure 1 shows the flow of events in the solution described in the following text.
Figure 1: Flow of events
Detect
Security Hub gives you a comprehensive view of your security alerts and security posture across your AWS accounts and automatically detects deviations from defined security standards and best practices.
Security Hub also collects findings from various AWS services and supported third-party partner products to consolidate security detection data across your accounts.
Ingest
All of the findings from Security Hub are automatically sent to CloudWatch Events and Amazon EventBridge and you can set up CloudWatch Events and EventBridge rules to be invoked on specific findings. You can also send findings to CloudWatch Events and EventBridge on demand via Security Hub custom actions.
Remediate
The CloudWatch Event and EventBridge rules can have AWS Lambda functions, AWS Systems Managerautomation documents, or AWS Step Functions workflows as the targets of the rules. This solution uses automation documents and Lambda functions as response and remediation playbooks. Using cross-account AWS Identity and Access Management (IAM) roles, the playbook performs the tasks to remediate the findings using the AWS API when a rule is invoked.
Log
The playbook logs the results to the Amazon CloudWatch log group for the solution, sends a notification to an Amazon Simple Notification Service (Amazon SNS) topic, and updates the Security Hub finding. An audit trail of actions taken is maintained in the finding notes. The finding is updated as RESOLVED after the remediation is run. The security finding notes are updated to reflect the remediation performed.
In the Security Hub master account, you deploy the AWS CloudFormationtemplate, which creates an AWS Service Catalog product along with some other resources. For a full set of what resources are deployed as part of an AWS CloudFormation stack deployment, you can find the full set of deployed resources in the Resources section of the deployed AWS CloudFormation stack. The solution uses the AWS Service Catalog to have the remediations available as a product that can be deployed after granting the users the required permissions to launch the product.
Add an IAM role that has administrator access to the AWS Service Catalog portfolio.
Deploy the CIS playbook from the AWS Service Catalog product list using the IAM role you added in the previous step.
Deploy the AWS Security Hub Automated Response and Remediation template in the master account in addition to the member accounts. This template establishes AssumeRole permissions to allow the playbook Lambda functions to perform remediations. Use AWS CloudFormation StackSets in the master account to have a centralized deployment approach across the master account and multiple member accounts.
Deployment steps for automated response and remediation
This section reviews the steps to implement the solution, including screenshots of the solution launched from an AWS account.
Launch AWS CloudFormation stack on the master account
As part of this AWS CloudFormation stack deployment, you create custom actions to configure Security Hub to send findings to CloudWatch Events. Lambda functions are used to provide remediation in response to actions sent to CloudWatch Events.
Note: In this solution, you create custom actions for the CIS standards. There will be more custom actions added for other security standards in the future.
To launch the AWS CloudFormation stack
Deploy the AWS CloudFormation template in the Security Hub master account. In your AWS console, select CloudFormation and choose Create new stack and enter the S3 URL.
Select Next to move to the Specify stack details tab, and then enter a Stack name as shown in Figure 2. In this example, I named the stack SO0111-SHARR, but you can use any name you want.
Figure 2: Creating a CloudFormation stack
Creating the stack automatically launches it, creating 21 new resources using AWS CloudFormation, as shown in Figure 3.
Figure 3: Resources launched with AWS CloudFormation
An Amazon SNS topic is automatically created from the AWS CloudFormation stack.
When you create a subscription, you’re prompted to enter an endpoint for receiving email notifications from Amazon SNS as shown in Figure 4. To subscribe to that topic that was created using CloudFormation, you must confirm the subscription from the email address you used to receive notifications.
Figure 4: Subscribing to Amazon SNS topic
Enable Security Hub
You should already have enabled Security Hub and AWS Config services on your master account and the associated member accounts. If you haven’t, you can refer to the documentation for setting up Security Hub on your master and member accounts. Figure 5 shows an AWS account that doesn’t have Security Hub enabled.
Figure 5: Enabling Security Hub for first time
AWS Service Catalog product deployment
In this section, you use the AWS Service Catalog to deploy Service Catalog products.
To use the AWS Service Catalog for product deployment
In the same master account, add roles that have administrator access and can deploy AWS Service Catalog products. To do this, from Services in the AWS Management Console, choose AWS Service Catalog. In AWS Service Catalog, select Administration, and then navigate to Portfolio details and select Groups, roles, and users as shown in Figure 6.
Figure 6: AWS Service Catalog product
After adding the role, you can see the products available for that role. You can switch roles on the console to assume the role that you granted access to for the product you added from the AWS Service Catalog. Select the three dots near the product name, and then select Launch product to launch the product, as shown in Figure 7.
Figure 7: Launch the product
While launching the product, you can choose from the parameters to either enable or disable the automated remediation. Even if you do not enable fully automated remediation, you can still invoke a remediation action in the Security Hub console using a custom action. By default, it’s disabled, as highlighted in Figure 8.
Figure 8: Enable or disable automated remediation
After launching the product, it can take from 3 to 5 minutes to deploy. When the product is deployed, it creates a new CloudFormation stack with a status of CREATE_COMPLETE as part of the provisioned product in the AWS CloudFormation console.
AssumeRole Lambda functions
Deploy the template that establishes AssumeRole permissions to allow the playbook Lambda functions to perform remediations. You must deploy this template in the master account in addition to any member accounts. Choose CloudFormation and create a new stack. In Specify stack details, go to Parameters and specify the Master account number as shown in Figure 9.
Figure 9: Deploy AssumeRole Lambda function
Test the automated remediation
Now that you’ve completed the steps to deploy the solution, you can test it to be sure that it works as expected.
To test the automated remediation
To test the solution, verify that there are 10 actions listed in Custom actions tab in the Security Hub master account. From the Security Hub master account, open the Security Hub console and select Settings and then Custom actions. You should see 10 actions, as shown in Figure 10.
Figure 10: Custom actions deployed
Make sure you have member accounts available for testing the solution. If not, you can add member accounts to the master account as described in Adding and inviting member accounts.
For testing purposes, you can use CIS 1.5 standard, which is to require that the IAM password policy requires at least one uppercase letter. Check the existing settings by navigating to IAM, and then to Account Settings. Under Password policy, you should see that there is no password policy set, as shown in Figure 11.
Figure 11: Password policy not set
To check the security settings, go to the Security Hub console and select Security standards. Choose CIS AWS Foundations Benchmark v1.2.0. Select CIS 1.5 from the list to see the Findings. You will see the Status as Failed. This means that the password policy to require at least one uppercase letter hasn’t been applied to either the master or the member account, as shown in Figure 12.
Figure 12: CIS 1.5 finding
Select CIS 1.5 – 1.11 from Actions on the top right dropdown of the Findings section from the previous step. You should see a notification with the heading Successfully sent findings to Amazon CloudWatch Events as shown in Figure 13.
Figure 13: Sending findings to CloudWatch Events
Return to Findings by selecting Security standards and then choosing CIS AWS Foundations Benchmark v1.2.0. Select CIS 1.5 to review Findings and verify that the Workflow status of CIS 1.5 is RESOLVED, as shown in Figure 14.
Figure 14: Resolved findings
After the remediation runs, you can verify that the Password policy is set on the master and the member accounts. To verify that the password policy is set, navigate to IAM, and then to Account Settings. Under Password policy, you should see that the account uses a password policy, as shown in Figure 15.
Figure 15: Password policy set
To check the CloudWatch logs for the Lambda function, in the console, go to Services, and then select Lambda and choose the Lambda function and within the Lambda function, select View logs in CloudWatch. You can see the details of the function being run, including updating the password policy on both the master account and the member account, as shown in Figure 16.
Figure 16: Lambda function log
Conclusion
In this post, you deployed the AWS Solution for Security Hub Automated Response and Remediation using Lambda and CloudWatch Events rules to remediate non-compliant CIS-related controls. With this solution, you can ensure that users in member accounts stay compliant with the CIS AWS Foundations Benchmark by automatically invoking guardrails whenever services move out of compliance. New or updated playbooks will be added to the existing AWS Service Catalog portfolio as they’re developed. You can choose when to take advantage of these new or updated playbooks.
If you have feedback about this post, submit comments in the Comments section below. If you have questions about this post, start a new thread on the AWS Security Hub forum or contact AWS Support.
Want more AWS Security how-to content, news, and feature announcements? Follow us on Twitter.
According to the Open Source Initiative, the term “open source” was created at a strategy session held in 1998 in Palo Alto, California, shortly after the announcement of the release of the Netscape source code. Stakeholders at that session realized that this announcement created an opportunity to educate and advocate for the superiority of an open development process.
We’ve witnessed big changes in open source in the past 22 years and this year-end issue of Architecture Monthly looks at a few trends, including the shift from businesses only consuming open source to contributing to it. You’ll also going to learn how AWS open source projects are one of the ways we’re making technology less cost-prohibitive and more accessible to everyone.
In this month’s Open Source issue
Ask an Expert: Ricardo Sueiras, Principal Advocate for Open Source at AWS
Blog: How Amazon Retail Systems Run Machine Learning Predictions with Apache Spark using Deep Java Library
Case Study: Absa Transforms IT and Fosters Tech Talent Using AWS
Reference Architecture: Running WordPress on AWS
Blog: Simplifying Serverless Best Practices with Lambda Powertools
Whitepaper: Modernizing the Amazon Database Infrastructure: Migrating from Oracle to AWS
QuickStart: Magento on AWS
Related Videos: Wix, Viber, UC Santa Cruz, & Redfin
Visit Flipboard, a personalized mobile magazine app that you can also read on your computer.
We hope you’re enjoying Architecture Monthly, and we’d like to hear from you—leave us star rating and comment on the Amazon Kindle Newsstand page or contact us anytime at [email protected].
In 2017, we launched Amazon MQ – a managed message broker service for Apache ActiveMQ, a popular open-source message broker that is fast and feature-rich. It offers queues and topics, durable and non-durable subscriptions, push-based and poll-based messaging, and filtering. With Amazon MQ, we have enhanced lots of new features by customer feedback to improve […]
It took me a while to figure out what observability was all about. A year or two I asked around and my colleagues told me that I needed to follow Charity Majors and to read her blog (done, and done). Just this week, Charity tweeted:
Kislay’s tweet led to his blog post, Observing is not Debugging, which I found very helpful. As Charity noted, Kislay tells us that Observability is a study of the system in motion.
Today’s large-scale distributed applications and systems are effectively always in motion. Whether serving web requests, processing streams of data or handling events, something is always happening. At world-scale, looking at individual requests or events is not always feasible. Instead, it is necessary to take a statistical approach and to watch how well a system is working, instead of simply waiting for a total failure.
New AWS Distro for OpenTelemetry Today we are launching a preview of AWS Distro for OpenTelemetry. We are part of the Cloud Native Computing Foundation (CNCF)’s OpenTelemetry community, working to define an open standard for the collection of distributed traces and metrics. AWS Distro for OpenTelemetry is a secure and supported distribution of the APIs, libraries, agents, and collectors defined in the OpenTelemetry Specification.
One of the coolest features of the toolkit is auto instrumentation. Starting with Java and in the works for other languages and environments (.NET and JavaScript are next), the auto-instrumentation agent identifies the frameworks and languages used by your application and automatically instruments them to collect and forward metrics and traces.
Here’s how all of the pieces fit together:
The AWS Observability Collector runs within your environment. It can be launched as a sidecar or daemonset for EKS, a sidecar for ECS, or an agent on EC2. You configure the metrics and traces that you want to collect, and also which AWS services to forward them to. You can set up a central account for monitoring complex multi-account applications, and you can also control the sampling rate (what percentage of the raw data is forwarded and ultimately stored).
Partners in Action You can make use of AWS and partner tools and applications to observe, analyze, and act on what you see. We’re working with Cisco AppDynamics, Datadog, New Relic, Splunk, and other partners and will have more information to share during the preview.
Things to Know The preview of the AWS Distro for OpenTelemetry is available now and you can start using it today. In addition to the .NET and JavaScript support that I mentioned earlier, we plan to support Python, Ruby, Go, C++, Erlang, and Rust as well.
This is an open source project and welcome your pull requests! We will be tracking the upstream repository and plan to release a fresh version of the toolkit quarterly.
What makes a project successful? For developers building cloud-native applications, successful projects thrive on transparent, consistent, and rigorous collaboration. That collaboration is one of the reasons that many open source projects, like Docker containers and Kubernetes, grow to become standards for how we build, deliver, and operate software. Our Open Source Guides and Introduction to innersourcing are great first steps to setting up and encouraging these best practices in your own projects.
However, a common challenge that application developers face is manually testing against inconsistent environments. Accurately testing Kubernetes applications can differ from one developer’s environment to another, and implementing a rigorous and consistent environment for end-to-end testing isn’t easy. It can also be very time consuming to spin up and down Kubernetes clusters. The inconsistencies between environments and the time required to spin up new Kubernetes clusters can negatively impact the speed and quality of cloud-native applications.
Building a transparent CI process
On GitHub, integration and testing becomes a little easier by combining GitHub Actions with open source tools. You can treat Actions as the native continuous integration and continuous delivery (CI/CD) tool for your project, and customize your Actions workflow to include automation and validation as next steps.
Since Actions can be triggered based on nearly any GitHub event, it’s also possible to build in accountability for updating tests and fixing bugs. For example, when a developer creates a pull request, Actions status checks can automatically block the merge if the test fails.
Here are a few more examples:
Branch protection rules in the repository help enforce certain workflows, such as requiring more than one pull request review or requiring certain status checks to pass before allowing a pull request to merge.
GitHub Actions are natively configured to act as status checks when they’re set up to trigger `on: [pull_request]`.
Continuous integration (CI) is extremely valuable as it allows you to run tests before each pull request is merged into production code. In turn, this will reduce the number of bugs that are pushed into production and increases confidence that newly introduced changes will not break existing functionality.
But transparency remains key: Requiring CI status checks on protected branches provides a clearly-defined, transparent way to let code reviewers know if the commits meet the conditions set for the repository—right in the pull request view.
Using community-powered workflows
Now that we’ve thought through the simple CI policies, automated workflows are next. Think of an Actions workflow as a set of “plug and play” open sourced, automated steps contributed by the community. You can use them as they are, or customize and make them your own. Once you’ve found the right one, open sourced Actions can be plugged into your workflow with the`- uses: repo/action-name` field.
You might ask, “So how do I find available Actions that suit my needs?”
As you’re building automation and CI pipelines, take advantage of Marketplace to find pre-built Actions provided by the community. Examples of pre-built Actions span from a Docker publish and the kubectl CLI installation to container scans and cloud deployments. When it comes to cloud-native Actions, the list keeps growing as container-based development continues to expand.
Testing with kind
Testing is a critical part of any CI/CD pipeline, but running tests in Kubernetes can absorb the extra time that automation saves. Enter kind. kind stands for “Kubernetes in Docker.” It’s an open source project from the Kubernetes special interest group (SIGs) community, and a tool for running local Kubernetes clusters using Docker container “nodes.” Creating a kind cluster is a simple way to run Kubernetes cluster and application testing—without having to spin up a complete Kubernetes environment.
As the number of Kubernetes users pushing critical applications to production grows, so does the need for a repeatable, reliable, and rigorous testing process. This can be accomplished by combining the creation of a homogenous Kubernetes testing environment with kind, the community-powered Marketplace, and the native and transparent Actions CI process.
Bringing it all together with kind and Actions
Come see kind and Actions at work during our next GitHub Demo Day live stream on October 16, 2020 at 11am PT. I’ll walk you through how to easily set up automated and consistent tests per pull request, including how to use kind with Actions to automatically run end-to-end tests across a common Kubernetes environment.
Today, I am happy to announce Redis 6 compatibility to Amazon ElastiCache for Redis. This release brings several new and important features to Amazon ElastiCache for Redis:
Managed Role-Based Access Control – Amazon ElastiCache for Redis 6 now provides you with the ability to create and manage users and user groups that can be used to set up Role-Based Access Control (RBAC) for Redis commands. You can now simplify your architecture while maintaining security boundaries by having several applications use the same Redis cluster without being able to access each other’s data. You can also take advantage of granular access control and authorization to create administration and read-only user groups. Amazon ElastiCache enhances the new Access Control Lists (ACL) introduced in open source Redis 6 to provide a managed RBAC experience, making it easy to set up access control across several Amazon ElastiCache for Redis clusters.
Client-Side Caching – Amazon ElastiCache for Redis 6 comes with server-side enhancements to deliver efficient client-side caching to further improve your application performance. Redis clusters now support client-side caching by tracking client requests and sending invalidation messages for data stored on the client. In addition, you can also take advantage of a broadcast mode that allows clients to subscribe to a set of notifications from Redis clusters.
Significant Operational Improvements – This release also includes several enhancements that improve application availability and reliability. Specifically, Amazon ElastiCache has improved replication under low memory conditions, especially for workloads with medium/large sized keys, by reducing latency and the time it takes to perform snapshots. Open source Redis enhancements include improvements to expiry algorithm for faster eviction of expired keys and various bug fixes.
Note that open source Redis 6 also announced support for encryption-in-transit, a capability that is already available in Amazon ElastiCache for Redis 4.0.10 onwards. This release of Amazon ElastiCache for Redis 6 does not impact Amazon ElastiCache for Redis’ existing support for encryption-in-transit.
In order to apply RBAC to a new or existing Redis 6 cluster, we first need to ensure you have a user and user group created. We’ll review the process to do this below.
Using Role-Based Access Control – How it works An alternative to Authenticating Users with the Redis AUTH Command, Amazon ElastiCache for Redis 6 offers Role-Based Access Control (RBAC). With RBAC, you create users and assign them specific permissions via an Access String.
If you want to create, modify, and delete users and user groups, you will need to select to the User Management and User Group Management sections in the ElastiCache console.
ElastiCache will automatically configure a default user with user ID and user name “default”, and then you can add it or new created users to new groups in User Group Management.
If you want to change the default user with your own password and access setting, you need to create a new user with the username set to “default” and can then swap it with the original default user. We recommend using your own strong password for a default user.
The following example shows how to swap the original default user with another default that has a modified access string via AWS CLI.
Also, you can modify a user’s password or change its access permissions using modify-user command, or remove a specific user using delete-user command. It will be removed from any user groups to which it belongs.
Similarly you can modify a user group by adding new users and/or removing current users using modify-user-group command, or delete a user group using delete-user-group command. Note that the user group itself, not the users belonging to the group, will be deleted.
Once you have created a user group and added users, you can assign the user group to a replication group, or migrate between Redis AUTH and RBAC. For more information, see the documentation in detail.
Redis 6 cluster for ElastiCache – Getting Started As usual, you can use the ElastiCache Console, CLI, APIs, or a CloudFormation template to create to new Redis 6 cluster. I’ll use the Console, choose Redis from the navigation pane and click Create with the following settings:
Select “Encryption in-transit” checkbox to ensure you can see the “Access Control” options. You can select an option of Access Control either User Group Access Control List by RBAC features or Redis AUTH default user. If you select RBAC, you can choose one of the available user groups.
My cluster is up and running within minutes. You can also use the in-place upgrade feature on existing cluster. By selecting the cluster, click Action and Modify. You can change the Engine Version from 5.0.6-compatible engine to 6.x.
Now Available Amazon ElastiCache for Redis 6 is now available in all AWS regions. For a list of ElastiCache for Redis supported versions, refer to the documentation. Please send us feedback either in the AWS forum for Amazon ElastiCache or through AWS support, or your account team.
Since 2006, Amazon Web Services (AWS) has been helping millions of customers build and manage their IT workloads. From startups to large enterprises to public sector, organizations of all sizes use our cloud computing services to reach unprecedented levels of security, resiliency, and scalability. Every day, they’re able to experiment, innovate, and deploy to production in less time and at lower cost than ever before. Thus, business opportunities can be explored, seized, and turned into industrial-grade products and services.
As Machine Learning (ML) became a growing priority for our customers, they asked us to build an ML service infused with the same agility and robustness. The result was Amazon SageMaker, a fully managed service launched at AWS re:Invent 2017 that provides every developer and data scientist with the ability to build, train, and deploy ML models quickly.
Today, Amazon SageMaker is helping tens of thousands of customers in all industry segments build, train and deploy high quality models in production: financial services (Euler Hermes, Intuit, Slice Labs, Nerdwallet, Root Insurance, Coinbase, NuData Security, Siemens Financial Services), healthcare (GE Healthcare, Cerner, Roche, Celgene, Zocdoc), news and media (Dow Jones, Thomson Reuters, ProQuest, SmartNews, Frame.io, Sportograf), sports (Formula 1, Bundesliga, Olympique de Marseille, NFL, Guiness Six Nations Rugby), retail (Zalando, Zappos, Fabulyst), automotive (Atlas Van Lines, Edmunds, Regit), dating (Tinder), hospitality (Hotels.com, iFood), industry and manufacturing (Veolia, Formosa Plastics), gaming (Voodoo), customer relationship management (Zendesk, Freshworks), energy (Kinect Energy Group, Advanced Microgrid Systems), real estate (Realtor.com), satellite imagery (Digital Globe), human resources (ADP), and many more.
When we asked our customers why they decided to standardize their ML workloads on Amazon SageMaker, the most common answer was: “SageMaker removes the undifferentiated heavy lifting from each step of the ML process.” Zooming in, we identified five areas where SageMaker helps them most.
#1 – Build Secure and Reliable ML Models, Faster As many ML models are used to serve real-time predictions to business applications and end users, making sure that they stay available and fast is of paramount importance. This is why Amazon SageMaker endpoints have built-in support for load balancing across multiple AWS Availability Zones, as well as built-in Auto Scaling to dynamically adjust the number of provisioned instances according to incoming traffic.
For even more robustness and scalability, Amazon SageMaker relies on production-grade open source model servers such as TensorFlow Serving, the Multi-Model Server, and TorchServe. A collaboration between AWS and Facebook, TorchServe is available as part of the PyTorch project, and makes it easy to deploy trained models at scale without having to write custom code.
In addition to resilient infrastructure and scalable model serving, you can also rely on Amazon SageMaker Model Monitor to catch prediction quality issues that could happen on your endpoints. By saving incoming requests as well as outgoing predictions, and by comparing them to a baseline built from a training set, you can quickly identify and fix problems like missing features or data drift.
Says Aude Giard, Chief Digital Officer at Veolia Water Technologies: “In 8 short weeks, we worked with AWS to develop a prototype that anticipates when to clean or change water filtering membranes in our desalination plants. Using Amazon SageMaker, we built a ML model that learns from previous patterns and predicts the future evolution of fouling indicators. By standardizing our ML workloads on AWS, we were able to reduce costs and prevent downtime while improving the quality of the water produced. These results couldn’t have been realized without the technical experience, trust, and dedication of both teams to achieve one goal: an uninterrupted clean and safe water supply.” You can learn more in this video.
#2 – Build ML Models Your Way When it comes to building models, Amazon SageMaker gives you plenty of options. You can visit AWS Marketplace, pick an algorithm or a model shared by one of our partners, and deploy it on SageMaker in just a few clicks. Alternatively, you can train a model using one of the built-in algorithms, or your own code written for a popular open source ML framework (TensorFlow, PyTorch, and Apache MXNet), or your own custom code packaged in a Docker container.
You could also rely on Amazon SageMaker AutoPilot, a game-changing AutoML capability. Whether you have little or no ML experience, or you’re a seasoned practitioner who needs to explore hundreds of datasets, SageMaker AutoPilot takes care of everything for you with a single API call. It automatically analyzes your dataset, figures out the type of problem you’re trying to solve, builds several data processing and training pipelines, trains them, and optimizes them for maximum accuracy. In addition, the data processing and training source code is available in auto-generated notebooks that you can review, and run yourself for further experimentation. SageMaker Autopilot also now creates machine learning models up to 40% faster with up to 200% higher accuracy, even with small and imbalanced datasets.
Another popular feature is Automatic Model Tuning. No more manual exploration, no more costly grid search jobs that run for days: using ML optimization, SageMaker quickly converges to high-performance models, saving you time and money, and letting you deploy the best model to production quicker.
“NerdWallet relies on data science and ML to connect customers with personalized financial products“, says Ryan Kirkman, Senior Engineering Manager. “We chose to standardize our ML workloads on AWS because it allowed us to quickly modernize our data science engineering practices, removing roadblocks and speeding time-to-delivery. With Amazon SageMaker, our data scientists can spend more time on strategic pursuits and focus more energy where our competitive advantage is—our insights into the problems we’re solving for our users.” You can learn more in this case study.
Says Tejas Bhandarkar, Senior Director of Product, Freshworks Platform: “We chose to standardize our ML workloads on AWS because we could easily build, train, and deploy machine learning models optimized for our customers’ use cases. Thanks to Amazon SageMaker, we have built more than 30,000 models for 11,000 customers while reducing training time for these models from 24 hours to under 33 minutes. With SageMaker Model Monitor, we can keep track of data drifts and retrain models to ensure accuracy. Powered by Amazon SageMaker, Freddy AI Skills is constantly-evolving with smart actions, deep-data insights, and intent-driven conversations.“
#3 – Reduce Costs Building and managing your own ML infrastructure can be costly, and Amazon SageMaker is a great alternative. In fact, we found out that the total cost of ownership (TCO) of Amazon SageMaker over a 3-year horizon is over 54% lower compared to other options, and developers can be up to 10 times more productive. This comes from the fact that Amazon SageMaker manages all the training and prediction infrastructure that ML typically requires, allowing teams to focus exclusively on studying and solving the ML problem at hand.
Furthermore, Amazon SageMaker includes many features that help training jobs run as fast and as cost-effectively as possible: optimized versions of the most popular machine learning libraries, a wide range of CPU and GPU instances with up to 100GB networking, and of course Managed Spot Training which lets you save up to 90% on your training jobs. Last but not least, Amazon SageMaker Debugger automatically identifies complex issues developing in ML training jobs. Unproductive jobs are terminated early, and you can use model information captured during training to pinpoint the root cause.
Amazon SageMaker also helps you slash your prediction costs. Thanks to Multi-Model Endpoints, you can deploy several models on a single prediction endpoint, avoiding the extra work and cost associated with running many low-traffic endpoints. For models that require some hardware acceleration without the need for a full-fledged GPU, Amazon Elastic Inference lets you save up to 90% on your prediction costs. At the other end of the spectrum, large-scale prediction workloads can rely on AWS Inferentia, a custom chip designed by AWS, for up to 30% higher throughput and up to 45% lower cost per inference compared to GPU instances.
Lyft, one of the largest transportation networks in the United States and Canada, launched its Level 5 autonomous vehicle division in 2017 to develop a self-driving system to help millions of riders. Lyft Level 5 aggregates over 10 terabytes of data each day to train ML models for their fleet of autonomous vehicles. Managing ML workloads on their own was becoming time-consuming and expensive. Says Alex Bain, Lead for ML Systems at Lyft Level 5: “Using Amazon SageMaker distributed training, we reduced our model training time from days to couple of hours. By running our ML workloads on AWS, we streamlined our development cycles and reduced costs, ultimately accelerating our mission to deliver self-driving capabilities to our customers.“
#4 – Build Secure and Compliant ML Systems Security is always priority #1 at AWS. It’s particularly important to customers operating in regulated industries such as financial services or healthcare, as they must implement their solutions with the highest level of security and compliance. For this purpose, Amazon SageMaker implements many security features, making it compliant with the following global standards: SOC 1/2/3, PCI, ISO, FedRAMP, DoD CC SRG, IRAP, MTCS, C5, K-ISMS, ENS High, OSPAR, and HITRUST CSF. It’s also HIPAA BAA eligible.
Says Ashok Srivastava, Chief Data Officer, Intuit: “With Amazon SageMaker, we can accelerate our Artificial Intelligence initiatives at scale by building and deploying our algorithms on the platform. We will create novel large-scale machine learning and AI algorithms and deploy them on this platform to solve complex problems that can power prosperity for our customers.”
#5 – Annotate Data and Keep Humans in the Loop As ML practitioners know, turning data into a dataset requires a lot of time and effort. To help you reduce both, Amazon SageMaker Ground Truth is a fully managed data labeling service that makes it easy to annotate and build highly accurate training datasets at any scale (text, image, video, and 3D point cloud datasets).
Says Magnus Soderberg, Director, Pathology Research, AstraZeneca: “AstraZeneca has been experimenting with machine learning across all stages of research and development, and most recently in pathology to speed up the review of tissue samples. The machine learning models first learn from a large, representative data set. Labeling the data is another time-consuming step, especially in this case, where it can take many thousands of tissue sample images to train an accurate model. AstraZeneca uses Amazon SageMaker Ground Truth, a machine learning-powered, human-in-the-loop data labeling and annotation service to automate some of the most tedious portions of this work, resulting in reduction of time spent cataloging samples by at least 50%.”
Amazon SageMaker is Evaluated The hundreds of new features added to Amazon SageMaker since launch are testimony to our relentless innovation on behalf of customers. In fact, the service was highlighted in February 2020 as the overall leader in Gartner’s Cloud AI Developer Services Magic Quadrant. Gartner subscribers can click here to learn more about why we have an overall score of 84/100 in their “Solution Scorecard for Amazon SageMaker, July 2020”, the highest rating among our peer group. According to Gartner, we met 87% of required criteria, 73% of preferred, and 85% of optional.
Announcing a Price Reduction on GPU Instances
To thank our customers for their trust and to show our continued commitment to make Amazon SageMaker the best and most cost-effective ML service, I’m extremely happy to announce a significant price reduction on all ml.p2 and ml.p3 GPU instances. It will apply starting October 1st for all SageMaker components and across the following regions: US East (N. Virginia), US East (Ohio), US West (Oregon), EU (Ireland), EU (Frankfurt), EU (London), Canada (Central), Asia Pacific (Singapore), Asia Pacific (Sydney), Asia Pacific (Seoul), Asia Pacific (Tokyo), Asia Pacific (Mumbai), and AWS GovCloud (US-Gov-West).
Instance Name
Price Reduction
ml.p2.xlarge
-11%
ml.p2.8xlarge
-14%
ml.p2.16xlarge
-18%
ml.p3.2xlarge
-11%
ml.p3.8xlarge
-14%
ml.p3.16xlarge
-18%
ml.p3dn.24xlarge
-18%
Getting Started with Amazon SageMaker As you can see, there are a lot of exciting features in Amazon SageMaker, and I encourage you to try them out! Amazon SageMaker is available worldwide, so chances are you can easily get to work on your own datasets. The service is part of the AWS Free Tier, letting new users work with it for free for hundreds of hours during the first two months.
If you’d like to kick the tires, this tutorial will get you started in minutes. You’ll learn how to use SageMaker Studio to build, train, and deploy a classification model based on the XGBoost algorithm.
Last but not least, I just published a book named “Learn Amazon SageMaker“, a 500-page detailed tour of all SageMaker features, illustrated by more than 60 original Jupyter notebooks. It should help you get up to speed in no time.
As always, we’re looking forward to your feedback. Please share it with your usual AWS support contacts, or on the AWS Forum for SageMaker.
Cloudflare powers cdnjs, an open-source project that accelerates websites by delivering popular JavaScript libraries and resources via Cloudflare’s network. Since our major update in December, we focused on remodelling cdnjs for scalability and resilience. Today, we are excited to announce how Cloudflare delivers cdnjs—a migration to a serverless infrastructure using Cloudflare Workers and its distributed key-value store Workers KV!
What is cdnjs and why do I care?
For those unfamiliar, cdnjs is an acronym describing a Content Delivery Network (CDN) for JavaScript (JS). A CDN simply refers to a geographically distributed network of servers that provide Internet content, whether it is memes, cat videos, or HTML pages. In our case, the CDN refers to Cloudflare’s ever expanding network of over 200 globally distributed data centers.
And here’s why this is relevant to you: it makes page load times lightning-fast. Virtually every website you visit needs to fetch JS libraries in order to load, including this one. Let’s say you visit a Sydney-based website that contains a local file from jQuery, a popular library found in 76.2% of websites. If you are located in New York, you may notice a delay, as it can easily exceed 300ms to fetch the file—not to mention the time it takes for the round trips involved with the TLS handshake. However, if the website references jQuery using cdnjs.cloudflare.com, you can retrieve the file from the closest Cloudflare data center in Buffalo, reducing the latency to a blazing 20ms.
While cdnjs operates behind the scenes, it is used by over 11% of websites, making the Internet a much faster and more reliable place. In July, cdnjs served almost 190 billion requests—an enormous 3.46PB of data.
Where are the files stored?
While cdnjs speeds up the Internet, it certainly isn’t magic!
Historically, a number of load-balanced machines at one of Cloudflare’s core data centers would periodically pull cdnjs files from a backing store, acting as the origin for cdnjs.cloudflare.com. When a new file is requested, it is cached by Cloudflare, allowing it to be fetched quickly from any of our data centers.
The backing store is a catalogue of JS, CSS, and other web libraries in the form of an open-source GitHub repository. What this means is that anyone—including you—can contribute to it, subject to review and other processes.
However, until recently, these existing operations were very labor intensive and fragile.
This blog post will explain why we changed the infrastructure behind cdnjs to make it faster, more reliable, and easier to maintain. First, we will discuss how the community used to contribute to cdnjs, outlining the pains and concerns of the old system. Then, we will explore the benefits of migrating to Workers KV. After, we will dive into the new architecture, as well as upgrades to the website and cdnjs API. Finally, we will review the history of cdnjs, and where it is headed in the future.
If you think you know how to make a PR, think again
For the non-technical reader, a pull request (PR) is a request to merge changes you’ve made to a repository. Traditionally, if you wanted to include your JavaScript library in cdnjs, you would first create a PR on GitHub to cdnjs/cdnjs with a JSON file describing your package and additional files for any version you wished to include. Once your PR was approved by our old bot, manually reviewed, and then merged by a maintainer, your package would be integrated with cdnjs.
Sounds easy, right? You can just fork the repo, clone it, and copy paste a few files, no?
Exactly. Contributing was easy if you had several hours to burn, a case-sensitive file system, and a couple hundred gigabytes of free disk space to git clone the 300GB repo. If you were short on time—no problem, you could always use your advanced knowledge of git sparse-checkout to get the job done. Don’t know git? Just add one file at a time manually through GitHub’s UI.
I think you get the point. I know I certainly did when I naively spent 10 hours cloning the repo, only to discover that macOS is case-insensitive by default.
However, updating cdnjs was not only difficult for the contributors, but also the maintainers. Historically, the community was able to contribute version files directly, which could potentially be malicious. This created lots of work for maintainers, requiring them to inspect each file manually, diffing files against the official library source and running malware checks. So how did packages update once they were in cdnjs? In the JSON file describing each package, there was an optional auto-update definition telling the bot where to look for new versions of the library. If present, when your package released a new version from npm or GitHub, the bot would download it, pushing the files to cdnjs/cdnjs and computed Subresource Integrity (SRI) hashes to cdnjs/SRIs. If the auto-update property was missing, it would be your responsibility to make manual PRs to update cdnjs with any future versions.
A wake-up call for cdnjs
In April, during maintenance at one of our core data centers, a technician accidentally disconnected the cables supplying all external connections to our other data centers, causing the data center to go offline for approximately four hours. This incident served as the first wake-up call for cdnjs, especially since the affected data center housed the primary cdnjs origin web servers. In this case, we did have a backup running on an external provider, but what really saved us was Cloudflare’s global cache, which minimized the impact of the outage as only uncached assets failed to load.
We started to think about how we can improve both the reliability and performance of how we serve cdnjs. We went straight to Cloudflare Workers, our own platform for developing on the edge. One powerful tool built into Workers is Workers KV—a low-latency, globally distributed key-value store optimized for high-read applications.
We put two and two together, realizing that instead of pulling the cdnjs/cdnjs repository and serving files from disk, we could cut the physical machines out entirely, distributing the data around the world and serving files straight from the edge. That way, cdnjs would be able to recover from any origin data center failure, while also increasing its scalability.
Workers KV to the rescue
At first glance, the decision to use Workers KV was a no-brainer. Since files in cdnjs never change but require frequent reads, Workers KV was a perfect fit.
However, as we planned our migration, we became concerned that with over 7 million assets in cdnjs, there would undoubtedly exist files that exceed Workers KV’s 10MiB value limit. After investigating, we discovered that several hundred cdnjs files were oversized, the majority being JavaScript Source Maps.
Then the idea hit us. We could store compressed versions of cdnjs files in Workers KV, not only solving our oversized file issue, but also optimizing how we serve files.
If you pay the Internet bill, you’ll know that bandwidth is expensive! For this reason, all modern browsers will try to fetch compressed web content whenever it is available. Similarly, within Cloudflare we often experiment with on-the-fly compression to reduce our bandwidth, always serving compressed content to the eyeball when it is accepted. As a result, we decided to compress all cdnjs files ahead of time, writing them to Workers KV with both optimal Brotli and gzip forms. That way, we could increase the compression level compared to on-the-fly compression as we no longer have the latency requirements.
This means we now serve cdnjs files faster and smaller!
A complete makeover for cdnjs
Today, if you want to include your JavaScript library in cdnjs, you first create a PR on GitHub to our new repository cdnjs/packages. The repo is easily cloneable at 50MB and consists of thousands of JSON files, each describing a cdnjs package and how it is auto-updated from npm or git. Once your file is validated by our automated CI—powered by a new bot—and merged by a maintainer, your package would be automatically enrolled in our auto-update service.
In the new system, security and maintainability are prioritized. For starters, cdnjs version files arecreated by our bot, minimizing the possibility of human error when merging a new version. While the JSON files in cdnjs/packages are added by error-prone humans, they are inspected by our bot before being approved by a maintainer. Each file is automatically validated against a JSON schema, as well as checked for popularity on npm or GitHub.
When the bot discovers a new release, it pushes Brotli and gzip-compressed versions of the files to a files namespace in Workers KV. With each entry, the bot writes some metadata in Workers KV for the ETag and Last-Modified HTTP headers. Similar to before, the bot also computes Subresource Integrity (SRI) hashes of the uncompressed files, but now pushes them instead to a SRIs namespace in Workers KV.
Then, when a new file is requested from cdnjs.cloudflare.com, a Cloudflare Worker will inspect the client’s Accept-Encoding header, fetching either the Brotli or gzip-compressed version with its ETag and Last-Modified metadata from Workers KV. As the compressed file travels back through Cloudflare, it is cached for future requests and uncompressed on-the-fly if needed.
At the moment, there are still a handful of files exceeding Workers KV’s size limit. Consequently, if the Cloudflare Worker fails to retrieve a file from Workers KV, it is fetched from the origin backed by the original git repo. In the coming months, we plan on gradually removing this infrastructure.
Scaling the website and API
Besides the core cdnjs infrastructure, many of its other components received upgrades as well!
On the cdnjs project’s homepage, you will be greeted by a slick new beta website built by Matt. Constructed with Vue and Nuxt, the beta website is powered entirely by the cdnjs API. As a result, it is always up-to-date with the latest package information and requires low resource usage to serve the site—which runs completely on the client-side after the first page load—helping us scale with cdnjs’s never-ending growth.
In fact, the cdnjs API also strengthened its scalability, benefitting from a serverless architecture close to the one we have seen with cdnjs and Workers KV.
Before migrating to Workers KV, the cdnjs API relied on a regularly scheduled process that involved generating about 300MB of metadata. The cdnjs API’s backend would then fetch this enormous “package.min.js” file into memory and use it to operate the API. If you are curious, the file is still being hosted here, but be warned—it may lag your browser! Similarly, file SRIs were pushed to cdnjs/SRIs, which was cloned by the API locally to serve SRI responses.
After all cdnjs files (within the permitted size limit) were moved to Workers KV, these legacy processes became unsustainable, requiring millions of reads and an unreasonable amount of time. Therefore, we decided to upload all metadata found into Workers KV. We split the metadata into four namespaces—one for package-level metadata, one for version-specific metadata, one containing aggregated metadata, and one for file SRIs.
Similar to cdnjs’s serverless design, a Cloudflare Worker sits on top of metadata.speedcdnjs.com, serving data from Workers KV using several public endpoints. Currently, the cdnjs API is fully integrated with these endpoints, which provide an elegant solution as cdnjs continues to scale.
Transparency and the future of cdnjs
Since its birth in January 2011, cdnjs has always been deeply rooted in transparency, deriving its strength from the community. Even when cdnjs exploded in size and its founders Ryan Kirkman and Thomas Davis teamed up with us in June 2011, the project remained entirely open-source on GitHub.
As the years passed, it became harder for the founders to stay active, heavily depending on the community for support. With a nearly nonexistent budget and little access to the repository, core cdnjs maintainers were challenged every day to keep the project alive.
However, as we remove our reliance on the legacy system and store files in Workers KV, there are concerns that cdnjs will become proprietary. Don’t worry, we are working hard to ensure that cdnjs remains as transparent and open-source as possible. To help the community audit updates to Workers KV, there is a new repository, cdnjs/logs, which is used by the bot to log all Workers KV-related events. Furthermore, anyone can validate the integrity of cdnjs files by fetching SRIs from the cdnjs API.
Conclusion
Overall, this past year has been a turbulent time for cdnjs, but all of its shortcomings have acted as red flags to help us build a better system. Most recently, we have mitigated the risks of depending on physical machines at a single location, migrating cdnjs to a serverless infrastructure where its files are stored in Workers KV.
Today, cdnjs is in good hands, and is not going away anytime soon. Shout out especially to the maintainers Sven and Matt for creating tons of momentum with the project, working on everything from scaling cdnjs to editing this post.
Moving forward, we are committed to making cdnjs as transparent as possible. As we continue to improve cdnjs, we will release more blog posts to keep the community up to date. If you are interested, please subscribe to our blog. After all, it is the community that makes cdnjs possible! A special thanks to our active GitHub contributors and members of the cdnjs Community Forum for sticking with us!
By Akshay Sarma, Principal Engineer, Verizon Media & Brian Xiao, Software Engineer, Verizon Media
This is the first of an ongoing series of blog posts sharing releases and announcements for Bullet, an open-sourced lightweight, scalable, pluggable, multi-tenant query system.
Bullet allows you to query any data flowing through a streaming system without having to store it first through its UI or API. The queries are injected into the running system and have minimal overhead. Running hundreds of queries generally fit into the overhead of just reading the streaming data. Bullet requires running an instance of its backend on your data. This backend runs on common stream processing frameworks (Storm and Spark Streaming currently supported).
The data on which Bullet sits determines what it is used for. For example, our team runs an instance of Bullet on user engagement data (~1M events/sec) to let developers find their own events to validate their code that produces this data. We also use this instance to interactively explore data, throw up quick dashboards to monitor live releases, count unique users, debug issues, and more.
Since open sourcing Bullet in 2017, we’ve been hard at work adding many new features! We’ll highlight some of these here and continue sharing update posts for future releases.
Windowing
Bullet used to operate in a request-response fashion – you would submit a query and wait for the query to meet its termination conditions (usually duration) before receiving results. For short-lived queries, say, a few seconds, this was fine. But as we started fielding more interactive and iterative queries, waiting even a minute for results became too cumbersome.
Enter windowing! Bullet now supports time and record-based windowing. With time windowing, you can break up your query into chunks of time over its duration and retrieve results for each chunk. For example, you can calculate the average of a field, and stream back results every second:
In the above example, the aggregation is operating on all the data since the beginning of the query, but you can also do aggregations on just the windows themselves. This is often called a Tumbling window:
With record windowing, you can get the intermediate aggregation for each record that matches your query (a Sliding window). Or you can do a Tumbling window on records rather than time. For example, you could get results back every three records:
Overlapping windows in other ways (Hopping windows) or windows that reset based on different criteria (Session windows, Cascading windows) are currently being worked on. Stay tuned!
Apache Pulsar support as a native PubSub
Bullet uses a PubSub (publish-subscribe) message queue to send queries and results between the Web Service and Backend. As with everything else in Bullet, the PubSub is pluggable. You can use your favorite pubsub by implementing a few interfaces if you don’t want to use the ones we provide. Until now, we’ve maintained and supported a REST-based PubSub and an Apache Kafka PubSub. Now we are excited to announce supporting Apache Pulsar as well! Bullet Pulsar will be useful to those users who want to use Pulsar as their underlying messaging service.
If you aren’t familiar with Pulsar, setting up a local standalone is very simple, and by default, any Pulsar topics written to will automatically be created. Setting up an instance of Bullet with Pulsar instead of REST or Kafka is just as easy. You can refer to our documentation for more details.
Plug your data into Bullet without code
While Bullet worked on any data source located in any persistence layer, you still had to implement an interface to connect your data source to the Backend and convert it into a record container format that Bullet understands. For instance, your data might be located in Kafka and be in the Avro format. If you were using Bullet on Storm, you would perhaps write a Storm Spout to read from Kafka, deserialize, and convert the Avro data into the Bullet record format. This was the only interface in Bullet that required our customers to write their own code. Not anymore! Bullet DSL is a text/configuration-based format for users to plug in their data to the Bullet Backend without having to write a single line of code.
Bullet DSL abstracts away the two major components for plugging data into the Bullet Backend. A Connector piece to read from arbitrary data-sources and a Converter piece to convert that read data into the Bullet record container. We currently support and maintain a few of these – Kafka and Pulsar for Connectors and Avro, Maps and arbitrary Java POJOs for Converters. The Converters understand typed data and can even do a bit of minor ETL (Extract, Transform and Load) if you need to change your data around before feeding it into Bullet. As always, the DSL components are pluggable and you can write your own (and contribute it back!) if you need one that we don’t support.
We appreciate your feedback and contributions! Explore Bullet on GitHub, use and help contribute to the project, and chat with us on Google Groups. To get started, try our Quickstarts on Spark or Storm to set up an instance of Bullet on some fake data and play around with it.
By Mohit Goenka, Gnanavel Shanmugam, and Lance Welsh
At Yahoo Mail, we’re constantly striving to upgrade our product experience. We do this not only by adding new features based on our members’ feedback, but also by providing the best technical solutions to power the most engaging experiences. As such, we’ve recently introduced a number of novel and unique revisions to the way in which we use Redux that have resulted in significant stability and performance improvements. Developers may find our methods useful in achieving similar results in their apps.
Improvements to product metrics
Last year Yahoo Mail implemented a brand new architecture using Redux. Since then, we have transformed the overall architecture to reduce latencies in various operations, reduce JavaScript exceptions, and better synchronized states. As a result, the product is much faster and more stable.
Stability improvements:
when checking for new emails – 20%
when reading emails – 30%
when sending emails – 20%
Performance improvements:
10% improvement in page load performance
40% improvement in frame rendering time
We have also reduced API calls by approximately 20%.
How we use Redux in Yahoo Mail
Redux architecture is reliant on one large store that represents the application state. In a Redux cycle, action creators dispatch actions to change the state of the store. React Components then respond to those state changes. We’ve made some modifications on top of this architecture that are atypical in the React-Redux community.
For instance, when fetching data over the network, the traditional methodology is to use Thunk middleware. Yahoo Mail fetches data over the network from our API. Thunks would create an unnecessary and undesirable dependency between the action creators and our API. If and when the API changes, the action creators must then also change. To keep these concerns separate we dispatch the action payload from the action creator to store them in the Redux state for later processing by “action syncers”. Action syncers use the payload information from the store to make requests to the API and process responses. In other words, the action syncers form an API layer by interacting with the store. An additional benefit to keeping the concerns separate is that the API layer can change as the backend changes, thereby preventing such changes from bubbling back up into the action creators and components. This also allowed us to optimize the API calls by batching, deduping, and processing the requests only when the network is available. We applied similar strategies for handling other side effects like route handling and instrumentation. Overall, action syncers helped us to reduce our API calls by ~20% and bring down API errors by 20-30%.
Another change to the normal Redux architecture was made to avoid unnecessary props. The React-Redux community has learned to avoid passing unnecessary props from high-level components through multiple layers down to lower-level components (prop drilling) for rendering. We have introduced action enhancers middleware to avoid passing additional unnecessary props that are purely used when dispatching actions. Action enhancers add data to the action payload so that data does not have to come from the component when dispatching the action. This avoids the component from having to receive that data through props and has improved frame rendering by ~40%. The use of action enhancers also avoids writing utility functions to add commonly-used data to each action from action creators.
In our new architecture, the store reducers accept the dispatched action via action enhancers to update the state. The store then updates the UI, completing the action cycle. Action syncers then initiate the call to the backend APIs to synchronize local changes.
Conclusion
Our novel use of Redux in Yahoo Mail has led to significant user-facing benefits through a more performant application. It has also reduced development cycles for new features due to its simplified architecture. We’re excited to share our work with the community and would love to hear from anyone interested in learning more.
Kuhu Shukla (bottom center) and team at the 2017 DataWorks Summit
By Kuhu Shukla
This post first appeared here on the Apache Software Foundation blog as part of ASF’s “Success at Apache” monthly blog series.
As I sit at my desk on a rather frosty morning with my coffee, looking up new JIRAs from the previous day in the Apache Tez project, I feel rather pleased. The latest community release vote is complete, the bug fixes that we so badly needed are in and the new release that we tested out internally on our many thousand strong cluster is looking good. Today I am looking at a new stack trace from a different Apache project process and it is hard to miss how much of the exceptional code I get to look at every day comes from people all around the globe. A contributor leaves a JIRA comment before he goes on to pick up his kid from soccer practice while someone else wakes up to find that her effort on a bug fix for the past two months has finally come to fruition through a binding +1.
Yahoo – which joined AOL, HuffPost, Tumblr, Engadget, and many more brands to form the Verizon subsidiary Oath last year – has been at the frontier of open source adoption and contribution since before I was in high school. So while I have no historical trajectories to share, I do have a story on how I found myself in an epic journey of migrating all of Yahoo jobs from Apache MapReduce to Apache Tez, a then-new DAG based execution engine.
Oath grid infrastructure is through and through driven by Apache technologies be it storage through HDFS, resource management through YARN, job execution frameworks with Tez and user interface engines such as Hive, Hue, Pig, Sqoop, Spark, Storm. Our grid solution is specifically tailored to Oath’s business-critical data pipeline needs using the polymorphic technologies hosted, developed and maintained by the Apache community.
On the third day of my job at Yahoo in 2015, I received a YouTube link on An Introduction to Apache Tez. I watched it carefully trying to keep up with all the questions I had and recognized a few names from my academic readings of Yarn ACM papers. I continued to ramp up on YARN and HDFS, the foundational Apache technologies Oath heavily contributes to even today. For the first few weeks I spent time picking out my favorite (necessary) mailing lists to subscribe to and getting started on setting up on a pseudo-distributed Hadoop cluster. I continued to find my footing with newbie contributions and being ever more careful with whitespaces in my patches. One thing was clear – Tez was the next big thing for us. By the time I could truly call myself a contributor in the Hadoop community nearly 80-90% of the Yahoo jobs were now running with Tez. But just like hiking up the Grand Canyon, the last 20% is where all the pain was. Being a part of the solution to this challenge was a happy prospect and thankfully contributing to Tez became a goal in my next quarter.
The next sprint planning meeting ended with me getting my first major Tez assignment – progress reporting. The progress reporting in Tez was non-existent – “Just needs an API fix,” I thought. Like almost all bugs in this ecosystem, it was not easy. How do you define progress? How is it different for different kinds of outputs in a graph? The questions were many.
I, however, did not have to go far to get answers. The Tez community actively came to a newbie’s rescue, finding answers and posing important questions. I started attending the bi-weekly Tez community sync up calls and asking existing contributors and committers for course correction. Suddenly the team was much bigger, the goals much more chiseled. This was new to anyone like me who came from the networking industry, where the most open part of the code are the RFCs and the implementation details are often hidden. These meetings served as a clean room for our coding ideas and experiments. Ideas were shared, to the extent of which data structure we should pick and what a future user of Tez would take from it. In between the usual status updates and extensive knowledge transfers were made.
Oath uses Apache Pig and Apache Hive extensively and most of the urgent requirements and requests came from Pig and Hive developers and users. Each issue led to a community JIRA and as we started running Tez at Oath scale, new feature ideas and bugs around performance and resource utilization materialized. Every year most of the Hadoop team at Oath travels to the Hadoop Summit where we meet our cohorts from the Apache community and we stand for hours discussing the state of the art and what is next for the project. One such discussion set the course for the next year and a half for me.
We needed an innovative way to shuffle data. Frameworks like MapReduce and Tez have a shuffle phase in their processing lifecycle wherein the data from upstream producers is made available to downstream consumers. Even though Apache Tez was designed with a feature set corresponding to optimization requirements in Pig and Hive, the Shuffle Handler Service was retrofitted from MapReduce at the time of the project’s inception. With several thousands of jobs on our clusters leveraging these features in Tez, the Shuffle Handler Service became a clear performance bottleneck. So as we stood talking about our experience with Tez with our friends from the community, we decided to implement a new Shuffle Handler for Tez. All the conversation points were tracked now through an umbrella JIRA TEZ-3334 and the to-do list was long. I picked a few JIRAs and as I started reading through I realized, this is all new code I get to contribute to and review. There might be a better way to put this, but to be honest it was just a lot of fun! All the whiteboards were full, the team took walks post lunch and discussed how to go about defining the API. Countless hours were spent debugging hangs while fetching data and looking at stack traces and Wireshark captures from our test runs. Six months in and we had the feature on our sandbox clusters. There were moments ranging from sheer frustration to absolute exhilaration with high fives as we continued to address review comments and fixing big and small issues with this evolving feature.
As much as owning your code is valued everywhere in the software community, I would never go on to say “I did this!” In fact, “we did!” It is this strong sense of shared ownership and fluid team structure that makes the open source experience at Apache truly rewarding. This is just one example. A lot of the work that was done in Tez was leveraged by the Hive and Pig community and cross Apache product community interaction made the work ever more interesting and challenging. Triaging and fixing issues with the Tez rollout led us to hit a 100% migration score last year and we also rolled the Tez Shuffle Handler Service out to our research clusters. As of last year we have run around 100 million Tez DAGs with a total of 50 billion tasks over almost 38,000 nodes.
In 2018 as I move on to explore Hadoop 3.0 as our future release, I hope that if someone outside the Apache community is reading this, it will inspire and intrigue them to contribute to a project of their choice. As an astronomy aficionado, going from a newbie Apache contributor to a newbie Apache committer was very much like looking through my telescope - it has endless possibilities and challenges you to be your best.
About the Author:
Kuhu Shukla is a software engineer at Oath and did her Masters in Computer Science at North Carolina State University. She works on the Big Data Platforms team on Apache Tez, YARN and HDFS with a lot of talented Apache PMCs and Committers in Champaign, Illinois. A recent Apache Tez Committer herself she continues to contribute to YARN and HDFS and spoke at the 2017 Dataworks Hadoop Summit on “Tez Shuffle Handler: Shuffling At Scale With Apache Hadoop”. Prior to that she worked on Juniper Networks’ router and switch configuration APIs. She likes to participate in open source conferences and women in tech events. In her spare time she loves singing Indian classical and jazz, laughing, whale watching, hiking and peering through her Dobsonian telescope.
The collective thoughts of the interwebz
Manage Consent
To provide the best experiences, we use technologies like cookies to store and/or access device information. Consenting to these technologies will allow us to process data such as browsing behavior or unique IDs on this site. Not consenting or withdrawing consent, may adversely affect certain features and functions.
Functional
Always active
The technical storage or access is strictly necessary for the legitimate purpose of enabling the use of a specific service explicitly requested by the subscriber or user, or for the sole purpose of carrying out the transmission of a communication over an electronic communications network.
Preferences
The technical storage or access is necessary for the legitimate purpose of storing preferences that are not requested by the subscriber or user.
Statistics
The technical storage or access that is used exclusively for statistical purposes.The technical storage or access that is used exclusively for anonymous statistical purposes. Without a subpoena, voluntary compliance on the part of your Internet Service Provider, or additional records from a third party, information stored or retrieved for this purpose alone cannot usually be used to identify you.
Marketing
The technical storage or access is required to create user profiles to send advertising, or to track the user on a website or across several websites for similar marketing purposes.

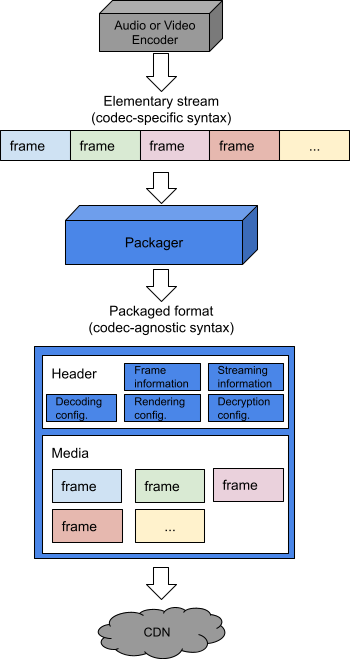


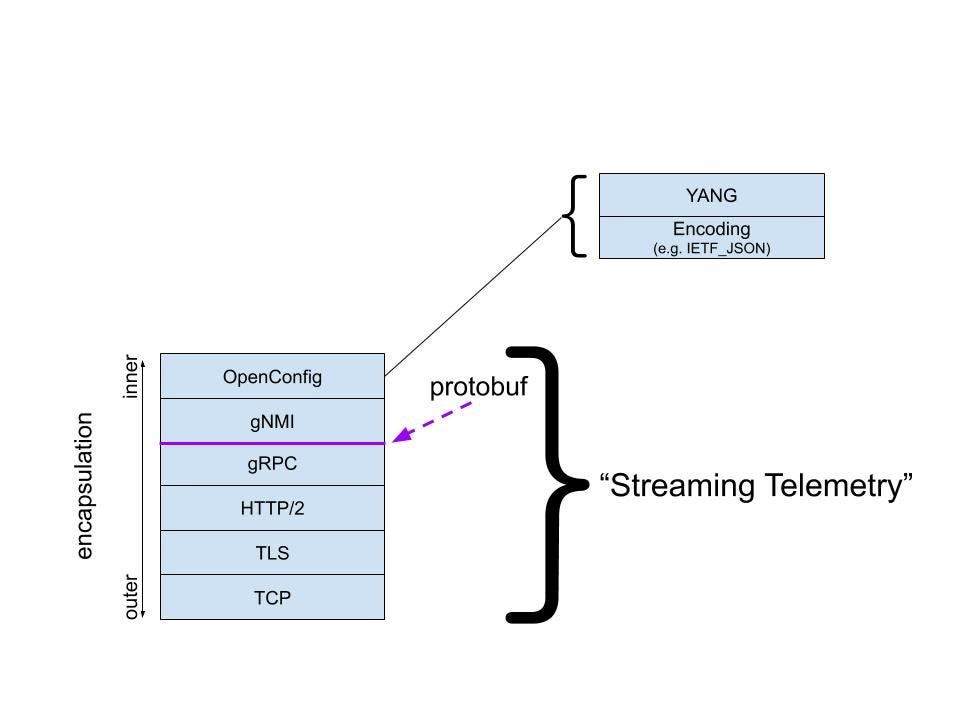

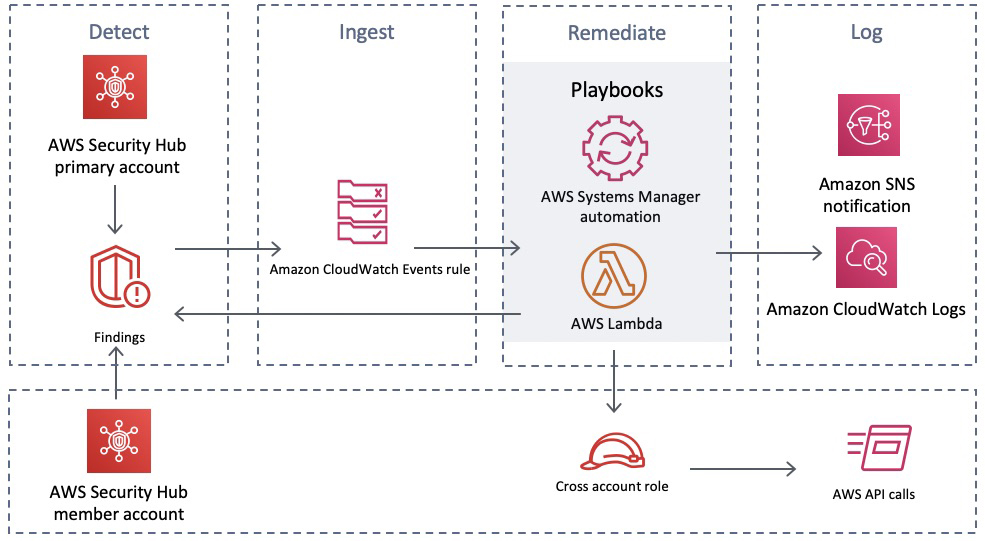


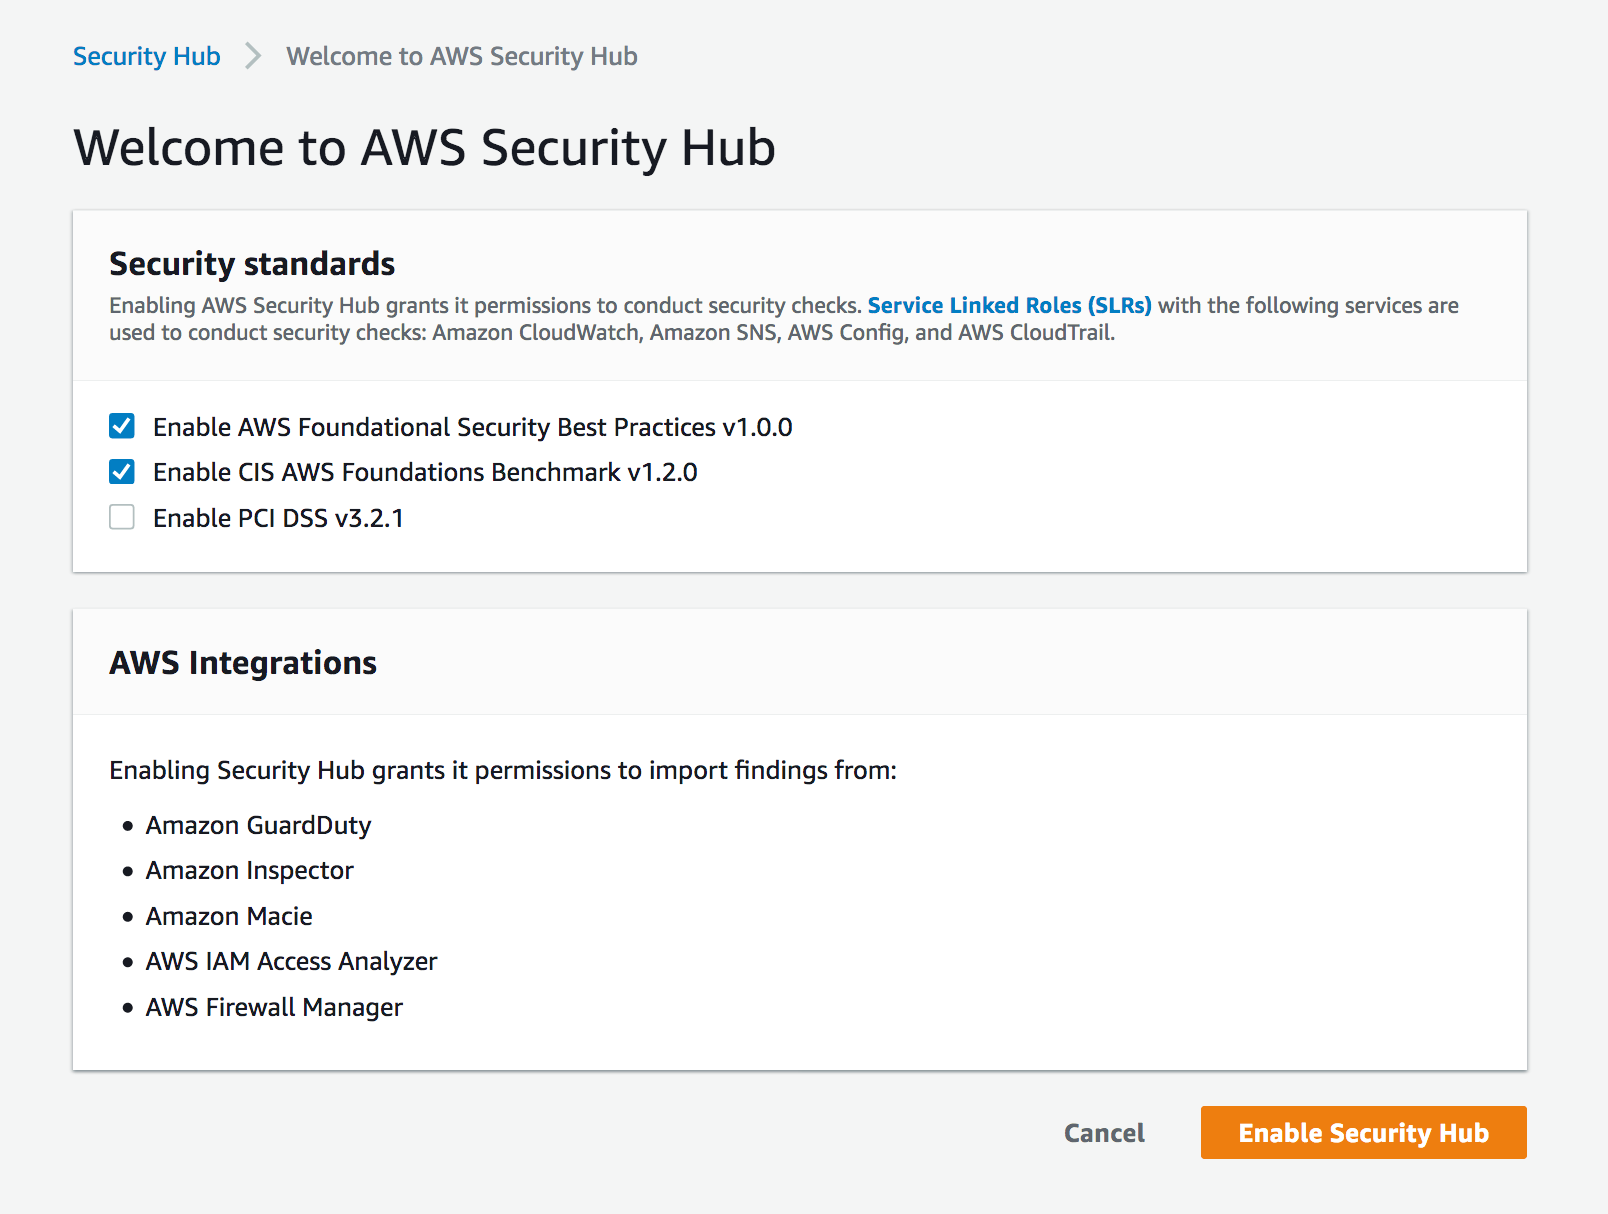


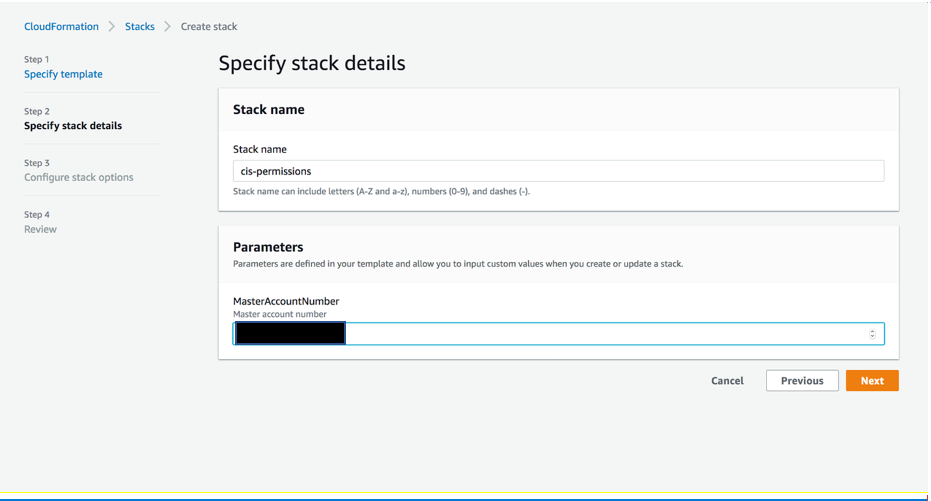


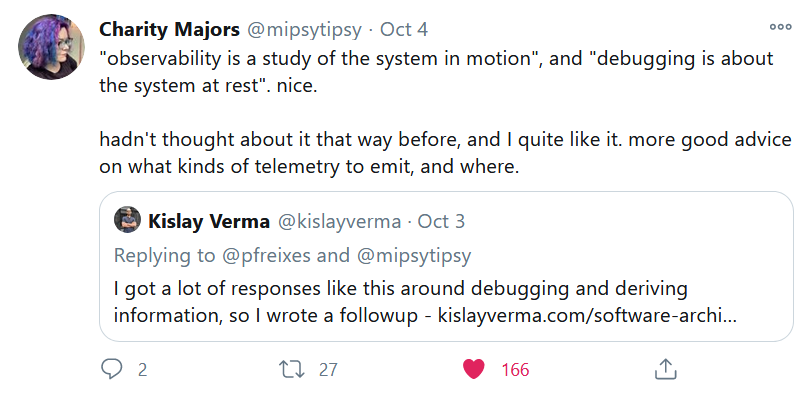
 Today we are launching a preview of