Tag Archives: Zabbix

NetBox as Home CMDB and Integrated with Zabbix

Post Syndicated from Janne Pikkarainen original https://blog.zabbix.com/netbox-as-home-cmdb-and-integrated-with-zabbix/29324/

Welcome to another episode of What’s up, home? weirdness! Who wouldn’t have their own NetBox at home – and who wouldn’t think of it as a  home CMDB? I’ve just started experimenting with it. For those who do not know, a Configuration Management Database (CMDB) is the source of truth for your inventory of stuff. In data centers, it keeps track of your servers, their cables, and everything else, telling you in which data center and which rack they are.

For me… well, take a look at for yourself. One picture says more than a thousand words of my storytelling.

What is it good for?

Well… in the real business world, it’s good for many things – from knowing about your assets, their serial numbers, purchase dates, hardware configuration, and so much else. I could go as deep as that, but there’s a limit how far even I want to go with these little experiments. Today’s case is merely to demonstrate the flexibility of Zabbix, yet again.

How did I do this?

I quickly threw the data in to NetBox by hand — it looks by a lot of work to do, but in fact, it wasn’t too bad – took me about 45 minutes to do the following:

  • Create a Site called “”What’s up, home?”
  • Create the rooms by adding new locations and making the previously created site as their parent
  • Add some manufacturers
  • Add some device roles
  • Add some device types

After that, adding the devices themselves is a breeze. If you have not used NetBox, this is what adding a new device looks like. Yes yes, in the real business world there would have been many more items for me to fill in, but for this case I only added the mandatory items and even those I could do just by choosing from the drop-down menus. Not a big deal.

…and the Zabbix integration?

Actually, this is something I created many years ago for other purposes, but still seems to work with today’s versions of NetBox. My little template queries NetBox over its API and asks if it has anything that matches with the host name that’s in Zabbix. If it has, then it gets the rack location and other stuff.

How this then works is pretty standard stuff. Retrieve a master item…

…and the dependent items then gather the data, parse some JSONPaths with Zabbix item preprocessing, and at least some of the items also populate bits and pieces in the Zabbix inventory. This is handy in real world, as your alerts can then contain the exact rack location and so forth about your failing devices. Add them as tags or add them as part of the alert text, your imagination is your limit.

Does it work?

Of course it does! Here’s the inventory grouped by manufacturer:

If I click on any of them, I get this:

Of course I can also browse the data through the latest data, for example…

…or I could just create some dashboards for visualizing all this. I have not done that yet, as this is what I did tonight so far and now I’m going to bed. To be continued – maybe! For now, the template only pulls data from NetBox, but I’d like to push data towards it as well, to also tell if a light bulb is powered on or not, for example. Stay tuned!


The post NetBox as Home CMDB and Integrated with Zabbix appeared first on Zabbix Blog.

What’s Up, Home? – Zabbix Plays Rock-Paper-Scissors

Post Syndicated from Janne Pikkarainen original https://blog.zabbix.com/whats-up-home-zabbix-plays-rock-paper-scissors/29310/

Zabbix 7.0 is so fast that in a small environment such as What’s up, home? it gets bored. Very bored.

What does Zabbix do when it gets bored? It uses its new Selenium-based Browser item type and plays some Rock-Paper-Scissors against this blog site.

But how does that work?

The idea is simple. My website hosts a very simple PHP script which returns back a random value of “Rock”, “Paper” or “Scissors”. Likewise, my Zabbix Selenium test picks up a random word out of those. Then, the Selenium test checks both answers and gets back the result.

So, in all seriousness, this blog post demonstrates you how the new Browser item type can react to different responses.

Backend code

Here’s the PHP script in all its g(l)ory:

<html>

<head>

<title>Whatsuphome.fi :: rock-paper-scissors</title>

</head>

<body>

<p>

<?php

$choices = ["Rock", "Scissors", "Paper"];

$random_choice = $choices[array_rand($choices)];

echo $random_choice;

?>

</p>

</body>

</html>

Nothing to call home about in that script: array with three choices, pick a random choice, print the result, done.

Zabbix side

I created a new Browser type item like this:

… and here’s the script part I just hammered in, so there might or might not be bugs. I really did not test this very thoroughly.

var browser = new Browser(Browser.chromeOptions());

const moves = ["Rock", "Scissors", "Paper"];

const zabbixMove = moves[Math.floor(Math.random() * moves.length)];

try {

browser.navigate("https://whatsuphome.fi/rps.php");

var opponentMove = browser.findElement("xpath", "//p").getText();

if (zabbixMove === opponentMove) {

var winner = "Draw";

}

else if (

(zabbixMove === "Rock" && opponentMove === "Scissors") ||

(zabbixMove === "Scissors" && opponentMove === "Paper") ||

(zabbixMove === "Paper" && opponentMove === "Rock")

) {

var winner="Zabbix";

}

else {

var winner="Opponent";

}

}

finally {

return ("Winner is " + winner + ". Zabbix move was " + zabbixMove + " and opponent move was " + opponentMove);

}

That’s it! From now on my Zabbix will play the game once per hour, although for this blog post I did manually click the Execute now button a few times. Again, here’s the same screenshot that was also in the beginning of this blog post.

Happy gaming!

The post What’s Up, Home? – Zabbix Plays Rock-Paper-Scissors appeared first on Zabbix Blog.

Open Source: The Option for a Connected and Collaborative World

Post Syndicated from Luciano Alves original https://blog.zabbix.com/open-source-the-option-for-a-connected-and-collaborative-world/29237/

In my previous article, where we explored the TCO and ROI of open-source software, I raised topics that sparked substantive discussions, new research, and renewed insights. It is undeniable that we live in an era where collaboration and connectivity go beyond trends. They represent the foundation of current technology, especially in a world based on APIs.

In this context, open-source software stands out and positions itself as a logical and natural choice for companies and organizations (both public and private) that seek innovation, flexibility, security, and agility. Over the last two decades, the technology sector has validated this direction. Recently, the Open Source Program Office (OSPO) appeared in Gartner’s Hype Cycle for Emerging Technologies report, reinforcing its relevance and emerging as a maturing trend within 2 to 5 years.

Open Source in Gartner’s Hype Cycle

Gartner’s Hype Cycle for Emerging Technologies is a well-known tool for illustrating the phases of maturity, adoption, and impact of new technologies. In the current cycle, the Open Source Program Office (OSPO) appears as an emerging technology with the potential for corporate transformation in the coming years.

This highlights that it is not only a viable alternative to proprietary software, but an engine of innovation within organizations. The OSPO is, essentially, an internal structure in companies dedicated to promoting and managing the use of open-source software, ensuring compliance and governance.

With the strengthening of these structures, organizations not only maximize the benefits of open source but also foster a culture of continuous innovation and active collaboration with communities, whether through service contracts, participation in working groups, or even funding new functionalities.

A Natural Strategic Choice

Experience shows that open source is a strategic path for organizations aiming to thrive in an increasingly interconnected and competitive market. The transparency, flexibility, and scalability offered by such solutions surpass the limitations of proprietary solutions, facilitating a more adaptable and agile adoption.

Additionally, the collaborative approach of this model aligns with today’s reality, where knowledge sharing and co-creation are essential for technological development within organizations. Companies like Google, Microsoft, and Red Hat have already recognized this reality and invest in their own Open Source Program Offices. These initiatives not only underline the commitment to open innovation but also highlight tangible benefits in terms of efficiency, cost reduction, and speed in the development of innovations.

The Future is Open Source

The inclusion of OSPO in Gartner’s Hype Cycle indicates that companies that have not yet embarked on this journey need to reconsider their strategies. In an environment where constant adaptation and innovation are essential for growth and efficiency, open source has ceased to be optional and has become a necessity. As adoption expands across various sectors and applications, companies that build a solid framework for evaluating and maximizing the benefits of these technologies will be in a privileged position to lead their markets.

At Zabbix, we understand the importance of open source not just as a technological solution, but as a philosophy aimed at democratizing technology, fostering continuous innovation, and cultivating a culture of collaboration—a vision that OSPOs have been solidifying in companies across multiple industries. The discussion about the Total Cost of Ownership (TCO) and Return on Investment (ROI) in open-source solutions is just the starting point.

Tools like Zabbix prove that this is an effective strategy for monitoring and maintaining critical environments. Open source is, and will continue to be, the driving force behind the innovations that will transform the way companies sustain their businesses and interact with customers and users. The future is already open source, and the time to embrace this transformation is now.

The post Open Source: The Option for a Connected and Collaborative World appeared first on Zabbix Blog.

Zabbix Summit 2024 in Review

Post Syndicated from Michael Kammer original https://blog.zabbix.com/zabbix-summit-2024-in-review/28901/

In what has become a highly anticipated annual tradition, Zabbix employees, partners, users, and just plain fans from every corner of the globe showed up in Riga on October 4 and 5 for Zabbix Summit 2024, celebrating a very special open-source monitoring solution that unites us all.

The 12th in-person version of our premier yearly event saw delegates arrive from 48 different countries, and just as every year the atmosphere was like a family reunion, with old friends reconnecting, remote colleagues meeting for the first time in person, and plenty of good vibes all around.

In case you couldn’t manage to make it to Riga and participate, fear not – we’ve put together this post to try to give you a taste of what Zabbix Summit 2024 was all about. As long-time Zabbix veterans say, “There’s nothing like a Zabbix Summit!”

And now, a word from our sponsors

Zabbix Summit 2024 could never have happened without the assistance of our featured sponsors, all part of Zabbix’s official partner network:

initMAX – Diamond Sponsor
IntelliTrend – Platinum Sponsor
IZI-IT – Platinum Sponsor
Quadrata – Platinum Sponsor
Allenta – Gold Sponsor
Metricio – Gold Sponsor
Docomo Business – Gold Sponsor
SRA OSS – Silver Sponsor
Inqbeo – Lunch and coffee break sponsor

Opening doors and minds alike

The day before the Summit, our team welcomed dozens of guests to our office for the traditional pre-Summit Open-Door day. We provided a whiteboard where attendees could leave their thoughts about Zabbix, set up a special Zabbix quiz, and organized a guided tour of the office. Countless questions were asked and answered, endless cups of coffee were poured, and a friendly, welcoming vibe was established that lasted through the end of the Summit and beyond.

Live from the main stage

This year’s Summit hosted 36 speakers who gave 34 speeches. Allowing our audience to ask questions during live Q&A sessions proved so popular last year that there was little doubt we’d continue it this year, as it promotes audience participation and keeps the speakers themselves on their toes. Here are brief recaps of a few of the standout speeches:

Zabbix Cloud and the way forward

Our CEO and Founder Alexei Vladishev kicked off the presentations with a keynote speech that introduced Zabbix Cloud and listed all the features that make it a secure, flexible, and functional alternative to the Zabbix we all know and love. Alexei also gave a short preview of the upcoming Zabbix 7.2 version. Stay tuned!

An intro to Zabbix Cloud

Zabbix Head of Product Dmitrijs Lamberts provided a deeper dive into Zabbix Cloud, sharing detailed information on how Zabbix Cloud works, providing insight into the pricing tiers, and explaining all the features and benefits that have the Zabbix community buzzing with excitement, whetting the audience’s appetite for a live demo he conducted on Day 2 of the Summit.

Using Zabbix to monitor solar energy

Mitsuhiro Ono of the Toyota Motor Corporation and Toshihiro Akamatsu of SRA OSS showed how they achieve distributed monitoring with Zabbix. They also demonstrated a case study that showed exactly how they use their Zabbix dashboard to provide the kind of detailed solar energy oversight that makes the adoption of green power in Japan possible.

Keeping tabs on MariaDB

On Day 2 of the Summit, Anders Karlsson of the MariaDB Corporation discussed how to monitor and manage MariaDB Server Clusters running with the MariaDB MaxScale database proxy. He also demonstrated how MariaDB MaxScale (which also monitors the MariaDB Servers) comes into the picture and touched on topics like managing failover, monitoring database traffic, and routing and load balancing.

Meeting security challenges with Zabbix

Gabriele Minniti and Vincenzo Morrone of Whysecurity demonstrated how the power of the Zabbix API can combine with the APIs of the vendors they work with to create centralized dashbords for controlling the cybersecurity posture of all their customers, no matter what technologies are being used.

The business track

For the first time at Zabbix Summit 2024, we constructed a second stage for slightly less technical, more business-oriented presentations. The speeches delivered there were among the most thought-provoking and fascinating of the Summit, and did much to help us reach new audiences. Here are a few highlights:

An evolving IT monitoring landscape

Zabbix LatAm CEO Luciano Alves gave a well-received talk that focused on the latest trends in the global monitoring market, presenting the results of a survey that took the pulse of over 100 global enterprise organizations.

Zabbix for managed service providers (MSPs)

Andre Morton of AGM Network Consultancy explained why having a flexible and scalable monitoring solution is extremely vital for MSPs and showed how a variety of different features, from authentication mechanisms to automatic remediation and visualization, work together to make Zabbix the perfect monitoring solution for MSPs.

Yes, we still had time for fun!

The Zabbix community works together, innovates together, and when it’s time to let off steam they have fun together at our Summit networking events, of which there were three this year:

  • This year’s welcome event was held at the architecturally stunning National Library of Latvia – or as Latvians call it, “The Castle of Light.” Tasty beverages and delicious food were on the menu, as was a guided tour of the library itself.
  • The main event was held at Riga’s famed Fantadroms Concert and Event Space, where attendees could dance to live music and enjoy more food and drinks as they caught up with friends and forged valuable connections with their counterparts in other organizations.
  • We sent the community on their way with a closing event at the Burzma food hall in Riga’s old town, with a cornucopia of food and music from around the world as well as plenty of opportunities for attendees to relive the Summit, have a few laughs, and wish each other well until next year!

Couldn’t make it this year? No problem!

At this point, you’re probably regretting that you didn’t manage to attend the Summit, but don’t worry – you can recreate the atmosphere in the privacy of your own home or office!

Recordings of both days are available on Zabbix’s YouTube channel:

Streaming – Zabbix Summit 2024 Day 1 
Streaming – Zabbix Summit 2024 Day 2

The slides and texts of the presentations are also available for reference and download here as well.

Whether you attended in person or streamed the Summit online, we hope that you had a great time, learned a lot, and are eager to do it all again in 2025!

The post Zabbix Summit 2024 in Review appeared first on Zabbix Blog.

How a Custom Zabbix Solution Maximized Efficiency for an MSP

Post Syndicated from Kristy Slimmer original https://blog.zabbix.com/how-a-custom-zabbix-solution-maximized-efficiency-for-an-msp/28810/

Discover how our partners at ATS Group designed and implemented a custom Zabbix solution that allowed a large managed service provider (MSP) to monitor and manage a vast array of client devices across multiple data centers.

The Challenge: Addressing Infrastructure Monitoring Complexities

When a federal government contractor specializing in IT managed services secured a contract to manage the infrastructure for a large federal agency, they faced a daunting challenge: how to effectively monitor and manage the vast array of devices under their purview using a single, comprehensive solution.

Real-time monitoring and immediate alerts for any issues were non-negotiable requirements. The sheer scale and complexity of the infrastructure demanded a robust monitoring system capable of providing insights across multiple data centers and diverse technologies.

The MSP, aware of the need for a trusted and experienced partner, turned to ATS Group to tackle the complexities of its observability and management challenge.

The Solution: Architecting a Custom Zabbix Solution

ATS Group, North America’s exclusive Zabbix Premium Partner, brings over two decades of experience in monitoring and optimizing enterprise IT environments. ATS Group architected and implemented a custom solution that leveraged Zabbix’s flexibility and scalability, demonstrating their deep knowledge of the technology and ability to handle complex challenges.

The ATS team deployed an on-premise Zabbix Server, accompanied by Zabbix Proxy Servers placed in each data center. This distributed architecture was a key factor in ensuring seamless monitoring across geographically dispersed environments while minimizing latency, a critical factor in managing such a vast infrastructure.

Custom Zabbix Solutions delivered by the ATS Group

From there, ATS implemented various Zabbix customizations that were integral to meeting the agency’s unique and diverse infrastructure needs, including developing templates and integrations.

Templates. ATS developed numerous templates covering a broad spectrum of technologies (including OpenShift, VMware, Dell, HP, Cisco UCS, Hitachi, NetApp, Pure, Brocade, Commvault, Linux, and Windows) to provide comprehensive monitoring capabilities tailored to the specifics of each component, ensuring a detailed view of the entire infrastructure stack.

Integrations. ATS built customized integrations for several third-party products. An integration with OpenShift allowed for alerts configured within OpenShift to be directly ingested and processed by Zabbix. The integration with VMware allowed Zabbix to detect when an administrator put a host in maintenance in VMware, automatically creating a maintenance period for that host within Zabbix to eliminate unwanted alerts while the host was being serviced.

Finally, integrations with ServiceNow and Operations Bridge Manager (OBM) enabled streamlined incident management workflows, ensuring that issues were promptly detected, triaged, and addressed with minimal manual intervention – and the proper stakeholders were notified within the customer and service provider organizations.

Trigger Actions. ATS implemented custom trigger actions to automate responses to predefined events. Whether restarting a service upon failure or executing remediation scripts, these trigger actions helped maintain system stability, minimize downtime, and reduce the workload (and callouts in the middle of the night!) for system administrators.

Dashboards. ATS designed custom dashboards to provide stakeholders with intuitive, real-time insights into the infrastructure’s health and performance. These dashboards served as a centralized hub, offering a comprehensive view of the entire environment with actionable insights to drive informed decision-making.

The Results

A custom Zabbix solution delivers visibility, streamlined monitoring, proactive management, and enhanced client satisfaction. The impact of the custom Zabbix solution was immediate and profound. By leveraging the power of Zabbix and the expert skill of the ATS team, the MSP gained unprecedented visibility and control over their client’s sprawling infrastructure. The benefits included:

Greater Operational Efficiency. With a unified view of the entire infrastructure and real-time alerts for any issues, our client experienced a significant improvement in operational efficiency. Proactive management and automated responses minimized downtime, allowing resources to be allocated more strategically.

Faster Incident Response. Issues were detected instantaneously, and relevant stakeholders were promptly alerted, enabling swift resolution and minimizing the impact on operations. This streamlined incident response mechanism reduced mean time to resolution (MTTR) and enhanced overall system reliability.

Increased Revenue. Delighted by the efficiency and effectiveness of our client’s management and monitoring capabilities, the end-user federal agency recognized the value of their partnership and expanded the scope of the contract.

This testament to our client’s success underscores the transformative impact of our solution, paving the way for further collaboration and growth opportunities. As a result, ATS Group and the managed services provider continue to expand their partnership and are solving complex infrastructure problems for numerous additional clients.

The post How a Custom Zabbix Solution Maximized Efficiency for an MSP appeared first on Zabbix Blog.

Monitoring Zabbix Security Advisories

Post Syndicated from Brian van Baekel original https://blog.zabbix.com/monitoring-zabbix-security-advisories/28672/

Zabbix plays a crucial role in monitoring all kinds of “things” – IoT devices, domains, cloud infrastructures and more. It can also be integrated with third-party solutions – for example, with Oxidized for configuration backup monitoring. Given the nature of Zabbix, it usually contains a lot of confidential information as well as (more importantly) some kind of elevated access to network elements while being used by operators, engineers, and customers. This requires that Zabbix as a product should be as secure as possible.

Zabbix has upped their security game and is actively working with HackerOne to take full advantage of the reach of their global community by providing a bug bounty program. And though it doesn’t happen too often, from time to time a security issue arises in Zabbix or one of its dependencies, warranting the release of a Security Advisory.

The issue

Zabbix typically releases a Security Advisory and might even assign a CVE to the issue. Cool, that is what we expect from reputable software developers. They even inform their customers with support contracts before publishing the advisory, in order to allow them to patch installations beforehand.

Unfortunately, if you don’t have a support contract you’re expected to find out about these security advisories on your own, either by monitoring the Security Advisory page or by monitoring the published CVEs for Zabbix. NIST has a public API that can be used and that works well, but the issue with CVE’s is that they are often incomplete and thus useless. For example, CVE-2024-22119 contains far less information than the advisory.

Currently, Zabbix does not publish an API for their Security Advisories. There is the public tracker which contains all entries and can be queried via API, but because it is unstructured text, it is really hard to parse.

The solution

We want to automatically be notified of new security advisories, and the only data source that contains all data in a structured way is the Zabbix Security Advisory page. However, structured doesn’t mean easily parseable – in fact, it is just raw HTML. We could try to solve this issue in Zabbix, but the easier solution in this case is to scrape the page and generate a JSON file which then can be parsed by Zabbix to achieve our goal, which is automated notifications of new advisories.

Webscraping

We’ve chosen to scrape the Zabbix site using Rust, utilizing the Scraper crate to parse the HTML and flesh out the relevant parts we want. Without going into too much detail, the interesting information is stored in 2 tables, one with the table-simple class applied and one with the table-vertical class applied. Using CSS selectors (which is what the Scraper crate requires), we can retrieve the information we want.

This information is then stored in a struct, which gets added to a hashmap. The result is stored in a vector, which is added to a struct, which eventually is used to generate the JSON we require. Phew.

The resulting JSON is easily parseable by Zabbix:

{
  "last_updated": {
    "secs": ,
    "nanos": ,
  },
  "reports": [
    _list of reports_
  ]
}

The ‘reports’ array contains one entry per advisory, and each entry has the following layout. Unsurprisingly, this closely matches the information that is available on the Zabbix Security Advisory page:

    {
      "_zbxref_": {
        "zbxref": "_zbxref_",
        "cveref": "CVE-XXXX-XXXX",
        "score": X.X,
        "synopsis": "_synopsis_",
        "description": "_description_",
        "vectors": "_vectors_",
        "resolution": "_resolution_",
        "workaround": "_workaround_",
        "acknowledgement": "_acknowledgement_",
        "components": [
          _list of components_,
          _list of components_
        ],
        "affected_version": [
          {
            "affected": "_version_",
            "fixed": "_version_"
          }
        ]
      }
    }

Now, we could provide you with the code of the scraping tool and wish you good luck with making sure the tool runs every X hours and somehow, somewhere stores the resulting JSON for Zabbix to parse. That would be the easy way out, right?

Instead, we’ve chosen to host the Rust program as an AWS Lambda function, triggered every 2 hours by the AWS EventBridge Scheduler and with some code added to the Rust program (function?) to upload the resulting JSON to an AWS S3 bucket. This chain of AWS products not only makes sure that our cloud bill increases, but also guarantees we don’t have to host (and maintain!) anything ourselves.

The result? Just one HTTP GET away…

Template

TL;DR: Download the template here.

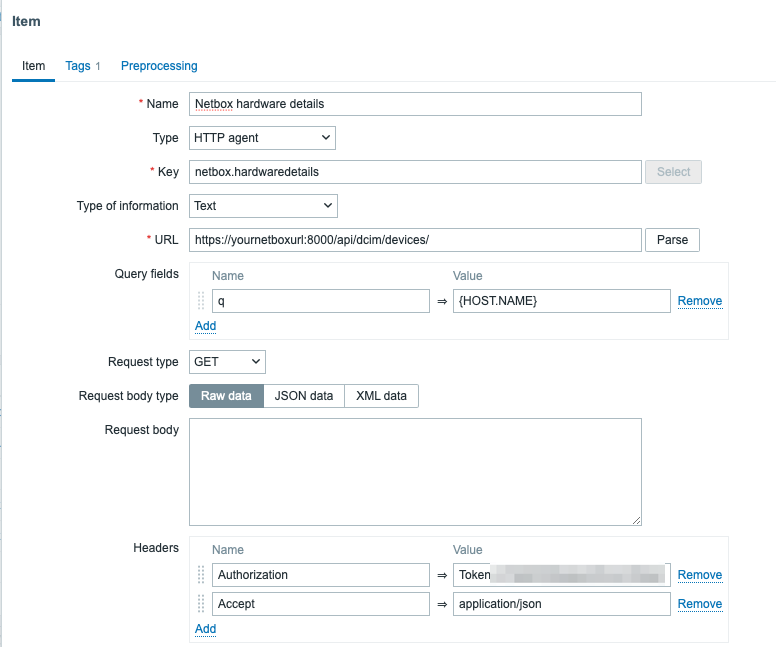
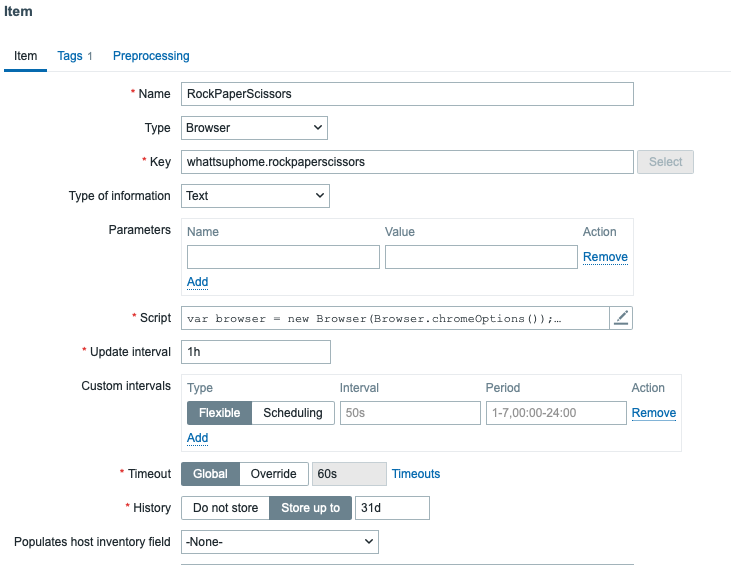
Now that the data is available in JSON, it’s fairly easy to parse it using Zabbix. Using the HTTP Agent data collection, we download the JSON from AWS. The URI is stored in the {$ZBX_ADVISORY_URI} macro, which allows for easy modification. By default, it points to the JSON file hosted on AWS S3. This retrieval is done by the Retrieve the Zabbix Security Advisories item, which acts as the source for every other operation. It retrieves the JSON every hour, and with the JSON being generated every 2 hours, the maximum delay between Zabbix publishing a new advisory and you getting it into Zabbix is 3 hours.

The retrieve the Zabbix Security Advisories item acts as a master item for the Last Updated item. This item uses a JSONPath preprocessing step to flesh out the information we want: $.last_updated.secs. The resulting data is stored as unixtime so that we mere mortals can easily read when the last update of the JSON file was performed.

A trigger is configured for this item to ensure that the JSON file isn’t too old. The trigger JSON Feed is out of date has the following expression:
last(/Zabbix Security Advisories/zbx_sec.last_updated)>{$ZBX_ADVISORY_UPDATE_INTERVAL}*{$ZBX_ADVISORY_UPDATE_THRESHOLD}

By default, {$ZBX_ADVISORY_UPDATE_INTERVAL} is set to 2 hours (which is the interval the file gets updated by our tool) and {$ZBX_ADVISORY_UPDATE_THRESHOLD} is set to 3. So, when the JSON file hasn’t been updated within the last 6 hours, this trigger will trigger.

The item Number of advisories uses the same principle, where a JSONPath preprocessing step is used to flesh out the information we want: $.reports. However, as $.reports is an array, we can use functions on it. In this case .length(), which returns an integer. This number is used in the associated trigger A new Zabbix Security Advisory has been published, which simply triggers when the value changes.

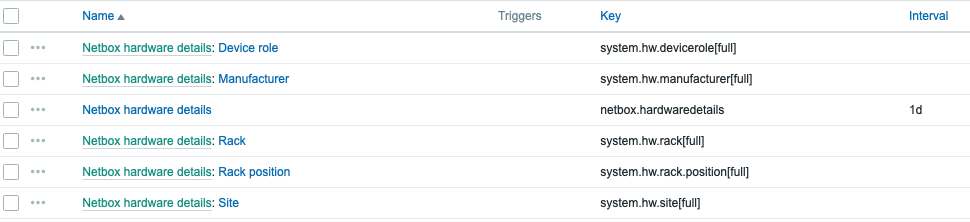
This is all very cool, but the JSON has a lot more information, including details about each report. In order to get these details into Zabbix, we use a discovery rule to ‘loop’ through the JSON and create items based on what we’ve discovered: Discover Advisories. This rule uses (again) a JSONPath preprocessing step to get the details we want: $.reports[*][*]. Based on the resulting data (which is a single report in this case), 2 LLD Macros are assigned: {#ZBXREF} – based on the JSONpath $.zbxref and {{#CVEREF} – based on the JSONpath $.cveref.

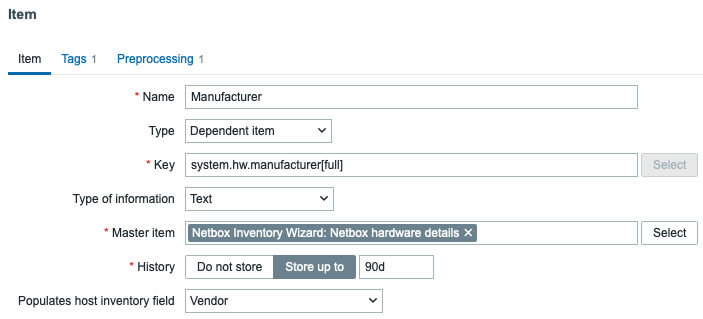
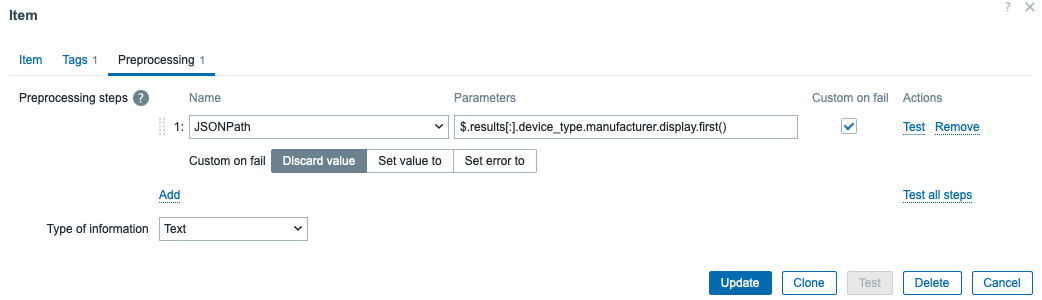
For each discovered report, 8 items are created. They all work using the same principle, so I will only describe one: Advisory {#ZBXREF} / {#CVEREF} – Acknowledgement. This item uses the master item Zabbix Security Advisories, just like all other items described so far. JSONPath is once again used to get the information we want. The expression $.reports[*][“{#ZBXREF}”].acknowledgement.first() provides exactly what we need, where we combine a LLD macro ({#ZBXREF}) and a JSONpath function (.first()) to first ‘select’ the correct advisory in the JSON and then retrieve the value.

All other 7 items work like this, and there is only one exception: Advisory {#ZBXREF} / {#CVEREF} – Components. The ‘components’ value in the JSON file is actually an array with 1 or more items, describing which components might be affected. But we cannot store arrays in Zabbix, so we use another preprocessing step to convert the array into a string. A few lines of Javascript is all we need:

components = JSON.parse(value);
return components.toString();

First, we parse the JSON input (‘value’) into an array, only to apply the javascript .toString() function on it. The toString method of arrays calls join() internally, which joins the array and returns one string containing each array element separated by commas, which is exactly what we want: a string, separated by commas.

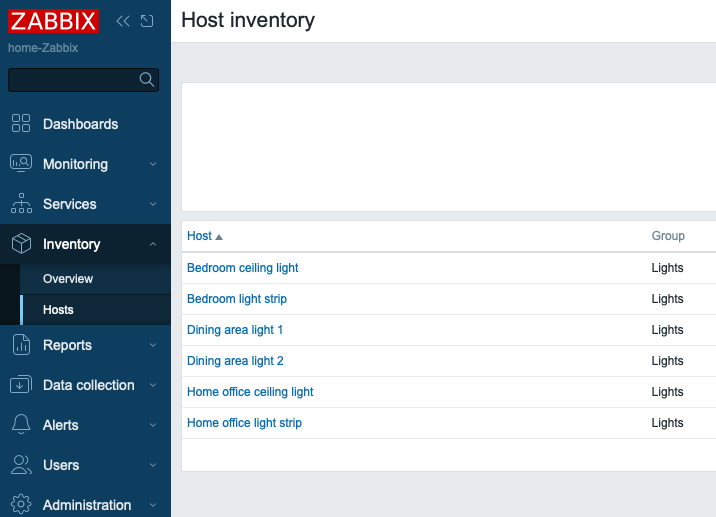
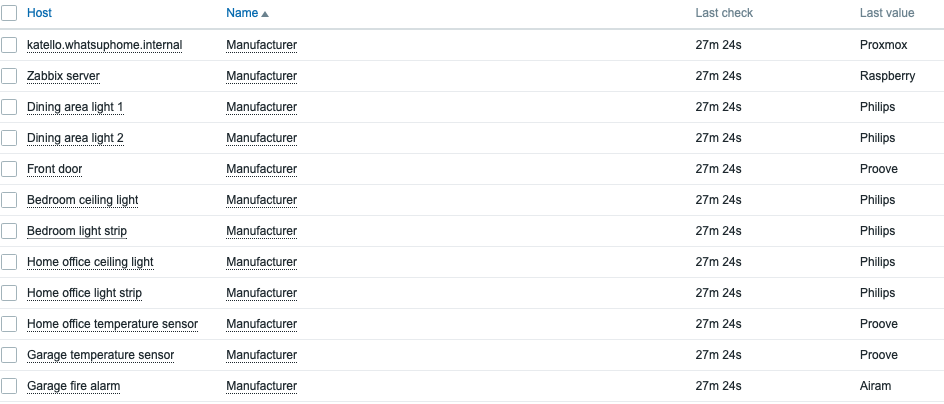
To make working with these advisories easier, each item has the component tag applied, with the value zabbix_security. If the item belongs to an advisory, the advisory tag is added with the value of {#ZBXREF} (which is the advisory number/name). That way, we can easily filter on all Zabbix Security items, filter on all items for a single advisory, and (to make things even better) the type tag is also applied, with the actual type being ‘workaround’ or ‘description.’ This allows for filtering on all Zabbix Security items, of the type ‘score’ (et cetera) to easily gain insight into the different advisories and their score, synopsis, description, components, et cetera.

Dashboard

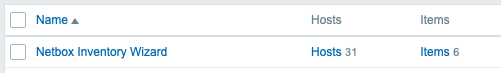
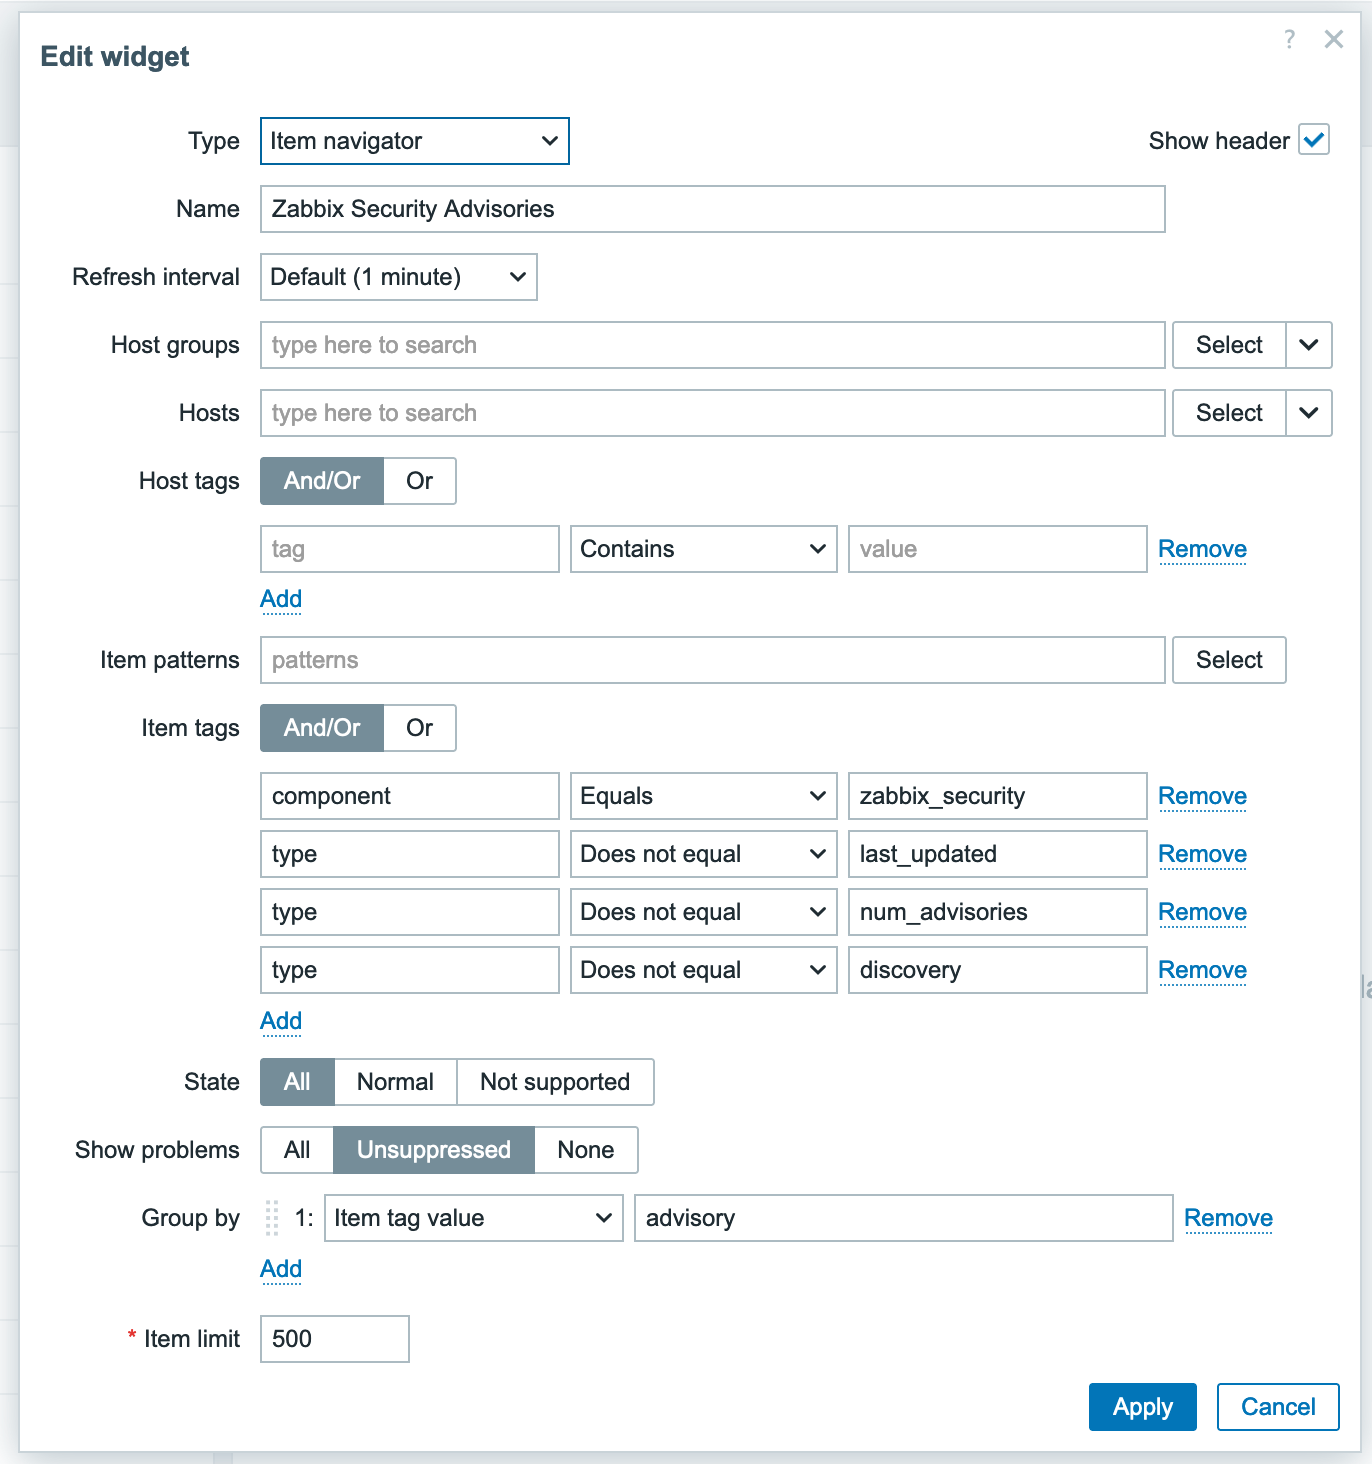
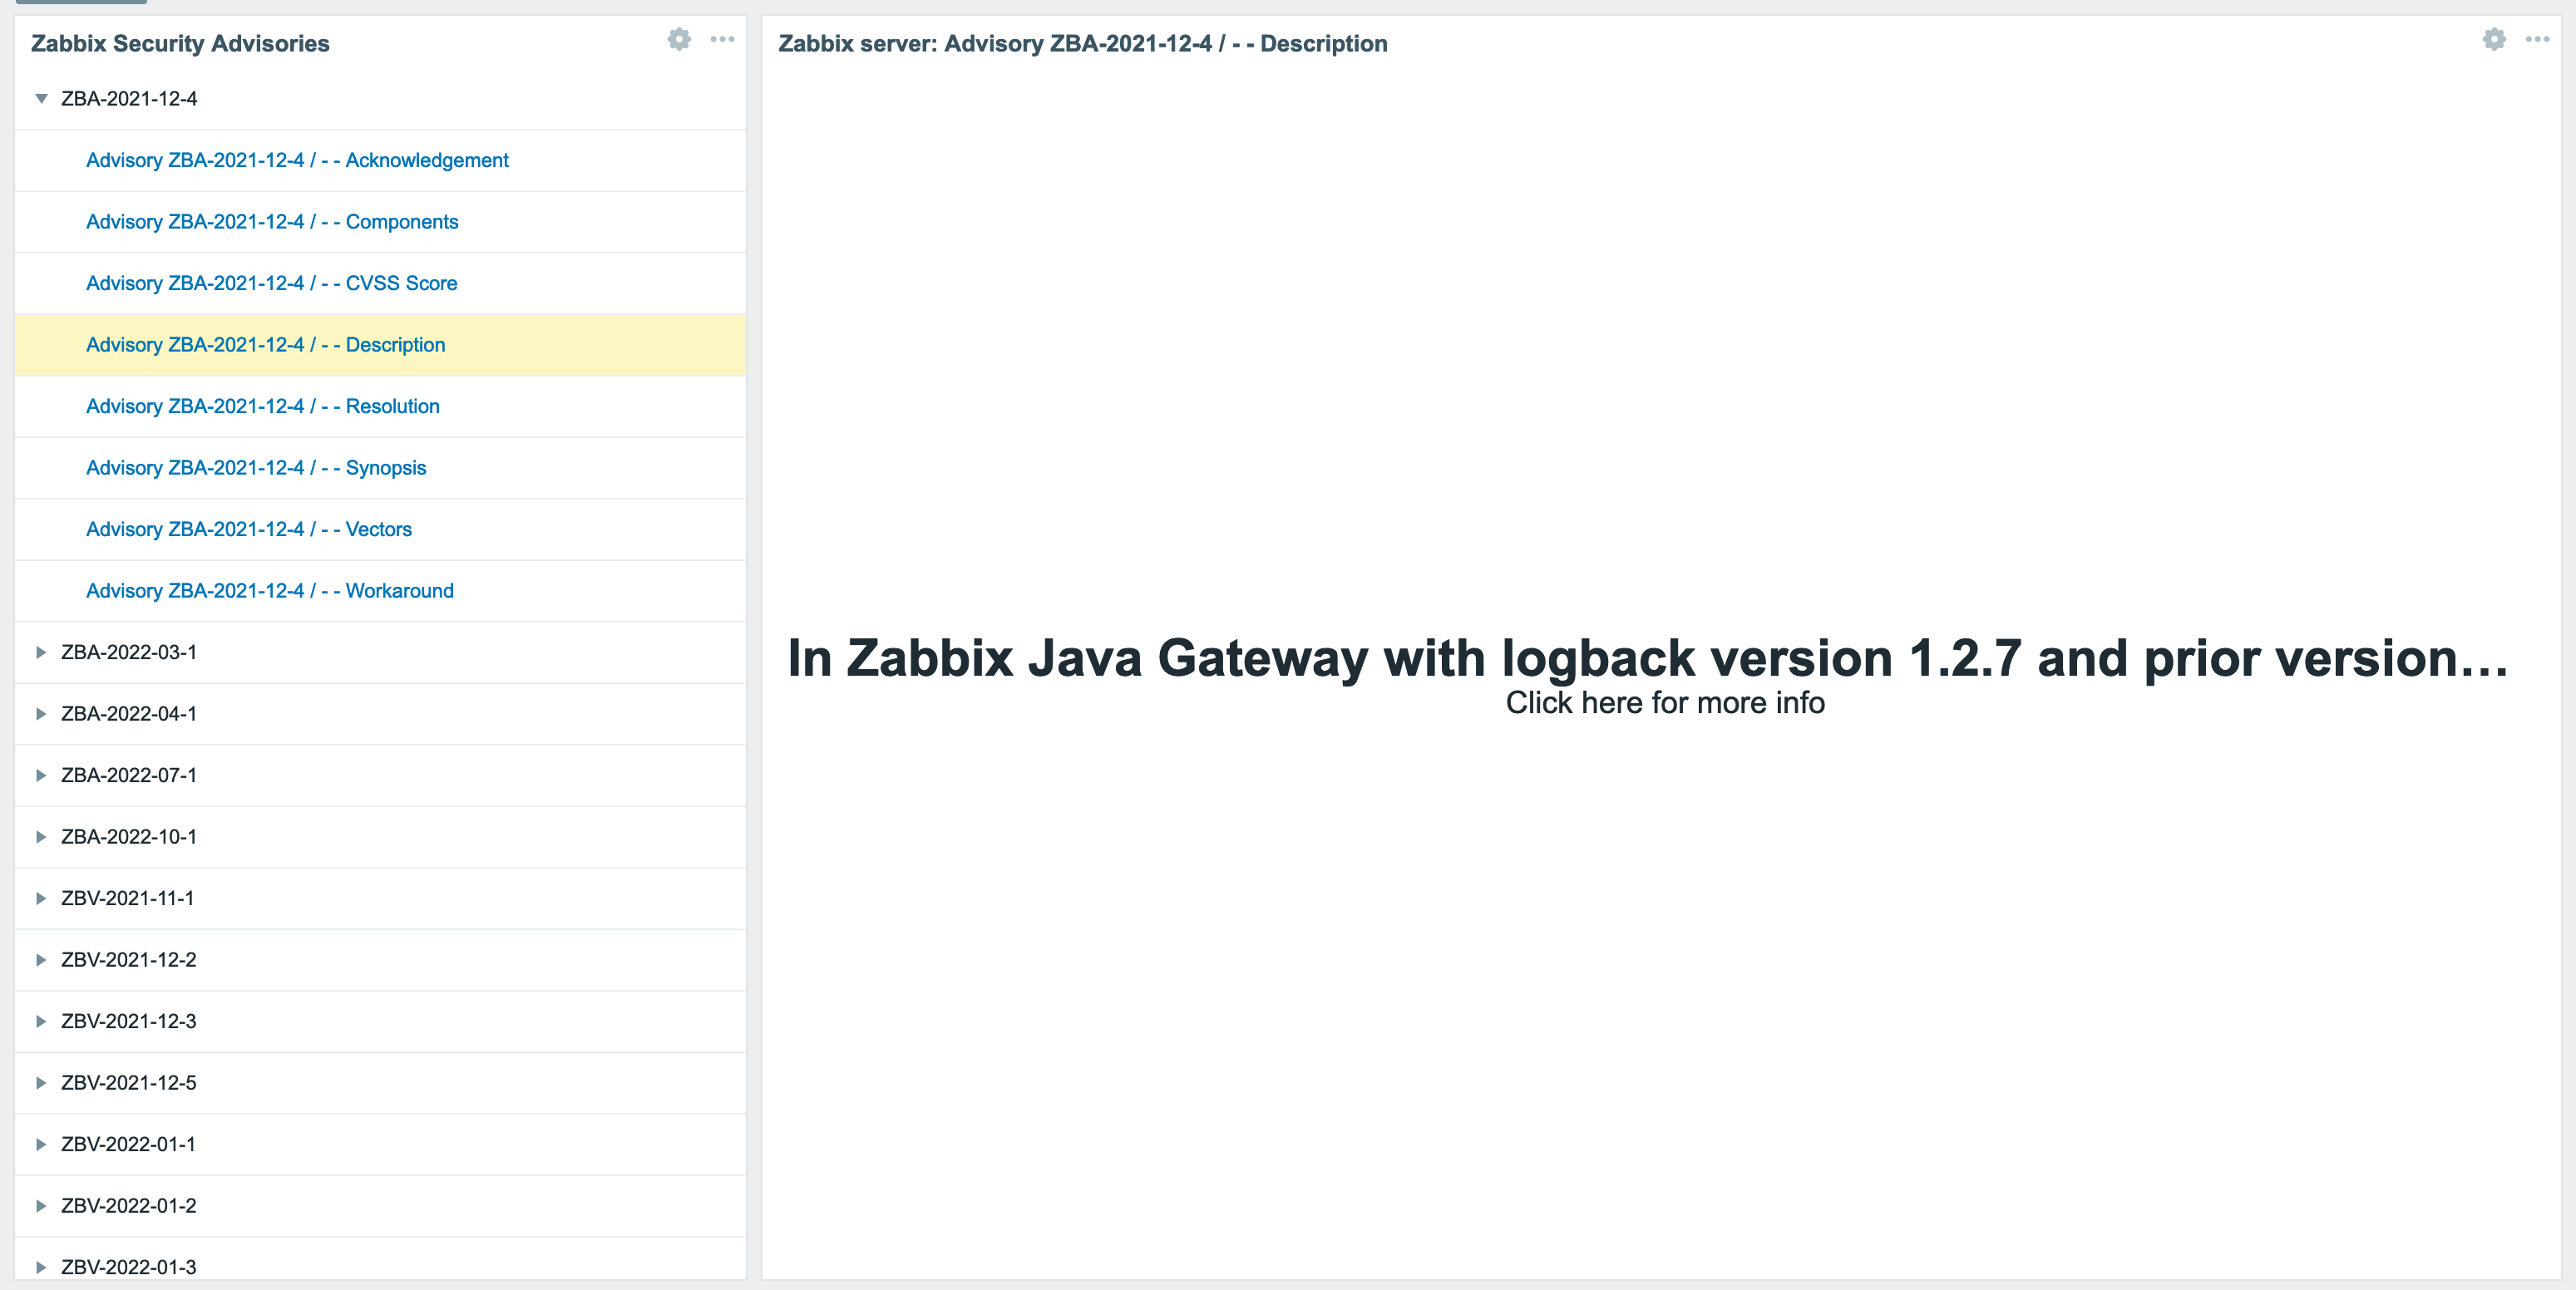
The tags on the items allow for filtering, but with Zabbix 7.0 we can use all great new nifty features, such as the Item Navigator widget combined with the Item Value widget. Let’s take a look at what configuring such a dashboard might look like if you set up the Item Navigator widget as follows:

Item Navigator configuration

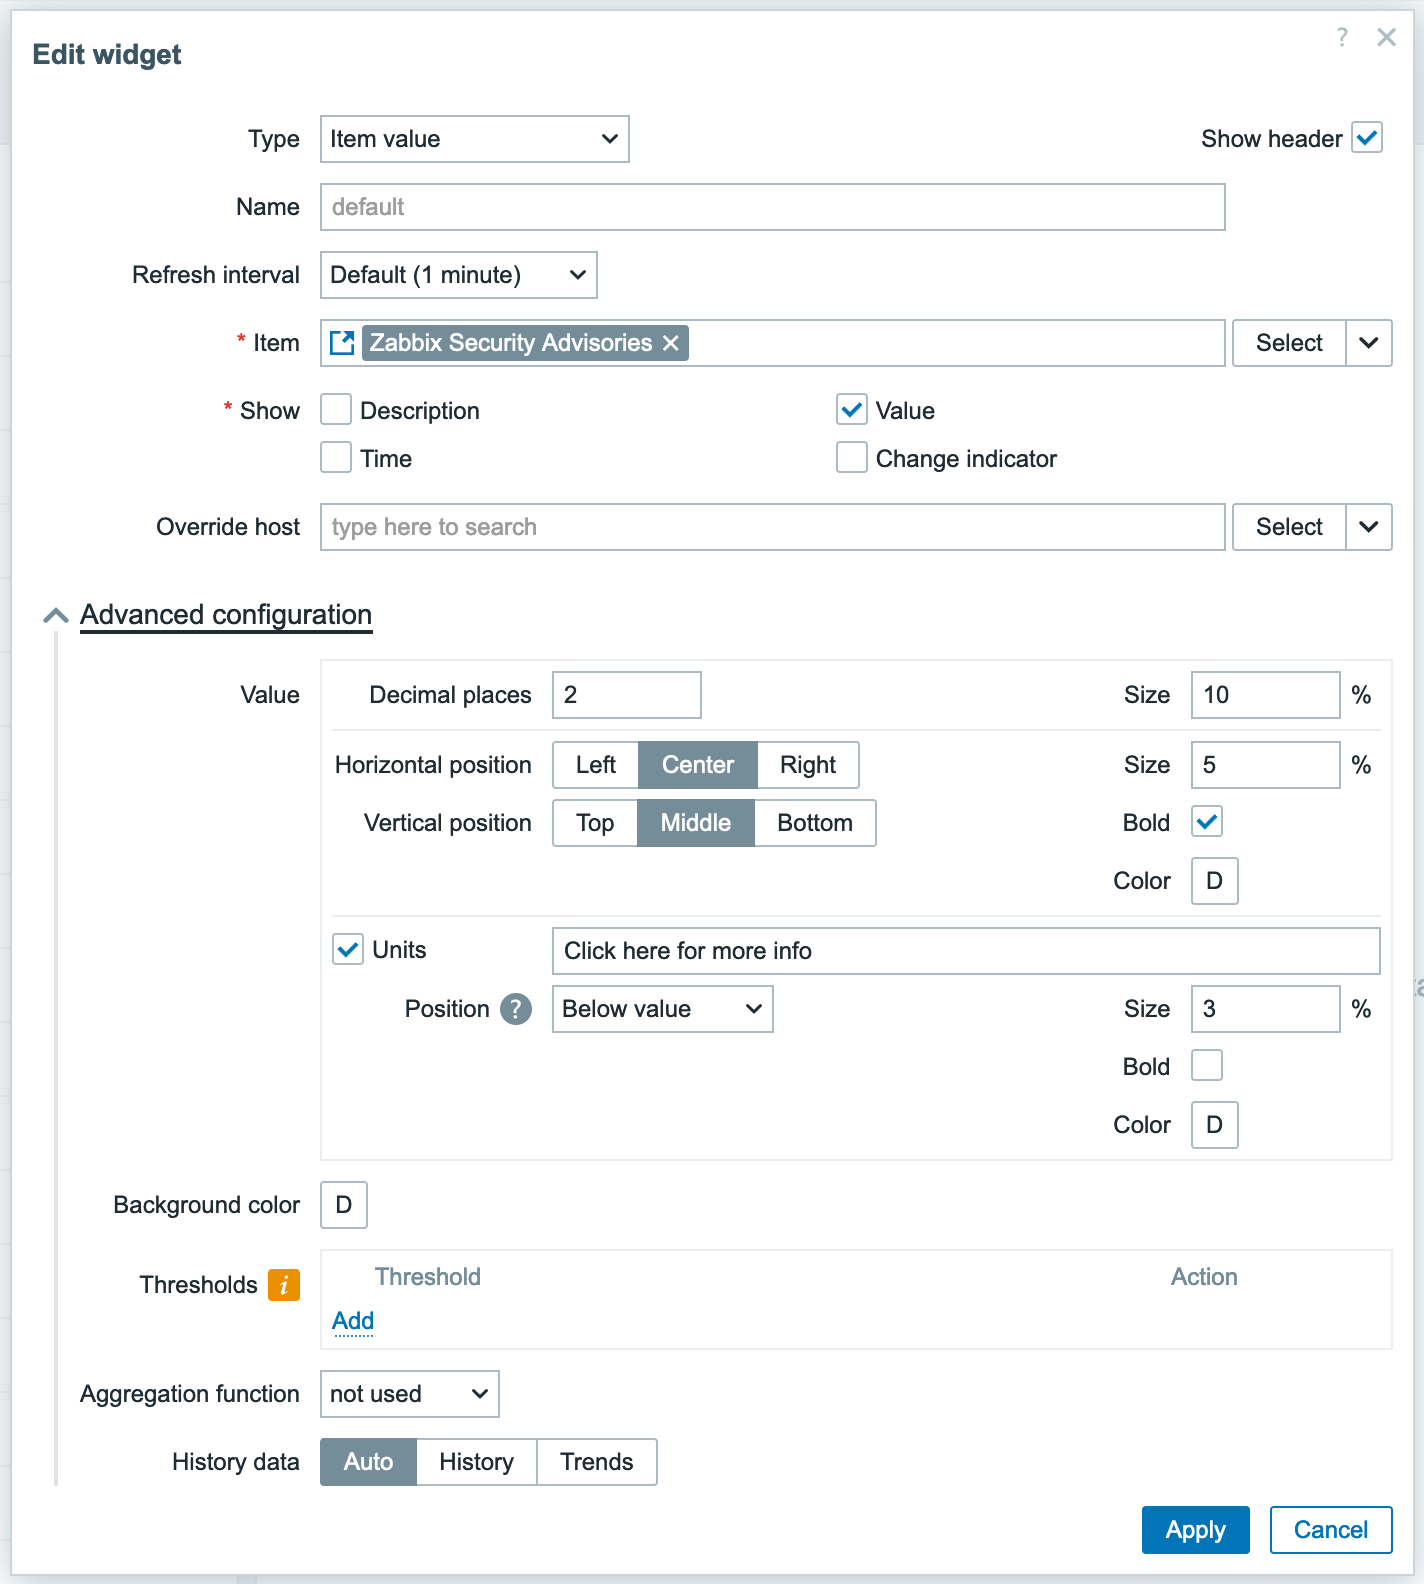
And then ‘link’ the Item Value widget to it:

You should get a somewhat decent dashboard. It isn’t perfect (given that the Item Value widget only seems to be able to display a single line of text) but it’s something.

Disclaimer

Though we use this functionality ourselves, this all comes without any guarantee. The technology used to retrieve data (screen scraping) is mediocre at best and could break at any moment if and when Zabbix changes the layout of their page.

The post Monitoring Zabbix Security Advisories appeared first on Zabbix Blog.

What’s in Store at Summit ‘24?

Post Syndicated from Michael Kammer original https://blog.zabbix.com/whats-in-store-at-summit-24/28649/

October means different things to different people – it’s springtime in the Southern Hemisphere, autumn in the Northern Hemisphere, and Summit time if you’re a member of the Zabbix community! Summit time, of course, means the biggest of all Zabbix events, gathering the global Zabbix community in one place to have fun together and learn as much as we can from each other. Zabbix Summit 2024 will take place on October 3-5 in Riga at the Radisson Blu Hotel Latvija. Keep reading to find out more about what you can expect this year.

All new main stage presentations

During Zabbix Summit 2024, you’ll be able to catch a variety of presentations from top industry thought leaders. You’ll learn all about the latest Zabbix features, explore use cases from multiple industries, check out the latest integrations, and have the chance to get your questions answered during live Q&A sessions.

The Summit agenda will feature speeches on nearly any Zabbix-related topic that you can imagine, but this year we’ll also have a fresh focus on the potential of artificial intelligence, with presentations on topics like “New Approaches to Reduce Alert Noise with Zabbix and AIOps” and “Leveraging AI for Synthetic Web Monitoring” as well as a more business-focused group of speeches covering topics related to open-source integration and Zabbix for MSPs.

Hands-on learning in Zabbix Summit workshops

Zabbix Summit workshops are the ideal place to put the theory you learn during presentations into practice. You can check out the latest features and use cases in action, while performing a variety of real-world tasks under the guidance of workshop hosts and their assistants – many of whom are also featured presenters at this year’s Summit.

All you’ll need to do is bring your own laptop – depending on the topic covered in the particular workshop, an SSH client and a web browser may also be required. All workshop sessions will take place on the morning of October 5 (Day 2 of the Summit) and will begin at 10AM.

Zabbix Certified Training sessions and exams

Do you have a lifetime of monitoring experience, but are too shy to let everyone know it? When you attend Zabbix Summit 2024, you’ll be able to prove your skills as a Zabbix specialist or professional by taking part in Zabbix Certified Training sessions and exams. If you’re looking for more specific topics to dive into, the following one-day courses will also be held from October 2 through October 4:

  • Automation and Integration with Zabbix API
  • Advanced Problem and Anomaly Detection with Zabbix
  • Advanced Zabbix Data Pre-Processing
  • Advanced Zabbix SNMP Monitoring

If you don’t mind extending your stay in Riga just a bit longer (and seriously, why would you?), you’ll also be able to take the full Zabbix Certified Specialist or Professional courses scheduled for October 9-13. Please remember that you can choose more than one training course, and it’s possible to attend the courses (without the 10% Summit discount) even if you’re not attending the Summit.

You can sign up for all training sessions and exams here.

The Zabbix Summit Feedback and Testimonial corner

Just as at last year’s Summit, you’ll be able to share your Zabbix story with the rest of the Zabbix community at our Feedback and Testimonial corner. Sharing a testimonial or leaving a review will give you a chance to collect a piece of exclusive Zabbix Summit 2024 merchandise!

Exclusive items, cool new designs, and unique gadgets at our merchandise shop

Speaking of merch, you’ll be pleased to know that not only will exclusive Zabbix Summit merchandise be available at a special stand throughout the event, but we’ll also have an online platform that will allow you to pre-order your merchandise and pick it up at the Summit. We’ve got 5 exclusive new t-shirt designs, 4 fresh sock designs, brand-new beanies, and the usual assortment of gadgets, hoodies, and other merch that our fans have come to know and love – most of which has also gotten a new look for this year’s Summit as well.

Three incredible Zabbix Summit 2024 networking events

There’s a lot to take in and consider at a Zabbix Summit, but don’t worry – we’ve also made sure to give you plenty of time to network with your fellow Zabbix fans by organizing three big events that you won’t want to miss!

  • The Zabbix Summit 2024 welcome event will be held at the famous National Library of Latvia – or as Latvians call it, “The Castle of Light.” You’ll enjoy tasty beverages, delicious food, and a guided tour of the library as you mingle with fellow Zabbix enthusiasts and industry experts, making this the perfect way to kick off this year’s Summit.
  • You’ll want to prepare yourself for a truly unforgettable experience as the Zabbix Summit main event unfolds. We’re sure that you’ll find Riga’s famous Fantadroms Concert and Event Space to be the ideal place to forge valuable connections with like-minded professionals – while indulging in a unique array of culinary delights, refreshing beverages, and great music.
  • After all that, we’ll send you on your way with a closing event that will be the perfect grand finale to a Summit that you won’t soon forget! Located in the heart of Old Riga, Burzma is a food hall that spans 1,500 square meters across the entire fourth floor of a bustling shopping mall. With stunning rooftop views to inspire your dining experience, Burzma offers 10 restaurants and a bar serving up a diverse range of culinary delights.

A chance to see where the magic happens during our Open-Door day

In what has become a popular tradition, Zabbix will host an Open-Door day on Thursday, October 3 from 1PM to 3PM local time. You’ll be able to chat with Zabbix team members, tour our headquarters, and take part in a fun activity designed to help you learn more about Zabbix.

Booths galore!

As usual, the Zabbix team will have multiple booths in the conference hall where you can meet our engineers and developers and get your questions answered by the people who know best. Our Summit sponsors will have booths of their own as well, where you can enjoy a unique opportunity to interact with them on a personal level and get the lowdown on the solutions they offer.

Special events for support customers

All Zabbix support customers are invited to meet our team at a special Zabbix client lunch on October 3 at 14:00 (EEST), with the exact location to be announced at a later date. What’s more, Enterprise and Global support customers are also invited to the Zabbix roadmap Q&A session with Zabbix CEO and Founder Alexei Vladishev on October 5 at 10AM. You’ll learn about our software development plans and be able to raise questions or make suggestions based on your experience – definitely an opportunity you won’t want to miss!

Which Zabbix Summit ticket is right for you?

If you want to enjoy the full Zabbix Summit experience (conference, accommodation, food, even airport transfers), the Full Participation ticket package is definitely for you.

For loyal users who have contributed so much to our product over the years, the Zabbix Fan package is definitely the way to go – it includes everything you’ll get with the Full Participation package, plus a special official fan package that will guarantee you bragging rights in your office once you return from Riga.

If you’re only there for the sessions, the Hall only pass is ideal. If you enjoy both learning and networking with our team and enthusiasts from around the world, we think you’ll find the Hall and Networking pass to be perfect for your needs.

Want to bring a friend or partner along to the summit? No problem — get a Zabbix Summit Travel Companion pass for them so you can stay together and attend networking events, while we handle the rest of their Riga experience.

The Companion pass includes 3 nights’ accommodation in the Radisson Blu Latvija hotel (in the same room as the Summit attendee), 3 breakfasts, and 3 networking events, but that’s not all – we’ll also include an exclusive tour of Riga on October 4 with an English-speaking guide.

The tour features a visit to the Ethnographic Open-Air Museum of Latvia, and runs from approximately 10AM to 4PM, including lunch and some workshop activities at the museum. You can learn more about the museum here.

Visit this page to sign up for the ticket package of your choice.

Livestreaming on YouTube

We hope to see you soon in Riga, but if you can’t make it, don’t worry – as in previous years, we’re going to be livestreaming the speeches on our YouTube channel! Stay tuned for more details.

The post What’s in Store at Summit ‘24? appeared first on Zabbix Blog.

Migrating from Datadog to Zabbix with Custom Metric Submission

Post Syndicated from Chris Board original https://blog.zabbix.com/migrating-from-datadog-to-zabbix-with-custom-metric-submission/28620/

For a few years, I’ve been monitoring 3 Digital Ocean servers with Datadog and using Datadog DogStatsD to submit custom metrics to Datadog. I am a big fan of Datadog and will continue recommending them. However, it became a bit too expensive for my needs, so I started looking for alternative options.

I decided to go down the self-hosted route as that was the least expensive option. I decided to go with Zabbix.

If you don’t know, Zabbix is a completely free, open source, and enterprise-ready monitoring service with a vast range of integrations for all of your monitoring needs. You can choose to install it on-premises or in the cloud.

I went with a $24 Basic Droplet in Digital Ocean with Regular SSD, which is actually below the minimum requirements that Zabbix specifies. It has been working fine and resource usage is minimal (around 40% RAM and 4% CPU use).

When you create a host to monitor, you assign templates. The templates are integrations you want to monitor, such as Apache, MySQL, and general Zabbix agent metrics like server performance (CPU, RAM, IO, etc.).

There were some things I had to create manually (including process monitoring) as I couldn’t find a built-in way of doing it. Datadog, had live process monitoring, so you could create a monitor which looks for a particular process, and then alert if that process wasn’t running.

Zabbix didn’t seem to have anything like this (that I could find) so I created custom templates and a custom shell script to look for the process name using the ps command (on Linux).

Another important function I needed was custom metric submission. This was originally done via the Datadog DogStatsD libraries available in pretty much any language, either as official libraries or via community versions. This would submit UDP data to the agent running locally on the server, and the agent would submit it to your Datadog account.

I didn’t want to rewrite all my apps to be able to send data to Zabbix, so I built a conversion tool. Its a small app I built in C# that listens on the same UDP socket as the Datadog agent (obviously, you’ll need to have the Datadog agent turned off). It receives the data from the Datadog DogStatsD libraries as normal, and the C# app converts the Datadog UDP data and submits an HTTP request to the Zabbix server via its API.

After everything was installed, I then re-created the various dashboards that I had from Datadog in Zabbix. A couple of examples are below:

In terms of access and configuration, all of the metrics are sent over the private interfaces of each droplet. Nothing is available via the public interface.

Logging into the Zabbix web portal is done via a Cloudflare Tunnel that allows me to connect to the web portal over the private interface via the Cloudflare tunnels running on each of the servers for fault tolerance. This provides multiple levels of authentication, as you have to authenticate to Cloudflare and authenticate with Zabbix.

This post was designed as an overview to show that it is possible to migrate from Datadog to Zabbix fairly easily, with a small amount of development involved to convert Datadog custom metrics to Zabbix via the C# app.

The C# app isn’t publicly available, but if there is some demand for it I can look at open sourcing it. If you want a full rundown of how I migrated and set up the Zabbix server and the servers being monitored, please let me know and I can do a more in-depth blog post!


The post Migrating from Datadog to Zabbix with Custom Metric Submission appeared first on Zabbix Blog.

Open-Source Security: The Zabbix Advantage

Post Syndicated from Michael Kammer original https://blog.zabbix.com/open-source-security-the-zabbix-advantage/28523/

At Zabbix, we’ve championed the open-source movement, with its emphasis on openness, transparency, and cooperation, from day one. Because of this, prospective customers and partners often have questions about the security of our product – the fear being that open-source software is somehow less secure than proprietary software.

In this post, we’ll provide a bit of background regarding how open-source software works, explain why fears about the security of open-source software are largely unfounded, and provide an overview of how the Zabbix team works to make sure that our product is as secure as it can possibly be.

A short open-source primer

At its most basic, open-source software is code that is available for anyone to modify and share in either its original or modified forms. It lets developers share their work without the restrictions of a proprietary license. The open-source movement is based on collaborative development and encourages the creation of high-quality software by tapping into the creativity and enthusiasm of a global community of developers.

Zabbix itself is an open-source solution covered by the GNU Affero General Public License version 3 (AGPLv3). The Zabbix source code is readily available and can be redistributed or modified – anyone with a great idea can create their own version of Zabbix. Apart from Zabbix, many well-known and widely used software solutions have emerged from the open-source movement, including Mozilla’s Firefox browser, the WordPress content management system, VLC Media Player, and the Linux operating system.

Open-source software and security

Data security is an issue that unites every company (and therefore every potential partner or client). Developers are constantly on the lookout for solutions that follow up-to-the-minute data and application security best practices in order to reduce risk and give users the most secure experience possible.

A common debate among both users and developers is whether open-source software is secure enough when compared to closed source alternatives. The good news is that there are massive efforts underway to help make sure that the open-source community is as safe as possible.

The Linux Foundation’s Community Health Analytics Open Source Software (CHAOSS) is a project that’s focused on creating a standard set of metrics and software to help define open source community health, and its GrimoireLab tool in particular makes it much easier for open-source projects to analyze and report their community health metrics.

Opinions vary regarding what makes for a truly secure environment, but quite possibly the biggest security advantage of open-source software is its transparency.

If you see something, say something

Open-source code is available for anyone to review, modify, and distribute. “Hold up,” you may be thinking – “If someone can see the whole code, can’t they just take advantage of a vulnerability if they see it?” The answer is that someone could certainly exploit a vulnerability, but because everybody can also see the code, there’s a far higher probability that someone else has also noticed the vulnerability in question and taken steps to correct it.

With open-source code, it’s usually much easier to get in touch with the developers and report issues directly to them than it is with a closed source project. This means a faster resolution of most security issues. Not only that, because the public is often allowed and encouraged to submit code improvements directly to the developers, anyone could submit the code to fix a vulnerability as a part of them reporting an issue. This leads to rigorous security scrutiny, with many eyes on the code, identifying and reporting vulnerabilities.

Think of it as the equivalent of a “neighborhood watch” program, in which organized groups of civilians devote themselves to crime and vandalism prevention within a neighborhood, ultimately making it safer and more secure for everyone.

No “waiting game” for updates

With standard closed source (or proprietary) software, users are completely at the mercy of the companies behind the software when it comes to getting software updates. Updates and fixes for high-profile closed source applications usually involve a great deal of complicated planning, and if there’s no budget or resources available, users might go months or even years before they see a new update, whether there are glaring security flaws or not.

Open-source solutions are also more agile when it comes to iterating and releasing new versions. This is down to any number of reasons, including the fact that open-source software has more eyes on the source code at any given time, plus a community-driven interest in making the product as good as it can be.

The Zabbix advantage

At Zabbix, we’ve long benefited from the inherent security advantages of being open-source. Because we’re enterprise-level open-source software, we’ve been able to adopt a “best of both worlds” approach that combines the flexibility and community policing of open-source with the knowledge that only a dedicated team of in-house security experts and robust security policies can provide.

If a member of our community notices a security vulnerability, the best way to make sure that it gets fixed as quickly as possible if for them to create a new issue in the Zabbix Security Reports (ZBXSEC) section of the public bug tracker, describing the problem (and a proposed solution if possible) in detail. This helps us make sure that only the Zabbix security team and the reporter have access to the case.

At that point, the Zabbix Security team reviews the issue and evaluates its potential impact. The team then works on the issue to provide a solution, creating new packages and making them available for download. Clients with support agreements are informed about security vulnerabilities that have been addressed and fixed, and given a window of opportunity to upgrade before the issue becomes known to the public. After that, a public announcement for the community is made.

Another potential security risk involves complex dependencies on other open-source libraries, where each dependency can introduce vulnerabilities if not properly managed. A perfect example of this is 2023’s repojacking attack on GitHub, in which a critical vulnerability in an open-source repository led to the exposure of over 4,000 other repositories.

To minimize the possibility of these supply chain attacks, we use tools that can generate an SBOM (Software Bill of Materials), which is basically a list of ingredients that make up software components. This makes it easy to keep track of each individual ingredient and take appropriate actions in the event of a red flag. What’s more, the fact that our clients are the sole owners of their data eliminates another potential source of security issues – unlike with other software vendors, there is no risk of an attacker accessing systems running Zabbix.

As an additional line of defense, we work with HackerOne, the world’s leading platform for ethical hackers, to maintain a Zabbix-specific bug bounty program that challenges the world’s most elite ethical hackers to find the weak spots in our code and let us know about them in time to fix them. We’re proud of the way that our community has done their part to help us make Zabbix as secure as possible, and we’re confident that with a few refinements we can pay out even more bug bounties in the future.

To learn more about the Zabbix approach to open-source security, please visit our website or get in touch with us.

The post Open-Source Security: The Zabbix Advantage appeared first on Zabbix Blog.

Elevating Code Quality: Real-Time Insights with Zabbix Integration and SonarQube

Post Syndicated from Benyamine Elmahir original https://blog.zabbix.com/elevating-code-quality-real-time-insights-with-zabbix-and-sonarqube/28452/

The objective of this project was to establish a robust and integrated environment for the continuous monitoring of code quality and performance metrics. To achieve this, SonarQube, an open-source platform for the continuous inspection of code quality, was installed on AlmaLinux. Following its setup, SonarQube was seamlessly integrated with Zabbix, an enterprise-class open-source distributed monitoring solution, to enable the dynamic monitoring of various projects. This integration aimed to provide our team at Zen Networks with real-time visibility into key metrics such as bugs, vulnerabilities, and code smells for ongoing projects.

Installing SonarQube on AlmaLinux

1. Pre-installation Requirements:
  • We conducted a detailed review to ensure that the server met the minimum hardware requirements for running SonarQube effectively.
  • Necessary dependencies, including Java Development Kit (JDK) and a supported database system, were installed and configured.
2. SonarQube Installation Steps:
  • The SonarQube server was downloaded from the official website.
  • Following best practices, a dedicated SonarQube user account was created for running the service.
  • The SonarQube service was configured to start on boot, ensuring high availability.
3. Configuration:
  • The sonar.properties file was meticulously edited to connect SonarQube to the chosen database, optimizing for performance and security.
  • Network settings were adjusted to allow SonarQube to run on the desired port (9000) and be accessible from the developer’s workstations.
  • Additional plugins were installed to extend the functionality of SonarQube and to support the languages used in our projects.

Project Setup in SonarQube

Upon successful installation and configuration of SonarQube on the AlmaLinux server, the next phase involved setting up projects for code analysis. Five test projects were created to demonstrate the capabilities of SonarQube and serve as a baseline for quality assessment.

Creation of Test Projects:
  • We created a series of five distinct projects, namely app-java, backup-code, erp-app, test-app, and web-app, each configured within SonarQube.
  • The projects were configured to assess various aspects of code quality, including reliability, security, and maintainability.
  • We enabled the automated scanning of code to identify bugs, vulnerabilities, and code smells within each project.
Analysis and Metrics:
  • Each project underwent a thorough analysis, with results indicating varying levels of bugs and vulnerabilities alongside code smells.
  • Metrics such as coverage and duplication were configured to be monitored, though the initial test runs reflected 0.0% coverage, indicating a scope for further CI/CD integration.
  • The test-app project notably showed a substantial number of bugs and a significant code smell count, highlighting areas for immediate improvement.
Quality Gate Status:
  • All projects were set against predefined quality gates to ensure they met the organization’s standards for code quality.
  • Despite some projects having bugs and code smells, all projects passed the quality gates, suggesting that non-critical issues were identified, which would be addressed in an ongoing manner.

Integration with Zabbix

The integration of SonarQube with Zabbix was aimed at leveraging Zabbix’s robust monitoring capabilities to keep a close eye on the projects’ health status in terms of code quality.

Zabbix Template Creation:

Our team built a Zabbix template dedicated to interfacing with the SonarQube API and designed to auto-discover SonarQube projects and their key metrics. For integrating Zabbix with the SonarQube API and enabling the auto-discovery of projects and key metrics, the following API calls and configurations were used:

Authentication:
    • Example API call to authenticate:
    • curl -u token: “http://sonarqube_ip/api/authentication/validate”
Project Discovery:
    • Example API call to list projects:
    • curl -u token: “http://sonarqube_ip/api/projects/search”
Metrics Retrieval:
    • Example API call to get project metrics:
    • curl -u token: “http://sonarqube_ip/api/measures/component?component=project_key&metricKeys=bugs,vulnerabilities,code_smells”
Zabbix Template Configuration:
    • A customized Zabbix template was created to interface with the SonarQube API. The template includes discovery rules, item prototypes, and preprocessing steps to extract relevant metrics.
    • Example of a discovery rule and item prototype in the Zabbix template:
<discovery_rule>
<name>sonarqube_project_discovery</name>
<type>HTTP_AGENT</type>
<key>sonarqube.project.discovery</key>
<delay>1h</delay>
<lifetime>3d</lifetime>
<item_prototypes>
<item_prototype>
<name>{#PROJECTNAME}: Metrics</name>
<type>HTTP_AGENT</type>
<key>sonarqube.project.metrics['{#PROJECTNAME}']</key>
<delay>5m</delay>
<url>{$PROTO}://{HOST.IP}:{$PORT}/api/measures/component?
component={#PROJECTNAME}&metricKeys=bugs,vulnerabilities,
code_smells,ncloc,complexity,violations</url>
<headers>
<header>
<name>Authorization</name>
<value>Basic YOUR_BASE64_ENCODED_TOKEN</value>
</header>
</headers>
</item_prototype>
</item_prototypes>
</discovery_rule>

In addition, our team set up items within Zabbix to track the number of bugs, vulnerabilities, and code smells, as presented in the SonarQube dashboard. We also configured triggers within Zabbix to alert the team when certain thresholds were reached, facilitating prompt action to maintain code quality.

Automation and Dynamic Monitoring:

We enabled the dynamic discovery of projects in SonarQube, allowing for new projects to be automatically detected and monitored without manual intervention. To enable the dynamic discovery of projects in SonarQube and ensure they are automatically detected and monitored by Zabbix, we implemented the following configurations:

  • SonarQube Configuration:
    • Webhooks: Configured SonarQube webhooks to notify Zabbix whenever a new project is created or updated.
    • Project Tags: Used consistent tagging for SonarQube projects to facilitate easy identification in Zabbix.
  • Zabbix Configuration:
    • Discovery Rules: Created discovery rules in Zabbix that periodically query the SonarQube API to check for new projects.
    • Low-Level Discovery (LLD): Implemented LLD in Zabbix to automate the creation of items, triggers, and graphs for each new SonarQube project.
    • We also established a data flow between SonarQube and Zabbix, ensuring that updates in the code quality metrics were reflected in real time on the Zabbix dashboard.
Validation and Testing:
      • We conducted a series of tests to ensure that the integration was functioning correctly.
      • Our team verified that metrics reported in SonarQube matched those displayed in Zabbix, confirming the accuracy and reliability of the monitoring setup.

With the projects and metrics being actively monitored, the focus shifted to presenting the data effectively. A custom dashboard was created in Zabbix to aggregate and display the information gleaned from SonarQube.

Design and Layout:

We created a user-friendly dashboard to provide a quick overview of the status of all projects.

  • The dashboard was organized to show metrics such as the number of bugs, vulnerabilities, code smells, and the Quality Gate status of each project at a glance.
  • Particular attention was paid to visual hierarchy and layout, ensuring that the most critical metrics were immediately visible.

Custom Widgets and Visualizations:

Widgets were customized for each key metric to enhance readability and instant understanding of the project statuses.
Visual indicators, such as color-coded status icons and progress bars, were incorporated to give a clear visual cue about the health of each project.

Real-time Data Representation:

W configured the dashboard to refresh at regular intervals, providing real-time updates to the development team.
Ensured that the most current data was always available, enabling a proactive approach to quality assurance and code health.

Results and Benefits

The integration of SonarQube with Zabbix and the creation of a dedicated dashboard yielded significant benefits for development workflow and project management.

Improved Code Quality Monitoring:
  • The real-time monitoring of code quality metrics allowed for quicker identification and resolution of issues.
  • Developers received immediate feedback on the quality of their code, fostering a culture of quality-first in the development process.
Enhanced Visibility:
  • The Zabbix dashboard provided a centralized view of the health status of all projects, enhancing visibility for both developers and management.
  • Critical issues could be identified at a glance, allowing for prioritization and resource allocation to address the most pressing problems.
Streamlined Workflow:
  • Automated project discovery and monitoring reduced manual overhead, allowing developers to focus on coding rather than reporting.
  • Alerts and notifications from Zabbix ensured that no critical issues went unnoticed.
Decision-making Support:
  • The collected data and trends visible on the dashboard supported informed decision-making regarding code quality improvements and technical debt management.
  • The ability to track historical data enabled the team to measure the impact of implemented changes over time.
Proactive Issue Management:
  • The early detection of bugs and vulnerabilities allowed the team to address issues before they escalated, reducing potential risks to project timelines and quality.
  • The Quality Gate statuses helped maintain a consistent standard of code quality across all projects.

Special thanks to the team at Zen Networks (Oumaima Naami, Karim Chadil, and Fayçal Noushi) for their work on this project.


The post Elevating Code Quality: Real-Time Insights with Zabbix Integration and SonarQube appeared first on Zabbix Blog.

Enhancing Network Synergy: rConfig’s Native Integration with Zabbix

Post Syndicated from Stephen Stack original https://blog.zabbix.com/enhancing-network-synergy-rconfigs-native-integration-with-zabbix/28283/

Native integration between two leading open-source tools – Zabbix for network monitoring and rConfig for configuration management, delivers substantial benefits to organizations. On one side, Zabbix offers a platform that maintains a Single Source of Truth for network device inventories. It provides real-time monitoring, problem detection, alerting, and other critical features that are essential for day-to-day operations, ensuring smooth and reliable network connectivity crucial for business continuity.

On the other side, there’s rConfig, renowned for its robust and reliable network automation, configuration backup, and compliance management. Integrating rConfig with Zabbix enhances its capabilities, allowing for seamless Device Inventory synchronization. This union not only simplifies the management of network configurations but also introduces more advanced Network Automation Platform features. Together, they form a powerhouse toolset that streamlines network management tasks, reduces operational overhead, and boosts overall network performance, making it easier for businesses to focus on growth and innovation without being hindered by network reliability concerns.

Optimizing Network Management with Unified Inventory

At rConfig, we are deeply embedded with our customers, and our main mission is to work with them to solve their real-world problems. One significant challenge that consistently surfaces – both from client feedback and our own experiences – is managing and accurately locating a trusted and reliable central network inventory. This challenge brings to the forefront a classic dilemma in Enterprise Architecture circles: In our scenario of network inventory, which system ought to act as the System of Record, and which should function as the System of Engagement to optimize interactions with records for various purposes, such as Network Management Systems (NMS) and Network Configuration Management (NCM)?

Enterprise Architecture circles illustrating systems of record, insight and engagement. Credit: Sharon Moore - https://samoore.me/
Enterprise Architecture circles illustrating systems of record, insight and engagement. Credit: Sharon Moore – https://samoore.me/

At rConfig, from a product perspective we’ve chosen to focus on what we do best and love most: Network Configuration Management. Therefore, integrating with an upstream Network Management System (NMS) that can act as the System of Record for network device inventory was a logical step for us. Given that many of our customers also use Zabbix network operations, it was a natural choice to begin our integration journey with them. Our platforms are highly complementary, which streamlines the integration process and enhances our ability to serve our customers better. This strategic decision allows us to offer a seamless and efficient management solution that not only meets the current needs but also scales to address future challenges in network management.

Enhanced Integration Through ETL

You might be wondering how this integration works and whether it’s straightforward or challenging to set up. Setting up the integration between rConfig and Zabbix is relatively straightforward, but, as with any complex data driven systems, it requires careful planning and diligence to ensure that the data flow between the systems is fully optimized and automated. This is where ETL – or Extract, Transform, Load – plays a crucial role. ETL is a process that involves extracting data from the Zabbix API in its raw form, transforming it into a format that rConfig can readily process and validate, and then loading it into the rConfig production database. This process also efficiently handles any data conflicts and updates.

The advantages of using ETL are significant, enhancing data quality and making the data more accessible, thereby enabling rConfig to analyze information more effectively and make well-informed, data-driven decisions. At rConfig, our user interface is designed to aid in the development and troubleshooting of features, though we’re also fond of using the CLI for those who prefer it. Below is a screenshot from our lab showing the end-to-end ETL process with Zabbix in action. It illustrates the steps rConfig takes to connect to Zabbix, extract, validate, transform and map the data, load it to staging, and finally, move it to the production environment for a small set of devices.

While the screenshot below displays just a few devices as a sample integration in our lab, the most extensive integration we’ve achieved in a production environment with this new rConfig feature involved syncing a single Zabbix instance with over 5,000 host/device records. This highlights its efficiency and reliability in a real-world environment.

Screenshot of rConfig Zabbix Integration on the Command Line

Going Deeper: Understanding the Integration Process

To grasp the integration process more clearly, let’s dive into the details that will help you understand how to set everything up before we automate the task. Our documentation website, docs.rconfig.com, provides comprehensive details, and our YouTube channel features a great demonstration video of the entire process.

Initial Setup: The first step involves configuring rConfig to connect and authenticate with the Zabbix API. This setup is managed through the Configuration page in the rConfig user interface. During this phase, you can also apply filters to select specific Zabbix tags or host groups, refining exactly which host records you want to synchronize.

Screenshot of Zabbix Configuration page in rConfig V7 professional

Data Extraction and Validation: Once the connection is established, rConfig extracts host records in raw JSON format. This stage involves validating the data to ensure that the correct tags and data mappings are in place.

Screenshot of Zabbix Raw Host Extract page in rConfig V7 Professional

Staging for Review: After validation, the data is loaded into a staging table. This allows for a thorough review to confirm that the mapped rConfig data fields are correct, ensuring that the newly imported devices are associated with the appropriate connection templates, categories, and tags.

Screenshot of Zabbix host staging table in rConfig V7 Professional

Final Loading: The final step involves transferring the staged devices to the main production devices table. After this transfer, the staging table is cleared. The devices then appear in the main device table, marked with a special icon indicating that they are synced through integration.

Screenshot of Zabbix host fully loaded to production devices table in rConfig V7 Professional 
Screenshot of Zabbix host fully loaded to production devices table in rConfig V7 Professional

Seamless Operational Integration: Once the devices are loaded into the production table, they are automatically incorporated into standard rConfig scheduled tasks, automations, or any other rConfig feature that utilizes the device data (like categories and tags). This integration facilitates a seamless operational workflow between the platforms. Users can even access these devices directly in Zabbix from within the rConfig UI, streamlining operations management.

After all the above steps are completed, and the initial setup is done future loads are completed on a scheduled and automation basis using the rConfig Task manager.

Screenshot of rConfig Device detail view for a Zabbix integrated host

This detailed setup and validation process ensures that the integration between rConfig and Zabbix is not only effective but also enhances the functionality and efficiency of managing network devices across platforms.

Case Study: Enhancing Network Management for a Las Vegas Entertainment Organization

  1. Challenge: A prominent Las Vegas entertainment organization faced significant difficulties in managing the diverse and complex network that supports their extensive operations, including gaming, security, and hospitality services. The primary issues were outdated network inventories and inefficient management of network configurations across numerous devices, leading to operational disruptions and security vulnerabilities.
  2. Solution: To address these challenges, the organization implemented the integration of rConfig with Zabbix, focusing on automating and centralizing the network management process. This solution aimed to synchronize network device inventories across the organization’s extensive operations, ensuring accurate and real-time data availability.
  3. Implementation: The integration process began with setting up Zabbix to continuously monitor and gather data from network devices across different venues and services. This data was then extracted, standardized, and loaded into rConfig, where it could be used for automated configuration management and backup. The setup also included sophisticated mapping and validation to ensure all data transferred between Zabbix and rConfig was accurate and relevant.

Benefits:

  • Improved Network Reliability: The automated synchronization of network inventories reduced the frequency of network failures and minimized downtime, which is crucial in the high-stakes environment of Las Vegas entertainment.
  • Enhanced Security: With more accurate and timely network data, the organization could better identify and respond to security threats, protecting sensitive information and ensuring the safety of both guests and operations.
  • Operational Efficiency: The IT team was able to shift their focus from routine network maintenance to strategic initiatives that enhanced overall business operations, including integrating new technologies and improving guest experiences.
  • Scalability: The integration provided a scalable solution that could accommodate future expansion, whether adding new devices or incorporating new technologies or venues into the network.
  • Outcome: The implementation of the rConfig and Zabbix integration dramatically transformed the organization’s network management capabilities. The IT department noted a substantial reduction in the manpower and time required for routine maintenance, while operational uptime improved significantly. The organization now enjoys a robust, streamlined network management system that supports its dynamic environment, ensuring that both guests and staff benefit from reliable and secure network services.

This case study highlights the power of effective network management solutions in supporting complex operations and enhancing business efficiency and security within the entertainment industry.

Conclusion: Forging Ahead with Innovative Partnerships

In conclusion, the Zabbix platform stands out as a cornerstone in network monitoring, renowned for its extensive capabilities in real-time monitoring, problem detection, and alerting. Its robust architecture not only supports a broad range of network environments but also offers the flexibility and scalability necessary for today’s diverse technological landscapes. The platform’s ability to provide detailed and accurate network insights is crucial for organizations aiming to maintain optimal operational continuity and security.

The integration of Zabbix with rConfig, a globally reliable and robust network configuration management (NCM) solution, enhances these benefits significantly, creating a synergistic relationship that leverages the strengths of both platforms. For customers and partners, this integration means not only smoother and more efficient network management but also the assurance that they are supported by two of the leading solutions in the industry. Together, Zabbix and rConfig deliver a comprehensive network management experience that drives efficiency, reduces costs, and ensures a higher level of network reliability and security, positioning them as indispensable tools in the toolkit of any organization serious about its network infrastructure.

About rConfig

rConfig is an industry leader in network configuration management and automation. Founded in 2010 and based in Ireland, rConfig has been at the forefront of delivering innovative solutions that simplify the complexities of network management. Our software is designed to be both powerful and user-friendly, making it an ideal choice for IT professionals across a variety of sectors, including education, government, manufacturing, and large global enterprises.

With the capability to manage up to 10s of 1000s of devices, rConfig offers robust functionalities such as automated config backups, compliance management, and network automation. Our platform is vendor-agnostic, which allows seamless integration with a diverse range of network devices and systems, from traditional IT to IoT and OT environments. This flexibility ensures that our clients can manage all aspects of their network configurations, regardless of the underlying technology.

rConfig is committed to continuous innovation and customer-centric solutions, with industry first solutions such as API backups and our Script Integration Engine. Our native integration with platforms like Zabbix exemplifies our dedication to enhancing network management through strategic partnerships. This collaboration not only streamlines operations but also amplifies the benefits provided, ensuring that our customers have access to the most advanced tools in the industry.


The post Enhancing Network Synergy: rConfig’s Native Integration with Zabbix appeared first on Zabbix Blog.

Case Study: Monitoring with Zabbix and AI

Post Syndicated from Aurea Araujo original https://blog.zabbix.com/case-study-monitoring-with-zabbix-and-ai/28045/

Artificial intelligence (AI) and data monitoring are working together to digitally transform relationships, businesses, and people. In telecommunications, predictive analysis based on data collection plays a crucial role in development. Starting with version 6.0 of Zabbix, users have benefited from updates in predictive functions and machine learning, which make it possible for them to study the data monitored by Zabbix and integrate it with AI modules.

Danilo Barros, co-founder of Lunio (a Zabbix Certified Partner in Brazil), presented the results of using Zabbix combined with telecom data monitoring through AI and machine learning at Zabbix Conference Brazil in 2022. Keep reading to get the whole story!

The scenario

With over 600 OLTs (Optical Line Terminals – the fiberoptic infrastructure used by internet providers) as well as 400,000 customers across more than 800 cities and 20 states in Brazil, Lunio’s client manages a staggering amount of data. This monitoring is essential for smooth operations and to guarantee that there are no negative impacts on users and no overload for customer service agents in the event of accidents.

A primary challenge for telecom clients is the overload of calls to customer service in the event of massive network incidents. With so many customers, every precaution must be taken to avoid clogging phone lines during outages or service failures.

“You can’t achieve customer satisfaction under such circumstances, and the Net Promoter Score (NPS) drops drastically.”


Danilo Barros, co-founder of Lunio

Mapping needs

Considering the client’s operational structure, a series of customer needs were identified, focusing on six main points:

1. Automation: With notifications via digital channels for each event
2. Speed: Aiming for improved customer service
3. Operational costs: Budget optimization
4. Root cause analysis: Quick identification of the cause of events
5. Predictability: The ability to analyze problems and identify trends
6. Reporting: Identifying incidents and following regulations from ANATEL (National Telecommunications Agency)

With these interests in mind, it was possible to reassess the use of tools previously employed by the telecom client, which at the time served unique functions in the process. Each tool had its usage and information verification time, which could impact hundreds of users in a massive-scale incident. The key challenges identified by the Lunio team included:

  • Integrations: Systems needed to be interconnected
  • Integrity: Constant data updates
  • Topology: With system mapping through specific programs
  • Business rules: Respecting the development of local processes
  • Performance: The monitoring and automation of 600,000 assets
  • High availability: Dozens of data centers catering to local demand

Once the needs and challenges were identified, it was time to promote change within the client. By integrating systems and using Zabbix to monitor over 600,000 items, understand incidents, and predict potential future errors, the technical teams at Lunio created LunioAI, a “super attendant” with analytical and predictive capabilities as well as the ability to continuously learn.

“This guy (LunioIA) learns from each event, understanding each topology that occurs in the client’s network.”


Danilo Barros, co-founder of Lunio

In the initial response tests, LunioAI was able to analyze and evaluate massive events in a minute and a half. Over time, this was reduced to 30 seconds, making the return to the technical team increasingly swift and positively impacting incident resolution.

The results

Throughout the development and improvement of LunioIA, the operations chain was involved in predictive analyses of potential events on the network, providing technical professionals with the information needed to perform preventive maintenance on monitored items.

LunioIA considers data from integrated systems, FTTH (fiber to the home) environments, data centers, and items, all as part of the Zabbix monitoring environment. It can then diagnose events, understand the severity of an event, and find resolution points – without the need for human resources in the process.

As a result, when physical attendants were contacted by customers experiencing difficulties with the service, instead of going through the entire process to understand what happened, the attendant could perform a search using the customer’s CPF (Individual Taxpayer Registry Identification) and then access a summary of the events, causes, and solutions identified by artificial intelligence combined with data monitoring through Zabbix.

In conclusion

This example happens to come from the telecommunications industry, but it’s not difficult to see how the ability of Zabbix to integrate the data monitored by Zabbix with AI modules can benefit companies in almost any industry.

You can find out more about what we can do across a variety of industries by visiting our website or requesting a demo.

The post Case Study: Monitoring with Zabbix and AI appeared first on Zabbix Blog.

Case Study: Monitoring Railway Infrastructure for Infrabel

Post Syndicated from Arturs Lontons original https://blog.zabbix.com/case-study-monitoring-railway-infrastructure-for-infrabel/28035/

Infrabel is a government-owned public limited company that builds, owns, maintains, and upgrades the Belgian railway network, makes its capacity available to railway operator companies, and handles train traffic control. Headquartered in Brussels, Infrabel employs over 9,000 people and manages 3,602 kilometers of rail lines.

The challenge

Infrabel needed a monitoring solution that was flexible enough to manage not only infrastructure, but also OS level metrics, data centers, service and application states, and the availability of railway infrastructure components.

The solution

To begin with, Zabbix agents are deployed on railway station screens and broadcasting systems. This is possible because under the hood these pieces of hardware they run Debian OS, which means they can be monitored on the OS level by Zabbix agents right out of the box with our official templates.

This can be very easily automated together with low level discovery, autoregistration, or network discovery. Devices can be pinged from Zabbix proxies or Zabbix servers to check if they are available. If they are unavailable, Zabbix sends a notification, after which an engineer either restores the network connectivity or replaces the hardware.

In addition, Infrabel also uses Zabbix to retrieve and monitor data collected from ActiveMQ. This is where a combination of custom bash scripts and Zabbix sender is used, so the required data (also related to the railway infrastructure and data centre, hardware, and software) is retrieved from ActiveMQ via Bash script, then forwarded to Zabbix sender via a wrapper script, sent to the Zabbix server or proxy, stored and analyzed in Zabbix, and acted upon if required.

The results

Infrabel found that they could get the most out of Zabbix by integrating it with a third-party ticketing system they were already using. The integration itself is simple – when Zabbix generates a problem, the Zabbix API is then used to retrieve the problems related to a particular set of triggers that need to be forwarded to this third-party system.

These alerts are then forwarded via API to whatever system Infrabel requires – Zabbix has a variety of integrations available right out-of-the-box using web hooks, including Slack, JIRA, Microsoft Teams, and many others. Messengers can also be used with Zabbix, but Infrabel has opted to use Zabbix API for their custom ticketing solution.

In conclusion

Infrabel is the perfect example of how the flexibility of Zabbix allows it to adapt to any industry or need. The possibility to use Zabbix API, web hooks, or a combination of both was a game-changer for Infrabel – just as it could be for any customer in any industry.

You can learn more about what we can do for customers across a variety of industries by visiting our website or requesting a demo.

The post Case Study: Monitoring Railway Infrastructure for Infrabel appeared first on Zabbix Blog.

Case Study: Zabbix at the European Space Agency

Post Syndicated from Arturs Lontons original https://blog.zabbix.com/case-study-zabbix-at-the-european-space-agency/28024/

The European Space Agency (ESA) is a 22-member intergovernmental body devoted to space exploration. Headquartered in Paris and with a global staff of around 2,200, the ESA was founded in 1975. Its annual budget was €7.08 billion in 2023.

The challenge

The Columbus laboratory is the European module of the International Space Station and the cornerstone of Europe’s participation. Positioned on the starboard side of the Station’s leading edge, it is designed to provide an environment for pursuing research and development in a wide variety of fields. Its characteristics include:

  • Payload complement flexibility, provided by a modular design and serviced by a regular logistics, maintenance, and upgrade capability
  • A permanent crew presence for servicing payload support systems and interacting with payloads
  • A continuously available ground infrastructure for monitoring and controlling onboard activities

Columbus provides internal payload accommodation for multidisciplinary research into material science, fluid physics, and life sciences, while the External Payload Facility (EPF) hosts space science and Earth observation payloads.

Academics on Earth perform their tests on Columbus remotely – programming them and getting the results. The infrastructure required for these tests and the payloads that get sent back and forth require a flexible and dependable monitoring solution, and that’s where Zabbix enters the picture.

The solution

Zabbix proxy was deployed in the Columbus module alongside other software required for research, operations, and connectivity. The Zabbix server and frontend are deployed in the ground data center, and this is what the proxy communicates with.

In addition to proxies, we have a Zabbix sender and Agent 2 that are used on this infrastructure, which is made of VMS and containers running different kinds of services. Data is collected in a very ordinary fashion – Zabbix Agent 2 performs native checks because there is still server hardware running with operating systems and OS level resources that need to be monitored by the Agent.

We mix these native checks with user parameters which execute custom checks based on scripts or commands for commercial off-the-shelf components. The agent is extended depending on the requirements of the components. It then collects those metrics and sends them to the proxy. Scripting is used for custom components, and because Zabbix is language agnostic, any type of programming or scripting language works. It gets wrapped together with Zabbix sender, which then sends data to the proxy, which then sends data to the server.

Because there are so many custom services and metrics that need to be monitored (the number of high priority files in the transfer queue for a particular payload, for example) and because metrics, services, and payloads can change over time, the ESA needed to automate a way of automatically discovering these, displaying them, and collecting data for them. We used low-level discovery together with some scripting to discover and automatically start monitoring new payloads.

The results

Thanks to Zabbix’s visualization capabilities, the ESA’s team has found it easy to observe their dashboards and react to alerts in real time.

The ESA has also found Zabbix proxy to be an ideal solution for their needs, because if a link between the ground data center and the Columbus module goes down, the proxy keeps collecting local metrics, stores them in its own database, and then sends them back to the ground once the connection is restored. No such situation has arisen yet, but Zabbix has performed flawlessly in all test scenarios.

Monitoring is a never-ending process and there’s always room for improvement, but it’s reasonable to expect that the ESA will continue working on Zabbix and finding new metrics and new ways of improving monitoring.

In conclusion

Part of the beauty of Zabbix has always been its adaptability – it can be as simple or as complex as any user needs it to be. The simplicity of the Zabbix setup in this scenario (as opposed to a more modular setup with 4 or 5 pieces of software) is what makes it ideal for deployment by the ESA on the International Space Station.

To learn more about what we do for customers across multiple industries, visit our website or request a demo.

The post Case Study: Zabbix at the European Space Agency appeared first on Zabbix Blog.

Making Life Easier for MSPs: The Zabbix Advantage

Post Syndicated from Michael Kammer original https://blog.zabbix.com/making-life-easier-for-msps-the-zabbix-advantage/28004/

Times have never been better for managed service providers (MSPs). The demand for remote monitoring services has skyrocketed as cloud adoption rises and working from home becomes the new standard. The number of organizations that trust MSPs with the everyday functioning of their mission-critical IT systems and processes has grown rapidly – nearly 9 out of 10 small and medium enterprises either use or plan to use MSPs to manage their infrastructure.

As a service provider, an MSP needs to be ahead of the curve at all times and adopt a constantly-shifting and evolving set of best practices for remote monitoring and management. At Zabbix, we’ve created the ultimate solution for full-stack IT monitoring, and we’ve built in features and benefits that are designed to make it as easy as possible for MSPs to provide top-quality monitoring to their clients as well. Keep reading to learn more about what makes Zabbix the ideal monitoring tool for any MSP.

There are no limits to what you can monitor with Zabbix

And when we say no limits, we mean no limits! Zabbix literally allows you to monitor anything from the frequency of a baby’s cries to the hydraulic systems on a space station. From hardware to software to middleware, VEP resources, virtual resources, and more, Zabbix is capable of monitoring millions of metrics.  As an MSP, you’re no doubt called upon to tackle anything from basic network and server monitoring to highly advanced cloud, container, and Kubernetes monitoring. Zabbix lets you keep it all under one roof and handle it with a single solution.

You can integrate Zabbix with any client’s systems

Today’s MSP needs to be able to seamlessly integrate their tools and processes with the IT frameworks and ITIL guidelines of their clients as well as their business goals, strategies, and best practices. Zabbix is designed to work with third party solutions and boasts a constantly-growing list of official integrations.

When you’re notified of a potential problem, you can easily forward your alerts to third-party ITSM, helpdesk, and messaging systems, enhance them with the additional information that Zabbix is able to collect, and freely customize the outgoing messages for different clients – just one of the areas where Zabbix stands out as an ideal multitenant solution.

Zabbix makes reporting and analysis simple

MSPs need to be able to quickly generate and share regular reports and analyses with clients, keeping them up to speed on the status, performance, and health of their infrastructure. Ideally, those reports should be clear, concise, and actionable, highlighting key metrics and insights via graphs, charts, and tables, identifying trends, and predicting potential issues. Done right, reporting can enhance service quality and position you as an ideal strategic partner.

When you make the decision to deploy Zabbix scheduled reports, you’ll get daily, weekly, monthly, and yearly overviews of the infrastructures and business services you’ve been tasked to monitor. You can also track the changes performed in your Zabbix instance with our robust and detailed built-in audit logging functionality, all of which is designed to make it as easy as possible for you to keep your clients in the loop.

Zabbix makes data easy to visualize

Much like the world around them, MSPs have become increasingly more data-driven. It’s easy to understand why – when you have critical information right in front of you, it’s easier to see trends you would have otherwise missed, which in turn helps you make better-informed decisions that can help guide you to success.

Zabbix dashboards are built to serve as visual storybooks for your business. They transform complex monitoring metrics into an engaging narrative, presenting intimidating data in an intuitive, insightful layout and making data interpretation simple.

You can customize dashboards, screens, and slideshows to easily track the status of a tenant’s infrastructure, applications, and business services. You can also leverage a wide range of dashboard widgets to aggregate, transform, and graph your data while also tracking your monitoring endpoints on geographical and network maps, identifying the status of the most critical alarms, and sorting your monitoring endpoints by resource usage.

Zabbix makes effective security management easier

When it comes to cyberattacks, MSPs are up against a constantly changing threat landscape, not to mention the challenges they face in protecting diverse, multitenant setups. With Zabbix, you can secure connections to and from your monitoring endpoints either with certificates or via pre-shared key encryption.

Multitenant MSPs can also control access to different Zabbix elements and features by creating unique Zabbix roles for your tenants while taking advantage of the native permission logic to isolate monitoring endpoints between tenants. Host groups and subgroups let you decide what your tenants can see, and encrypted agents help to secure all communication, including proxy-to-server communication.

You can also rely on encrypted communication between Zabbix components as well as flexible permissions, user authentication, and integrations with secret vaults for storing passwords and other sensitive information.

Zabbix is inherently scalable

There are no two ways about it – surviving as an MSP in today’s business environment means being able to scale. The number of customers that you support is likely to vary from year to year or even month to month. In order to add customers without compromising your level of service, you need to scale up. And if your customer base shrinks, you will probably need to decrease the size of your infrastructure and operations in order to avoid spending money on services that your business no longer needs.

By deploying Zabbix proxies and letting them collect and process data on behalf of the primary Zabbix server node, you can easily scale your Zabbix instance as your client base expands – no matter where those clients happen to be. And if you need to scale back your business for any reason, it’s a simple matter of deleting the unused proxies.

Zabbix is uniquely cost-efficient

A key benefit of Zabbix has always been that it’s open-source – there are no license fees associated with using our software, and you’re not locked into an endless, inflexible contract. Meanwhile, our extensive range of competitively-priced professional services are designed to fit the unique needs of MSPs and give you the most effective solutions as quickly as possible.

Perhaps most importantly for a multitenant MSP, Zabbix is built to run without the need for a lot of infrastructure or resources. With Zabbix, you can offer your clients more flexibility than comparable monitoring solutions while dramatically lowering the amount of hardware, CPU power, and costs involved.

Conclusion

In order to serve the constantly evolving needs of their clients, MSPs demand more flexibility and features than ever before – and this naturally extends to the monitoring solutions they choose. Rather than offer a few additional services to target MSPs, we’ve built our business with them in mind, which is why we offer a range of feature-rich technical support plans specifically for MSPs.

To learn more about what Zabbix can do for MSPs like yours, visit our website or request a demo.

The post Making Life Easier for MSPs: The Zabbix Advantage appeared first on Zabbix Blog.

Saving Time and Money with Zabbix Professional Services

Post Syndicated from Ronalds Sulcs original https://blog.zabbix.com/saving-time-and-money-with-zabbix-professional-services/27951/

One of the most common questions the Zabbix Sales team gets is, “How do you make money selling an open-source product that literally anyone in the world can download for free? Where’s the business?”

The simplest and shortest answer is that we’ve developed a three-part approach to our business – build a best-in-class monitoring solution, make that solution open source and available to everyone, and develop a set of Zabbix professional services that help our users save time and money.

There’s a lot of information available about the first two parts of this trifecta, so in this post I’m going to complete it by going into a little bit more detail about what Zabbix professional services can do for you and why they’re well worth the investment.

What do our clients look for?

Our professional services are designed to be flexible enough to fit your unique business demands, and they include technical support, turnkey and migration solutions, professional training, and template building integrations. These are the main services that my team and I see our clients expressing an interest in on a daily basis, so let’s take a look at each one individually.

Zabbix turnkey/migration services

This service is perfect for Zabbix users who are new to Zabbix and who would like to either start using Zabbix or migrate from another solution to Zabbix. Because they’re just starting out, we help them design their Zabbix environment, deploy it, and make it secure. Whether it’s just a local installation for devices in one location or if the devices and applications you would like to monitor are spread around the globe worldwide, distribution is not an issue thanks to our scalable Zabbix architecture.

We start out by doing an analysis to make sure that whatever your requirements are, we’ll be able to meet them. Based on this, we provide a specific timeline and a cost estimate of how much this service will cost you. Once we have approval from your side, we move forward to implementation, which includes documentation, a full knowledge transfer, and constant check-ins to make sure your expectations are met.

It’s a service that quickly pays for itself when you consider the potential downsides of attempting to go the DIY route – notably, a high risk of delay or failure (which will end up costing you money and time rather than saving it). When our team guides your Zabbix deployment and implementation, your project gets done properly and on time, with an average implementation time of 10 days as opposed to several months if you go the self-service route. Thanks to the skills and experience of our engineers, we’re accurate in 95% of our project estimates, so it’s easy to calculate the time and money you’ll save by leaving it to us.

Zabbix technical support

Technical support is intended for clients and Zabbix users who have already deployed Zabbix and are using it on a daily basis. It’s an annual subscription, with pricing dependent on the size of your Zabbix environment and how many legal entities will be using it.

The silver tier is meant for simple installations, where only one Zabbix server is available. The gold and platinum tiers are dependent on your Zabbix environment, including how many proxies you have. The enterprise and global tiers support unlimited Zabbix servers and proxies, and they include plenty of other useful services, including training, consulting, and even development.

Zabbix also offers a specialized managed service provider (MSP) support subscription, tailored for companies that provide monitoring services for their own clients. These companies need to have support for their clients as well as themselves, which means that the support structure is slightly different, with the key differentiator being the number of hosts.

When it comes to saving time and money with Zabbix professional services, there’s no better move than purchasing a Zabbix technical support package. In many cases, our clients need to dedicate at least one specialist to take care of their Zabbix environment and make sure that everything is up and running. But what happens when that individual is out of office for any reason, or needs assistance?

A Zabbix support subscription costs considerably less than hiring an additional engineer or outsourcing issues to a third-party specialist, and the level of expertise in our team simply can’t be matched – you’ll have a full team of support engineers who are available around the clock to jump on any request that you have and provide you with an answer whenever you need it. Not only that, but tickets created within our support portal are nearly always answered in less than one hour, regardless of SLAs.

Zabbix template building and integrations

On our website, you’ll find an extensive list of available integrations, many of which are supported by Zabbix directly and many more of which are built and developed by our global community. But what if your specific needs call for a template that doesn’t exist yet?

Not to worry – not only do we maintain a massive library of existing templates, but on average, it takes only 3 to 10 days for us to create a standard template from scratch. For standard templates that we want to maintain for future versions, we’re ready to give a fixed price and cover part of the cost of the development of the template ourselves – something that definitely wouldn’t be on the table if you were to have a third-party vendor create the template for you.

Zabbix professional training

When you invest in Zabbix professional training courses for your employees, what you’re really investing in is improved efficiency, faster project completion time, and a much lower risk of project failure.

The effectiveness of employees who have gone through a Zabbix training course is impossible to miss – they learn tips and tricks about how to work better with Zabbix that wouldn’t be possible for them to pick up anywhere else. Our goal is to give you and your employees comprehensive knowledge about how to use Zabbix as effectively as possible.

Here are our core courses – user, specialist, professional, and expert. Our recommendation is to take them all in a row, as it’s the best way to make sure that you’ll be equipped with the most up-to-date subject knowledge. There’s also a bargain involved if you purchase them as a bundle!

We’ve also got advanced, one-day courses that can be taken separately whenever you need, depending on the topic that you’re interested in understanding better.

Learning is a lifelong process, and because we strive to create new upgrades and put out new versions every year, Zabbix upgrade courses are the perfect way to quickly brush up on your knowledge and keep your skills relevant.

All of our training courses are designed to produce a quick, measurable return on investment, equipping you and your employees with the knowledge you need to get the most out of Zabbix. Our website is full of testimonials and additional information, so it’s the perfect place to start if you have any questions or you want to get started on your training journey.

Conclusion

From the beginning, our goal at Zabbix has been a world without interruptions. In practice, that means giving businesses of all kinds the all-in-one, Enterprise-level solution they need to monitor their devices, applications, and processes. With the help of Zabbix professional services, you can help you minimize or even eliminate downtime, so that you can keep your business is up and running at all times, increasing your efficiency, and generating more revenue in the process.

Don’t hesitate to reach out to us to learn more – we’re standing by with the answers to any questions you may have.

The post Saving Time and Money with Zabbix Professional Services appeared first on Zabbix Blog.

What Makes a Zabbix Conference Benelux Special?

Post Syndicated from Michael Kammer original https://blog.zabbix.com/what-makes-a-zabbix-conference-benelux-special/27789/

Zabbix has always seen our mission as going beyond simply delivering a product. From the start, building a strong global community has created and supported a better business model, and an important part of building our community is our practice of taking our message to the places where our users, partners, and potential clients live and work.

That’s where Zabbix Conferences enter the picture. Since 2011, they’ve grown from yearly events on our home turf in Riga to multi-day extravaganzas in locations as far-flung as Tokyo, Shanghai, and Porto Alegre. There’s something about the conferences in the Benelux countries, however, that seems to boost our reach a little further and create a little more enthusiasm every time we visit.

“Zabbix Conference Benelux is a can’t-miss event for European Zabbix enthusiasts and professionals. It attracts Zabbix experts from the retail, IT, banking, and government sectors (just to name a few), and brings everyone together with a shared sense of purpose. It’s the perfect place to network with like-minded individuals and come away with plenty of inspiration for your own projects.”

– Alexei Vladishev, Zabbix Founder and CEO

There’s just something about Benelux

The politico-economic union of Belgium, the Netherlands, and Luxembourg is a fascinating locale for any event – the three nations that make up the union each bring their own customs, history, language, and business culture to the mix, which creates an intriguing backdrop for any kind of business.

“A Zabbix Conference Benelux is a unique event because of the way the people of the region make their guests feel welcome and create an atmosphere of belonging, togetherness, and support.”

-Alexei Vladishev, Zabbix Founder and CEO

From our perspective at Zabbix, Benelux is home not only to a sizable community of existing clients and partners, but also an enormous pool of potential new ones. We’ve thought long and hard about what we can offer to that particular group when we make our (almost) annual pilgrimage to Benelux, so keep reading for some insight into what makes a Zabbix Conference Benelux not only special, but worth attending.

Learn from the best

Attending a Zabbix Conference Benelux is first and foremost an excellent opportunity to catch up with the very latest trends and developments in the world of IT monitoring, including Zabbix proxy high-availability and load balancing as well as automating Zabbix workflows with Zabbix API and zabbix_utils.

Our conference speakers represent a broad cross-section of industries and experiences, and they pride themselves on coming up with fresh, innovative topics – in fact, many of them share their use cases and results for the first time on our stage. What’s more, the energy and dynamics of our workshops and live Q&A sessions foster open dialogue, richer conversations, and greater innovation.

“The Zabbix Conference Benelux I attended in 2023 stands out to me because of a very informative speech by (Zabbix Trainer and Consultant at Opensource ICT Solutions) Brian Van Baekel about his experience with Zabbix in an MSP environment. On top of that, the conference was organized in the beautiful center of Antwerp, the atmosphere was very friendly as usual, and we had some fascinating events after the conference as well.” 

– Kaspars Mednis, Zabbix Chief Trainer 

Getting to know you

The world may be increasingly dominated by virtual interactions and digital connections, but there’s still something unique and special about face-to-face conferences. At Zabbix, our feeling has always been that in-person events are crucial to strengthening the bonds between our team members, our partners, and our users. A Zabbix Conference Benelux gives participants a chance to truly get in touch with the people behind our product, allowing for deeper understanding and stronger relationships, which are the foundation of all successful business collaborations.

“The year I attended (2023) I really enjoyed the overall spirit of the event, the atmosphere in Antwerp, and the opportunities to get to know the Zabbix community closer.” 

– Aleksandrs Petrovs-Gavrilovs, Zabbix Technical Support Engineer 

Drumming up new business

Attending a Zabbix Conference Benelux isn’t just about exchanging information, but also about providing attendees with opportunities for spontaneous conversations, chance encounters, and relationship-building that can lead to collaborations, partnerships, and future business opportunities for everyone involved.

Business leaders can learn about the technology and challenges of Zabbix and our partners and have a frank dialogue that helps them understand their own needs from a different perspective. And as anyone who has spent time at a Zabbix Conference Benelux can tell you, those kinds of free-flowing conversations tend to happen naturally and organically when both parties are in a friendly, welcoming environment that also happens to be just a bit outside of their home turf.

Networking and hospitality

Speaking of creating a welcoming environment, it’s impossible to underestimate how important quirky yet fun event venues and incredible hospitality are to creating an ideal event for learning and networking. Zabbix Technical Support Engineer Edgars Melveris is a veteran of Zabbix Conferences in 2020 (Utrecht, the Netherlands) and 2023 (Antwerp, Belgium). He says that it’s the combination of in-depth technical information, fascinating locales, and good times that makes a Zabbix Conference Benelux special to him.

“The National Military Museum in Utrecht really impressed me, and I also enjoyed the atmosphere and sense of community at the event venues. When it comes to conference content, (Zabbix Chief Trainer) Kaspars Mednis’ workshop on ‘New and improved SNMP bulk data collection in Zabbix 6.4’ has only become more relevant with the passage of time, and (Zabbix Trainer and Consultant at Opensource ICT Solutions) Nathan Liefting’s presentation on ‘Zabbix Native HA: Lessons Learned and Tips & Tricks’ was particularly useful to me in my role.”

-Edgars Melveris, Zabbix Technical Support Engineer

Zabbix Conference Benelux 2024 will take place in Utrecht, the Netherlands, on May 24-25. To find out more information, register to attend, or sign up as a speaker, please visit the conference page. We’re looking forward to seeing you soon!

The post What Makes a Zabbix Conference Benelux Special? appeared first on Zabbix Blog.

Striking the Right Balance: Zabbix 7.0 to be Released Under AGPLv3 License

Post Syndicated from Alexei Vladishev original https://blog.zabbix.com/striking-the-right-balance-zabbix-7-0-to-be-released-under-agplv3-license/27596/

At Zabbix, we believe that knowledge should be accessible to everyone, and we’re proud to have built a thriving community that reflects our values of openness, transparency, and cooperation. That’s why we’ve championed the open-source movement.

Our number one priority is and always has been to make sure that we’re able to provide our solution to millions, while being able to maintain and develop it.

Why AGPLv3?

Since 2001, all major and minor versions of Zabbix Monitoring Solution software have been released under GNU General Public License version 2.0 or later (GPLv2 or later), which has proven to be a strong and well-regarded copyleft license.

As the tech landscape has evolved, however, we’ve been on the lookout for a licensing solution that would allow us to stay open source while keeping our values intact, adding flexibility, and maintaining copyright protection. That’s why we’re releasing version 7.0, the next major version of Zabbix, under GNU Affero General Public License version 3 (AGPLv3).

AGPL V3 is an OSI-approved license that meets all criteria for Free and Open-Source Software. The purpose of AGPLv3 is to impose copyleft license on modified versions made available for use over a network, which we believe will help us strike the right balance between our open-source roots and effective copyright protection.

How will this affect the Zabbix community?

Our community impacts our popularity and the direction of our development. Their contributions are important to us, and as far as we’re concerned, the release of the 7.0 version of Zabbix software under AGPLv3 will not create any impact on any plugins, modules, or widgets released under any AGPLv3 compliant licenses. Our Contributor License Agreement (CLA) will not change in any way, and you can find the current version of it here.

In terms of templates, there is an opinion that application programming interfaces (APIs) are not protected by copyright. However, if the developer of a template considers the template copyrightable, we recommend that they release the template under any permissive or copyleft open-source software license that is AGPLv3 compliant (e.g., 3-clause BSD, MIT, Apache license 2.0, LGPLv3, GPLv3, or AGPLv3).

How will this affect Zabbix itself (the product)?

It won’t. This change will do nothing to prevent Zabbix users from using Zabbix software — in fact, the only difference is that under the AGPLv3 license users must share source code if they are modifying it and making it available to others, either by distribution or over a network. For distributors, AGPLv3 has the same source code sharing requirements as other strong copyleft licenses, including GPLv2 or later.

Conclusion

We’re honored by the number of users who love Zabbix and don’t want to see it change in any way. We believe that releasing the 7.0 version of Zabbix software under the AGPLv3 licence is the perfect balance between protecting our business interests and staying free and open source.

If you want to learn more about AGPLv3, the GNU project has a comprehensive FAQ section, and the Free Software Foundation has published a useful guide as well. We’ve added our own FAQ section below for anyone who wants more specific information, and you can also visit our updated license page.

FAQ

Why is Zabbix doing this? And why now?

Being open source is central to our business model, which is all about empowering partners to provide our customers with individual solutions. After much internal discussion, we’ve determined that moving to AGPLv3 is the best way to make sure that anyone who modifies our software makes it available to everyone. The upcoming 7.0 release provided us with the perfect time to make the move. It’s a way for us to get two birds with one stone – we can make sure that no commercial entity helps themselves to our product while circumventing copyleft requirements, and we can also make sure that anyone who does modify our code makes their modifications available to everyone.

Will this affect the Zabbix version that I already have?

Absolutely not! There is no impact on any older releases of Zabbix in any way.

The post Striking the Right Balance: Zabbix 7.0 to be Released Under AGPLv3 License appeared first on Zabbix Blog.

Securing the Zabbix Frontend

Post Syndicated from Patrik Uytterhoeven original https://blog.zabbix.com/securing-the-zabbix-frontend/27700/

The frontend is what we use to login into our system. The Zabbix frontend will connect to our Zabbix server and our database. But we also send information from our laptop to the frontend. It’s important that when we enter our credentials that we can do this in a safe way. So it makes sense to make use of certificates and one way to do this is by making use of self-signed certificates.

To give you a better understanding of why your browser will warn you when using self-signed certificates, we have to know that when we request an SSL certificate from an official Certificate Authority (CA) that you submit a Certificate Signing Request (CSR) to them. They in return provide you with a Signed SSL certificate. For this, they make use of their root certificate and private key.

Our browser comes with a copy of the root certificate (CA) from various authorities, or it can access it from the OS. This is why our self-signed certificates are not trusted by our browser – we don’t have any CA validation. Our only workaround is to create our own root certificate and private key.

Understanding the concepts

How to create an SSL certificate:

How SSL works – Client – Server flow:

NOTE: I have borrowed the designs from this video, which does a good job of explaining how SSL works.

Securing the Frontend with self signed SSL on Nginx

In order to configure this, there are a few steps that we need to follow:

  • Generate a private key for the CA ( Certificate Authority )
  • Generate a root certificate
  • Generate CA-Authenticated Certificates
  • Generate a Certificate Signing Request (CSR)
  • Generate an X509 V3 certificate extension configuration file
  • Generate the certificate using our CSR, the CA private key, the CA certificate, and the config file
  • Copy the SSL certificates to your Virtual Host
  • Adapt your Nginx Zabbix config

Generate a private key for the CA

The first step is to make a folder named “SSL” so we can create our certificates and save them:

>- mkdir ~/ssl
>- cd ~/ssl
>- openssl ecparam -out myCA.key -name prime256v1 -genkey

Let’s explain all the options:

  • openssl : The tool to use the OpenSSL library, which provides us with cryptographic functions and utilities
  • out myCA.key : This part of the command specifies the output file name for the generated private key
  • name prime256v1: The name of the elliptic curve; X9.62/SECG curve over a 256 bit prime field
  • ecparam: This command is used to manipulate or generate EC parameter files
  • genkey: This option will generate an EC private key using the specified parameters

Generate a Root Certificate

openssl req -x509 -new -nodes -key myCA.key -sha256 -days 1825 -out myCA.pema

Let’s explain all the options:

  • openssl: The command-line tool for OpenSSL
  • req: This command is used for X.509 certificate signing request (CSR) management
  • x509: This option specifies that a self-signed certificate should be created
  • new: This option is used to generate a new certificate
  • nodes: This option indicates that the private key should not be encrypted. It will generates a private key without a passphrase, making it more
    convenient but potentially less secure
  • key myCA.key: This specifies the private key file (myCA.key) to be used in generating the certificate
  • sha256: This option specifies the hash algorithm to be used for the certificate. In this case, SHA-256 is chosen for stronger security
  • days 1825: This sets the validity period of the certificate in days. Here, it’s set to 1825 days (5 years)
  • out myCA.pem: This specifies the output file name for the generated certificate. In this case, “myCA.pem”

The information you enter is not so important, but it’s best to fill it in as comprehensively as possible. Just make sure you enter for CN your IP or DNS.

You are about to be asked to enter information that will be incorporated
into your certificate request.
What you are about to enter is what is called a Distinguished Name or a DN.
There are quite a few fields but you can leave some blank
For some fields there will be a default value,
If you enter '.', the field will be left blank.
-----
Country Name (2 letter code) [XX]:BE
State or Province Name (full name) []:vlaams-brabant
Locality Name (eg, city) [Default City]:leuven
Organization Name (eg, company) [Default Company Ltd]:
Organizational Unit Name (eg, section) []:
Common Name (eg, your name or your server's hostname) []:192.168.0.134
Email Address []:

Generate CA-Authenticated Certificates

It’s probably good practice to use the dns name of your webiste in the name for the private key. As we use in this case an IP address rather than a dns, I will use the fictive dns zabbix.mycompany.internal.

openssl genrsa -out zabbix.mycompany.internal.key 2048

Generate a Certificate Signing Request (CSR)

openssl req -new -key zabbix.mycompany.internal.key -out zabbix.mycompany.internal.csr

You will be asked the same set of questions as above. Once again, your answers hold minimal significance and in our case no one will inspect the certificate, so they matter even less.

You are about to be asked to enter information that will be incorporated
into your certificate request.
What you are about to enter is what is called a Distinguished Name or a DN.
There are quite a few fields but you can leave some blank
For some fields there will be a default value,
If you enter '.', the field will be left blank.
-----
Country Name (2 letter code) [XX]:BE
State or Province Name (full name) []:vlaams-brabant
Locality Name (eg, city) [Default City]:leuven
Organization Name (eg, company) [Default Company Ltd]:
Organizational Unit Name (eg, section) []:
Common Name (eg, your name or your server's hostname) []:192.168.0.134
Email Address []:

Please enter the following 'extra' attributes
to be sent with your certificate request
A challenge password []:
An optional company name []:

Generate an X509 V3 certificate extension configuration file

# vi zabbix.mycompany.internal.ext

Add the following lines in your certificate extension file. Replace IP or DNS with your own values.

authorityKeyIdentifier=keyid,issuer
basicConstraints=CA:FALSE
keyUsage = digitalSignature, nonRepudiation, keyEncipherment, dataEncipherment
subjectAltName = @alt_names

[alt_names]
IP.1 = 192.168.0.133
#DNS.1 = MYDNS (You can use DNS if you have a dns name if you use IP then use the above line)

Generate the certificate using our CSR, the CA private key, the CA certificate, and the config file

openssl x509 -req -in zabbix.mycompany.internal.csr -CA myCA.pem -CAkey myCA.key \
-CAcreateserial -out zabbix.mycompany.internal.crt -days 825 -sha256 -extfile zabbix.mycompany.internal.ext

Copy the SSL certificates to our Virtual Host

cp zabbix.mycompany.internal.crt /etc/pki/tls/certs/.
cp zabbix.mycompany.internal.key /etc/pki/tls/private/.

Import the CA in Linux (RHEL)

We need to update the CA certificates, so run the below command to update the CA certs.

cp myCA.pem /etc/pki/ca-trust/source/anchors/myCA.crt
update-ca-trust extract

Import the CA in OSX

  • Open the macOS Keychain app
  • Navigate to File > Import Items
  • Choose your private key file (i.e., myCA.pem)
  • Search for the “Common Name” you provided earlier
  • Double-click on your root certificate in the list
  • Expand the Trust section
  • Modify the “When using this certificate:” dropdown to “Always Trust”
  • Close the certificate window

Import the CA in Windows

  • Open the “Microsoft Management Console” by pressing Windows + R, typing mmc, and clicking Open
  • Navigate to File > Add/Remove Snap-in
  • Select Certificates and click Add
  • Choose Computer Account and proceed by clicking Next
  • Select Local Computer and click Finish
  • Click OK to return to the MMC window
  • Expand the view by double-clicking Certificates (local computer)
  • Right-click on Certificates under “Object Type” in the middle column, select All Tasks, and then Import
  • Click Next, followed by Browse. Change the certificate extension dropdown next to the filename field to All Files (.) and locate the myCA.pem file
  • Click Open, then Next
  • Choose “Place all certificates in the following store.” with “Trusted Root Certification Authorities store” as the default. Proceed by clicking Next, then Finish, to finalize the wizard
  • If all went well you should find your certificate under Trusted Root Certification Authorities > Certificates

Warning! You also need to import the myCA.crt file in your OS. We are not an official CA, so we have to import it in our OS and tell it to trust this Certificate. This action depends on the OS you use.

As you are using OpenSSL, you should also create a strong Diffie-Hellman group, which is used in negotiating Perfect Forward Secrecy with clients. You can do this by typing:

openssl dhparam -out /etc/ssl/certs/dhparam.pem 2048

Adapt your Nginx Zabbix config

Add the following lines to your Nginx configuration, modifying the file paths as needed. Replace the existing lines with port 80 with this configuration. This will enable SSL and HTTP2.

# vi /etc/nginx/conf.d/zabbix.conf
server {
listen 443 http2 ssl;
listen [::]:443 http2 ssl;
server_name <ip qddress>;
ssl_certificate /etc/ssl/certs/zabbix.mycompany.internal.crt;
ssl_certificate_key /etc/pki/tls/private/zabbix.mycompany.internal.key;
ssl_dhparam /etc/ssl/certs/dhparam.pem;

To redirect traffic from port 80 to 443 we can add the following lines above our https block:

server {
listen 80;
server_name _; #dns or ip is also possible
return 301 https://$host$request_uri;
}

Restart all services and allow https traffic

systemctl restart php-fpm.service
systemctl restart nginx

firewall-cmd --add-service=https --permanent
firewall-cmd —reload

When we go to our url http://<IP or DNS>/ we get redirected to our https:// page and when we check we can see that our site is secure:

You can check out this article in its original form (and keep an eye out for more of Patrik’s helpful tips) at https://trikke76.github.io/Zabbix-Book/security/securing-zabbix/.

The post Securing the Zabbix Frontend appeared first on Zabbix Blog.

Discover A World of Opportunity at Zabbix Meetings

Post Syndicated from Michael Kammer original https://blog.zabbix.com/discover-a-world-of-opportunity-at-zabbix-meetings/27684/

From the very beginning, Zabbix has been fortunate to have a large, diverse, and truly global community. Engaging with them is the key to getting the most out of Zabbix, and to that end, we introduced Zabbix Meetings in late 2022.

Zabbix Meetings are global get-togethers in locations from Stockholm to Shanghai to Sao Paulo and all points in between. They were created to serve as the first step on the journey to working with Zabbix and getting to know us better, giving Zabbix beginners a chance to learn about our capabilities directly from our team and our partners.

They’re also an opportunity for more experienced Zabbix users to learn from others, share their knowledge, and stay up to date on the latest developments in the Zabbix ecosystem – all in one event.

Whether you’re new to Zabbix or an experienced professional, we’re confident that attending a Zabbix Meeting will help you solve problems, exchange ideas, and grow your Zabbix expertise. Accordingly, here are 4 key benefits you can expect from showing up at a Zabbix Meeting near you.

Build relationships with our team members

Businesses are built on relationships, and ours is no exception. We still believe that there’s no substitute for meeting in person when it comes to building a strong culture, developing rapport with our users and partners, and connecting on a deeper level.

Attending Zabbix Meetings and getting to know our team is a great way to build trust and put some faces to names, which will allow you to know who exactly on our team you can reach out to when you’re shopping around for the best deals on support packages, when you need assistance, or when you want to collaborate on a cool new feature or project that can be a game-changer for your business.

Hear use cases that apply to your own organization

If you’re thinking about adopting Zabbix or expanding your existing Zabbix setup, it can be invaluable to learn how other companies similar to yours have tried and succeeded with it. Our use cases come from actual satisfied Zabbix users and highlight the effectiveness of a specific feature or benefit, while sharing notable results.

They’re also ideal for providing best practices that you can apply to your own industry. We can just about guarantee that no matter what you’re trying to do with Zabbix, a similar organization has already succeeded at it and would be glad to show you how they pulled it off. What’s more, seeing Zabbix-related use cases presented can also help you sell the benefits of Zabbix to stakeholders in your organization, gain buy-in, and present the implementation process.

Get direct, real-time answers to your questions

Taking part in a Zabbix Meeting is an excellent way to grow your professional network and make new business connections – we’ve created them to be the perfect place to meet a variety of like-minded industry professionals. That said, simply attending a Zabbix Meeting isn’t a recipe for success – if you’re not asking questions, you’re definitely not getting the full experience.

Asking good questions at Zabbix Meetings can help you gain valuable information and make the most of your time and the opportunity. The presentations and use cases that are the backbone of any Zabbix Meeting are detailed, in-depth, and full of technical details, so we always offer an extended Q&A session at the end of each one to make sure you walk away from the Meeting with a full understanding of all the information presented.

Learn more about what Zabbix can do for you

If you’re signing up to attend a Zabbix Meeting near you, there’s a good chance that you already know a fair amount about Zabbix and what we do. There are plenty of ways to find out the basics, including visiting our website, checking out our latest blog posts, or having a look at our famous forums.

No matter how much time you spend reading up on us, however, some information is bound to slip through the cracks. You might know about our technical support offers, but there’s no substitute for chatting with one of our support engineers about how you use Zabbix and hearing their opinion about what type of support plan best suits your specific needs.

You might also know that we offer training sessions, but that’s not the same as hearing from one of our certified trainers exactly how a Zabbix Certified training session has upskilled employees at a company just like yours and helped them save money, reduce downtime, and do things with Zabbix that they never imagined possible.

Conclusion

There’s simply no substitute for a Zabbix Meeting when it comes to learning more about what we can do for you. Have a look at our Events page to see when we’ll be in a location near you and be sure to sign up – we’re looking forward to seeing you soon!

The post Discover A World of Opportunity at Zabbix Meetings appeared first on Zabbix Blog.