The Rapid7 Take Command Summit is just two short weeks away. We’re busy putting together one of the most impactful programs on the latest in cybersecurity trends, technology, and innovations available, and we are eager to share it with all of you.
So eager, in fact, that Chairman and CEO of Rapid7, Corey Thomas, has a special message to share.
The Take Command Summit is a chance to hear from industry leaders on up-to-the minute security research, trends, and intelligence; from ransomware and state-sponsored threats, to the marquee vulnerabilities making headlines around the globe.
At Take Command you will receive a glimpse into our elite security operations center (SOC); and understand the best ways to show your organization’s leadership how a robust security operation can actually improve your ROI. We will share our approach to building a world-class SOC with partners who truly understand your needs and what makes your security operations unique.
All of this is in service of what we call commanding the attack surface. It’s best expressed in our effort to anticipate, pinpoint, and act on imminent and active threats across your entire security ecosystem and foster a cultural shift that empowers every member of your organization to help keep your networks secure.
We think this is a critical conversation at a critical moment. We hope to see you there.
This post is written by Uri Segev, Principal Serverless Specialist SA.
When you invoke an AWS Lambda function synchronously, you expect the function to return a response. For example, this is the case when a client invokes a Lambda function through Amazon API Gateway or from AWS Step Functions. As the client is waiting for the response, you should return the response as soon as possible.
However, there may be instances where you must perform additional work that does not affect the response and you can do it asynchronously, after you send the response. For example, you may store data in a database or send information to a logging system.
Once you send the response from the function, the Lambda service freezes the runtime environment, and the function cannot run additional code. Even if you create a thread for running a task in the background, the Lambda service freezes the runtime environment once the handler returns, causing the thread to freeze until the next invocation. While you can delay returning the response to the client until all work is complete, this approach can negatively impact the user experience.
This blog explores ways to run a task that may start before the function returns but continues running after the function returns the response to the client.
Invoking an asynchronous Lambda function
The first option is to break the code into two functions. The first function runs the synchronous code; the second function runs the asynchronous code. Before the synchronous function returns, it invokes the second function asynchronously, either directly, using the Invoke API, or indirectly, for example, by sending a message to Amazon SQS to trigger the second function.
This Python code demonstrates how to implement this:
import json
import time
import os
import boto3
from aws_lambda_powertools import Logger

logger = Logger()
client = boto3.client('lambda')

def calc_response(event):
    logger.info(f"[Function] Calculating response")
    time.sleep(1) # Simulate sync work
    return {
        "message": "hello from async"
    }

def submit_async_task(response):
    # Invoke async function to continue
    logger.info(f"[Function] Invoking async task in async function")
    client.invoke_async(FunctionName=os.getenv('ASYNC_FUNCTION'), InvokeArgs=json.dumps(response))

def handler(event, context):
    logger.info(f"[Function] Received event: {json.dumps(event)}")

    response = calc_response(event)

    # Done calculating response, submit async task
    submit_async_task(response)

    # Return response to client
    logger.info(f"[Function] Returning response to client")
    return {
        "statusCode": 200,
        "body": json.dumps(response)
    }
The following is the Lambda function that performs the asynchronous work:
import json
import time
from aws_lambda_powertools import Logger

logger = Logger()

def handler(event, context):
    logger.info(f"[Async task] Starting async task: {json.dumps(event)}")
    time.sleep(3)  # Simulate async work
    logger.info(f"[Async task] Done")
Use Lambda response streaming
Response streaming enables developers to start streaming the response as soon as they have the first byte of the response, without waiting for the entire response. You usually use response streaming when you must minimize the Time to First Byte (TTFB) or when you must send a response that is larger than 6 MB (the Lambda response payload size limit).
Using this method, the function can send the response using the response streaming mechanism and can continue running code even after sending the last byte of the response. This way, the client receives the response, and the Lambda function can continue running.
This Node.js code demonstrates how to implement this:
import { Logger } from '@aws-lambda-powertools/logger';

const logger = new Logger();

export const handler = awslambda.streamifyResponse(async (event, responseStream, _context) => {
    logger.info("[Function] Received event: ", event);

    // Do some stuff with event
    let response = await calc_response(event);

    // Return response to client
    logger.info("[Function] Returning response to client");
    responseStream.setContentType('application/json');
    responseStream.write(response);
    responseStream.end();

    await async_task(response);
});

const calc_response = async (event) => {
    logger.info("[Function] Calculating response");
    await sleep(1);  // Simulate sync work

    return {
        message: "hello from streaming"
    };
};

const async_task = async (response) => {
    logger.info("[Async task] Starting async task");
    await sleep(3);  // Simulate async work
    logger.info("[Async task] Done");
};

const sleep = async (sec) => {
    return new Promise((resolve) => {
        setTimeout(resolve, sec * 1000);
    });
};
Use Lambda extensions
Lambda extensions can augment Lambda functions to integrate with your preferred monitoring, observability, security, and governance tools. You can also use an extension to run your own code in the background so that it continues running after your function returns the response to the client.
There are two types of Lambda extensions: external extensions and internal extensions. External extensions run as separate processes in the same execution environment. The Lambda function can communicate with the extension using files in the /tmp folder or using a local network, for example, via HTTP requests. You must package external extensions as a Lambda layer.
Internal extensions run as separate threads within the same process that runs the handler. The handler can communicate with the extension using any in-process mechanism, such as internal queues. This example shows an internal extension, which is a dedicated thread within the handler process.
When the Lambda service invokes a function, it also notifies all the extensions of the invocation. The Lambda service only freezes the execution environment when the Lambda function returns a response and all the extensions signal to the runtime that they are finished. With this approach, the function has the extension run the task independently from the function itself and the extension notifies the Lambda runtime when it is done processing the task. This way, the execution environment stays active until the task is done.
The following Python code example isolates the extension code into its own file and the handler imports and uses it to run the background task:
import json
import time
import async_processor as ap
from aws_lambda_powertools import Logger

logger = Logger()

def calc_response(event):
    logger.info(f"[Function] Calculating response")
    time.sleep(1) # Simulate sync work
    return {
        "message": "hello from extension"
    }

# This function is performed after the handler code calls submit_async_task
# and it can continue running after the function returns
def async_task(response):
    logger.info(f"[Async task] Starting async task: {json.dumps(response)}")
    time.sleep(3)  # Simulate async work
    logger.info(f"[Async task] Done")

def handler(event, context):
    logger.info(f"[Function] Received event: {json.dumps(event)}")

    # Calculate response
    response = calc_response(event)

    # Done calculating response
    # call async processor to continue
    logger.info(f"[Function] Invoking async task in extension")
    ap.start_async_task(async_task, response)

    # Return response to client
    logger.info(f"[Function] Returning response to client")
    return {
        "statusCode": 200,
        "body": json.dumps(response)
    }
The following Python code demonstrates how to implement the extension that runs the background task:
import os
import requests
import threading
import queue
from aws_lambda_powertools import Logger

logger = Logger()
LAMBDA_EXTENSION_NAME = "AsyncProcessor"

# An internal queue used by the handler to notify the extension that it can
# start processing the async task.
async_tasks_queue = queue.Queue()

def start_async_processor():
    # Register internal extension
    logger.debug(f"[{LAMBDA_EXTENSION_NAME}] Registering with Lambda service...")
    response = requests.post(
        url=f"http://{os.environ['AWS_LAMBDA_RUNTIME_API']}/2020-01-01/extension/register",
        json={'events': ['INVOKE']},
        headers={'Lambda-Extension-Name': LAMBDA_EXTENSION_NAME}
    )
    ext_id = response.headers['Lambda-Extension-Identifier']
    logger.debug(f"[{LAMBDA_EXTENSION_NAME}] Registered with ID: {ext_id}")

    def process_tasks():
        while True:
            # Call /next to get notified when there is a new invocation and let
            # Lambda know that we are done processing the previous task.

            logger.debug(f"[{LAMBDA_EXTENSION_NAME}] Waiting for invocation...")
            response = requests.get(
                url=f"http://{os.environ['AWS_LAMBDA_RUNTIME_API']}/2020-01-01/extension/event/next",
                headers={'Lambda-Extension-Identifier': ext_id},
                timeout=None
            )

            # Get next task from internal queue
            logger.debug(f"[{LAMBDA_EXTENSION_NAME}] Wok up, waiting for async task from handler")
            async_task, args = async_tasks_queue.get()

            if async_task is None:
                # No task to run this invocation
                logger.debug(f"[{LAMBDA_EXTENSION_NAME}] Received null task. Ignoring.")
            else:
                # Invoke task
                logger.debug(f"[{LAMBDA_EXTENSION_NAME}] Received async task from handler. Starting task.")
                async_task(args)

            logger.debug(f"[{LAMBDA_EXTENSION_NAME}] Finished processing task")

    # Start processing extension events in a separate thread
    threading.Thread(target=process_tasks, daemon=True, name='AsyncProcessor').start()

# Used by the function to indicate that there is work that needs to be
# performed by the async task processor
def start_async_task(async_task=None, args=None):
    async_tasks_queue.put((async_task, args))

# Starts the async task processor
start_async_processor()
Use a custom runtime
Lambda supports several runtimes out of the box: Python, Node.js, Java, Dotnet, and Ruby. Lambda also supports custom runtimes, which lets you develop Lambda functions in any other programming language that you need to.
When you invoke a Lambda function that uses a custom runtime, the Lambda service invokes a process called ‘bootstrap’ that contains your custom code. The custom code needs to interact with the Lambda Runtime API. It calls the /next endpoint to obtain information about the next invocation. This API call is blocking and it waits until a request arrives. When the function is done processing the request, it must call the /response endpoint to send the response back to the client and then it must call the /next endpoint again to wait for the next invocation. Lambda freezes the execution environment after you call /next, until a request arrives.
Using this approach, you can run the asynchronous task after calling /response, and sending the response back to the client, and before calling /next, indicating that the processing is done.
The following Python code example isolates the custom runtime code into its own file and the function imports and uses it to interact with the runtime API:
import time
import json
import runtime_interface as rt
from aws_lambda_powertools import Logger

logger = Logger()

def calc_response(event):
    logger.info(f"[Function] Calculating response")
    time.sleep(1) # Simulate sync work
    return {
        "message": "hello from custom"
    }

def async_task(response):
    logger.info(f"[Async task] Starting async task: {json.dumps(response)}")
    time.sleep(3)  # Simulate async work
    logger.info(f"[Async task] Done")

def main():
    # You can add initialization code here

    # The following loop runs forever waiting for the next invocation
    # and sending the response back to the client
    while True:
        # Call /next to wait for next request (and indicate
        # that we are done processing the previous request)

        requestId, event = rt.get_next()

        # The code from here to send_response() is the code
        # that usually goes inside the Lambda handler()

        logger.info(f"[Function] Received event: {json.dumps(event)}")

        # Calculate response
        response = calc_response(event)

        # Done calculating response, send response to client
        logger.info(f"[Function] Returning response to client")
        rt.send_response(requestId, {
            "statusCode": 200,
            "body": json.dumps(response)
        })

        logger.info(f"[Function] Invoking async task")
        async_task(response)

main()
This Python code demonstrates how to interact with the runtime API:
This blog shows four ways of combining synchronous and asynchronous tasks in a Lambda function, allowing you to run tasks that continue running after the function returns a response to the client. The following table summarizes the pros and cons of each solution:
Function URLs, cannot be used with API Gateway, always public
Asynchronous invocation
Response streaming
Lambda extensions
Custom runtime
Complexity
Easier to implement
Easiest to implement
The most complex solution to implement as it requires interacting with the extensions API and a dedicated thread
Medium as it interacts with the runtime API
Deployment
Need two artifacts: the synchronous function and the asynchronous function
A single deployment artifact that contains all code
A single deployment artifact that contains all code
A single deployment artifact, requires packaging all needed runtime files
Cost
Most expensive as it incurs additional invocation cost as well as the overall duration of both functions is higher than having it in one
Least expensive
Least expensive
Least expensive
Starting the async task
Before returning from handler
Anytime during the handler invocation
Anytime during the handler invocation
After returning the response to the client, unless you use a dedicated thread
Limitations
Payload sent to the asynchronous function cannot exceed 256 KB
Only supported with Node.js and custom runtimes. Requires Lambda Function URLs, cannot be used with API Gateway, always public
–
–
Additional benefits
Better decoupling between synchronous and asynchronous code
Ability to send response in stages. Supports payloads larger than 6 MB (at additional cost)
The asynchronous task runs in its own thread, which can reduce overall duration and cost
–
Retries in case of failure in async code
Managed by the Lambda service
Responsibility of the developer
Responsibility of the developer
Responsibility of the developer
Choosing the right approach depends on your use case. If you write your function in Node.js and you invoke it using Lambda Function URLs, use response streaming. This is the easiest way to implement, and it is the most cost effective.
If there is a chance for a failure in the asynchronous task (for example, a database is not accessible), and you must ensure that the task completes, use the asynchronous Lambda invocation method. The Lambda service retries your asynchronous function until it succeeds. Eventually, if all retries fail, it invokes a Lambda destination so you can take action.
If you need a custom runtime because you need to use a programming language that Lambda does not natively support, use the custom runtime option. Otherwise, use the Lambda extensions option. It is more complex to implement, but it is cost effective. This allows you to package the code in a single artifact and start processing the asynchronous task before you send the response to the client.
For more serverless learning resources, visit Serverless Land.
Data governance is a key enabler for teams adopting a data-driven culture and operational model to drive innovation with data. Amazon DataZone is a fully managed data management service that makes it faster and easier for customers to catalog, discover, share, and govern data stored across Amazon Web Services (AWS), on premises, and on third-party sources. It also makes it easier for engineers, data scientists, product managers, analysts, and business users to access data throughout an organization to discover, use, and collaborate to derive data-driven insights.
Amazon DataZone allows you to simply and securely govern end-to-end data assets stored in your Amazon Redshift data warehouses or data lakes cataloged with the AWS Glue data catalog. As you experience the benefits of consolidating your data governance strategy on top of Amazon DataZone, you may want to extend its coverage to new, diverse data repositories (either self-managed or as managed services) including relational databases, third-party data warehouses, analytic platforms and more.
This post explains how you can extend the governance capabilities of Amazon DataZone to data assets hosted in relational databases based on MySQL, PostgreSQL, Oracle or SQL Server engines. What’s covered in this post is already implemented and available in the Guidance for Connecting Data Products with Amazon DataZone solution, published in the AWS Solutions Library. This solution was built using the AWS Cloud Development Kit (AWS CDK) and was designed to be easy to set up in any AWS environment. It is based on a serverless stack for cost-effectiveness and simplicity and follows the best practices in the AWS Well-Architected-Framework.
Self-service analytics experience in Amazon DataZone
In Amazon DataZone, data producers populate the business data catalog with data assets from data sources such as the AWS Glue data catalog and Amazon Redshift. They also enrich their assets with business context to make them accessible to the consumers.
After the data asset is available in the Amazon DataZone business catalog, data consumers such as analysts and data scientists can search and access this data by requesting subscriptions. When the request is approved, Amazon DataZone can automatically provision access to the managed data asset by managing permissions in AWS Lake Formation or Amazon Redshift so that the data consumer can start querying the data using tools such as Amazon Athena or Amazon Redshift. Note that a managed data asset is an asset for which Amazon DataZone can manage permissions. It includes those stored in Amazon Simple Storage Service (Amazon S3) data lakes (and cataloged in the AWS Glue data catalog) or Amazon Redshift.
As you’ll see next, when working with relational databases, most of the experience described above will remain the same because Amazon DataZone provides a set features and integrations that data producers and consumers can use with a consistent experience, even when working with additional data sources. However, there are some additional tasks that need to be accounted for to achieve a frictionless experience, which will be addressed later in this post.
The following diagram illustrates a high-level overview of the flow of actions when a data producer and consumer collaborate around a data asset stored in a relational database using Amazon DataZone.
Figure 1: Flow of actions for self-service analytics around data assets stored in relational databases
First, the data producer needs to capture and catalog the technical metadata of the data asset.
The AWS Glue data catalog can be used to store metadata from a variety of data assets, like those stored in relational databases, including their schema, connection details, and more. It offers AWS Glue connections and AWS Glue crawlers as a means to capture the data asset’s metadata easily from their source database and keep it up to date. Later in this post, we’ll introduce how the “Guidance for Connecting Data Products with Amazon DataZone” solution can help data producers easily deploy and run AWS Glue connections and crawlers to capture technical metadata.
Second, the data producer needs to consolidate the data asset’s metadata in the business catalog and enrich it with business metadata. The producer also needs to manage and publish the data asset so it’s discoverable throughout the organization.
Amazon DataZone provides built-in data sources that allow you to easily fetch metadata (such as table name, column name, or data types) of assets in the AWS Glue data catalog into Amazon DataZone’s business catalog. You can also include data quality details thanks to the integration with AWS Glue Data Quality or external data quality solutions. Amazon DataZone also provides metadata forms and generative artificial intelligence (generative AI) driven suggestions to simplify the enrichment of data assets’ metadata with business context. Finally, the Amazon DataZone data portal helps you manage and publish your data assets.
Third, a data consumer needs to subscribe to the data asset published by the producer. To do so, the data consumer will submit a subscription request that, once approved by the producer, triggers a mechanism that automatically provisions read access to the consumer without moving or duplicating data.
In Amazon DataZone, data assets stored in relational databases are considered unmanaged data assets, which means that Amazon DataZone will not be able to manage permissions to them on the customer’s behalf. This is where the “Guidance for Connecting Data Products with Amazon DataZone” solution also comes in handy because it deploys the required mechanism to provision access automatically when subscriptions are approved. You’ll learn how the solution does this later in this post.
Finally, the data consumer needs to access the subscribed data once access has been provisioned. Depending on the use case, consumers would like to use SQL-based engines to run exploratory analysis, business intelligence (BI) tools to build dashboards for decision-making, or data science tools for machine learning (ML) development.
Amazon DataZone provides blueprints to give options for consuming data and provides default ones for Amazon Athena and Amazon Redshift, with more to come soon. Amazon Athena connectors is a good way to run one-time queries on top of relational databases. Later in this post we’ll introduce how the “Guidance for Connecting Data Products with Amazon DataZone” solution can help data consumers deploy Amazon Athena connectors and become a platform to deploy custom tools for data consumers.
Solution’s core components
Now that we have covered what the self-service analytics experience looks like when working with data assets stored in relational databases, let’s review at a high level the core components of the “Guidance for Connecting Data Products with Amazon DataZone” solution.
You’ll be able to identify where some of the core components fit in the flow of actions described in the last section because they were developed to bring simplicity and automation for a frictionless experience. Other components, even though they are not directly tied to the experience, are as relevant since they take care of the prerequisites for the solution to work properly.
Figure 2: Solution’s core components
The toolkit component is a set of tools (in AWS Service Catalog) that producer and consumer teams can easily deploy and use, in a self-service fashion, to support some of the tasks described in the experience, such as the following.
As a data producer, capture metadata from data assets stored in relational databases into the AWS Glue data catalog by leveraging AWS Glue connectors and crawlers.
As a data consumer, query a subscribed data asset directly from its source database with Amazon Athena by deploying and using an Amazon Athena connector.
The workflows component is a set of automated workflows (orchestrated through AWS Step Functions) that will trigger automatically on certain Amazon DataZone events such as:
When a new Amazon DataZone data lake environment is successfully deployed so that its default capabilities are extended to support this solution’s toolkit.
When a subscription request is accepted by a data producer so that access is provisioned automatically for data assets stored in relational databases. This workflow is the mechanism that was referred to in the experience of the last section as the means to provision access to unmanaged data assets governed by Amazon DataZone.
When a subscription is revoked or canceled so that access is revoked automatically for data assets in relational databases.
When an existing Amazon DataZone environment deletion starts so that non default Amazon DataZone capabilities are removed.
The following table lists the multiple AWS services that the solution uses to provide an add-on for Amazon DataZone with the purpose of providing the core components described in this section.
Used to store database credentials as secrets. Each consumer environment with granted subscription to one or many data assets in the same relational database will have its own individual credentials (secret).
Used to provide a complementary toolkit for users (producers and consumers), so that they can provision products to execute tasks specific to their roles in a self-service manner.
Multiple components are used, such as the AWS Glue data catalog as the direct publishing source for Amazon DataZone business catalog and connectors and crawlers to connect on infer schemas from data assets stored in relational databases.
Used as one of the consumption mechanisms that allow users and teams to query data assets that they are subscribed to, either on top of Amazon S3 backed data lakes and relational databases.
Solution overview
Now let’s dive into the workflow that automatically provisions access to an approved subscription request (2b in the last section). Figure 3 outlines the AWS services involved in its execution. It also illustrates when the solution’s toolkit is used to simplify some of the tasks that producers and consumers need to perform before and after a subscription is requested and granted. If you’d like to learn more about other workflows in this solution, please refer to the implementation guide.
The architecture illustrates how the solution works in a multi-account environment, which is a common scenario. In a multi-account environment, the governance account will host the Amazon DataZone domain and the remaining accounts will be associated to it. The producer account hosts the subscription’s data asset and the consumer account hosts the environment subscribing to the data asset.
Figure 3 – Architecture for subscription grant workflow
Solution walkthrough
1. Capture data asset’s metadata
A data producer captures metadata of a data asset to be published from its data source into the AWS Glue catalog. This can be done by using AWS Glue connections and crawlers. To speed up the process, the solution includes a Producer Toolkit using the AWS Service Catalog to simplify the deployment of such resources by just filling out a form.
Once the data asset’s technical metadata is captured, the data producer will run a data source job in Amazon DataZone to publish it into the business catalog. In the Amazon DataZone portal, a consumer will discover the data asset and subsequently, subscribe to it when needed. Any subscription action will create a subscription request in Amazon DataZone.
2. Approve a subscription request
The data producer approves the incoming subscription request. An event is sent to Amazon EventBridge, where a rule deployed by the solution captures it and triggers an instance of the AWS Step Functions primary state machine in the governance account for each environment of the subscribing project.
3. Fulfill read-access in the relational database (producer account)
The primary state machine in the governance account triggers an instance of the AWS Step Functions secondary state machine in the producer account, which will run a set of AWS Lambda functions to:
Retrieve the subscription data asset’s metadata from the AWS Glue catalog, including the details required for connecting to the data source hosting the subscription’s data asset.
Connect to the data source hosting the subscription’s data asset, create credentials for the subscription’s target environment (if nonexistent) and grant read access to the subscription’s data asset.
Store the new data source credentials in an AWS Secrets Manager producer secret (if nonexistent) with a resource policy allowing read cross-account access to the environment’s associated consumer account.
Update tracking records in Amazon DynamoDB in the governance account.
4. Share access credentials to the subscribing environment (consumer account)
The primary state machine in the governance account triggers an instance of the AWS Step Functions secondary state machine in the consumer account, which will run a set of AWS Lambda functions to:
Retrieve connection credentials from the producer secret in the producer account through cross-account access, then copy the credentials into a new consumer secret (if nonexistent) in AWS Secrets Manager local to the consumer account.
Update tracking records in Amazon DynamoDB in the governance account.
5. Access the subscribed data
The data consumer uses the consumer secret to connect to that data source and query the subscribed data asset using any preferred means.
To speed up the process, the solution includes a consumer toolkit using the AWS Service Catalog to simplify the deployment of such resources by just filling out a form. Current scope for this toolkit includes a tool that deploys an Amazon Athena connector for a corresponding MySQL, PostgreSQL, Oracle, or SQL Server data source. However, it could be extended to support other tools on top of AWS Glue, Amazon EMR, Amazon SageMaker, Amazon Quicksight, or other AWS services, and keep the same simple-to-deploy experience.
Conclusion
In this post we went through how teams can extend the governance of Amazon DataZone to cover relational databases, including those with MySQL, Postgres, Oracle, and SQL Server engines. Now, teams are one step further in unifying their data governance strategy in Amazon DataZone to deliver self-service analytics across their organizations for all of their data.
As a final thought, the solution explained in this post introduces a replicable pattern that can be extended to other relational databases. The pattern is based on access grants through environment-specific credentials that are shared as secrets in AWS Secrets Manager. For data sources with different authentication and authorization methods, the solution can be extended to provide the required means to grant access to them (such as through AWS Identity and Access Management (IAM) roles and policies). We encourage teams to experiment with this approach as well.
How to get started
With the “Guidance for Connecting Data Products with Amazon DataZone” solution, you have multiple resources to learn more, test it, and make it your own.
You can learn more on the AWS Solutions Library solutions page. You can download the source code from GitHub and follow the README file to learn more of its underlying components and how to set it up and deploy it in a single or multi-account environment. You can also use it to learn how to think of costs when using the solution. Finally, it explains how best practices from the AWS Well-Architected Framework were included in the solution.
You can follow the solution’s hands-on lab either with the help of the AWS Solutions Architect team or on your own. The lab will take you through the entire workflow described in this post for each of the supported database engines (MySQL, PostgreSQL, Oracle, and SQL Server). We encourage you to start here before trying the solution in your own testing environments and your own sample datasets. Once you have full clarity on how to set up and use the solution, you can test it with your workloads and even customize it to make it your own.
The implementation guide is an asset for customers eager to customize or extend the solution to their specific challenges and needs. It provides an in-depth description of the code repository structure and the solution’s underlying components, as well as all the details to understand the mechanisms used to track all subscriptions handled by the solution.
About the authors
Jose Romero is a Senior Solutions Architect for Startups at AWS, based in Austin, TX, US. He is passionate about helping customers architect modern platforms at scale for data, AI, and ML. As a former senior architect with AWS Professional Services, he enjoys building and sharing solutions for common complex problems so that customers can accelerate their cloud journey and adopt best practices. Connect with him on LinkedIn..
Leonardo Gómez is a Principal Big Data / ETL Solutions Architect at AWS, based in Florida, US. He has over a decade of experience in data management, helping customers around the globe address their business and technical needs. Connect with him on LinkedIn.
One of GitHub’s core values is Diverse and Inclusive. It is a guiding thought for how we operate, reminding us that GitHub serves a developer community that spans a wide range of geography and ability.
Putting diversity and inclusivity into practice means incorporating a wide range of perspectives into our work. To that point, disability and accessibility are an integral part of our efforts.
This consideration has been instrumental in crafting resilient, accessible components at GitHub. These components, in turn, help to guarantee that our experiences work regardless how they are interacted with.
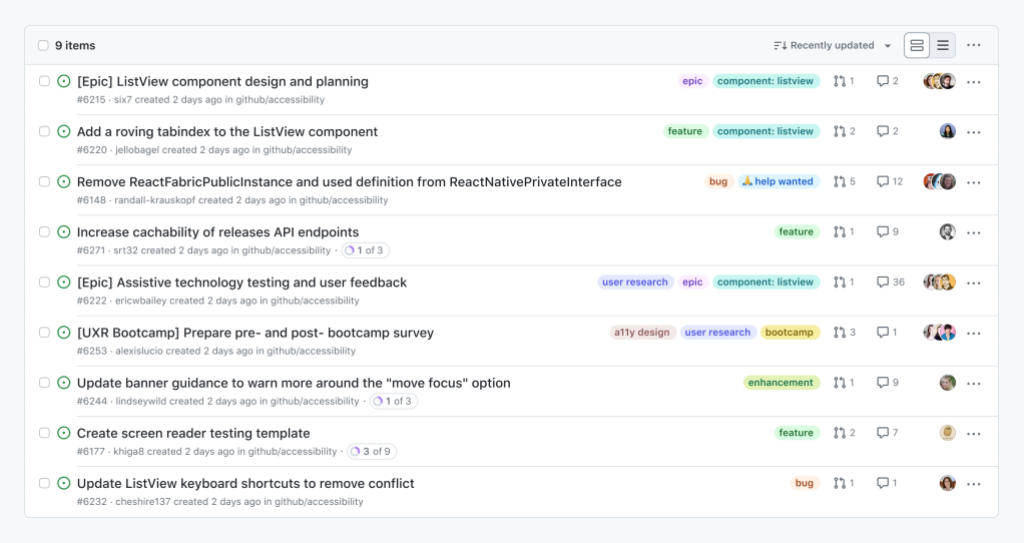
Using GitHub should be efficient and intuitive, regardless of your device, circumstance, or ability. To that point, we have been working on improving the accessibility of our lists of issues and pull requests, as well as our information tables.
Our list of issues and pull requests are some of the most high-traffic experiences we have on GitHub. For many, it is the “homepage” of their open source projects, a jumping off point for conducting and managing work.
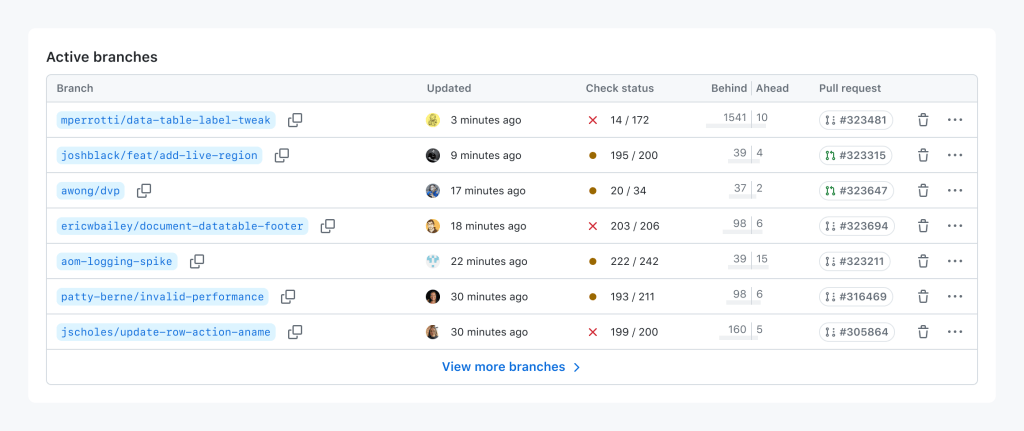
Our tables help to communicate, and facilitate taking action with confidence on complicated information relationships. These experiences are workhorses, helping to communicate information about branches, repositories, secrets, attestations, configurations, internal documentation, etc.
Nothing about us without us
Before we discuss the particulars of these updates, I would like to call attention to the most important aspect of the work: direct participation of, and input from daily assistive technology users.
Disabled people’s direct involvement in the inception, design, and development stages is indispensable. It’s crucial for us to go beyond compliance and weave these practices into the core of our organization. Only by doing so can we create genuinely inclusive experiences.
With this context established, we can now talk about how this process manifests in component work.
Improvements we’re making to lists of issues and pull requests
Lists of issues and pull requests will continue to support methods of navigation via assistive technology that you may already be familiar with—making experiences consistent and predictable is a huge and often overlooked aspect of the work.
In addition, these lists will soon be updated to also have:
A dedicated subheading for quickly navigating to the list itself.
Primer-derived tables help provide consistency and predictability. This is important for expected table navigation, but also applies for other table-related experiences, such as loading content, sorting and pagination requests, and bulk and row-level actions.
At the time of this blog post’s publishing, there are 75 bespoke tables that have been replaced with the Primer component, spread across all of GitHub.
The reason for this quiet success has been due entirely to close collaboration with both our disabled partners and our design system experts. This collaboration helped to ensure:
The new table experiences were seamlessly integrated.
Doing so, improved and enhanced the underlying assistive technology experience.
Progress over perfection
Meryl K. Evans’ Progress Over Perfection philosophy heavily influenced how we approached this work.
Accessibility is never done. Part of our dedication to this work is understanding that it will grow and change to meet the needs of the people who rely on it. This means making positive, iterative change based on feedback from the community GitHub serves.
More to come
Tables will continue to be updated, and the lists should be released publicly soon. Beyond that, we’re excited about the changes we’re making to improve GitHub’s accessibility. This includes both our services and also our internal culture.
We hope that these components, and the process that led to their creation, help you as both part of our developer community and as people who build the world’s software.
In this post, we explore how Amazon Web Services (AWS) customers can use Amazon Security Lake to efficiently collect, query, and centralize logs on AWS. We also discuss new use cases for Security Lake, such as applying generative AI to Security Lake data for threat hunting and incident response, and we share the latest service enhancements and developments from our growing landscape. Security Lake centralizes security data from AWS environments, software as a service (SaaS) providers, and on-premises and cloud sources into a purpose-built data lake that is stored in your AWS account. Using Open Cybersecurity Schema Framework (OCSF) support, Security Lake normalizes and combines security data from AWS and a broad range of third-party data sources. This helps provide your security team with the ability to investigate and respond to security events and analyze possible threats within your environment, which can facilitate timely responses and help to improve your security across multicloud and hybrid environments.
One year ago, AWS embarked on a mission driven by the growing customer need to revolutionize how security professionals centralize, optimize, normalize, and analyze their security data. As we celebrate the one-year general availability milestone of Amazon Security Lake, we’re excited to reflect on the journey and showcase how customers are using the service, yielding both productivity and cost benefits, while maintaining ownership of their data.
In this section, we highlight how some of our customers have found the most value with Security Lake and how you can use Security Lake in your organization.
Simplify the centralization of security data management across hybrid environments to enhance security analytics
Many customers use Security Lake to gather and analyze security data from various sources, including AWS, multicloud, and on-premises systems. By centralizing this data in a single location, organizations can streamline data collection and analysis, help eliminate data silos, and improve cross-environment analysis. This enhanced visibility and efficiency allows security teams to respond more effectively to security events. With Security Lake, customers simplify data gathering and reduce the burden of data retention and extract, transform, and load (ETL) processes with key AWS data sources.
For example, Interpublic Group (IPG), an advertising company, uses Security Lake to gain a comprehensive, organization-wide grasp of their security posture across hybrid environments. Watch this video from re:Inforce 2023 to understand how IPG streamlined their security operations.
Before adopting Security Lake, the IPG team had to work through the challenge of managing diverse log data sources. This involved translating and transforming the data, as well as reconciling complex elements like IP addresses. However, with the implementation of Security Lake, IPG was able to access previously unavailable log sources. This enabled them to consolidate and effectively analyze security-related data. The use of Security Lake has empowered IPG to gain comprehensive insight into their security landscape, resulting in a significant improvement in their overall security posture.
“We can achieve a more complete, organization-wide understanding of our security posture across hybrid environments. We could quickly create a security data lake that centralized security-related data from AWS and third-party sources,” — Troy Wilkinson, Global CISO at Interpublic Group
Streamline incident investigation and reduce mean time to respond
As organizations expand their cloud presence, they need to gather information from diverse sources. Security Lake automates the centralization of security data from AWS environments and third-party logging sources, including firewall logs, storage security, and threat intelligence signals. This removes the need for custom, one-off security consolidation pipelines. The centralized data in Security Lake streamlines security investigations, making security management and investigations simpler. Whether you’re in operations or a security analyst, dealing with multiple applications and scattered data can be tough. Security Lake makes it simpler by centralizing the data, reducing the need for scattered systems. Plus, with data stored in your Amazon Simple Storage Service (Amazon S3) account, Security Lake lets you store a lot of historical data, which helps when looking back for patterns or anomalies indicative of security issues.
For example, SEEK, an Australian online employment marketplace, uses Security Lake to streamline incident investigations and reduce mean time to respond (MTTR). Watch this video from re:Invent 2023 to understand how SEEK improved its incident response. Prior to using Security Lake, SEEK had to rely on a legacy VPC Flow Logs system to identify possible indicators of compromise, which took a long time. With Security Lake, the company was able to more quickly identify a host in one of their accounts that was communicating with a malicious IP. Now, Security Lake has provided SEEK with swift access to comprehensive data across diverse environments, facilitating forensic investigations and enabling them scale their security operations better.
Optimize your log retention strategy
Security Lake simplifies data management for customers who need to store large volumes of security logs to meet compliance requirements. It provides customizable retention settings and automated storage tiering to optimize storage costs and security analytics. It automatically partitions and converts incoming security data into a storage and query-efficient Apache Parquet format. Security Lake uses the Apache Iceberg open table format to enhance query performance for your security analytics. Customers can now choose which logs to keep for compliance reasons, which logs to send to their analytics solutions for further analysis, and which logs to query in place for incident investigation use cases. Security Lake helps customers to retain logs that were previously unfeasible to store and to extend storage beyond their typical retention policy, within their security information and event management (SIEM) system.
Figure 2 shows a section of the Security Lake activation page, which presents users with options to set rollup AWS Regions and storage classes.
Figure 2: Security Lake activation page with options to select a roll-up Region and set storage classes
For example, Carrier, an intelligent climate and energy solutions company, relies on Security Lake to strengthen its security and governance practices. By using Security Lake, Carrier can adhere to compliance with industry standards and regulations, safeguarding its operations and optimizing its log retention.
“Amazon Security Lake simplifies the process of ingesting and analyzing all our security-related log and findings data into a single data lake, strengthening our enterprise-level security and governance practices. This streamlined approach has enhanced our ability to identify and address potential issues within our environment more effectively, enabling us to proactively implement mitigations based on insights derived from the service,” — Justin McDowell, Associate Director for Enterprise Cloud Services at Carrier
Proactive threat and vulnerability detection
Security Lake helps customers identify potential threats and vulnerabilities earlier in the development process by facilitating the correlation of security events across different data sources, allowing security analysts to identify complex attack patterns more effectively. This proactive approach shifts the responsibility for maintaining secure coding and infrastructure to earlier phases, enhancing overall security posture. Security Lake can also optimize security operations by automating safeguard protocols and involving engineering teams in decision-making, validation, and remediation processes. Also, by seamlessly integrating with security orchestration tools, Security Lake can help expedite responses to security incidents and preemptively help mitigate vulnerabilities before exploitation occurs.
For example, SPH Media, a Singapore media company, uses Security Lake to get better visibility into security activity across their organization, enabling proactive identification of potential threats and vulnerabilities.
Security Lake and generative AI for threat hunting and incident response practices
Centralizing security-related data allows organizations to efficiently analyze behaviors from systems and users across their environments, providing deeper insight into potential risks. With Security Lake, customers can centralize their security logs and have them stored in a standardized format using OCSF. OCSF implements a well-documented schema maintained at schema.ocsf.io, which generative AI can use to contextualize the structured data within Security Lake tables. Security personnel can then ask questions of the data using familiar security investigation terminology rather than needing data analytics skills to translate an otherwise simple question into complex SQL (Structured Query Language) queries. Building upon the previous processes, Amazon Bedrock then takes an organization’s natural language incident response playbooks and converts them into a sequence of queries capable of automating what would otherwise be manual investigation tasks.
“Organizations can benefit from using Amazon Security Lake to centralize and manage security data with the OCSF and Apache Parquet format. It simplifies the integration of disparate security log sources and findings, reducing complexity and cost. By applying generative AI to Security Lake data, SecOps can streamline security investigations, facilitate timely responses, and enhance their overall security,” — Phil Bues, Research Manager, Cloud Security at IDC
Enhance incident response workflow with contextual alerts
Incident responders commonly deal with a high volume of automatically generated alerts from their IT environment. Initially, the response team members sift through numerous log sources to uncover relevant details about affected resources and the causes of alerts, which adds time to the remediation process. This manual process also consumes valuable analyst time, particularly if the alert turns out to be a false positive.
To reduce this burden on incident responders, customers can use generative AI to perform initial investigations and generate human-readable context from alerts. Amazon QuickSight Q is a generative AI–powered assistant that can answer questions, provide summaries, generate content, and securely complete tasks based on data and information in your enterprise systems. Incident responders can now combine these capabilities with data in Amazon Security Lake to begin their investigation and build detailed dashboards in minutes. This allows them to visually identify resources and activities that could potentially trigger alerts, giving incident responders a head start in their response efforts. The approach can also be used to validate alert information against alternative sources, enabling faster identification of false positives and allowing responders to focus on genuine security incidents.
As natural language processing (NLP) models evolve they can also interpret incident response playbooks, often written in a human-readable, step-by-step format. Amazon Q Apps will enable the incident responder to use natural language to quickly and securely build their own generative AI playbooks to automate their tasks. This automation can streamline incident response tasks such as creating tickets in the relevant ticketing system, logging bugs in the version control system that hosts application code, and tagging resources as non-compliant if they fail to adhere to the organization’s IT security policy.
Incident investigation with automatic dashboard generation
By using Amazon QuickSight Q and data in Security Lake, incident responders can now generate customized visuals based on the specific characteristics and context of the incident they are investigating. The incident response team can start with a generic investigative question and automatically produce dashboards without writing SQL queries or learning the complexities of how to build a dashboard.
After building a topic in Amazon QuickSight Q. The investigator can either ask their own question or utilize the AI generated questions that Q has provided. In the example shown in Figure 3, the incident responder suspects a potential security incident and is seeking more information about Create or Update API calls in their environment, by asking ” I’m looking for what accounts ran an update or create api call in the last week, can you display the API Operation?
Figure 3: AI Generated visual to begin the investigation
This automatically generated dashboard can be saved for later and from this dashboard the investigator can just focus on one account with a simple right click and get more information about the API calls performed by a single account. as shown in Figure 4.
Figure 4: Investigating API calls for a single account
Using the centralized security data in Amazon Security Lake and Amazon QuickSight Q, incident responders can jump-start investigations and rapidly validate potential threats without having to write complex queries or manually construct dashboards.
Updates since GA launch
Security Lake makes it simpler to analyze security data, gain a more comprehensive understanding of security across your entire organization, and improve the protection of your workloads, applications, and data. Since the general availability release in 2023, we have made various updates to the service. It’s now available in 17 AWS Regions globally. To assist you in evaluating your current and future Security Lake usage and cost estimates, we’ve introduced a new usage page. If you’re currently in a 15-day free trial, your trial usage can serve as a reference for estimating post-trial costs. Accessing Security Lake usage and projected costs is as simple as logging into the Security Lake console.
We have released an integration with Amazon Detective that enables querying and retrieving logs stored in Security Lake. Detective begins pulling raw logs from Security Lake related to AWS CloudTrail management events and Amazon VPC Flow Logs. Security Lake enhances analytics performance with support for OCSF 1.1.0 and Apache Iceberg. Also, Security Lake has integrated several OCSF mapping enhancements, including OCSF Observables, and has adopted the latest version of the OCSF datetime profile for improved usability. Security Lake seamlessly centralizes and normalizes Amazon Elastic Kubernetes Service (Amazon EKS) audit logs, simplifying monitoring and investigation of potential suspicious activities in your Amazon EKS clusters, without requiring additional setup or affecting existing configurations.
The global team of experts in the AWS Professional Services organization can help customers realize their desired business outcomes with AWS. Our teams of data architects and security engineers collaborate with customer security, IT, and business leaders to develop enterprise solutions.
The AWS ProServe Amazon Security Lake Assessment offering is a complimentary workshop for customers. It entails a two-week interactive assessment, delving deep into customer use cases and creating a program roadmap to implement Security Lake alongside a suite of analytics solutions. Through a series of technical and strategic discussions, the AWS ProServe team analyzes use cases for data storage, security, search, visualization, analytics, AI/ML, and generative AI. The team then recommends a target future state architecture to achieve the customer’s security operations goals. At the end of the workshop, customers receive a draft architecture and implementation plan, along with infrastructure cost estimates, training, and other technical recommendations.
Summary
In this post, we showcased how customers use Security Lake to collect, query, and centralize logs on AWS. We discussed new applications for Security Lake and generative AI for threat hunting and incident response. We invite you to discover the benefits of using Security Lake through our 15-day free trial and share your feedback. To help you in getting started and building your first security data lake, we offer a range of resources including an infographic, eBook, demo videos, and webinars. There are many different use cases for Security Lake that can be tailored to suit your AWS environment. Join us at AWS re:Inforce 2024, our annual cloud security event, for more insights and firsthand experiences of how Security Lake can help you centralize, normalize, and optimize your security data.
If you have feedback about this post, submit comments in the Comments section below. If you have questions about this post, contact AWS Support.
As a developer, you can now use your company’s single sign-on credentials to sign in to Bedrock Studio and start experimenting. You can build applications using a wide array of top performing models, evaluate, and share your generative AI apps within Bedrock Studio. The user interface guides you through various steps to help improve a model’s responses. You can experiment with model settings, and securely integrate your company data sources, tools, and APIs, and set guardrails. You can collaborate with team members to ideate, experiment, and refine your generative AI applications—all without requiring advanced machine learning (ML) expertise or AWS Management Console access.
As an Amazon Web Services (AWS) administrator, you can be confident that developers will only have access to the features provided by Bedrock Studio, and won’t have broader access to AWS infrastructure and services.
Now, let me show you how to get started with Amazon Bedrock Studio.
Get started with Amazon Bedrock Studio As an AWS administrator, you first need to create an Amazon Bedrock Studio workspace, then select and add users you want to give access to the workspace. Once the workspace is created, you can share the workspace URL with the respective users. Users with access privileges can sign in to the workspace using single sign-on, create projects within their workspace, and start building generative AI applications.
Create Amazon Bedrock Studio workspace Navigate to the Amazon Bedrock console and choose Bedrock Studio on the bottom left pane.
Before creating a workspace, you need to configure and secure the single sign-on integration with your identity provider (IdP) using the AWS IAM Identity Center. For detailed instructions on how to configure various IdPs, such as AWS Directory Service for Microsoft Active Directory, Microsoft Entra ID, or Okta, check out the AWS IAM Identity Center User Guide. For this demo, I configured user access with the default IAM Identity Center directory.
If you want, you can also select default generative AI models and embedding models for the workspace. Once you’re done, choose Create.
Next, select the created workspace.
Then, choose User management and Add users or groups to select the users you want to give access to this workspace.
Back in the Overview tab, you can now copy the Bedrock Studio URL and share it with your users.
Build generative AI applications using Amazon Bedrock Studio As a builder, you can now navigate to the provided Bedrock Studio URL and sign in with your single sign-on user credentials. Welcome to Amazon Bedrock Studio! Let me show you how to choose from industry leading FMs, bring your own data, use functions to make API calls, and safeguard your applications using guardrails.
Choose from multiple industry leading FMs By choosing Explore, you can start selecting available FMs and explore the models using natural language prompts.
If you choose Build, you can start building generative AI applications in a playground mode, experiment with model configurations, iterate on system prompts to define the behavior of your application, and prototype new features.
Bring your own data With Bedrock Studio, you can securely bring your own data to customize your application by providing a single file or by selecting a knowledge base created in Amazon Bedrock.
Use functions to make API calls and make model responses more relevant A function call allows the FM to dynamically access and incorporate external data or capabilities when responding to a prompt. The model determines which function it needs to call based on an OpenAPI schema that you provide.
Functions enable a model to include information in its response that it doesn’t have direct access to or prior knowledge of. For example, a function could allow the model to retrieve and include the current weather conditions in its response, even though the model itself doesn’t have that information stored.
Safeguard your applications using Guardrails for Amazon Bedrock You can create guardrails to promote safe interactions between users and your generative AI applications by implementing safeguards customized to your use cases and responsible AI policies.
When you create applications in Amazon Bedrock Studio, the corresponding managed resources such as knowledge bases, agents, and guardrails are automatically deployed in your AWS account. You can use the Amazon Bedrock API to access those resources in downstream applications.
Here’s a short demo video of Amazon Bedrock Studio created by my colleague Banjo Obayomi.
Join the preview Amazon Bedrock Studio is available today in public preview in AWS Regions US East (N. Virginia) and US West (Oregon). To learn more, visit the Amazon Bedrock Studio page and User Guide.
Give Amazon Bedrock Studio a try today and let us know what you think! Send feedback to AWS re:Post for Amazon Bedrock or through your usual AWS contacts, and engage with the generative AI builder community at community.aws.
The
systemd project is preparing for a new release.
Version 256-rc1 was released
on April 25 with a large number of changes and new features. Most of the
changes relate to security, easier configuration, unprivileged access to system
resources, or all three of these. Users of systemd will find setting up
containers — even without root access — much simpler and more secure.
This attack has been feasible for over two decades:
Researchers have devised an attack against nearly all virtual private network applications that forces them to send and receive some or all traffic outside of the encrypted tunnel designed to protect it from snooping or tampering.
TunnelVision, as the researchers have named their attack, largely negates the entire purpose and selling point of VPNs, which is to encapsulate incoming and outgoing Internet traffic in an encrypted tunnel and to cloak the user’s IP address. The researchers believe it affects all VPN applications when they’re connected to a hostile network and that there are no ways to prevent such attacks except when the user’s VPN runs on Linux or Android. They also said their attack technique may have been possible since 2002 and may already have been discovered and used in the wild since then.
[…]
The attack works by manipulating the DHCP server that allocates IP addresses to devices trying to connect to the local network. A setting known as option 121 allows the DHCP server to override default routing rules that send VPN traffic through a local IP address that initiates the encrypted tunnel. By using option 121 to route VPN traffic through the DHCP server, the attack diverts the data to the DHCP server itself.
Managing risk posture — how your business assesses, prioritizes, and mitigates risks — has never been easy. But as attack surfaces continue to expand rapidly, doing that job has become increasingly complex and inefficient. (One global survey found that SOC team members spend, on average, one-third of their workday on incidents that pose no threat).
But what if you could mitigate risk with less effort and less noise?
Why this approach helps protect more of your attack surface, while also reducing SecOps effort
Three key use cases — including enforcing Zero Trust with our expanded CrowdStrike partnership
Other new projects we’re exploring based on these capabilities
Cloudflare for Unified Risk Posture
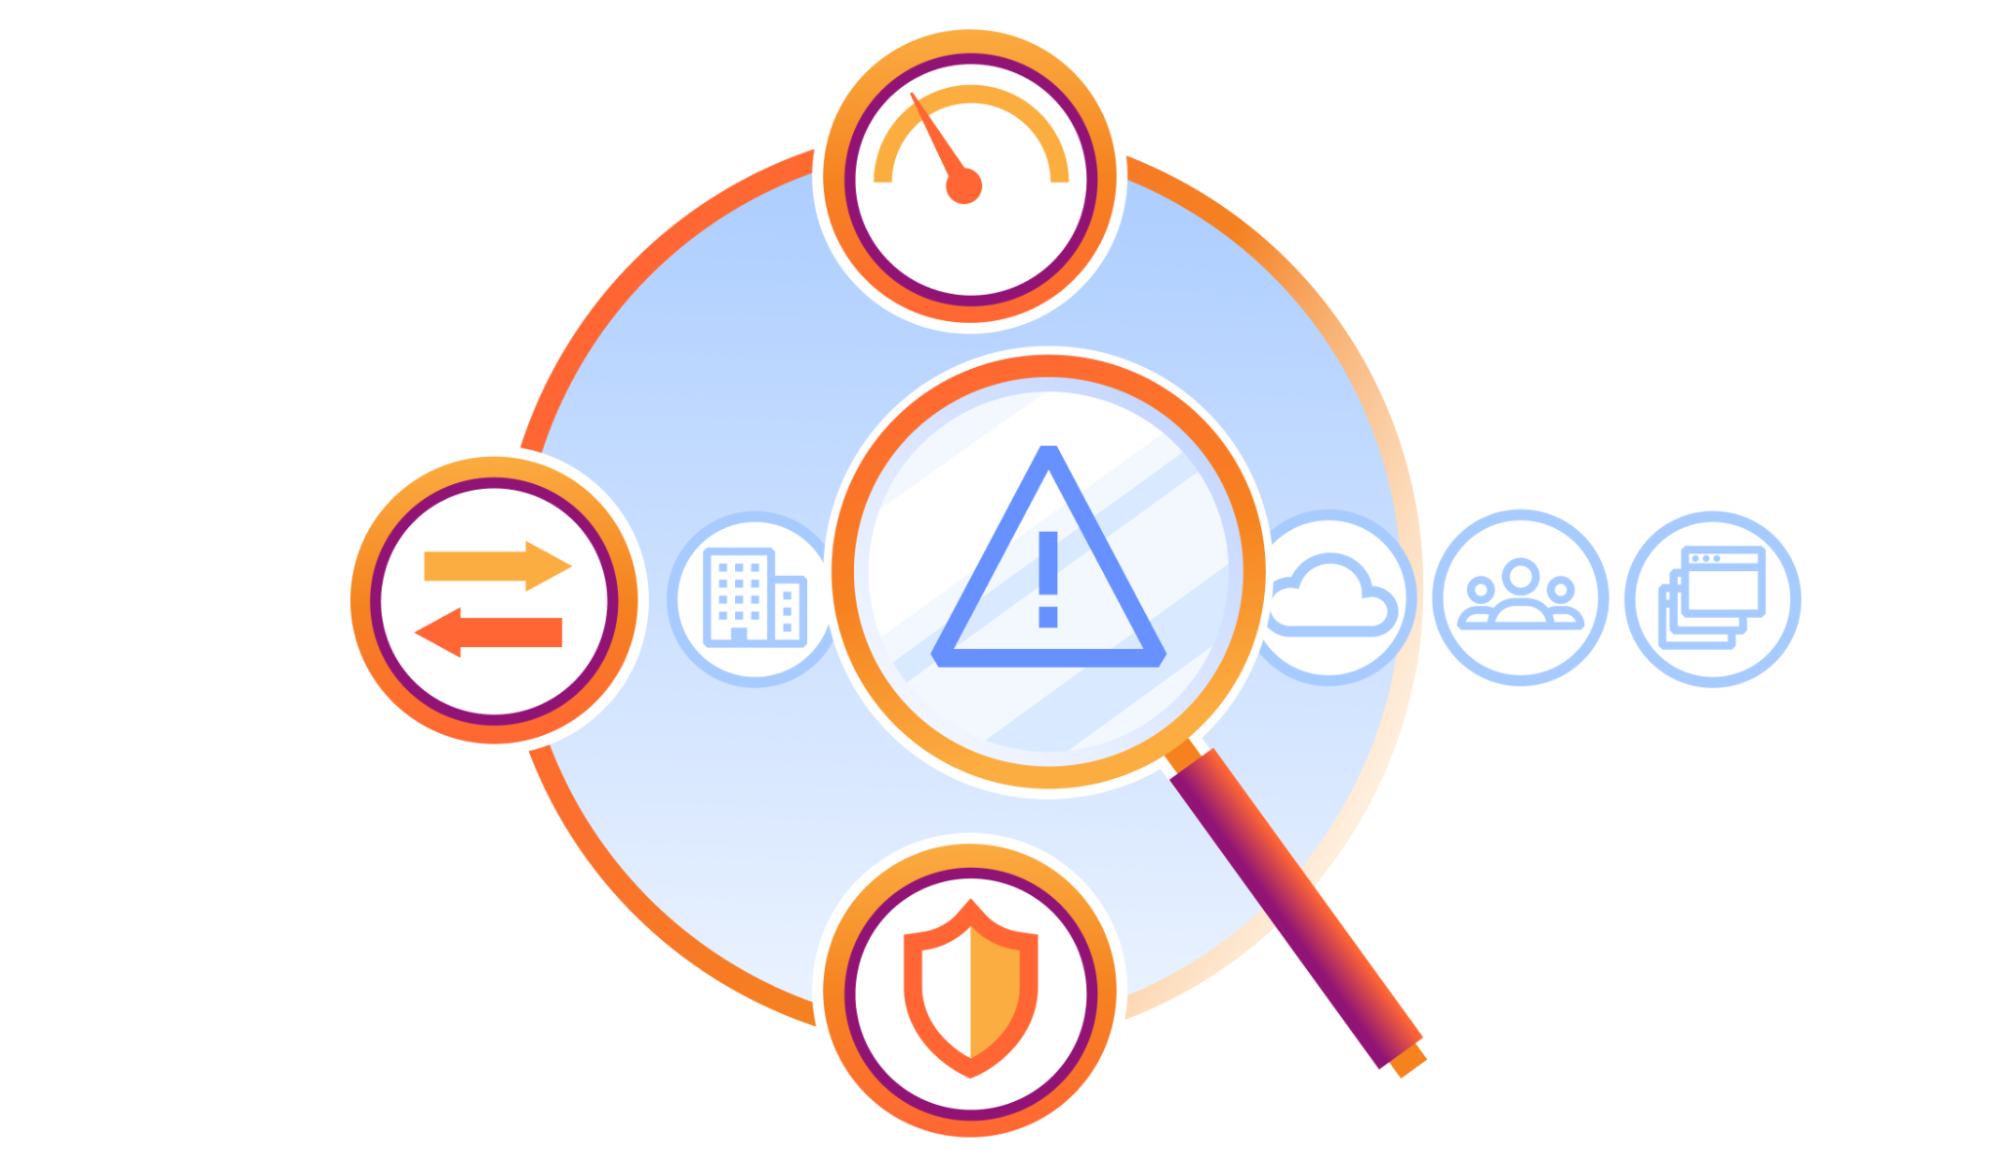
Today, we’re announcing Cloudflare for Unified Risk Posture, a new suite of cybersecurity risk management capabilities that can help enterprises with automated and dynamic risk posture enforcement across their expanding attack surface. Today, one unified platform enables organizations to:
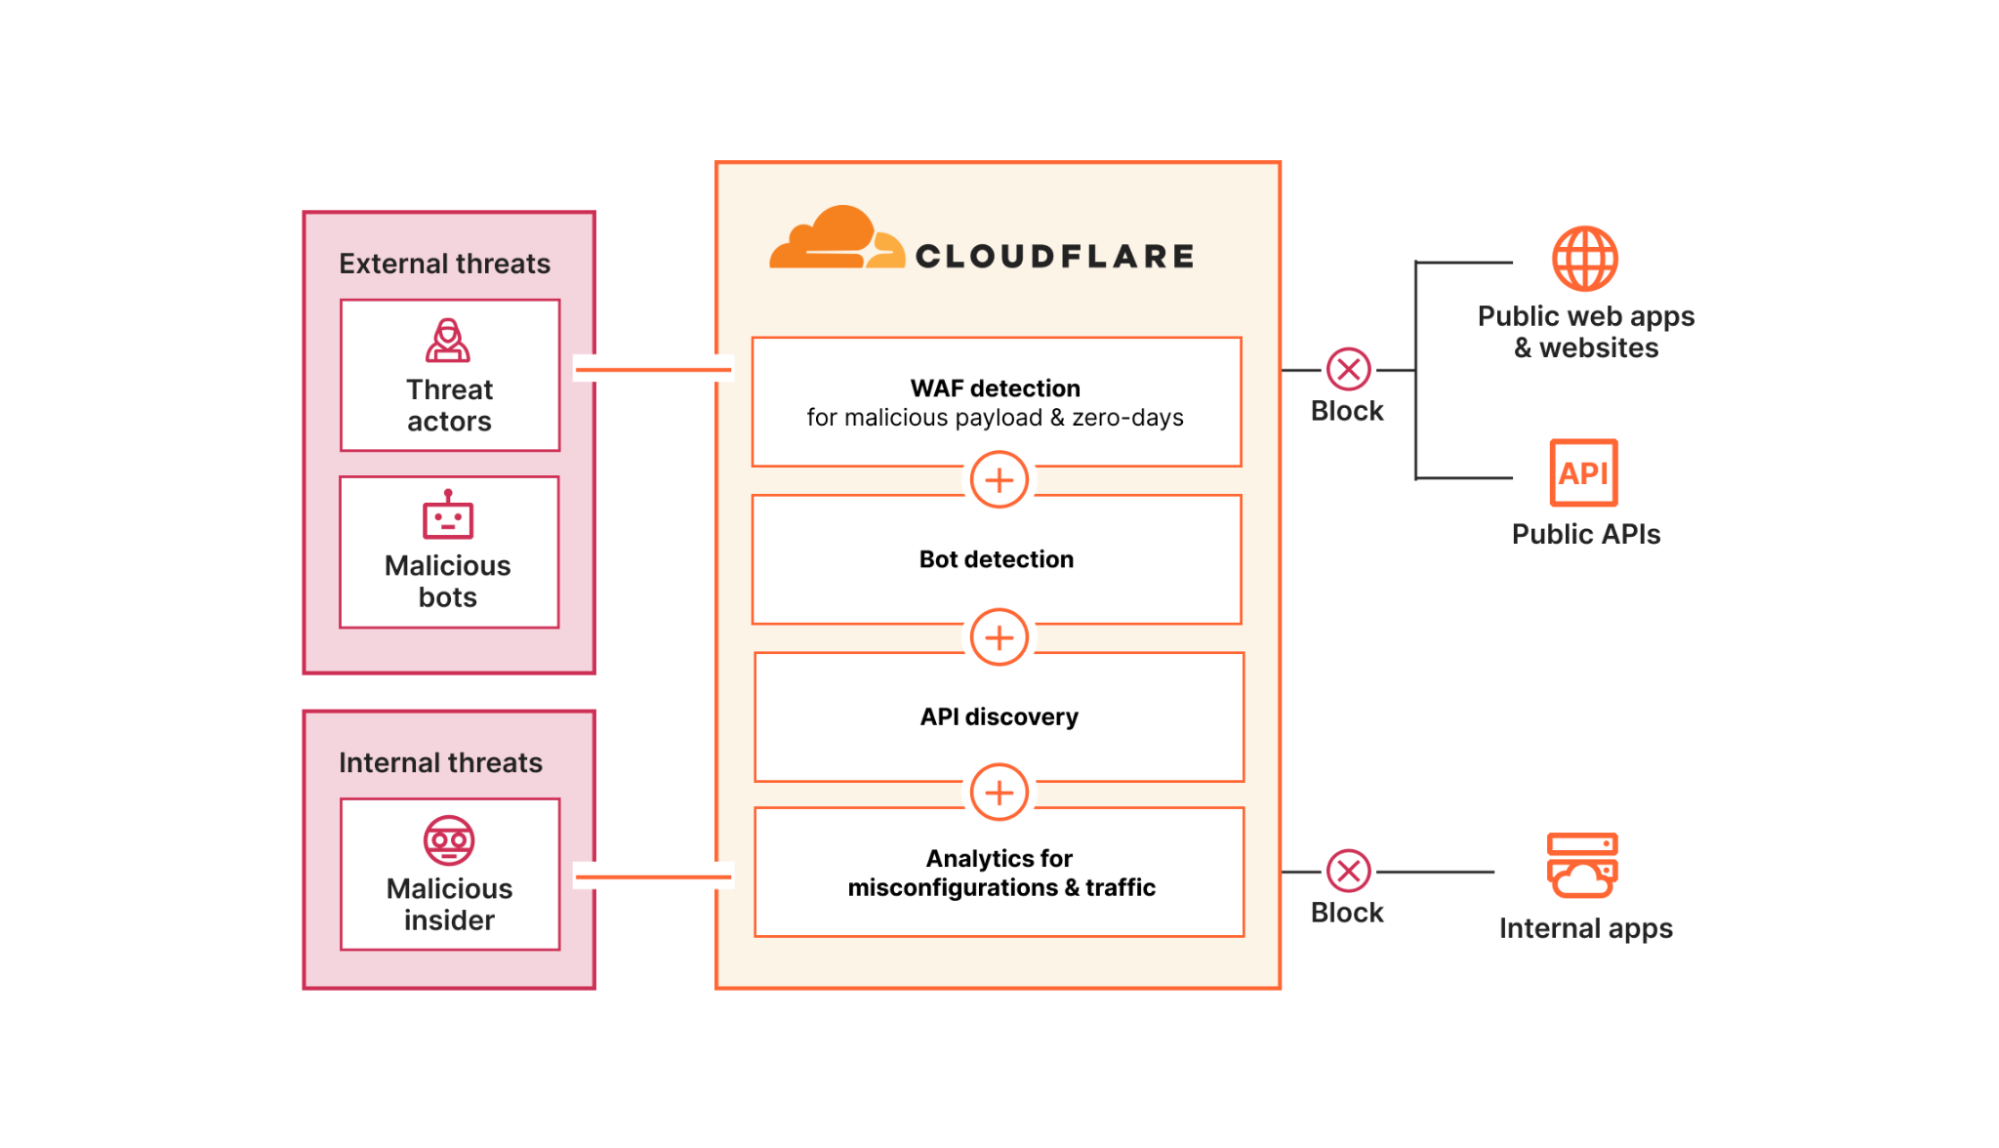
Evaluate risk across people and applications: Cloudflare evaluates risk posed by people via user entity and behavior analytics (UEBA) models and risks to apps, APIs, and sites via malicious payload, zero-day threat, and bot detection models.
Enforce automated risk controls at scale: Based on these dynamic first- and third-party risk scores, Cloudflare enforces consistent risk controls for people and apps across any location around the world.
Figure 1: Unified Risk Posture Diagram
As mentioned above, this suite converges capabilities from our SASE and WAAP security portfolios onto our global network. Customers can now take advantage of built-in risk management functionality packaged as part of these existing portfolios.
This launch builds on our progressive efforts to extend first-party visibility and controls and third-party integrations that make it easier for organizations to adapt to evolving risks. For example, as part of the 2024 Security Week, we announced the general availability of behavior-based user risk scoring and the beta availability of an AI-enabled assistant to help you analyze risks facing your applications. And in a recent integration in the Fall of 2023, we announced that our cloud email security customers can ingest and display our threat detections within the CrowdStrike Falcon® Next-Gen SIEM dashboard.
To further manage your risk posture, you will be able to take advantage of new Cloudflare capabilities and integrations, including:
A new integration to share Cloudflare Zero Trust and email log data with the CrowdStrike Falcon Next-Gen SIEM (available now)
A new integration to share Cloudflare’s user risk score with Okta to enforce access policies (coming by the end of Q2 2024)
New first-party UEBA models, including user risk scores based on device posture checks (coming by the end of Q2 2024)
Unifying the evaluation, exchange, and enforcement stages of risk management onto Cloudflare’s platform helps security leaders mitigate risk with less effort. As a cybersecurity vendor defending both public-facing and internal infrastructure, Cloudflare is uniquely positioned to protect wide swathes of your expanding attack surface. Bringing together dynamic first-party risk scoring, flexible integrations, and automated enforcement helps drive two primary business outcomes:
Reducing effort in SecOps with less manual policy building and greater agility in responding to incidents. This means fewer clicks to build policies, more automated workflows, and lower mean times to detect (MTTD) and mean times to respond (MTTR) to incidents.
Reducing cyber risk with visibility and controls that span people and apps. This means fewer critical incidents and more threats blocked automatically.
Customers like Indeed, the #1 job site in the world, are already seeing these impacts by partnering with Cloudflare:
“Cloudflare is helping us mitigate risk more effectively with less effort and simplifies how we deliver Zero Trust across my organization.” — Anthony Moisant, SVP, Chief Information Officer and Chief Security Officer at Indeed.
Problem: Too many risks across too much attack surface
Managing risk posture is an inherently broad challenge, covering internal dangers and external threats across attack vectors. Below is just a sampling of risk factors CISOs and their security teams track across three everyday dimensions including people, apps, and data:
People risks: Phishing, social engineering, malware, ransomware, remote access, insider threats, physical access compromise, third party / supply chain, mobile devices / BYOD
App risks: denial of service, zero-day exploits, SQL injection, cross-site scripting, remote code execution, credential stuffing, account takeover, shadow IT usage, API abuse
Data risks: data loss / exposure, data theft / breach, privacy violation, compliance violation, data tampering
Point solutions emerged to lock down some of these specific risks and attack vectors. But over time, organizations have accumulated many services with a limited ability to talk to one another and build a more holistic view of risk. The granular telemetry generated by each tool has led to information overload for security staff who are often stretched thin already. Security Information and Event Management (SIEM) and Extended Detection & Response (XDR) platforms play a critical role in aggregating risk data across environments and mitigating threats based on analysis, but these tools still demand time, resources, and expertise to operate effectively. All these challenges have gotten worse as attack surfaces have expanded rapidly, as businesses embrace hybrid work, build new digital apps, and more recently, experiment with AI.
How Cloudflare helps manage risk posture
To help restore control over this complexity, Cloudflare for Unified Risk Posture provides one platform to evaluate risk, exchange indicators, and enforce dynamic controls throughout IT environments and around the world, all while complementing the security tools your business already relies on.
Although the specific risks Cloudflare can mitigate are wide-ranging (including all those in the sample bullets above), the following three use cases represent the full range of our capabilities, which you can start taking advantage of today.
Use Case #1: Enforce Zero Trust with Cloudflare & CrowdStrike
This first use case spotlights the flexibility with which Cloudflare fits into your current security ecosystem to make it easier to adopt Zero Trust best practices.
Cloudflare integrates with and ingests security signals from best-in-class EPP and IDP partners to enforce identity and device posture checks for any access request to any destination. You can even onboard multiple providers at once to enforce different policies in different contexts. For example, by integrating with CrowdStrike Falcon®, joint customers can enforce policies based on the Falcon Zero Trust Assessment (ZTA) score, which delivers continuous real-time security posture assessments across all endpoints in an organization regardless of the location, network or user. Plus, customers can then push activity logs generated by Cloudflare, including all access requests, to whichever cloud storage or analytics providers they prefer.
Today, we are announcing an expanded partnership with CrowdStrike for a new integration that enables organizations to share logs with Falcon Next-Gen SIEM for deeper analysis and further investigation. Falcon Next-Gen SIEM unifies first- and third-party data, native threat intelligence, AI, and workflow automation to drive SOC transformation and enforce better threat protection. The integration of Cloudflare Zero Trust and email logs with Falcon Next-Gen SIEM allows joint customers to identify and investigate Zero Trust networking and email risks and analyze data with other log sources to uncover hidden threats.
“CrowdStrike Falcon Next-Gen SIEM delivers up to 150x faster search performance over legacy SIEMs and products positioned as SIEM alternatives. Our transformative telemetry, paired with Cloudflare’s robust Zero Trust capabilities provides an unprecedented partnership. Together, we are converging two of the most critical pieces of the risk management puzzle that organizations of every size must address in order to combat today’s growing threats.” — Daniel Bernard, Chief Business Officer at CrowdStrike
Below is a sample workflow of how Cloudflare and CrowdStrike work together to enforce Zero Trust policies and mitigate emerging risks. Together, Cloudflare and CrowdStrike complement each other by exchanging activity and risk data and enforcing risk-based policies and remediation steps.
Figure 2: Enforce Zero Trust with Cloudflare & CrowdStrike
Phase 1: Automated investigation
Phase 2: Zero Trust enforcement
Phase 3: Remediation
Cloudflare and CrowdStrike help an organization detect that a user is compromised.
In this example, Cloudflare has recently blocked web browsing to risky websites and phishing emails, serving as the first line of defense. Those logs are then sent to CrowdStrike Falcon Next-Gen SIEM, which alerts your organization’s analyst about suspicious activity.
At the same time, CrowdStrike Falcon Insight XDR automatically scans that user’s device and detects that it is infected. As a result, the Falcon ZTA score reflecting the device’s health is lowered.
This org has set up device posture checks via Cloudflare’s Zero Trust Network Access (ZTNA), only allowing access when the Falcon ZTA risk score is above a specific threshold they have defined.
Our ZTNA denies the user’s next request to access an application because the Falcon ZTA score falls below that threshold.
Because of this failed device posture check, Cloudflare increases the risk score for that user, which places them in a group with more restrictive controls.
In parallel, CrowdStrike’s Next-GenSIEM has continued to analyze the specific user’s activity and broader risks throughout the organization’s environment. Using machine learning models, CrowdStrike surfaces top risks and proposes solutions for each risk to your analyst.
The analyst can then review and select remediation tactics — for example, quarantining the user’s device — to further reduce risk throughout the organization.
Use Case #2: Protect apps, APIs, & websites
This next use case is focused on protecting apps, APIs, and websites from threat actors and bots. Many customers first adopt Cloudflare for this use case, but may not be aware of the risk evaluation algorithms underpinning their protection.
These risk models are trained largely on telemetry from Cloudflare’s global network, which is used as a reverse proxy by nearly 20% of all websites and sees about 3 trillion DNS queries per day. This unique real-time visibility powers threat intelligence and even enables us to detect and mitigate zero-days before others.
Unlike other vendors, Cloudflare’s network architecture enables risk evaluation models and security controls on public-facing and internal infrastructure to be shared across all of our services. This means that organizations can apply protections against app vulnerability exploits, DDoS, and bots in front of internal apps like self-hosted Jira and Confluence servers, protecting them from emerging and even zero-day threats.
Organizations can review the potential misconfigurations, data leakage risks, and vulnerabilities that impact the risk posture for their apps, APIs, and websites within Cloudflare Security Center. We are investing in this centralized view of risk posture management by integrating alerts and insights across our security portfolio. In fact, we recently announced updates focused on highlighting where gaps exist in how your organization has deployed Cloudflare services.
Finally, we are also making it easier for organizations to investigate security events directly and recently announced beta availability of Log Explorer. In this beta, security teams can view all of their HTTP traffic in one place with search, analytics dashboards, and filters built-in. These capabilities can help customers monitor more risk factors within the Cloudflare platform versus exporting to third party tools.
Use Case #3: Protect sensitive data with UEBA
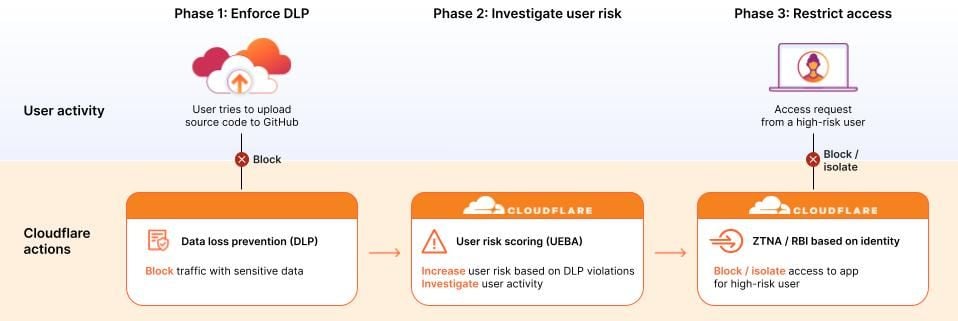
This third use case summarizes one common way many customers plan to leverage our user risk / UEBA scores to prevent leaks and mishandling of sensitive data:
Phase 1: In this example, the security team has already configured data loss prevention (DLP) policies to detect and block traffic with sensitive data. These policies prevent one user’s multiple, repeated attempts to upload source code to a public GitHub repository.
Phase 2: Because this user has now violated a high number of DLP policies within a short time frame, Cloudflare scores that suspicious user as high risk, regardless of whether those uploads had malicious or benign intent. The security team can now further investigate that specific user, including reviewing all of his recent log activity.
Phase 3: For that specific high-risk user or for a group of high-risk users, administrators can then set ZTNA or even browser isolation rules to block or isolate access to applications that contain other sensitive data.
Altogether, this workflow highlights how Cloudflare’s risk posture controls adapt to suspicious behavior from evaluation through to enforcement.
How to get started with unified risk posture management
The above use cases reflect how our customers are unifying risk management with Cloudflare. Through these customer conversations, a few themes emerged for why they feel confident in our vision to help them manage risk across their expanding attack surface:
The simplicity of our unified platform: We bring together SASE and WAAP risk scoring and controls for people and apps. Plus, with a single API for all Cloudflare services, organizations can automate and customize workflows with infrastructure-as-code tools like Terraform with ease.
The flexibility of our integrations:We exchange risk signals with the EPP, IDP, XDR, and SIEM providers you already use, so you can do more with your tools and data. Plus, with one-time integrations that work across all our services, you can extend controls across your IT environments with agility.
The scale of our global network: Every security service is available for customers to run in every location across our network spanning 320+ locations and 13K+ interconnects. In this way, single-pass inspection and risk policy enforcement is always fast, consistent, and resilient, delivered close to your users and apps.
To continue learning more about how Cloudflare can help you evaluate risk, exchange risk indicators, and enforce risk controls, explore more resources on our website.
In April 2020, we blogged about how to get COBOL running on Cloudflare Workers by compiling to WebAssembly. The ecosystem around WebAssembly has grown significantly since then, and it has become a solid foundation for all types of projects, be they client-side or server-side.
As WebAssembly support has grown, more and more languages are able to compile to WebAssembly for execution on servers and in browsers. As Cloudflare Workers uses the V8 engine and supports WebAssembly natively, we’re able to support languages that compile to WebAssembly on the platform.
Recently, work on LLVM has enabled Fortran to compile to WebAssembly. So, today, we’re writing about running Fortran code on Cloudflare Workers.
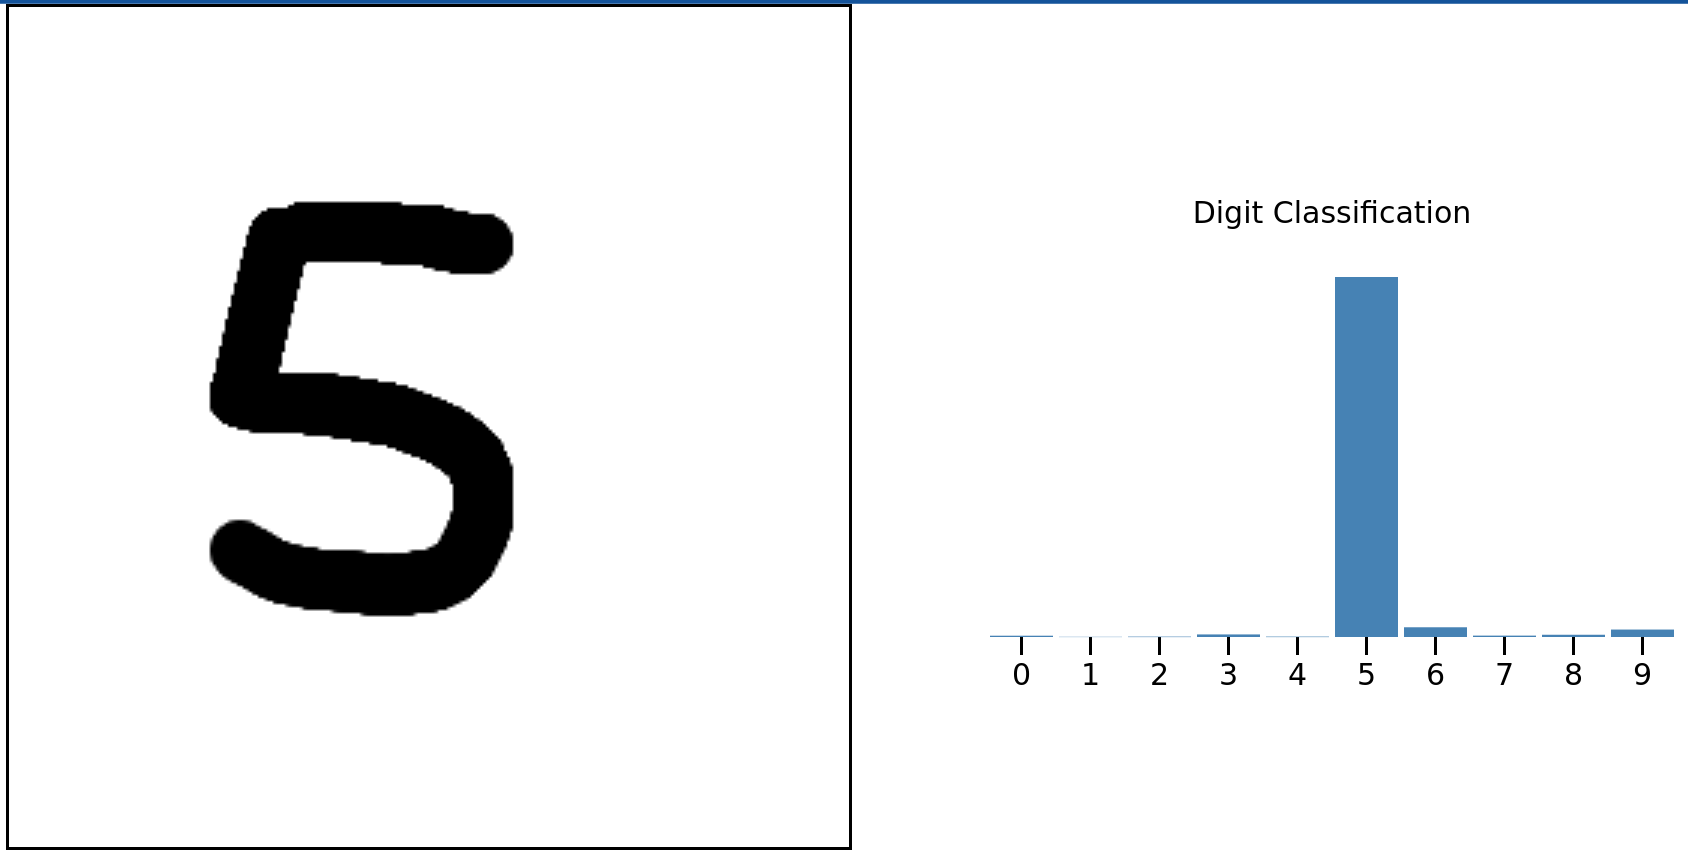
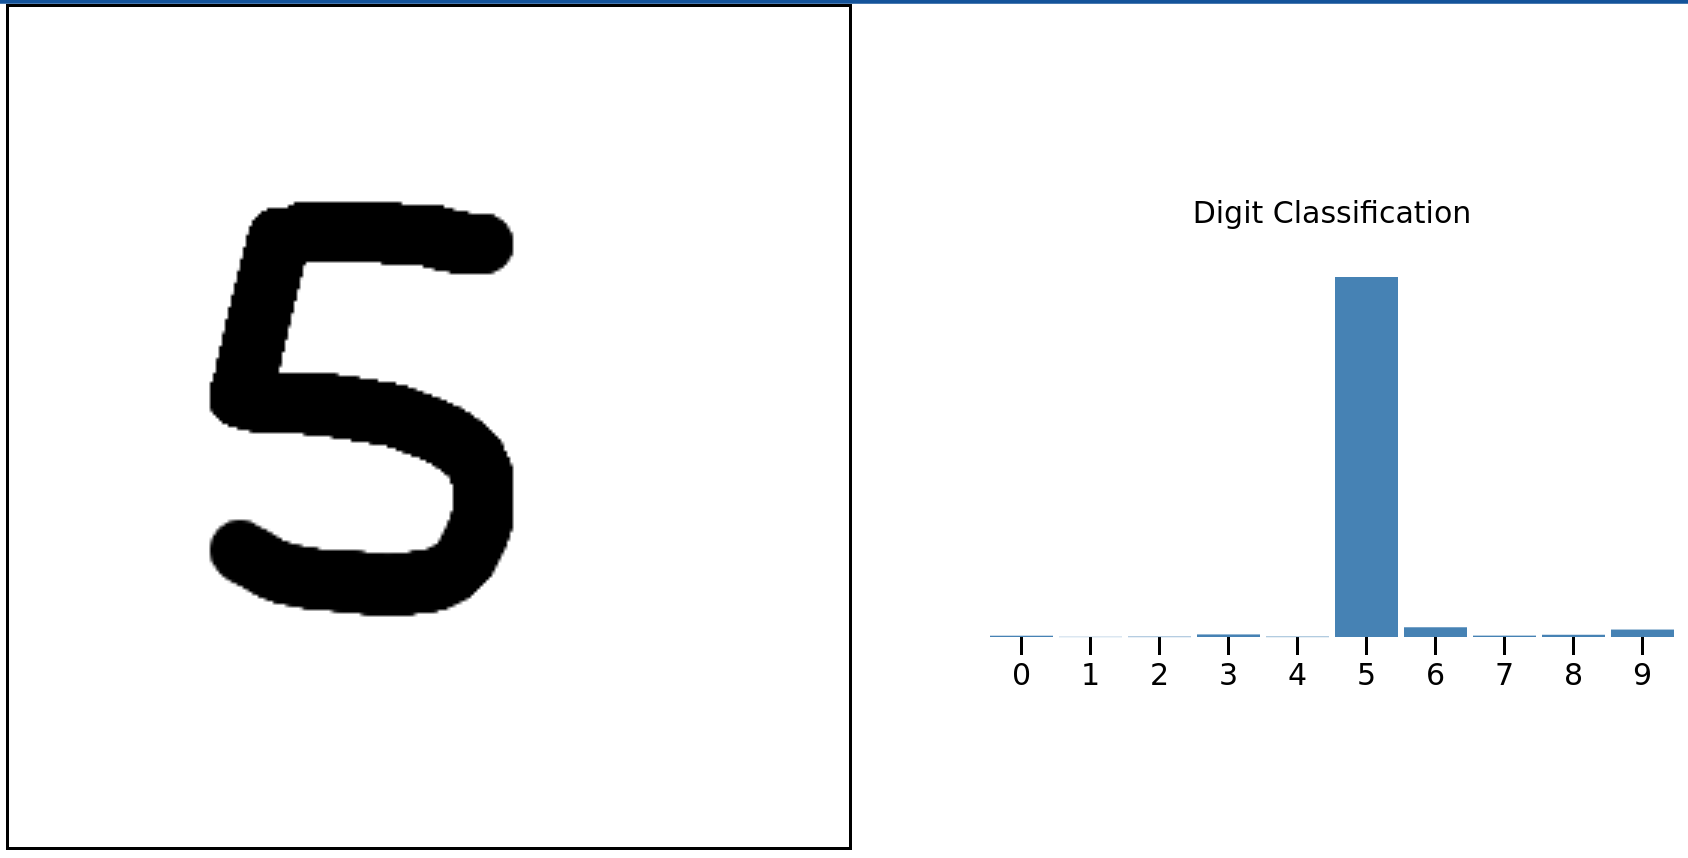
Before we dive into how to do this, here’s a little demonstration of number recognition in Fortran. Draw a number from 0 to 9 and Fortran code running somewhere on Cloudflare’s network will predict the number you drew.
This is taken from the wonderful Fortran on WebAssembly post but instead of running client-side, the Fortran code is running on Cloudflare Workers. Read on to find out how you can use Fortran on Cloudflare Workers and how that demonstration works.
Wait, Fortran? No one uses that!
Not so fast! Or rather, actually pretty darn fast if you’re doing a lot of numerical programming or have scientific data to work with. Fortran (originally FORmula TRANslator) is very well suited for scientific workloads because of its native functionality for things like arithmetic and handling large arrays and matrices.
If you look at the ranking of the fastest supercomputers in the world you’ll discover that the measurement of “fast” is based on these supercomputers running a piece of software called LINPACK that was originally written in Fortran. LINPACK is designed to help with problems solvable using linear algebra.
The LINPACK benchmarks use LINPACK to solve an n x n system of linear equations using matrix operations and, in doing so, determine how fast supercomputers are. The code is available in Fortran, C and Java.
A related Fortran package, BLAS, also does linear algebra and forms the basis of the number identifying code above. But other Fortran packages are still relevant. Back in 2017, NASA ran a competition to make FUN3D (used to perform calculations of airflow over simulated aircraft). FUN3D is written in Fortran.
So, although Fortran (or at the time FORTRAN) first came to life in 1957, it’s alive and well and being used widely for scientific applications (there’s even Fortran for CUDA). One particular application left Earth 20 years after Fortran was born: Voyager. The Voyager probes use a combination of assembly language and Fortran to keep chugging along.
But back in our solar system, and back on Region: Earth, you can now use Fortran on Cloudflare Workers. Here’s how.
How to get your Fortran code running on Cloudflare Workers
To make it easy to run your Fortran code on Cloudflare Workers, we created a tool called Fortiche (translates to smart in French). It uses Flang and Emscripten under the hood.
Flang is a frontend in LLVM and, if you read the Fortran on WebAssembly blog post, we currently have to patch LLVM to work around a few issues.
Emscripten is used to compile LLVM output and produce code that is compatible with Cloudflare Workers.
This is all packaged in the Fortiche Docker image. Let’s see a simple example.
add.f90:
SUBROUTINE add(a, b, res)
    INTEGER, INTENT(IN) :: a, b
    INTEGER, INTENT(OUT) :: res

    res = a + b
END
Here we defined a subroutine called add that takes a and b, sums them together and places the result in res.
docker run -v $PWD:/input -v $PWD/output:/output xtuc/fortiche --export-func=add add.f90
Passing --export-func=add to Fortiche makes the Fortran add subroutine available to JavaScript.
The output folder contains the compiled WebAssembly module and JavaScript from Emscripten, and a JavaScript endpoint generated by Fortiche:
$ ls -lh ./output
total 84K
-rw-r--r-- 1 root root 392 avril 22 12:00 index.mjs
-rw-r--r-- 1 root root 27K avril 22 12:00 out.mjs
-rwxr-xr-x 1 root root 49K avril 22 12:00 out.wasm
And finally the Cloudflare Worker:
// Import what Fortiche generated
import {load} from "../output/index.mjs"

export default {
    async fetch(request: Request): Promise<Response> {
        // Load the Fortran program
        const program = await load();

        // Allocate space in memory for the arguments and result
        const aPtr = program.malloc(4);
        const bPtr = program.malloc(4);
        const outPtr = program.malloc(4);

        // Set argument values
        program.HEAP32[aPtr / 4] = 123;
        program.HEAP32[bPtr / 4] = 321;

        // Run the Fortran add subroutine
        program.add(aPtr, bPtr, outPtr);

        // Read the result
        const res = program.HEAP32[outPtr / 4];

        // Free everything
        program.free(aPtr);
        program.free(bPtr);
        program.free(outPtr);

        return Response.json({ res });
    },
};
Interestingly, the values we pass to Fortran are all pointers, therefore we have to allocate space for each argument and result (the Fortran integer type is four bytes wide), and pass the pointers to the `add` subroutine.
Version
14.1 of the GCC compiler suite has been released. The list of changes
is long; it includes support for more C++26 features, preparation for
Fortran 2023 support, a new -fhardened flag to enable
security-hardening features, vectorizer improvements, and a number of static-analyzer improvements. See the release notes for
details.
The Go Blog has a detailed
article on the new, more secure random-number generator implemented for
the 1.22 release.
For example, when Go 1.20 deprecated math/rand’s Read, we heard
from developers who discovered (thanks to tooling pointing out use
of deprecated functionality) they had been using it in places where
crypto/rand’s Read was definitely needed, like generating key
material. Using Go 1.20, that mistake is a serious security problem
that merits a detailed investigation to understand the
damage. Where were the keys used? How were the keys exposed? Were
other random outputs exposed that might allow an attacker to derive
the keys? And so on. Using Go 1.22, that mistake is just a mistake.
Security updates have been issued by Debian (kernel), Gentoo (libjpeg-turbo, xar, and Xpdf), Red Hat (bind, dhcp and glibc), and SUSE (bouncycastle, curl, flatpak, less, and xen).
The collective thoughts of the interwebz
Manage Consent
To provide the best experiences, we use technologies like cookies to store and/or access device information. Consenting to these technologies will allow us to process data such as browsing behavior or unique IDs on this site. Not consenting or withdrawing consent, may adversely affect certain features and functions.
Functional
Always active
The technical storage or access is strictly necessary for the legitimate purpose of enabling the use of a specific service explicitly requested by the subscriber or user, or for the sole purpose of carrying out the transmission of a communication over an electronic communications network.
Preferences
The technical storage or access is necessary for the legitimate purpose of storing preferences that are not requested by the subscriber or user.
Statistics
The technical storage or access that is used exclusively for statistical purposes.The technical storage or access that is used exclusively for anonymous statistical purposes. Without a subpoena, voluntary compliance on the part of your Internet Service Provider, or additional records from a third party, information stored or retrieved for this purpose alone cannot usually be used to identify you.
Marketing
The technical storage or access is required to create user profiles to send advertising, or to track the user on a website or across several websites for similar marketing purposes.

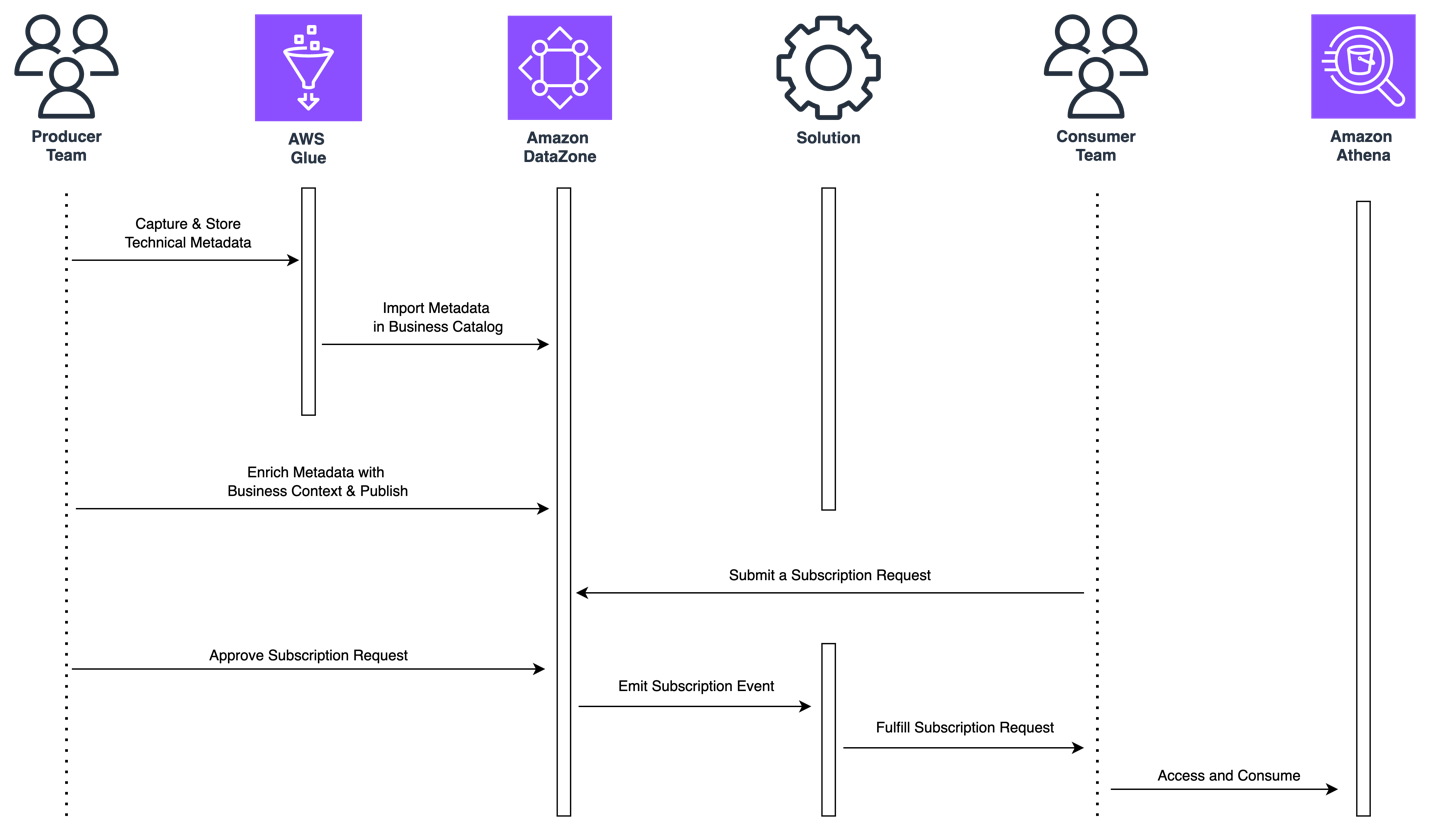


 Jose Romero is a Senior Solutions Architect for Startups at AWS, based in Austin, TX, US. He is passionate about helping customers architect modern platforms at scale for data, AI, and ML. As a former senior architect with AWS Professional Services, he enjoys building and sharing solutions for common complex problems so that customers can accelerate their cloud journey and adopt best practices. Connect with him on
  Leonardo Gómez is a Principal Big Data / ETL Solutions Architect at AWS, based in Florida, US. He has over a decade of experience in data management, helping customers around the globe address their business and technical needs. Connect with him on