Post Syndicated from The Atlantic original https://www.youtube.com/watch?v=er87hPH-aGI
Multi-region disaster recovery for Amazon API Gateway WebSocket APIs
Post Syndicated from Shubham Dhoka original https://aws.amazon.com/blogs/architecture/multi-region-disaster-recovery-for-amazon-api-gateway-websocket-apis/
WebSocket connections power some of the most interactive experiences on the web: financial trading applications streaming live market data, collaborative editing tools where multiple users work on the same document, gaming leaderboards updating in real time, and IoT dashboards monitoring thousands of devices. These applications depend on persistent, bidirectional communication between clients and servers.
Real-time applications using WebSocket connections face a unique challenge during Regional outages. WebSocket connections are persistent and bound to a specific AWS Region. A Regional failure severs every active connection. For applications that also maintain shared state across those connections, such as a live auction or collaborative editor, users lose both their connection and their session context. This post presents a design pattern for multi-Region disaster recovery with Amazon API Gateway WebSocket APIs that reconnects clients and restores state automatically during failover.
In this post, you learn how to build this pattern using Amazon Route 53 for DNS-based failover, Amazon DynamoDB Global Tables for cross-Region state replication, a canary health probe for traffic-independent failure detection, and client-side reconnection logic to recover from Regional failures while preserving application state.
Solution overview
This pattern creates an active-passive multi-Region architecture where the primary Region serves WebSocket connections and automatically fails over to a secondary Region during a disaster. The core idea is separating application state from the connection itself, so the client can restore its session after reconnection.
The architecture deploys identical WebSocket API stacks in two Regions, a primary and a secondary. Both Regions share application state through DynamoDB Global Tables, so the secondary Region is consistently ready to serve traffic. A single custom domain name fronts both Regions. Amazon Route 53 failover routing policy directs traffic to the primary Region under normal conditions. When the primary becomes unhealthy, Route 53 automatically shifts DNS resolution to the secondary Region. Clients reconnect to the same domain and resume operations without changing their configuration.
Figure 1 shows the architecture and the normal operation and failover flow.
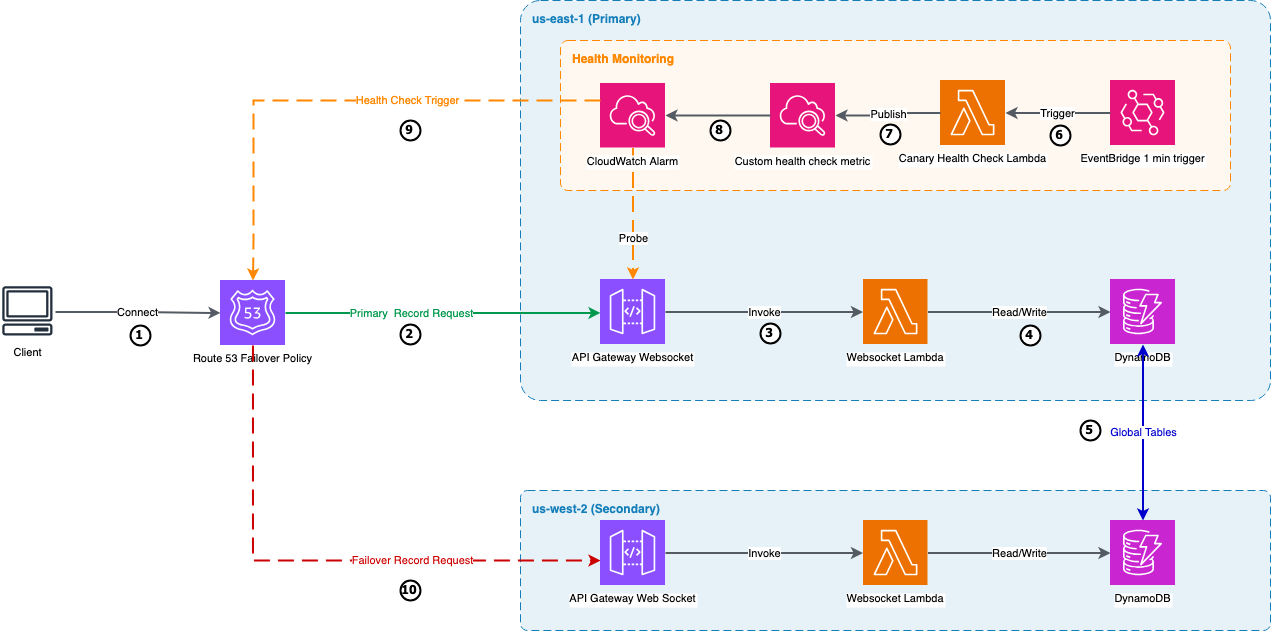
Figure 1: Multi-region WebSocket API failover architecture
- A user opens the application, which establishes a WebSocket connection to the application’s domain name.
- Amazon Route 53 resolves the domain using a failover routing policy. Under normal conditions, it returns the primary Region’s endpoint.
- The WebSocket connection reaches API Gateway in the primary Region, which invokes an AWS Lambda function for each connection event and message.
- Lambda reads and writes application state to DynamoDB. Connected clients receive updates through their open WebSocket connections.
- DynamoDB Global Tables replicates the application state to the secondary Region asynchronously, keeping it ready to serve traffic.
- Independently, an Amazon EventBridge rule triggers a canary Lambda function every minute.
- The canary opens a WebSocket connection to the API Gateway endpoint, sends a heartbeat, and publishes the result as a custom Amazon CloudWatch metric.
- A CloudWatch alarm evaluates the metric. If the canary reports consecutive failures or stops publishing, the alarm fires and the associated Route 53 health check marks the primary as unhealthy.
- Route 53 detects the unhealthy primary and begins resolving the domain to the secondary Region instead.
- Clients reconnect through the same domain, now reaching the secondary Region, and recover their application state from the local DynamoDB replica.
Prerequisites
To follow along with this post, you need:
- An AWS account with permissions to create Amazon API Gateway, AWS Lambda, Amazon DynamoDB, Amazon CloudWatch, and Route 53 resources.
- A domain name with a hosted zone in Amazon Route 53.
- AWS Certificate Manager (ACM) certificates for your domain in both the primary and secondary Regions.
- AWS Command Line Interface (AWS CLI) v2 installed and configured.
- Node.js 18.x or later (for the client application).
Deploy the solution
The complete source code and deployment instructions are available on the GitHub repo. The repository includes AWS CloudFormation templates for the WebSocket APIs, canary health probe, and a React client application with the reconnection logic described in this post.
The demo application
The sample application is a real-time auction where multiple users bid on an item simultaneously. Each bid updates a shared counter through WebSocket messages, and connected clients see the current bid in real time. The application displays which AWS Region is serving responses, making failover visible during testing. Although minimal, this pattern represents real-time workloads where multiple clients share mutable state over WebSocket connections: chat applications, collaborative editors, live dashboards, or multiplayer games.
Managing connection state across Regions
WebSocket connections are persistent, but the application state built on top of them is what matters during failover. As users interact with the application, the server builds up session data tied to their identity. When a failover occurs and the client reconnects to a different Region, that session data needs to be available for the experience to continue uninterrupted. This solution stores state in DynamoDB Global Tables, which replicates it to the secondary Region asynchronously, typically within a second. Because this replication is asynchronous, writes that occur immediately before a failure may not reach the secondary Region. For most applications, this window is small enough to be acceptable.
After failover, the client reconnects and restores its state. In this demo, the client sends a getState message after reconnection to retrieve the latest application state from the secondary Region’s DynamoDB replica.
Production applications add two considerations on reconnection. First, clients authenticate again: WebSocket APIs authenticate on the $connect route, so after failover the secondary Region re-authenticates the client through a Lambda authorizer. Deploy that authorizer in both Regions so reconnecting clients can authenticate against either one. Second, to restore state, identify the user from the validated token, such as the sub claim. Key the stored state by the user ID rather than the connection ID, which changes on every reconnect. Applications model session state in different ways, so adapt this to your design.
If your application uses a relational database, you need to set up similar cross-region state replication. For instance, Amazon Aurora Global Database provides sub-second replication latency across Regions. Note that Aurora requires promoting a read replica to primary during failover, which typically adds 1–2 minutes to the recovery process. This promotion can also be automated based on a CloudWatch alarm action.
Heartbeat
Both the client and the canary use application-level heartbeat to verify their WebSocket connections are alive. At a regular interval, they send a lightweight message and expect an acknowledgment. A missing or invalid response signals a broken connection. The client uses this to trigger reconnection. The canary uses it to drive the Route 53 health check. This mechanism is described in RFC 6455 and is the standard approach for WebSocket connection health monitoring.
The client code snippets in this post use react-use-websocket, a React library that provides built-in support for reconnection and heartbeat. You can implement the same patterns in other WebSocket client libraries or languages.
Detecting regional failures automatically
When the primary Region becomes unavailable, Route 53 needs to detect the failure and redirect traffic to the secondary. To do this, the solution creates a health check that actively monitors the WebSocket endpoint. A Lambda function called the canary, deployed in the primary Region, powers this health check. It probes the endpoint every minute by opening a WebSocket connection, sending a heartbeat message, and confirming it receives a valid response. The canary publishes the result as a custom CloudWatch metric (App/WebSocketHealth, dimension ApiId): 1 for healthy, 0 for unhealthy.
A CloudWatch alarm monitors this metric and treats both failures and missing data as unhealthy (TreatMissingData: breaching). After two consecutive unhealthy datapoints, the alarm fires and the associated Route 53 health check (configured with InsufficientDataHealthStatus: Unhealthy) marks the primary as down. Route 53 shifts DNS to the secondary Region.
Failback works through the same mechanism. When the primary recovers, the canary starts succeeding again, the alarm clears, and Route 53 shifts traffic back. For production workloads, consider asymmetric thresholds: use a low threshold (two datapoints) for fast failover and a higher threshold (over five) for slower failback, which helps prevent flapping if the primary is unstable during recovery. A DNS time-to-live (TTL) of 60–120 seconds provides a good balance between fast propagation and lookup efficiency.
Client reconnection strategy
When a connection drops, the client needs to reconnect without overwhelming the recovering service. The heartbeat described earlier handles detection in most cases. If no messages arrive within the timeout window, the library closes the connection. However, the backend can be degraded rather than fully unreachable. For example, API Gateway returns error responses when the Lambda function is throttled, so the connection remains technically open while the application is non-functional. To handle this, the client tracks consecutive failed heartbeats: responses that aren’t the expected pong message. After 2 consecutive failures, the client force-closes the connection and triggers reconnection. With a 30-second heartbeat interval, this detects a degraded backend within 60 seconds.
After the client identifies a broken connection, it begins reconnecting using exponential backoff with full jitter, a pattern described in the AWS Architecture Blog post Exponential Backoff And Jitter. The reconnection interval doubles with each attempt, and full jitter randomizes the actual delay within that window. This spreads reconnection attempts over time, helping prevent a thundering herd where many clients retry simultaneously and overwhelm the secondary Region the moment DNS shifts.
After each successful reconnection, the client requests the current application state from the server. Because the client reconnects to the same custom domain, Route 53 resolves it to whichever Region is currently healthy. The client doesn’t need to know which Region it’s connecting to. The server includes the Region in its response, and the application can update its UI or logging accordingly.
Failover in action
To see the full failover sequence, start the client application and connect to your WebSocket endpoint:
Open the application in your browser and note the serving Region displayed in the UI.
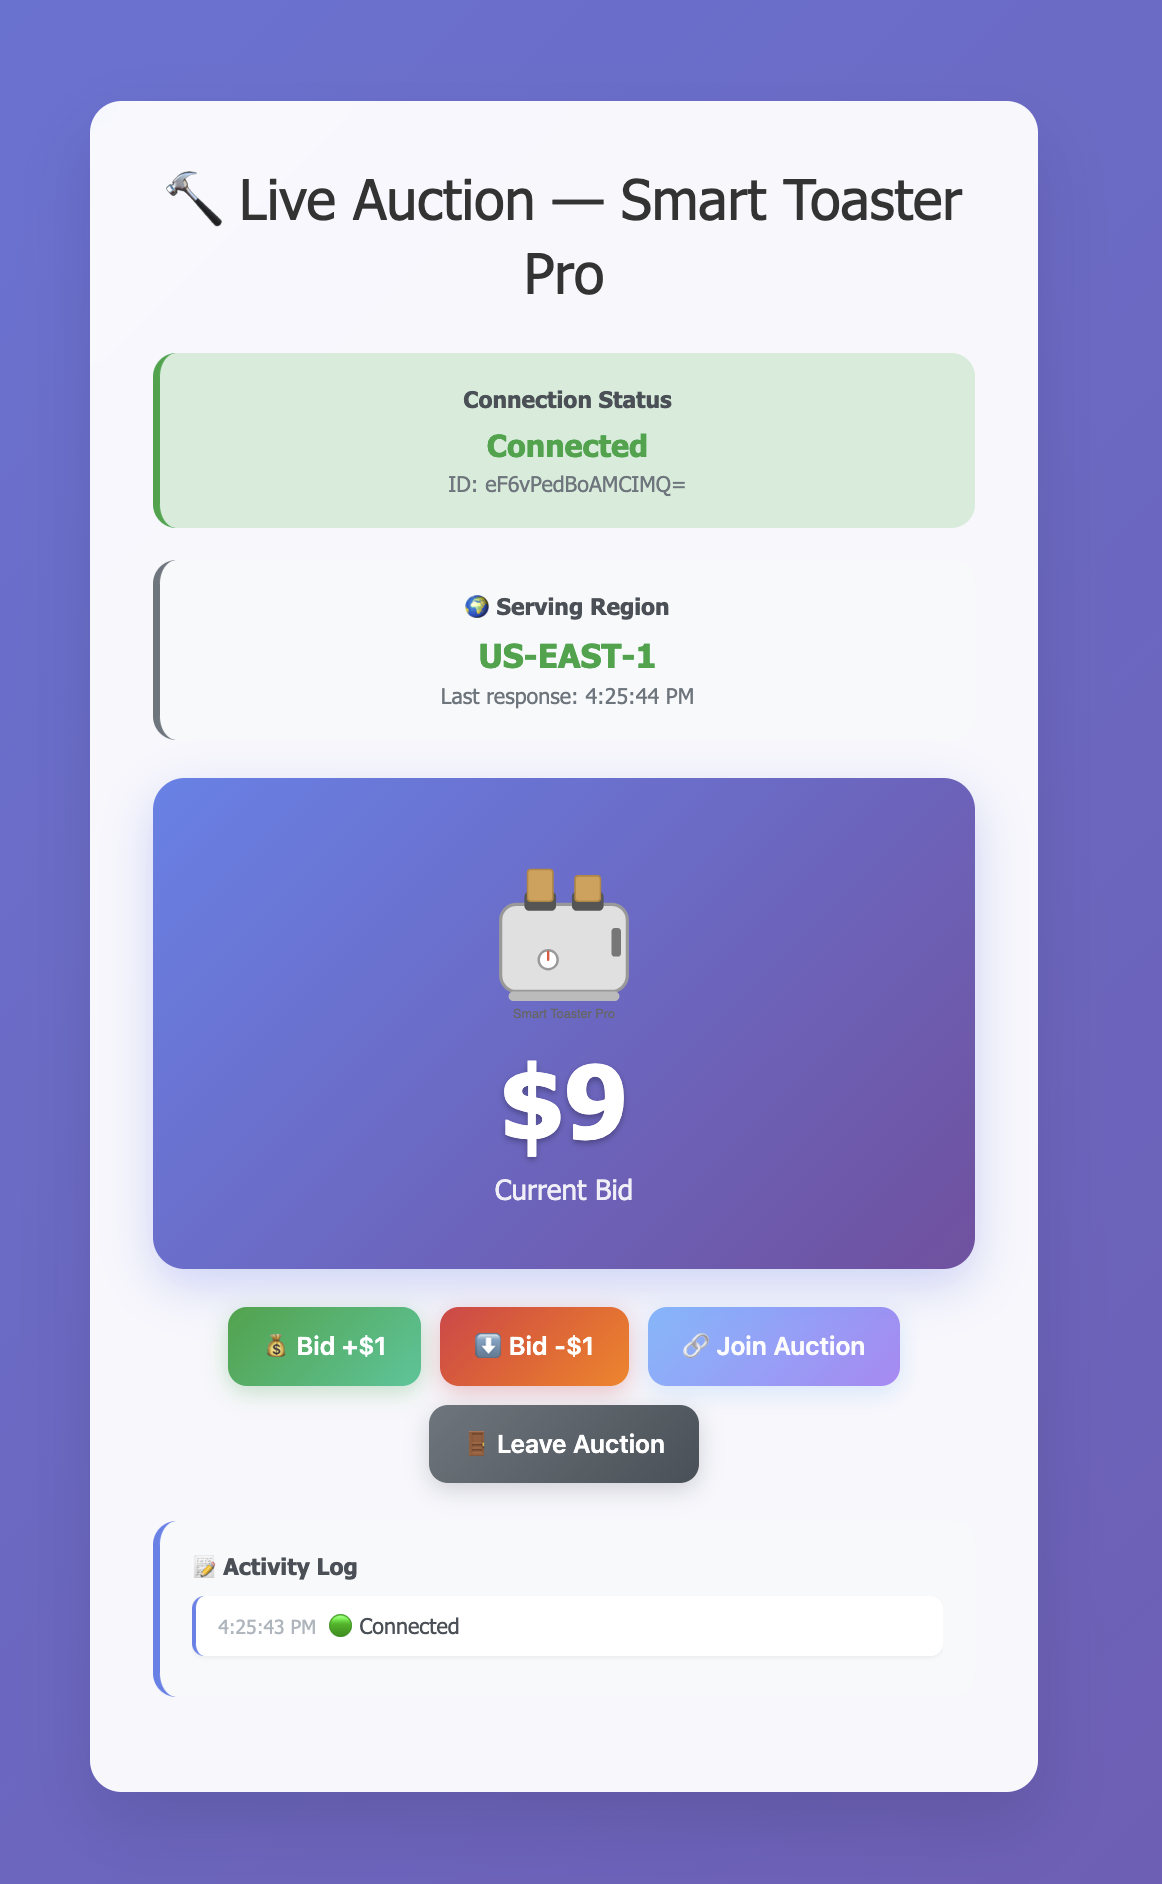
Figure 2: Client connected to the primary Region (us-east-1)
Next, simulate a failure by setting the primary Lambda function’s reserved concurrency to zero, which prevents it from processing requests:
Within about two minutes, the canary detects the failure after two consecutive failed probes at one-minute intervals. Route 53 then marks the primary as unhealthy, and DNS begins resolving to the secondary Region.
The client detects the dropped connection and begins retrying with exponential backoff and jitter.
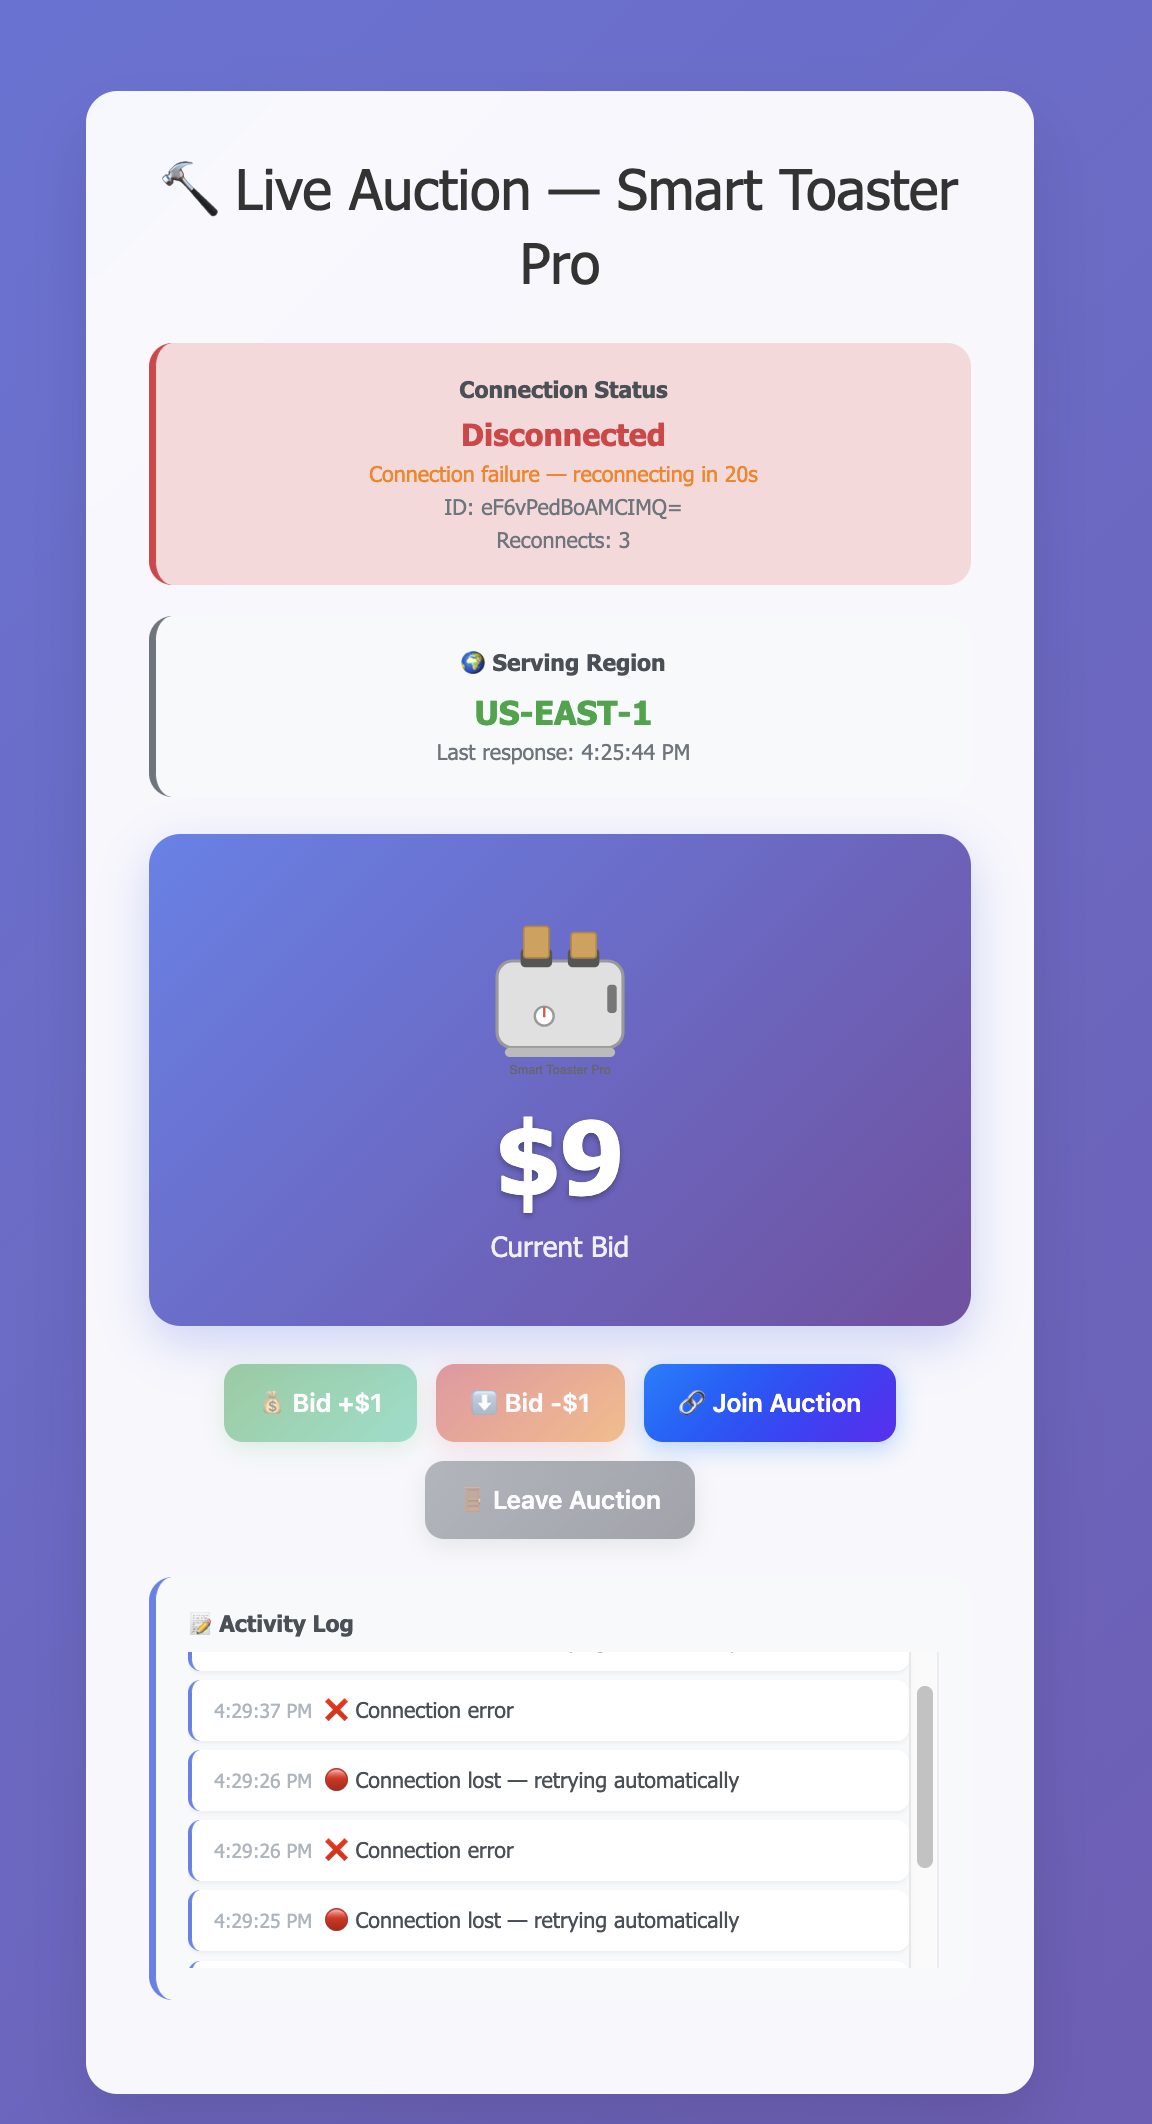
Figure 3: Client detecting failure and reconnecting with exponential backoff
When DNS propagation completes, the next reconnection attempt reaches the secondary Region. The client requests the current state, recovers it from DynamoDB Global Tables, and the UI updates to show the new serving Region.
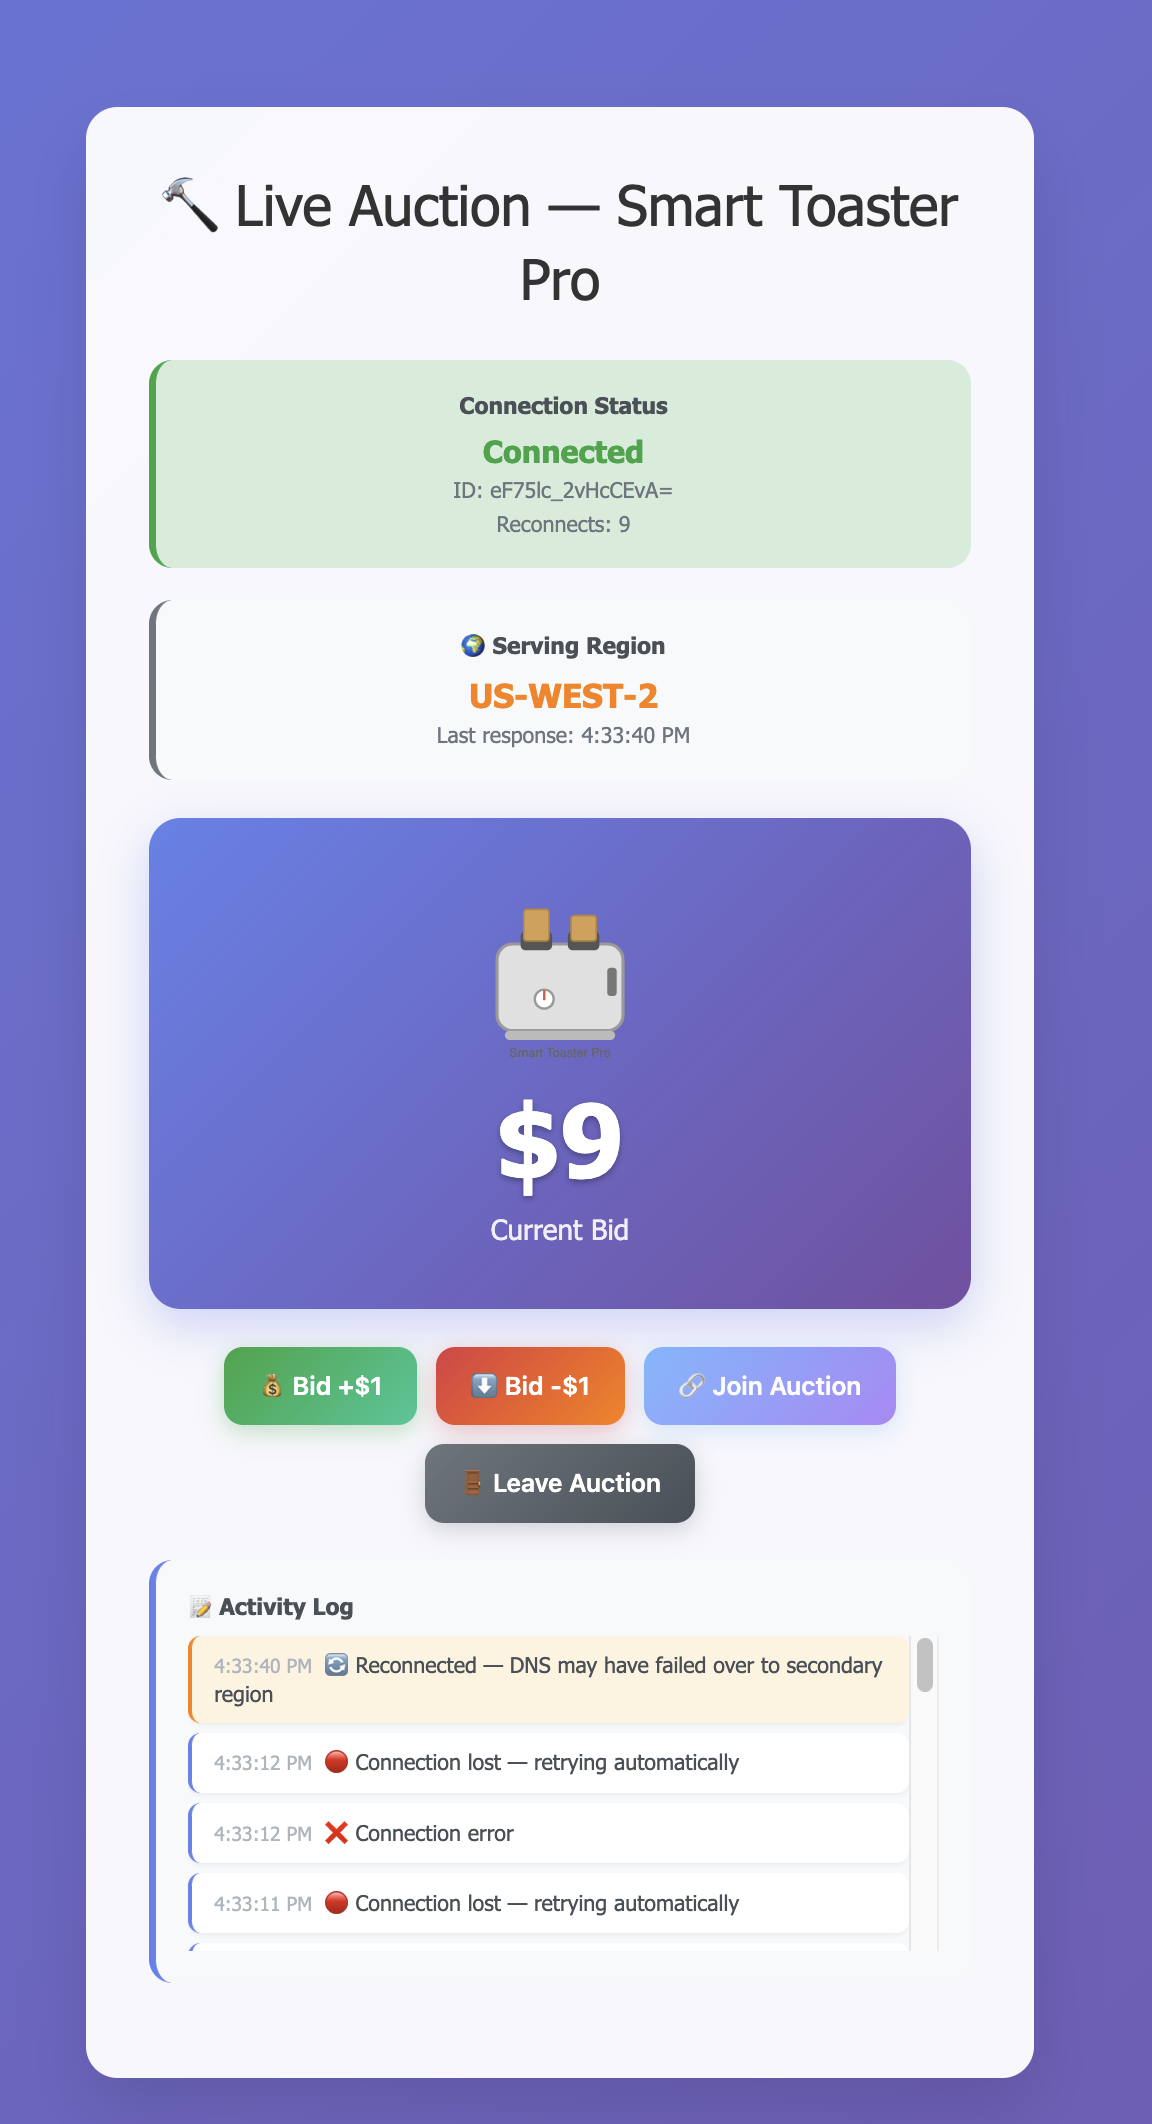
Figure 4: Client after failover to the secondary Region (us-west-2) with state preserved
When the primary Region recovers, the canary confirms that it’s healthy again. After the alarm clears, Route 53 shifts DNS back and clients reconnect to the primary through the same automatic process. No manual intervention is needed for failback.
Clean up
To avoid ongoing charges, delete the resources created during this walkthrough:
- Delete the CloudFormation stacks:
- Delete the Route 53 failover records and API Gateway custom domain names manually from the console.
Conclusion
In this post, you learned how to build a multi-region disaster recovery pattern for API Gateway WebSocket APIs. By separating application state from the connection itself, you can restore sessions automatically after a regional failover. This pattern applies to real-time applications where WebSocket continuity matters. Adapt the health check thresholds, reconnection timing, and state recovery approach to fit your workload.
To learn more about the services used in this solution, refer to the following resources:
- Amazon API Gateway WebSocket APIs
- Amazon DynamoDB Global Tables
- Configure custom health checks for DNS failover
- Exponential Backoff And Jitter
About the authors
How UTS established a modern curriculum data services foundation on AWS
Post Syndicated from Oleg Polianski original https://aws.amazon.com/blogs/architecture/how-uts-established-a-modern-curriculum-data-services-foundation-on-aws/
Students and staff experience the University of Technology Sydney (UTS) as a single institution, not as the collection of curriculum and student systems behind it. They expect the information underpinning teaching, learning, course design and institutional decision-making to be accurate, timely and coherent, irrespective of its source.
Behind that experience, UTS had reached a natural inflection point in its integration landscape. Critical teaching and learning capabilities relied upon established vendor platforms with disparate data models, interfaces, stability profiles and scaling characteristics. Although those platforms continued to perform essential operational functions, integrating and operating the surrounding estate had become progressively more intricate and costly.
UTS’s purpose remained constant: excellence in teaching, learning and the student experience. Technology exists to advance that purpose, not to supplant it. UTS Information Technology Unit (ITU) therefore sought to remove impediments between authoritative data and the people, processes and digital services that depend upon it.
UTS made that transition practical with AWS. With managed, elastic and serverless capabilities, UTS reduced undifferentiated operational effort and improved fault tolerance. This established a sustainable model for governed data services. Curriculum became the first bounded business domain in which UTS applied that model.
The challenge
UTS ITU required an architecture that could:
- Make authoritative curriculum information available through reusable services without displacing the Curriculum Management System, a third-party software as a service (SaaS) application, as the system of record.
- Replace tightly coupled, consumer-specific interfaces with governed contracts that insulate consumers from source schemas and implementation detail.
- Accommodate routine change and transient high-volume activity, including complete domain reloads, without permanently provisioned capacity.
- Support graph traversal across deeply nested and inverse curriculum relationships, exact and full-text retrieval, and semantic discovery from the same authoritative source.
- Operate reliably and economically within finite engineering capacity whilst establishing a repeatable pattern for subsequent data domains.
Domain boundaries were non-negotiable. Curriculum describes what the university teaches and remains the responsibility of the Curriculum Management System. Preserving that bounded context prevents ownership, validation and governance from migrating into non-authoritative services.
A domain-oriented approach
UTS ITU organised the capability according to domain-driven design. Rather than aligning data services with the applications that produce or consume data, they aligned them with:
- the business domains defined in CAUDIT’s Higher Education Reference Model (HERM).
- the information for which those domains are accountable.
Each data product has explicit ownership, consumers, quality expectations, interface contracts and lifecycle management. Institutional data is therefore treated as a governed asset designed for reuse, not an incidental application by-product.
Declarative architecture as code provides the executable realisation of the design and a reproducible source of truth. Configuration is separated from implementation where practicable, delivery is automated and managed AWS services are preferred to bespoke infrastructure software. The discipline is “just enough code”: engineering effort focuses on building differentiated domain logic (the business rules and data services unique to higher education) rather than undifferentiated infrastructure.
Stateless execution, asynchronous communication, purpose-built persistence and independently recoverable components avoid a tightly coupled failure domain. Consumption-based services align expenditure with workload demand instead of maintaining an estate permanently sized for intermittent peaks.
Solution overview
The architecture comprises five layers: edge, ingestion, persistence, application and business logic, and interface. Each layer has discrete responsibilities, as shown in Figure 1.
Identity, encryption, network controls, observability and operational governance apply across the stack. Curriculum data services capture complete changes from the Curriculum Management System as events, preserve them in a durable event log, materialise purpose-built representations and expose governed synchronous and asynchronous services.
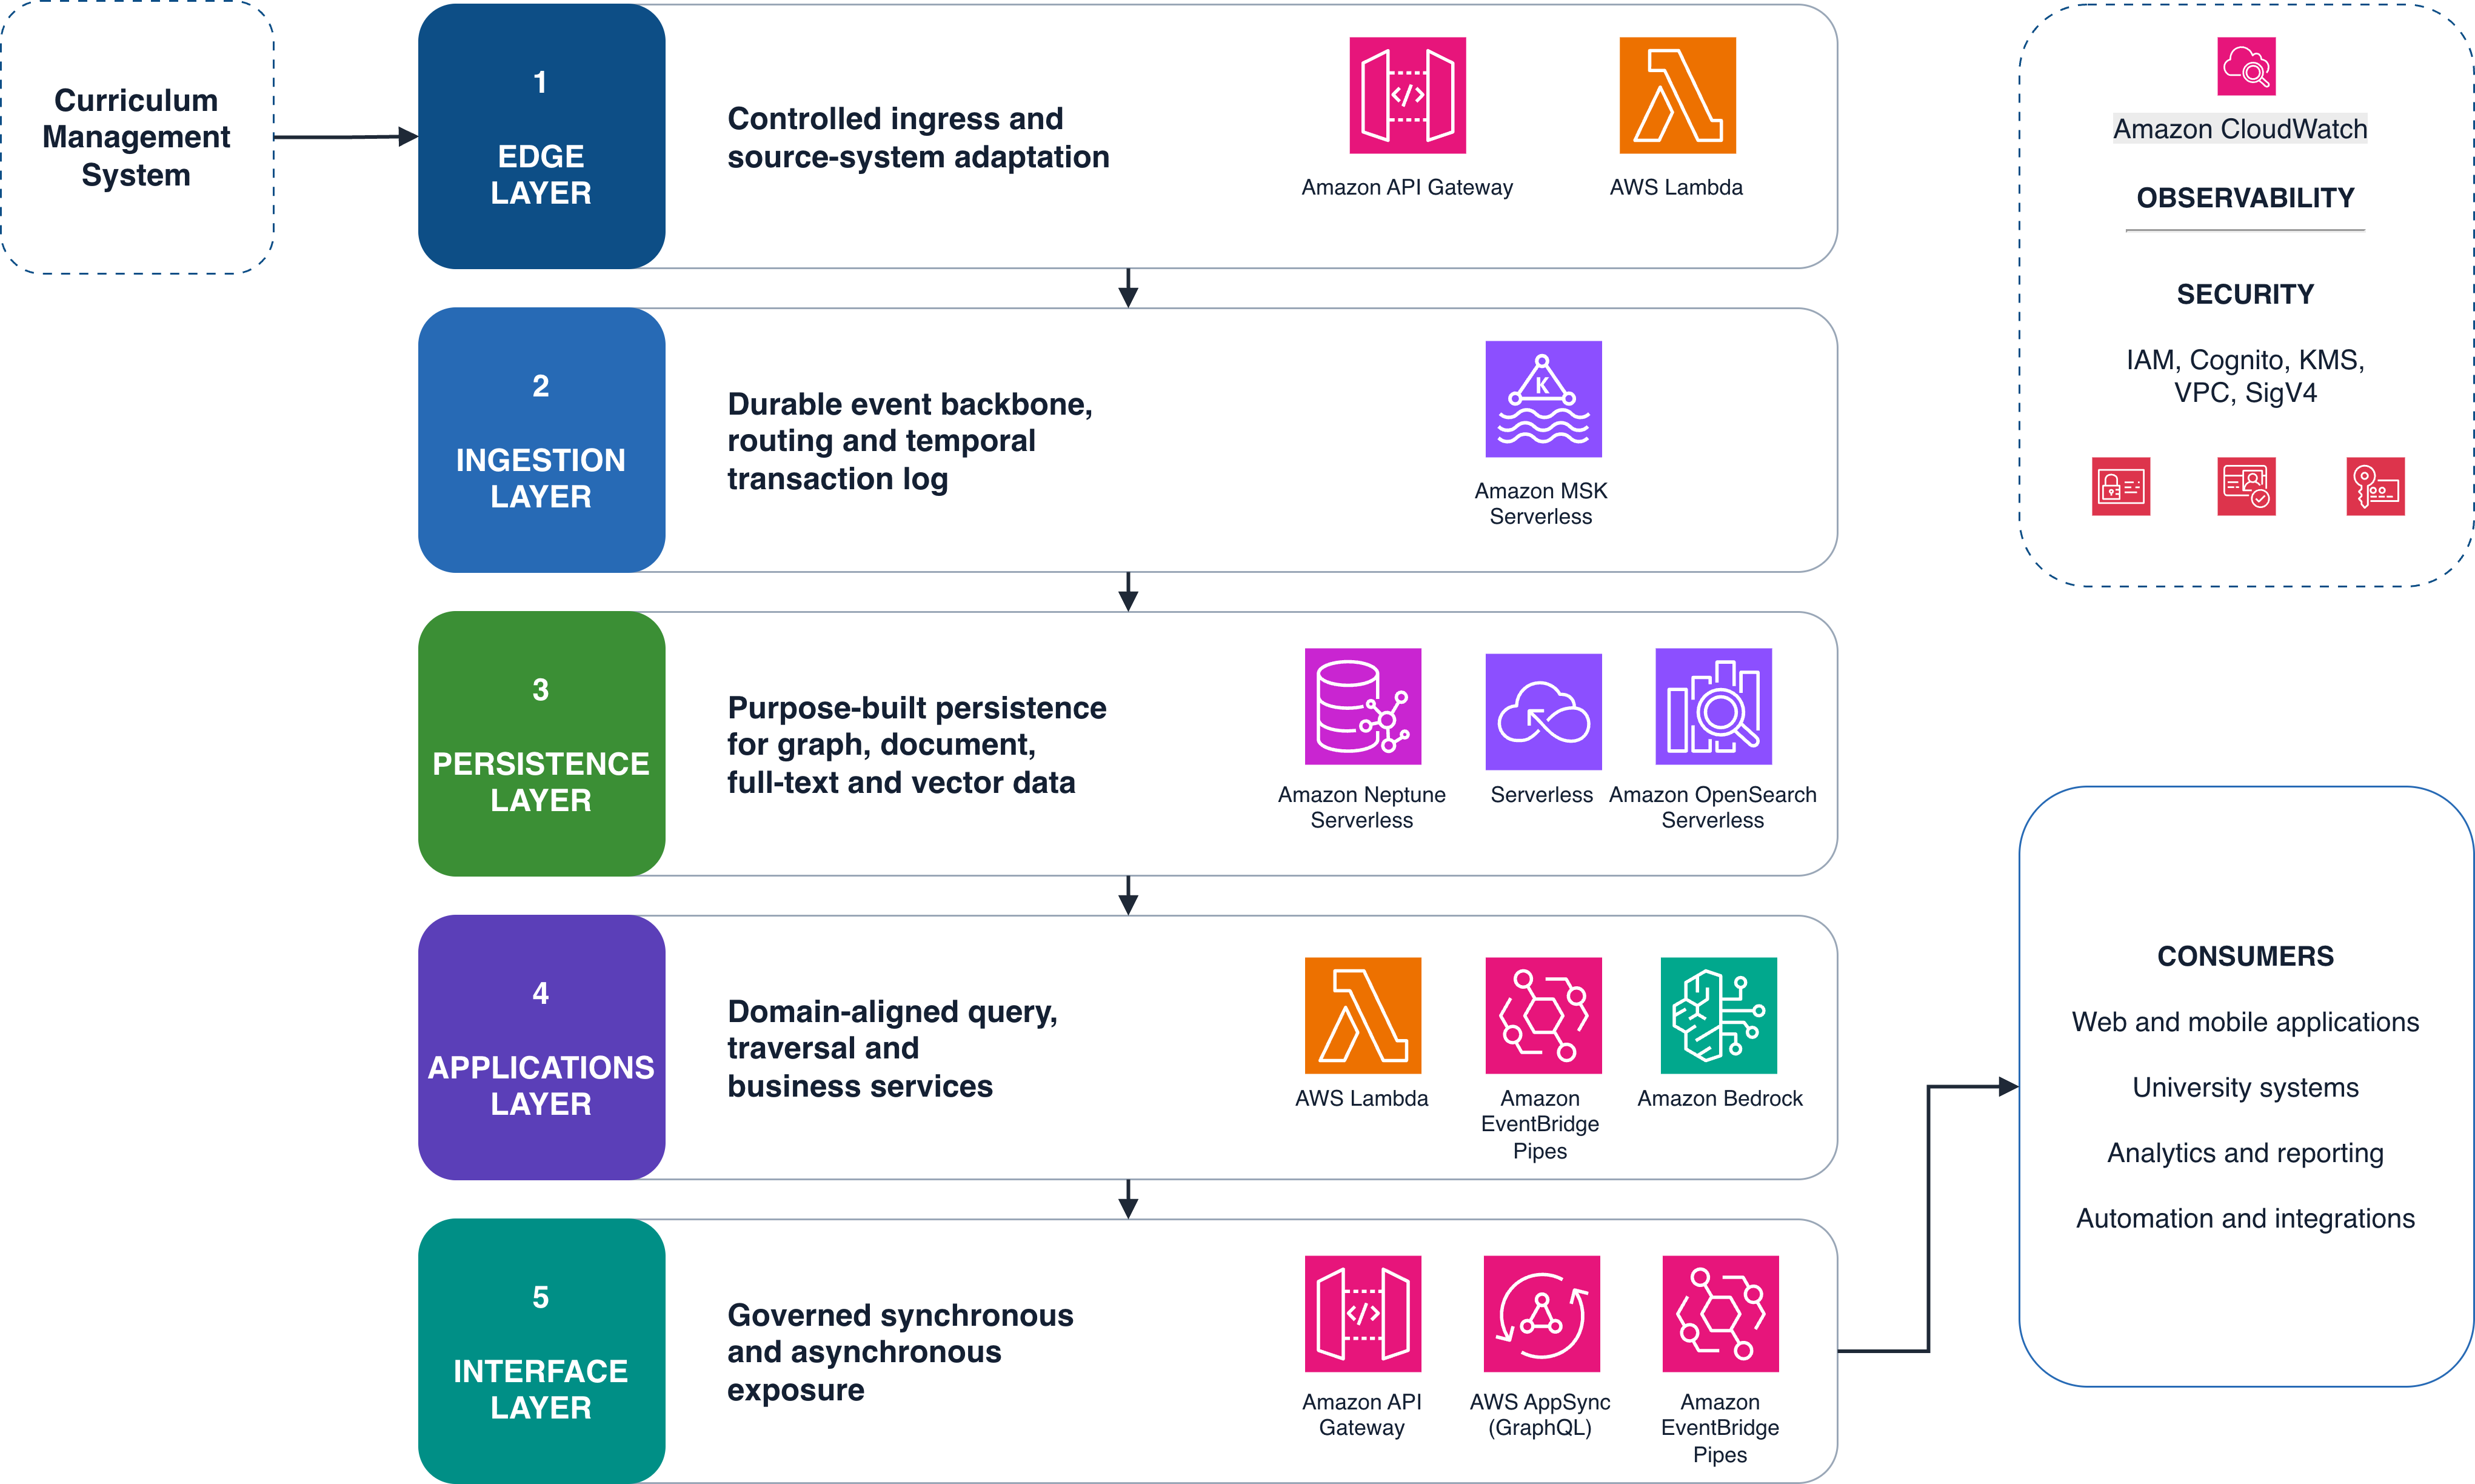
Figure 1: UTS curriculum data services layered architecture
The next five sections examine each layer of the realised architecture in turn.
Edge layer
The edge layer is the controlled ingress boundary between the SaaS Curriculum Management System and the curriculum domain. Its remit is deliberately narrow: receive a complete curriculum change, establish the internal event contract and submit it to the ingestion layer with minimal processing.
The source system sends change events to an Amazon API Gateway HTTP API, which invokes an AWS Lambda function acting as a technical adapter because no suitable managed connector satisfies the source system’s proprietary API contract and payload format (for example, vendor-specific REST endpoints, authentication schemes, and data structures). The adapter encapsulates the complete vendor event in a CloudEvent envelope, appends UTS operational metadata and publishes it to the appropriate Amazon Managed Streaming for Apache Kafka (Amazon MSK) Serverless topic.
The edge neither reinterprets curriculum nor performs validation or consumer-specific transformation. Validation remains within the system of record. This preserves source fidelity, prevents downstream concerns from contaminating the ingress boundary and allows the stateless edge to scale automatically during complete domain reloads.
Ingestion layer
Amazon MSK Serverless forms the durable, append-only event backbone. Curriculum changes are segregated into domain-aligned topics by academic item type, retaining the complete source event whilst allowing independent consumers to progress, retry and recover without obstructing one another.
MSK Serverless scales on demand. Routine changes consume little capacity. A domain reload fans out across the event backbone and parallel processors, then contracts after completion. Model or schema changes can be accommodated through idempotent reprocessing or a complete reload, without introducing a second curriculum authority.
Persistence layer
The persistence layer uses purpose-built data services selected according to the access patterns and business questions each representation must support. Amazon Neptune Serverless stores curriculum structures and inverse relationships as a property graph, whilst Amazon OpenSearch Service stores complete source documents and indices for exact, full-text and vector retrieval.
In Neptune, programmes of learning, areas of learning and units of learning are connected academic items. Consumers can traverse from a programme to its constituent structures or begin with a unit and identify every programme and area through which it is taught. These inverse enquiries are native graph traversals rather than application-specific joins repeatedly reconstructed by consumers.
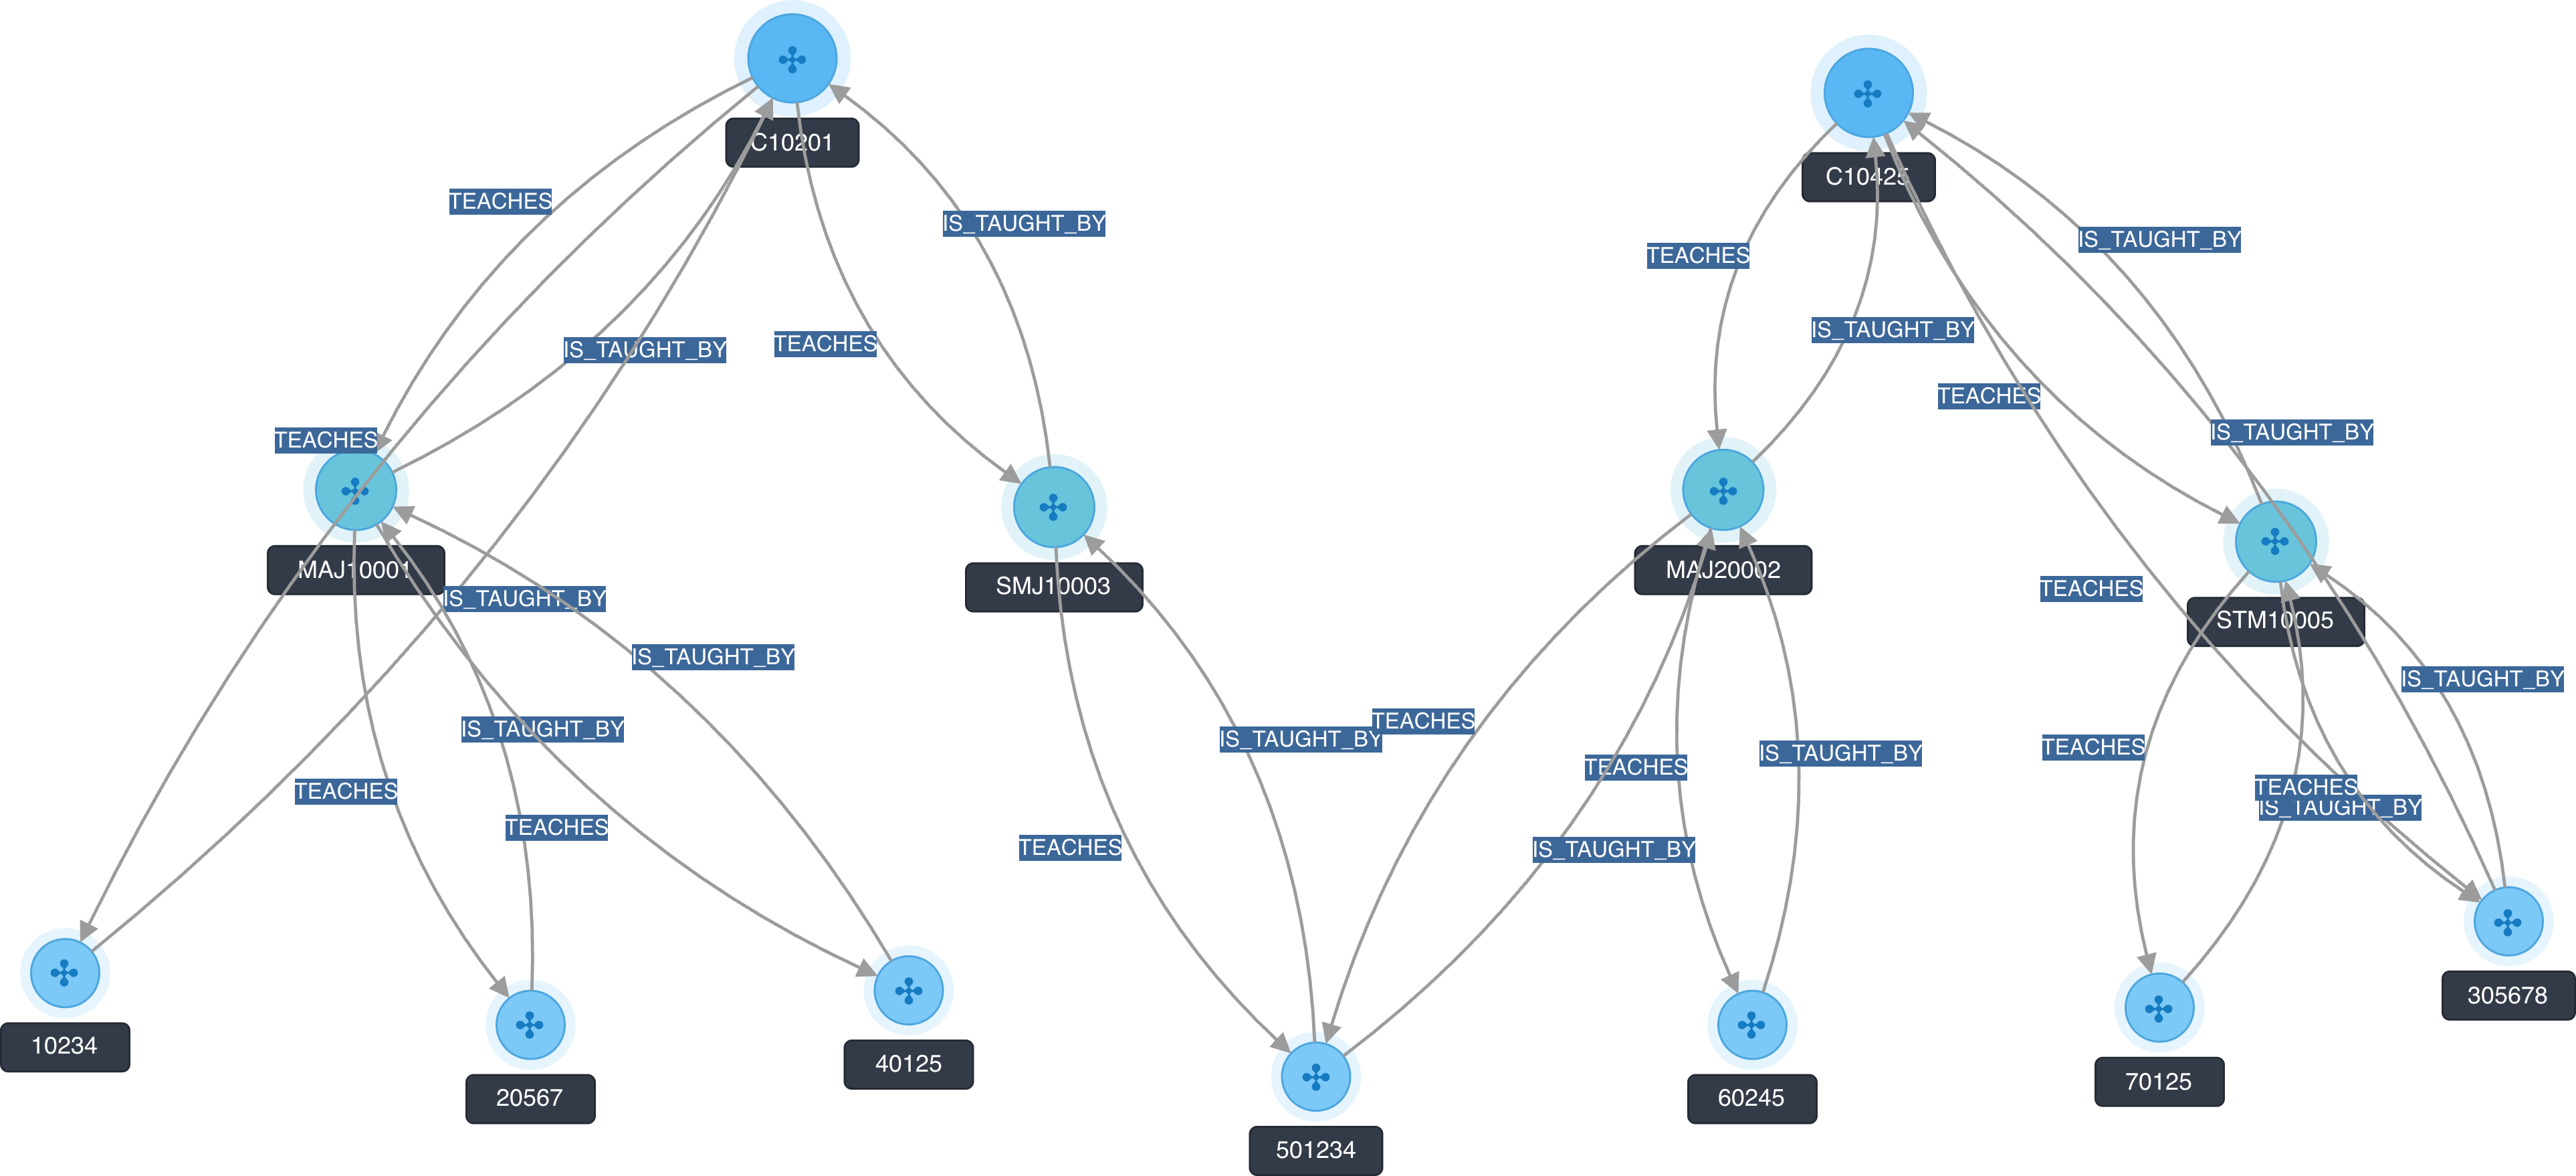
Figure 2: Curriculum structures relationships in Amazon Neptune
OpenSearch provides exact lookup, filtering and document retrieval alongside k-nearest-neighbour vector search. Selected data processors implemented as AWS Lambda functions invoke an embedding model through Amazon Bedrock and append vector representations of relevant curriculum text before persistence. Curriculum can consequently be discovered by semantic proximity rather than lexical coincidence. UTS also validated multilingual retrieval against English-language curriculum content.
Neptune and OpenSearch are independently and eventually consistent. Failure of one materialisation doesn’t block another, and neither store is exposed directly to consumers. Both are disposable projections rather than competing systems of record and can be reconstructed from the Curriculum Management System through a complete reload. Data is encrypted with a dedicated domain AWS Key Management Service (AWS KMS) key whose use is restricted to authorised domain services.
Applications layer
The applications layer converts those materialisations into reusable domain capabilities. Dozens of narrowly scoped Lambda-backed services query Neptune or OpenSearch, whilst persistence remains private and is exposed solely through governed contracts.
Amazon EventBridge Pipes acts as a set of transport adapters between MSK Serverless and the Lambda functions acting as processors and services consuming the event stream. Pipes provide routing and delivery, not curriculum validation, enrichment or business transformation, keeping processing responsibilities explicit, independently deployable and observable.
Stateless Lambda function execution allows services to scale with demand and recover independently through retries and re-invocation. Signature Version 4 (SigV4) authentication and fine-grained AWS Identity and Access Management (IAM) roles provide least-privilege access to Amazon Neptune and Amazon OpenSearch Service without distributing or managing database credentials. The services provide authoritative retrieval, graph traversal and semantic discovery without transferring responsibility for curriculum validity into the data domain.
Interface layer
The interface layer provides pull-based access through REST and GraphQL and push-based delivery of domain events, whilst keeping persistence and implementation private. Amazon API Gateway supplies the REST boundary. AWS AppSync provides GraphQL access to frequently consumed capabilities with attribute-based access control at schema level. Both interfaces invoke the same governed service contracts.
Approved consumers might also receive curriculum events in the internal CloudEvent envelope. Amazon EventBridge Pipes manages last-mile delivery without bespoke routing middleware, and consumers determine which academic item events are relevant rather than UTS maintaining a filtered stream for each consumer.
Amazon Cognito authenticates approved external consumers through OAuth 2.0 and OpenID Connect, whilst AWS native workloads use IAM. AWS Key Management Service, AWS Secrets Manager, AWS WAF, and AWS Certificate Manager provide encryption, secrets management, perimeter protection and certificate lifecycle management. Amazon Route 53 supplies naming for a single shared vanity domain, and Amazon CloudWatch and Amazon Simple Notification Service (Amazon SNS) provide observability, telemetry and targeted alerting across the architecture.
Full solution architecture
The following diagram shows the complete solution architecture, including the identity, encryption, network, observability and governance controls that apply across all five layers.
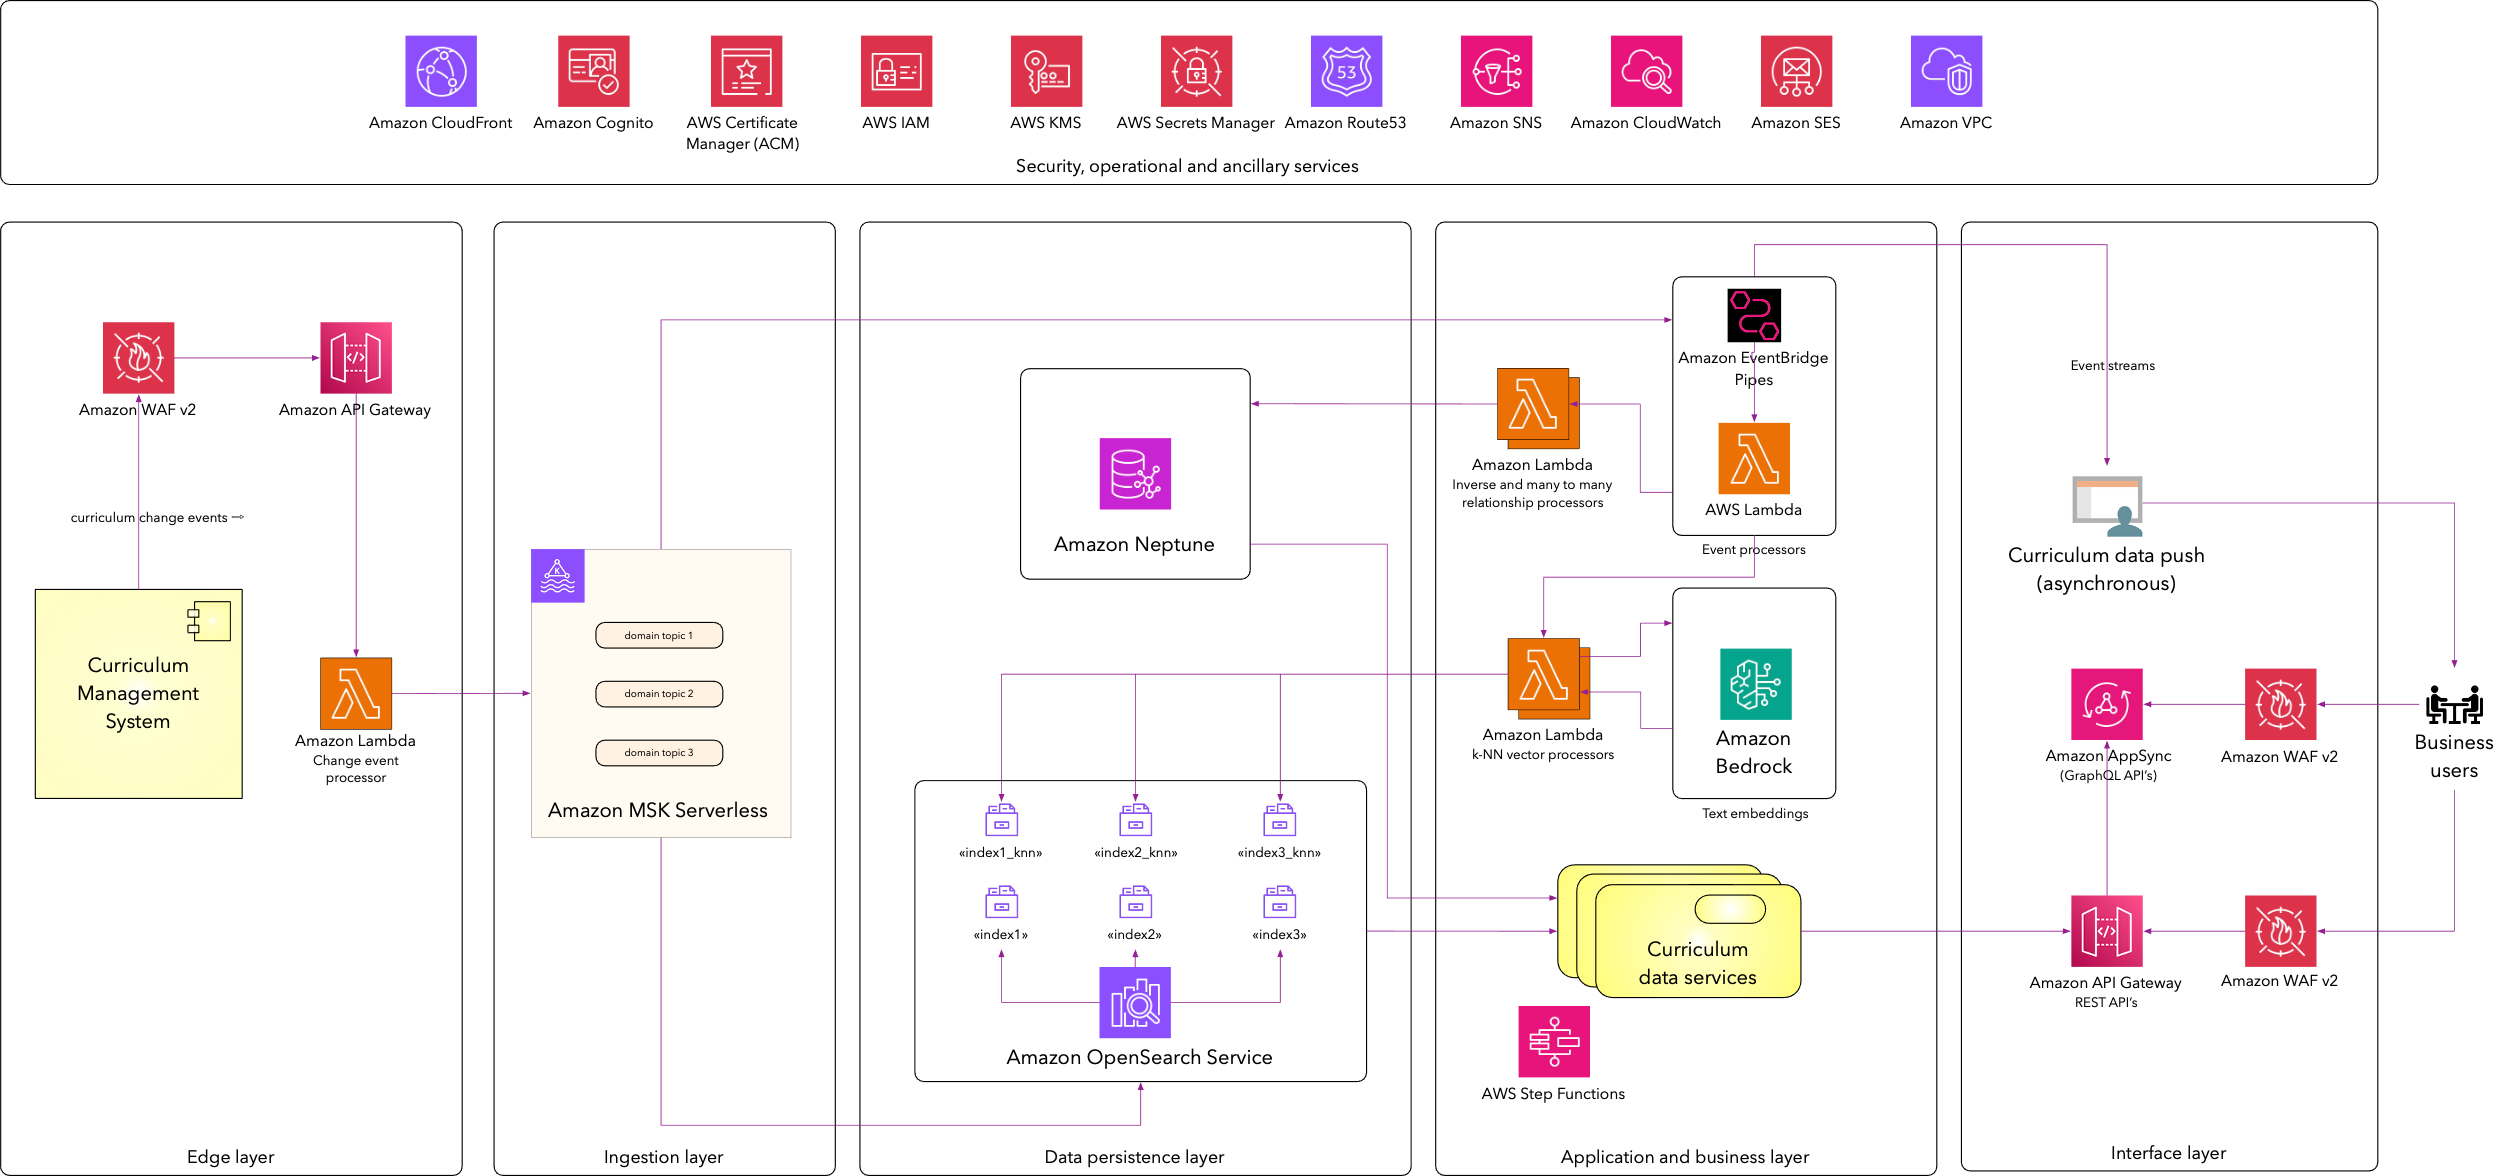
Figure 3: End-to-end architecture of the curriculum data services solution
Results and measurable outcomes
The outcome isn’t a replacement for the Curriculum Management System as the system of record. It’s a governed data foundation that leaves the system of record authoritative whilst making curriculum information reusable through APIs, graph traversal, semantic search and event delivery. Since the production launch in November 2024, the domain has recorded zero production incidents.
- Latency – Changes become available to downstream consumers in an average of 1.6 seconds from crossing the edge layer, through synchronous and asynchronous interfaces.
- Curriculum graph – The domain models 43,794 relationships across approximately 800 programs of learning, 3,500 units of learning and 2,500 areas of learning.
- Consumer adoption – 11 institutional consumers have adopted the services, replacing bespoke point-to-point integrations with reusable, governed contracts.
- Operational footprint – One engineer operates the domain. Managed, serverless and self-healing components make routine intervention negligible and remove the need for dedicated Level 3 support.
- Cost efficiency – UTS achieved a material reduction in the total cost of ownership of curriculum data integration and delivery, consolidating capabilities previously spread across commercial products, bespoke integrations, databases and multiple support teams.
- Availability and resilience – The platform operates continuously and has maintained downstream access to trusted curriculum information when the upstream system of record was unavailable.
Collectively, these outcomes show how a small engineering contingent can operate an institutional-scale data domain using managed AWS services, whilst increasing capability, reducing operational complexity and aligning expenditure with demand.
What’s next
The curriculum domain validated the production architecture and operating model. The student data domain followed, providing a single governed point of access for student profiles, admissions, offers, enrolments and related information. UTS is now preparing the learning activities domain, a substantially larger capability built around a lifelong learner graph using Amazon Neptune and Amazon Neptune Analytics, extending the same domain-driven pattern across the teaching and learning landscape.
Each bounded context can select the AWS services appropriate to its business questions whilst retaining common controls for identity, security, observability, delivery and operational sustainability.
Conclusion
UTS’s integration landscape had reached the point at which cumulative complexity and operational overhead constrained institutional change. The response was not technology for its own sake. UTS ITU used AWS to remove the impediments between authoritative institutional data and the teaching, learning and administrative capabilities that depend upon it.
The significance of AWS extended beyond technology selection, but the outcome was principally an architectural and operating-model achievement by UTS. Curriculum data services became UTS’s first production data domain. UTS combined domain-driven design, asynchronous processing, purpose-built persistence and governed interfaces with managed AWS capabilities that made those patterns practicable at institutional scale.
The resulting service foundation supports event streaming, graph traversal, document and semantic retrieval, compute, identity, security and governed data exposure. UTS operates it without a conventional infrastructure estate. This allowed UTS ITU to convert an ambitious architectural design into a sustainable production capability whilst keeping engineering effort concentrated on domain services rather than undifferentiated infrastructure.
Curriculum data services embody the resulting transition: from a burdensome integration model to a domain-aligned data foundation that’s reusable, resilient and operationally sustainable. UTS now possesses a repeatable model through which institutional data can be treated as a strategic asset rather than a by-product of individual systems. The university will continue to operate many systems. Students and staff should never experience the boundaries between them.
For more information or support, contact the AWS Public Sector team.
About the authors
The Future of AI Cryptanalysis
Post Syndicated from Bruce Schneier original https://www.schneier.com/blog/archives/2026/10/the-future-of-ai-cryptanalysis.html
Matthew Green has been writing a rather pessimistic series of posts about the potential for AI systems to vastly outperform humans in cryptanalysis of both symmetric and public-key ciphers.
I am more optimistic than he is. That is, I have stronger faith in the over-engineering cryptographers tend to do. I am trying to write this up in more detail.
Cyberattack on Connected Fridges in France
Post Syndicated from Bruce Schneier original https://www.schneier.com/blog/archives/2026/10/cyberattack-on-connected-fridges-in-france.html
Another IoT cyberattack, this one in France:
Hackers gained control of the software that regulates the temperatures of the refrigeration units, forcing some to warm to 50C (120F) overnight, according to one supermarket chain affected.
[…]
Normally, supermarket freezers go through a short period of defrosting overnight, in which temperatures rise slightly. But the hackers ordered the units to heat up and stay hot, although Danfoss did not confirm any reports about just how warm the fridges and freezers could become in that process.
Danfoss said the affected cold units were older models whose security software could not be updated to ward off a risk they had identified.
Any IoT device that can’t be updated is vulnerable. And, probably, any IoT device that can be updated is also vulnerable.
[$] Collaborating with out-of-tree tracers
Post Syndicated from jake original https://lwn.net/Articles/1099300/
LTTng creator Mathieu Desnoyers seems a
bit trapped in something of a catch-22.
At the 2026 Linux Plumbers Conference
(LPC), he led a discussion on the problem he is having in trying to
collaborate with other tracing projects (e.g. ftrace, perf) in the kernel. The
feedback he has gotten, both over the years and more recently, does not
show a path that would allow him to contribute the 21-year-old
GPLv2-licensed LTTng tracing framework, or, incrementally, features from
it, to the mainline kernel.
Linus Torvalds’s first LLM-assisted patch series
Post Syndicated from corbet original https://lwn.net/Articles/1100449/
At the recently concluded Maintainers
Summit, Linus Torvalds said that he had been using a large language
model to work on a patch series addressing a longstanding problem; he has
now posted
that series for review.
The fairly short series of ten patches basically enhances folio
lookup by noticing when folios are hot, and setting a “delay
releasing this folio until after a RCU period”, and then using that
RCU delay it does not just the folio lookup itself under RCU (which
we’ve done forever), but also the actual folio data accesses
themselves under RCU. No refcount taking needed for the fastpath
where we can just read the data from the folio entirely in an
RCU-protected region when the user copy doesn’t cause page faults.
The end result is an order-of-magnitude speedup for a read()-heavy
benchmark. Review has already identified a race
condition in the code, though, so further work will be needed.
KDE Plasma 6.8 released
Post Syndicated from jzb original https://lwn.net/Articles/1100429/
Version 6.8 of
the KDE Plasma desktop has been
released. The The KDE project has timed the release to coincide with the 30th
anniversary of Matthias Ettrich’s email announcing the
project:
Unix popularity grows thanks to the free variants, mostly Linux. But still a
consistent, nice looking free desktop-environment is missing. There are several
nice either free or low-priced applications available, so that Linux/X11 would
almost fit everybody needs if we could offer a real GUI.
Notable changes include accessibility improvements, inclusion
of the Kup backup
tool as part of Plasma, as well as the ability to include system audio and
microphone input in Spectacle
screen recordings. Plasma 6.8 also drops support for Plasma X11 sessions, as was announced
in November 2025. X11 applications are still supported via XWayland, and KDE
applications will continue to support X11 “for the foreseeable
“.
future
See the KDE wiki for a
list of major user-facing changes, and the changelog
for all changes since Plasma 6.7.5.
[$] GCC development with large-language models
Post Syndicated from corbet original https://lwn.net/Articles/1098672/
After much deliberation, the GCC project recently came up with a policy on the use of large
language models for development of the compiler suite. It is somewhat
restrictive, but still leaves room for LLMs in the development process. At
the 2026 GNU Tools Cauldron,
Jeff Law and Kyrill Tkachov discussed how these tools have been useful for
them.
Security updates for Wednesday
Post Syndicated from jzb original https://lwn.net/Articles/1100426/
Security updates have been issued by AlmaLinux (bind9.18, dovecot, flatpak, gd, jackson-core, jackson-databind, jackson-jaxrs-providers, and jackson-modules-base, kernel, opentelemetry-collector, pcre2, and tftp), Debian (curl and keystone), Fedora (aegisub, arm-none-eabi-binutils-cs, avr-binutils, chromium, curl, firefox, kernel, python-jupytext, and xdg-dbus-proxy), Mageia (apache, freeciv, gnumeric, mingw-gdk-pixbuf, and patool), Red Hat (cockpit-image-builder, fence-agents, firefox, ipa, kernel, kernel-rt, pcre2, python-tornado, qt6-qtdeclarative, thunderbird, and webkit2gtk3), Slackware (expat), SUSE (bind, busybox, containerd, cups-filters, fixme, gimp, glibc, google-osconfig-agent, kernel, libtcnative-2-0, openssh, openssl-3, php8, podman, python-oauthlib, python-PyJWT, python-urllib3, python-virtualenv, python311, python313-jupyter-server, python313-kubernetes, python313-logilab-common, python313-markdown-it-py, python313-markdown2, python313-marshmallow, python313-mpmath, python313-mysql-connector-python, python313-oci-sdk, python313-oic, unbound, wpa_supplicant, xen, and xorg-x11-server), and Ubuntu (kernel, libyaml-perl, linux, linux-aws, linux-aws-fips, linux-aws-hwe, linux-azure, linux-azure-4.15, linux-azure-fips, linux-fips, linux-gcp, linux-gcp-4.15, linux-gcp-fips, linux-hwe, linux-kvm, linux, linux-aws, linux-aws-fips, linux-fips, linux-gcp, linux-gcp-fips, linux-gke, linux-gkeop, linux-ibm, linux-lowlatency, linux-oracle, linux-realtime, linux, linux-aws, linux-azure, linux-azure-5.4, linux-fips, linux-gcp, linux-gcp-5.4, linux-gcp-fips, linux-hwe-5.4, linux-iot, linux-kvm, linux-oracle, linux-oracle-5.4, linux-raspi, linux-raspi-5.4, linux-xilinx-zynqmp, linux, linux-aws, linux-fips, linux-kvm, linux-lts-xenial, linux-aws-5.4, linux-aws-fips, linux-azure-fips, linux-ibm, linux-ibm-5.4, linux-azure, linux-azure-fde, linux-azure-fips, linux-oracle, and pyjwt).
Inside Hyperdrive: How we solved a rare Hyperdrive MySQL caching bug
Post Syndicated from Pranoy Dutta original https://blog.cloudflare.com/hyperdrive-mysql/
Hyperdrive support for MySQL is now generally available (GA). Hyperdrive, Cloudflare’s database connection pooler for Workers, initially only supported Postgres. Since we announced the beta for MySQL protocol support last year, we have been working on making our MySQL handling as reliable as our Postgres support.
We’ve learned some things from building and running a MySQL connection pooler on Cloudflare’s network. It turns out that the difference between beta and GA is just 20 bug fixes in a trenchcoat.
During the beta, our goal was to validate that real-world customer usage hit our production availability target of 99.99%. We knew there were gaps in our reliability since we track how often client connections from a Worker end in an error related to Hyperdrive. In addition, we had feedback from customers in the beta that led to the discovery of a rare and subtle bug in our production environment. To convey the complexity of this particular bug, we first need to explain how Hyperdrive works.
What is Hyperdrive?
Hyperdrive is a distributed database connection pooler that connects Cloudflare Workers to SQL databases. Hyperdrive holds warm SQL connections open on our global network and shares these connections across many Worker requests. In addition to connection pooling, Hyperdrive can also cache common queries in our global CDN cache, reducing latency and load on the origin database.
Establishing a connection to a SQL database is expensive, taking a minimum of five network round trips. On a serverless compute platform like Workers, establishing a connection for each request would be impractical, both because of the amount of latency added to each request, but also because a large number of open connections can incur high per-connection resource costs. While MySQL fares better here than Postgres since MySQL doesn’t use an entire OS process per connection, a typical deployment can still run into resource issues with a large number of connections.
For more details, see our blog post introducing Hyperdrive.
A journey to stability
Some of the issues we ran into were small and easy to fix once reported. One of the first problems reported in the beta was that emojis written to the database were not being correctly returned. This was a bug related to character set encoding. Hyperdrive negotiates the encoding for the connection in the startup handshake and we negotiate utf8 as the encoding. As it turns out, utf8 is a deprecated alias for utf8mb3 which is not all of UTF-8: it only supports 1-3 bytes per Unicode code point, while full UTF-8 has a max of 4 bytes per code point. To get all of UTF-8, we needed to change our handshake to use utf8mb4 , which fixed the emoji issue.
Another encoding-related bug occurred when we added connection cleanup via COM_RESET_CONNECTION. This is a lightweight MySQL command to clear any session state in a given connection, which is exactly what Hyperdrive needs to ensure that no session-level state leaks between checkouts. But adding this connection cleanup step caused encoding issues once again! It turns out that COM_RESET_CONNECTION does not reset the connection state to the character set encoding we negotiated at connection startup; it instead resets the connection to the server default. This means that after negotiating utf8mb4 on a MySQL server instance that defaults to latin1, once we run COM_RESET_CONNECTION, our connection now has an encoding of latin1. The fix is to always run a command setting the encoding to utf8mb4 after a connection reset.
A hard-to-find bug
During the beta, our highest-volume MySQL customer reported a small but consistent rate of empty query responses for which a non-empty response was always expected. We started the investigation by combing through all of our telemetry and understanding the user’s logic. Then we also increased the trace rate for this Hyperdrive instance, hoping to see the execution flow of this bug. We searched for network issues that could explain the issue — but nothing seemed to account for this behavior. This error occurred about 0.001% of the time, which made it very hard to find relevant end-to-end execution traces.
But we did have one clue: the bug only occurred on Hyperdrive instances with caching enabled. This made us suspect an issue with Hyperdrive’s MySQL caching.
Hyperdrive caching
To understand Hyperdrive's caching, we first need to talk about Hyperdrive's topology and how it interacts with the CDN cache. Every Hyperdrive instance has a split architecture with two nodes: a Client and an Endpoint. The Client node runs on the same machine as the user’s Worker, handles local caching (if enabled), and forwards queries to the Endpoint if needed. The Endpoint node holds the connection pool and is placed in the data center closest to the origin database. Each node uses the Cloudflare CDN cache local to the data center it is running in. Importantly, this means that if the two nodes are running in the same data center, they will share a cache.
Sharing the cache between Client and Endpoint is generally good for performance. We use a hash of the contents of the query’s wire messages with some normalization and store the result bytes in the cache. If a Hyperdrive Client running in the same data center as its Endpoint receives a request, and that Endpoint has recently cached the results of the same query, the Client can serve the response directly from the shared data center cache. To work correctly, this scheme requires that the same bytes are cached for the same response, whether stored by the Client or the Endpoint.
MySQL client/server protocol
Since we couldn’t get a direct trace of the issue, we decided to spend time looking at the MySQL client / server protocol. Perhaps we had an assumption about Postgres’ protocol built into our MySQL handling that was causing these issues.
The protocol describes how a MySQL client communicates with a MySQL server. This can be somewhat confusing in the case of database connection pooling since we have two components acting like clients and two acting like servers. The first client is the Worker using a MySQL client library, and it connects to the first component acting like a server, the Hyperdrive Client. The Hyperdrive Client connects to the Hyperdrive Endpoint which acts as a MySQL client connecting to the actual MySQL origin server.
This protocol starts with the Connection Phase where the MySQL client and the MySQL server agree upon a common authentication method and capabilities. Once a connection is established, the client and server begin the Command Phase, where the client sends commands (e.g. SQL statements) to be executed with the server responding and waiting for the next command.
Capabilities are exchanged during the Connection Phase to support protocol evolution while remaining backwards compatible. Each capability is a feature, like supporting compression during the Command Phase. The clients and servers must only use features which the other supports, otherwise a protocol desync can occur, leading to unexpected behavior.
This capability negotiation can be tricky for Hyperdrive, since Hyperdrive acts as a client to the origin database, and acts as a server to the Worker. To ensure that Hyperdrive can parse the messages from the origin MySQL server, Hyperdrive has a fixed set of capability flags which are used to communicate to the origin database. Since it is possible for Hyperdrive’s set of capabilities to be different from the Worker client’s set of capabilities, Hyperdrive needs to translate all origin responses encoded by its capabilities to the capabilities that the Worker expects.
While trying to debug this issue, we found that a popular MySQL client library for Node.js (mysql2) does not currently support the CLIENT_DEPRECATE_EOF capability, which changes how result sets are terminated. Without this capability, the server sends an EOF packet between the column definitions and rows, then another EOF packet at the end of the result set. When CLIENT_DEPRECATE_EOF is negotiated, the metadata EOF packet is omitted and the final EOF packet is replaced with an OK packet. MySQL server 5.7.5 and later supports this capability, but the newer OK-packet behavior is only used when the client negotiates it.
While Hyperdrive does support the CLIENT_DEPRECATE_EOF capability, it’s possible that the Worker’s MySQL driver does not. To handle this, Hyperdrive adjusts its behavior to support the capabilities that the Worker client driver expects. This means rewriting result sets to include EOFs and to translate all OK packets to EOFs when required.
After days of looking through telemetry, documentation, and Hyperdrive code, everything clicked. We finally came across the last missing piece: a faulty assumption in our Hyperdrive Client caching code. We baked in an assumption when implementing the Client caching for Postgres: that we can cache exactly the bytes we wrote back to the Worker. While this was a reasonable assumption to make with Postgres’ wire protocol, it no longer holds due to the mismatch in MySQL capabilities. If a Client node is caching exactly what it writes back to the Worker, these bytes are in a different format than what an Endpoint node would be expecting. That’s because the Endpoint node is always working with Hyperdrive’s capabilities, while the Client node writes back bytes that are translated to match the Worker’s capabilities.
Now if we put all these clues together, we can understand scenarios where Hyperdrive can return a MySQL response encoded with the wrong capabilities, leading to the unexpected empty results and hangs. The bug occurs when both the Client and Endpoint are in the same data center, sharing a cache, and when one reads a value cached by the other.
Here’s a closer look at two such scenarios.
Endpoint caches, Client reads
- The Endpoint is in the middle of servicing a request for query Q. It gets back a response R from the origin server and caches response result bytes R_hyperdrive (Response encoded with Hyperdrive capabilities) into the shared cache.
- Client receives another request for query Q, checks the shared cache and finds R_hyperdrive.
- Client responds to the Worker with R_hyperdrive without translating to the Worker’s capabilities.
This diagram shows that flow:
Client caches, Endpoint reads
- Client is finishing serving a request for query Q, and it writes the translated response bytes R_worker to cache.
- Endpoint is in the middle of servicing a request for Q, and checks the cache to find R_worker.
- Endpoint sends R_worker to a different Client, and this Client tries to translate R_worker to the Worker’s capabilities, and ends up sending an early EOF or hangs.
You can see that here:
Once we found this type of failure mode, the fix was simple. We now make sure that we always write back a canonical version of the query result bytes in the cache encoded using Hyperdrive’s capabilities, no matter which node stored it. After releasing this change, the empty row problem went away — and our success rate for Client connections reached 99.99%.
Reliability is a feature
You can use Hyperdrive support for MySQL today! Create a Hyperdrive to an existing MySQL-compatible database via the dashboard or wrangler, or connect to a new PlanetScale database. If you run into any issues or have questions, reach out on our Discord.
npx wrangler hyperdrive create HYPERDRIVE_NAME --connection-string="mysql://user:[email protected]:3306/dbname"USS Indiana: America’s First Battleship
Post Syndicated from The History Guy: History Deserves to Be Remembered original https://www.youtube.com/watch?v=71FtfKrl-1M
From Backup to Assurance: Monitoring Veeam with Zabbix
Post Syndicated from Michael Kammer original https://blog.zabbix.com/from-backup-to-assurance-monitoring-veeam-with-zabbix/33694/
Your data isn’t truly protected if you don’t know when that protection fails. Today’s organizations depend on backup infrastructure to safeguard critical workloads, yet a single backup failure, dwindling repository capacity, expired license, security incident, or infrastructure issue can quietly undermine that protection. The key isn’t just having backups – it’s knowing, as quickly and reliably as possible, when something has gone wrong.
Simply having a backup solution in place is not enough. IT teams need continuous visibility into health and operational status. That’s where Zabbix and Veeam come together.
With the latest integrations for Zabbix 8.0 and Veeam Backup & Replication v13, organizations can bring Veeam backup monitoring into their broader infrastructure monitoring strategy, gaining centralized visibility, proactive alerting, and a clearer picture of whether their data protection environment is ready when it is needed. Veeam protects your data. Zabbix makes sure you always know when that protection is at risk.
Two ways to monitor your Veeam environment
Zabbix provides integrations for monitoring Veeam environments through two approaches:
- Veeam Backup & Replication by HTTP
- Veeam Backup Enterprise Manager by HTTP
Both approaches extend Zabbix monitoring into the backup environment, helping teams detect operational and security issues before they become business-impacting incidents.
The Veeam Backup & Replication by HTTP integration provides direct monitoring capabilities for Veeam environments and offers administrators detailed visibility into backup operations and the infrastructure that supports them.
The Veeam Backup Enterprise Manager by HTTP integration is an alternative for organizations that use Veeam Backup Enterprise Manager to centrally manage multiple Veeam Backup & Replication deployments. It uses the Enterprise Manager REST API to bring information from multiple deployments into Zabbix.
It’s important to note that Enterprise Manager is an additional Veeam component and requires a separate installation. For organizations that already have Enterprise Manager deployed, its centralized architecture can make it a valuable option for bringing multiple Veeam environments into a single Zabbix monitoring view.
Veeam Backup & Replication by HTTP: Direct visibility into your backup environment
The Veeam Backup & Replication integration focuses on the operational health of the backup infrastructure and the results of backup activities. With Zabbix, administrators can monitor important components and events, including:
- Backup job status and execution results
- Backup sessions and failures
- Backup repositories and available capacity
- Backup proxies and managed servers
- License status and expiration
- Security Analyzer findings
- Malware detection events
- Authentication and security-related events
NOTE: License, Authorization Events, and Security Analyzer Data require the “Backup Administrator” role; without it, these items are not supported.
This means backup monitoring becomes part of the same monitoring workflow used for servers, applications, networks, storage, and other critical infrastructure. Instead of discovering a failed backup when a recovery is already required, teams can receive an alert as soon as the failure occurs.
Veeam Backup Enterprise Manager by HTTP: Centralized observability across deployments
For organizations managing multiple Veeam Backup & Replication deployments, Veeam Backup Enterprise Manager offers another way to centralize backup information. This Zabbix integration communicates with Enterprise Manager through its REST API and provides centralized monitoring and alerting across multiple Veeam Backup & Replication environments. This gives administrators visibility into areas like:
- Backup infrastructure health
- Backup job status
- Repository utilization
- Operational events
- Job run results
- VM protection status
The result is a consolidated view of backup operations from a single Zabbix dashboard. The integration also works without external scripts and uses a Zabbix script item, helping simplify deployment and ongoing maintenance. This means that Enterprise Manager can be especially useful when an organization already operates it as a centralized management layer for multiple Veeam deployments.
Why monitor Veeam with Zabbix?
Veeam is responsible for protecting data. Zabbix adds a monitoring and alerting layer that helps ensure the protection itself remains healthy. This distinction is important!
A backup job can exist without actually providing reliable protection. Repositories can run out of capacity. Backup jobs can fail repeatedly. Infrastructure components can become unavailable. Licenses can approach expiration. Security-related events can require immediate attention.
Without proactive monitoring, these conditions can remain unnoticed until they have serious consequences. By integrating Veeam into Zabbix, organizations can continuously monitor these conditions and incorporate them into their existing operational processes.
A single pane of glass. IT teams often manage complex environments containing physical and virtual servers, cloud services, networks, storage, applications, and backup infrastructure. Bringing Veeam into Zabbix means that backup operations can be monitored alongside the rest of the environment rather than through an isolated monitoring workflow. This provides a single pane of glass for infrastructure and backup operations and gives administrators a more complete picture of overall service health.
Immediate detection of backup failures. A successful backup is one of the most important indicators that data protection is working as expected. Zabbix can alert teams when backup jobs or sessions fail, allowing them to investigate while there is still time to resolve the problem and complete a successful backup. This changes backup monitoring from a reactive process into a proactive one.
Proactive capacity monitoring. Backup repositories require sufficient capacity to continue protecting data. Monitoring repository utilization and available capacity allows administrators to identify trends and potential capacity problems before they cause backup failures. Instead of reacting to a full repository, teams can plan capacity increases or optimize retention policies ahead of time.
Faster troubleshooting. When something goes wrong, knowing that a backup failed is only the first step. Monitoring the surrounding infrastructure and Veeam components in the same platform can provide valuable context. Zabbix can help teams correlate backup-related events with infrastructure conditions, making it easier to identify potential causes and accelerate troubleshooting.
Reduced recovery risk. The real value of a backup becomes apparent when an organization needs to recover data.
A continuously monitored backup environment provides greater confidence that backup jobs complete successfully, repositories have sufficient capacity, and critical components remain operational. Proactive monitoring, therefore, directly reduces recovery risks and improves both business continuity and disaster recovery readiness.
Security-aware monitoring. Modern backup environments are also an important part of an organization’s security strategy.
Monitoring Veeam security-related information, including malware detection events, Security Analyzer findings, and authentication or security-related events, helps teams identify conditions that may require immediate investigation. Combining these signals with the rest of the organization’s monitoring data can provide additional context when responding to potential threats.
Zabbix 8.0 and Veeam Backup & Replication v13: Keeping the integration current
The latest integration updates for Zabbix 8.0 and Veeam Backup & Replication v13 make it easier for organizations running current versions of these platforms to incorporate Veeam into their monitoring strategy. Keeping integrations aligned with current platform versions is important for organizations that want to modernize their infrastructure while maintaining consistent monitoring and alerting.
Whether you’re observing a single Veeam deployment directly through Veeam Backup & Replication or using Enterprise Manager to centralize multiple deployments, the goal is the same – to
make the state of your backup environment visible and actionable.
From backup monitoring to backup assurance
The biggest benefit of monitoring Veeam with Zabbix is not simply having more metrics or dashboards. It’s the peace of mind that comes from knowing that your data is fully protected at all times. After all, a backup system shouldn’t be something that IT teams think about only when they need to restore data. Its health should be continuously visible, and potential problems should generate alerts before they become emergencies.
Together, Veeam and Zabbix provide a proactive approach to backup monitoring. Veeam protects your data, and Zabbix helps you verify that the protection remains healthy. By combining backup monitoring with broader infrastructure observability, organizations can detect failures earlier, respond faster, plan capacity more effectively, and increase confidence in their business continuity and disaster recovery readiness.
For organizations running Veeam, monitoring the backup environment should be an essential part of the protection strategy, because knowing that your backups are working is just as important as having backups in the first place.
Visit Zabbix to find out more about open source observability, and check out Veeam’s website to discover data protection and resilience solutions.
The post From Backup to Assurance: Monitoring Veeam with Zabbix appeared first on Zabbix Blog.
На второ четене: „Горски цар“
Post Syndicated from Стефан Иванов original https://www.toest.bg/na-vtoro-chetene-gorski-tsar/
„Горски цар“ от Мишел Турние

превод от френски Изабела Георгиева, София: изд. „Парадокс“, 2024
Има книги, които човек препрочита, и книги, които препрочитат него. „Горски цар“ на Мишел Турние принадлежи към втория вид. За първи път го прочетох в гимназията, на онази възраст, когато всеки роман е или откровение, или скука, и той се оказа много важен за мен с някаква смущаваща, почти неприлична настойчивост. После, по инерцията на заразата, изчетох всичко останало на Турние на български и на френски – от „Петкан“ до „Метеорите“ и „Златната капка“. Днес възприемам това като един от решаващите етапи в читателското си развитие, врата с надпис, който се разчита едва след като си я затворил зад себе си. Новото издание на „Парадокс“ в превода на Изабела Георгиева е добър повод за второ четене, което по дефиниция е и разследване на първото.
Сюжетът изглежда като биография, сглобена от случайности, и точно в това е капанът. Абел Тифож, собственик на автосервиз на площад „Порт дьо Терн“, пише своите „Опаки записки“ с лявата си ръка след злополука с манивелата. Заглавието е решение на преводачката, което запазва двусмислието на френското sinistre – едновременно ляво и зловещо. Детството му в колежа „Свети Христофор“ е белязано от Нестор, чудовищно развито дете, което го посвещава в тайнописа на знаците. Обвинението в посегателство над момиченцето Мартина го изпраща към съда. Войната от 1939 г. идва като deus ex machina, която го спасява и отнася. Следват гълъбите на Рейн, пленът в Източна Прусия и ловните гори на Роминтен, където Гьоринг царува като карикатурен людоед сред трофеите си. Накрая идва Калтенборн – националполитическа школа за елитни момчета. Там Тифож, облечен в пълната си митологическа униформа, обикаля околните села на кон и събира деца за Райха. Главите се казват „Роминтенският човекоядец“ и „Калтенборнският човекоядец“ и не хитруват.
Сърцевината на романа е понятието фория, носенето. Тифож открива екстаза на тялото, което носи друго тяло.
Около него изгражда цяла теология, опряна на свети Христофор, пренесъл Христос през реката, и на баладата на Гьоте, в която бащата носи сина си през нощта, а Горският цар го отнема. Турние, възпитаник на Башлар и слушател на Леви-Строс, строи символна машина с часовникарска прецизност. Всеки знак има своя обратен образ и благословията се среща със своята злокачествена инверсия. Носенето спасява и поглъща. Роговете на елена са едновременно триумф и огледален фалос. Дори името на героя е шифър. Тифож е замъкът на Жил дьо Ре, спътника на Жана д’Арк и детеубиеца, когото Юисманс описва в „Там долу“ и Жорж Батай го анализира в свое изследване.
Прочетен в контекста на цялото творчество на Турние, романът разкрива и своята генеалогия. В „Петкан“ той обръща Дефо и превръща Робинзон от колонизатор в ученик на дивака. В „Метеорите“ разиграва мита за близнаците като утопия на затвореното тяло. „Горски цар“ е най-тъмният панел в този триптих от пренаписани митове. Тук методът е подложен на най-тежкото изпитание, защото материалът му е историята, която не търпи алегория. Турние го знае и затова подковава фикцията с бележки под линия към Нюрнбергския процес, сякаш документът е призван да удържи мита да не отлети в чиста поезия.
Тук критическото четене трябва да бъде по-внимателно от възхищението. Силата на книгата и нейният проблем са едно и също нещо. Тифож чете света като йероглифи, изписани лично за него, и романът му дава право, защото съдбата наистина му намига.
Читателят е поканен да опознае една херменевтика, която логически съвпада с параноята и естетически съвпада с фашизма.
Сюзан Зонтаг пише своето есе „Очарователният фашизъм“ пет години след романа. Тя описва точно този култ към здравото тяло, ритуала и подчинението като еротика. Турние го показва отвътре, с лупа и без морален коментар и затова е неудобен. Педофилският подтекст се мярка като сянка, достатъчно ясна, за да я видиш, и достатъчно неназована, за да те направи съучастник в мълчанието. Финалът е изкупление с почти католическа хореография. Тифож носи еврейското момче Ефраим през блатото и потъва под тежестта му, докато над него се върти златна шестолъчна звезда. Красиво е, може би прекалено красиво. Символната система се затваря като ковчеже и изкушението да я приемеш като прошка е силно. При първото четене тази звезда ме разплака. При второто ме накара да се запитам кой всъщност е спасен – дали това е детето, героят или авторът.

Паралелите със световната литература се предлагат сами. „Тенекиеният барабан“ на Грас разказва същата епоха през погледа на детето, което отказва да порасне. „Горски цар“ я разказва през погледа на великана, който отказва на детето да порасне. „Доктор Фаустус“ на Томас Ман проследява как германският мит се превръща в катастрофа. Турние стига до същото, но с френска наслада от германския мит.
„Лолита“ на Набоков е най-близкият роднина по техника и отново е с чудовищен разказвач, чиято реторика е по-обаятелна от моралния ни рефлекс.
„Доброжелателните“ на Джонатан Лител, трийсет и шест години по-късно, повтарят жеста с есесовец вместо с френски пленник и показват колко далеч е отишъл Турние пръв. Над всички тях стои Перо, защото приказката за людоеда е първият текст, в който децата се броят като запаси. Шльондорф екранизира романа през 1996 г. с Джон Малкович и доказа неволно, че тази книга не понася добре буквалността на образа. Митът оцелява в изречението и умира в кадъра.
Днешният свят предлага на романа неочаквано добри условия за четене. Фразата на Тифож „Всичко на този свят е знак“ звучи като мото на алгоритмичната епоха. Всеки има персонален поток от знамения, скроени лично за него, и лесно се убеждава, че небето не е пусто. Апофенията („немотивирано виждане за взаимовръзка, съпровождаща се с характерното чувство за неадекватна важност“) вече е бизнес модел. Култът към младото тяло, униформата и строя се връща в новите войни, в които детските военно-патриотични организации отново маршируват в камуфлаж. Дигиталната икономика на вниманието е може би най-ефективният людоед, който човечеството е изобретило, защото отвлича децата, без да ги изнася от стаята им.
За българския читател Калтенборн звучи смущаващо познато. Пионерските лагери, чавдарчетата с връзките, бригадирските движения, спартакиадите с масовите гимнастически фигури бяха българската версия на форията. Колективното тяло беше носено от идеологията, която претендираше, че го обича. Днешните патриотични лагери с бойна подготовка и възторжената реторика за „здрав дух в здраво тяло“ показват, че тази хореография е оцеляла и е сменила единствено знамената.
Още по-точен е паралелът с Роминтен. Гьоринг, който се изживява като пазител на гората и убива в нея, има своя български двойник в социалистическите ловни стопанства. Има го и в днешните резервати, където властта продължава да трофеизира природата и да се снима до убития елен. Отделно, че страстта към знаците е почти национален спорт от пророчествата на Ванга до конспиративните канали в социалните мрежи. Почти всеки у нас е малко Тифож, убеден, че съдбата му намига персонално.
Второто четене прави очарованието на „Горски цар“ по-подозрително и затова по-ценно. Книгата, която в гимназията ми изглеждаше като тайно познание, днес ми изглежда като изпит по бдителност. Турние ни учи да четем знаците и едновременно с това ни показва какво става с онзи, който ги чете твърде добре. Постижение е да се напише красив, умен и опасен роман, срещу който читателят трябва да се защитава със същата интелигентност, с която му се наслаждава.
Никой от нас не чете единствено най-новите книги. Тогава защо само за тях се пише? „На второ четене“ е рубрика, в която отваряме списъците с книги, публикувани преди поне година, четем ги и препоръчваме любимите си от тях. За нея медията „Тоест“ е отличена с Националната награда „Христо Г. Данов“ (2025) за принос в представянето на българската книга.
Рубриката е част от партньорската програма Читателски клуб „Тоест“, благодарение на която активните дарители на „Тоест“ получават 20% отстъпка от коричната цена на всички книги на включените издателства. Изборът на заглавия обаче е единствено на авторите Стефан Иванов, Севда Семер и Антония Апостолова, които биха ви препоръчали тези книги и ако имаше как да се разходите с тях в книжарницата.
Patch Tuesday – October 2026
Post Syndicated from Adam Barnett original https://www.rapid7.com/blog/post/em-patch-tuesday-october-2026
Microsoft is publishing 1,413 own-product vulnerabilities on October 2026 Patch Tuesday, including 1,102 vulnerabilities in Windows. Anyone who enjoyed last month’s record-setting Patch Tuesday will love the October 2026 edition, because it’s much bigger still. As Rapid7 has noted over the course of 2026, there is every reason to suppose that vulnerability volumes will continue to rise. Microsoft is aware of exploitation in the wild for just one of the vulnerabilities published today, as well as public disclosure for two others.
Windows Shell: zero-day security feature bypass
The Windows Shell is Microsoft’s term for the GUI interaction logic for the entire OS provided by explorer.exe and associated libraries and APIs, and for the second time this year, the Windows Shell is the site of an exploited-in-the-wild zero-day vulnerability. Today’s specimen is CVE-2026-96951. Once again, the immediate prize for an attacker is a Mark of the Web (MOTW) bypass. What this means is that Windows won’t provide the user with a dialog explaining that Windows protected their PC, because in this case, it didn’t. Exploitation requires that a user opens a specially crafted malicious file or visits an attacker-controlled site, so the evergreen advice about being careful what you click remains valid. Fans of vintage operating systems should note that Windows Server 2012 doesn’t receive a patch, although Server 2012 R2 does. The advisory acknowledges reporters from multiple organizations, although none from within Microsoft. The vulnerability also affected Microsoft’s Outlook.com cloud services, although Outlook.com was patched in a build dated several weeks ago.
.NET Framework: zero-day security feature bypass
Microsoft is aware of some level of public disclosure of CVE-2026-108398, a .NET Framework security feature bypass. Exploitation requires an attacker with an existing foothold to register a malicious .NET assembly for loading by a protected process, bypassing Windows Defender Application Control (WDAC) enforcement. Microsoft rebranded WDAC as App Control for Business several years ago, so you may know it under its new name. The Microsoft Learn page for Application Control for Windows points out that “your organization’s data is one of its most valuable assets… and threat actors want it”, and this is, of course, correct. The patch presumably removes an attacker-controlled location from the list of places .NET Framework searches for registered assemblies, which are typically contained within DLLs and executables. If any further indications were needed that vulnerability volumes are increasing industry-wide, this is only the second month that Microsoft has published vulnerabilities with six-digit CVE numbers, but these extra-large CVEs will seem unremarkable from now on.
Outlook: multiple no-interaction RCEs
The sheer volume of vulnerabilities in recent Patch Tuesday releases can easily include several examples of potentially concerning vulnerabilities, each of which might have been more remarkable in its own right back when volumes were lower. Today, Microsoft has published five separate remote code execution vulnerabilities in Outlook where the preview pane is a vector, meaning that simply scrolling past an email in the Outlook reading pane would be sufficient to trigger exploitation. Worse still, Outlook might helpfully display the preview without any user interaction at all. All five of CVE-2026-70242, CVE-2026-97749, CVE-2026-97016, CVE-2026-88156, and CVE-2026-70291 receive fixes in the same patches. No-interaction Outlook preview pane vulnerabilities can sometimes feature prominently in state-backed actor campaigns, with CVE-2023-23397 as a prominent example in this category.
Edge: security updates unclear
In September 2026, Microsoft did not appear to publish any desktop browser security advisories between the start of the month and Patch Tuesday. In October, a slightly different approach has emerged: several recent entries in the Edge security updates release notes mention new versions of Edge which incorporate the latest updates from the Chromium project, but without detailing which vulnerabilities have been fixed, stating instead, “CVE’s will be added as soon as available,” and directing readers to the Security Update Guide (SUG). At the time of writing, the SUG lists a total of zero vulnerabilities addressed in Edge in the first 13 days of October, and the “CVE’s added soon” message has been up for over a week. As a result, defenders have no obvious way of knowing which recent vulnerabilities Microsoft has addressed in Edge.
Microsoft lifecycle update
In Microsoft product lifecycle news, today sees Windows 11 24H2 Home & Pro reach end of servicing, while Windows Server 2022 moves to extended support, with free critical security updates continuing but no further feature development. Also this month, the final curtain falls for Windows Server 2012 and 2012 R2 with the expiry of the third and final year of cash-for-updates Extended Security Update (ESU) program for these aging workhorses. Microsoft lists the end of ESU Year 3 on October 14, 2026, in both cases. Microsoft has a long history of providing at least some security patches for products beyond the end of support, with Server 2008 being a case in point, but the time to move past Server 2012 is now. Office 2021 also moves into retirement on October 14; this includes the Long-Term Servicing Channel, with no ESU available in that case.
Also on October 15, 2026, Exchange Server 2016 and Exchange Server 2019 finally join the “no ESU” club, after two previous six-month reprieves. Microsoft seems to really mean it this time, since any future Exchange Server CVEs released by MSRC will stop mentioning Exchange 2016 and 2019. However, Microsoft points out that a lack of warnings does not mean those unsupported versions are not vulnerable to future security issues.
Summary charts
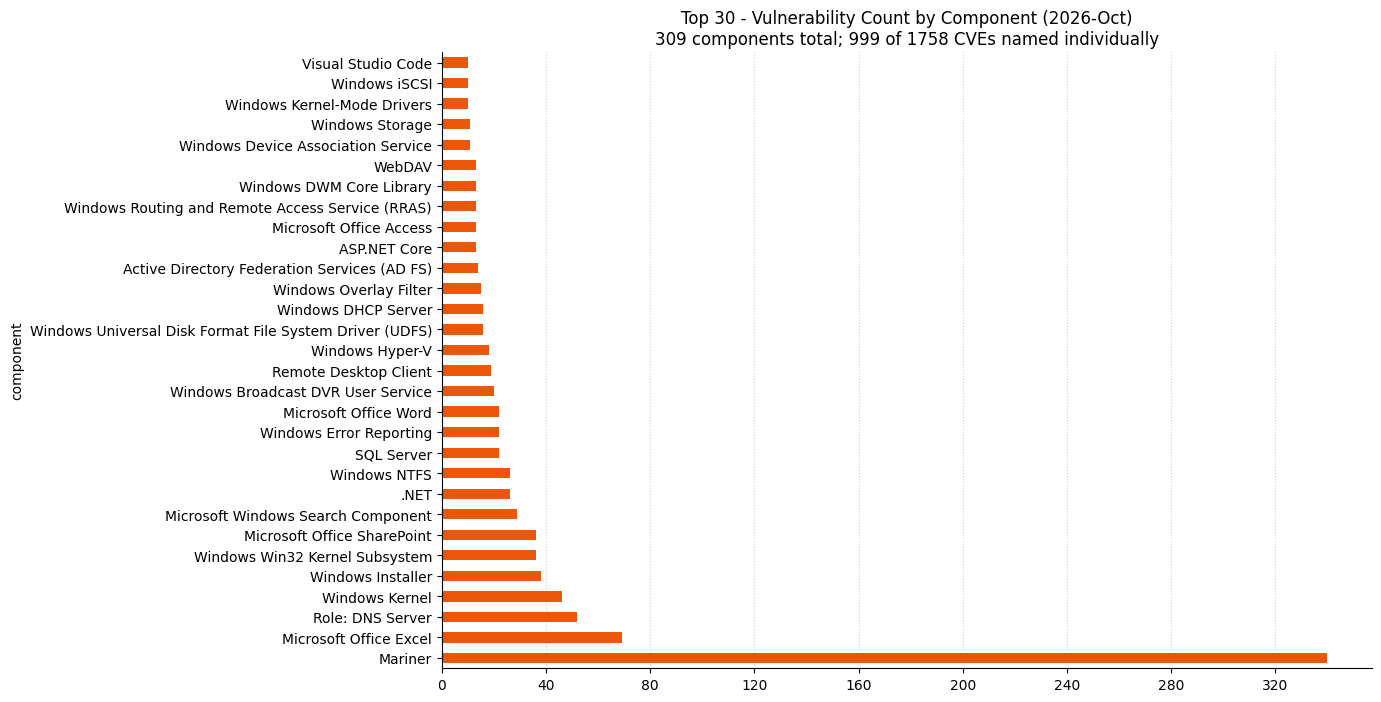
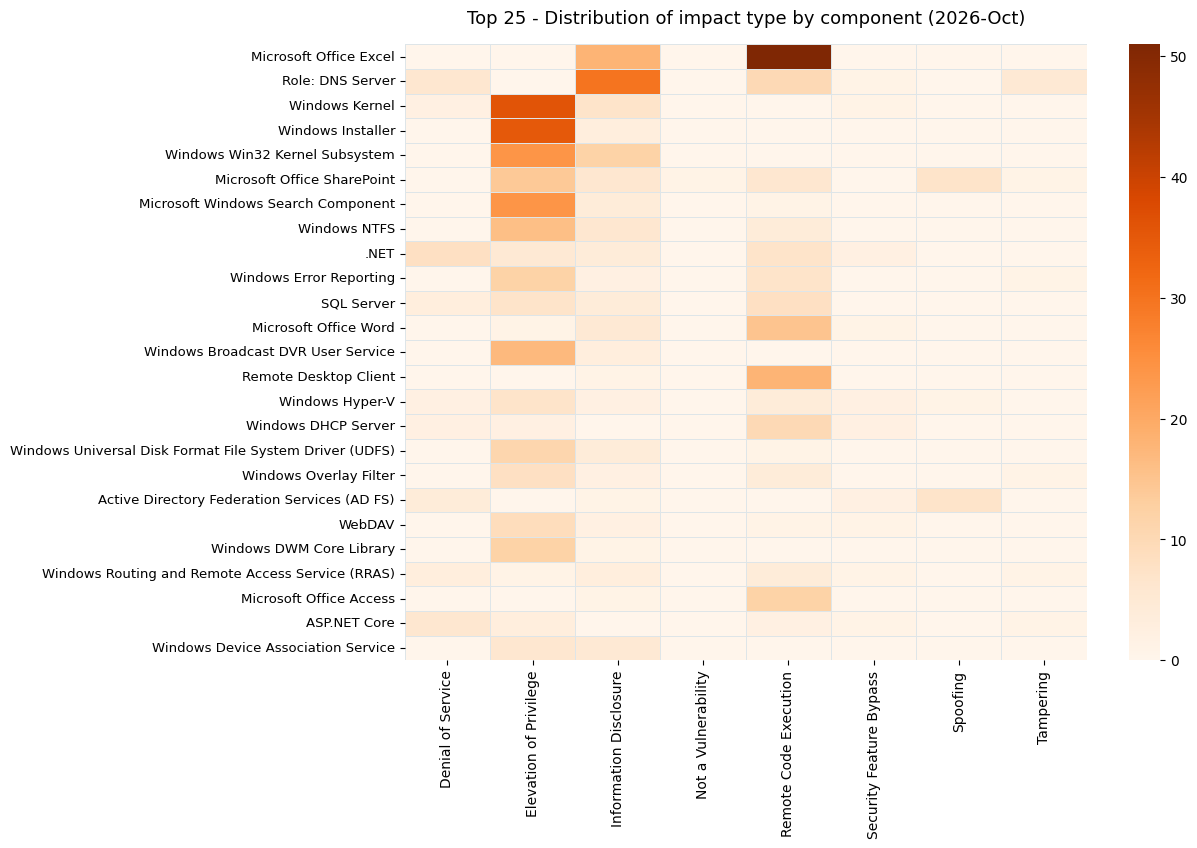
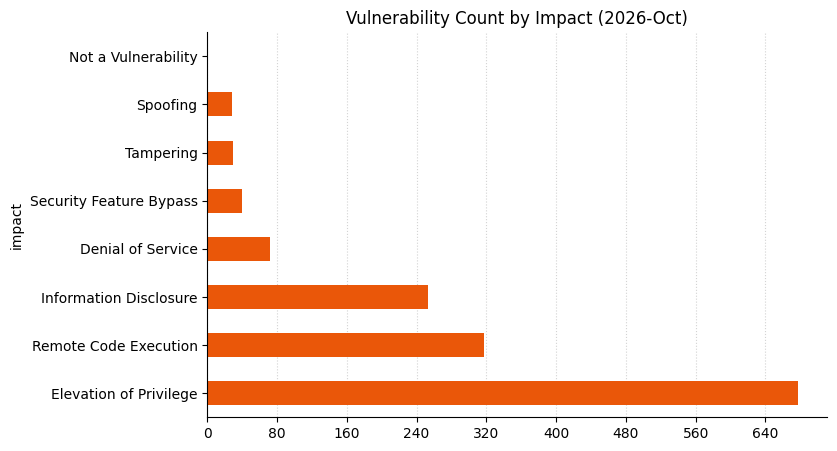
Scope workloads and share resilience policies with AWS Resilience Hub
Post Syndicated from Sinisa Mikasinovic original https://aws.amazon.com/blogs/architecture/scope-workloads-and-share-resilience-policies-with-aws-resilience-hub/
A resilience plan is useful only while it reflects the application you run. After a migration or deployment, a service can acquire a new dependency while its documented recovery objectives stay the same. In a shared Kubernetes cluster, even deciding which resources belong to that service can take investigation.
On September 18, 2026, the Next generation of AWS Resilience Hub introduced three capabilities to help you keep workload scope and resilience requirements aligned with your running environment:
- Amazon Elastic Kubernetes Service (Amazon EKS) label support for service input sources selects Kubernetes resources using the labels that already describe your workloads.
- Generative AI-powered Dependency Insights analyzes a service’s discovered dependencies and highlights the patterns worth reviewing.
- Resilience policy sharing through AWS Organizations lets a central team define resilience requirements once and make them available to member accounts.
In this post, you follow a team reviewing the resilience of a sample workload named checkout on Amazon EKS, representing an online store’s checkout service. The team starts by defining which Kubernetes resources belong to checkout, using labels to distinguish it from inventory in the same namespace. This establishes the resource boundary for the resilience review.
With that boundary defined, the team examines discovered dependencies and uses Dependency Insights to prioritize findings for investigation. A cross-Region dependency becomes a concrete question about whether checkout’s recovery design accounts for the services it requires to operate. The service owner then works with a central resilience team to validate the recovery requirements and apply a shared policy. Maintaining those requirements centrally gives teams a common definition to adopt across accounts, while policy events help the central team track adoption.
You perform these steps using the console or the AWS Command Line Interface (AWS CLI). The workload generates synthetic traffic to demonstrate dependency discovery.
About the application model: In the Next generation of Resilience Hub, the primary unit of assessment is a service. Services can be grouped into systems, and user journeys describe paths through them. See the key changes and the overview of the new hierarchy in the Next generation of Resilience Hub.
Prerequisites
To follow the examples, you need:
- Access to the Next generation of AWS Resilience Hub in a supported AWS Region.
- An Amazon EKS cluster with sample, labeled workloads and permission to configure access to the cluster.
- If you follow the CLI examples, install or update the AWS CLI using the installation and update instructions. Your installation must support the resiliencehubv2 commands. These examples use Bash.
- An AWS Identity and Access Management (IAM) role that Resilience Hub can assume, with the
AWSResilienceHubV2AssessmentExecutionPolicymanaged policy attached. The console can create this role when you create a service. - Kubernetes RBAC permissions and an EKS access entry that grant this role access to Kubernetes resources. The permissions guide provides the manifest and commands.
- For policy sharing, an organization with all features enabled and access to its management account.
The examples use two accounts: a workload account containing the EKS cluster and Resilience Hub service, and a management account that owns the shared policy.
For the CLI examples, configure profiles named workload and management for the respective accounts. Replace the example cluster ARN and other placeholders with your own values, and set the Region:
Each command uses --profile to select the account. Follow either the console steps or their CLI equivalents for each operation.
Amazon EKS label support for service input sources
A service input source tells Resilience Hub where to discover a service’s resources. Input sources can be AWS CloudFormation stacks, Terraform state files, resource tags, or Amazon EKS clusters. For an EKS input source, you select the namespaces to include. With this launch, you can also use Kubernetes label selectors to filter resources within those namespaces.
A namespace can contain workloads owned by different teams. With labels, you can select checkout’s resources without including inventory or reorganizing the namespace for an assessment. You use the same labels your teams already maintain.
How it works
Specify the cluster and one or more namespaces, then add label selectors to filter resources within each namespace. A selector contains a key, an operator, and values. Selectors within a namespace use AND logic: an object must match all of them. Without a selector, Resilience Hub discovers every supported object in the selected namespaces.
Checkout and inventory share the production namespace. Their resources carry app=checkout and app=inventory, respectively. Selecting production with app In checkout includes checkout’s Deployment and ReplicaSet and excludes inventory.
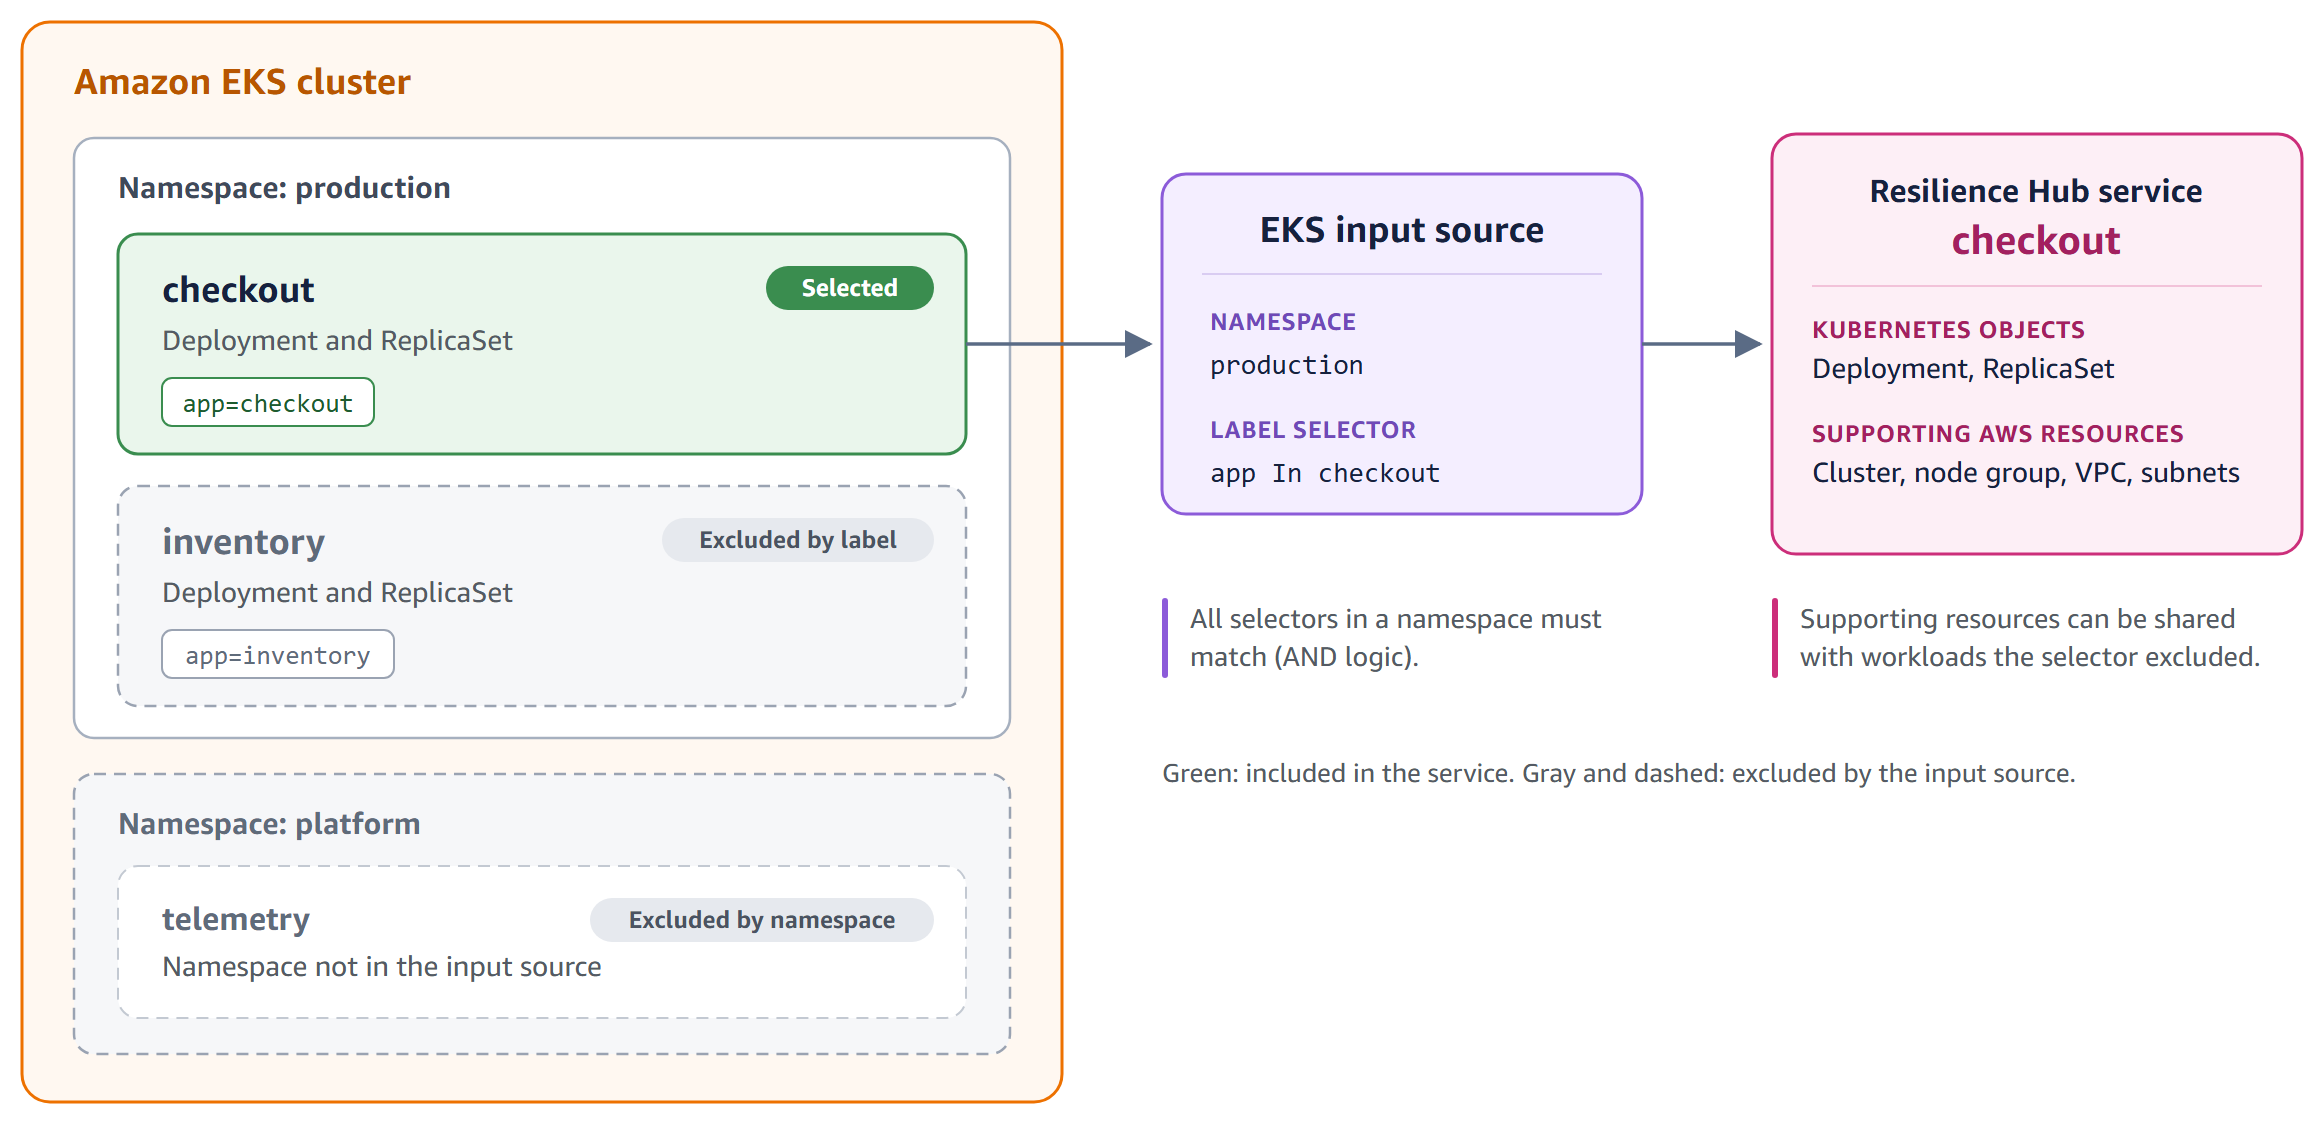
Figure 1: Selecting checkout resources with a Kubernetes label
The resource list also includes supporting AWS infrastructure, such as the cluster, node group, virtual private cloud (VPC), and subnets. Labels select Kubernetes objects. They don’t make that shared infrastructure exclusive to checkout.
How to use it
In the Resilience Hub console:
- Choose Create service and enter a name. Under Permission, choose Create default role to create an IAM role with the required AWS permissions, or choose Use another role to select an existing role.
- Under Service resource discovery, choose Amazon EKS cluster and enter the cluster ARN.
- Choose Configure namespaces, enter
production, and add a label selector with keyapp, operatorIn, and valuecheckout. - Choose Save, select Enable dependency discovery for this service, then choose Create service. Resource discovery starts automatically.
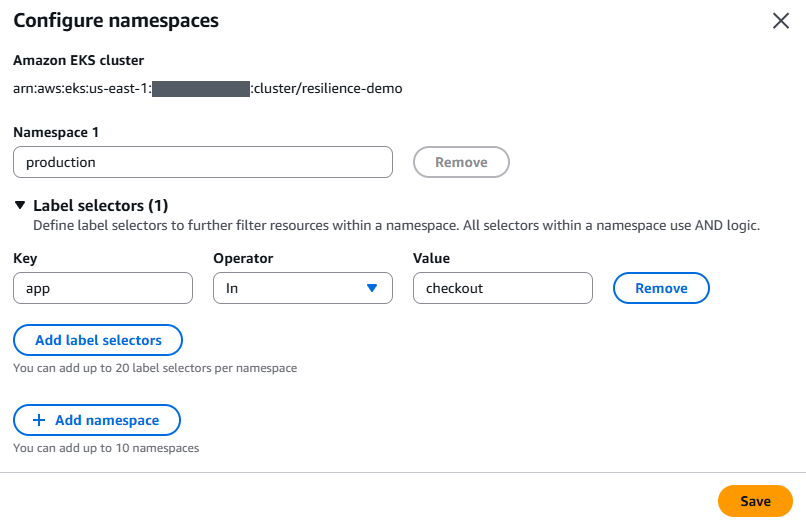
Figure 2: Scoping the checkout service to one namespace and one label
If you prefer to use the AWS CLI instead of the console, run the following commands to create the service and add its EKS input source.
Skip this block if you already created the service using the preceding console steps.
The console displays selector operators as In, NotIn, Exists, and NotExists. In the API, use IN, NOT_IN, EXISTS, and DOES_NOT_EXIST, respectively.
In the following command, replace ResilienceHubRole with your service’s IAM role name.
After resource discovery completes, you can use the following command to list the discovered resource types. If you created the service on the console, first set SERVICE_ARN to that service’s ARN.
Generative AI-powered Dependency Insights
Dependency Insights uses generative AI to summarize discovered dependencies and highlight patterns that warrant resilience review. It provides an overview and categorized findings.
The Resources list describes the service’s components. The Dependencies list shows endpoints discovered through DNS activity, including AWS service endpoints in other Regions and external APIs. When that list grows to hundreds of entries, Dependency Insights helps you prioritize what to investigate.
How it works
Dependency Insights builds on dependency discovery, an optional, separately priced feature. Dependency discovery analyzes DNS activity through Amazon Route 53 Resolver and does not require installing an agent in your workload. It examines up to 35 days of available history and continues monitoring for changes. The dependency list shows each endpoint’s name, location, and when it was first and last seen.
Dependency Insights analyzes this list, filters out common service activity that typically does not indicate resilience risk, and highlights patterns such as these:
| Pattern | What to investigate |
| Cross-Region dependencies | Whether a call to another Region is intentional, and how it affects recovery |
| New dependencies | Whether an endpoint first observed within the last seven days changes the documented architecture |
| Third-party dependencies | How the service behaves when an external provider is unavailable |
| Uneven usage | Whether activity reflects a scheduled job or a dependency used only at certain times |
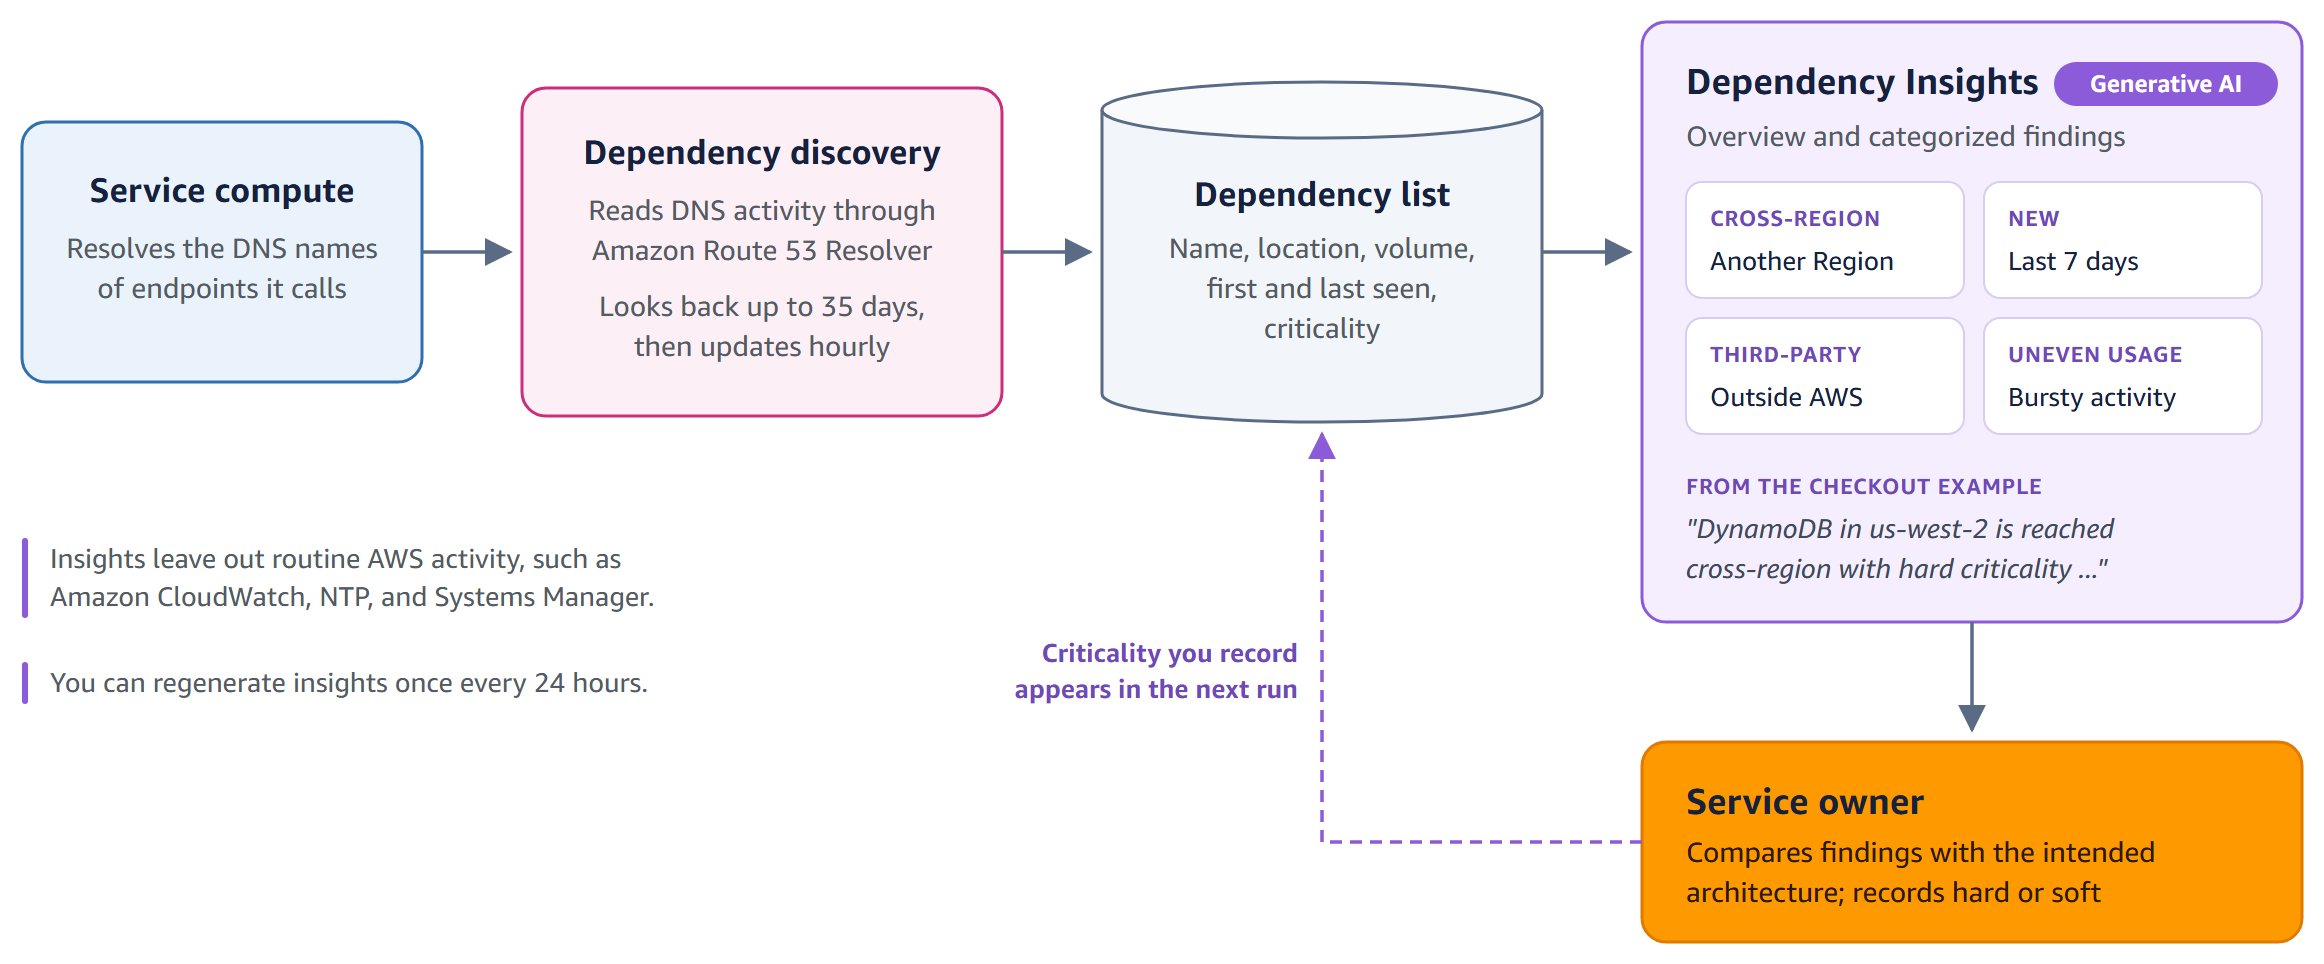
Figure 3: Turning dependency data into a focused review
Insights prioritize review. They don’t prescribe fixes or list every dependency. Use the full dependency list when you need detail. A new workload’s insights reflect only the history it has generated.
How to use it
In the Resilience Hub console, wait for initial dependency discovery to complete before generating insights:
- Open the service. On the Assessment tab, scroll to the Dependencies section to review discovered dependencies.
- Choose Generate insights.
- Read the overview and compare each finding with the intended architecture.
You can regenerate insights once every 24 hours. This limit applies whether you generate them through the console or the AWS CLI.
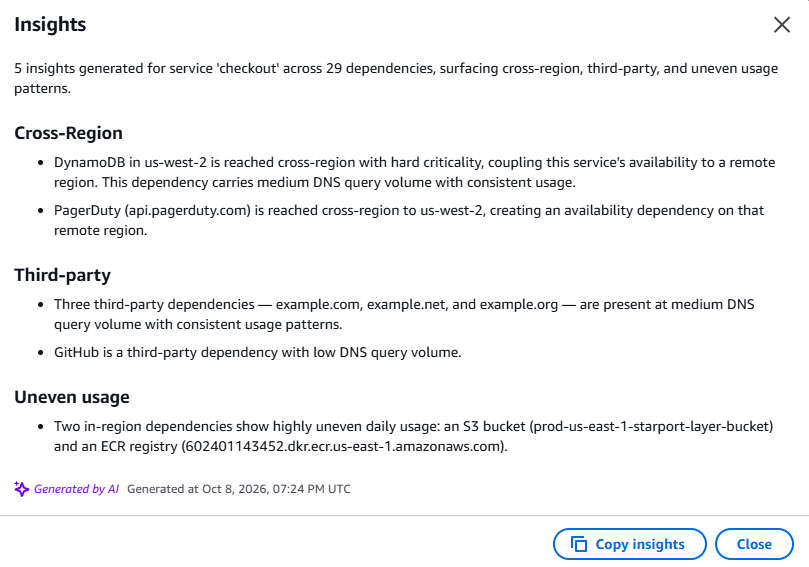
Figure 4: Dependency Insights for the checkout service
If you prefer the AWS CLI, use the following commands instead of the console steps. Set SERVICE_ARN to your service’s ARN.
Enable dependency discovery only if it is not already enabled. After initial discovery completes, review the dependency list and generate insights. If you already generated insights on the console, skip start-dependency-insights and use get-dependency-insights to retrieve the existing result.
Generation can complete asynchronously. Run get-dependency-insights again if the returned status is IN_PROGRESS.
The checkout service produced five insights across 29 dependencies. The following response shows the generated overview and all five findings:
The first finding identifies a cross-Region Amazon DynamoDB dependency. If checkout requires that dependency to accept orders, a disruption in the remote Region could prevent it from operating even when its Amazon EKS resources remain healthy. The service owner should verify which operations require the table and review how those operations behave when it is unavailable. That review determines whether the dependency fits the recovery design or whether the architecture needs to change. DNS activity alone cannot answer that question.
The uneven-usage finding points to container image infrastructure. Image downloads during pod startup can produce bursts of DNS activity. This is a pattern to investigate, rather than evidence that your application has an outage.
Classify a dependency as hard if the service fails without it, or soft if the service degrades but keeps running. In the sample environment, we had classified the DynamoDB dependency as hard using the following command. The comment describes an illustrative failure assumption, which requires validation through testing:
Resilience policy sharing through AWS Organizations
After reviewing checkout’s dependencies, the service owner can validate its recovery requirements with the business and the central site reliability engineering (SRE) team. Dependency findings inform that discussion. They don’t automatically determine the policy targets.
The central SRE team can codify the agreed requirements into a resilience policy, defining availability and recovery targets for critical services. The management account or a delegated administrator can share that policy across the organization so service owners can apply the centrally maintained requirements without creating separate copies.
The policy owner can review attachment and detachment events to track adoption. If a service stops using the policy, the SRE team can engage its owner to understand why and determine whether different requirements are appropriate. Application owners remain responsible for meeting the targets.
How it works
A policy can combine four target types: availability, recovery from an Availability Zone disruption, recovery from a Regional disruption, and data recovery. The recovery time objective (RTO) specifies the targeted recovery time. The recovery point objective (RPO) specifies the tolerable period of data loss.
When sharing is on, the policy appears in every member account alongside the account’s own policies, and its ARN shows which account owns it. Each service owner chooses whether to apply it. If a requirement must apply regardless of that choice, associate the policy with a system containing the relevant services instead, as described in Applying resilience policies across accounts.
The owning account can review a timeline of the services that start or stop using the policy. Turning sharing off stops evaluating member services against the policy and removes it from the services that used it, so coordinate changes with the teams involved.
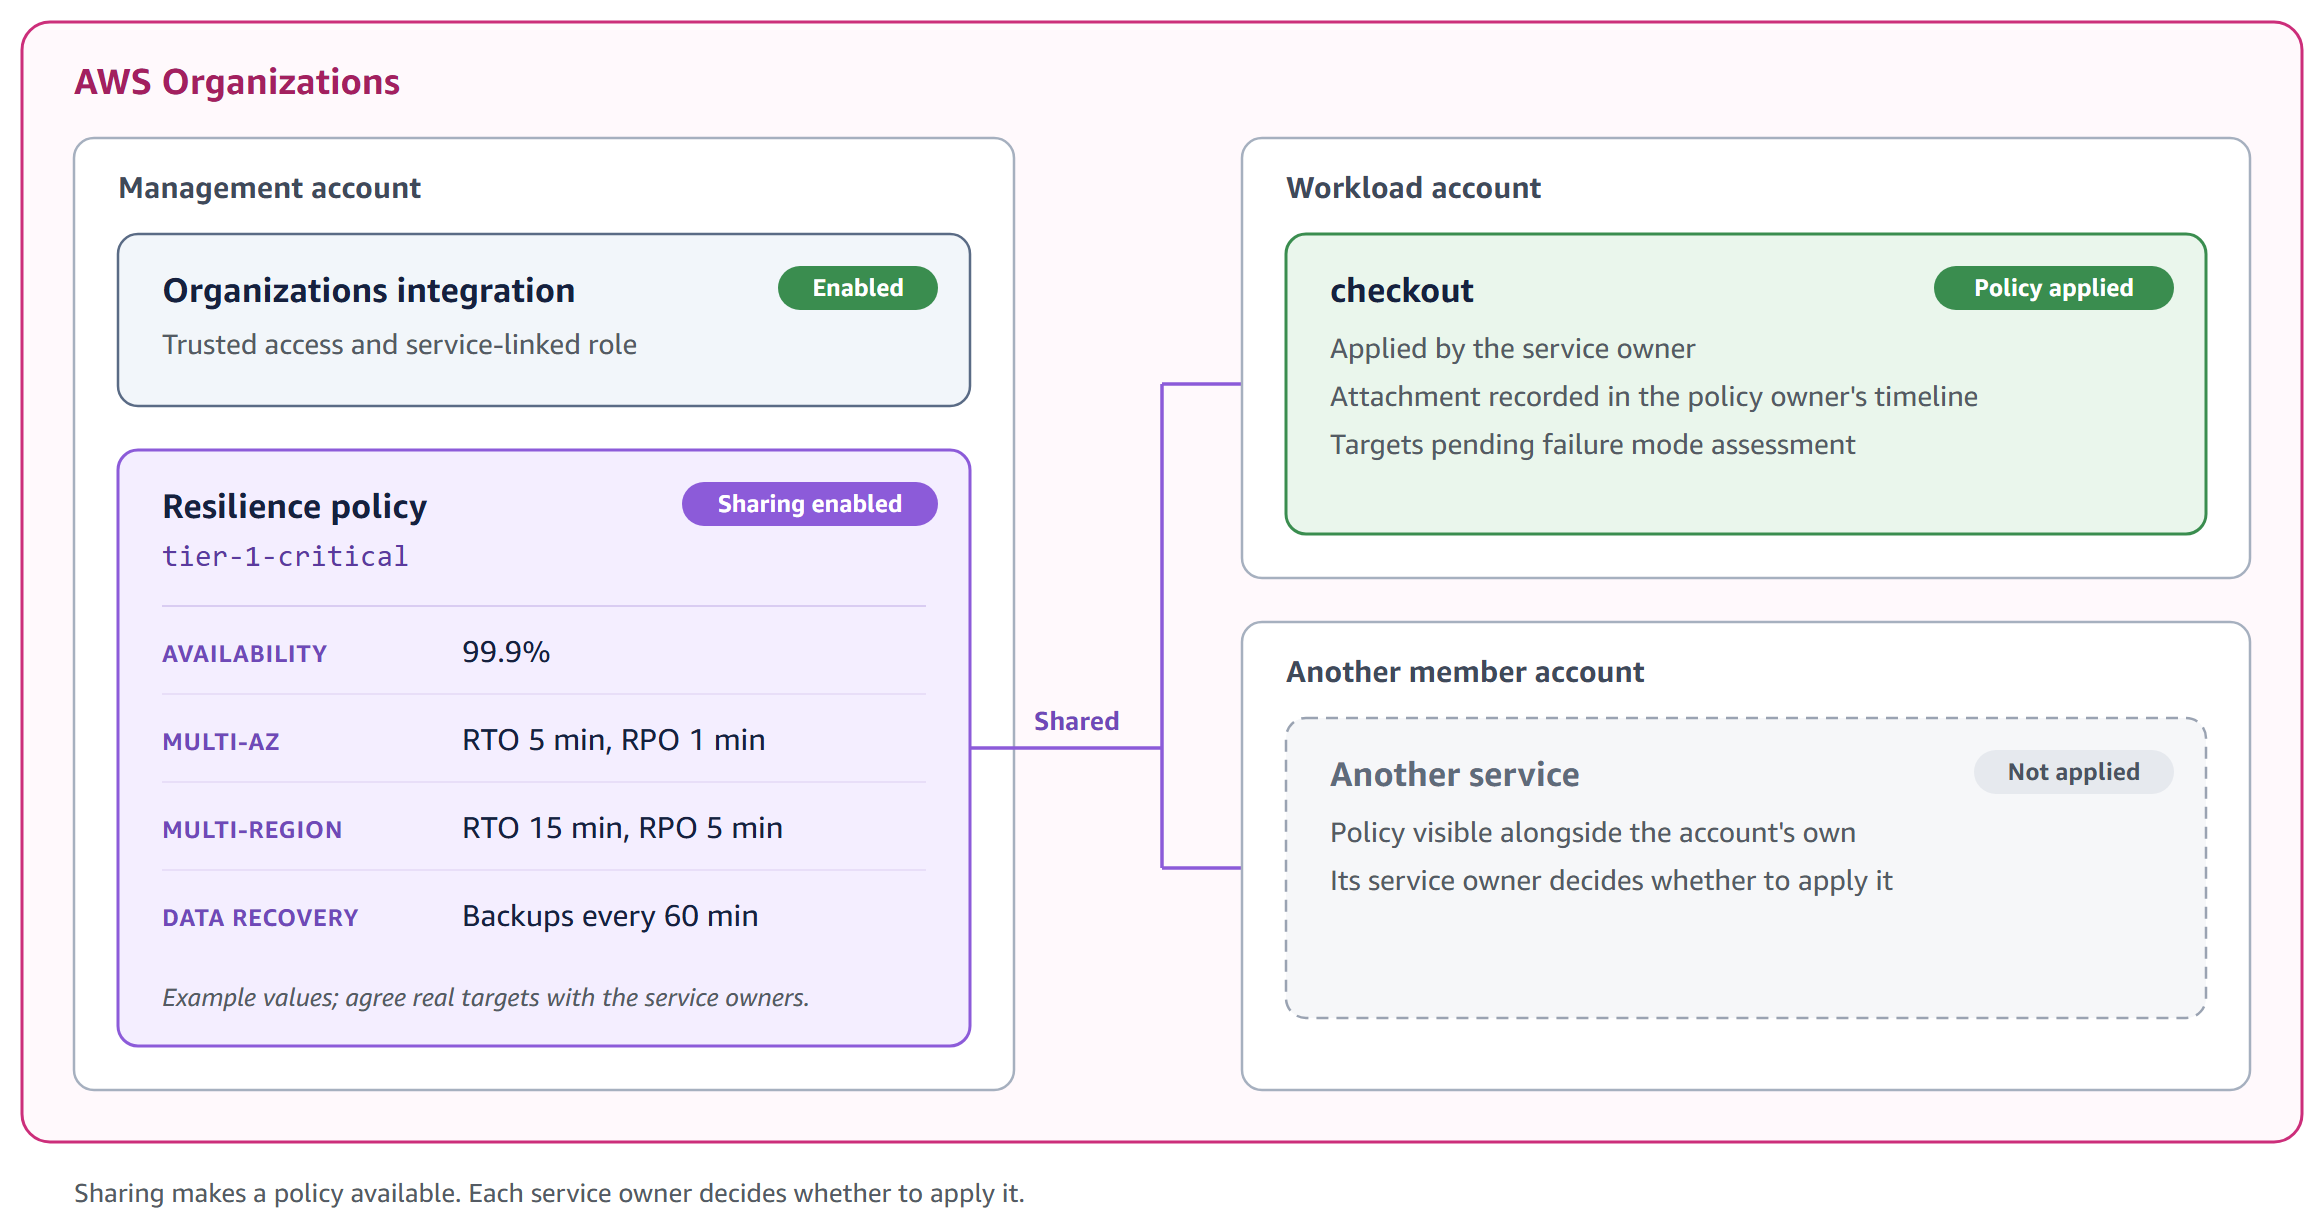
Figure 5: One policy definition, shared with member accounts
How to use it
The organization integration is a one-time setup in the management account:
- In the Resilience Hub console, open AWS Organizations settings.
- Select Enable trusted access and create a service-linked role, then choose Create integration.
To confirm that the service-linked role exists in a member account:
Next, create the policy in the management account with sharing turned on. Policy names can contain letters, numbers, hyphens, and underscores, but no spaces. The following targets are examples. Agree on real values with the business and service owners. This example uses an availability target of 99.9 percent.
In the workload account, find the shared policy and apply it to the service. On the console, choose Change policy on the service and select the shared policy. With the AWS CLI:
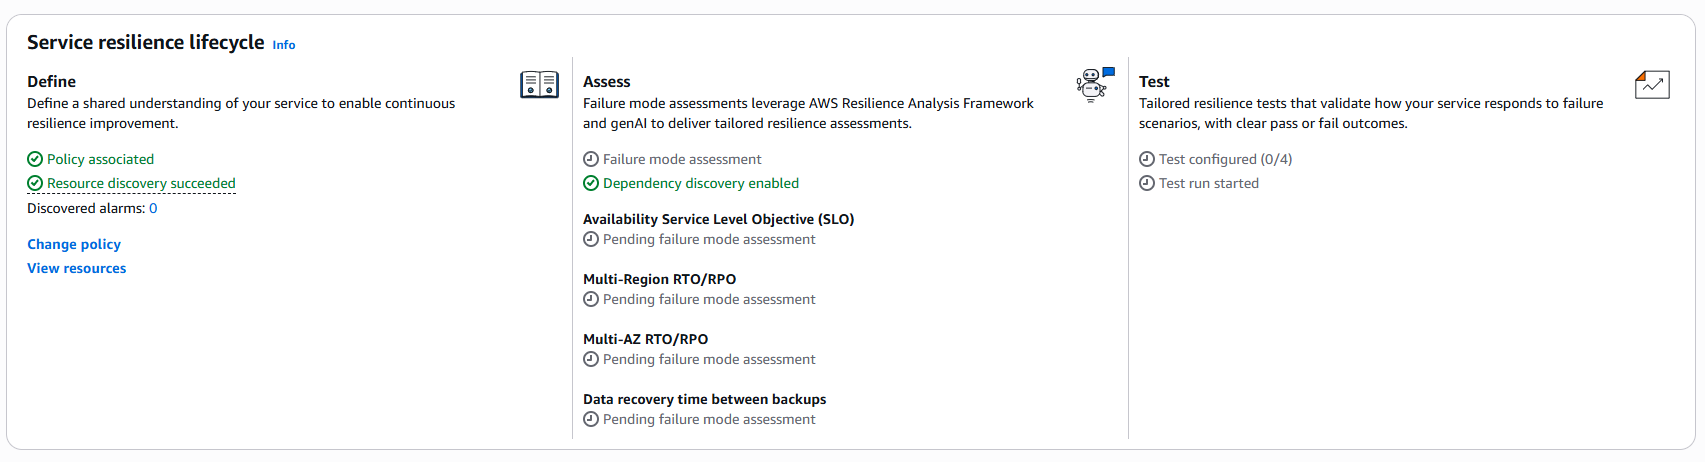
Figure 6: Policy targets are defined. Assessment of those targets is still pending
Back in the management account, the policy owner can confirm adoption:
An attachment event confirms adoption, not compliance. After we applied the shared policy, the console changed each target from Not defined in policy to Pending failure mode assessment. A failure mode assessment and appropriate resilience testing are needed to determine whether the service meets those targets.
Things to know
- Shared clusters. Labels decide which Kubernetes objects belong to a service. On a cluster that several workloads share, review the discovered dependencies to confirm they belong to the service, as described in the guidance for shared EKS clusters.
- What DNS-based discovery can’t see. Connections made directly by IP address aren’t discovered, AWS Lambda functions need VPC connectivity to be covered, and very infrequent calls might not appear in initial results. See Coverage and known limitations.
- Timing. Results reflect the history available to the service. Give a new workload time to build history before drawing conclusions from its insights. You can regenerate insights once every 24 hours.
Cleanup
If you created resources to try these capabilities, remove them when you finish. Turning sharing off also removes the policy from every member service that uses it, so only do this for a demonstration policy:
Delete the EKS cluster as well if you created it only for this walkthrough.
Conclusion
Start with a service whose architecture and ownership you know. Use EKS labels to check its Kubernetes resource boundary, then review Dependency Insights against its intended behavior. If several teams maintain the same requirements separately, consider a shared policy.
You can use the capabilities together or independently. Label support applies to EKS workloads. Dependency Insights and policy sharing also support services beyond EKS. Insights focus the investigation. Your architecture review determines what to change.
Further reading
- What changes with Next generation Resilience Hub
- Viewing discovered dependencies
- Dependency Insights considerations
- Sharing a policy across your organization
- Setting up Organizations integration
About the author
Should Elon Musk and Jeff Bezos Work Together to Get to the Moon?
Post Syndicated from The Atlantic original https://www.youtube.com/shorts/e3gljKiS2xA
Part 2 – Cybersecurity journeys: What even is this job?
Post Syndicated from Shannon Brazil original https://aws.amazon.com/blogs/security/part-2-cybersecurity-journeys-what-even-is-this-job/
If you’ve ever looked at a list of cybersecurity jobs and felt like none of them fit you, you might just be looking at a short list. Most career guides cover the same few roles, like the analyst watching alerts or the pen tester (penetration tester, someone hired to legally break into systems to find weaknesses) looking for a way in. Those jobs matter, but they’re a small slice of a field with room for a lot of different skills. The three people in this post do work you probably won’t find in those guides, and none of them started out qualified for it. What they had in common was a willingness to aim at something before they were ready and to build the skills on the way there. If you’ve ever talked yourself out of a role because you didn’t tick every box, their stories are worth a few minutes, because the move each of them made is one you can make too.
In Part 1: I didn’t plan this, I shared how three people found their way into security from a warehouse floor, a marketing desk, and a teenager’s bedroom. This week is about where people end up after they’re inside. I’ve been in security for over a decade, and while putting this series together I kept running into work I hadn’t come across before: measuring the risk of a million applications at once, building detection tools from the customer service side of the house, and thinking seriously about how to secure infrastructure that’s being launched into orbit.
The skill tree

Jason Lane, Security Engineer
When Jason Lane told me he plans his career like a Dungeons & Dragons character build, I assumed he was being metaphorical, but he meant it literally. “Think of it like a video game skill tree,” he said, and then walked me through the whole framework. You start by picturing your level 20 character, the version of yourself with the skills and the role you actually want, and then you work backward. At level 19, what choices get you to 20? At level 18, what needs to be true so you even have those options? You keep stepping back until you’re standing at level 1, looking at a path you built from the top down.
For Jason, level 20 was vulnerability research (finding unknown security flaws in software before attackers do). At the time he was a systems administrator, keeping servers and networks running, which gave him a solid grasp of how systems fit together but little exposure to picking apart the applications on top of them. That gap, application security, was the next node on his tree, so he called an IT recruiter, laid out his plan, and was honest about where he stood. The recruiter found a credit card processing company that needed an application security engineer and was open to someone who wasn’t one yet. For Jason it was a paid apprenticeship in the exact skill he was after; for the company it was a motivated engineer who would grow into the role. He describes it as a deal where both sides got what they needed, and that framing matters: he wasn’t settling for less, he was trading a steeper learning curve for a faster path to where he wanted to be.
He spent 4 years there taking applications apart to understand what made them breakable, and when he had learned what that role could teach him, he applied the same framework again. A friend offered to get him an interview at Google, and Jason’s honest reaction, that he wasn’t smart enough to work there, is the kind of self-doubt most of us recognize (also known as imposter syndrome). His friend didn’t buy it, the interviewers didn’t either, and they hired him. The lesson he took from it is one worth borrowing: the voice telling you that you don’t belong in the room is often wrong, and the way to quiet it is to put in the work until the skills speak for themselves. He went on to spend nearly 7 years doing Android vulnerability research, the kind of deep technical work most companies don’t have the budget for.
That track record opened the door to Amazon. When the team that measures application risk interviewed him, the hiring manager’s pitch was simple: we could really use your vulnerability research experience. Years of tearing systems apart to find what made them breakable turned out to be the perfect background for judging which systems were most at risk. Today, Jason measures risk across roughly a million applications at Amazon, evaluating which ones would cause the most damage if compromised and which are most likely to be targeted, so the organization can focus on the most dangerous ones first. When his manager recently presented the team’s work to a new senior leader, the example he used was a project Jason had built from scratch. Jason’s name wasn’t on the slide, and he told me he didn’t need it to be, but you could hear the pride in his voice.
When I asked what he’d tell someone with a big vision and no idea where to start, he said to get obsessively clear about where you’re going, because the gaps will show up on their own. He compared it to planning a 100-mile trip and realizing you aren’t wearing shoes; once you see it, you can’t unsee it. And if it turns out the dream is really a hobby, he’s at peace with that too.
| “If you can wait for Saturday, maybe you should just wait for Saturday. There’s nothing wrong with that.” —Jason Lane |
If you’ve been waiting for someone to hand you a career ladder, Jason’s approach offers another option: decide where you want to end up, and let that tell you what to learn next.
Full circle

Jason Goodman, Security Engineer
Where Jason Lane planned his career from the finish line, Jason Goodman’s career has looked more like a pinball machine, bouncing through three security disciplines in about a year and picking up new skills along the way.
The foundation was laid long before he knew it. Eight years ago, before Amazon acquired Ring, he was working in customer service, troubleshooting doorbells and helping customers with their accounts, and before that he sold computers at Best Buy. “That was the most tech I had,” he told me, grinning. What pointed him toward security was partly a nudge from his father-in-law, who worked in IT, and partly what he was seeing on the phones every day: the occasional account access that didn’t look right, the quiet signals that something might be off. Those patterns made him want to understand the systems behind them, so while he was still in customer service he went back to school for a cybersecurity degree.
He didn’t wait until graduation to start building toward the move. He reached out to the manager of the internal threat team (the people who look for misuse of access from inside an organization) and asked a question anyone can ask: what could I do to keep progressing while I’m in school? That turned into stretch projects, and here is the part worth noticing, he earned the bigger ones by delivering the smaller ones first. His standout project was a fraud prevention dashboard that helped the team spot potential misuse of customer account access, a blind spot nobody had flagged. He had the credibility to be handed it because he’d already shown up for the low-stakes work, and it opened the door to his first security engineering role on that same team.
From there he moved to an adversarial threat detection team (the people who watch for outside attackers trying to get in), which meant flipping his mindset overnight: instead of asking what someone on the inside could do with their existing access, he was now asking how someone on the outside would try to break in. A later move took him into application security, where the work shifted from responding after the fact to building security into processes from the ground up.
| “I’m in my third discipline in a year since transitioning out of customer service into security engineering.” —Jason Goodman |
What I find fascinating is how much carried over from one role to the next. The Splunk queries (Splunk is a tool for searching and analyzing large volumes of log data) he learned in customer service carried into internal threat work, the detection logic from insider investigations carried into adversarial detection, and now in application security he has come full circle, working alongside the same customer service teams he started with, except this time he’s helping build the security around them.
Through all of it, he has leaned on four different mentors, and the way he found them is worth stealing. Finding one mentor who truly invests in you is hard; finding four is rare. Jason didn’t wait to be assigned anyone. He reached out to people whose work he admired, starting with that internal threat manager during school, asked specific questions, and stayed in touch over the years as he grew. Each mentor served a different purpose: one for navigating school, one for stretch projects, one for learning to think like an adversary, and one for getting grounded in application security. “I’ve always felt like I could take at least a little nugget from each one of them,” he said. Next on his list is offensive security, meaning pen testing and red teaming (simulating real attackers to test how well an organization defends itself). He figures starting on defense was the right call: learn what attackers do and how to stop them, then learn to think like one.
If your current role feels unrelated to security, Jason’s story is a good reminder that the skills you’re building now may be exactly the ones your first security job needs. The analytical habit of noticing when something is off, the patience to explain a problem clearly, even the instincts you pick up from a completely different field all transfer. The trick is learning to name what you already have and point it at the work you want.
The edge of the map

Harshvardhan Chunawala, Solutions Architect, AWS Startups
Harshvardhan Chunawala was still in high school when he started finding security flaws in real products and reporting them to the companies that built them. He had started out building websites and web applications, and after he understood how software was put together, he couldn’t stop wondering how it could be pulled apart. Rather than wait until he had a degree or a job to explore that, he began poking at real products on his own, and when he found a flaw he contacted the company and worked with them to fix it.
Today he advises startup founders at AWS on security and volunteers his time to teach cloud and security courses to students, who often ask him where to start when entry-level work is being automated. His answer has changed over the years. Now that generative AI can answer the surface-level questions, he believes curiosity matters more than credentials, because the people who stand out are the ones who keep asking questions after the tool runs out of answers.
| “AI tools put everyone on the same starting line. Interest and passion has become the driving force.” —Harshvardhan Chunawala |
What surprised me most, though, was where his own curiosity took him. While studying at Carnegie Mellon University (CMU), he ended up working on space missions, including time as a mission operator for the Iris lunar rover (Iris and CMU’s next rover, MoonRanger, appear with him in the photo above). If you had asked me a few years ago whether security belonged anywhere near a rover on the Moon, I wouldn’t have known what to say, but Harshvardhan would have answered right away: anything that can be commanded remotely can be commanded by the wrong person.
When I asked about the future of security, he took the conversation completely off the map. He talked about robots entering people’s homes and about data centers moving from land to underwater to space. A satellite has to be protected in orbit, where nobody can physically reach a compromised system, and on the ground, where the stations that command it are targets too. “So are cyber security specialists going to go under astronaut training?” he asked, grinning, and he was only half joking. He has already written a two-part guide to incident response for satellite operations on AWS, so for him, this corner of the map is already part of the job.
If you’re drawn to an area that doesn’t look like a security job yet, Harshvardhan’s story is worth taking seriously: the move he keeps making is to follow a question past the point where the easy answers run out, into territory nobody has fully mapped. You don’t need a satellite to do that. Pick the corner of technology that genuinely fascinates you, start asking how it could be attacked and defended, and you might find you’re standing at the edge of a role that doesn’t have a name yet.
The thread
These three stories share one thread: the job you end up loving might be one you haven’t heard of yet. Jason Lane mapped his moves in advance, Jason Goodman carried his skills through three disciplines in a single year, and Harshvardhan is already helping AWS customers secure satellites and the ground systems that run them. None of them could answer “what do you do?” in a single sentence, and I suspect that’s true for a lot of people doing interesting work in this field.
If you’re curious about the roles that exist beyond the ones you already know, here are a few places to start exploring:
- The NICE Workforce Framework for Cybersecurity lays out dozens of security work roles and the skills each one needs
- CyberSeek offers an interactive career pathway map showing how entry-level roles connect to advanced ones
- AWS Skill Builder has free security and cloud training you can start today
- CISA’s Cybersecurity Awareness Month page has more resources for this October
In Part 3: The work behind the work, we pull back the curtain on what the day-to-day of security actually looks like compared to what people imagine.
Have you found a corner of security most people don’t know exists? Share your story on LinkedIn!
Resolving concurrent write conflicts for Apache Iceberg tables in Amazon Redshift
Post Syndicated from Sanjay Devireddy original https://aws.amazon.com/blogs/big-data/resolving-concurrent-write-conflicts-for-apache-iceberg-tables-in-amazon-redshift/
In Getting started with Apache Iceberg write support in Amazon Redshift – Part 1, you learned how to create Apache Iceberg tables and write to them with INSERT. In Part 2, you modified data at the row level with DELETE, UPDATE, and MERGE. Both posts assumed your write had the table to itself. In production, that is rarely true: streaming jobs, scheduled pipelines, and one-time transformations frequently write to the same table at the same time. Amazon Redshift now resolves many of these concurrent writes automatically, committing changes that previously failed and were forced to retry. In this post, we explain why concurrent writes to Iceberg tables conflict, how Amazon Redshift resolves the conflicts that don’t actually overlap, how the engine escalates its checks from operations to partitions to individual files, and the throughput improvement it provides.
The challenge of concurrent writes
Apache Iceberg uses optimistic concurrency control (OCC) to keep a table consistent when more than one writer commits at the same time. Each writer prepares its changes against the table’s current version and commits by atomically advancing the table version in the catalog, on the condition that no other writer advanced it first. If another writer commits in the meantime, the condition fails and the entire write is discarded. This strictness maintains snapshot isolation semantics: if the later commit were applied anyway, it would replace the table version without the earlier writer’s changes, silently losing a committed write.
Readers don’t encounter this problem. An Iceberg scan always reads a committed snapshot, so a read is never invalidated by a concurrent write. That leaves write-write conflicts as the only case the engine must resolve, and resolving them correctly is what preserves snapshot isolation semantics for the table.
The problem is the bluntness of this check. The condition is evaluated against the table version, not against the rows or partitions each writer touched. At that grain, its answer is correct in that the version really did change. However, it says nothing about whether the two writes overlapped in the data underneath. Two writers that modified entirely separate partitions, or that independently inserted new data, conflict exactly as hard as two that rewrote the same rows. This happens whenever their query-start-to-commit windows overlap.
Consider a retail analytics platform with a customer_orders Iceberg table. A streaming pipeline might land new orders continuously with hundreds of inserts a minute. A nightly compliance job deletes records older than seven years, and takes about an hour to run. The two writes never touch the same data: the stream only adds recent orders, and the compliance job only removes old ones. Under basic optimistic concurrency, that doesn’t matter. If a single streaming insert commits at any point during that hour, the compliance job loses the race, its hour of work is discarded, and the next attempt re-scans terabytes of data only to re-enter the same race. The table version conflict was real even though the data conflict was not.
The common ways to avoid this are all manual, and each carries a cost. You can serialize your writers so that only one commits at a time, which gives up concurrency entirely. You can split a single logical table into several physical tables so that no two writers ever share one. This trades a clean data model and the ability to query across them for the ability to write in parallel. Or you can wrap every write in an application-side retry loop and absorb the cost of re-running statements that never actually conflicted. In each case, the effort goes toward working around the commit protocol rather than toward your data.
How Amazon Redshift resolves write conflicts
When a commit loses the race, Amazon Redshift now asks a more precise question before giving up: Did the writers that committed ahead of it actually change the same partitions or files or rows it changed? When the answer is no, there’s no reason to discard the work. Instead of aborting, Amazon Redshift rebases the change (similar to git rebase), replaying the already-prepared write onto the latest version of the table and committing that result. Both writes land, with no re-scan, no re-execution, and no retry loop in your application.
In the retail example, the compliance delete previously failed the moment a streaming insert committed inside its execution window. Now Amazon Redshift examines both writes, sees that the inserts only added data files while the delete only removed others, and confirms they never touched the same data. Because the changes are provably independent, Amazon Redshift rebases the delete onto the updated table version and commits it. Both writes succeed, the hour of work is preserved, and downstream consumers see both changes.
This behavior is automatic for eligible writes, with no clustering keys to choose, no repartitioning, and no setting to enable. When two writes genuinely conflict, the behavior is unchanged from today: the conflict surfaces and the later writer fails and must retry.
Two principles govern how the resolution works. The first is that a conflict is a matter of granularity. A failed race isn’t automatically a conflict. It’s a question that can be asked at different resolutions. The engine can ask whether any writer removed data at all or whether they only added it, and if data was removed, whether it came from the same partition, the same file, or the same rows that the current write touched. The finer the granularity examined, the more apparent conflicts turn out to be independent changes that can safely coexist. But finer checks also cost more: taken to the limit, the engine could intersect two change sets row by row, and that is expensive and usually unnecessary. So Amazon Redshift evaluates the least expensive level first and examines a finer level only when it must.
The second principle is that correctness takes precedence over concurrency. Conflict resolution works entirely from table metadata and never re-scans data or re-plans a query. When the engine can’t prove that two writes are independent, it doesn’t guess. It declines to resolve the conflict and the write retries, exactly as it would today. An unnecessary retry costs a small amount of time, whereas an incorrect resolution risks losing data, so the system is deliberately biased toward the safe outcome. Resolution operates under snapshot isolation, the same model Amazon Redshift already uses for Iceberg reads. Engines such as Apache Spark, Amazon EMR, and Amazon Athena honor it through the table’s isolation-level property, so a table shared across engines retains consistent semantics. For tables whose write isolation property is set to serializable, Amazon Redshift preserves the stricter contract and surfaces every conflict rather than resolving it. This is the Iceberg table property write.*.isolation-level. It’s unrelated to the Amazon Redshift database isolation level set with ALTER DATABASE … ISOLATION LEVEL, which governs Amazon Redshift transactions and has no effect on Iceberg commit conflict resolution.
Resolving at the right granularity
When a commit loses the race, the engine escalates through a sequence of checks, from the cheapest to the most precise. Each level is a complete resolution on its own and if a check proves the writes independent, the rebase commits and no finer check runs. The following diagram shows this escalation sequence: an operation-level check first, then partition-level, then file-level. Each level either proves the writes independent or escalates to the next, and a genuine conflict surfaces only after the last.
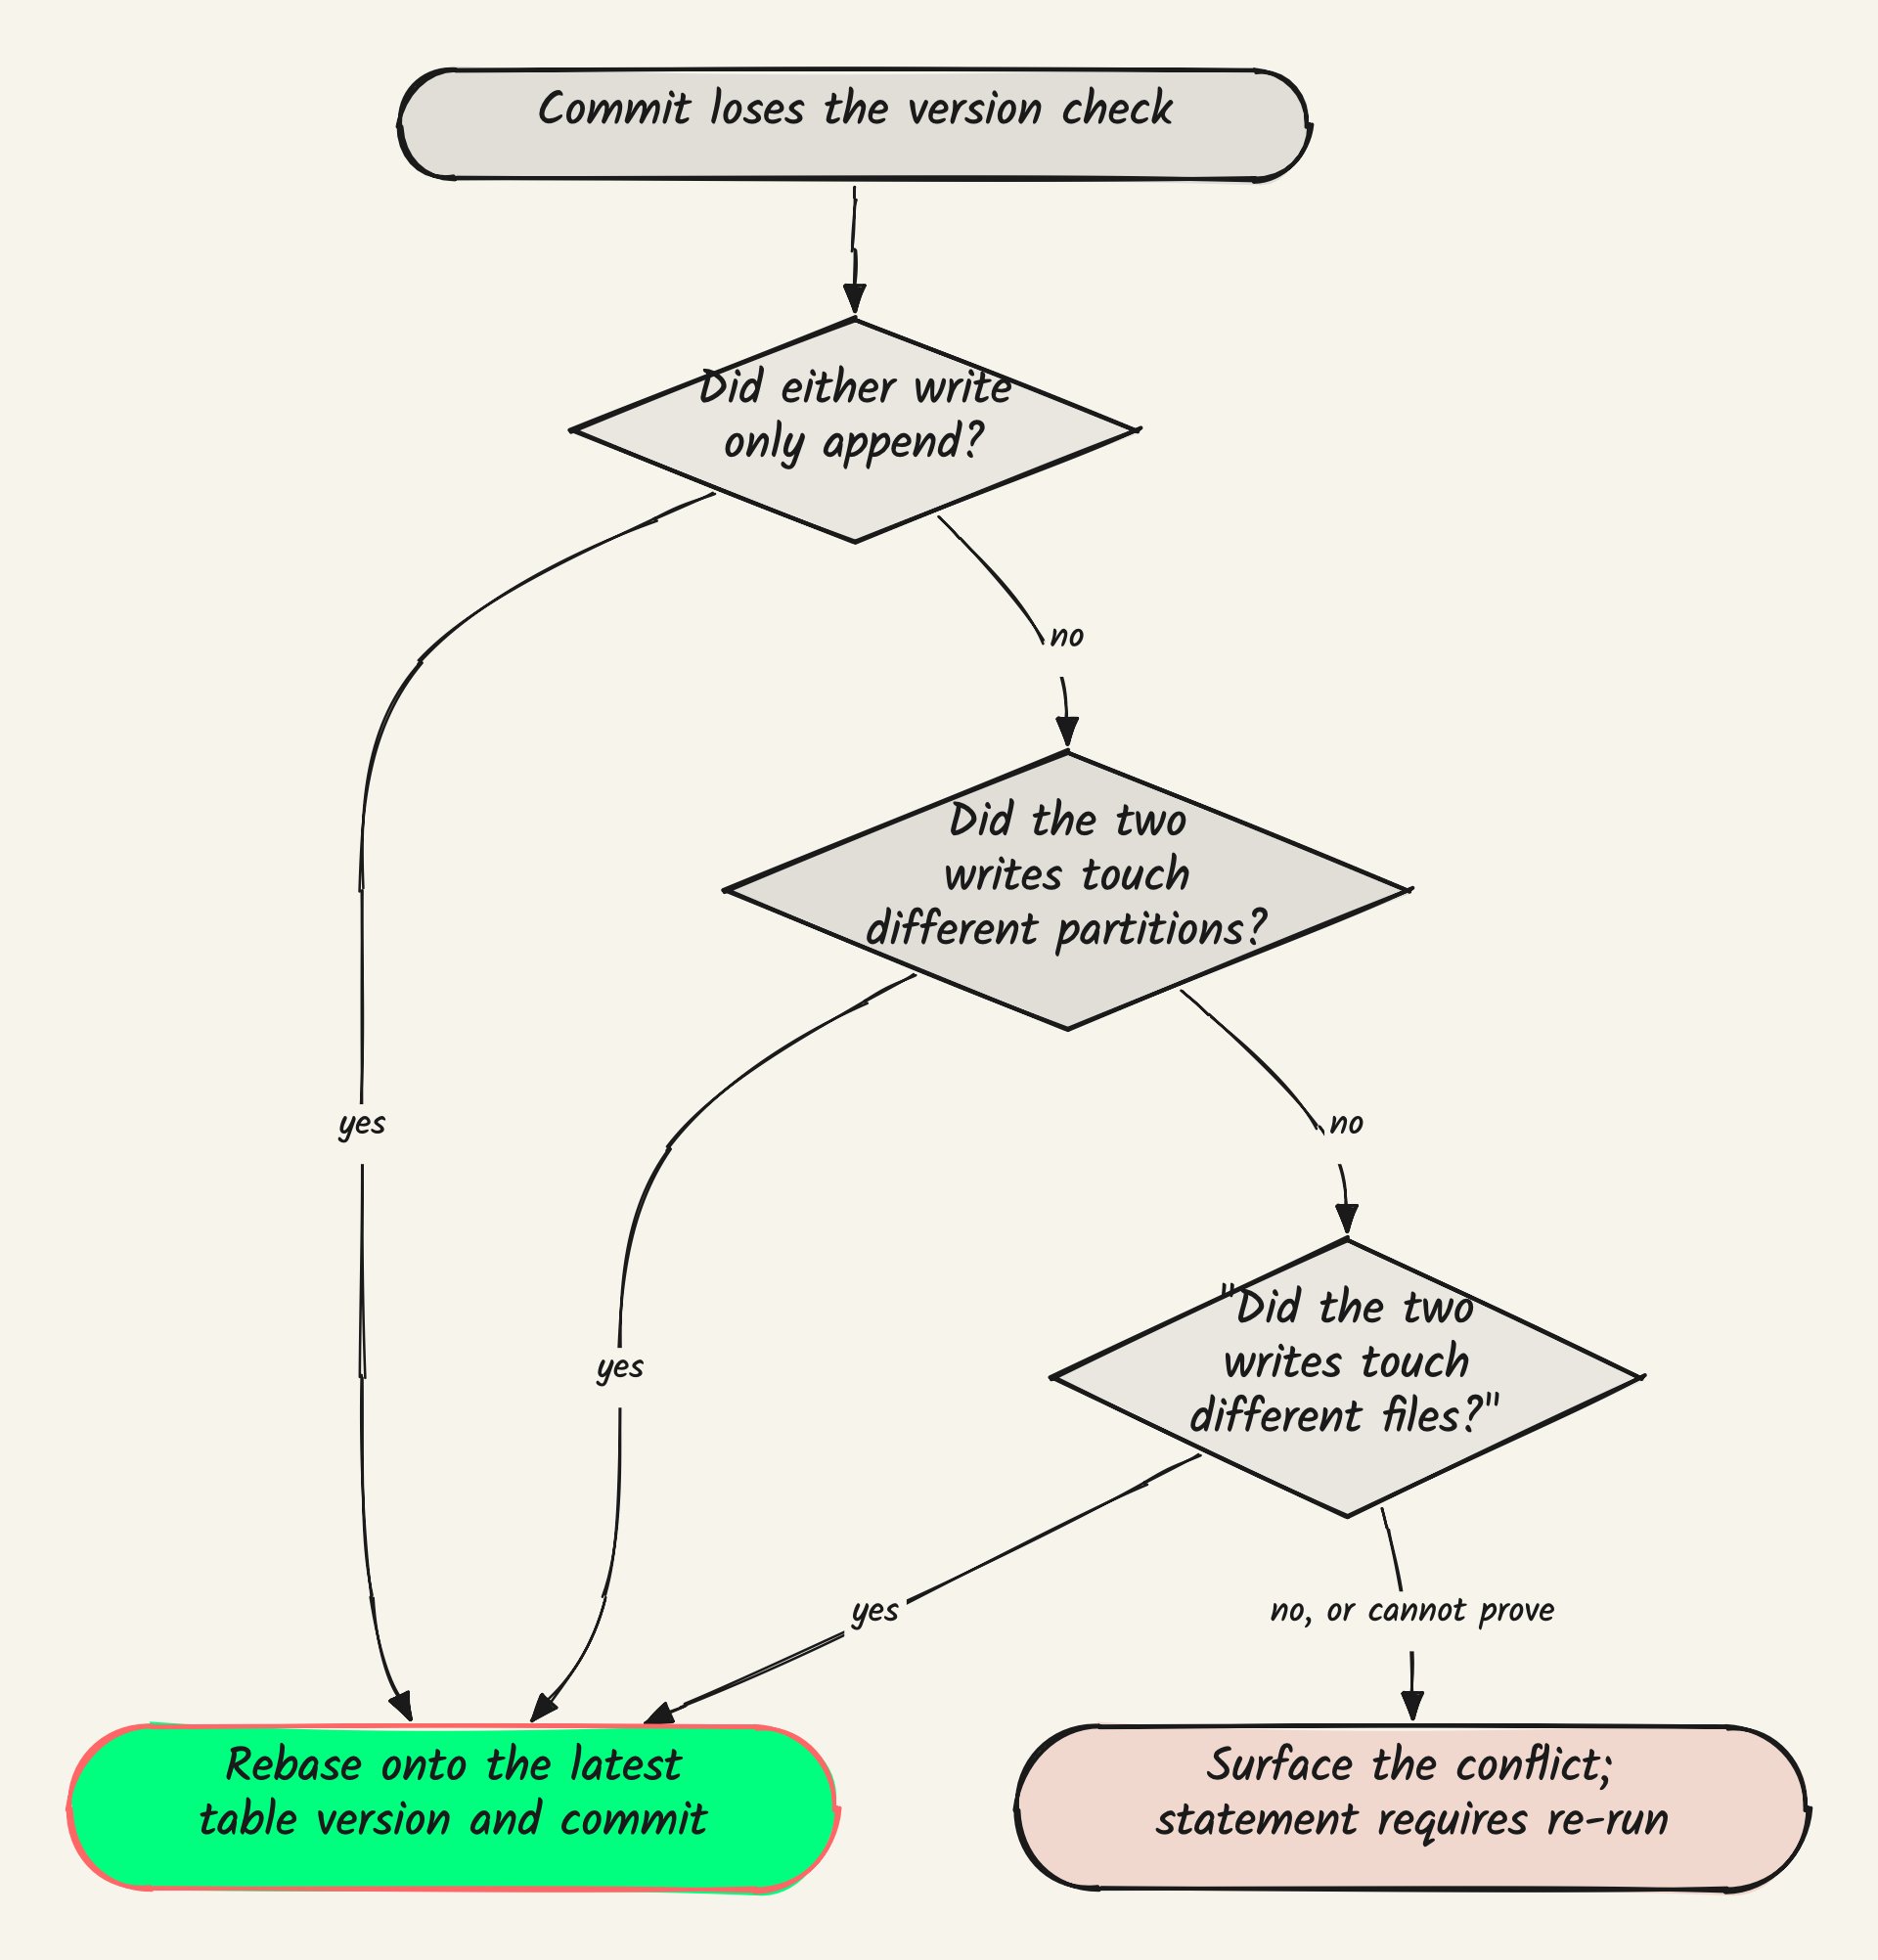
Figure 1: The conflict-resolution escalation from operation-level to partition-level to file-level checks
The first check is by operation. A write that only added data, for example an INSERT consisting of new data landing from a streaming job, can’t have removed anything another writer relied on, so any write can be rebased against it. This single rule resolves every combination in which at least one of the two writes only appended. A DELETE, UPDATE, or MERGE commits cleanly against a stream of concurrent inserts, and an INSERT commits cleanly over any other concurrent change, including a compaction.
Next, when both writes removed data, the engine compares the partitions they each touched. Writes that modified disjoint partitions, for example batch jobs updating different dates or per-Region pipelines maintaining their own slices of one table, are independent by construction and both can commit cleanly.
Finally, when both writes touch the same partition, the engine compares the individual files that each one changed. Two jobs deleting different rows of the same date partition usually land in different files, and when they do, both can commit cleanly. Only when two writes modified the same file does the conflict surface and the statement re-run. The protocol additionally has headroom for one further level: distinguishing changes to different rows within a single file.
The following table summarizes the outcomes by operation pair. Read down for the concurrent write that committed first, and across for your write.
| Your write ↓ / Concurrent write → | INSERT |
DELETE / UPDATE / MERGE |
Compaction | ALTER |
|
| 1 | INSERT |
Resolves | Resolves | Resolves | Re-run required |
| 2 | DELETE / UPDATE / MERGE |
Resolves | Resolves based on partitions or files touched. A same-file change surfaces as a conflict | Resolves based on partitions or files touched. A same-file change surfaces as a conflict | Re-run required |
| 3 | ALTER |
Re-run required | Re-run required | Re-run required | Re-run required |
Performance
To measure the effect, we ran an increasing number of concurrent writers committing to a single Iceberg table over a fixed window. We compared basic optimistic concurrency mode, where a losing commit is aborted and re-runs, against automatic conflict resolution mode being enabled. Every writer issued the same single-statement INSERT, so the only variable across the various runs was contention rather than workload. We scaled 1–16 concurrent writers and recorded, for each configuration, how many commits succeeded and how many were rejected as conflicts.
Setup: one unpartitioned Iceberg table registered in the AWS Glue Data Catalog in the US East (N. Virginia) AWS Region (us-east-1). Each writer is an independent session issuing autocommit INSERT statements in a loop over a 60-second period. We report the commits completed and the attempts rejected as conflicts for each configuration.
The first figure shows write throughput as writers are added, normalized to the single-writer case so the comparison doesn’t depend on instance type or table size.
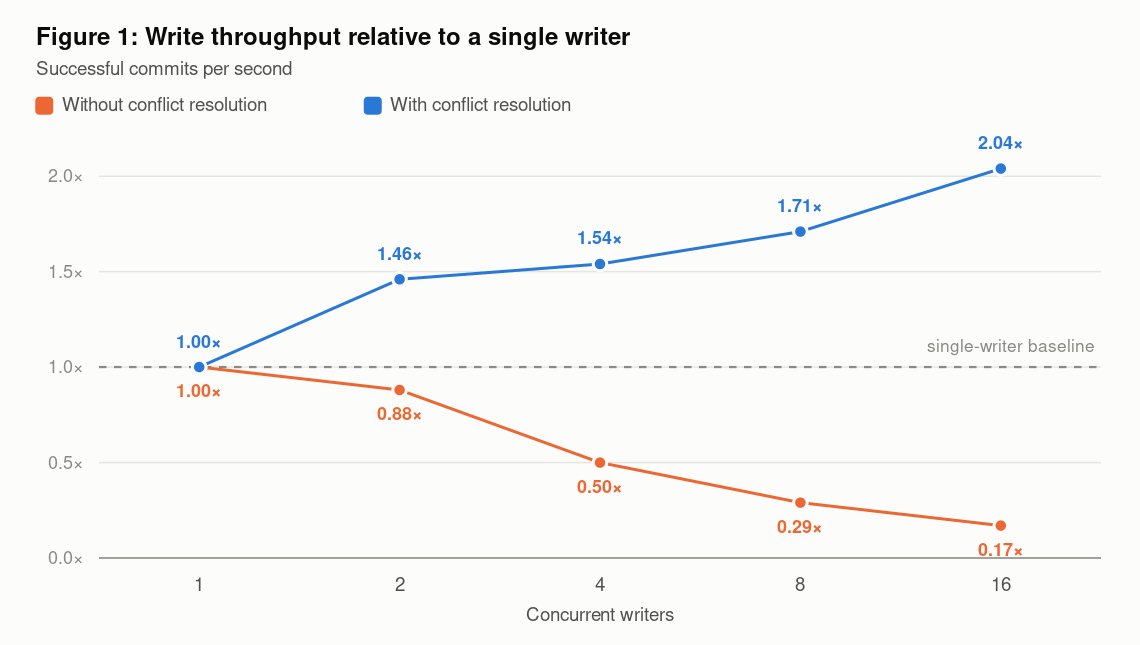
Figure 2: Write throughput as concurrent writers increase, with and without automatic conflict resolution
Under basic optimistic concurrency, adding writers makes writing to the table slower. At 16 writers, throughput falls to 0.17× of a single writer, because nearly every writer’s work is discarded and redone rather than committed. With automatic conflict resolution the same workload scales to roughly 2×, and no commit is rejected in any measured configuration. At 16 concurrent writers, 12× more commits complete in the same window. The second figure shows why.
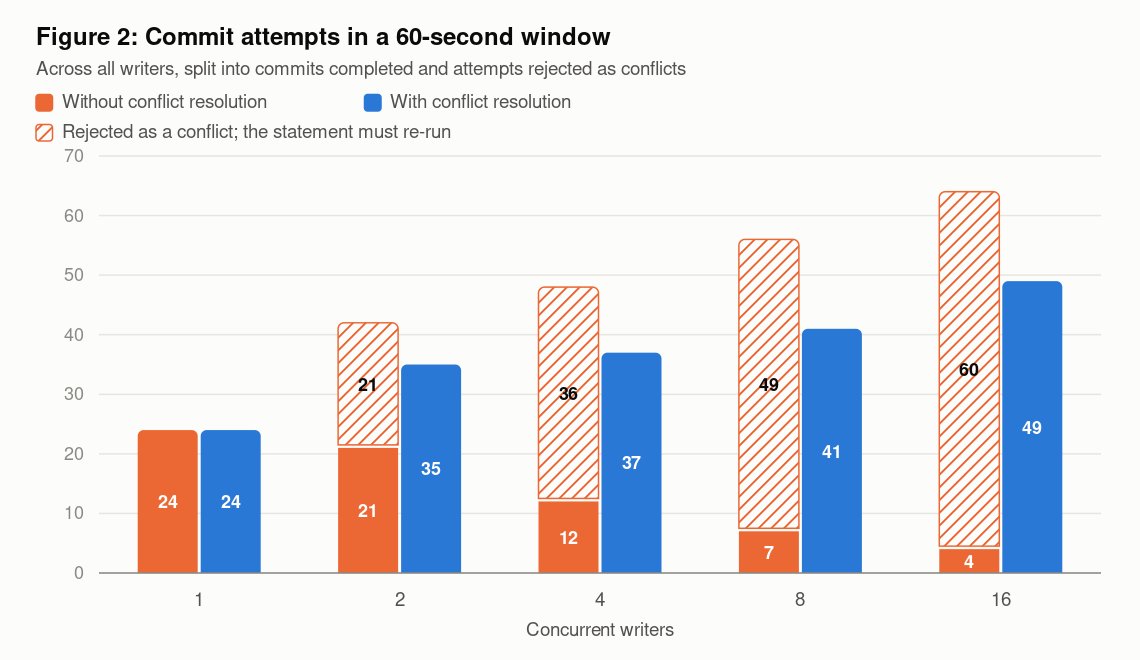
Figure 3: Commit failure rate as concurrent writers increase, with and without automatic conflict resolution
The baseline’s failure rate is almost exactly (N−1)/N, for example 50 percent at two writers, 75 percent at four writers, and 94 percent at 16 writers. This illustrates the table-level check that occurred previously: only one writer wins each commit round and every other writer in flight is rejected. Additional writers translate almost entirely into repeated work rather than progress. With conflict resolution enabled, the same runs record no conflicts at all, because every write in this workload is an append, and an append never removes data another writer relied on.
This benchmark isolates the most basic append case deliberately: a single unpartitioned table and insert-only writers, which is the pattern behind continuous ingestion. Workloads that remove data exercise the partition and file checks described earlier, where the outcome depends on whether the two writes touched the same partition and the same files.
Fleet Results
Before conflict resolution, concurrent-write conflicts were the single largest cause of failed Iceberg writes in Amazon Redshift, accounting for roughly one in five failed Iceberg write queries each week. We rolled out this feature in stages, beginning with the operation-level check that covers concurrent appends. As that stage reached full fleet deployment in early September 2026, conflict errors from concurrent writes dropped to nearly zero, even as Iceberg write volume on the fleet more than doubled. One residual spike shown below came from a workload issuing concurrent UPDATE statements, a conflict class that subsequent partition and file level checks will resolve as they deploy across the fleet.
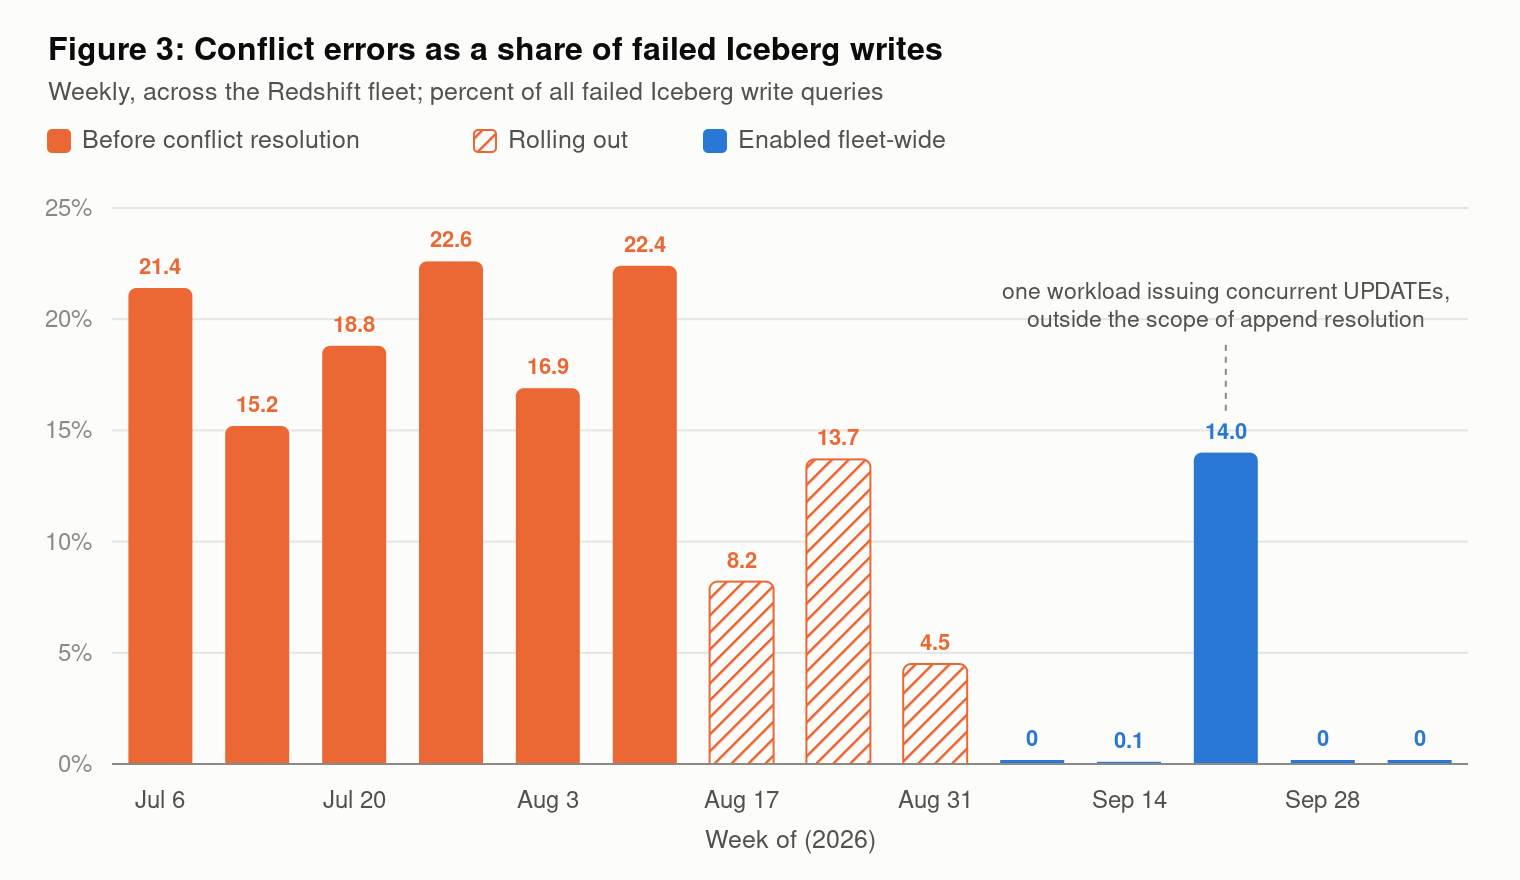
Figure 3: Conflict errors as a share of failed Iceberg writes
Observing conflict resolution
Every Iceberg commit attempt is recorded in the stl_iceberg_commit system table, including the outcome, the number of attempts, the concurrent operations the write rebased over, and the time spent rebasing. To see how often resolution is engaging on an example table:
Conclusion
Concurrent writes are a fact of production data lakes, and until now, they forced you to serialize writers, partition around the problem, or retry. With automatic conflict resolution, Amazon Redshift commits concurrent writes that don’t actually overlap. These include any mix of writes alongside concurrent appends, and row-level writes that changed different partitions or different files of the same table. To get started, write to your Iceberg tables from multiple jobs on patch 203 or later. Non-conflicting commits start to resolve on their own. To learn more about Iceberg write support in Amazon Redshift, see Part 1 and Part 2.
About the authors
Exploring AWS Lambda Web Functions for building web applications
Post Syndicated from Julian Wood original https://aws.amazon.com/blogs/compute/exploring-aws-lambda-web-functions-for-building-web-applications/
You can now run a standard Node.js web server on AWS Lambda with Lambda Web Functions, a new type of Lambda function. Deploy it with one command or AWS CloudFormation and get a public HTTPS endpoint with no adapter layer and no servers or load balancers to manage.
Lambda Web Functions suit server-side rendered web apps, REST and GraphQL APIs, streaming endpoints, and microservices. Building on the launch announcement, this post uses a sample application to show how one execution environment handles many requests at once and how the same app serves a global audience. See how active-CPU billing keeps the cost of waiting low while your code waits, with memory and requests billed separately.
Overview
Lambda launched in 2014 with a minimal model: upload your code, and the service handles everything else. For over a decade that code ran as an event handler, invoked once per event such as a batch of queue messages or an object landing in Amazon Simple Storage Service (Amazon S3). We now call this an Event Function and it remains the right choice for event-driven work.
Web Functions are a second type of Lambda function, running on the same Firecracker-based isolation as Event Functions. Instead of a handler that receives an event, your code runs as a standard HTTP server that listens on a port, which is what lets a web framework, or in this case a plain Node.js server, run unmodified.
A Web Function is made of three resources:
- Web Function is the top-level resource with a name and configuration.
- Revision is an immutable snapshot of your code and configuration which Lambda creates each time you deploy code or change revision configuration, so you can roll back by routing traffic to an earlier revision.
- Endpoint is a network entry point with a unique HTTPS domain, an authentication type, and the rules that route traffic to your revisions.
At launch, Web Functions run Node.js 24 on Arm64, with 2 vCPUs and 2 GB of memory per execution environment. Web Functions support Amazon Virtual Private Cloud (VPC) connectivity, allowing your function to access resources that exist within a VPC.
Walkthrough
Node.js frameworks that start an HTTP server, such as Express, Fastify, and Hono, run without adapters. Next.js in standalone mode needs a small index.js that sets its host and port. This post uses a plain Node.js server to stay dependency-free.
The full source is available in the Serverless Patterns collection along with other Web Functions patterns.
Prerequisites
You need an AWS account with the AWS Command Line Interface (AWS CLI) installed and configured and Node.js installed locally.
The pattern instructions show how to clone the repo and change to the pattern directory or download the pattern .zip file to run the example.
The app
The dashboard is a single Node.js HTTP server that streams live server metrics to the browser over server-sent events (SSE).
The runtime provides the address to listen on in the AWS_LAMBDA_HTTP_ENDPOINT environment variable, in host:port form. The server reads it and starts listening, exactly as it would anywhere else:
The runtime is nodejs24.x, and it loads index.js at the package root by default. To use a different entry file, set AWS_LAMBDA_NODEJS_ENTRYPOINT to its path.
Run locally
You can run the server locally with npm start.
Browse to http://localhost:3000/ to view the dashboard streaming from the local server.
Deploy
- Deploy using the single command:
For this example, you can also use
npm run deploydefined in thepackage.jsonfile.
The AWS CLI bundles your code, creates the function and an endpoint named dev with a live HTTPS URL. It also creates an execution role and a versioned S3 bucket, if one does not exist, that all CLI-deployed Web Functions in the Region share.
- Press Enter to create the resources.
The AWS CLI output shows the URL in the format: https://<id>.<shard>.lambda-web.<region>.on.aws
Figure 1: AWS CLI showing the aws lambda-web deploy command.
Browse to the URL and the dashboard loads, already streaming. This endpoint is public and the sample has no authentication, so use it for evaluation and delete it when you finish.
Figure 2: The app streaming dashboard showing function information.
The dashboard shows how long the execution environment has been alive and how many streaming connections it is holding open. It shows how much CPU it has used with a button to generate real CPU load on demand. The function runs in the US East (N. Virginia) Region (us-east-1). From my laptop in the United Kingdom, latency is 90 ms.
The dashboard updates every two seconds over a single HTTP streaming response. A Web Function environment is a long-lived process, so it keeps the connection open and keeps pushing data to the browser. The long-lived process can also run background tasks outside the main request path, such as emitting telemetry events.
An Event Function environment serves one request at a time. It can stream a response during an invocation, but each open stream occupies a whole environment. Lambda freezes the environment between invocations, so background work stops.
Active-CPU billing
If the environment stays alive for minutes at a time, what are you paying for? You pay for requests, consumed memory, and the CPU time the environment consumes. For this example, compare connection uptime with CPU time. The environment keeps running but uses only a fraction of a second of CPU.
Choose Generate CPU load, and the app runs a cryptographic hashing loop for about 1.5 seconds. CPU time climbs on the chart, then falls back to near zero when the work stops. When a request waits on a database, downstream API, or AI inference, your code uses little CPU, so the wait costs less than it would under wall-clock billing.
Figure 3: CPU chart mid-spike after choosing Generate CPU load.
For pricing details, read the AWS Lambda pricing page.
Concurrency and scale-out
With Web Functions, each execution environment handles many requests at once, not one at a time. As environments approach their concurrency limit, Lambda adds more environments and removes them again when traffic falls.
You can control how a Web Function scales. maxConcurrencyPerEnvironment sets the maximum number of requests each execution environment handles at once, up to 128, with a default of 64. On the endpoint, maxEnvironments caps the number of execution environments and rateLimit caps requests per second. You can use these two settings to protect downstream dependencies such as databases and external APIs. Both apply in each Region the endpoint serves and maxEnvironments applies to each revision. Requests above a limit receive HTTP 429 and are not queued.
Generate load on the app. Send 300 streaming requests to the /api/events endpoint, with up to 200 open at once, rather than a burst of quick responses.
Figure 4: Concurrency showing increased connections in a single execution environment.
The dashboard updates to reflect the active SSE connections and peak for the currently connected execution environment.
The runtime also writes a per-environment summary record to Amazon CloudWatch Logs every minute with the instance ID, request count, peak concurrency, and CPU time. A CloudWatch Logs Insights query aggregates them across the fleet:
From a sample run of 300 streaming requests with up to 200 open at once, the logs showed the following:
- Execution environments used: 5.
- Total requests handled: 484.
- Peak concurrency on a single environment: 59.
- Total CPU consumed across the whole fleet: 4.75 seconds.
One environment peaked at 59 connections, near the default limit of 64. Lambda adds environments before existing ones reach their limit, so this load used five. Event Functions serve one request per environment, so 200 open streams would need up to 200 environments. Across 484 requests, the whole fleet used about 4.8 seconds of CPU.
Each environment reports only its own connections, because Lambda routes each request independently with no session affinity.
Going multi-Region
The same app can serve each caller from the Region with the lowest latency. Because an endpoint’s type and Regions are fixed when you create it, going global means adding a new endpoint:
Figure 5: AWS CLI creating a global endpoint.
Lambda replicates your code and revision configuration, including environment variables, to each Region, and centralizes logs in the home Region. In this case, Lambda replicates to Europe (London) Region (eu-west-2). It provides a single global domain URL and uses Amazon Route 53 latency-based routing to send each request to the lowest-latency Region.
Browse to the new global URL which is now in the format: https://<domain>.lambda-web.global.on.aws
Figure 6: The app dashboard showing routing to the local Region.
From my laptop in the United Kingdom, the request routes to eu-west-2 (London) in 16 ms, where the single-Region endpoint in us-east-1 replied in 90 ms. These are single measurements from one location, not a benchmark. Each request goes to the Region with the lowest latency for the caller through the same URL. Lambda manages the DNS routing, so there are no load balancers or Route 53 records to configure.
Authentication and running behind Amazon CloudFront
Each endpoint has an authentication type that you can change without redeploying code.
With ApplicationManaged, the endpoint is public, and your code handles authentication (OAuth, JWT, a session cookie, or Amazon Cognito). Administrators can prevent public endpoints across an organization with a service control policy that uses the lambda:Request/WebFunctionAuthType condition key.
With IamAuth, Lambda validates each request with AWS Signature Version 4 (SigV4) for single-Region endpoints and SigV4a for multi-Region endpoints. Only callers with the lambda:InvokeWebFunctionEndpoint permission reach your app, which suits service-to-service APIs. Endpoints are always reachable over the public internet, and IamAuth controls who can invoke them.
Endpoints use a Lambda-provided domain. For a custom domain, edge caching, and AWS WAF, place Amazon CloudFront in front of the endpoint. Use IamAuth with origin access control so the Lambda domain cannot bypass CloudFront which still passes your application’s own Authorization header through to your code.
Build it with an agent
Because deployment is a single aws lambda-web deploy command and the code is an ordinary HTTP server, you can scaffold, build, and deploy an app from a prompt using AWS skills for coding agents. The Agent Toolkit for AWS includes Web Functions.
Clean up
To remove the default resources that the aws lambda-web deploy command created, see the cleanup instructions in the repo.
Conclusion
AWS Lambda Web Functions bring the serverless operating model to web applications without adapter layers. You write a standard Node.js HTTP server, deploy it with one command or CloudFormation, and get a scalable, pay-per-use HTTPS endpoint with global routing built in. Deploy the sample application from the Serverless Patterns collection along with other Web Functions patterns. Read the Lambda Web Functions documentation to go deeper and the Lambda roadmap.
For more serverless learning resources, visit Serverless Land.