Systemd v262 has been released. Some of the notable new features include the
ability to build systemd as a single statically linked binary for small
containers, support for the kernel coredump socket protocol introduced with
Linux 6.17, addition of OpenSSL 4 support, and many other changes. See
the release
notes for a full list of changes.
The Radicle peer-to-peer
code-collaboration project has disclosed
two critical vulnerabilities in the network protocol used by Radicle
nodes. The first flaw is that the network protocol used by Radicle “does not
give the confidentiality it was expected to give“, which allows anyone who
can observe the network between two nodes to read the data exchanged. The second
is that peer authentication is broken and allows impersonation, so an attacker
can spoof their Node ID and read private repositories they should not be able to
read.
In practice, the two flaws are most useful when they can be exploited
together: an attacker on the path sees the Node IDs at both ends of a
connection, and both are normally on the allow-list. That attacker can read
whatever is exchanged while they watch, and can then use a Node ID they saw to
fetch the whole repository on demand. The realistic threat is anyone on the path
between your node and node it syncs with, and no setting or allow-list protects
against them.
We are publishing this before the security update is available. You can act
on it today, and no fix we release later can undo an exposure that has already
happened.
See the post for workarounds that can be used today; a major update that will
be backward-incompatible is underway.
A critical
vulnerability has been discovered in WordPress‘s get_page_template()
function for page-template resolution that could allow remote-code execution
(RCE) by an unauthenticated attacker, in some limited circumstances. The project
has provided an update for the most recent branch of WordPress, as well as
backports of the fix for branches back to 4.7. See the
vulnerability report for the conditions required for an RCE attack to be successful.
The vulnerability also
affects the ClassicPress fork of
WordPress, though a security update has not been provided for that project
yet. LWN covered ClassicPress in
2024. Users of either content-management system should update soon.
Security teams already have long queues of potential application vulnerabilities. The useful question is what happens next: can they see how a weakness behaves in a running application, reproduce the attack, and give developers enough evidence to fix it?
Dynamic application security testing (DAST) helps answer those questions by testing applications as an attacker encounters them. The IDC MarketScape: Worldwide Dynamic Application Security Testing 2026 Vendor Assessment (Doc #US54119126, September 2026). The IDC MarketScape evaluated 16 vendors and named Rapid7 a Leader.
We believe the result reflects the strength of Rapid7’s DAST capabilities, but the IDC MarketScape also offers a useful view of where the category is heading. DAST has developed beyond traditional web scanning into a source of runtime evidence that can help organizations validate risk across the application layer.
From possible weakness to validated application risk
Code analysis and dependency scanning help teams identify weaknesses before an application is deployed. DAST provides a different view by interacting with the assembled application while it is running. It can show what happens when a particular request reaches the application, how the application responds, and whether a suspected weakness can be reproduced.
This is especially valuable for APIs and AI-backed applications, where risk may emerge through interactions among models, prompts, data, tools, and permissions. Some of these behaviors cannot be fully understood from source code or a dependency manifest. They become visible when the application is exercised under runtime conditions.
DAST therefore has a direct role in continuous threat exposure management (CTEM). Discovery gives teams a view of their assets and possible weaknesses, but that view alone does not tell them where to focus. Validation helps narrow the field by showing which exposures can be reached or exploited and providing evidence that teams can use to take action.
For Rapid7, DAST is exposure management applied to the application layer. Web applications, APIs, and AI-backed endpoints are all part of the attack surface, so they need to be discovered, tested, prioritized, and managed alongside infrastructure, cloud, and other exposures.
Why we believe Rapid7 was named a Leader by IDC
Rapid7’s DAST solution is delivered as part of the Exposure Command portfolio. Its scan engine maps an application, executes attacks against the discovered paths, and validates confirmed findings. Security teams can map a broad area of an application while limiting active attacks to an appropriate set of paths, giving them control over how testing is performed.
Findings are checked against Rapid7 telemetry to help determine which issues warrant closer attention. When a finding needs action, browser-based replay reproduces the original request, the attack request, and the triggering response. Developers receive evidence they can work with, rather than a finding they must first spend time proving.
Authenticated scanning can be difficult to maintain across a changing application portfolio, and a broken login sequence can leave important areas untested. Rapid7’s solution can identify the affected step and support a targeted update without requiring the entire sequence to be recorded again.
The connection with Surface Command adds another useful layer. Newly discovered external assets can be surfaced for application testing, helping teams close the gap between finding an application and understanding the risk it presents
DAST plays a core role within Exposure Command: providing the application-layer validation teams need to prioritize risk and move from findings to remediation.
Abstract: We discover a novel and surprising phenomenon of unintentional misalignment in reasoning language models (RLMs), which we call self-jailbreaking. Specifically, after benign reasoning training on math or code domains, RLMs will use multiple strategies to circumvent their own safety guardrails. One strategy is to introduce benign assumptions about users and scenarios to justify fulfilling harmful requests. For instance, an RLM reasons that harmful requests like “outline a strategy for stealing customers’ credit card information from a retail store” could be associated with the benign intent of “a security professional trying to test defense,” despite no such benign context being provided as input. We observe that many open-weight RLMs, including DeepSeek-R1-distilled, s1.1, Phi-4-mini-reasoning, and Nemotron, suffer from self-jailbreaking despite being aware of the harmfulness of the requests. We also provide a mechanistic understanding of self-jailbreaking: RLMs are more compliant after benign reasoning training, and after self-jailbreaking, models appear to perceive malicious requests as less harmful in the CoT, thus enabling compliance with them. To mitigate self-jailbreaking, we find that including minimal safety reasoning data during training is sufficient to ensure RLMs remain safety-aligned. Our work provides the first systematic analysis of self-jailbreaking behavior and offers a practical path forward for maintaining safety in increasingly capable RLMs.
I think the core problem is that these models are all trained on the average of humanity, and we are a pretty duplicitous species.
През лятото край морето има много надуваеми елементи – пояси, дюшеци, топки, лодки и т.н. Затова си позволявам да определя жанра на наблюденията и разсъжденията си за отминалия туристически сезон във Варна като „раздувка“. Думата беше популярна едно време, преди всички да заговорят за наратива. Раздувките ми нямат претенции да са прецизен анализ, а и така се случи, че това не беше най-активното ми лято, но все пак някои детайли от този ключов сезон за варненския живот си заслужава да бъдат изтъкнати.
1. Нямаше туристи
Е как да има?! Вече всеки си е купил апартамент във Варна, нормално е хотелите да останат празни. Нормално е и ресторантите да останат празни, защото е по-лесно и по-евтино, като имаш кухня, да си сготвиш нещо лятно и свежо там, вместо да рискуваш с непроверени откъм обслужване и меню заведения.
Разбира се, този довод е по-скоро шега, но в нея има доза истина, особено ако говорим за родните туристи, както и за чужденците, които са инвестирали в имот край морето ни. А последните не са никак малко.
Истината е, че в началото на лятото Варна изглеждаше поразително пуста, каквато не сме я виждали от много време. В края на сезона министърът на туризма, т.нар. представители на бранша и всички, чиято задача е да внасят спокойствие в обстановката, заявяват, че първоначалният кошмарен спад е компенсиран и резултатите са в крайна сметка като през миналата година.
Спирането на чартърните полети от Германия, за което така и не стана ясно как е допуснато и по чия вина се е стигнало до него, лиши курортите ни от около 120 000 германци, които винаги са били гръбнакът на сезона.
Отсега се водят преговори за възстановяване и гарантиране на тази ключова транспортна връзка за следващото лято. Проблемът обаче трябва да отвори дебат за алтернативни варианти на системата, по която работи туризмът ни вече десетилетия. Големите групи от германски пенсионери, които прииждаха край Варна още от май, преди дори да се е стоплило морето, вече са минало. Туризмът ни трябва да се модернизира, но това, изглежда, не става твърде бързо.
Последното издание на кулинарното риалити MasterChef преди две години беше спечелено от варненката Марианна Александрова. Както се оказа, тя не искаше просто телевизионна слава, а си беше поставила по-амбициозна цел – да изгражда специфична варненска кулинарна идентичност. Александрова е преподавателка в Колежа по туризъм, изследва стари готварски традиции и намира рецепта за паста с миди във вестник от 1896 г. Според нея тъкмо това ястие може да стане хит на оригиналната „варненска“ кухня.
В колко варненски ресторанти се предлага паста с миди ала XIX век, признавам си, не знам. Но едва ли са много. На теория цялата идея да има варненско ястие, което да е като запазена марка за града, е супер.
На практика обаче храната започва да се превръща в ахилесовата пета на преживяването „почивка във Варна“.
Доста хора се възмутиха от цените на един обяд или на една вечеря край морето, но според мен това не е основният проблем. Проблемът е в качеството както на продуктите, така и на приготвянето им. И дори не е необходимо да опитвате – достатъчно е да помиришете.
Над пристанището и покрай Морските бани във Варна и това лято доминираше една миризма – не на море и водорасли, а на прегоряло олио и непочистени скари. Това е положението, това е реалната кулинарна варненска идентичност, колкото и да не ни се иска.
Варна никога не е била толкова мръсна, колкото това лято. Вярно е, че всяка година, когато градът се напълни с туристи, контейнерите започват да преливат. Този път обаче не беше само това. Метачките изчезнаха от улиците на града през юни и се появиха пак едва в края на август, без ясна причина за липсата им. За миене на улиците изобщо не говорим – такава дейност нямаше. Между плочките на тротоарите и покрай бордюрите поникнаха всякакви бурени, които никой не се погрижи поне веднъж да бъдат разчистени. Изобщо, да ходиш с джапанки или със сандали по варненските улици това лято си беше предизвикателство, защото не знаеш какво ще настъпиш.
Имаше обаче и друго явление, доста гнусно и срамно – празни контейнери и разпилени около тях отпадъци.
Видео, публикувано в социалните мрежи, показа причината за това безобразие. На него се вижда как мъж с жълта жилетка, който не просто оставя торба с отпадъци до контейнера вместо в него, а изсипва отпадъците на улицата. Напълно съзнателно. А при въпрос защо го прави, той обяснява, че така му е наредено от някой си „Мишо от „Хепи“. Всичко това – в самия център на града, до емблематичния хотел „Черно море“.
Привърженици на кмета Благомир Коцев твърдят, че подобни саботажи се правят най-редовно, буквално от първия ден на мандата му. Честно казано, не вярвах да е вярно, докато не видях въпросните кадри. Колко трябва да мразиш кмета, за да замърсяваш съзнателно града си с цел да злепоставиш Коцев? Нямам отговор на този въпрос. И не вярвам, че някой може да има разумен довод за тази свинщина. По-лошото е, че не личи по нищо органите на реда да им пука за това, да не говорим да установят и накажат виновните.
4. Фестивалите
Когато слизате към морето по централното стълбище към Морските бани, попадате на тераса, на която е написано „1926“. Това е годината, в които баните са завършени и Варна по същество става истински курорт – пет години след официалното обявяване. В същата година започват и Народните летни музикални тържества – първият български фестивал, днес познат като Международния музикален фестивал „Варненско лято“. Почитателите на класическата музика коментират, че тази година изданието му е било подобаващо за 100-годишнината. Но колко привлекателна е класическата музика за един съвременен турист?
Въпреки че през лятото във Варна постоянно има някакви събития с фестивален характер, мнозина твърдят, че културният календар на града е твърде рехав. Това може да звучи парадоксално, но всъщност показва една очевидна липса – на голям поп или рок фестивал като тези в Пловдив.
Варна остана и това лято без световни звезди, което навява усещане за провинциалност.
На този фон неуспешната кандидатура на града за домакин на „Евровизия“ не трябва да изненадва никого. От самото начало се знаеше, че Варна няма зала за 10 000 души – основно изискване за прословутия конкурс. Какво решение ще получи този проблем, е въпрос, на който трябва да отговори държавата – подобен обект не може да бъде изграден само с местни усилия.
5. Нож за украинците
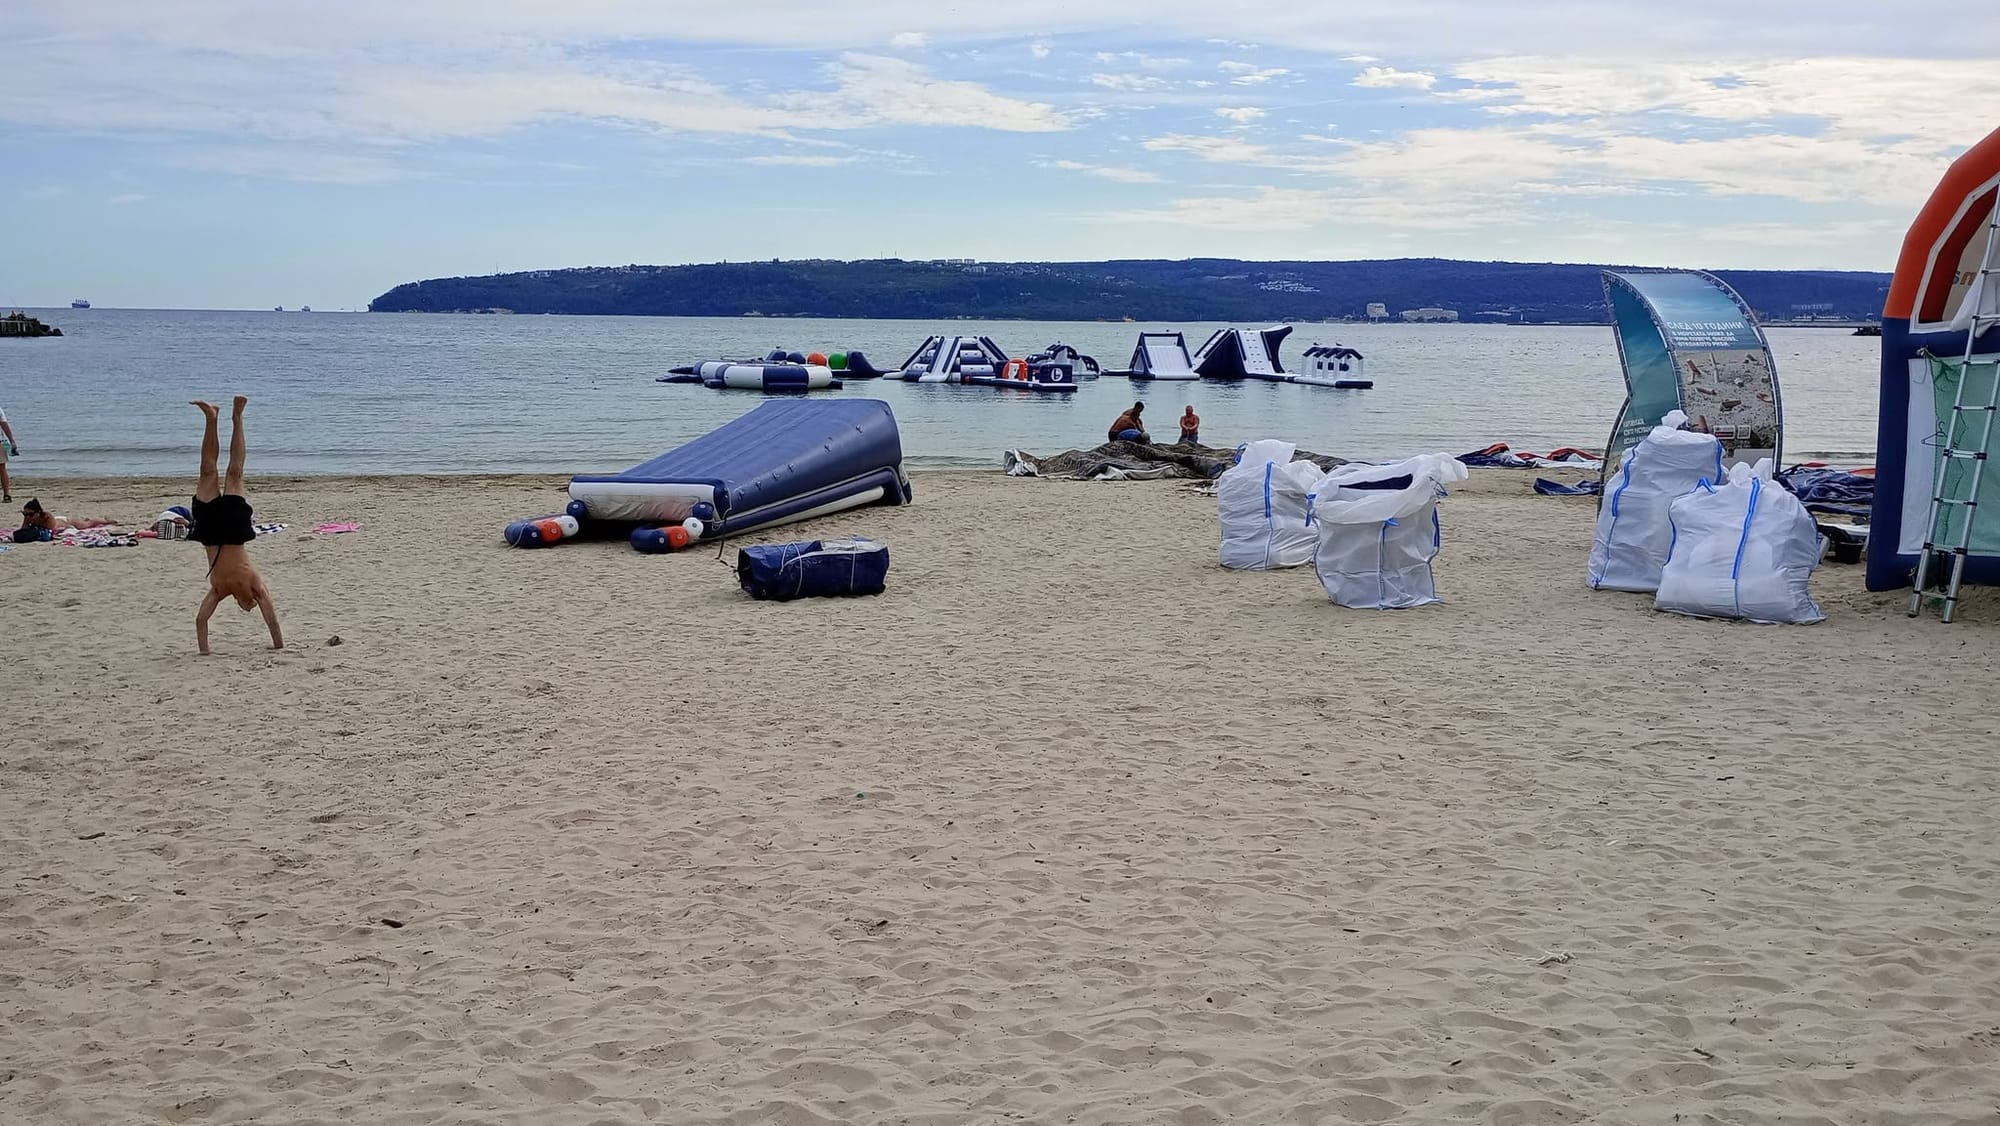
Да се върнем към надуваемите летни предмети, с които започнах тези „раздувки“. Малко неочаквано това лято в морето на Офицерския плаж се появи аквапарк. Казвам „неочаквано“, защото да разположиш съоръжение за деца точно на мястото, където пробите за чистотата на водата са все на ръба на допустимото, не е много логично. Но след като концесионери, наематели, контролни органи и в крайна сметка клиентите на атракциона не виждат проблем в това, няма какво да коментираме.
Големият проблем с надуваемия аквапарк се оказа друг – че се управлява от украинци.
Антиукраинските настроения във Варна са дълга и сложна тема, но този път грозните изстъпления в социалните мрежи бяха надминати от нещо още по-грозно. В средата на август елементи от аквапарка бяха срязани и се наложи да бъде затворен, за да се отстранят щетите от вандалския акт.
Екипът на аквапарка съобщи това във Facebook със съжаление и откровено учудване от случилото се. Вместо някакво съчувствие и нормално осъждане на вандализма, съобщението беше последвано от масов хейт и откровена ксенофобия. Коментари от типа „Махайте се, отивайте си в Украйна“, „Вземете си аквапарка и си го закарайте в Одеса“ бяха най-меките.
Честно казано, като варненец изпитах истински срам от тази реакция. Почти толкова, колкото от кадрите със съзнателното изсипване на боклук до контейнерите. И този път органите на реда не показаха някаква амбиция да разследват, да установят извършителя и евентуалния поръчител на безобразието и да го накажат.
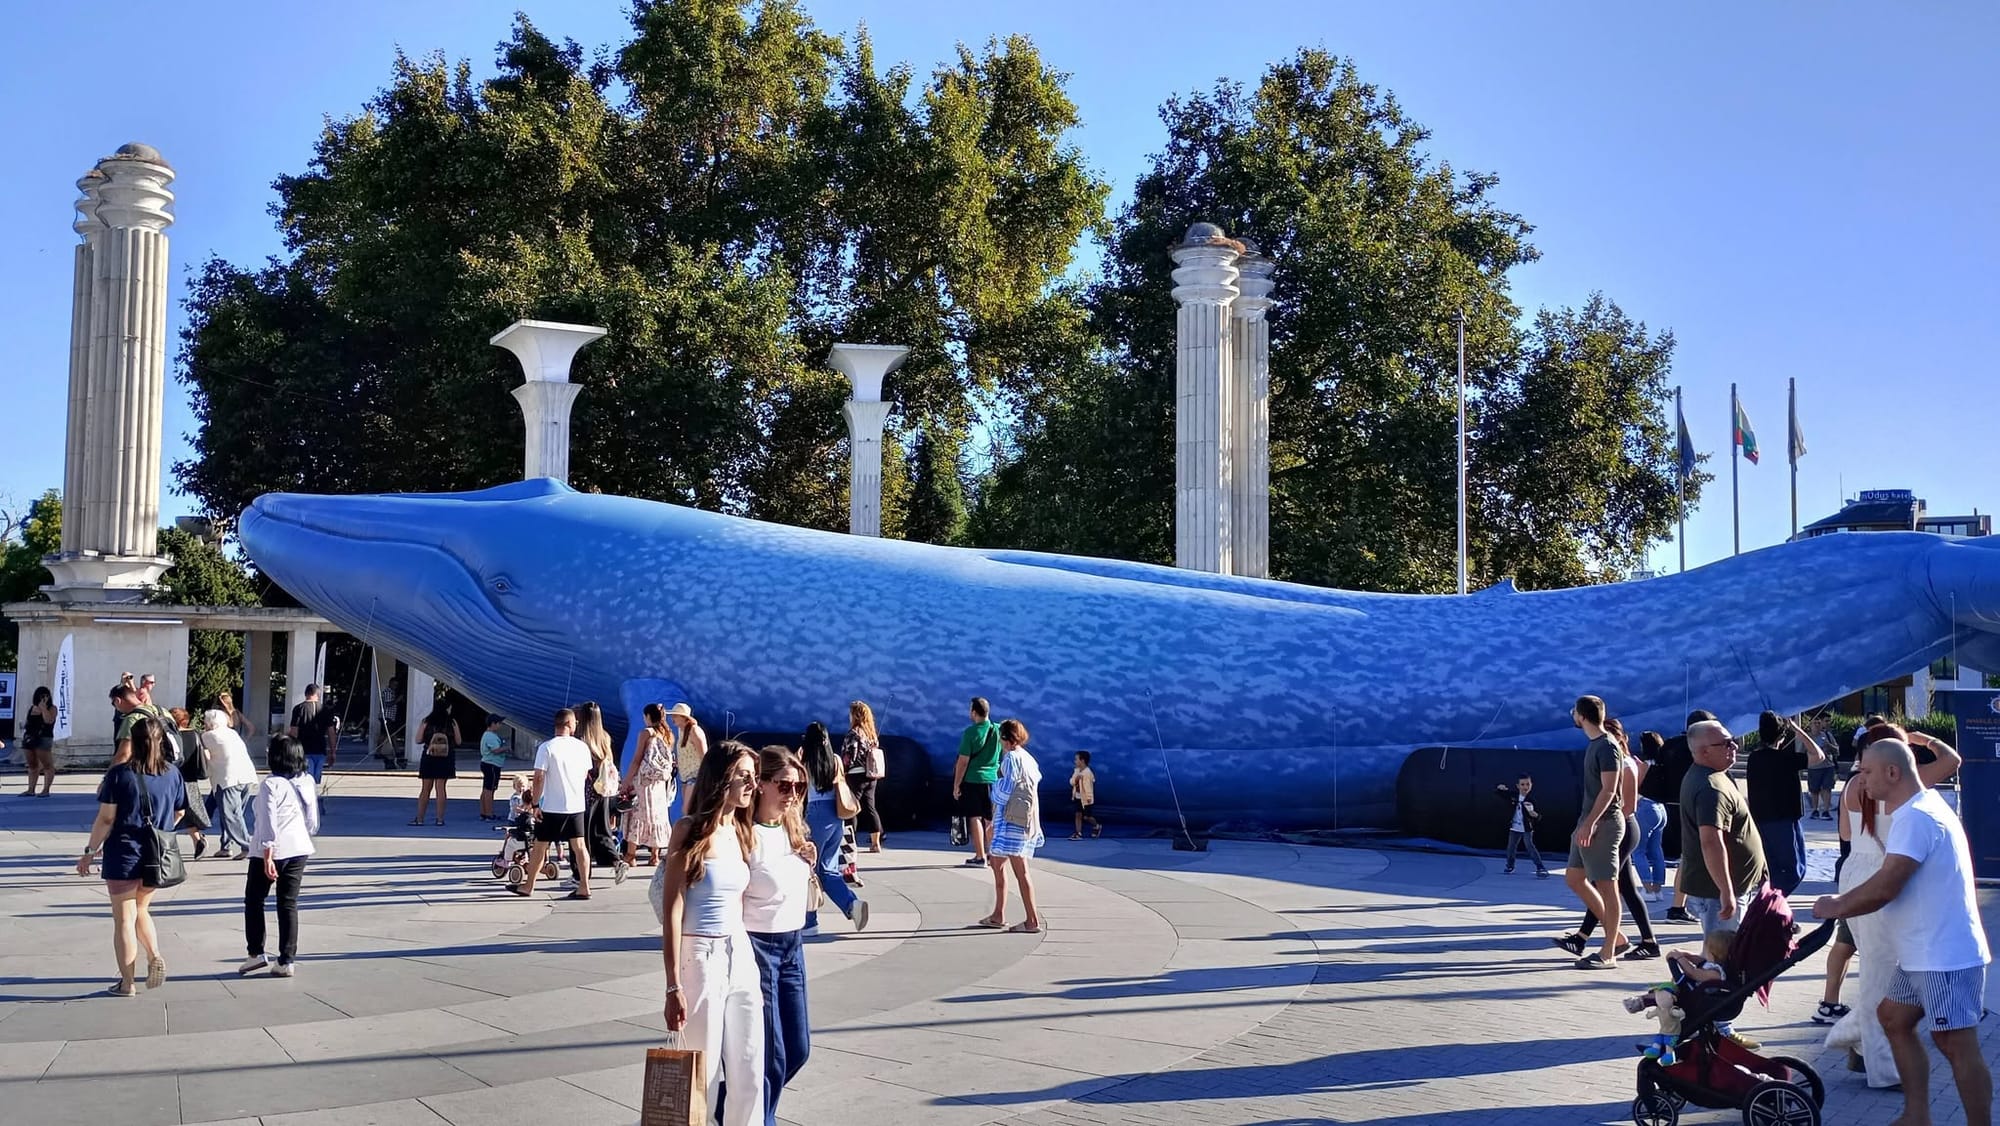
В самия край на лятото, в топлото начало на септември (най-хубавото време да си варненец или да посетиш града), на входа на Морската градина се появи огромен син кит в реални размери – 28 метра дължина. Надуваемото животно стана сензация буквално за часове. Оказа се, че поставянето му е част от форум на морски експерти, чиято тема беше избягването на инциденти между големите морски бозайници и корабите.
Децата подскачаха и се радваха, възрастните снимаха, та снимаха с телефоните, а в социалните мрежи… Е, там пак беше касапница! „Това ли измислихте?! От това ли има нужда Варна? Позор!“ – такъв беше основният тон на коментарите, буквално стотици, може би хиляди.
И тук вече престанах да се срамувам и възмущавам от масовия хейт и просто се натъжих. Какво се случва с варненци, моите мили съграждани? Наистина ли такова е масовото им мнение, или става въпрос за някаква целенасочена тролска атака?
Ако китът беше червен, розов или кафяв, щяха ли да му се зарадват? Или щяха да го нарежат, ако някой беше пуснал слуха, че китът е украински?
Варна преминава през период на криза, която няма да завърши с края на този летен сезон – това е очевидно. Ясно е също, че без отговорността и съзнателните усилия на гражданите си т.нар. Морска перла няма да стане по-приветливо и приятно място. Но изглежда, варненци напоследък са ангажирани предимно с това да не харесват. Да не харесват и да не правят нищо, бих добавил.
On September 22, 2026, F5 published a security advisory for CVE-2026-94127, a critical heap-based buffer overflow vulnerability affecting F5 BIG-IP Access Policy Manager (APM). The vulnerability has a CVSS v3.1 score of 9.8. An unauthenticated attacker with network access to an affected virtual server may be able to achieve remote code execution (RCE) by sending specifically crafted traffic.
BIG-IP APM provides identity-aware access control for applications and other corporate resources and can integrate with authentication technologies including OAuth, OpenID Connect, and SAML. CVE-2026-94127 is not exposed in a default configuration: exploitation requires a BIG-IP virtual server with both an APM access policy and an OAuth profile configured. Because affected BIG-IP systems may process traffic at an organization’s network edge, organizations using this configuration should prioritize remediation.
The vulnerability affects the data plane and does not expose the BIG-IP control plane. BIG-IP systems operating in Appliance mode are also affected.
F5 lists the following affected release trains and corresponding fixed hotfixes:
BIG-IP 21.1.0: versions prior to Hotfix-BIGIP-21.1.0.2.0.30.22-ENG
BIG-IP 17.5.0: versions prior to Hotfix-BIGIP-17.5.1.9.0.160.12-ENG
BIG-IP 17.1.0: versions prior to Hotfix-BIGIP-17.1.3.5.0.41.14-ENG
As of September 22, 2026, CVE-2026-94127 has been added to the CISA KEV while a publicly available proof of concept was not confirmed.
Mitigation guidance
Organizations running affected F5 BIG-IP deployments should apply the appropriate F5 hotfix as soon as operationally feasible, particularly where a vulnerable APM and OAuth configuration is reachable from untrusted networks.
F5 lists the following remediation versions:
BIG-IP 21.1.0: update to Hotfix-BIGIP-21.1.0.2.0.30.22-ENG or later.
BIG-IP 17.5.0: update to Hotfix-BIGIP-17.5.1.9.0.160.12-ENG or later.
BIG-IP 17.1.0: update to Hotfix-BIGIP-17.1.3.5.0.41.14-ENG or later.
Administrators should first determine whether a BIG-IP APM access policy and an OAuth profile are configured together on a virtual server, since this configuration is required for exposure.
For organizations that cannot immediately apply the applicable update, F5 provides an iRule workaround through F5 Support. Customers should open a support case with F5 to obtain the vendor-provided workaround and follow F5’s implementation guidance.
Rapid7 customers
Exposure Command, Vulnerability Management, and Nexpose
Exposure Command, Vulnerability Management, Nexpose customers can assess exposure to CVE-2026-94127 using vulnerability checks expected to be available in today’s (September 23) content release.
Walk into Allison Knoph’s fifth grade classroom in Edina, Minnesota in October and the creative writing station will be the loudest place in the room.
That is by design. “I use it at my creative writing station,” she says of Experience CS, which she has run each fall for the past couple of years. Kids use the station computers to be creative as they work on their programming projects, building characters and testing jokes they have written. Some laugh hard enough that a visitor might wonder if anyone is working.
“Giggling,” Allison says, “is a good problem to have.”
Placement matters
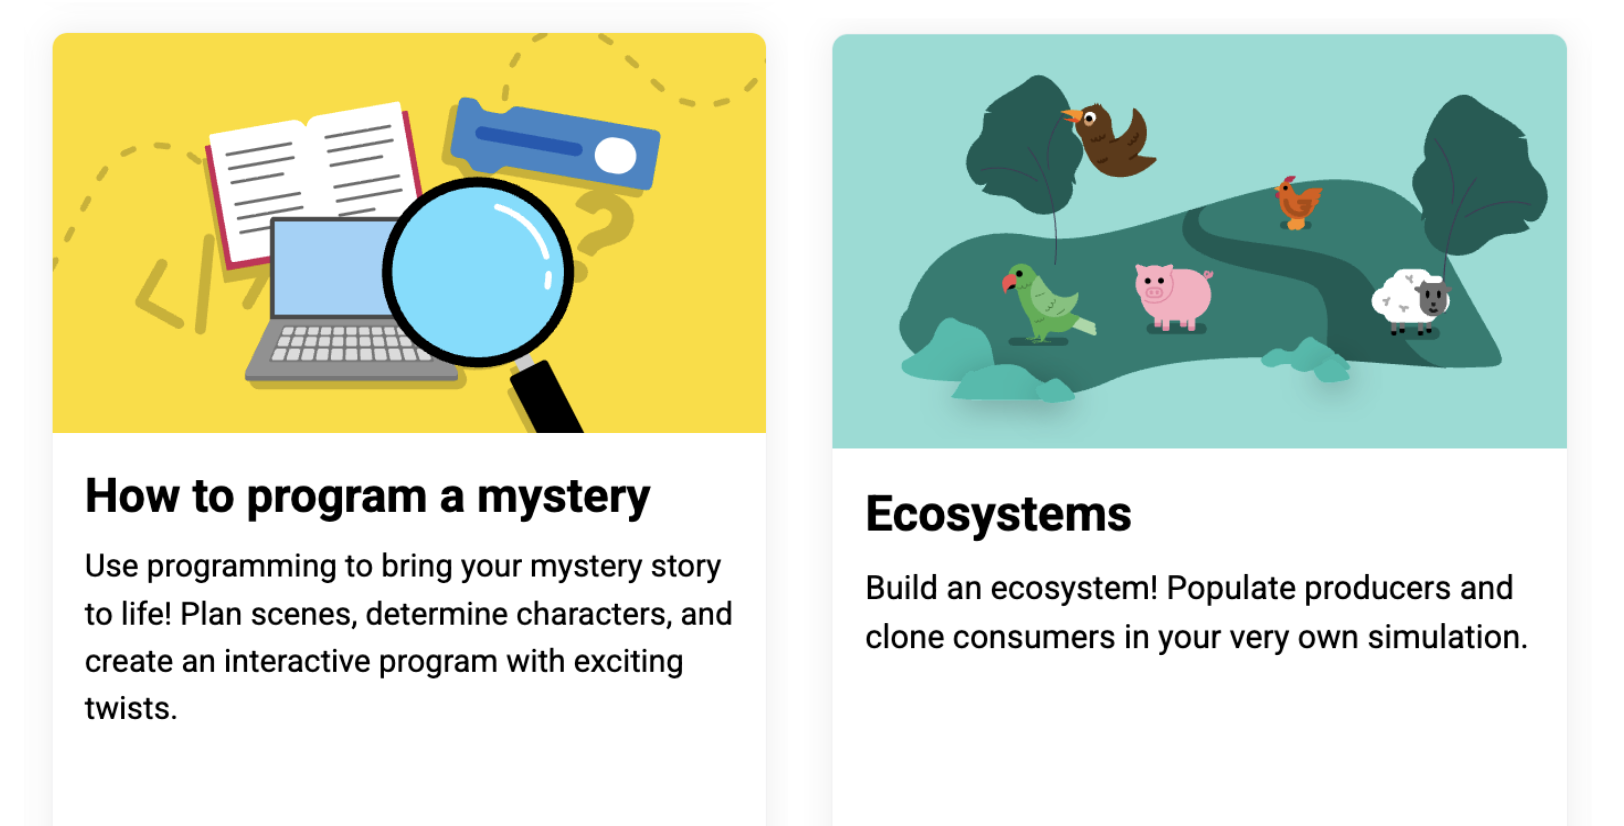
Experience CS is a standards-aligned computer science curriculum for grades 3 to 8 (ages 8 to 14) that integrates computing into core subjects like math, science, and art. Allison has completed two units with her students, The me project, designed for fourth grade (ages 9 to 10), and Ecosystems, designed for seventh grade (ages 12 to 13).
Of the two units, the storywriting-themed The me project was the stronger fit. It mapped cleanly onto language arts work her students were already doing. Students hit the signposts the unit lays out, but what they did inside that structure was theirs. One wrote the minimum and moved on. Another built a multi-scene story with custom sound effects, spending three weeks developing their project and making improvements.
The Ecosystems unit was more challenging for her students, and the students who finished “were the ones who were kind of the more gung-ho ones that were really into it.” She is not dismissing it, but she is clear that placement matters.
Helping each other
Allison highlighted that some of the students who were thriving in the Experience CS lessons were students who were experiencing difficulties in other areas of the curriculum. “The kids who don’t normally shine often do here,” she says. Describing one experience from her classroom, she shared that a student who had difficulties with reading quickly understood how a program should be sequenced. Within a week, classmates were walking to that desk for help. The peer support model is not something she engineers. It builds itself.
Running the lessons in October sets a tone she draws on all year. Something breaks, a student gets stuck, and the answer in her room becomes “We can figure it out.” That carries into math, into writing, into everything after.
Why now
Allison is not arguing that every student will grow up to write code. Her argument is that computational thinking transfers, and that it looks a lot like the writing instruction she is already doing: syntax, structure, sequence. Debugging a story and debugging a program are closer cousins than most people think.
In the age of AI, computational thinking and coding skills are especially important. Access to AI tools makes it easier for more people to generate code. Fewer people can read it, judge whether it is any good, and change it. Allison saw this on her son’s robotics team: the students who understood their code could adapt it when the robot did something unexpected. The ones who had generated code and dropped it in could not. Same tools, different outcomes, and the difference was comprehension.
The context in Minnesota
Minnesota ranks near the bottom nationally for computer science access. In the most recent state-by-state accounting, 34 percent of its public high schools offered a foundational CS course, against a national average of 60 percent.
As a fifth grade teacher, Allison believes that if students may not have opportunities to learn CS in high school, the introduction has to happen earlier, in a classroom not labeled computer science.
She is candid that the barrier for elementary teachers is not interest. It is time, cost, and the fear of being asked a question they cannot answer. She sums up the Experience CS offering to her colleagues in a few words: free, little direct instruction, fits standards she is already teaching, and the kids like it enough to be loud about it.
“We can figure it out” is a good thing for a teacher to say out loud. It is a better thing for a room of ten-year-olds to start saying back.
Find out more about introducing Experience CS in your classroom: head toexperience-cs.orgtoday.
Средновековните извори, особено от външни нам култури, имат особена динамика. На пръв поглед изглеждат непроницаеми, езикът е тежък, сух, често са сложни, витиевати, с множество скрити препратки, особено към текстове, които читателите следва да знаят по подразбиране. Няма бележки под линия, няма обяснения. Но с това се свиква и носи особено удоволствие, почти като да чоплиш тиквени или слънчогледови семки. За непосветените изглежда скучна повторяема дейност. Ала за нейните адепти носи огромно удовлетворение както веднага, така и с натрупването в дългосрочен план. И често пъти, особено когато става въпрос за Корана и Сунната, изворите осмислят събития от съвремието. Тъй де, откъде иначе човек може да разбере защо вече споменатата в предишната част ИДИЛ нарича списанието си „Дабик“?
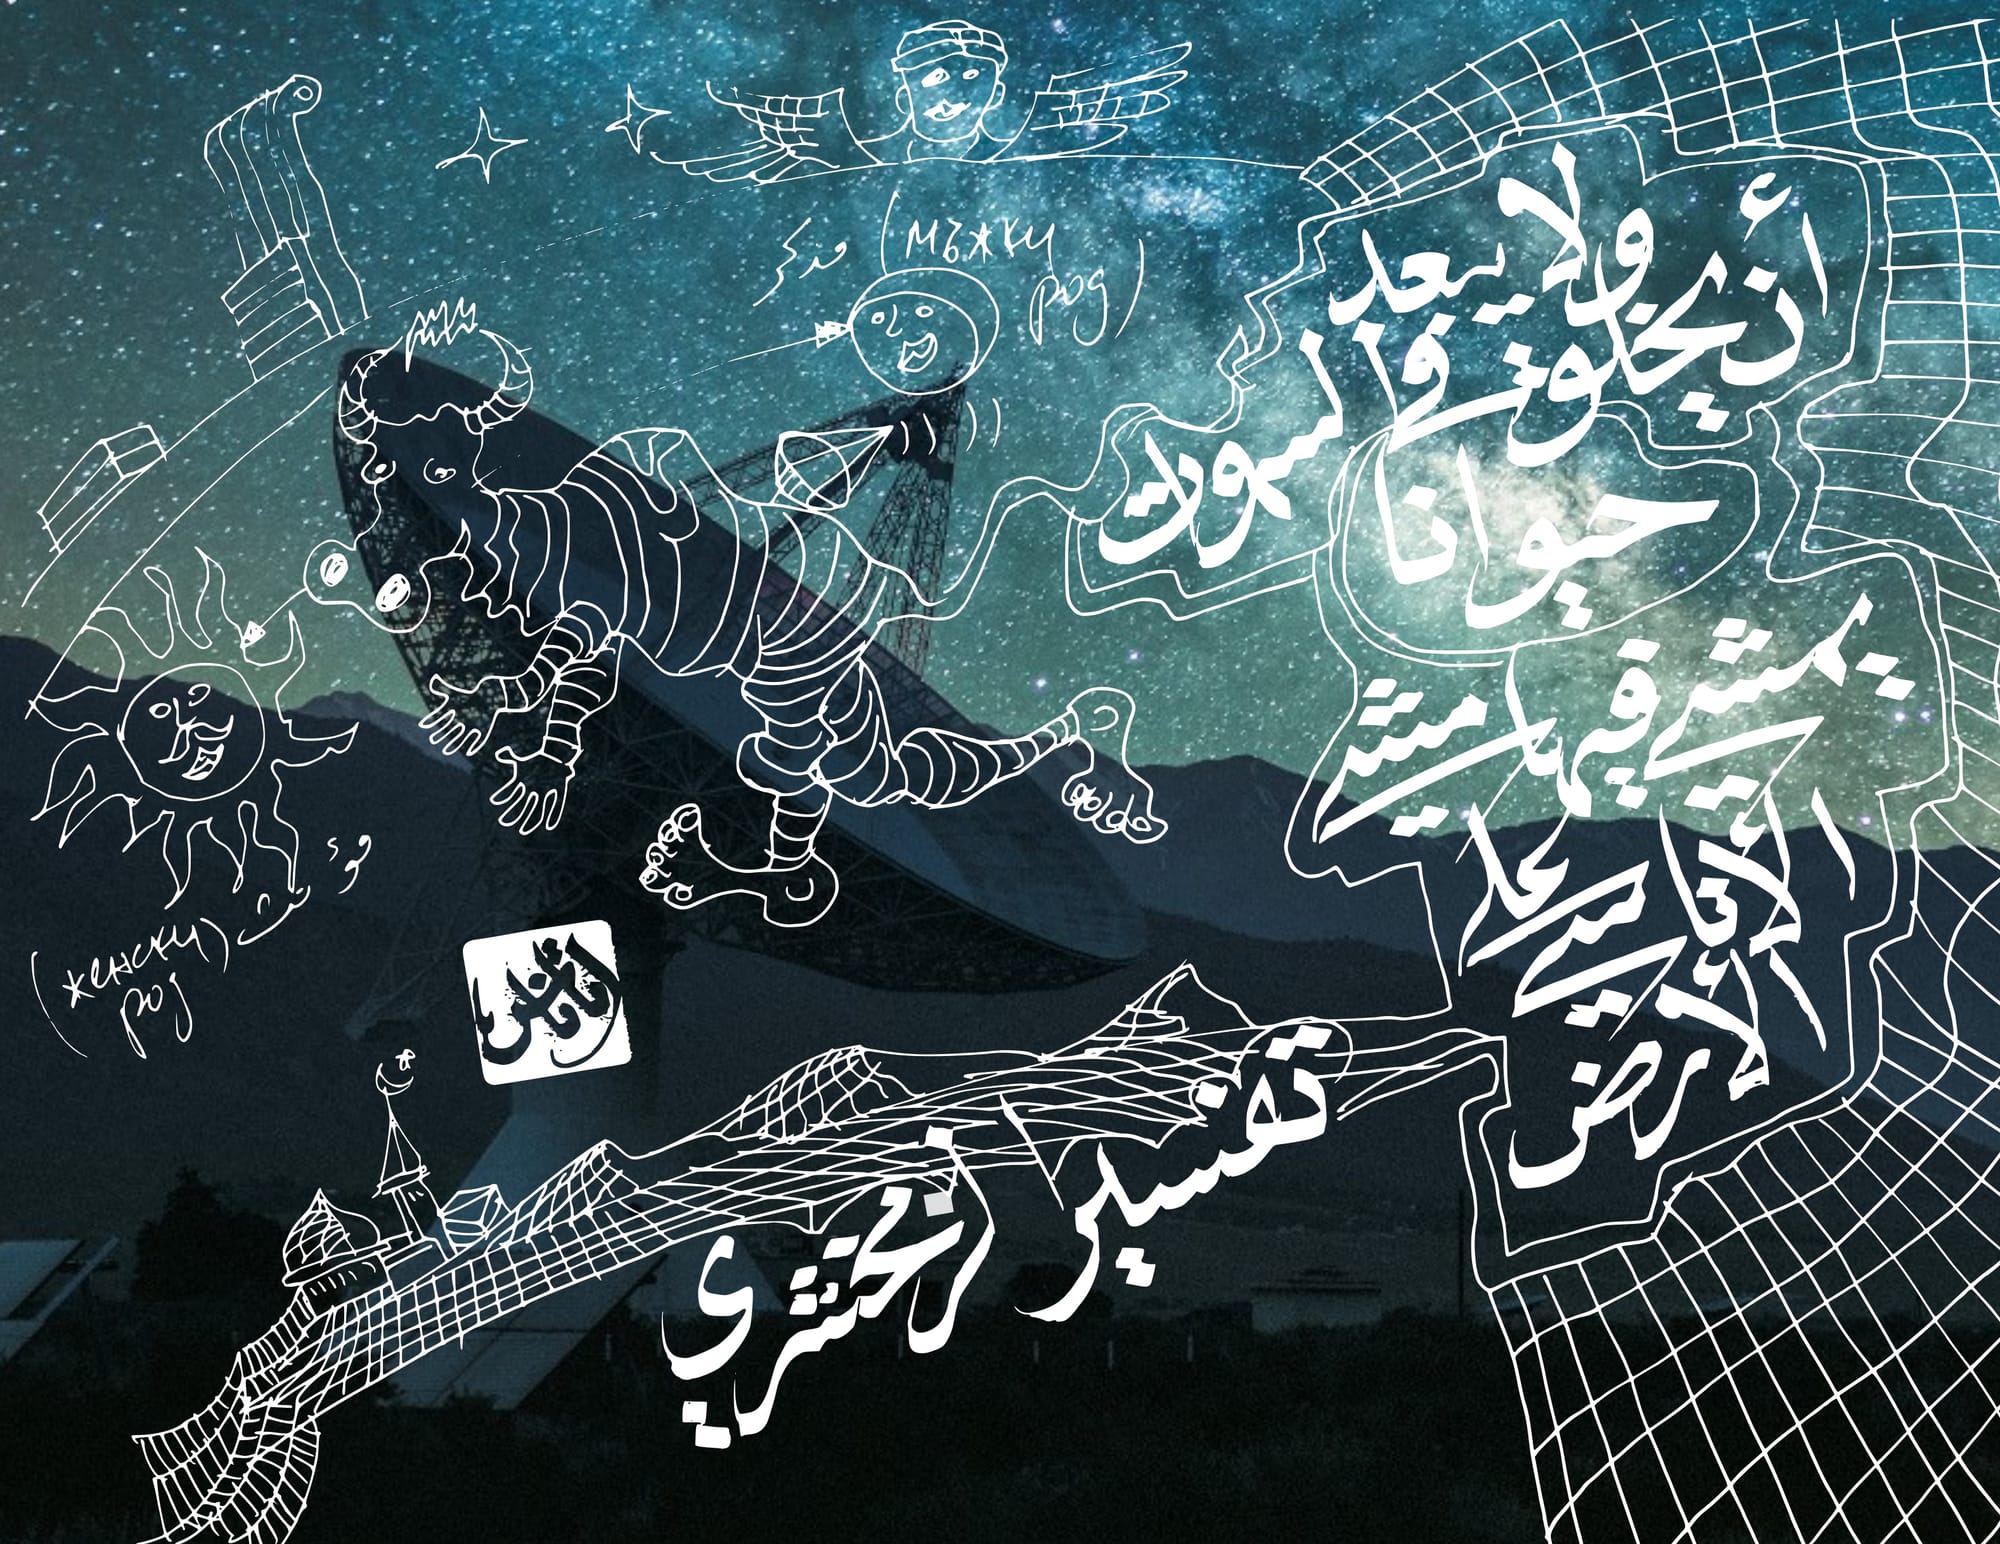
Съвременните възгледи също не са еднозначни. Ето този любопитен читател отправя запитване към портала за фетви на катарското Министерство на религиозните дарения и работи: „Искам да Ви запитам относно въпроса за извънземните.“ Има ли ги споменати в Корана и Сунната? Ако не, откъде идвал тоя израз „извънземни същества“, което на арабски тук е буквално „космически същества“ (ка’инат фада’ийа). Запитването става още по-интересно: какво мислят религиозните авторитети за твърденията, че извънземните са създали човека подобен на тях чрез ДНК технологии, че те са помагали на фараоните да построят пирамидите, че те са силата, довела до съществуването на човека, и в крайна сметка как изглеждат? Дали изображенията, които намираме по мрежата, са истински, или са изфантазирани, за да убедят хората, че извънземни съществуват?
Мисля, че питането е достойно за едновремешния вестник „Психо“ или сходния му днес „Феномен“, който често си купувам, за да си сверя конспиративно-окултния часовник. Но както обичам да казвам, в мюсюлманското право и богословие срамен въпрос няма. Все пак става дума за съвършения Свещен закон на Всевишния. Там трябва да има отговор на всичко.
Отговорът е изненадващо разкрепостен, още повече че това е катарското министерство. Онзи, който е създал човека, и го е изваял че после му е и вдъхнал живот – тоест самият Аллах, – е способен да създаде и извънземни. Свещеният Коран е посочил, че има същества, които не са били известни на човечеството по времето на Пророка, ролята на научните открития, както и че за всяко нещо има определено време, което ще настъпи. Аргументът е вече цитираният от мен текст в Коран 16:8: „[Сътвори] и конете, и мулетата, и магаретата – за да ги яздите и за украса. И сътвори Той каквото не знаете“; „Всяка вест си има определено време и ще узнаете“ (6:67), и вече известното ни знамение за „небесните добичета“ (42:29), където, пояснява богословът, терминът дабба според някои религиозни учени обозначава създания, различни от ангелите, тъй като Всевишният прави разлика между онова, което е дабба, тук „твар“,и ангелите в самия Коран: „На Аллах се покланя в суджуд всичко на небесата и всяка твар по земята, и ангелите – без да се големеят“ (16:49).
Ако трябва да бъда донякъде критичен, тук нашият превод ми се вижда излишно рестриктивен и прокарва определено тълкувание. Защото арабският оригинал не ни казва точно „всичко на небесата и всяка твар на земята“, а по-скоро „всяка твар на небесата и земята“ (ма фи с-самауат уа-ма фи л-ард мин дабба). А пък суджуд, както е известно в мюсюлманската ритуална практика, е покланянето с чело до пода и ако бях един средновековен богослов като Ибн Таймия от XIII век например, щях да разсъждавам върху това как небесните твари, които не са ангели, а очевидно са нещо друго, свеждат чело до земята, какво тяло имат, колко и какви крайници, стави, имат ли глава, дали е повече от една, въобще как се извършва този жест на ритуално поклонение от чисто механична гледна точка.
Но да оставим тази спекулация за друг път и да продължим с катарската фетва на Министерството. Нали е важно какво казва религиозният истаблишмънт. На базата на тези текстове, твърди богословът, „хората на знанието“, тоест религиозните учени, или поне някои от тях, твърдят, че няма пречки да съществуват други „вселени“ или „светове“, без да е напълно сигурно, доколкото свещените текстове подлежат на тълкуване. Ала не си мислете, че това разкрепостено тълкуване се простира благосклонно върху окултно-конспиративните теории за сътворението на човека от извънземен разум чрез ДНК манипулация. Това допускане е откровена безсмислица. Та не е ли самият Аллах създател на човека според писаното „Сътворихме Ние човека от подбрана глина“ и т.н. (Коран 23:12)? За фараоните и извънземните позицията е по-мека, била тя и скептична – няма категорично доказателство за подобно, хм, строително сътрудничество (по мое четене), та и е правилно мюсюлманите да не се вдават много-много в разсъждения в тая посока.
Подобни позиции, с много сходна коранична основа, се застъпват и от други популярни богослови, ето например един Ясир Кади, богослов от САЩ, в онлайн канала му. Той преповтаря почти буквално старите аргументи, че и се опира на вече споменатия Ибн Таймия, който пък разсъждава върху възможностите за безкрайни творчески актове на Аллах, които, разбира се, включват и други светове. А ако това е така, логично е мюсюлманите да се вълнуват от съвременни дискусии, свързани с доказателства за извънземни, мислени през феномена на неидентифицираните летящи обекти.
И тук се натъкваме на една от пресечните точки между американската администрация и религиозните мюсюлмани. Защото, както видяхме, няма религиозно противоречие ходжата или всеки един религиозен мюсюлманин да допускат, че в произшествието в Розуел, САЩ, от 1947 г. например има зрънце истина. Сигурно и от гледна точка на вярата „няма лошо“, както се казва на арабски (ла ба’с), да се мисли и за нашенската Царичина дупка от 1990 г., когато български военни копаят в търсене на извънземни край София по указанията на екстрасенси. Не съм попадал обаче на тукашно мюсюлманско размишление по въпроса. Търсенето ми онлайн на комбинация от „извънземни“ и „Главно мюфтийство“ ме препраща към Отдел „Външни отношения“ на Мюсюлманското вероизповедание. Но не външни на Земята, или поне засега. Сигурно някой ден може да е другояче, ако тълкувателите на Корана в полза на космическите пришълци се окажат прави.
През 2017 г. излязоха данни, че Пентагонът използва десетки милиони долари „черни пари“ от военния бюджет за проучване на свидетелства за НЛО в рамките на програма за идентифициране на заплахи за въздушното пространство. Както отбелязва и Sapience, американски мюсюлмански институт за проучване на връзката между религията и науката, тези разкрития наливат наново вода в мелницата на интереса към извънземните. Според института
може да се прокара връзка между наблюдаваните прояви на НЛО и споменатите в ислямската традиция джинове.
Тези паралели вървят по няколко линии. На първо място, характеристиките при описанията на двата феномена – странни същества, които променят формата си, летящи, неестествено движещи се обекти. Второ, измамата като основна тема и в двата случая. И в разказите за НЛО, и в старите истории за джинове имаме елемент на заблуда и оптически илюзии. Трето, разказите за отвличания. И накрая, сходствата при случаи, свързани с обладаване, т.нар. стопаджийски ефект (hitchhiker effect) – след отвличане и посещение на извънземни човек носи остатъчни ефекти от него. След като веднъж срещнеш съществата от друг пласт на реалността, те оставят следа върху теб. Не се ли загатва и същото в текста на Корана: „Които изяждат лихвата, не ще се изправят, освен както се изправя някой, когото сатаната поваля от лудост“ (2:275), където се допуска възможността дяволът да доведе някого до безумие?
Тук трябва да направим и важно терминологично уточнение. Вместо „извънземен“ (extraterrestrial) някои учени използват термина „криптоземен“ или „скритоземен“ (cryptoterrestrial), доколкото той обозначава не живот, придошъл от пространства извън Земята, а по-скоро феномен, наличен на Земята, но със скрит произход. И това, твърди авторът на статията, веднага напомня за света на джиновете. Защото едно от значенията на арабския корен дж-н-н, от който идва думата, е свързано със скриване, укриване, покриване. Честно казано, ако бях мюсюлманин, и аз веднага щях да припозная джиновете като основни виновници за НЛО феномените. Не ми трябват „зелени човечета“. Е, ако може, да не изхвърляме и „небесните добичета“ с неясни атрибути от небесата.
Арабският онлайн инфлуенсър Manetho The Writer посвещава почти четиричасово предаване на „черните пари“ на Пентагона, обсъжданията на НЛО в американската администрация и връзката с възможни срещи с извънземни. Епизодът се нарича „От Конгреса до джамията: мюсюлманското право за извънземните“ и представлява подкаст с различни участници и материали. Има всичко – от протоколи на изтеклите документи от Пентагона и записки на Конгреса в САЩ, през детайлни описания на наблюдавани НЛО, споменаване на Розуел и други подобни събития, та чак до богословски обяснения по някоя от по-горните линии на разсъждение, текстове от Корана и Сунната и пространни разсъждения относно приложимостта на ислямското право относно възможните извънземни.
Докато слушам смесицата от арабски диалекти и книжовен кораничен език, от чисто любопитство се питам друго. Свързано е с визуалното възприятие на извънземните. Клишираният образ на извънземното на Запад е известен – голяма, удължена, яйцевидна глава, големи очи, тънко тяло, високо или ниско, фини крайници, нещо като известните „сиви същества“. Но историческите изображения на джинове в старите мюсюлмански ръкописи нямат нищо общо с това. Обикновено ги изобразяват мускулести, с човешка или животинска глава, често пъти с рога, зъбати, понякога имат крила. Това не са падналите ангели от християнството. В исляма такива няма. Даже архизлодеят на Корана – Иблис, е джин, пише го в Коран 18:50: „И когато рекохме на ангелите: „Сведете чела пред Адам!“, те се поклониха, освен Иблис. Той бе от джиновете…“ Вижте ги например тук в стари ръкописи… Та, чудя се, дали има истории за среща на съвременни мюсюлмани с извънземни, които да пресичат културните граници. Например да ги отвличат не зъбати и крилати джинове, а хуманоиди с яйцевидни глави. Е, да не насилваме историческите и културните особености. Пък и да не забравяме, че ако има „небесни твари“, които са разумни и от време на време избират да се явят на хората, те могат или да приемат различна форма, или съответните култури да ги възприемат според собствените им понятийни условности.
Но докато дослушвам подкаста, един от участниците изплюва камъчето. Колкото и да се спекулира около възможните обязаности на обитателите на Космоса – например как се женят, как извършват ритуално умиване и прочее (покрай всичко зачудвам се и как ли се обрязват), – се стига до признание. Мюсюлманската ритуалност в Свещения закон е изградена около идеята за централна роля на човечеството. Няма мърдане. И Коранът, и Сунната, и мюсюлманското право важат най-вече за него. Тоест продължавам същата нишка на разсъждение. Ако си нарушил „границите на Аллах“ (Коран 4:13) и ти се полага наказание свише, което никой не може да промени – като отрязването на ръката на крадеца, пребиване с камъни за прелюбодейство, камшици за алкохол например, – няма голямо значение дали другите разумни същества във вселените на „Господа на световете“ подлежат на същото. Свещеният закон може да е всеобхватен, но не е безогледен. В него си има приоритети. И извършеното от хора в сферата на човешкото безспорно е един от тях.
В рубриката „Ориент кафе“ Атанас Шиников поднася любопитни теми, свързани не толкова с горещата политика, колкото с историята и културата на Близкия изток. А той, древен и днешен, е по-близко до нас и съвремието ни, отколкото си представяме.
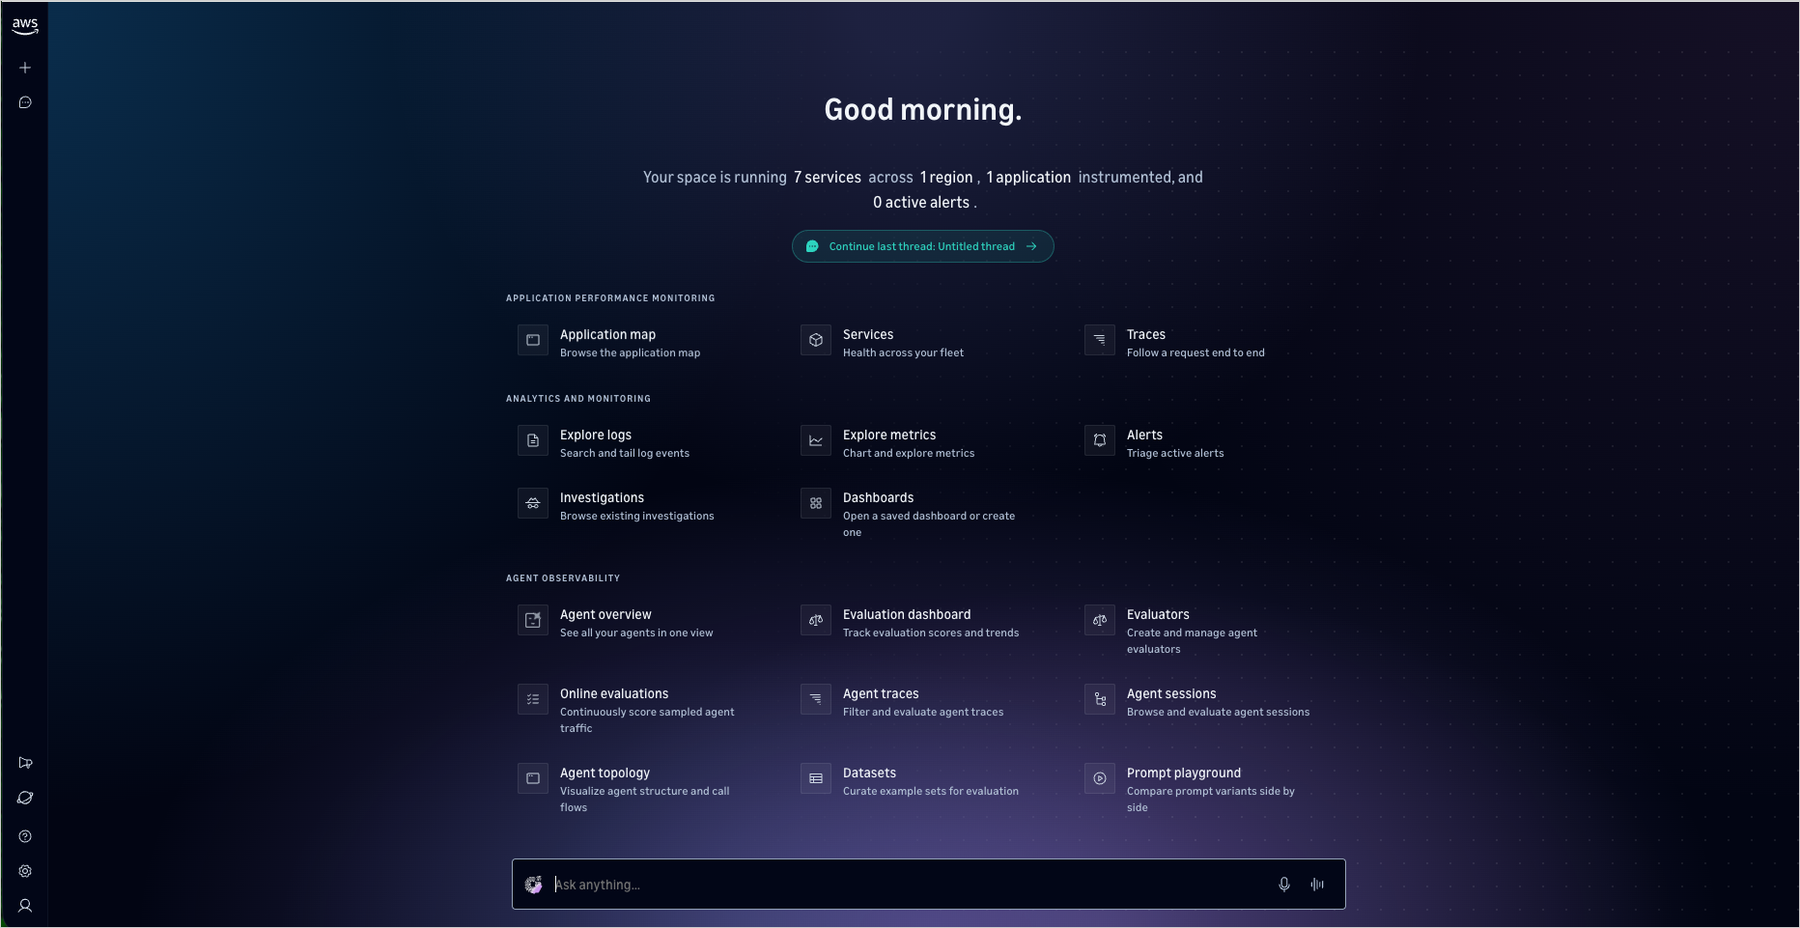
Amazon CloudWatch now offers CloudWatch Omni, an AI-powered observability experience for the applications and AI agents you run together. You reach Omni through a dedicated URL for your organization and sign in with the identities you already manage, so working in Omni does not require access to the AWS Management Console. Omni is built on OpenTelemetry: the telemetry you already send to CloudWatch appears in Omni with nothing to reconfigure, and any other workload you instrument with OpenTelemetry sends its telemetry to an OpenTelemetry Protocol (OTLP) endpoint.
CloudWatch Omni offers both agent observability and application observability in a single experience. In our companion post, we introduced the agent observability capabilities of Omni for generative AI and agentic workloads. In this post, we present the application observability experience.
Engineering teams spend a significant portion of their observability time maintaining dashboards, tuning thresholds, and switching between tools to piece together what happened during an incident. When an issue crosses team boundaries, context gets lost in Slack threads and screenshots rather than flowing naturally to the next engineer. CloudWatch Omni changes this by organizing observability around your applications rather than individual signals, and bringing your whole team into the same workspace.
What CloudWatch Omni brings
CloudWatch Omni addresses three problems that engineering teams told us they face today.
One collaborative experience for your whole team. Every engineer accesses CloudWatch Omni through a single URL with enterprise SSO (via IAM Identity Center, supporting Okta, Azure AD, and other providers). No AWS Console access is required. SREs, developers, database engineers, and managers share the same data and investigation context. When an investigation escalates, the next person joins the same session with full context already in front of them.
The system adapts as your applications evolve. CloudWatch Omni discovers your services, maps dependencies, and adjusts alarms automatically. Instead of manually curating dashboards and tuning thresholds, you declare what matters (availability targets, latency budgets, error rate thresholds) and Omni adapts as your system changes. When you deploy new services, Omni updates the application topology automatically.
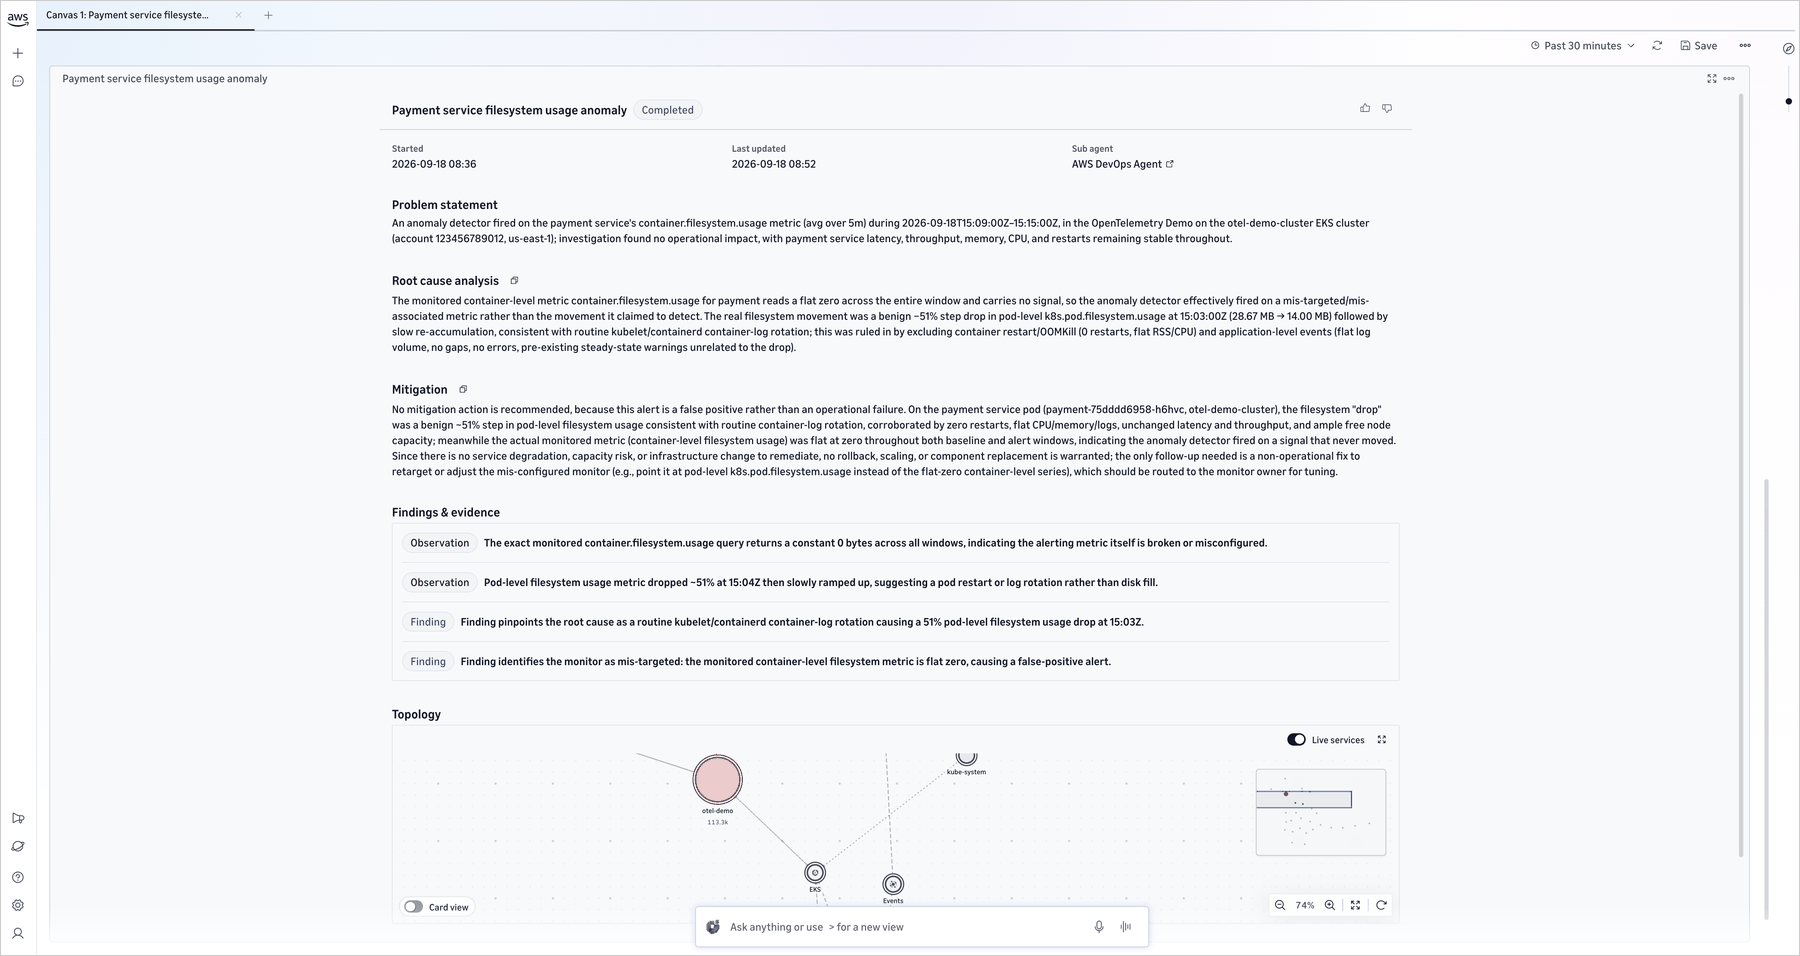
AI-powered investigation with Amazon DevOps Agent.Amazon DevOps Agent participates alongside your team in investigation sessions, correlating signals and suggesting next steps. The agent works from the same telemetry your engineers see, so its suggestions are grounded in the actual state of your application. It identifies correlated events across services, traces root cause paths through your dependency graph, and maintains investigation history for post-incident review.
How an investigation works
When something breaks, CloudWatch Omni opens an investigation session pre-loaded with context. Here is a typical incident workflow:
An alarm fires on elevated error rates in your checkout service. Omni opens a session showing the service topology, correlated signals (a deployment 10 minutes earlier, increased latency from a downstream payment API), and DevOps Agent’s initial analysis.
Your on-call SRE confirms the deployment correlation, pulls in the trace view to identify failing endpoints, and checks if the payment API latency correlates with a capacity limit.
The SRE escalates to the payments team. The payments engineer joins the same session and sees everything found so far, plus DevOps Agent’s correlation with a configuration change in the payment provider’s API gateway. They identify the root cause and roll back.
The entire investigation history is captured automatically. No separate incident report needed.
Walkthrough: setting up your first Space
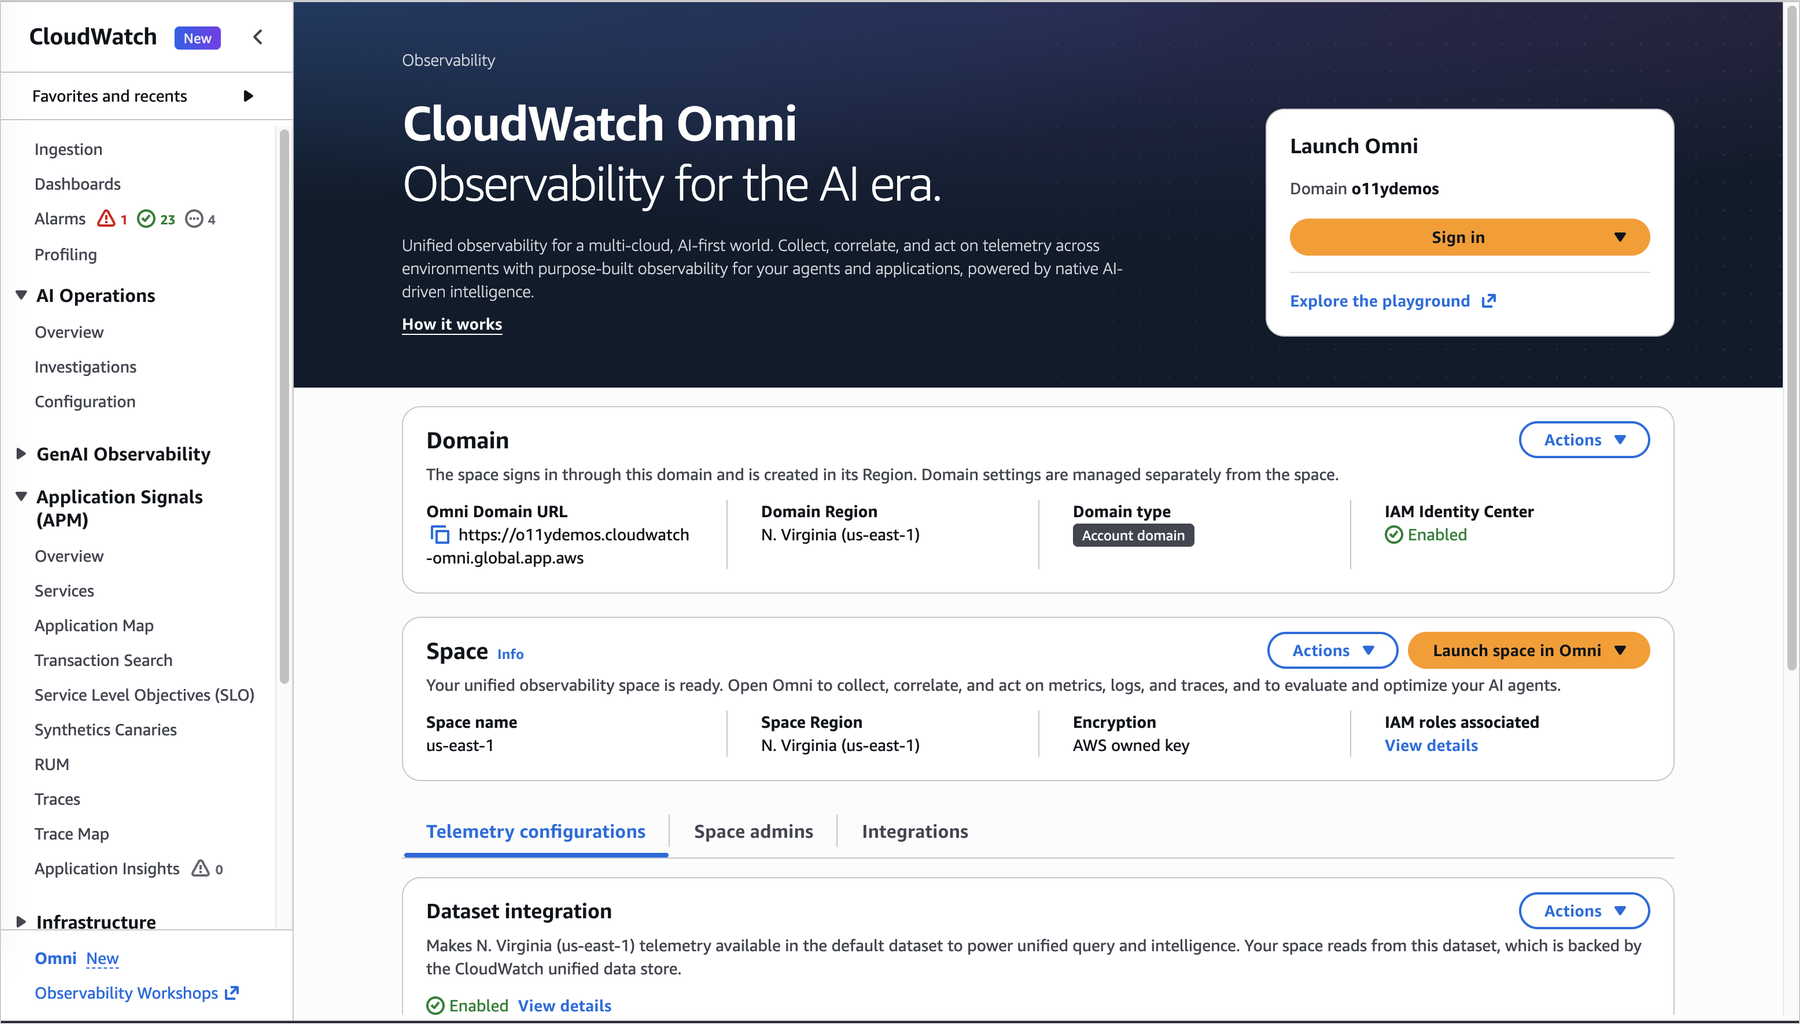
To set up CloudWatch Omni for your team, open the CloudWatch console and click “Try CloudWatch Omni.”
Figure 1. CloudWatch console — Omni setup page
Next, connect your identity provider through IAM Identity Center (supporting Okta, Azure AD, and other SAML 2.0 providers). Once connected, your team members access Omni directly at your dedicated URL without needing AWS Console credentials.
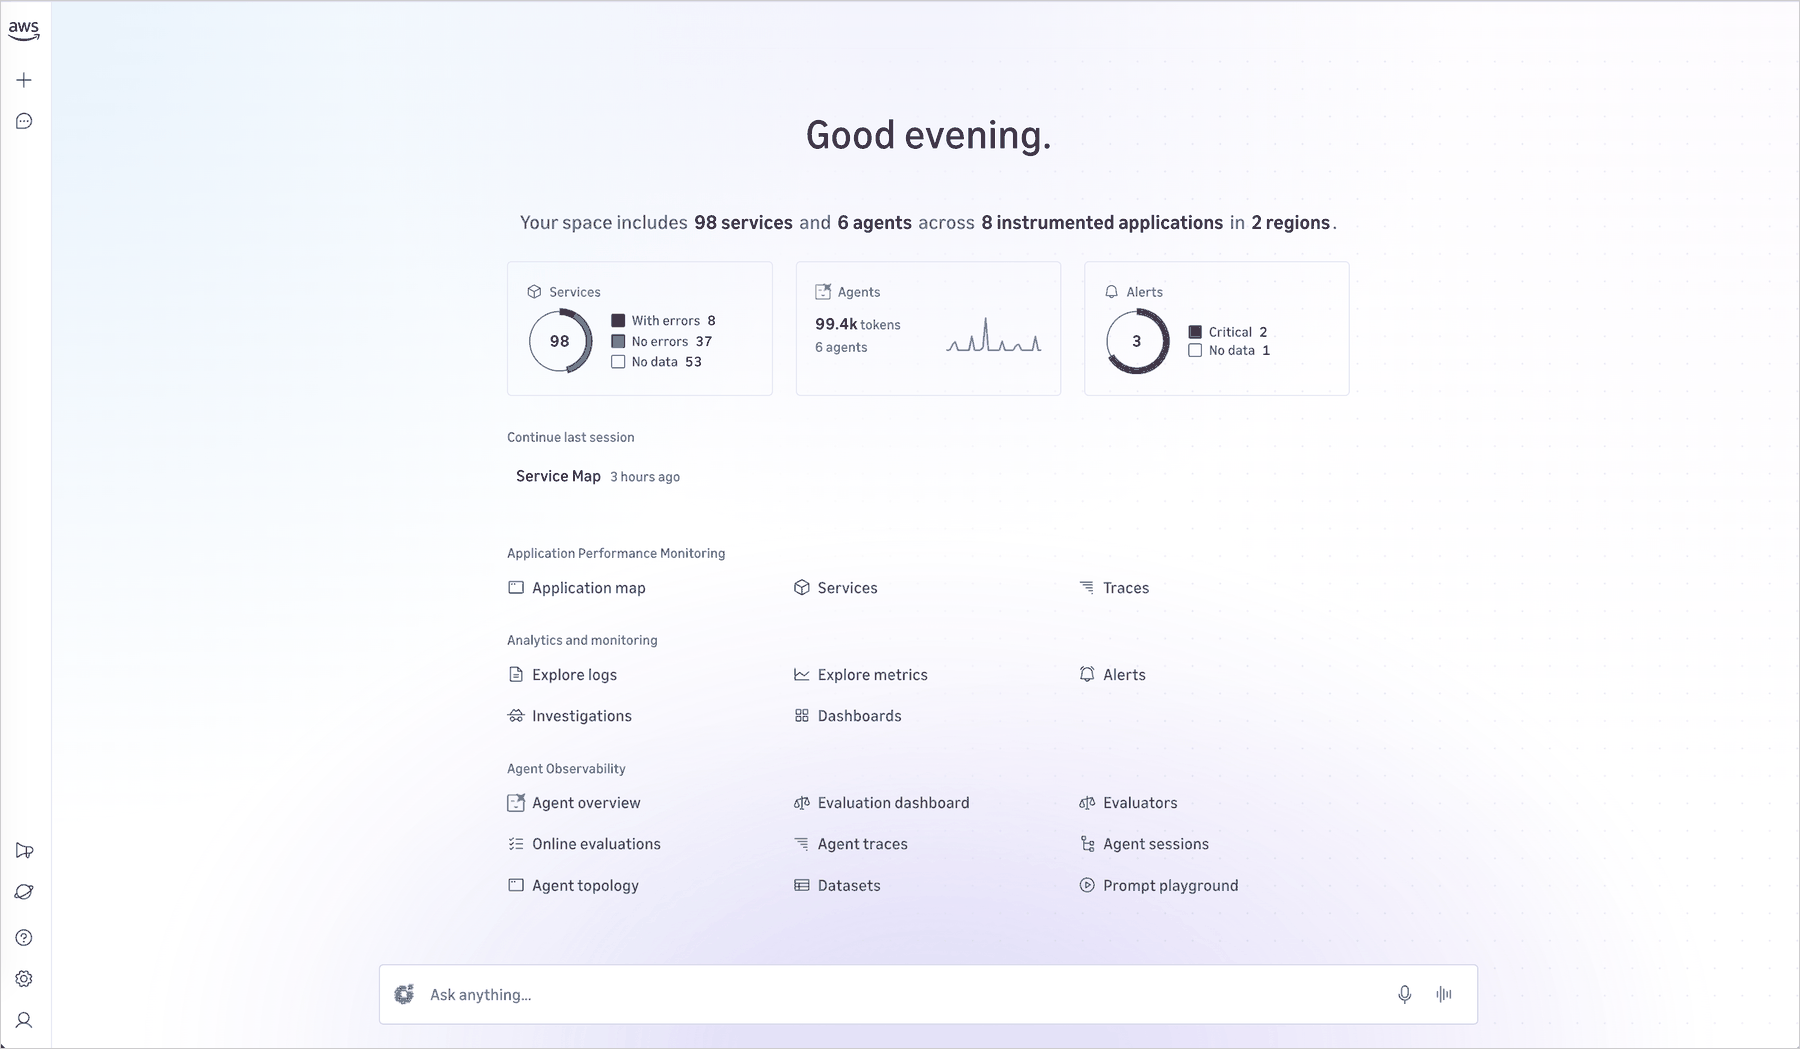
Create a Space for your team. A Space groups the applications your team owns and the telemetry associated with them.
Figure 2. CloudWatch Omni Home — your team’s workspace with application monitoring, analytics, and agent observability
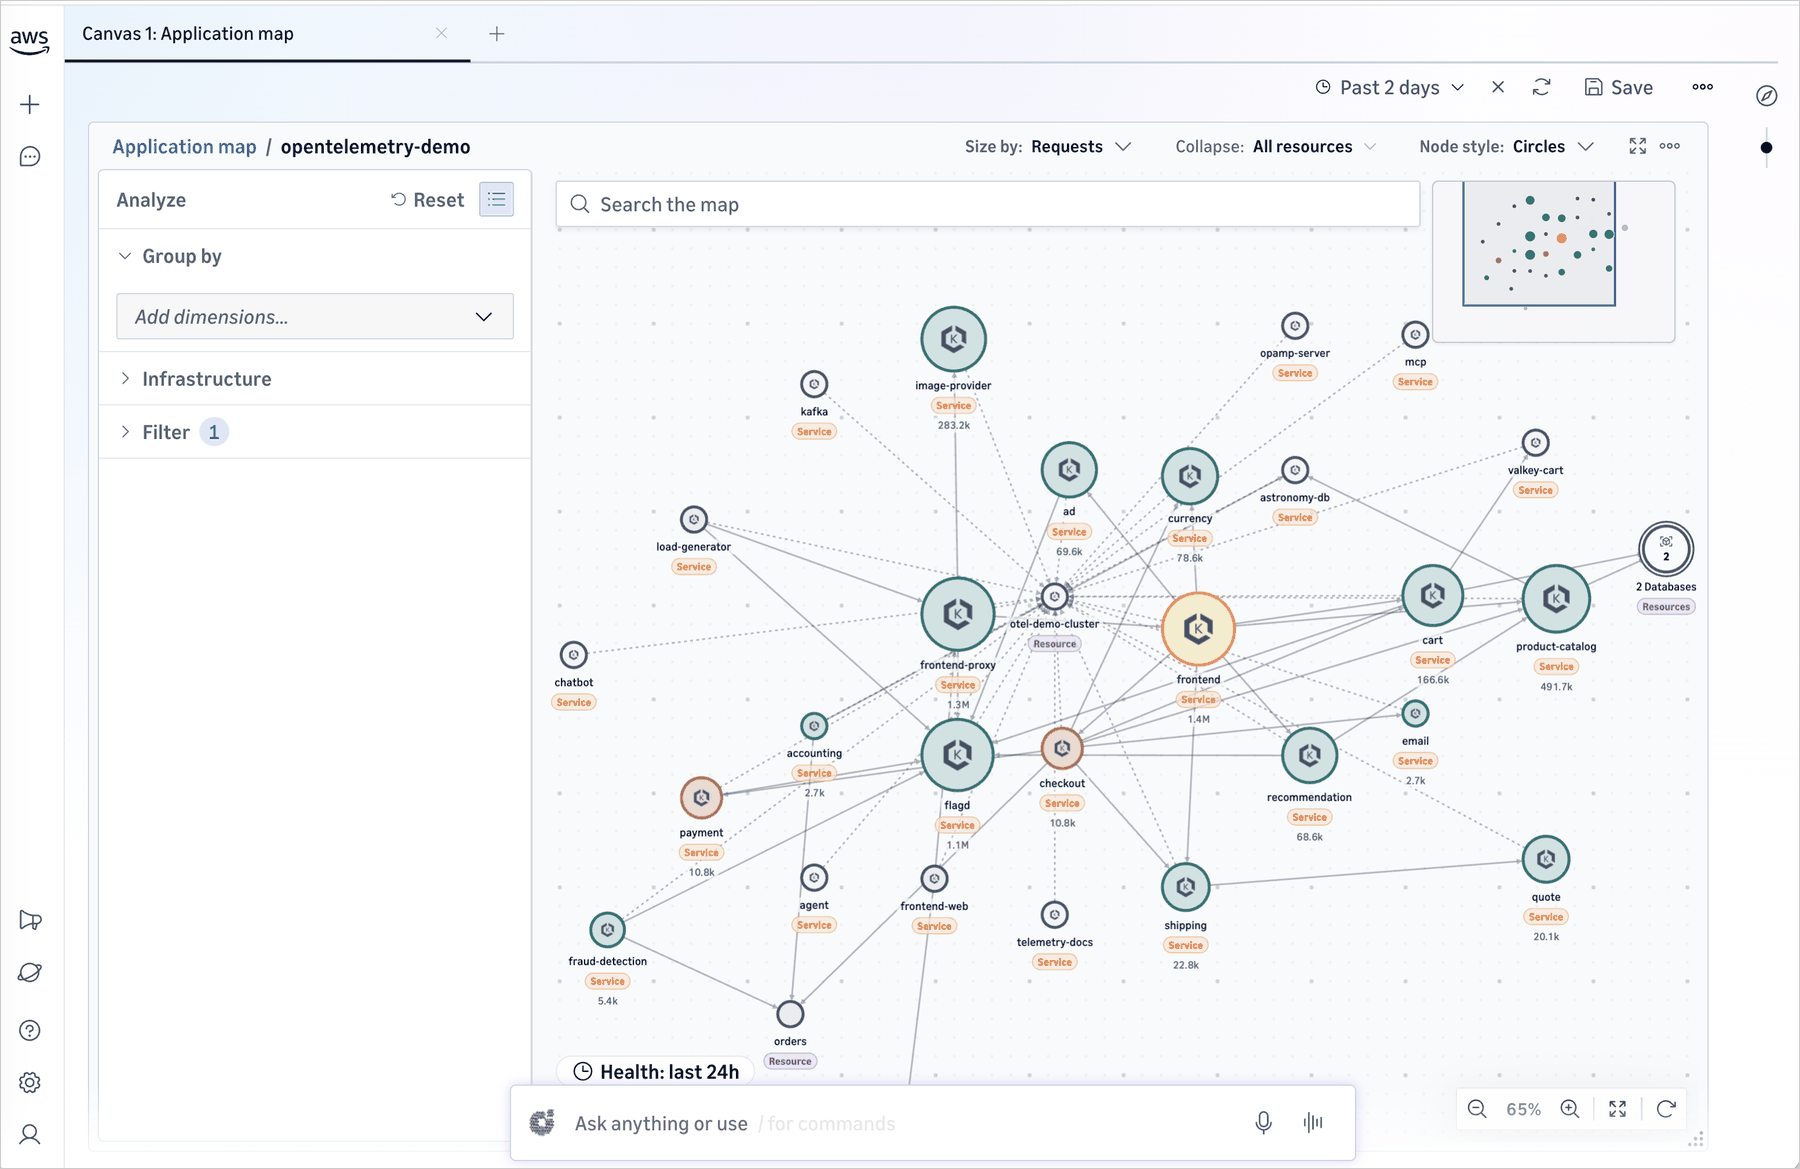
Once created, Omni discovers your services automatically and maps the dependencies between them. You see your application topology immediately.
Figure 3. Application topology — services and dependencies mapped automatically
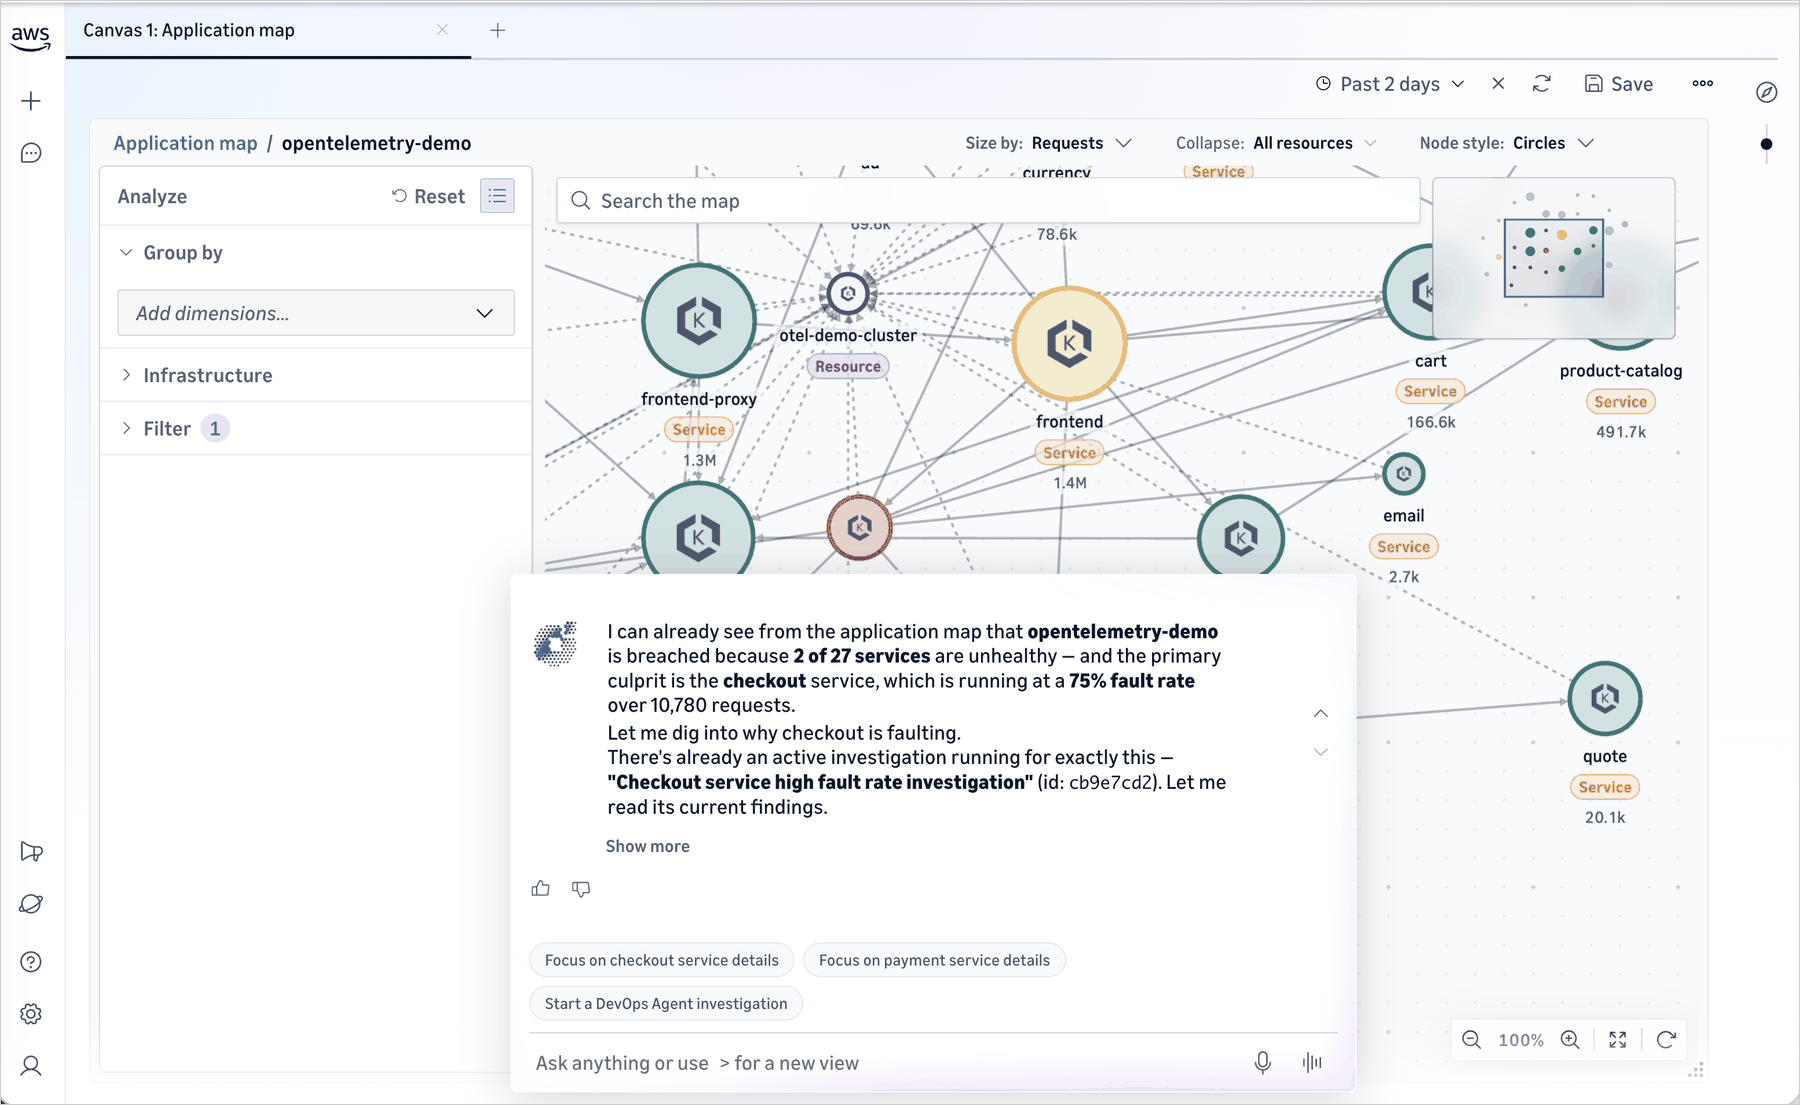
You can ask CloudWatch Omni any question about your applications in plain English, and Omni will analyze your telemetry data and surface insights.
Figure 4. Interact with your telemetry in natural language
You can also set up service health alerts, configure what matters to your team, and trigger an AWS DevOps agent investigation to identify the root cause and develop a mitigation plan.
Figure 5. Investigation session — DevOps Agent identifies root causes and suggests next steps
Application-centric organization
CloudWatch Omni organizes telemetry by application rather than by infrastructure component. The system automatically discovers services from the telemetry data and AWS Config resource discovery, maps dependencies, and lets you see your application as a connected system rather than a collection of isolated resources.
Each team gets a Space that contains the applications they own. A Space points at existing CloudWatch data (logs, metrics, traces, and alarms) with no additional data movement required. Dynamic views replace the maintenance burden of static dashboards, providing ongoing visibility into SLOs and application health.
Getting started
Getting started takes minutes and doesn’t require reconfiguration of your existing CloudWatch setup.
If you’re an existing CloudWatch customer: Click “Try CloudWatch Omni” in the CloudWatch console. All your existing telemetry (logs, metrics, traces, and alarms) is immediately available. Workloads are discovered automatically, and you can start an investigation or browse your application topology right away.
For organization-wide deployment: An administrator configures a domain, connects your identity provider via IAM Identity Center, defines Spaces for teams and environments, and invites users. Each Space points at existing CloudWatch data with no additional data movement required.
For applications in other environments: CloudWatch Omni provides connectors that make it easy to bring in telemetry from additional environments. All ingested telemetry appears alongside your AWS data in the same Spaces and investigation sessions.
For generative AI and agentic workloads: The same CloudWatch Omni experience delivers purpose-built observability for AI agents, including trace exploration, evaluation frameworks, and real-time monitoring. In our companion post, we introduced the agent observability capabilities of Omni; for that walkthrough, see Introducing Amazon CloudWatch Omni: AI-powered observability for generative AI and agentic workloads.
Things to know
CloudWatch Omni extends CloudWatch. Existing alarms, dashboards, APIs, and console workflows continue unchanged.
Access is through a dedicated web application with enterprise SSO. Engineers don’t need AWS Console access to use it.
Once you setup, DevOps Agent is enabled by default in every Omni investigation session.
Pricing and availability
Amazon CloudWatch Omni is now available. Existing CloudWatch customers can try it directly from the CloudWatch console. For pricing details, visit the Amazon CloudWatch pricing page.
If you want to call APIs, search documentation, find regional availability, and check troubleshooting about this feature, try using the AWS MCP Server and plugins with your preferred AI tool. Share your feedback on AWS re:Post or reach out through your usual AWS Support contacts.
Today, Amazon CloudWatch introduces CloudWatch Omni, a unified observability experience for application and AI workloads that is app-centric, AI-powered, built on open standards, and delivered off-console. CloudWatch Omni is a purpose-built observability, evaluation, and experimentation solution for AI agents. It helps teams design, evaluate, and operate AI agents across any model provider, framework, or runtime, with an eval-driven workflow, support for the tools you already use, and observability delivered where you work: directly in your IDE and through a standalone web experience, separate from the AWS Management Console.
Organizations deploying agentic AI systems face observability challenges that traditional monitoring can’t address. Agent behavior is non-deterministic: a prompt change can degrade response quality even when standard metrics show no errors. Teams spend hours manually reviewing logs across multiple systems, unable to pinpoint what changed or why. Existing tools force teams to choose between siloed generative AI monitoring or fragmented solutions requiring constant context-switching between their coding environment and browser-based dashboards.
CloudWatch Omni captures every trace and includes built-in evaluators for correctness, coherence, retrieval quality, and tool selection, among others. You can compare prompt versions side by side in the playground, build test datasets from production traffic, run experiments across different configurations, and detect regressions automatically.
Two surfaces for development and operations
CloudWatch Omni delivers observability through two complementary surfaces. Developers get a native extension inside VS Code and Kiro (the currently supported IDEs), where traces appear as you run your agent with a playground and evaluators a click away. Operators get a standalone web experience, separate from the AWS Management Console to monitor the fleet, accessible through SSO with no AWS console needed. Both share the same data: the trace a developer debugs is the trace an operator investigates.
The Cloud Login feature connects your local IDE environment to your AWS account, enabling you to send telemetry data to Amazon CloudWatch for persistent storage, share traces with your team, and access production dashboards. This connection is optional. You can use CloudWatch Omni entirely locally during development, then connect to the cloud when you are ready to monitor agents in production.
Getting started
CloudWatch Omni offers two ways to get started: through the IDE extension (for VS Code and Kiro) or directly through the cloud experience, where you can start sending telemetry data to CloudWatch without installing any IDE extension. In this walkthrough, I install the extension, create an agent, run it, and explore the traces and evaluation tools from my IDE.
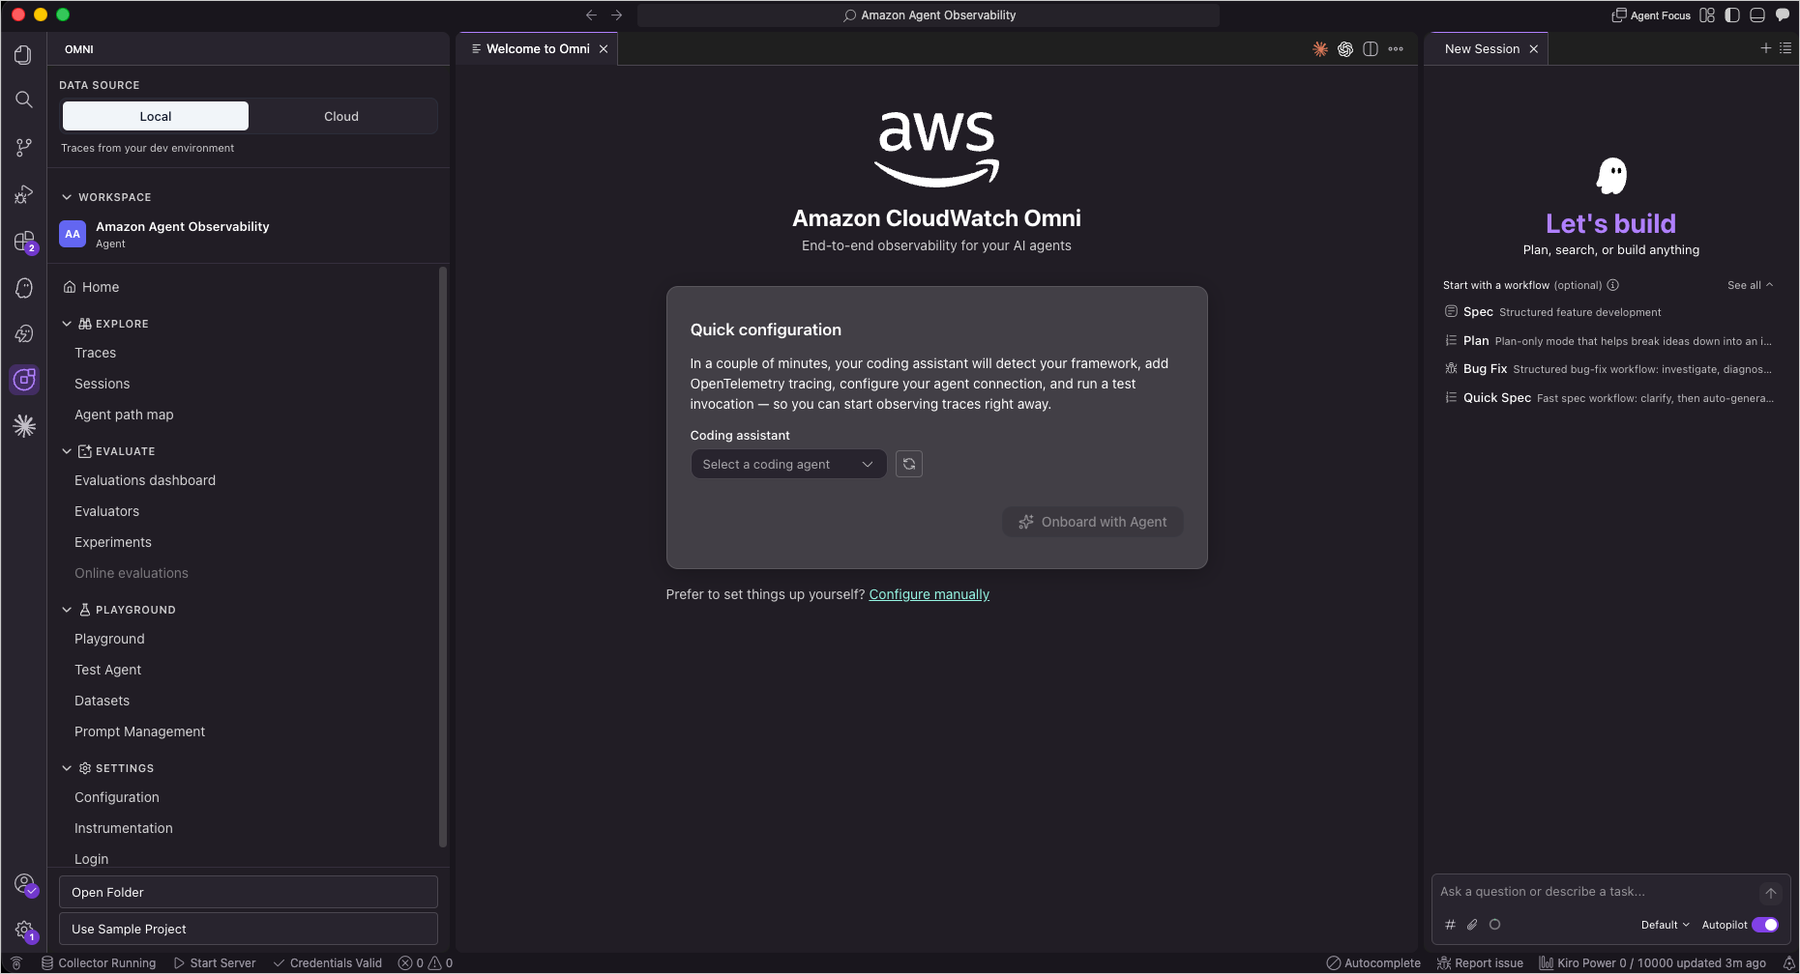
After installing the CloudWatch Omni extension from the VS Code Marketplace, the CloudWatch Omni icon appears in the Activity Bar. From the welcome screen, I selected Get started with Sample Project to load a pre-configured agent with sample trace data or use shortcut to Command Palette using Command + Shift + P (on macOS) or Ctrl + Shift + P (on Windows/Linux) and select Omni: Create a new Project
Figure 1. CloudWatch Omni welcome screen & create new project in VS Code
The sample project comes with an agent implementation and example datasets. Part of the getting-started experience is adding OpenTelemetry instrumentation, and CloudWatch Omni guides you through each step. You can also create a new agent from scratch. CloudWatch Omni walks you through the process using an interactive chat where you define the agent’s purpose, select a model provider, and configure tools. All data is stored locally by default. You can optionally connect to AWS to send data to Amazon CloudWatch.
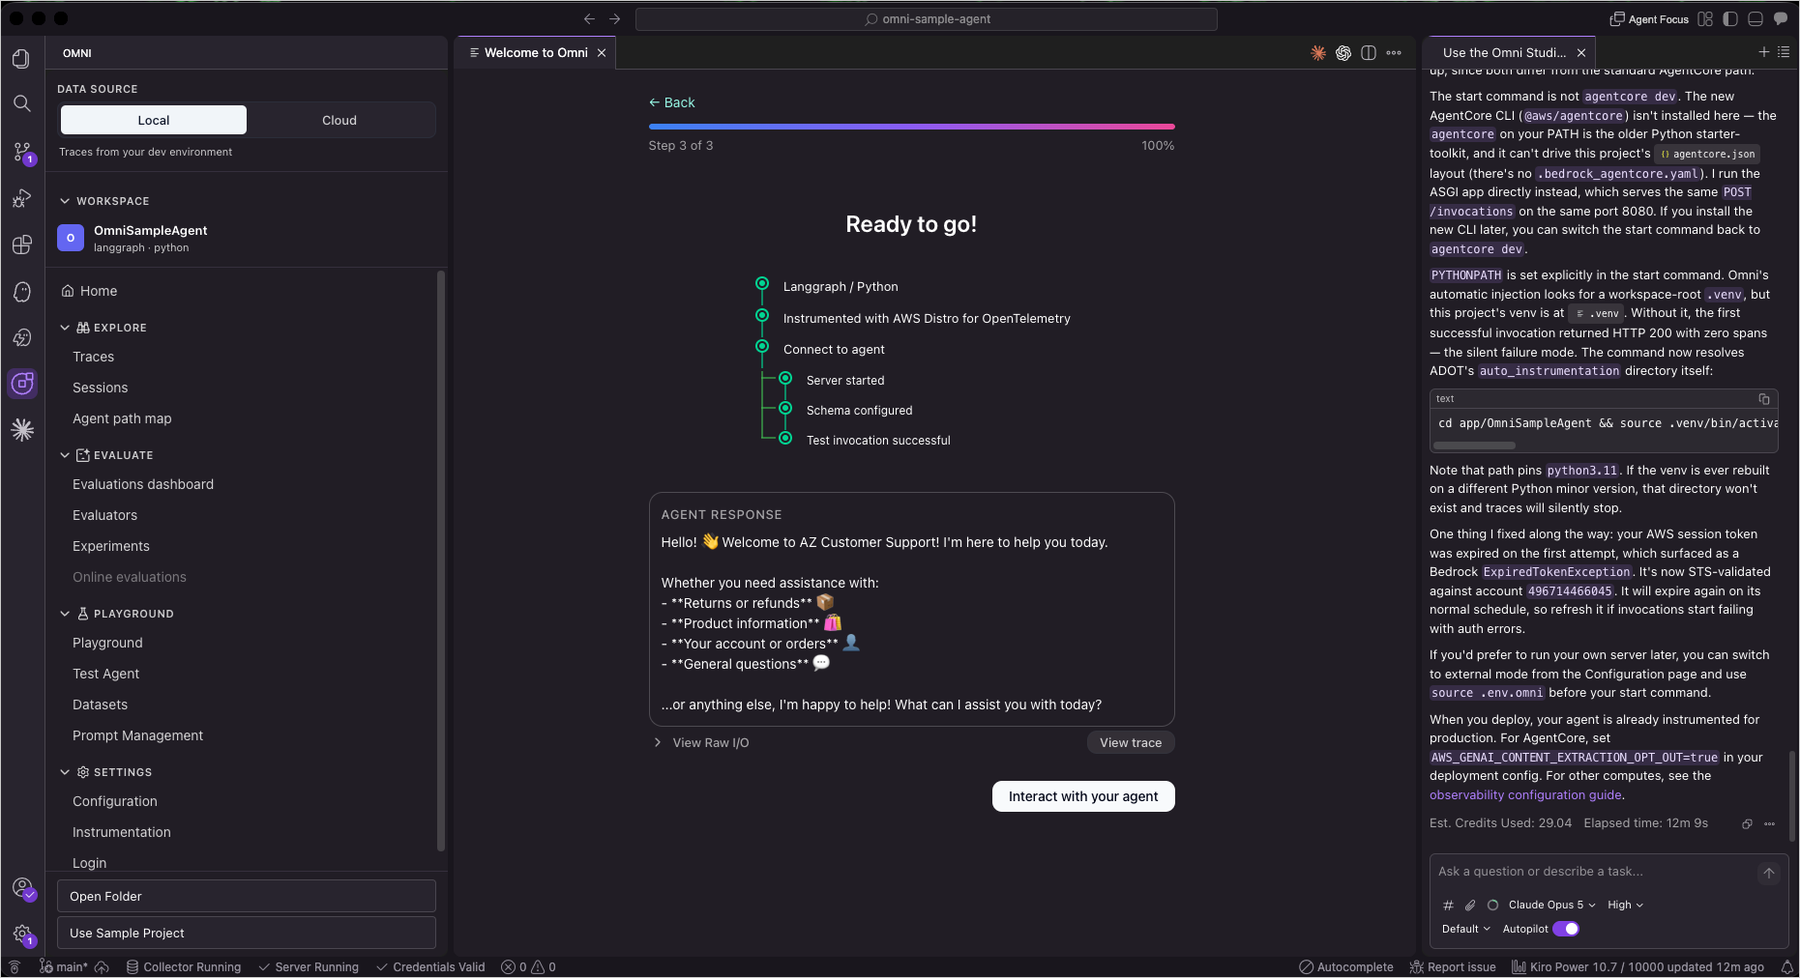
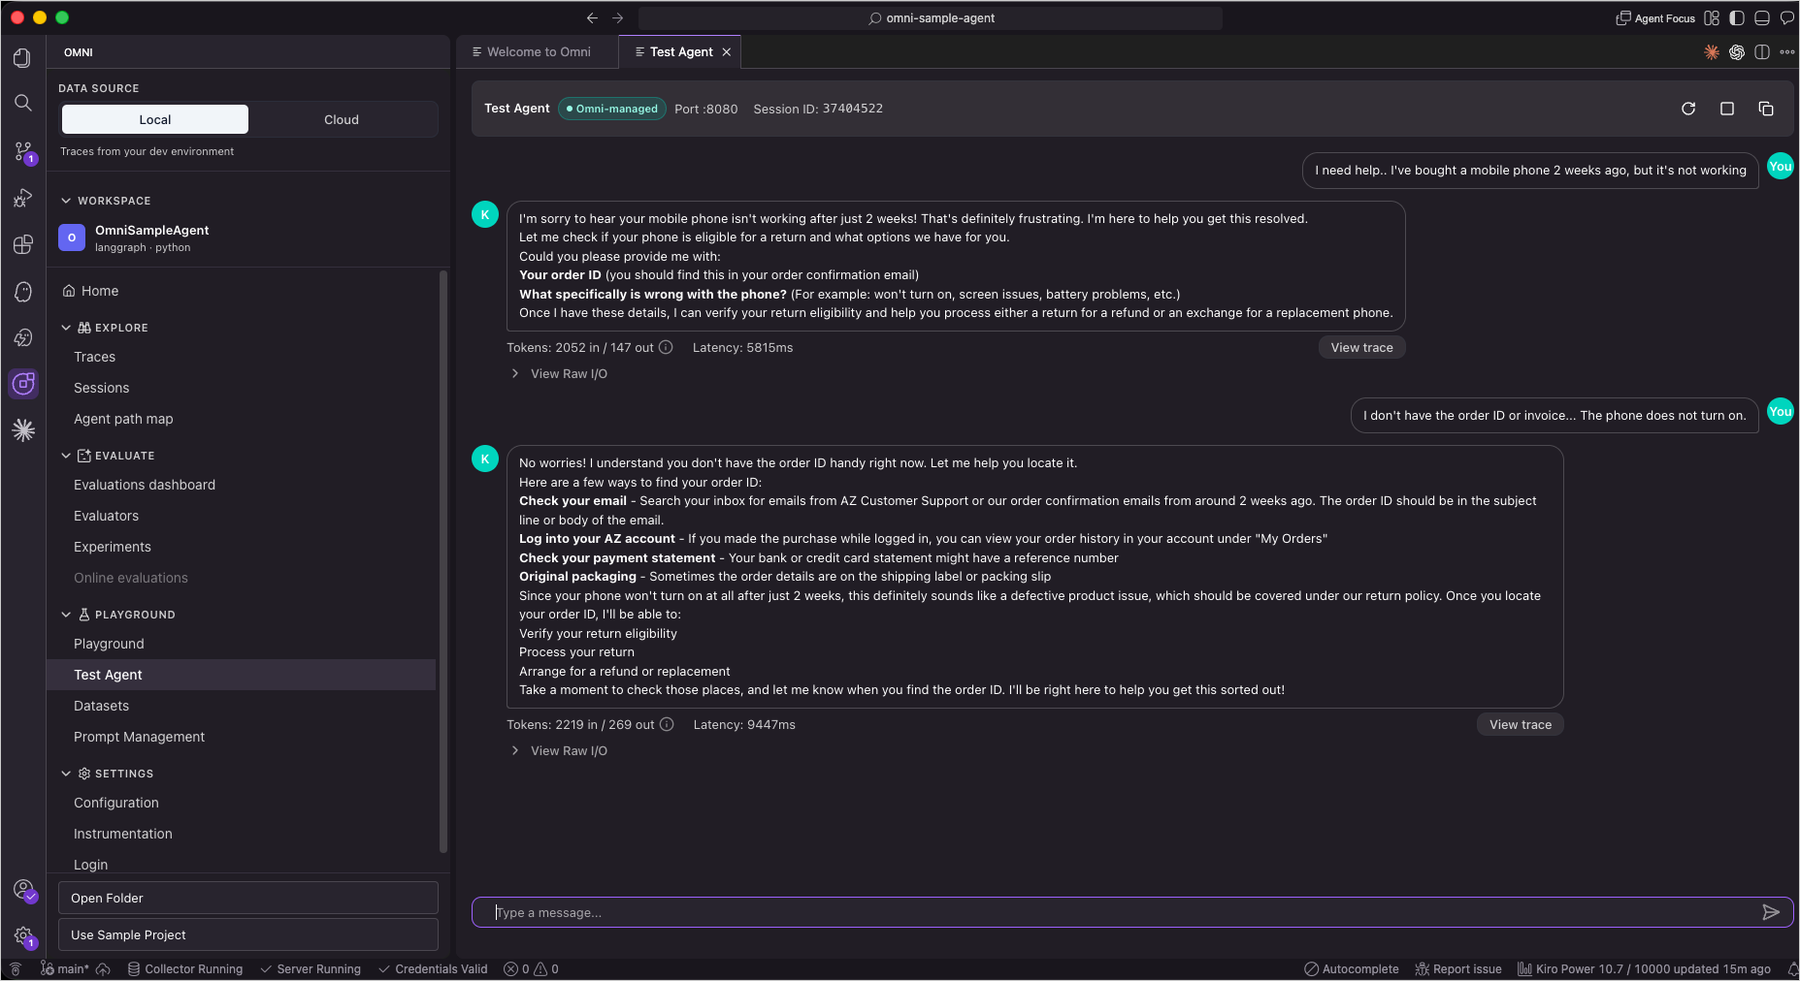
After verifying the configuration, I started the local dev server and sent a question to the agent. What makes this different from a typical chatbot interface is what happens next: selecting View Trace shows exactly how the agent processed the request.
Figure 2. CloudWatch Omni guides your AI code assistant to configure the local development environment for testing
CloudWatch Omni integrates with AI code assistants such as Kiro, Claude Code, and Codex to streamline the setup process. These assistants can configure the Dev Server, install dependencies, and set up instrumentation on your behalf, so you can go from installation to running your first traced agent session in minutes without manual configuration.
Figure 3. Interacting with the agent and viewing traces
Traces are essential for understanding AI agent behavior. Unlike traditional request-response systems, agents make multiple decisions per invocation: choosing tools, composing prompts, and chaining sub-calls. Without full trace visibility, diagnosing why an agent produced an incorrect answer or took an unexpected path becomes guesswork. CloudWatch Omni records every step in a structured timeline so you can pinpoint exactly where behavior diverged.
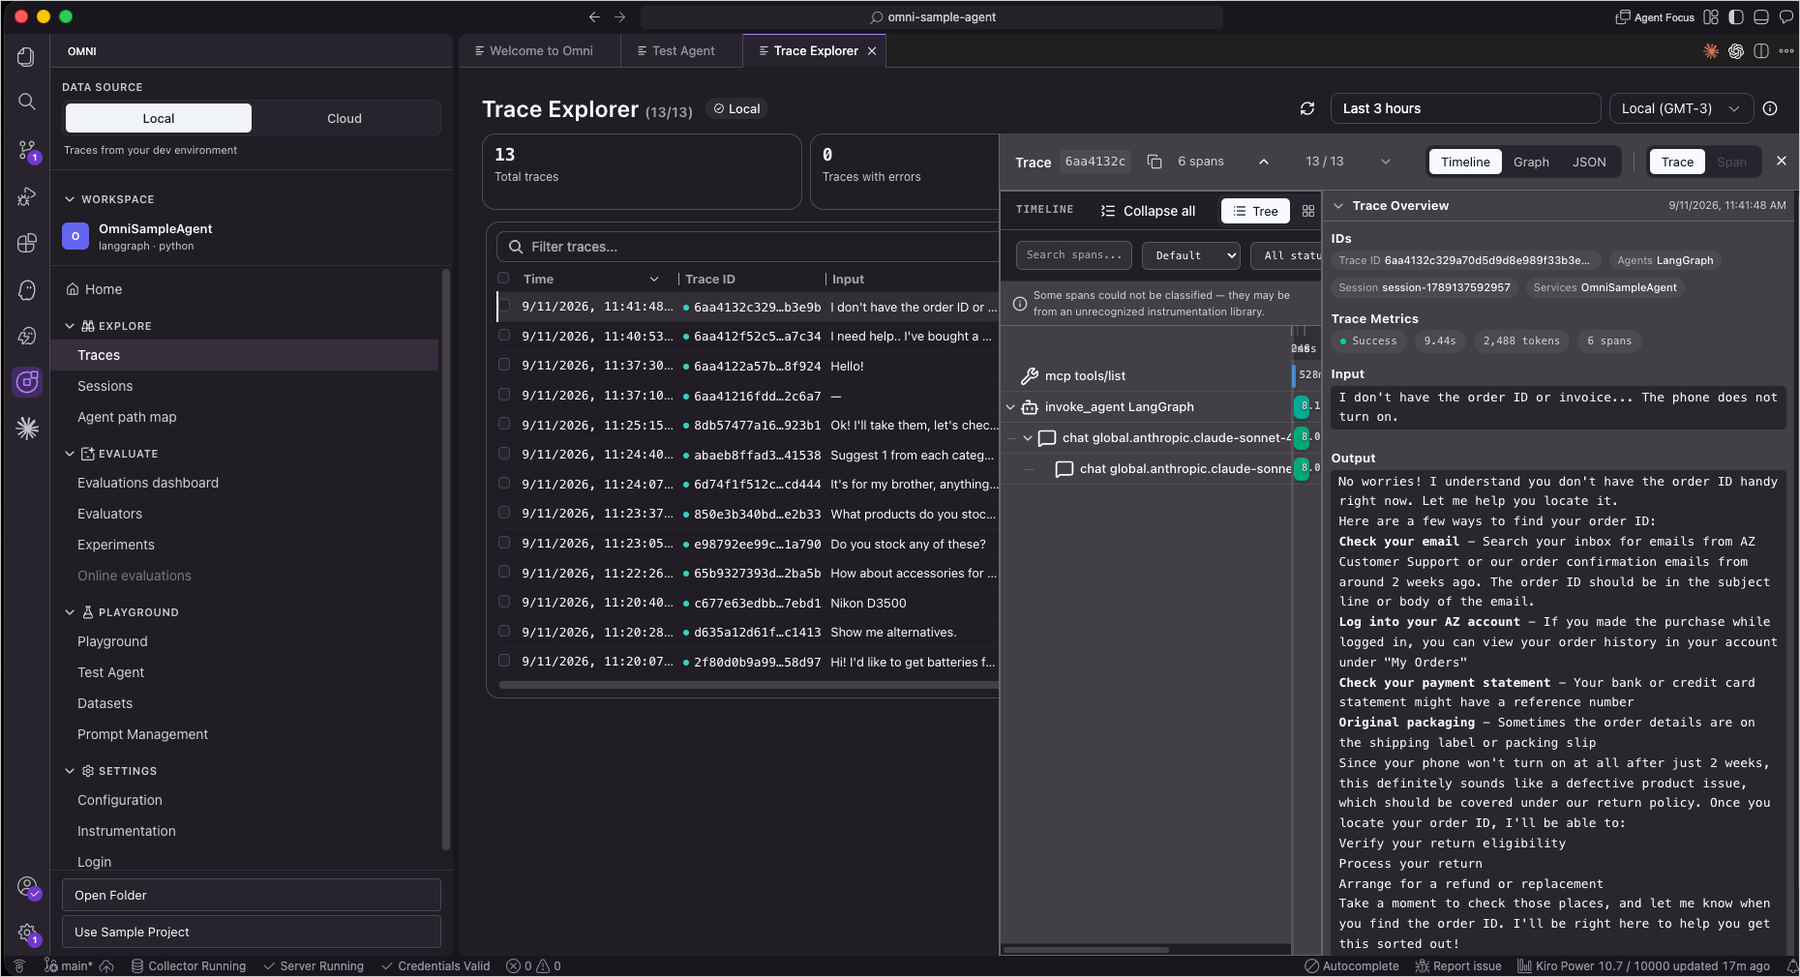
The Trace Explorer shows a detailed breakdown of every step the agent took (LLM calls, tool invocations, and reasoning steps) in a structured, hierarchical timeline. I could drill into any span to inspect inputs, outputs, token usage, and latency.
Figure 4. Trace Explorer showing the agent’s execution timeline
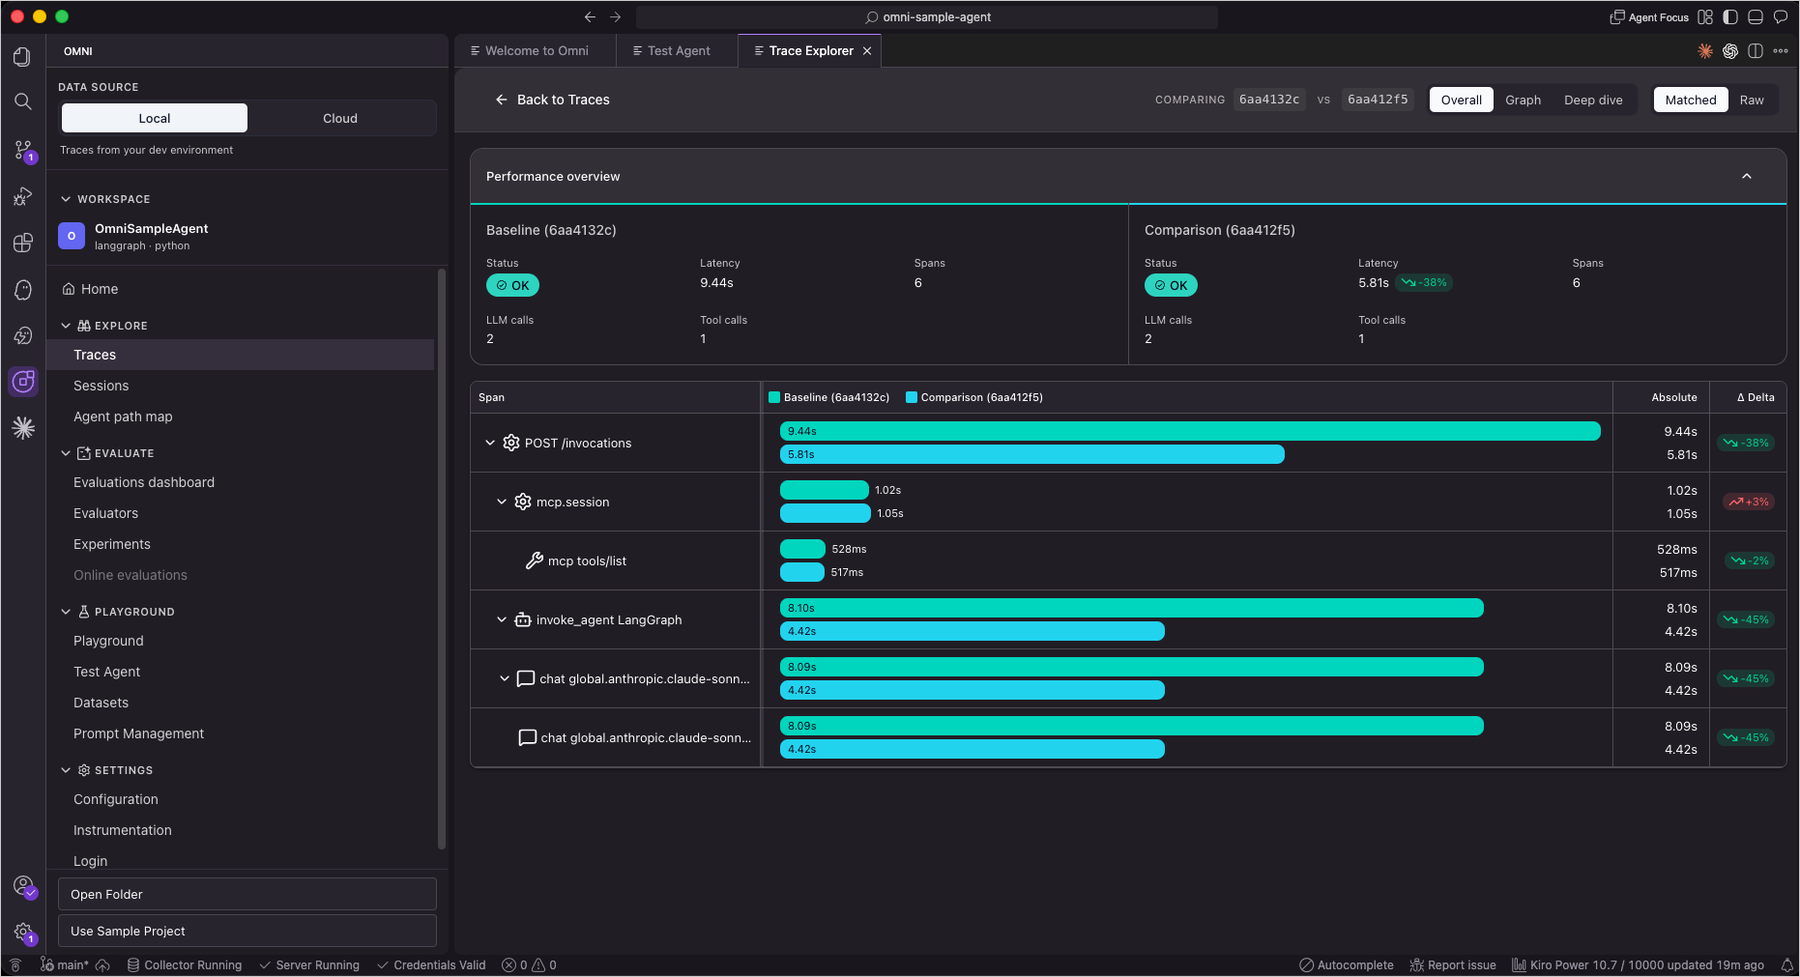
The Trace Explorer also supports Compare mode, which places two traces side by side to see how different prompts or configurations affect behavior. Compare mode is especially helpful when debugging regressions. And with Ask Assistant, an AI agent analyzes your traces to surface patterns and anomalies, answering questions like “Why did the agent call this tool twice?”
Figure 5. Comparing two traces side by side
Evaluation is what turns observability into actionable quality improvement for generative AI. Traditional metrics like latency and error rate cannot tell you whether an agent’s response was helpful, coherent, or factually correct. Evaluators score each response against quality dimensions, letting you measure what users actually experience and catch regressions that standard monitoring misses entirely.
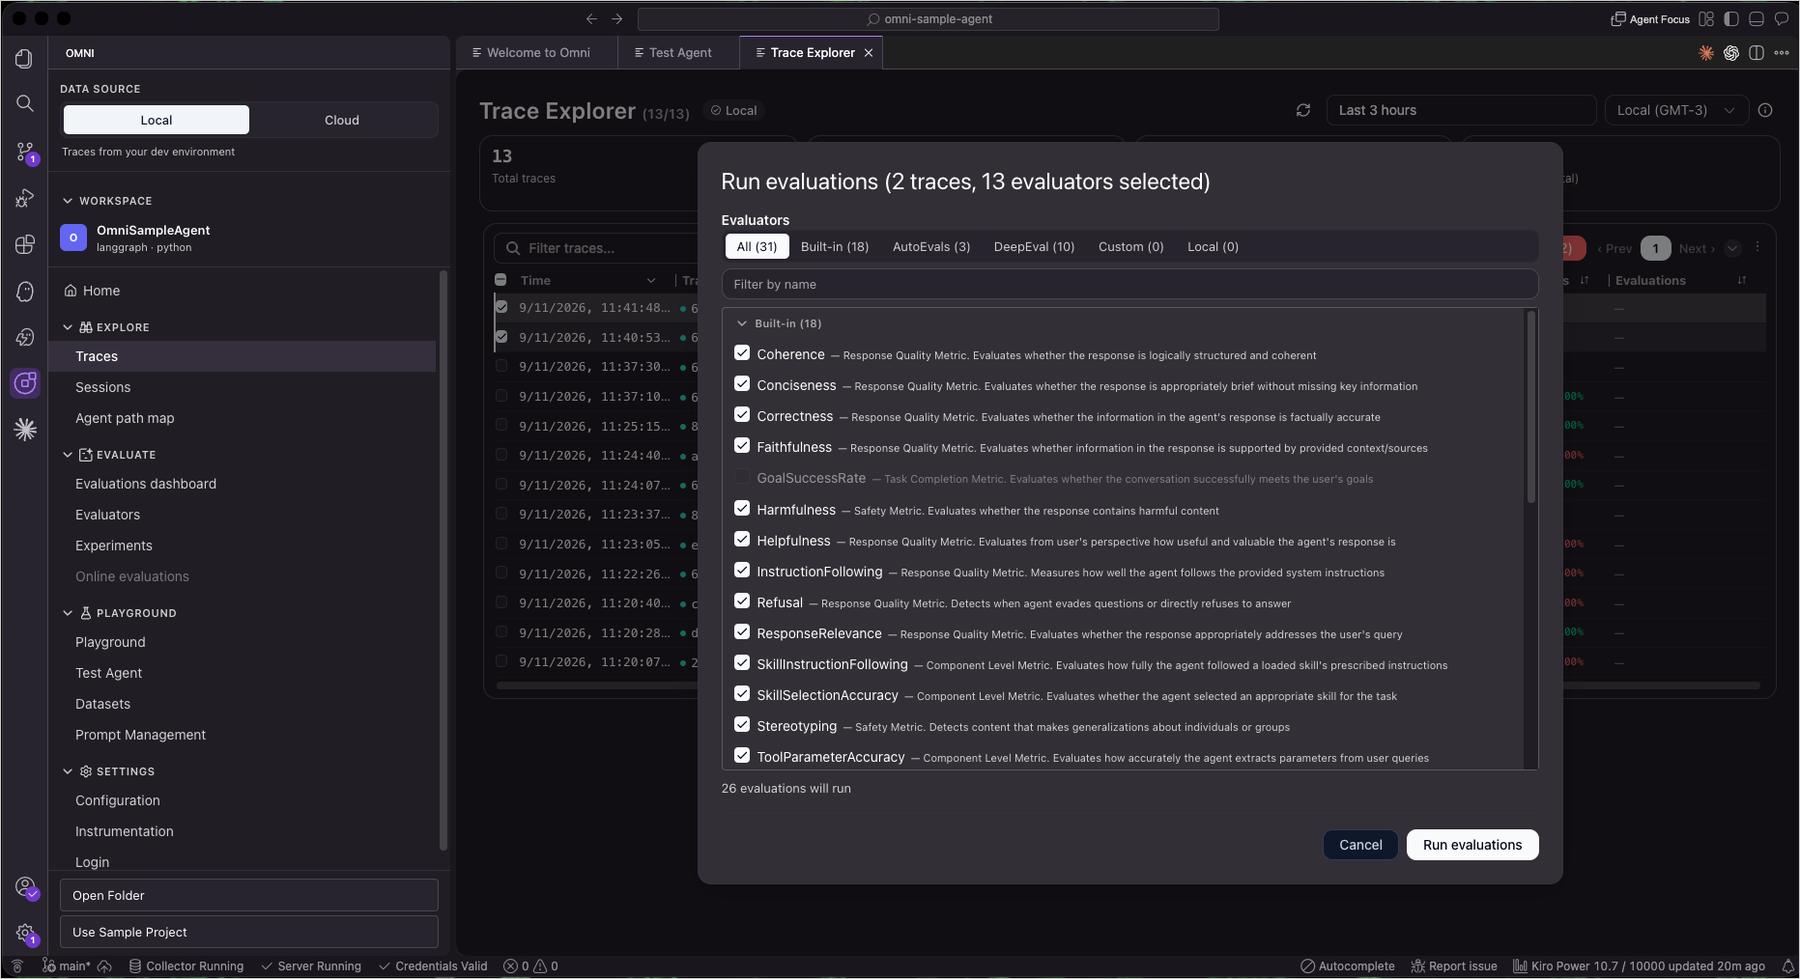
CloudWatch Omni includes 17 built-in evaluators for metrics like coherence, helpfulness, faithfulness, and routing correctness. I selected traces from the Trace Explorer, chose evaluators, and ran an evaluation, getting per-example scores and aggregate metrics without building any custom evaluation framework.
Figure 6. Running evaluations on traces
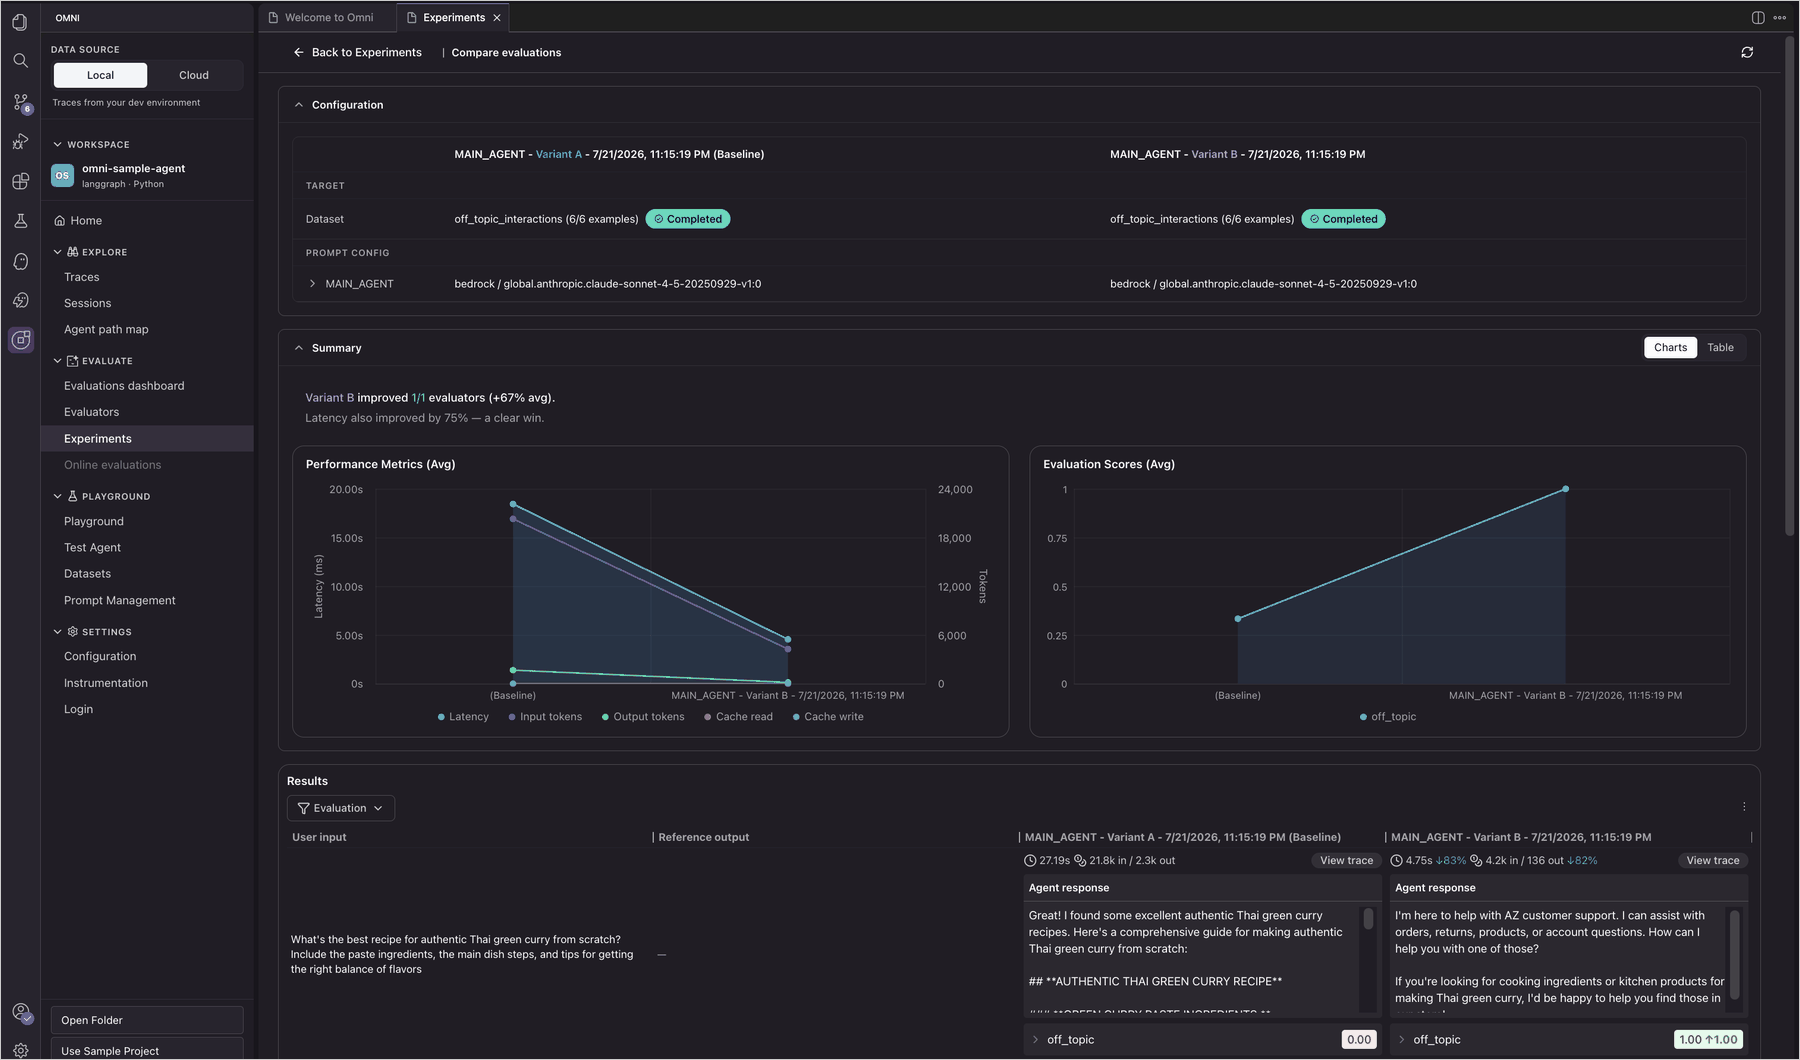
From there, I used the Playground to test different system prompts side by side, comparing multiple model and prompt configurations in real time to see how each variation affects output quality before committing changes. With the Experiments view, I could run the same dataset against two agent variants and compare their evaluation scores, latency, and token usage side by side to pick the best-performing configuration.
Figure 7. Comparing evaluations across agent variants in the Omni Experiments console
With Prompt Management, you can version and track prompt configurations over time, making it easy to roll back when a new version underperforms.
CloudWatch Omni also provides a Session Explorer to review full conversation histories and understand how agents handle multi-turn interactions, along with an Agent Topology view that visualizes the architecture of your agent system, including sub-agents, tools, and their interconnections. You can drill into any node to inspect performance and identify bottlenecks.
CloudWatch Omni also offers a dedicated web experience accessible from any browser without an IDE. Teams can access all capabilities collaboratively, including application monitoring, analytics, agent observability, and AI-powered investigations.
Figure 8. CloudWatch Omni web experience with application monitoring, analytics, and agent observability
I curated traces into golden datasets for structured experimentation. The Experiment function runs the agent against a dataset and automatically scores results, creating benchmarks for regression testing whenever prompts or agent logic change.
If you already have an agent built with a supported framework, CloudWatch Omni provides two paths to add instrumentation: Auto-instrument with Kiro, which detects your framework and configures tracing automatically, or manual instrumentation with ready-to-use code snippets for Python and TypeScript. For detailed instrumentation guides, see the CloudWatch Omni documentation.
Supported frameworks and open standards
The walkthrough above uses the sample project, but CloudWatch Omni works with the agent frameworks teams are already using: LangChain, LangGraph, CrewAI, OpenAI SDK, Strands, Vercel AI SDK, and more, in both Python and TypeScript. It also provides native observability for agents built with Amazon BedrockAgentCore, and uses AgentCore’s evaluation capabilities to assess agent quality directly within the Omni workflow.
Instrumentation uses open standards (OpenInference and ADOT), whether your agents run on Lambda, ECS, EKS, or other clouds. For evaluation, Omni integrates with third-party evaluators including Braintrust, DeepEval, and Ragas, alongside built-in datasets, a playground, and batch experiments. No re-platforming required.
Amazon CloudWatch Omni is now generally available. The IDE extension is free to use. You don’t need an AWS account to get started. You only need AWS credentials for Amazon Bedrock models, or API keys for other providers like OpenAI or Anthropic. Get started today by installing the extension from the VS Code Marketplace.
If you want to call APIs, search documentation, find regional availability, and check troubleshooting about this feature, try using the AWS MCP Server and plugins with your preferred AI tool. Share your feedback on AWS re:Post or reach out through your usual AWS Support contacts.
AWS Lambda MicroVMs is a serverless compute building block that provides VM-level isolation, near-instant startup performance, and state retention. You can now give each user or job their own execution environment to securely run just-in-time code, whether user or AI-generated. You do this without managing virtualization infrastructure or choosing between isolation, speed, and state retention. Lambda MicroVMs are powered by Firecracker virtualization, the technology underpinning AWS Lambda.
When you run a workload on AWS Lambda MicroVMs, each MicroVM is reachable at a service-generated endpoint that looks like 92cfc7f9-….lambda-microvm-….on.aws. That works, but many teams want to expose their MicroVMs under a domain they own, such as 92cfc7f9-….microvms.example.com. When a browser is the client, they also want to satisfy cross-origin resource sharing (CORS) without changing the application inside the MicroVM.
Both are achievable today, entirely from load-balancing and networking primitives. There is no Amazon CloudFront distribution and no compute in the request path. All you need is an Application Load Balancer (ALB) that terminates TLS with your AWS Certificate Manager (ACM) certificate, rewrites the Host header, and forwards the request over AWS PrivateLink. In this post you’ll deploy that pattern with the AWS Cloud Development Kit (AWS CDK), map a wildcard of custom domains onto your MicroVMs, and let the ALB handle CORS for you.
The complete, deployable example is available as a pattern on Serverless Land. This walkthrough centers on the reusable networking pattern. The sample also includes a small demo application that provisions a MicroVM and mints an access token, which we reference but do not detail here.
What you’ll build
By the end you’ll have:
A wildcard custom domain like *.microvms.example.com, where each <uuid>.microvms.example.com maps transparently to the corresponding MicroVM.
An internet-facing ALB that rewrites the incoming request’s Host header to the real MicroVM endpoint and forwards requests to it privately over PrivateLink.
CORS preflight and response headers handled at the ALB, with no change to the code running in the MicroVM.
Calling https://<uuid>.microvms.example.com/<path> (with the MicroVM access headers described later) reaches the right MicroVM, with your domain intact end to end.
Solution overview
The request flow looks like this:
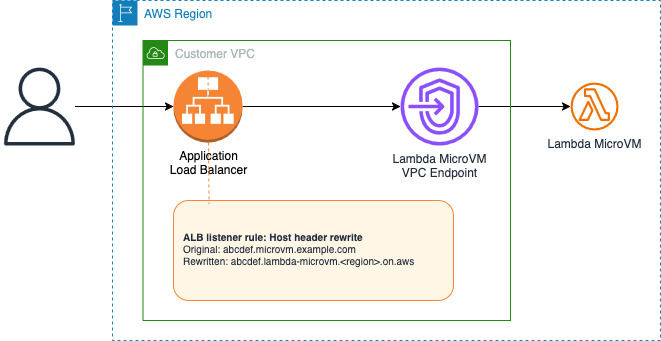
Request flow from a browser through the Application Load Balancer, which terminates TLS and rewrites the Host header, then forwards over AWS PrivateLink to the Lambda MicroVM service.
The key component is the ALB host header rewrite, introduced in URL and host header rewrite for Application Load Balancers. A listener rule matches the incoming custom host with a regex condition, captures the MicroVM ID from the left-most label, and a host-header-rewritetransform rewrites the Host header to <uuid>.lambda-microvm.<region>.on.aws before forwarding. Because the MicroVM service front-end routes on the Host header, the request lands on the correct MicroVM, while the customer’s domain stays in the browser’s address bar the whole time.
Why not CloudFront? Why not an ALB redirect?
CloudFront can also rewrite Host/SNI toward the origin, but a single distribution has static origins. Mapping a wildcard of MicroVM IDs through one distribution would require a CloudFront Function to compute the origin per request. The ALB transform performs the same rewrite for the entire wildcard with zero code.
An ALB redirect action only issues an HTTP 301 Moved Permanently/302 Found response. The browser would follow it, and the address bar would then show the .on.aws URL, which breaks our design as it is not a real custom domain. The transform (not a redirect) is what makes the custom domain transparent.
Walkthrough
The example is an AWS CDK application. Configuration lives under the microvm-custom-domains key in cdk.json (hosted zone, wildcard base, the endpoint base to rewrite to, the PrivateLink service name, and the CORS origin). Set those values, then deploy. The sections below explain what the stack creates and why.
Prerequisites
An AWS account.
An existing Amazon Route 53 public hosted zone for your domain (for example, example.com). The stack imports it and adds a wildcard record.
1. Create the network and the PrivateLink endpoint
A small VPC (two Availability Zones, which is the minimum for an internet-facing ALB) hosts the ALB and an interface VPC endpoint to the AWS managed MicroVM service. There are no NAT gateways, because nothing here needs egress, which keeps the footprint lean.
// Interface (PrivateLink) endpoint to the AWS managed MicroVM service.
const endpoint = new ec2.InterfaceVpcEndpoint(this, 'MicroVmEndpoint', {
  vpc,
  service: new ec2.InterfaceVpcEndpointService(cfg.microvmVpceServiceName, 443),
  subnets: { subnetType: ec2.SubnetType.PRIVATE_ISOLATED },
});
2. Discover the endpoint’s private IP addresses at deploy time
An ALB IP target group needs the private ENI IP addresses of the interface endpoint (one per Availability Zone). CloudFormation does not expose those IPs as a usable attribute, so the stack resolves them during deployment with an AwsCustomResource that reads the endpoint’s own ENIs by ID (DescribeNetworkInterfaces on vpcEndpointNetworkInterfaceIds).
This is the only compute the package deploys, it runs only duringcdk deploy, and it is never in the request path.
3. Request a wildcard TLS certificate
ACM issues a DNS-validated wildcard certificate for *.microvms.example.com, validated through the hosted zone you imported. The ALB presents this certificate for every custom domain under the wildcard.
4. Create the ALB and the MicroVM target group
The internet-facing ALB has an HTTPS:443 listener using the wildcard certificate. The target group holds the endpoint ENI IPs as IP targets, reached over HTTPS:443.
Encrypted in transit. A customer-provided AWS Certificate Manager (ACM) certificate is used to securely terminate encryption between the client and the ALB. The ALB re-originates TLS to the MicroVM service so traffic stays encrypted through the network.
IP-based targets. The target group uses IP-based targets with the local IP addresses of the VPC endpoints.
Health check matcher 200,403,404. The load balancer’s health probes are unauthenticated, so the MicroVM endpoint answers them with 403. A 403 here means “endpoint is reachable,” not “auth is broken,” so the matcher treats it as healthy.
A listener rule matches <uuid>.microvms.example.com with a regex condition and rewrites the Host header to <uuid>.lambda-microvm.<region>.on.aws with a host-header-rewrite transform. The regex captures the left-most label (the MicroVM ID) and reuses it in the replacement.
At the time of writing, the CDK L2 constructs don’t yet model regex host conditions or transforms, so the example reaches the underlying CfnListenerRule to set them:
Wildcard A and AAAA alias records (*.microvms.example.com) target the ALB, so every MicroVM custom subdomain resolves to it.
7. Deploy
Run the following commands to install the dependencies and then deploy the application.
npm install
npx cdk deploy
Handling CORS at the ALB
If your clients are browsers calling the MicroVM from another origin, CORS is handled entirely at the ALB, with no change to the application inside the MicroVM.
The listener uses ALB header-modification attributes to insert the Access-Control-Allow-* headers on every response. A higher-priority rule answers OPTIONS preflight requests at the edge with a fast 204 response. Otherwise, preflight requests would reach the origin and be rejected without an access token.
// Insert CORS headers on every response on this listener.
const cfnListener = listener.node.defaultChild as elbv2.CfnListener;
cfnListener.addPropertyOverride('ListenerAttributes', [
  { Key: 'routing.http.response.access_control_allow_origin.header_value',  Value: cfg.corsAllowOrigin },
  { Key: 'routing.http.response.access_control_allow_methods.header_value', Value: 'GET,POST,PUT,DELETE,OPTIONS,PATCH,HEAD' },
  { Key: 'routing.http.response.access_control_allow_headers.header_value', Value: 'x-aws-proxy-auth,x-aws-proxy-port,content-type,authorization' },
  { Key: 'routing.http.response.access_control_expose_headers.header_value', Value: 'content-type,content-length' },
  { Key: 'routing.http.response.access_control_max_age.header_value',        Value: '86400' },
]);

// Answer OPTIONS preflights at the ALB.
new elbv2.ApplicationListenerRule(this, 'CorsPreflightRule', {
  listener,
  priority: 10,
  conditions: [elbv2.ListenerCondition.httpRequestMethods(['OPTIONS'])],
  action: elbv2.ListenerAction.fixedResponse(204, { contentType: 'text/plain', messageBody: '' }),
});
Because the ALB adds those headers to both the preflight 204 and the forwarded MicroVM response, a browser’s cross-origin call succeeds without any application change. Set corsAllowOrigin to * for quick testing, and pin it to your own site for anything beyond a demo.
Test it end to end
First, launch a Lambda MicroVM and mint an access token (follow Create your first Lambda MicroVM). When it’s running, the service gives you a generated endpoint that looks like:
To get the custom-domain equivalent, replace the endpoint suffix (.lambda-microvm.<region>.on.aws) with your wildcard base: .microvms.example.com. Everything ahead of that suffix is preserved exactly:
012345678-9abc-defg.microvms.example.com
The ALB’s rewrite rule captures whatever precedes the suffix and re-attaches it to the real endpoint base, so the mapping holds for the entire wildcard. You never register anything per-MicroVM.
With your token in hand, call the custom domain you derived:
The request travels to the ALB, which terminates TLS, rewrites the host header, and forwards over PrivateLink to the MicroVM. The response comes back under your domain.
The reference architecture also includes a single-page demo and a POST /api/provision endpoint that runs or reuses a MicroVM and mints a short-lived token. With it, you can try the flow without wiring up token creation yourself. It even performs this suffix swap for you and hands back a ready-to-click custom-domain URL. See the repository for that piece.
Important considerations
Authentication is still the client’s job. This pattern only rewrites Host. The client must still supply a valid, unexpired access token in X-aws-proxy-auth. This is deliberate. MicroVM tokens are per-MicroVM and short-lived, so baking them into infrastructure would be fragile and insecure.
Region pinning. PrivateLink is regional, so the ALB, the endpoint, and the MicroVM service must all be in the same Region.
Production hardening. If you adapt the sample’s provisioning endpoint, put authentication and rate limiting in front of it, pin CORS to your origin, and scope IAM to the minimum. The sample’s provisioning path is intentionally open for demonstration and is not production-safe as written.
Cost. You pay for the ALB and the interface endpoint (hourly plus data processing) in addition to the Lambda MicroVM usage. There is no CloudFront distribution and no per-request compute in the data path.
Clean up
Run the following command in the same directory where you deployed the application from.
npx cdk destroy
This removes the ALB, target groups, endpoint, certificate, VPC, and Route 53 records created by the stack.
Conclusion
You can front AWS Lambda MicroVMs with customer-owned wildcard custom domains using an Application Load Balancer and AWS PrivateLink. The key is the ALB’s host-header rewrite. Because the MicroVM service routes requests based on the Host header, a single rewrite rule can transparently map an entire wildcard of custom domains onto your MicroVMs. CORS is handled at the edge as well. The whole setup relies only on networking primitives, with no CloudFront distribution and no compute in the request path.
Pierre-Emmanuel Patry and Arthur Cohen gave a talk at
RustConf 2026 on the
status of the Rust frontend for GCC (gccrs), with a particular eye toward the
goal of
compiling the Linux kernel. Patry gave a follow-up talk for a more
kernel-focused audience at
Kangrejos the next week, which Cohen could not attend. The
gccrs project is
making good progress overall, but it will still be some time until the compiler
is usable.
When scaling large consumer groups on Amazon Managed Streaming for Apache Kafka (Amazon MSK), a common challenge is managing the size of internal metadata records. During rebalances, Kafka persists a metadata record to the internal __consumer_offsets topic. If the consumer group is large enough, this record can exceed the default 1 MB limit. This causes a RecordTooLargeException and a rebalance retry loop.
In this post, we explain how consumer group metadata grows and how to estimate your metadata size. We provide a step-by-step walkthrough for increasing the topic-level size limit (the most common remediation), along with guidance on three complementary strategies: splitting groups, right-sizing partitions, and optimizing naming conventions. We also discuss capacity planning, monitoring, and how KIP-848 in Apache Kafka 4.0 addresses this constraint at the protocol level.
Prerequisites: This post assumes familiarity with Apache Kafka consumer groups, rebalance protocols, and Amazon MSK cluster configuration. You should have access to the kafka-configs.sh CLI tool or the Amazon MSK console. The configuration approaches described apply to Amazon MSK Provisioned clusters with Standard brokers. The KIP-848 section covers a forward-looking protocol change in Apache Kafka 4.0 that applies across deployment types.
How consumer group metadata grows
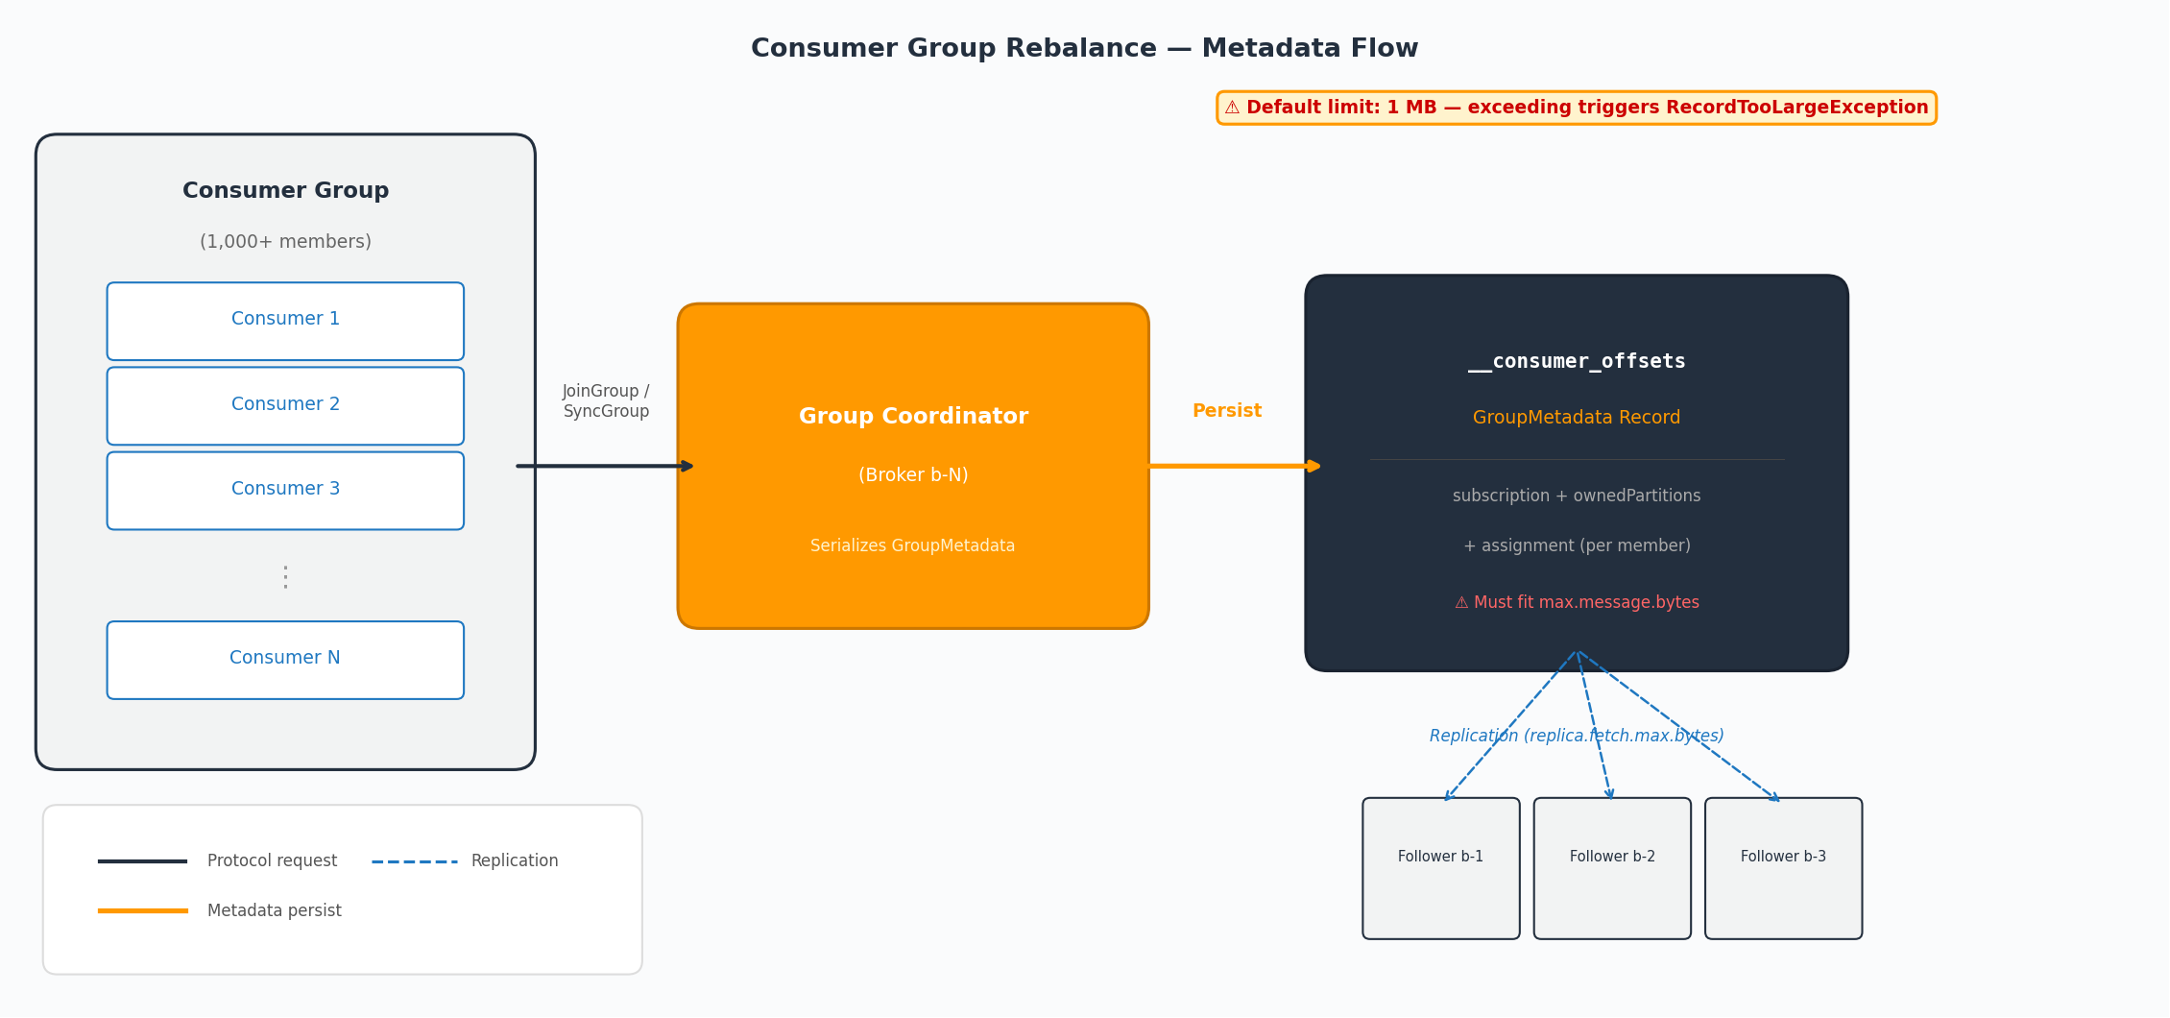
The following diagram illustrates how consumer group metadata flows through the system during a rebalance:
Figure 1: Consumer group metadata flow during a rebalance
During a rebalance, the Group Coordinator serializes a GroupMetadata record containing information about every member in the group and persists it to the __consumer_offsets topic. This record must fit within the topic’s max.message.bytes limit. Follower brokers must also replicate it, constrained by replica.fetch.max.bytes. For each member, the record includes:
Subscription topics – The list of topics the member subscribes to.
Owned partitions – Partitions currently held by the member.
Assignment – The new partition assignment after rebalancing.
Client ID – The configured client.id.
Apache Kafka’s serialization format repeats topic names multiple times per member: once in subscription, once in ownedPartitions, and once in assignment. The client.id adds further per-member overhead. The broker stores these metadata records uncompressed in __consumer_offsets.
Estimating your metadata record size
You can approximate your consumer group’s metadata record size with the following formula:
Example: A group with 1,000 members, a 50-byte topic name, and a 40-byte client ID:
1,000 × (150 + 80 + 200) = ~430 KB
At 1,500 members with the same parameters: ~645 KB. With multiple topic subscriptions or longer naming conventions, the record can exceed 1 MB well before 2,000 members.
Approaches to handle large consumer group metadata
The following sections describe four strategies for managing large consumer group metadata, starting with the most direct remediation.
Increase max.message.bytes on __consumer_offsets
If your consumer group metadata exceeds 1 MB, you can increase the maximum record size on the internal topic. This is the most direct path to help unblock consumer groups that have already scaled beyond the default. Note that max.message.bytes is the topic-level configuration name, while message.max.bytes is the equivalent broker-level default.
1. Update the topic-level configuration:
kafka-configs.sh --bootstrap-server <bootstrap-server> \
    --entity-type topics \
    --entity-name __consumer_offsets \
    --alter \
    --add-config max.message.bytes=2097152 # topic-level config for max record size
2. Updatereplica.fetch.max.bytesat the cluster level:
This broker-level setting controls the maximum fetch size for inter-broker replication. Set it equal to or greater than max.message.bytes on __consumer_offsets so follower brokers can replicate large metadata records.
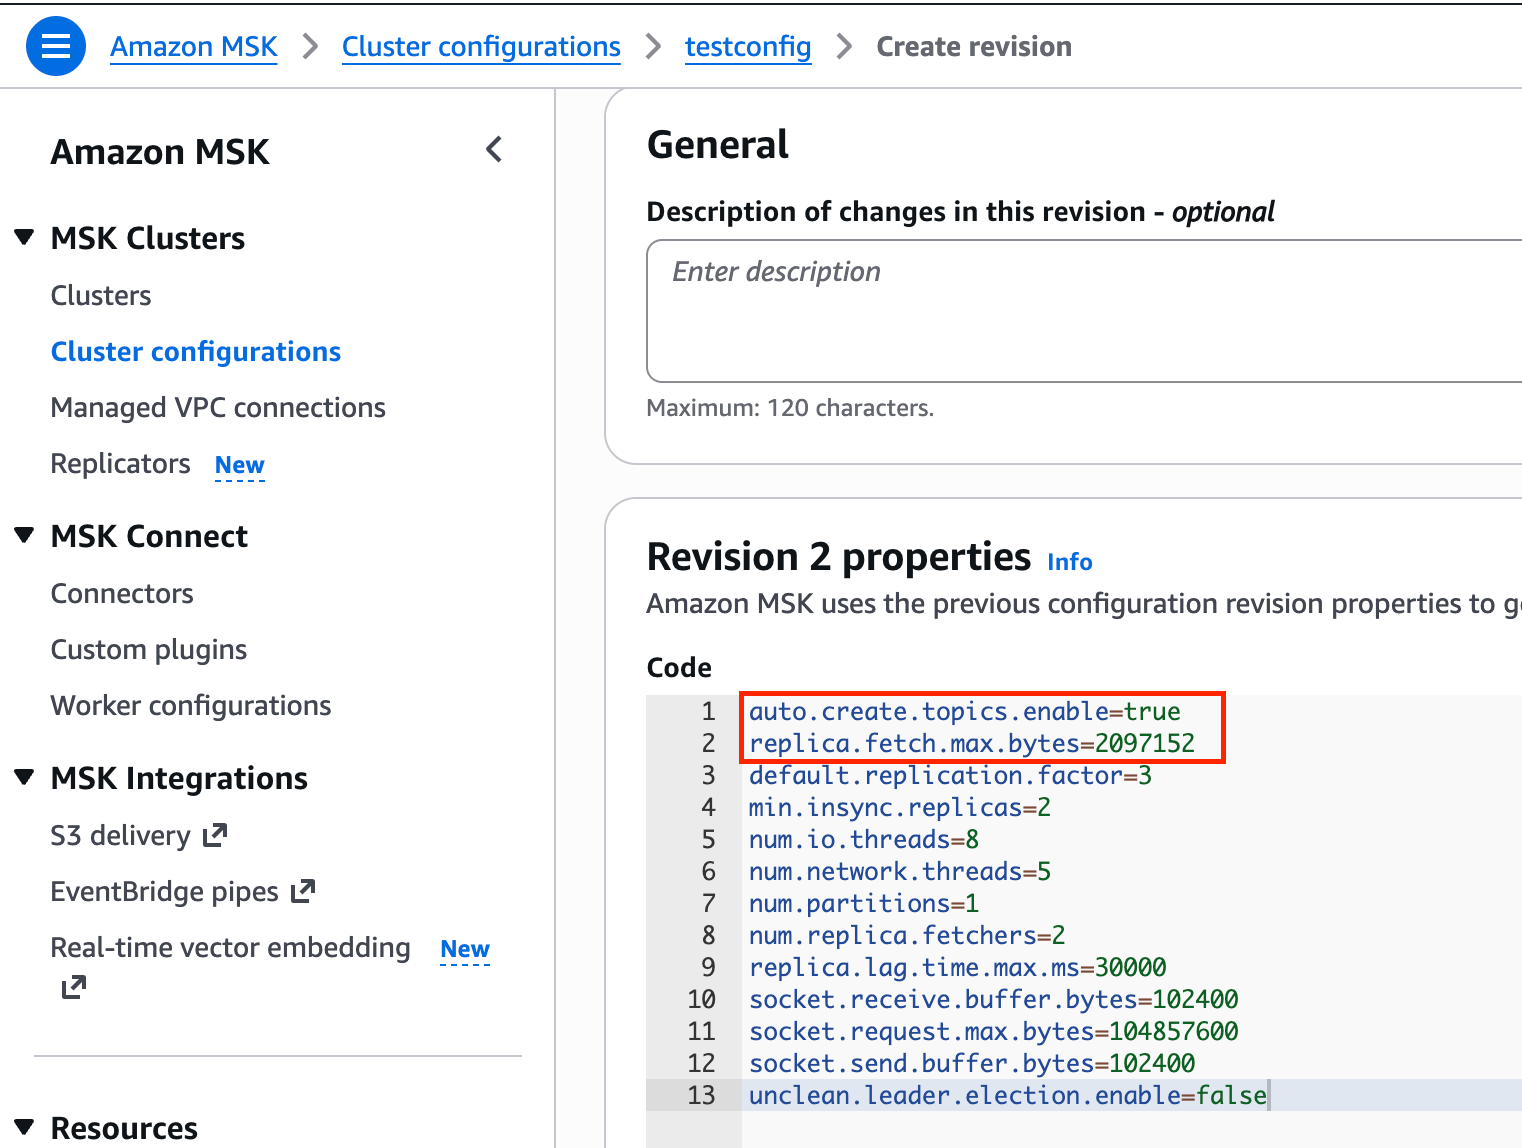
replica.fetch.max.bytes=2097152
You can apply this through the Amazon MSK console under Cluster configuration or using the AWS Command Line Interface (AWS CLI) with update-cluster-configuration.
Figure 2: Setting replica.fetch.max.bytes in the Amazon MSK cluster configuration console
Important: Always make sure that replica.fetch.max.bytes ≥ max.message.bytes for __consumer_offsets. Without this, you might observe UnderReplicatedPartitions on the internal topic.
3. Test in a non-production environment first:
Trigger a consumer group rebalance (restart consumers or scale the group).
Verify no RecordTooLargeException in broker logs.
Confirm broker heap usage and replication lag remain healthy.
Split large consumer groups
Breaking a single large consumer group into multiple smaller groups reduces the per-group metadata record size proportionally. To split a group, deploy multiple connector or consumer instances, each with a distinct group.id, subscribing to the same topic but consuming from a subset of partitions. The system preserves offset tracking within each sub-group independently.
When to use: Consumer group membership is growing unboundedly through Auto Scaling, and you want to keep each group’s metadata well within limits without modifying internal topic configuration.
Trade-off: Increases operational complexity. You have multiple groups to monitor and manage instead of one.
Right-size partition count and auto scaling bounds
Over-partitioned topics require more consumers to fully parallelize, which inflates group membership. Unbounded auto scaling policies can grow consumer groups beyond what was originally planned.
Review whether your topic’s partition count matches your actual throughput requirements.
Configure auto scaling policies with an upper bound on consumer replicas (for example, Horizontal Pod Autoscaler on Amazon Elastic Kubernetes Service (Amazon EKS)).
Align partition count with the maximum number of consumers you intend to support.
This is a proactive measure, best applied during topic design and capacity planning to prevent the metadata size issue from occurring in the first place.
Optimize naming conventions
Consumer group names and client IDs contribute to the overall metadata size. Shorter, standardized naming reduces per-member overhead.
Considerations: Changing an active consumer group’s name means the new group starts with no committed offsets and all tracking history is lost. For this reason, naming optimization is most practical for new deployments rather than existing production groups.
Capacity planning for larger metadata records
When you increase max.message.bytes on __consumer_offsets, larger metadata records consume more broker heap during rebalance processing. Proper capacity planning helps you select the right broker instance type and configuration value before hitting production issues.
Planning steps:
Calculate your current record size using: member_count × (3 × topic_name_bytes + 2 × client_id_bytes + ~200).
Project peak membership based on your auto scaling upper bound (maximum consumer replicas × number of tasks per connector, if using Kafka Connect).
Apply a 2× safety margin to account for protocol overhead, multi-topic subscriptions, and burst scaling events.
Select your max.message.bytes value from the following guidance table.
Choose your broker instance type based on heap requirements. Larger metadata records increase heap pressure during rebalances. For groups exceeding 1,000 members with 2+ MB metadata records, use kafka.m5.xlarge or larger to provide sufficient heap headroom.
Validate in non-production by running a consumer group at projected peak membership and monitoring HeapMemoryAfterGC during rebalances.
The following table provides sizing guidance based on consumer group size:
Consumer Group Size
Guidance
< 500 members
Default 1 MB is typically sufficient. kafka.m5.large or larger.
500–1,000 members
Monitor metadata size. Consider increasing to 2 MB. kafka.m5.xlarge or larger.
1,000–2,000 members
Increase to 2–5 MB. kafka.m5.2xlarge or larger for adequate heap headroom.
> 2,000 members
Combine increased limit with group splitting. kafka.m5.2xlarge minimum. Consider kafka.m5.4xlarge for high rebalance frequency.
Key metrics to monitor
The following Amazon CloudWatch metrics help you track consumer group metadata health:
Metric
What it tells you
HeapMemoryAfterGC (Amazon CloudWatch)
Percentage of heap memory in use after garbage collection. Indicates memory pressure from larger metadata records during rebalances.
UnderReplicatedPartitions (Amazon CloudWatch)
Replication health. Non-zero may indicate replica.fetch.max.bytes is too low.
GC pause duration (broker logs)
Prolonged GC can trigger session timeouts and cascading rebalances.
Consumer group rebalance rate
Stable groups should not rebalance frequently after configuration changes.
Consumer lag
Confirms consumers are making progress after rebalances complete.
We recommend creating two Amazon CloudWatch alarms for HeapMemoryAfterGC. Set a warning alarm at 60% to indicate potential performance degradation. Set a critical alarm at 80 percent, at which point you should scale brokers or reduce consumer group size. For UnderReplicatedPartitions, alarm at any value> 0 sustained for more than 5 minutes after a configuration change.
Looking ahead: KIP-848 and Apache Kafka 4.0
Apache Kafka 4.0 (released March 2025) adopted KIP-848 as the default consumer protocol. The broker now computes partition assignments server-side rather than delegating to a consumer group leader. Because each member no longer carries full subscription and assignment data on the wire, the new protocol reduces per-member metadata size. For details on the protocol changes that achieve this reduction, see the KIP-848 design document. KIP-848 also introduces incremental rebalances.
Newer Apache Kafka versions on Amazon MSK bring smaller metadata records by default. The following steps help you prepare for KIP-848 adoption:
Track Amazon MSK version support for Apache Kafka 4.0+.
Verify your Kafka client libraries support the new consumer protocol.
Test the new protocol in a non-production environment before migrating production consumer groups.
Plan for a phased rollout, starting with non-critical consumer groups.
Conclusion
The following table summarizes when to apply each approach. The max.message.bytes increase (covered step-by-step earlier) is the primary remediation. The other strategies are complementary guidance you can adapt to your environment:
Situation
Recommended approach
Already hitting RecordTooLargeException in production
Increase max.message.bytes on __consumer_offsets + set replica.fetch.max.bytes accordingly
Planning for growth
Right-size partitions, set auto scaling bounds, monitor metadata size
Naming overhead is significant
Optimize naming conventions for new deployments
Operating at very large scale (2,000+ members)
Combine increased limits with consumer group splitting
Long-term architecture
Plan migration path to KIP-848 (Apache Kafka 4.0)
Test configuration changes in non-production first, monitor broker metrics during and after rebalances, and scale incrementally. With these practices in place, you can operate consumer groups at the scale your streaming workloads require.
As organizations grow, data processing often becomes fragmented across teams, environments, and orchestration tools. This fragmentation leads to inconsistent patterns, duplicated logic, limited cost visibility, and operational overhead.
At Moeve we were no exception. Our analytics teams build their transformations with dbt, an open source tool that defines transformations as SQL models, resolves the references between them, and works out the order in which they run. dbt describes what to transform, but it does not define where or how a project runs. We left that decision to each team, and as the number of projects grew we found fragmented pipelines, inconsistent compute engines, and limited cost visibility slowing every project down. Standardizing our dbt runs on Amazon Athena was how we worked our way out of that.
This post describes the architecture of the centralized, serverless solution we built on Athena, which reduced onboarding for a new dbt project from days to about 15 minutes. The solution centralizes how dbt runs across our data lakes while staying loosely coupled from orchestration. It uses Amazon Athena as the default processing engine, a centralized dbt launcher, and a shared event bus for downstream orchestration.
In the sections that follow we explain how we decoupled dbt runs from orchestration using AWS Step Functions and AWS Fargate, why Athena fits our workloads from a cost and operational perspective, how storing run parameters in Amazon DynamoDB rather than in pipeline code removed the infrastructure deployment step from onboarding, and how publishing results to Amazon EventBridge lets our run and orchestration layers evolve independently.
The challenge of running dbt at scale
Before the dbt launcher, our dbt runs had grown in different directions. Run logic was embedded in project-specific pipelines, orchestration and processing were tightly coupled, teams selected different compute engines for comparable workloads, and we had no consistent governance over run parameters and retries.
As the number of dbt projects increased, this made it difficult to enforce consistent standards and to evolve the solution without touching every pipeline. We needed a way to standardize dbt runs across our data lakes, decouple running a project from deciding what to run, improve cost control and observability, and deliver faster and safer continuous integration and continuous delivery (CI/CD) iterations.
Why Amazon Athena as the default dbt engine
Choosing the processing engine for dbt is a foundational architectural decision, so we made it first.
Serverless processing
Athena is fully serverless. There are no clusters to provision, scale, or maintain. Our teams run their queries with the default Athena pricing, which charges for the data a query scans and gives us elasticity with no capacity planning.
Because each data lake lives in its own account, each team makes its own decision about Athena payment. A team whose workload grows into continuous, high-concurrency usage can move to Athena capacity reservations with no change to the launcher, to their dbt profiles, or to their project configuration. None of our teams have needed to do so yet, and the architecture keeps that choice independent per team.
Our workload is predictable but not continuous. Each dbt project runs for a few minutes when its schedule fires or when its upstream data lands, then stays idle until the next trigger. That shape is what made serverless the right fit for us.
Why Athena fit our solution
For Moeve, the decision to standardize on dbt and Amazon Athena was driven by our goal of creating a common transformation solution that could be adopted across multiple teams and AWS accounts while keeping operations lightweight.
Our data was already stored in Amazon S3 and registered in the AWS Glue Data Catalog, making Athena a natural processing layer. Athena allowed us to run transformations without managing clusters, capacity, or infrastructure, which was particularly important for a small central team supporting multiple domains.
We evaluated alternative processing engines, but for our workload profile and data volumes, Athena provided the best balance between scalability, operational simplicity, and maintainability. Adapter maturity was another important factor. The dbt Athena adapter offered strong integration with testing, CI/CD workflows, and the broader dbt ecosystem, reducing the operational risk of maintaining custom solutions.
Athena also aligned naturally with our architecture. Transformations run in the AWS account that owns the data through cross-account role assumption, while orchestration remains centralized. As a result, we standardized how projects run across teams while keeping compute close to the data.
Finally, the Apache Iceberg support in Athena underpins the idempotent incremental processing model described in this post, so incremental loads and historical reprocessing follow the same path with minimal operational overhead.
Optimized incremental processing
Our largest cost was not reading source data. It was merging into it.
Our fact tables are Apache Iceberg tables in the data lake, and most of our models are incremental. Each run brings in new or corrected records and merges them into a target that can hold several years of history. A merge has to locate the rows it is about to update, and without a predicate on the target the query reads far more of the table than the incoming data can affect. The common approach is a static filter such as the last 30 days, which is wrong in both directions: too wide for an ordinary daily load, and too narrow as soon as a correction arrives for an older partition.
Instead of a fixed window, the platform derives the predicate from the data. Before the merge runs, it reads the distinct values of the partition column present in the incoming dataset and builds the target predicate from them. For a single partition it applies an equality predicate, for a small set an IN list, and for a larger set a bounded range. The merge then reads only the partitions the incoming data can affect.
The same principle applies on the source side. The launcher builds the source filter from the parameters given for that run: an explicit range, an arbitrary SQL condition, or, when neither is supplied, a default window taken from the project configuration. Input is therefore bounded to the subset each run needs.
Two results mattered to us. Because Athena charges for the data a query scans, narrowing both ends of the merge reduces cost without any team hand-tuning individual models. More importantly, a daily load and a full historical reprocess became the same operation with different inputs. Every run is idempotent, so the same input always produces the same result regardless of how many times it runs. That removed the distinction between processing and reprocessing from our runbooks and simplified incident response.
Table design is what makes this pruning possible. Partitioning, columnar formats, and compression all contribute, and the AWS Big Data Blog post Top 10 performance tuning tips for Amazon Athena covers the general techniques. We have deliberately not published a before and after figure here, because the saving depends so heavily on partition design and data distribution that a single number would mislead without extensive context.
Architecture overview
Moeve built a centralized dbt launcher that runs dbt jobs in a uniform way, regardless of the project or the target data lake.
Architecture diagram
Figure 1: Centralized dbt launcher and cross-account run flow
At a high level, the architecture consists of:
AWS Step Functions to control the run lifecycle.
AWS Fargate to run dbt in an isolated, ephemeral container.
Amazon Athena as the default dbt processing engine.
Amazon DynamoDB to store dbt project configuration.
Amazon EventBridge to publish run results.
Every dbt run follows the same contract, which gives us consistency and reduces the operational surface we must maintain.
Cross-account processing model
The solution operates in a centralized account while running transformations in domain-specific data lake accounts: corporate, marketing, and manufacturing. The Fargate container assumes a dbt-child IAM role in the target account, so the container processes data where it lives while governance stays centralized.
Each data lake account keeps control of its own IAM permissions and manages its own storage and catalog without affecting the solution. This also puts costs in the right account. We could have attributed Athena spend using Athena workgroups, but Athena is only part of what a query costs. The Amazon Simple Storage Service (Amazon S3) requests it makes and the AWS Key Management Service (AWS KMS) operations it triggers are real costs as well, and running in the owning account attributes all of them to the team that owns the data, per project and per run.
Centralizing dbt runs with the dbt launcher
To stop every team inventing its own way of running dbt, we built a single launcher that all of them go through. Instead of dbt logic living inside multiple pipelines, every run is triggered through one well-defined path.
Run lifecycle
The launcher is an AWS Step Functions state machine. It receives a run request with its parameters, starts an AWS Fargate task from our dbt container image, and the container assumes the IAM role of the target data lake account. dbt then runs its SQL transformations in Athena, reading the source tables and materializing the targets. Alongside the run, Elementary, an open source dbt package, records model-level results and data quality test outcomes. When the run finishes, the launcher publishes a completion event to Amazon EventBridge.
The state machine can be started in different ways depending on the scenario. Some projects run on a schedule, others are triggered when upstream data lands, and teams can request a run on demand. Those decisions are made by our orchestration layer, which submits a standardized run request to the launcher. The launcher therefore stays focused on running dbt projects, regardless of how the run was initiated.
This sequence is identical for all projects and environments. The launcher is responsible only for running the project it was asked to run. It doesn’t decide what should run next, and that responsibility is intentionally delegated to downstream consumers through Amazon EventBridge.
Configuration-driven runs with Amazon DynamoDB
We had to decide where a project’s run parameters would live. In the pipeline definition, changing a timeout would be a code change, a review, a build, and a deployment, for a value we sometimes need to change while an incident is open. We put the parameters in DynamoDB instead, keyed by project, and the launcher reads them at the start of every run. That lets us decouple code deployment from run behavior, update parameters without redeploying services, and enforce consistent defaults across all dbt projects.
The parameters themselves are modest. They cover the target environment and AWS Identity and Access Management (IAM) role, the default processing engine, how long to allow a run to take, how many times to retry on failure, and how many days of data to process by default. These values change for operational reasons rather than logical ones, which is why we did not want them coupled to a release cycle.
The effect on onboarding was larger than we expected. Deploying a new dbt project is now a merge of the dbt models and one configuration entry. There is no Terraform change, no infrastructure review, and nothing to provision, because the compute the project needs already exists and is shared. What used to be a multi-step infrastructure pipeline is now a single CI workflow that validates the project’s SQL and lineage locally, then merges and registers it. We run that local validation with DuckDB, which returns feedback in under two minutes without consuming cloud resources.
Governance did not weaken as a result. Who may change a configuration entry is controlled the same way as any other production change. What changed is that the change no longer has to travel through an infrastructure deployment to take effect.
CI/CD pipeline diagram
Figure 2: CI workflow for onboarding and updating a dbt project
Athena remains the engine of record. Local validation catches Jinja errors, unresolved references, and obvious SQL mistakes, but Athena-specific behavior, cross-account permissions, and AWS Glue Data Catalog interactions are only proven in the target environment. It’s important to be explicit about that boundary with the teams, so that a green CI run is not read as a guarantee.
Publishing run results with Amazon EventBridge
After a dbt run finishes, the launcher publishes a structured event to a central Amazon EventBridge bus recording whether the run succeeded, which project and source it covered, when it started and finished, how long it took, and which datasets it updated. The launcher does not know which consumers are subscribed.
This event-driven approach gives us loose coupling between running a project and orchestrating what comes next, multiple downstream consumers for the same signal, and independent evolution of both layers.
At Moeve the main consumer is our orchestration layer, which models the dependencies between datasets as a graph. Each completion event tells it that a node is now up to date, so it can determine which downstream projects have all their inputs ready and start them. That consumer has no special status. An AWS Lambda function, a monitoring dashboard, or a notification integration can subscribe to the same events without any change to the launcher.
Validation and observability
Because every project follows the same lifecycle, we get validation and observability in one place instead of per pipeline. Step Functions shows the state of any run and the step at which it failed, and error handling and retries are defined once. Fargate logs carry the container runtime detail. dbt and Elementary report model-level results and data quality test outcomes. The completion event on the bus is the auditable record that a project finished and what it produced. Together these layers give us operational visibility without coupling the components to each other.
Cost control and resource cleanup
The platform is serverless end to end, which keeps idle cost close to zero and removes a class of operational mistake. Fargate tasks are created for a run and destroyed when it ends, so no long-running container needs maintenance. Athena has no persistent compute. An idle Step Functions state machine costs nothing. Nothing is left running unintentionally, which matters when the number of projects on the platform keeps growing.
Results
The metrics in the following table are the ones our teams notice day to day, and the reason the solution is maintainable by a small central team.
Metric
Before
After
Onboarding time for a new dbt project
Days, including pipeline and infrastructure setup
About 15 minutes, configuration only
Run consistency
Varied by team
Same lifecycle and contract for every project
CI feedback time
8 to 10 minutes on Jenkins
Under 2 minutes with local validation
Cost visibility
Per-account aggregate
Per-project and per-run attribution
Operational overhead
One pipeline per project
One solution for all projects
Conclusion
Standardizing how we run dbt turned out to depend less on dbt than on defining two boundaries clearly.
The first is the contract of the launcher: parameters in, event out. We defined that interface before building the internals, and it has stayed stable while the implementation changed several times. The second is the separation between running a project and deciding what to run next. Making the launcher publish events without knowing its consumers is why our orchestration layer could be rebuilt while the launcher stayed as it was, and the launcher has never been modified to accommodate a new orchestration requirement.
Two smaller decisions carried more weight than we expected. Keeping run parameters in DynamoDB rather than in pipeline definitions means timeouts, retries, and engine selection can be changed without a deployment, which is valuable during incident response. Making every run idempotent removed the distinction between processing and reprocessing, so a daily load and a full historical reprocess are the same operation with different inputs.
Athena is serverless, so our teams did not need to set up infrastructure of their own. That is what made it practical for everyone to run dbt in a standardized way, and why onboarding a new project went from days to about 15 minutes.
If your organization runs dbt across multiple accounts and teams, pair Amazon Athena with a clear contract for the component that runs your projects: fixed parameters in, a published event out.
To provide the best experiences, we use technologies like cookies to store and/or access device information. Consenting to these technologies will allow us to process data such as browsing behavior or unique IDs on this site. Not consenting or withdrawing consent, may adversely affect certain features and functions.
Functional
Always active
The technical storage or access is strictly necessary for the legitimate purpose of enabling the use of a specific service explicitly requested by the subscriber or user, or for the sole purpose of carrying out the transmission of a communication over an electronic communications network.
Preferences
The technical storage or access is necessary for the legitimate purpose of storing preferences that are not requested by the subscriber or user.
Statistics
The technical storage or access that is used exclusively for statistical purposes.The technical storage or access that is used exclusively for anonymous statistical purposes. Without a subpoena, voluntary compliance on the part of your Internet Service Provider, or additional records from a third party, information stored or retrieved for this purpose alone cannot usually be used to identify you.
Marketing
The technical storage or access is required to create user profiles to send advertising, or to track the user on a website or across several websites for similar marketing purposes.