All posts by Alex Casalboni

Announcing AWS Lambda Function URLs: Built-in HTTPS Endpoints for Single-Function Microservices

Post Syndicated from Alex Casalboni original https://aws.amazon.com/blogs/aws/announcing-aws-lambda-function-urls-built-in-https-endpoints-for-single-function-microservices/

Organizations are adopting microservices architectures to build resilient and scalable applications using AWS Lambda. These applications are composed of multiple serverless functions that implement the business logic. Each function is mapped to API endpoints, methods, and resources using services such as Amazon API Gateway and Application Load Balancer.

But sometimes all you need is a simple way to configure an HTTPS endpoint in front of your function without having to learn, configure, and operate additional services besides Lambda. For example, you might need to implement a webhook handler or a simple form validator that runs within an individual Lambda function.

Today, I’m happy to announce the general availability of Lambda Function URLs, a new feature that lets you add HTTPS endpoints to any Lambda function and optionally configure Cross-Origin Resource Sharing (CORS) headers.

This lets you focus on what matters while we take care of configuring and monitoring a highly available, scalable, and secure HTTPS service.

How Lambda Function URLs Work
Create a new function URL and map it to any function. Each function URL is globally unique and can be associated with a function’s alias or the function’s unqualified ARN, which implicitly invokes the $LATEST version.

For example, if you map a function URL to your $LATEST version, each code update will be available immediately via the function URL. On the other hand, I’d recommend mapping a function URL to an alias, so you can safely deploy new versions, perform some integration tests, and then update the alias when you’re ready. This also lets you implement weighted traffic shifting and safe deployments.

Function URLs are natively supported by the Lambda API, and you can start using it via the AWS Management Console or AWS SDKs, as well as infrastructure as code(IaC) tools such as AWS CloudFormation, AWS SAM, or AWS Cloud Development Kit (AWS CDK).

Lambda Function URLs in Action
You can configure a function URL for a new or an existing function. Let’s see how to implement a new function to handle a webhook.

When creating a new function, I check Enable function URL in Advanced Settings.

Here, I select Auth type: AWS_IAM or NONE. My webhook will use custom authorization logic based on a signature provided in the HTTP headers. Therefore, I’ll choose AuthType None, which means Lambda won’t check for any AWS IAM Sigv4 signatures before invoking my function. Instead, I’ll extract and validate a custom header in my function handler for authorization.

AWS Lambda URLs - Create Function

Please note that when using AuthType None, my function’s resource-based policy must still explicitly allow for public access. Otherwise, unauthenticated requests will be rejected. You can add permissions programmatically using the AddPermission API. In this case, the Lambda console automatically adds the necessary policy for me, as the IAM role I’m using is authorized to call the AddPermission API in my account.

With one click, I can also enable CORS. The default CORS configuration will allow all origins. Then, I’ll add more granular controls after creating the function. In case you’re not familiar with CORS, it’s a header-based security mechanism implemented by browsers to make sure that only certain hosts are allowed to load resources and invoke APIs. If a website is allowed to consume your API, you’ll need to include a few CORS headers that declare which origins, methods, and custom headers are allowed. The new function URLs take care of it for you, so you don’t have to implement all of this in your Lambda handler.

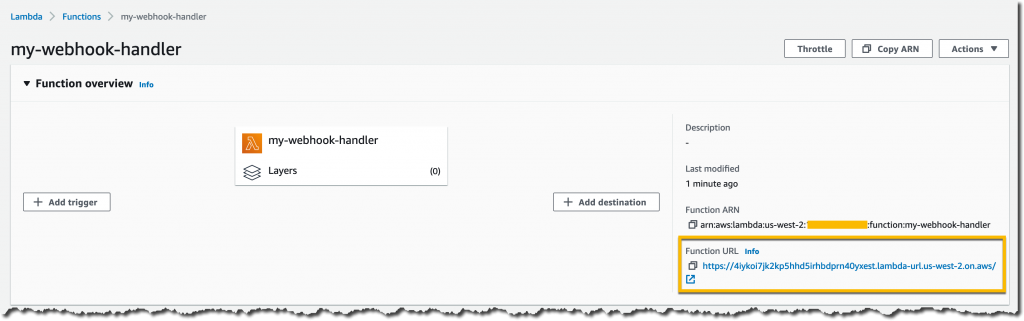
A few seconds later, the function URL is available. I can also easily find and copy it in the Lambda console.

AWS Lambda URLs - Console URL

The function code that handles my webhook in Node.js looks like this:

exports.handler = async (event) => {
    
    // (optional) fetch method and querystring
    const method = event.requestContext.http.method;
    const queryParam = event.queryStringParameters.myCustomParameter;
    console.log(`Received ${method} request with ${queryParam}`)
    
    // retrieve signature and payload
    const webhookSignature = event.headers.SignatureHeader;
    const webhookPayload = JSON.parse(event.body);
    
    try {
        validateSignature(webhookSignature); // throws if invalid signature
        handleEvent(webhookPayload); // throws if processing error
    } catch (error) {
        console.error(error)
        return {
            statusCode: 400,
            body: `Cannot process event: ${error}`,
        }
    }

    return {
        statusCode: 200, // default value
        body: JSON.stringify({
            received: true,
        }),
    };
};

The code is extracting a few parameters from the request headers, query string, and body. If you’re already familiar with the event structure provided by API Gateway or Application Load Balancer, this should look very familiar.

After updating the code, I decide to test the function URL with an HTTP client.

For example, here’s how I’d do it with curl:

$ curl "https://4iykoi7jk2kp5hhd5irhbdprn40yxest.lambda-url.us-west-2.on.aws/?myCustomParameter=squirrel"
    -X POST
    -H "SignatureHeader: XYZ"
    -H "Content-type: application/json"
    -d '{"type": "payment-succeeded"}'

Or with a Python script:

import json
import requests

url = "https://4iykoi7jk2kp5hhd5irhbdprn40yxest.lambda-url.us-west-2.on.aws/"
headers = {'SignatureHeader': 'XYZ', 'Content-type': 'application/json'}
payload = json.dumps({'type': 'payment-succeeded'})
querystring = {'myCustomParameter': 'squirrel'}

r = requests.post(url=url, params=querystring, data=payload, headers=headers)
print(r.json())

Don’t forget to set the request’s Content-type to application/json or text/* in your tests, otherwise, the body will be base64-encoded by default, and you’ll need to decode it in the Lambda handler.

Of course, in this case we’re talking about a webhook, so this function will receive requests directly from the external system that I’m integrating with. I only need to provide them with the public function URL and start receiving events.

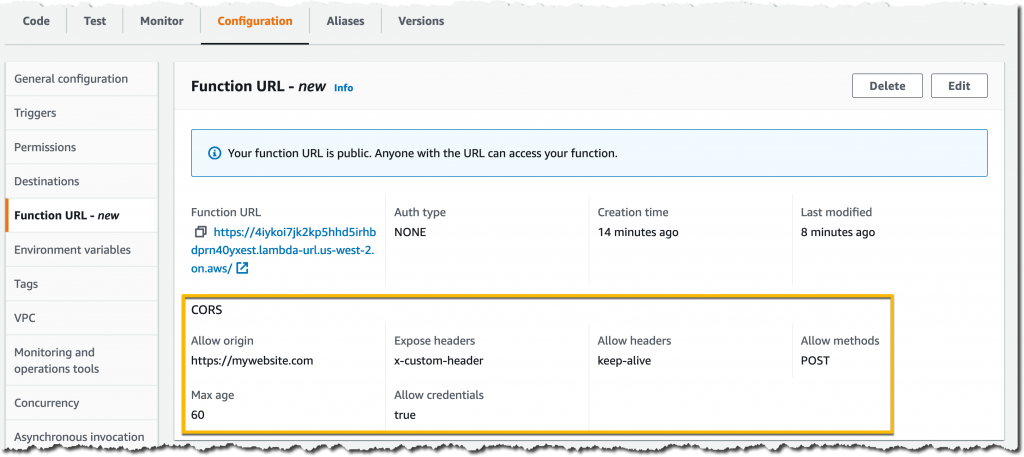
For this specific use case, I don’t need any CORS configuration. In other cases where the function URL is called from the browser, I’d need to configure a few more CORS parameters such as Access-Control-Allow-Origin, Access-Control-Allow-Methods, and Access-Control-Expose-Headers. I can easily review and edit these CORS parameters in the Lambda console or in my IaC templates. Here’s what it looks like in the console:

AWS Lambda URLs - CORS

Also, keep in mind that each function URL is unique and mapped to a specific alias or the $LATEST version of your function. This lets you define multiple URLs for the same function. For example, you can define one for testing the $LATEST version during development and one for each stage or alias, such as staging, production, and so on.

Support for Infrastructure as Code (IaC)
You can start configuring Lambda Function URLs directly in your IaC templates today using AWS CloudFormation, AWS SAM, and AWS Cloud Development Kit (AWS CDK).

For example, here’s how to define a Lambda function and its public URL with AWS SAM, including the alias mapping:

WebhookFunction:
    Type: AWS::Serverless::Function
    Properties:
      CodeUri: webhook/
      Handler: index.handler
      Runtime: nodejs14.x
      AutoPublishAlias: live
      FunctionUrlConfig:
        AuthType: NONE
        Cors:
            AllowOrigins:
                - "https://example.com"

If you have existing Lambda functions in your IaC templates, you can define a new function URL with a few lines of code.

Function URL Pricing
Function URLs are included in Lambda’s request and duration pricing. For example, let’s imagine that you deploy a single Lambda function with 128 MB of memory and an average invocation time of 50 ms. The function receives five million requests every month, so the cost will be $1.00 for the requests, and $0.53 for the duration. The grand total is $1.53 per month, in the US East (N. Virginia) Region.

When to use Function URLs vs. Amazon API Gateway
Function URLs are best for use cases where you must implement a single-function microservice with a public endpoint that doesn’t require the advanced functionality of API Gateway, such as request validation, throttling, custom authorizers, custom domain names, usage plans, or caching. For example, when you are implementing webhook handlers, form validators, mobile payment processing, advertisement placement, machine learning inference, and so on. It is also the simplest way to invoke your Lambda functions during research and development without leaving the Lambda console or integrating additional services.

Amazon API Gateway is a fully managed service that makes it easy for you to create, publish, maintain, monitor, and secure APIs at any scale. Use API Gateway to take advantage of capabilities like JWT/custom authorizers, request/response validation and transformation, usage plans, built-in AWS WAF support, and so on.

Generally Available Today
Function URLs are generally available today in all AWS Regions where Lambda is available, except for the AWS China Regions. Support is also available through many AWS Lambda Partners such as Datadog, Lumigo, Pulumi, Serverless Framework, Thundra, and Dynatrace.

I’m looking forward to hearing how you’re using this new functionality to simplify your serverless architectures, especially in single-function use cases where you want to keep things simple and cost-optimized.

Check out the new Lambda Function URLs documentation.

Alex

New – Sustainability Pillar for AWS Well-Architected Framework

Post Syndicated from Alex Casalboni original https://aws.amazon.com/blogs/aws/sustainability-pillar-well-architected-framework/

The AWS Well-Architected Framework has been helping AWS customers improve their cloud architectures since 2015. The framework consists of design principles, questions, and best practices across multiple pillars: Operational Excellence, Security, Reliability, Performance Efficiency, and Cost Optimization.

Today we are introducing a new Sustainability Pillar to help organizations learn, measure, and improve their workloads using environmental best practices for cloud computing.

Similar to the other pillars, the Sustainability Pillar contains questions aimed at evaluating the design, architecture, and implementation of your workloads to reduce their energy consumption and improve their efficiency. The pillar is designed as a tool to track your progress toward policies and best practices that support a more sustainable future, not just a simple checklist.

The Shared Responsibility Model of Cloud Sustainability
The shared responsibility model also applies to sustainability. AWS is responsible for the sustainability of the cloud, while AWS customers are responsible for sustainability in the cloud.

The sustainability of the cloud allows AWS customers to reduce associated energy usage by nearly 80% with respect to a typical on-premises deployment. This is possible because of the much higher server utilization, power and cooling efficiency, custom data center design, and continued progress on the path to powering AWS operations with 100% renewable energy by 2025. But we can achieve much more by collectively designing sustainable architectures.

We are introducing the new Sustainability Pillar to help organizations improve their sustainability in the cloud. This is a continuous effort focused on energy reduction and efficiency of all types of workloads. In practice, the pillar helps developers and cloud architects surface the trade-offs, highlight patterns and best practices, and avoid anti-patterns. For example, selecting an efficient programming language, adopting modern algorithms, using efficient data storage techniques, and deploying correctly sized and efficient infrastructure.

Specifically, the pillar is designed to support organizations in developing a better understanding of the state of their workloads, as well as the impact related to defined sustainability targets, how to measure against these targets, and how to model where they cannot directly measure.

In addition to building sustainable workloads in the cloud, you can use AWS technology to solve broader sustainability challenges. For example, reducing the environmental incidents caused by industrial equipment failure using Amazon Monitron to detect abnormal behavior and conduct preventative maintenance. We call this sustainability through the cloud.

Well-Architected Design Principles for Sustainability in the Cloud
The Sustainability Pillar includes design principles and operational guidance, as well as architectural and software patterns.

The design principles will facilitate good design for sustainability:

  • Understand your impact – Measure business outcomes and the related sustainability impact to establish performance indicators, evaluate improvements, and estimate the impact of proposed changes over time.
  • Establish sustainability goals – Set long-term goals for each workload, model return on investment (ROI) and give owners the resources to invest in sustainability goals. Plan for growth and design your architecture to reduce the impact per unit of work such as per user or per operation.
  • Maximize utilization – Right size each workload to maximize the energy efficiency of the underlying hardware, and minimize idle resources.
  • Anticipate and adopt new, more efficient hardware and software offerings – Support upstream improvements by your partners, continually evaluate hardware and software choices for efficiencies, and design for flexibility to adopt new technologies over time.
  • Use managed services – Shared services reduce the amount of infrastructure needed to support a broad range of workloads. Leverage managed services to help minimize your impact and automate sustainability best practices such as moving infrequent accessed data to cold storage and adjusting compute capacity.
  • Reduce the downstream impact of your cloud workloads – Reduce the amount of energy or resources required to use your services and reduce the need for your customers to upgrade their devices; test using device farms to measure impact and test directly with customers to understand the actual impact on them.

Well-Architected Best Practices for Sustainability
The design principles summarized above correspond to concrete architectural best practices that development teams can apply every day.

Some examples of architectural best practices for sustainability:

  • Optimize geographic placement of workloads for user locations
  • Optimize areas of code that consume the most time or resources
  • Optimize impact on customer devices and equipment
  • Implement a data classification policy
  • Use lifecycle policies to delete unnecessary data
  • Minimize data movement across networks
  • Optimize your use of GPUs
  • Adopt development and testing methods that allow rapid introduction of potential sustainability improvements
  • Increase the utilization of your build environments

Many of these best practices are generic and apply to all workloads, while others are specific to some use cases, verticals, and compute platforms. I’d highly encourage you to dive into these practices and identify the areas where you can achieve the most impact immediately.

Transforming sustainability into a non-functional requirement can result in cost effective solutions and directly translate to cost savings on AWS, as you only pay for what you use. In some cases, meeting these non-functional targets might involve tradeoffs in terms of uptime, availability, or response time. Where minor tradeoffs are required, the sustainability improvements are likely to outweigh the change in quality of service. It’s important to encourage teams to continuously experiment with sustainability improvements and embed proxy metrics in their team goals.

Available Now
The AWS Well-Architected Sustainability Pillar is a new addition to the existing framework. By using the design principles and best practices defined in the Sustainability Pillar Whitepaper, you can make informed decisions balancing security, cost, performance, reliability, and operational excellence with sustainability outcomes for your workloads on AWS.

Learn more about the new Sustainability Pillar.

Alex

New – Enhanced Dead-letter Queue Management Experience for Amazon SQS Standard Queues

Post Syndicated from Alex Casalboni original https://aws.amazon.com/blogs/aws/enhanced-dlq-management-sqs/

Hundreds of thousands of customers use Amazon Simple Queue Service (SQS) to build message-based applications to decouple and scale microservices, distributed systems, and serverless apps. When a message cannot be successfully processed by the queue consumer, you can configure SQS to store it in a dead-letter queue (DLQ).

As a software developer or architect, you’d like to examine and review unconsumed messages in your DLQs to figure out why they couldn’t be processed, identify patterns, resolve code errors, and ultimately reprocess these messages in the original queue. The life cycle of these unconsumed messages is part of your error-handling workflow, which is often manual and time consuming.

Today, I’m happy to announce the general availability of a new enhanced DLQ management experience for SQS standard queues that lets you easily redrive unconsumed messages from your DLQ to the source queue.

This new functionality is available in the SQS console and helps you focus on the important phase of your error handling workflow, which consists of identifying and resolving processing errors. With this new development experience, you can easily inspect a sample of the unconsumed messages and move them back to the original queue with a click, and without writing, maintaining, and securing any custom code. This new experience also takes care of redriving messages in batches, reducing overall costs.

DLQ and Lambda Processor Setup
If you’re already comfortable with the DLQ setup, then skip the setup and jump into the new DLQ redrive experience.

First, I create two queues: the source queue and the dead-letter queue.

I edit the source queue and configure the Dead-letter queue section. Here, I pick the DLQ and configure the Maximum receives, which is the number of times after which a message is reprocessed before being sent to the DLQ. For this demonstration, I’ve set it to one. This means that every failed message goes to the DLQ immediately. In a real-world environment, you might want to set a higher number depending on your requirements and based on what a failure means with respect to your application.

I also edit the DLQ to make sure that only my source queue is allowed to use this DLQ. This configuration is optional: when this Redrive allow policy is disabled, any SQS queue can use this DLQ. There are cases where you want to reuse a single DLQ for multiple queues. But usually it’s considered best practices to setup independent DLQs per source queue to simplify the redrive phase without affecting cost. Keep in mind that you’re charged based on the number of API calls, not the number of queues.

Once the DLQ is correctly set up, I need a processor. Let’s implement a simple message consumer using AWS Lambda.

The Lambda function written in Python will iterate over the batch of incoming messages, fetch two values from the message body, and print the sum of these two values.

import json

def lambda_handler(event, context):
    for record in event['Records']:
        payload = json.loads(record['body'])

        value1 = payload['value1']
        value2 = payload['value2']

        value_sum = value1 + value2
        print("the sum is %s" % value_sum)
        
    return "OK"

The code above assumes that each message’s body contains two integer values that can be summed, without dealing with any validation or error handling. As you can imagine, this will lead to trouble later on.

Before processing any messages, you must grant this Lambda function enough permissions to read messages from SQS and configure its trigger. For the IAM permissions, I use the managed policy named AWSLambdaSQSQueueExecutionRole, which grants permissions to invoke sqs:ReceiveMessage, sqs:DeleteMessage, and sqs:GetQueueAttributes.

I use the Lambda console to set up the SQS trigger. I could achieve the same from the SQS console too.

Now I’m ready to process new messages using Send and receive messages for my source queue in the SQS console. I write {"value1": 10, "value2": 5} in the message body, and select Send message.

When I look at the CloudWatch logs of my Lambda function, I see a successful invocation.

START RequestId: 637888a3-c98b-5c20-8113-d2a74fd9edd1 Version: $LATEST
the sum is 15
END RequestId: 637888a3-c98b-5c20-8113-d2a74fd9edd1
REPORT RequestId: 637888a3-c98b-5c20-8113-d2a74fd9edd1	Duration: 1.31 ms	Billed Duration: 2 ms	Memory Size: 128 MB	Max Memory Used: 39 MB	Init Duration: 116.90 ms	

Troubleshooting powered by DLQ Redrive
Now what if a different producer starts publishing messages with the wrong format? For example, {"value1": "10", "value2": 5}. The first number is a string and this is quite likely to become a problem in my processor.

In fact, this is what I find in the CloudWatch logs:

START RequestId: 542ac2ca-1db3-5575-a1fb-98ce9b30f4b3 Version: $LATEST
[ERROR] TypeError: can only concatenate str (not "int") to str
Traceback (most recent call last):
  File "/var/task/lambda_function.py", line 8, in lambda_handler
    value_sum = value1 + value2
END RequestId: 542ac2ca-1db3-5575-a1fb-98ce9b30f4b3
REPORT RequestId: 542ac2ca-1db3-5575-a1fb-98ce9b30f4b3	Duration: 1.69 ms	Billed Duration: 2 ms	Memory Size: 128 MB	Max Memory Used: 39 MB	

To figure out what’s wrong in the offending message, I use the new SQS redrive functionality, selecting DLQ redrive in my dead-letter queue.

I use Poll for messages and fetch all unconsumed messages from the DLQ.

And then I inspect the unconsumed message by selecting it.

The problem is clear, and I decide to update my processing code to handle this case properly. In the ideal world, this is an upstream issue that should be fixed in the message producer. But let’s assume that I can’t control that system and it’s critically important for the business that I process this new type of messages.

Therefore, I update the processing logic as follows:

import json

def lambda_handler(event, context):
    for record in event['Records']:
        payload = json.loads(record['body'])
        value1 = int(payload['value1'])
        value2 = int(payload['value2'])
        value_sum = value1 + value2
        print("the sum is %s" % value_sum)
        # do some more stuff
        
    return "OK"

Now that my code is ready to process the unconsumed message, I start a new redrive task from the DLQ to the source queue.

By default, SQS will redrive unconsumed messages to the source queue. But you could also specify a different destination and provide a custom velocity to set the maximum number of messages per second.

I wait for the redrive task to complete by monitoring the redrive status in the console. This new section always shows the status of most recent redrive task.

The message has been moved back to the source queue and successfully processed by my Lambda function. Everything looks fine in my CloudWatch logs.

START RequestId: 637888a3-c98b-5c20-8113-d2a74fd9edd1 Version: $LATEST
the sum is 15
END RequestId: 637888a3-c98b-5c20-8113-d2a74fd9edd1
REPORT RequestId: 637888a3-c98b-5c20-8113-d2a74fd9edd1	Duration: 1.31 ms	Billed Duration: 2 ms	Memory Size: 128 MB	Max Memory Used: 39 MB	Init Duration: 116.90 ms	

Available Today at No Additional Cost
Today you can start leveraging the new DLQ redrive experience to simplify your development and troubleshooting workflows, without any additional cost. This new console experience is available in all AWS Regions where SQS is available, and we’re looking forward to hearing your feedback.

Alex

Announcing Amazon SageMaker Canvas – a Visual, No Code Machine Learning Capability for Business Analysts

Post Syndicated from Alex Casalboni original https://aws.amazon.com/blogs/aws/announcing-amazon-sagemaker-canvas-a-visual-no-code-machine-learning-capability-for-business-analysts/

As an organization facing business problems and dealing with data on a daily basis, the ability to build systems that can predict business outcomes becomes very important. This ability lets you solve problems and move faster by automating slow processes and embedding intelligence in your IT systems.

But how do you make sure that all teams and individual decision makers in the organization are empowered to create these machine learning (ML) systems at scale, and without depending on other data science and data engineering teams? As a business user or data analyst, you’d like to build and use prediction systems based on the data that you analyze and process every day, without having to learn about hundreds of algorithms, training parameters, evaluation metrics, and deployment best practices.

Today, I’m excited to announce the general availability of Amazon SageMaker Canvas, a new visual, no code capability that allows business analysts to build ML models and generate accurate predictions without writing code or requiring ML expertise. Its intuitive user interface lets you browse and access disparate data sources in the cloud or on-premises, combine datasets with the click of a button, train accurate models, and then generate new predictions once new data is available.

SageMaker Canvas leverages the same technology as Amazon SageMaker to automatically clean and combine your data, create hundreds of models under the hood, select the best performing one, and generate new individual or batch predictions. It supports multiple problem types such as binary classification, multi-class classification, numerical regression, and time series forecasting. These problem types let you address business-critical use cases, such as fraud detection, churn reduction, and inventory optimization, without writing a single line of code.

SageMaker Canvas in Action
Imagine that I’m an e-commerce manager who needs to predict whether or not a product will be shipped on time. The datasets at my disposal consist of a product catalog and the historical shipping dataset, both in CSV format.

First, I enter the SageMaker Canvas application where all of my models and datasets are created and inspected.

I select Import, and upload two CSV files: ProductData.csv and ShippingData.csv. I have 120 products and 10,000 shipping records.

I could also fetch data from Amazon Simple Storage Service (Amazon S3) or connect to other cloud or on-premises data sources, such as Amazon Redshift or Snowflake. For this use case, I prefer to upload 1.6 MB of data directly from my computer.

Before confirming the import, I have a chance to preview the two datasets, their columns, and their respective values. For example, each product has a ComputerBrand, ScreenSize, and PackageWeight. In addition to useful columns such as ShippingOrigin, OrderDate, and ShippingPriority, each record in the shipping dataset also contains OnTimeDelivery, which is either On Time or Late. This column will be used by SageMaker Canvas to generate a prediction model based on historical data.

After a few seconds of processing, the datasets are ready, and I decide to join them to create a single dataset containing both product and shipping information. This is an optional step that often lets you increase the precision of a prediction model.

Now I can simply drag and drop the two datasets: SageMaker Canvas will automatically identify the shared ProductId column and apply an Inner Join transformation.

The join preview lets me visualize the resulting columns, identify missing or invalid values, and optionally deselect unwanted columns.

I select Save joined data and provide a new name for this joined dataset, which now includes 16 columns and 10,000 records.

Next, I want to create a model and start by selecting New model in the Models section on the left menu. I call it On Time Prediction Model.

The first step is selecting a dataset.

I select a target column that my model will predict: OnTimeDelivery.

SageMaker Canvas shows me the value distribution and already recommends the most appropriate model type: two categories classification.

Before proceeding with the model training, I have the option to generate an analysis report. This analysis gives me two very important pieces of information: the estimated accuracy and the impact of each column.

The estimated accuracy of 99.9% gives me confidence, but then I notice that the highest impact is provided by the ActualShippingDays column. Unfortunately, this column is not available in advance and I can’t use it for my predictions. So I deselect it and run the analysis again.

The new estimated accuracy is 94.2%, which is still pretty high. The most impactful columns are ShippingPriority, YShippingDistance, XShippingDistance, and Carrier. This is great because all of this information is available in advance and can be used for a prediction. On the other hand, product-related columns, such PackageWeight and ScreenSize, have very small impacts on the prediction. This means that in the future I could simplify the overall process by feeding only shipping information into the training and prediction phases.

I’m happy with the analysis insights. Therefore, I decide to proceed and build a prediction model by selecting the Standard build option.

Now I can go for a walk, attend a few productive meetings, or simply spend some time with family. SageMaker Canvas is doing all of the work for me, training hundreds of models behind the scenes. It will select the best performing one, so that I can start generating accurate predictions in a couple of hours. Of course, the training duration will vary depending on the dataset size and problem type.

After about an hour and a half, the model is ready and the console lets me analyze its accuracy and the column impacts visually. I’m also happy to see that the model predicts the correct value 95.8% of the time, which is even higher than the estimated accuracy.

Optionally, I could also inspect advanced metrics such as Precision, Recall, F1 Score, and so on. These metrics help me understand how the model is performing and what kind of false positives and false negatives I can expect from this model.

From here, I could share the model into Amazon SageMaker Studio or continue using the Canvas UI to generate new predictions.

I decide to continue with the intuitive UI and select Predict. Now I can work with individual records or with a dataset for batch predictions.

When selecting Single prediction, SageMaker Canvas simplifies my life and lets me start from an existing record. I modify the column values and get immediate feedback on the prediction and the corresponding feature importance.

This quick feedback loop and intuitive UI allows me to use the ML model without having to write custom code. In case I decide to integrate the model into an automated production system, the Amazon SageMaker Studio integration lets me share the model easily with other data scientists in my team.

Generally Available Today
SageMaker Canvas is generally available in US East (Ohio), US East (N. Virginia), US West (Oregon), Europe (Frankfurt), and Europe (Ireland). You can start using it with your local datasets, as well as data already stored on Amazon S3, Amazon Redshift, or Snowflake. With just a few clicks, you’ll prepare and join your datasets, analyze estimated accuracy, verify which columns are impactful, train the best performing model, and generate new individual or batch predictions. We’re excited to hear your feedback and help you solve even more business problems with ML.

Alex

Announcing AWS Data Exchange for APIs: Find, Subscribe to, and Use Third-party APIs with Consistent Authentication

Post Syndicated from Alex Casalboni original https://aws.amazon.com/blogs/aws/data-exchange-for-apis-find-subscribe-use-third-party-apis-consistent-authentication/

Data is at the center of many processes and products, whether it’s a large-scale dataset used to train machine learning models, a relational database, or an API-based integration. AWS Data Exchange lets you discover, subscribe to, and use hundreds of file-based datasets via Amazon Simple Storage Service (Amazon S3) offered by third parties such as Reuters, Foursquare, Change Healthcare, Vortexa, IMDb, and many more. Additionally, AWS Data Exchange for Amazon Redshift makes it even easier to ingest third-party data in your Amazon Redshift data warehouse, without any manual processing or transformation.

However, in many cases your data projects require more than static datasets because you need frequent and synchronous retrieval of small amounts of information – for example, you might need to fetch a stock price every hour. Data APIs let you answer specific questions quickly and without having to build ad-hoc data pipelines to ingest, process, and analyze bulk datasets. But each API provider has its own ease of use, SDK, documentation, and authentication mechanisms, which makes this harder than it needs to be.

Today, I’m happy to announce the general availability of AWS Data Exchange for APIs, a new capability that lets you find, subscribe to, and use third-party APIs with a consistent access using AWS SDKs, as well as consistent AWS-native authentication and governance. This simplifies the lives of developers and IT administrators who have to integrate and secure the access to multiple third-party APIs.

Now you can make RESTful or GraphQL API calls directly to AWS Data Exchange and receive synchronous responses that contain the information you need, using the AWS SDK in the programming language of your choice. We take care of integrating with the API provider, implementing proper authentication, managing the API subscription, and ensuring charges appear on your AWS bill. You can manage API access centrally with AWS Identity and Access Management (IAM).

As a data provider, you make your API discoverable by millions of AWS customers by listing it in the AWS Data Exchange catalog using an OpenAPI specification and fronting it with an Amazon API Gateway endpoint.

AWS Data Exchange for APIs in Action
First, I look for an API product in the AWS Data Exchange catalog, review its subscription terms, support information, and auto-renewal. Each API product might include multiple public or private subscription offers and periods.

I select Subscribe and a couple of minutes later I’m successfully subscribed.

Within the API product, I select an entitled data set and its latest revision.

Each API revision contains one or more API assets that correspond to a specific API endpoint and a unique Asset ARN.

AWS Data Exchange takes care of invoking API endpoints with the correct authentication.

All I need to do is check the Integration notes, which include instructions and code snippets based on the AWS Command Line Interface (CLI).

Of course, I could implement the very same API call with my favorite programming language using one of the AWS SDKs.

For example, here’s how I’d implement a simple wrapper function in Python:

import json
import urllib
import boto3

adx = boto3.client('dataexchange')

def get_api_response(path, method="GET", querystring={}, headers={}, body={}):
    return adx.send_api_asset(
        DataSetId="4b3fbabc31171662851531b8576a3411",
        RevisionId="e8e78e921af12c76499edc40f92e3082",
        AssetId="557d858c317efdfb5b6c9a2860ec4a03",
        Method=method,
        Path=path,
        QueryStringParameters=urllib.urlencode(querystring),
        RequestHeaders=urllib.urlencode(headers),
        Body=json.dumps(body),
    )

Please note that there are no hard-coded credentials in the code above because all the authorization happens via AWS Identity and Access Management (IAM).

And that’s how you make your first API call via AWS Data Exchange for APIs.

Available Today
AWS Data Exchange for APIs is generally available in all AWS Regions where AWS Data Exchange is available. We’re looking forward to helping you simplify and centralize the management and governance of third-party APIs while we take care of the undifferentiated heavy lifting for you.

Today you can start integrating third-party APIs such as Infutor, Variety Business Intelligence, IMDb, PeopleDataLabs, Neustar, Experian, Foursquare, PredictHQ, WeatherTrends International, and many more.

If you’re a developer, check out the new AWS Data Exchange for APIs documentation to learn more about subscribing and using APIs. If you’re an API provider, check out the new publishing documentation to learn more about publishing new APIs on the AWS Data Exchange catalog.

Alex

Announcing AWS Well-Architected Custom Lenses: Extend the Well-Architected Framework with Your Internal Best Practices

Post Syndicated from Alex Casalboni original https://aws.amazon.com/blogs/aws/well-architected-custom-lenses-internal-best-practices/

We launched the AWS Well-Architected Framework back in 2015 to help you review workloads against architectural best practices, and across pillars such as operational excellence, security, reliability, performance efficiency, and cost optimization. In 2017, we extended the framework with the concept of “lenses” to optimize specific workload types such as the Serverless Lens, the SaaS Lens, and the Foundational Technical Review (FTR) Lens for APN Partners. In 2018, we launched the AWS Well-Architected Tool, a self-service tool designed to help you review AWS workloads at any time, without the need for an AWS Solutions Architect.

Today, I’m happy to announce the general availability of AWS Well-Architected Custom Lenses, a new feature of the AWS Well-Architected Tool that lets you bring your own best practices to complement the existing framework based on your industry, operational plans, and internal processes. Custom Lenses provide a consolidated view and a consistent way to measure and improve your workloads on AWS without relying on external spreadsheets or third-party systems.

In addition to AWS Well-Architected Lenses, now you can create and share custom lenses and include them in your workload reviews, ultimately tailoring the review to your organizational needs. For example, you could define a custom lens to review your workloads against PCI compliance, SOC 2 compliance, or other national or industry regulations. As an AWS Partner, you might include ad-hoc best practices in your custom lenses when reviewing workloads with customers from different industries and segments, ultimately making the review process easier, faster, and more comprehensive.

How to Define a new Custom Lens
You author a new custom lens by editing a JSON preset template, where you define questions, choices, helpful resources, improvement plans, and risk rules.

Here’s how it works: download the template from the AWS Well-Architected Tool, work on it locally, and then re-upload it.

The JSON structure is composed of multiple pillars. Each pillar might contain multiple questions, each with its own choices and risk rules.

Your JSON file will look like this:

{
    "schemaVersion": "2021-11-01",
    "name": "My Test Lens",
    "description": "This is a description of my test lens.",
    "pillars": [
        {
            "id": "pillar_red",
            "name": "Red Pillar",
            "questions": [
                {
                    "id": "pillar_1_q1",
                    "title": "How do you get started with this pillar?",
                    "description": "Optional description.",
                    "choices": [
                        {
                            "id": "choice1",
                            "title": "Best practice #1",
                            "helpfulResource": {
                                "displayText": "This is helpful text for the first choice.",
                                "url": "https://aws.amazon.com"
                            },
                            "improvementPlan": {
                                "displayText": "This is text that will be shown for improvement of this choice."
                            }
                        },
                        {
                            "id": "choice2",
                            "title": "Best practice #2",
                            ...
                        }
                    ],
                    "riskRules": [
                        {
                            "condition": "choice1 && choice2",
                            "risk": "NO_RISK"
                        },
                        {
                            "condition": "choice1 && !choice2",
                            "risk": "MEDIUM_RISK"
                        },
                        {
                            "condition": "default",
                            "risk": "HIGH_RISK"
                        }
                    ]
                }
            ]
            ...
        },
        ...
    ]
}

Once you’re ready to submit your JSON file, proceed with the upload.

And don’t worry about making it perfect on the first try. You’ll be able to improve it and add new versions.

AWS Well-Architected Custom Lenses in Action
You find the list of custom lenses and their latest version in the new Custom Lenses section.

Each custom lens has an owner and can be shared with multiple AWS accounts too.

Before using this new custom lens in a workload review, you’ll need to publish it and assign it a version.

Select Publish lens and provide a version name such as 1.0.

Now you can create a new workload review and apply both AWS-owned lenses and your own custom lenses, in addition to the main framework.

During the workload review, you will go through each pillar and questions of the custom lens, using the same user interface provided by the AWS Well-Architected Tool.

Last but not least, you can share your custom lens with other AWS Identity and Access Management (IAM) principals such as AWS accounts, IAM users, and IAM roles.

Available Today at No Charge
Custom Lenses are available today in all AWS Regions where the AWS Well-Architected Tool is available, at no cost. You can define up to five custom lenses and share them across AWS Accounts, in addition to the existing Well-Architected Framework and AWS-owned Lenses.

Check out the technical documentation here.

We’re looking forward to hearing your feedback and iterating quickly to improve the authoring and sharing experience based on your needs.

Alex

Amazon CodeGuru Reviewer Introduces Secrets Detector to Identify Hardcoded Secrets and Secure Them with AWS Secrets Manager

Post Syndicated from Alex Casalboni original https://aws.amazon.com/blogs/aws/codeguru-reviewer-secrets-detector-identify-hardcoded-secrets/

Amazon CodeGuru helps you improve code quality and automate code reviews by scanning and profiling your Java and Python applications. CodeGuru Reviewer can detect potential defects and bugs in your code. For example, it suggests improvements regarding security vulnerabilities, resource leaks, concurrency issues, incorrect input validation, and deviation from AWS best practices.

One of the most well-known security practices is the centralization and governance of secrets, such as passwords, API keys, and credentials in general. As many other developers facing a strict deadline, I’ve often taken shortcuts when managing and consuming secrets in my code, using plaintext environment variables or hard-coding static secrets during local development, and then inadvertently commit them. Of course, I’ve always regretted it and wished there was an automated way to detect and secure these secrets across all my repositories.

Today, I’m happy to announce the new Amazon CodeGuru Reviewer Secrets Detector, an automated tool that helps developers detect secrets in source code or configuration files, such as passwords, API keys, SSH keys, and access tokens.

These new detectors use machine learning (ML) to identify hardcoded secrets as part of your code review process, ultimately helping you to ensure that all new code doesn’t contain hardcoded secrets before being merged and deployed. In addition to Java and Python code, secrets detectors also scan configuration and documentation files. CodeGuru Reviewer suggests remediation steps to secure your secrets with AWS Secrets Manager, a managed service that lets you securely and automatically store, rotate, manage, and retrieve credentials, API keys, and all sorts of secrets.

This new functionality is included as part of the CodeGuru Reviewer service at no additional cost and supports the most common API providers, such as AWS, Atlassian, Datadog, Databricks, GitHub, Hubspot, Mailchimp, Salesforce, SendGrid, Shopify, Slack, Stripe, Tableau, Telegram, and Twilio. Check out the full list here.

Secrets Detectors in Action
First, I select CodeGuru from the AWS Secrets Manager console. This new flow lets me associate a new repository and run a full repository analysis with the goal of identifying hardcoded secrets.

Associating a new repository only takes a few seconds. I connect my GitHub account, and then select a repository named hawkcd, which contains a few Java, C#, JavaScript, and configuration files.

A few minutes later, my full repository is successfully associated and the full scan is completed. I could also have a look at a demo repository analysis called DemoFullRepositoryAnalysisSecrets. You’ll find this demo in the CodeGuru console, under Full repository analysis, in your AWS Account.

I select the repository analysis and find 42 recommendations, including one recommendation for a hardcoded secret (you can filter recommendations by Type=Secrets). CodeGuru Reviewer identified a hardcoded AWS Access Key ID in a .travis.yml file.

The recommendation highlights the importance of storing these secrets securely, provides a link to learn more about the issue, and suggests rotating the identified secret to make sure that it can’t be reused by malicious actors in the future.

CodeGuru Reviewer lets me jump to the exact file and line of code where the secret appears, so that I can dive deeper, understand the context, verify the file history, and take action quickly.

Last but not least, the recommendation includes a Protect your credential button that lets me jump quickly to the AWS Secrets Manager console and create a new secret with the proper name and value.

I’m going to remove the plaintext secret from my source code and update my application to fetch the secret value from AWS Secrets Manager. In many cases, you can keep the current configuration structure and use existing parameters to store the secret’s name instead of the secret’s value.

Once the secret is securely stored, AWS Secrets Manager also provides me with code snippets that fetch my new secret in many programming languages using the AWS SDKs. These snippets let me save time and include the necessary SDK call, as well as the error handling, decryption, and decoding logic.

I’ve showed you how to run a full repository analysis, and of course the same analysis can be performed continuously on every new pull request to help you prevent hardcoded secrets and other issues from being introduced in the future.

Available Today with CodeGuru Reviewer
CodeGuru Reviewer Secrets Detector is available in all regions where CodeGuru Reviewer is available, at no additional cost.

If you’re new to CodeGuru Reviewer, you can try it for free for 90 days with repositories up to 100,000 lines of code. Connecting your repositories and starting a full scan takes only a couple of minutes, whether your code is hosted on AWS CodeCommit, BitBucket, or GitHub. If you’re using GitHub, check out the GitHub Actions integration as well.

You can learn more about Secrets Detector in the technical documentation.

Alex

Introducing Amazon Redshift Query Editor V2, a Free Web-based Query Authoring Tool for Data Analysts

Post Syndicated from Alex Casalboni original https://aws.amazon.com/blogs/aws/amazon-redshift-query-editor-v2-web-query-authoring/

When it comes to manipulating and analyzing relational data, Structured Query Language (SQL) has been an international standard since 1986, a couple of years before I was born. And yet, it sometimes takes hours to get access to a new database or data warehouse, configure credentials or single sign-on, download and install multiple desktop libraries or drivers, and get familiar with the new schema—all this before you even run a query. Not to mention the challenge of sharing queries, results, and analyses securely between members of the same team or across teams.

Today, I’m glad to announce the general availability of Amazon Redshift Query Editor V2, a web-based tool that you can use to explore, analyze, and share data using SQL. It allows you to explore, analyze, share, and collaborate on data stored on Amazon Redshift. It supports data warehouses on Amazon Redshift and data lakes through Amazon Redshift Spectrum.

Amazon Redshift Query Editor V2 provides a free serverless web interface that reduces the operational costs of managing query tools and infrastructure. Because it’s a managed SQL editor in your browser and it’s integrated with your single sign-on provider, the Query Editor V2 reduces the number of steps to the first query so you gain insights faster. You also get in-place visual analysis of query results (no data download required), all in one place. As an additional team productivity boost, it improves collaboration with saved queries and the ability to share results and analyses between users.

From a security standpoint, analysts can access Query Editor V2 without requiring any admin privileges on the Amazon Redshift cluster, using an IAM role for READ, WRITE, or ADMIN access. Check out the documentation for more details.

Connection Setup for Amazon Redshift Query Editor V2
First, you’ll need to configure the connection to your Amazon Redshift cluster.

After you have configured the connection, you can reuse it for future sessions. And, of course, you can edit or delete a connection at any time.

Simply click on a cluster to connect with Query Editor V2.

Amazon Redshift Query Editor V2 in Action
The web interface allows you to browse schemas, tables, views, functions, and stored procedures. You can also preview a table’s columns with one click and create or delete schemas, tables, or functions.

The interface is intuitive for newcomers and expert users alike. You can resize panels, create tabs, and configure your editor preferences.

Running or explaining a query is quite straightforward: You simply write (or paste) the query and choose Run. You can visualize and interact with the result set in the bottom pane. For example, you might want to change the row ordering or search for a specific word. Even though Amazon Redshift Query Editor V2 is a browser-based tool, the data movement between your browser and the Amazon Redshift cluster is optimized, so your browser doesn’t need to download any raw data. A lot of the filtering and reordering happens directly in the browser, without any wait time.

To export a result set as a JSON or CSV file on your local machine, simply right-click it.

So far so good! Running queries is the minimum you’d expect from a Query Editor. Let’s have a look at some of the more interesting features.

Team Collaboration with Amazon Redshift Query Editor V2
Amazon Redshift Query Editor V2 allows you to manage the permissions of your team members based on their IAM roles, so that you can easily share queries and cluster access in a secure way.

For example, you can use IAM managed policies such as AmazonRedshiftQueryEditorV2FullAccess, AmazonRedshiftQueryEditorV2ReadSharing, or AmazonRedshiftQueryEditorV2ReadWriteSharing. Also, don’t forget to include the redshift:GetClusterCredentials permission.

After you’ve set up the IAM roles for your team, choose Save to save a query.

The Untitled tab will show the query name. From now on, you edit this saved query to make updates and then choose Save again.

Individual users with WRITE access can run, edit, and delete shared queries, while users with READ access can only run shared queries.

If you work on multiple projects and collaborate with many different teams, it might be difficult to remember query names or even find them in a long list. In Amazon Redshift Query Editor V2, saved and shared queries are available from the left navigation in Queries. You can keep your queries organized into folders. Even nested folders are supported.

Last but not least, each saved query is versioned and the version history is always available. That’s pretty useful when you need to restore an older version.

Plot Your Queries with Amazon Redshift Query Editor V2
Sharing queries with teammates is great, but wouldn’t it even better if you could visualize a result set, export it as PNG or JPEG, and save the chart for later? Amazon Redshift Query Editor V2 allows you to perform in-place visualizations of your results. When you’re happy with the look and feel of your chart, you can save it for later and organize all your saved charts into folders. This allows you to simply choose a saved chart, rerun the corresponding query, and export the new image. No need to configure the plot from scratch or remember the configuration of hundreds of charts and queries across different projects.

Available Today
Amazon Redshift Query Editor V2 is available today in all commercial AWS Regions, except AP-Northeast-3 regions. It requires no license and it’s free, except for the cost for your Amazon Redshift cluster.

You can interact with the service using the Amazon Redshift console. It doesn’t require any driver or software on your local machine.

For more information, see the Amazon Redshift Query Editor V2 technical documentation or take a look at this video:

We look forward to your feedback.

Alex

AWS IQ expansion: Connect with Experts and Consulting Firms based in the UK and France

Post Syndicated from Alex Casalboni original https://aws.amazon.com/blogs/aws/aws-iq-expansion-experts-uk-france/

AWS IQ launched in 2019 and has been helping customers worldwide engage thousands of AWS Certified third-party experts and consulting firms for on-demand project work. Whether you need to learn about AWS, plan your project, setup new services, migrate existing applications, or optimize your spend, AWS IQ connects you with experts and consulting firms who can help. You can share your project objectives with a description, receive responses within the AWS IQ application, approve permissions and budget, and will be charged directly through AWS billing.

Until yesterday, experts had to reside in the United States to offer their hands-on help on AWS IQ. Today, I’m happy to announce that AWS Certified experts and consulting firms based in the UK and France can participate in AWS IQ.

If you are an AWS customer based in the UK or France and need to connect with local AWS experts, now you can reach out to a wider pool of experts and consulting firms during European business hours. When creating a new project, you can now indicate a preferred expert location.

As an AWS Certified expert you can now view the buyer’s preferred expert location to ensure the right fit. AWS IQ simplifies finding relevant opportunities and it helps you access a customer’s AWS environment securely. It also takes care of billing so more time is spent on solving customer problems, instead of administrative tasks. Your payments will be disbursed by AWS Marketplace in USD towards a US bank account. If you don’t already have a US bank account, you may be able to obtain one through third-party services such as Hyperwallet.

AWS IQ User Interface Update
When you create a new project request, you can select a Preferred expert or firm location: Anywhere, France, UK, or US.

Check out Jeff Barr’s launch article to learn more about the full request creation process.

You can also work on the same project with multiple experts from different locations.

When browsing experts and firms, you will find their location under the company name and reviews.

Available Today
AWS IQ is available for customers anywhere in the world (except China) for all sorts of project work, delivered by AWS experts in the United States, the United Kingdom, and France. Get started by creating your project request on iq.aws.amazon.com. Here you can discover featured experts or browse experts for a specific service such as Amazon Elastic Compute Cloud (EC2) or DynamoDB.

If you’re interested in getting started as an expert, check out AWS IQ for Experts. Your profile will showcase your AWS Certifications as well as the ratings and reviews from completed projects.

I’m excited about the expansion of AWS IQ for experts based in the UK and France, and I’m looking forward to further expansions in the future.

Alex

How to Accelerate Performance and Availability of Multi-region Applications with Amazon S3 Multi-Region Access Points

Post Syndicated from Alex Casalboni original https://aws.amazon.com/blogs/aws/s3-multi-region-access-points-accelerate-performance-availability/

Building multi-region applications allows you to improve latency for end users, achieve higher availability and resiliency in case of unexpected disasters, and adhere to business requirements related to data durability and data residency. For example, you might want to reduce the overall latency of dynamic API calls to your backend services . Or you might want to extend a single-region deployment to handle internet routing issues, failures of submarine cables, or regional connectivity issues – and therefore avoid costly downtime. Today, thanks to multi-region data replication functions such as Amazon DynamoDB global tables, Amazon Aurora global database, Amazon ElastiCache global datastore, and Amazon Simple Storage Service (Amazon S3) cross-region replication, you can build multi-region applications across 25 AWS Regions worldwide.

Yet, when it comes to implementing multi-region applications, you often have to make your code region-aware and take care of the heavy lifting of interacting with the correct regional resources, whether it’s the closest or the most available. For example, you might have three S3 buckets with object replication across three AWS Regions. Your application code needs to be aware of how many copies of the bucket exist and where they are located, which bucket is the closest to the caller, and how to fall back to other buckets in case of issues. The complexity grows when you add new regions to your multi-region architecture and redeploy your stack in each region whenever a global configuration changes.

Today, I’m happy to announce the general availability of Amazon S3 Multi-Region Access Points, a new S3 feature that allows you to define global endpoints that span buckets in multiple AWS Regions. With S3 Multi-Region Access Points, you can build multi-region applications with the same simple architecture used in a single region.

S3 Multi-Region Access Points deliver built-in network resilience, building on top AWS Global Accelerator to route S3 requests over the AWS global network. This is especially important to minimize network congestion and overall latency, while maintaining a simple application architecture. AWS Global Accelerator constantly monitors for regional availability and can shift requests to another region within seconds. By dynamically routing your requests to the lowest latency copy of your data, S3 Multi-Region Access Points increase upload and download performance by up to 60%. This is great not just for server-side applications that rely on S3 for reading configuration files or application data, but also for edge applications that need a performant and reliable write-only endpoint, such as IoT devices or autonomous vehicles.

S3 Multi-Region Access Points in Action
To get started, you create an S3 Multi-Region Access Point in the S3 console, via API, or with AWS CloudFormation.

Let me show you how to create one using the S3 console. Each access point needs a name, unique at the account level.

After it’s created, you can access it through its alias, which is generated automatically and globally unique. The alias will look like a random string ending with .mrap – for example, mmqdt41e4bf6x.mrap. It can also be accessed over the internet via https://mmqdt41e4bf6x.mrap.s3-global.amazonaws.com, via VPC, or on-premises using AWS PrivateLink.

Then, you associate multiple buckets (new or existing) to the access point, one per Region. If you need data replication, you’ll need to enable bucket versioning too.

Finally, you configure the Block Public Access settings for the access point. By default, all public access is blocked, which works fine for most cases.

The creation process is asynchronous, you can view the creation status in the Console or by listing the S3 Multi-Region Access Points from the CLI. When it becomes Ready, you can configure optional settings for the access point policy and object replication.

Similar to regular access points, you can customize the access control policy to limit the use of the access point with respect to the bucket’s permission. Keep in mind that both the access point and the underlying buckets must permit a request. S3 Multi-Region Access Points cannot extend the permissions, just limit (or equal) them. You can also use IAM Access Analyzer to verify public and cross-account access for buckets that use S3 Multi-Region Access Points and preview access to your buckets before deploying permissions changes.

Your S3 Multi-Region Access Point access policy might look like this:

{
  "Version": "2012-10-17",
  "Statement": [
    {
      "Sid": "Default",
      "Effect": "Allow",
      "Principal": {
        "AWS": "YOUR_ACCOUNT_ID" 
      },
      "Action": ["s3:GetObject", "s3:PutObject"],
      "Resource": "arn:aws:s3::YOUR_ACCOUNT_ID:accesspoint/YOUR_ALIAS/object/*"
    }
   ]
}

To replicate data between buckets used with your S3 Multi-Region Access Point, you configure S3 Replication. In some cases, you might want to store different content in each bucket, or have a portion of a regional bucket for use with a global endpoint and other portions that aren’t replicated and used only with a regional access point or direct bucket access. For example, an IoT device configuration might include references to other regional API endpoints or regional resources that will be different for each bucket.

The new S3 console provides two basic templates that you can use to easily and centrally create replication rules:

  • Replicate objects from one or more source bucket to one or more destination buckets: This is ideal for ready-only use cases where data is always generated in a specific AWS Region and you want it to be available in all other Regions, too.
  • Replicate objects among all specified buckets: This is ideal for the IoT scenario I mentioned, where you’d define a write-only access point that devices use to upload data to the closest region, and you need this data to be available in all regions.

Of course, thanks to filters and conditions, you can create more sophisticated replication setups. For example, you might want to replicate only certain objects based on a prefix or tags.

Keep in mind that bucket versioning must be enabled for cross-region replication.

The console will take care of creating and configuring the replication rules and IAM roles. Note that to add or remove buckets, you would create a new the S3 Multi-Region Access Point with the revised list.

In addition to the replication rules, here is where you configure replication options such as Replication Time Control (RTC), replication metrics and notifications, and bidirectional sync. RTC allows you to replicate most new objects in seconds, and 99.99% of those objects within 15 minutes, for use cases where replication speed is important; replications metrics allow you to monitor how synchronized are your buckets in terms of object and byte count; bidirectional sync allows you to achieve an active-active configuration for put-heavy use cases in which object metadata needs to be replicated across buckets too.

After replication is configured, you get a very useful visual and interactive summary that allows you to verify which AWS Regions are enabled. You’ll see where they are on the map, the name of the regional buckets, and which replication rules are being applied.

After the S3 Multi-Region Access Point is defined and correctly configured, you can start interacting with it through the S3 API, AWS CLI, or the AWS SDKs. For example, this is how you’d write and read a new object using the CLI (don’t forget to upgrade to the latest CLI version):

# create a new object
aws s3api put-object --bucket arn:aws:s3::YOUR_ACCOUNT_ID:accesspoint/YOUR_ALIAS --key test.png --body test.png
# retrieve the same object
aws s3api get-object --bucket arn:aws:s3::YOUR_ACCOUNT_ID:accesspoint/YOUR_ALIAS --key test.png test.png

Last but not least, you can use bucket metrics in Amazon CloudWatch to keep track of how user requests are distributed across buckets in multiple AWS Regions.

CloudFormation Support at Launch
Today, you can start using two new CloudFormation resources to easily define an S3 Multi-Region Access Point: AWS::S3::MultiRegionAccessPoint and AWS::S3::MultiRegionAccessPointPolicy.

Here is an example:

Resources:
  MyS3MultiRegionAccessPoint:
    Type: AWS::S3::MultiRegionAccessPoint
    Properties:
      Regions:
        - Bucket: regional-bucket-ireland
        - Bucket: regional-bucket-australia
        - Bucket: regional-bucket-us-east
      PublicAccessBlockConfiguration:
        BlockPublicAcls: true
        IgnorePublicAcls: true
        BlockPublicPolicy: true
        RestrictPublicBuckets: true
  MyMultiRegionAccessPointPolicy:
    Type: AWS::S3::MultiRegionAccessPointPolicy
    Properties:
      MrapName: !Ref MyS3MultiRegionAccessPoint
      Policy:
        Version: 2012-10-17
        Statement:
          - Action: '*'
            Effect: Allow
            Resource: !Sub
              - 'arn:aws:s3::${AWS::AccountId}:accesspoint/${mrapalias}/object/*'
              - mrapalias: !GetAtt
                  - MyS3MultiRegionAccessPoint
                  - Alias
            Principal: {"AWS": !Ref "AWS::AccountId"}

The AWS::S3::MultiRegionAccessPoint resource depends only on the S3 bucket names. You don’t need to reference other regional stacks and you can easily centralize the S3 Multi-Region Access Point definition into its own stack. On the other hand, cross-region replication needs to be configured on each S3 bucket.

Cost considerations
When you use an S3 Multi-Region Access Point to route requests within the AWS global network, you pay a data routing cost of $0.0033 per GB processed, in addition to the standard charges for S3 requests, storage, data transfer, and replication. If your applications access the S3 Multi-Region Access Point over the internet, you’re also charged an internet acceleration cost per GB. This cost depends on the transfer type (upload or download) and whether the client and the bucket are in the same or different locations. For details, visit the S3 pricing page and select the data transfer tab.

Let me share a few practical examples:

  • All traffic within an AWS Region: In this simple case, your application runs in US East (N. Virginia) and you configure two S3 buckets in US East (N. Virginia) and US West (Oregon). The application uploads 100GB of data and the lowest latency bucket is in US East(N. Virginia). All the data is routed by your S3 Multi-Region Access Point in the same region and the total cost is $0.33.
  • All traffic across two AWS Regions: In this case, your application runs in US East (N. Virginia) and you configure two S3 buckets in US East (Ohio) and US West (Oregon). The application uploads 100GB of data and the lowest latency bucket is in US East (Ohio). All the data is routed by your S3 Multi-Region Access Point across two AWS Regions. The data routing cost for 100GB is the same of the previous example ($0.33), plus the S3 data transfer cost of $0.01 per GB, resulting in a total cost of $1.33.
  • All traffic over the internet across North America, Europe, and Asia Pacific (download and upload): In this case, your application runs on customer devices in North America, Europe, and Asia, and you configure two S3 buckets in US East (N. Virginia) and Europe (Ireland). One customer in North America uploads 50GB of data, which is routed to the bucket in US East (N. Virginia); a second customer in Europe downloads 50GB of data from the bucket in Europe (Ireland); a third customer in Asia downloads 50GB of data from the bucket in Europe (Ireland). The data routing cost for 150GB is $0.495. Plus the data transfer out from S3 to Europe of $0.09 per GB ($9), the internet acceleration cost from North America to the S3 bucket in US East (N. Virginia) of $0.0025 per GB ($0.125), the internet acceleration cost from the S3 bucket in Europe (Ireland) to Europe of $0.005 per GB ($0.25), and the internet acceleration cost from the S3 bucket in Europe (Ireland) to Asia of $0.05 per GB ($2.5). The total cost is $12.37. Please note that this example is intended to demonstrate how the internet acceleration cost works across continents. Also note that the internet acceleration cost to Asia might be reduced by an order of magnitude with an additional S3 bucket in Asia (see next example).
  • All the traffic over the internet across North America, Europe, and Asia Pacific (only upload): In this case, we consider the same conditions of the previous example. The only difference is that all customers only upload data and that you configure an additional bucket in Asia Pacific (Singapore). The data routing cost is the same ($0.495). Plus the internet acceleration cost from North America to the S3 bucket in US East (N. Virginia) of $0.0025 per GB ($0.125), the internet acceleration cost from Europe to the S3 bucket in Europe (Ireland) of $0.0025 per GB ($0.125), and the internet acceleration cost from Asia to the S3 bucket in Asia Pacific (Singapore) of $0.01 per GB ($0.5). The total cost is $1.24.

In other words, the routing cost is easy to estimate and doesn’t depend on the application type or data access pattern. The internet acceleration cost depends on the access pattern (downloads are more expensive than uploads) and on the client location with respect to the closest AWS Region. For global applications that upload or download data over the internet, you can minimize the internet acceleration cost by configuring at least one S3 bucket in each continent.

Available Today
Amazon S3 Multi-Region Access Points allow you to increase resiliency and accelerate application performance up to 60% when accessing data across multiple AWS Regions. We look forward to feedback about your use cases so that we can iterate quickly and simplify how you design and implement multi-region applications.

You can get started using the S3 API, CLI, SDKs, AWS CloudFormation or the S3 Console. This new functionality is available in 17 AWS Regions worldwide (see the full list of supported AWS Regions).

Learn More

Watch this video to hear more about S3 Multi-Region Access Points and see a short demo.

Check out the technical documentation for S3 Multi-Region Access Points.

Alex

Amazon CodeGuru Reviewer Updates: New Java Detectors and CI/CD Integration with GitHub Actions

Post Syndicated from Alex Casalboni original https://aws.amazon.com/blogs/aws/amazon_codeguru_reviewer_updates_new_java_detectors_and_cicd_integration_with_github_actions/

Amazon CodeGuru allows you to automate code reviews and improve code quality, and thanks to the new pricing model announced in April you can get started with a lower and fixed monthly rate based on the size of your repository (up to 90% less expensive). CodeGuru Reviewer helps you detect potential defects and bugs that are hard to find in your Java and Python applications, using the AWS Management Console, AWS SDKs, and AWS CLI.

Today, I’m happy to announce that CodeGuru Reviewer natively integrates with the tools that you use every day to package and deploy your code. This new CI/CD experience allows you to trigger code quality and security analysis as a step in your build process using GitHub Actions.

Although the CodeGuru Reviewer console still serves as an analysis hub for all your onboarded repositories, the new CI/CD experience allows you to integrate CodeGuru Reviewer more deeply with your favorite source code management and CI/CD tools.

And that’s not all! Today we’re also releasing 20 new security detectors for Java to help you identify even more issues related to security and AWS best practices.

A New CI/CD Experience for CodeGuru Reviewer
As a developer or development team, you push new code every day and want to identify security vulnerabilities early in the development cycle, ideally at every push. During a pull-request (PR) review, all the CodeGuru recommendations will appear as a comment, as if you had another pair of eyes on the PR. These comments include useful links to help you resolve the problem.

When you push new code or schedule a code review, recommendations will appear in the Security > Code scanning alerts tab on GitHub.

Let’s see how to integrate CodeGuru Reviewer with GitHub Actions.

First of all, create a .yml file in your repository under .github/workflows/ (or update an existing action). This file will contain all your actions’ step. Let’s go through the individual steps.

The first step is configuring your AWS credentials. You want to do this securely, without storing any credentials in your repository’s code, using the Configure AWS Credentials action. This action allows you to configure an IAM role that GitHub will use to interact with AWS services. This role will require a few permissions related to CodeGuru Reviewer and Amazon S3. You can attach the AmazonCodeGuruReviewerFullAccess managed policy to the action role, in addition to s3:GetObject, s3:PutObject and s3:ListBucket.

This first step will look as follows:

- name: Configure AWS Credentials
  uses: aws-actions/configure-aws-credentials@v1
  with:
    aws-access-key-id: ${{ secrets.AWS_ACCESS_KEY_ID }}
    aws-secret-access-key: ${{ secrets.AWS_SECRET_ACCESS_KEY }}
    aws-region: eu-west-1

These access key and secret key correspond to your IAM role and will be used to interact with CodeGuru Reviewer and Amazon S3.

Next, you add the CodeGuru Reviewer action and a final step to upload the results:

- name: Amazon CodeGuru Reviewer Scanner
  uses: aws-actions/codeguru-reviewer
  if: ${{ always() }} 
  with:
    build_path: target # build artifact(s) directory
    s3_bucket: 'codeguru-reviewer-myactions-bucket'  # S3 Bucket starting with "codeguru-reviewer-*"
- name: Upload review result
  if: ${{ always() }}
  uses: github/codeql-action/upload-sarif@v1
  with:
    sarif_file: codeguru-results.sarif.json

The CodeGuru Reviewer action requires two input parameters:

  • build_path: Where your build artifacts are in the repository.
  • s3_bucket: The name of an S3 bucket that you’ve created previously, used to upload the build artifacts and analysis results. It’s a customer-owned bucket so you have full control over access and permissions, in case you need to share its content with other systems.

Now, let’s put all the pieces together.

Your .yml file should look like this:

name: CodeGuru Reviewer GitHub Actions Integration
on: [pull_request, push, schedule]
jobs:
  CodeGuru-Reviewer-Actions:
    runs-on: ubuntu-latest
    steps:
      - name: Configure AWS Credentials
        uses: aws-actions/configure-aws-credentials@v1
        with:
          aws-access-key-id: ${{ secrets.AWS_ACCESS_KEY_ID }}
          aws-secret-access-key: ${{ secrets.AWS_SECRET_ACCESS_KEY }}
          aws-region: us-east-2
	  - name: Amazon CodeGuru Reviewer Scanner
        uses: aws-actions/codeguru-reviewer
        if: ${{ always() }} 
        with:
          build_path: target # build artifact(s) directory
          s3_bucket: 'codeguru-reviewer-myactions-bucket'  # S3 Bucket starting with "codeguru-reviewer-*"
      - name: Upload review result
        if: ${{ always() }}
        uses: github/codeql-action/upload-sarif@v1
        with:
          sarif_file: codeguru-results.sarif.json

It’s important to remember that the S3 bucket name needs to start with codeguru_reviewer- and that these actions can be configured to run with the pull_request, push, or schedule triggers (check out the GitHub Actions documentation for the full list of events that trigger workflows). Also keep in mind that there are minor differences in how you configure GitHub-hosted runners and self-hosted runners, mainly in the credentials configuration step. For example, if you run your GitHub Actions in a self-hosted runner that already has access to AWS credentials, such as an EC2 instance, then you don’t need to provide any credentials to this action (check out the full documentation for self-hosted runners).

Now when you push a change or open a PR CodeGuru Reviewer will comment on your code changes with a few recommendations.

Or you can schedule a daily or weekly repository scan and check out the recommendations in the Security > Code scanning alerts tab.

New Security Detectors for Java
In December last year, we launched the Java Security Detectors for CodeGuru Reviewer to help you find and remediate potential security issues in your Java applications. These detectors are built with machine learning and automated reasoning techniques, trained on over 100,000 Amazon and open-source code repositories, and based on the decades of expertise of the AWS Application Security (AppSec) team.

For example, some of these detectors will look at potential leaks of sensitive information or credentials through excessively verbose logging, exception handling, and storing passwords in plaintext in memory. The security detectors also help you identify several web application vulnerabilities such as command injection, weak cryptography, weak hashing, LDAP injection, path traversal, secure cookie flag, SQL injection, XPATH injection, and XSS (cross-site scripting).

The new security detectors for Java can identify security issues with the Java Servlet APIs and web frameworks such as Spring. Some of the new detectors will also help you with security best practices for AWS APIs when using services such as Amazon S3, IAM, and AWS Lambda, as well as libraries and utilities such as Apache ActiveMQ, LDAP servers, SAML parsers, and password encoders.

Available Today at No Additional Cost
The new CI/CD integration and security detectors for Java are available today at no additional cost, excluding the storage on S3 which can be estimated based on size of your build artifacts and the frequency of code reviews. Check out the CodeGuru Reviewer Action in the GitHub Marketplace and the Amazon CodeGuru pricing page to find pricing examples based on the new pricing model we launched last month.

We’re looking forward to hearing your feedback, launching more detectors to help you identify potential issues, and integrating with even more CI/CD tools in the future.

You can learn more about the CI/CD experience and configuration in the technical documentation.

Alex

Preview: Amazon Lookout for Metrics, an Anomaly Detection Service for Monitoring the Health of Your Business

Post Syndicated from Alex Casalboni original https://aws.amazon.com/blogs/aws/preview-amazon-lookout-for-metrics-anomaly-detection-service-monitoring-health-business/

We are excited to announce Amazon Lookout for Metrics, a new service that uses machine learning (ML) to detect anomalies in your metrics, helping you proactively monitor the health of your business, diagnose issues, and find opportunities quickly – with no ML experience required.

Lookout for Metrics uses the same technology used by Amazon to detect anomalous changes in data that are otherwise hard to find, while reducing the number of false detections. It also groups similar findings together, ranks them by severity, and provides information to determine the root cause of the anomalies.

It can be used across a wide variety of metrics such as revenue, web page views, daily active users, churn rate, transaction volume, mobile app installations, and more. Lookout for Metrics is now available in preview today.

Why Use Amazon Lookout for Metrics for Anomaly Detection?
Organizations across all industries are looking to improve efficiency in their business through technology and automation. While challenges may vary, what’s common is that being able to identify defects and opportunities early and often can lead to material cost savings, higher margins, and better customer experience. Traditionally, organizations rely on manual audits of large amounts of data, which is not scalable and is prone to human error. Others use rule-based methods based on arbitrary ranges, which are often static, do not easily adapt to seasonality changes, and lead to too many false detections.

When anomalies are detected, developers, analysts, and business owners can spend weeks trying to identify the root cause of the change. These are situations where ML can be an effective and transformational tool. However, ML algorithms need to be carefully selected, trained, tested, and deployed for each type of data – requiring a skilled team of ML experts.

Amazon has a long history of being a data-driven company, with a growing number of businesses that need to stay on top of the health of their business, operations, and customer experience. A key part of this effort over the years has involved building and improving ML technology to detect anomalies in key performance indicators (KPI) such as website visits from different traffic channels, number of products added to the shopping cart, number of orders placed, revenue for every product category, and more.

Amazon Lookout for Metrics puts the same ML technology used by Amazon in the hands of every developer. It finds anomalies in your data, groups them intelligently, helps you visualize aggregated results, and automates alerts.

Because it’s a fully managed service, it takes care of the whole ML process so you can get started quickly and focus on your core business. And most importantly, the service improves model performance continually by incorporating your real-time feedback on the accuracy and relevance of the anomalies and root cause analysis.

How Amazon Lookout for Metrics Works
You can get started with Lookout for Metrics with just a few clicks in the AWS Management Console. Without having to write any code, you connect your data to the service through the built-in data source integrations; next Lookout for Metrics trains a custom model for your data; and finally, it begins detecting anomalies for you to review and start taking action on.

Lookout for Metrics continuously monitors data stored in Amazon Simple Storage Service (S3), Amazon Relational Database Service (RDS), Amazon Redshift, Amazon CloudWatch, or SaaS integrations supported by Amazon AppFlow such as Salesforce, Marketo, Google Analytics, Slack, Zendesk, and many more.

During this phase, you can flag each field in your dataset as a measure (or KPI), dimension, or timestamp. For example, if you want to monitor abnormal changes in page views for every device type separately, then you would select page_views as the measure and device_type as the dimension.

Once your data source is configured and connected, Lookout for Metrics inspects and prepares the data for analysis and selects the right algorithm to build the most accurate anomaly detection model. This detector runs on your data at a configurable cadence (every few minutes, hourly, daily, and so on) and provides a threshold dial that allows you to adjust its sensitivity.

When detecting an anomaly, Lookout for Metrics helps you focus on what matters the most by assigning a severity score to aid prioritization. To help you find the root cause, it intelligently groups anomalies that may be related to the same incident and summarizes the different sources of impact (as shown below).

Moreover, you can configure an automatic action such as sending a notification via Amazon Simple Notification Service (SNS), Datadog, PagerDuty, Webhooks, or Slack. Or you can trigger a Lambda function, for example to temporarily hide a product on your e-commerce site when a potential pricing error is detected.

Domain knowledge and expertise can often play an important role in determining if a sudden change in a metric is expected or is an anomaly. Lookout for Metrics allows you to provide real-time feedback on the relevance of the detected anomalies, enabling a powerful human-in-the-loop mechanism. This information is fed back to the anomaly detection model to improve its accuracy.

Who’s Using Amazon Lookout for Metrics Today?
Digitata Networks offers intelligent customer, network and site-centric solutions that assist Mobile Network Operators to monitor, audit, control and automate different aspects of their network. Company CTO Nico Kruger has been pleased with the results he’s seen so far from using Lookout for Metrics.

“We discovered the improved accuracy and insights that Lookout for Metrics can bring to our existing solution and we are thrilled to use the service…we can quickly identify opportunities in addition to finding issues,” he said.

Playrix, one of the leading mobile game developers in the world, known for high-quality games such as Township, Fishdom, and Gardenscapes, is another customer that’s been working with the new service. “We experimented with our user acquisition data to understand how the service works and it quickly identified and grouped anomalies enabling us to work faster and better,” said Mikhail Artyugin, Playrix technical director.

“Lookout for Metrics has saved our team many hours of manual investigation and now notifications are viewed as actionable rather than noise, allowing our teams to easily focus on strategic priorities with less technical overhead,” he added.

“Working with almost a billion impressions every day to capture insights and intent for our customers, we need quick feedback on real data anomalies,” said Brian Ecker, a senior staff engineer at NextRoll, a marketing and data technology company with the mission to provide innovative solutions to companies to keep them growing.

“After working with the Lookout for Metrics team, we saw the improved accuracy that the new service can bring to our existing anomaly detection process and we are thrilled to start using it.”

It’s also worth noting that APN partners such as TensorIoT, Quantiphi, and Provectus have expertise in Lookout for Metrics and can help customers leverage its functionalities.

Available in Preview
Amazon Lookout for Metrics is now available in preview in US East (N. Virginia), US East (Ohio), US West (Oregon), Asia Pacific (Tokyo), and Europe (Ireland).

You can interact with the service using the AWS Management Console, the AWS SDKs and the CLI . Find out more on the technical documentation and get started quickly by joining the preview at the following link.

Request preview access to Amazon Lookout for Metrics here.

Alex

Preview: AWS Proton – Automated Management for Container and Serverless Deployments

Post Syndicated from Alex Casalboni original https://aws.amazon.com/blogs/aws/preview-aws-proton-automated-management-for-container-and-serverless-deployments/

Today, we are excited to announce the public preview of AWS Proton, a new service that helps you automate and manage infrastructure provisioning and code deployments for serverless and container-based applications.

Maintaining hundreds – or sometimes thousands – of microservices with constantly changing infrastructure resources and configurations is a challenging task for even the most capable teams.

AWS Proton enables infrastructure teams to define standard templates centrally and make them available for developers in their organization. This allows infrastructure teams to manage and update infrastructure without impacting developer productivity.

How AWS Proton Works
The process of defining a service template involves the definition of cloud resources, continuous integration and continuous delivery (CI/CD) pipelines, and observability tools. AWS Proton will integrate with commonly used CI/CD pipelines and observability tools such as CodePipeline and CloudWatch. It also provides curated templates that follow AWS best practices for common use cases such as web services running on AWS Fargate or stream processing apps built on AWS Lambda.

Infrastructure teams can visualize and manage the list of service templates in the AWS Management Console.

This is what the list of templates looks like.

AWS Proton also collects information about the deployment status of the application such as the last date it was successfully deployed. When a template changes, AWS Proton identifies all the existing applications using the old version and allows infrastructure teams to upgrade them to the most recent definition, while monitoring application health during the upgrade so it can be rolled-back in case of issues.

This is what a service template looks like, with its versions and running instances.

Once service templates have been defined, developers can select and deploy services in a self-service fashion. AWS Proton will take care of provisioning cloud resources, deploying the code, and health monitoring, while providing visibility into the status of all the deployed applications and their pipelines.

This way, developers can focus on building and shipping application code for serverless and container-based applications without having to learn, configure, and maintain the underlying resources.

This is what the list of deployed services looks like.

Available in Preview
AWS Proton is now available in preview in US East (N. Virginia), US East (Ohio), US West (Oregon), Asia Pacific (Tokyo), and Europe (Ireland); it’s free of charge, as you only pay for the underlying services and resources. Check out the technical documentation.

You can get started using the AWS Management Console here.

Alex

New – Export Amazon DynamoDB Table Data to Your Data Lake in Amazon S3, No Code Writing Required

Post Syndicated from Alex Casalboni original https://aws.amazon.com/blogs/aws/new-export-amazon-dynamodb-table-data-to-data-lake-amazon-s3/

Hundreds of thousands of AWS customers have chosen Amazon DynamoDB for mission-critical workloads since its launch in 2012. DynamoDB is a nonrelational managed database that allows you to store a virtually infinite amount of data and retrieve it with single-digit-millisecond performance at any scale. To get the most value out of this data, customers had […]

In the Works – New AWS Region in Zurich, Switzerland

Post Syndicated from Alex Casalboni original https://aws.amazon.com/blogs/aws/in-the-works-new-aws-region-in-zurich-switzerland/

Earlier this year, we launched the new AWS Region in Italy and have plans for three more AWS Regions in Indonesia, Japan, and Spain. Coming to Switzerland in 2022 Today, I’m happy to announce that the AWS Europe (Zurich) Region is in the works. It will open in the second half of 2022 with three […]