In June, we experienced two incidents that resulted in degraded performance across GitHub services.
June 7 16:11 UTC (lasting 2 hours 28 minutes)
On June 7 at 16:11 UTC, GitHub started experiencing increasing delays in an internal job queue used to process Git pushes. Our monitoring systems alerted our first responders after 19 minutes. During this incident, customers experienced GitHub Actions workflow run and webhook delays as long as 55 minutes, and pull requests did not accurately reflect new commits.
We immediately began investigating and found that the delays were caused by a customer making a large number of pushes to a repository with a specific data shape. The jobs processing these pushes became throttled when communicating with the Git backend, leading to increased job execution times. These slow jobs exhausted a worker pool, starving the processing of pushes for other repositories. Once the source was identified and temporarily disabled, the system gradually recovered as the backlog of jobs was completed. To prevent a recurrence, we updated the Git backend’s throttling behavior to fail faster and reduced the Git client timeout within the job to prevent it from hanging. We have additional repair items in place to reduce the times to detect, diagnose, and recover.
June 29 14:50 UTC (lasting 32 minutes)
On June 29, starting from 17:39 UTC, GitHub was down in parts of North America, particularly the US East coast and South America, for approximately 32 minutes.
GitHub takes measures to ensure that we have redundancy in our system for various disaster scenarios. We have been working on building redundancy to an earlier single point of failure in our network architecture at a second Internet edge facility. This facility was completed in January and has been actively routing production traffic since then in a high availability (HA) architecture alongside the first edge facility. As part of the facility validation steps, we performed a live failover test in order to verify that we could use this second Internet edge facility if the primary were to fail. Unfortunately, during this failover test we inadvertently caused a production outage.
The test exposed a network path configuration issue in the secondary side that prevented it from properly functioning as a primary, which resulted in the outage. This has since been fixed. We were immediately notified of the issue and within two minutes of being alerted we reverted the change and brought the primary facility back online. Once online it took time for traffic to be rebalanced and for our border routers to reconverge restoring public connectivity to GitHub systems.
This failover test helped expose the configuration issue, and we are addressing the gaps in both configuration and our failover testing, which will help make GitHub more resilient. We recognize the severity of this outage and the importance of keeping GitHub available. Moving forward, we will continue our commitment to high availability, improving these tests and scheduling them in a way where potential customer impact is minimized as much as possible.
Please follow our status page for real-time updates on status changes. To learn more about what we’re working on, check out the GitHub Engineering Blog.
Customers who build smart home devices using the Matter protocol from the Connectivity Standards Alliance (CSA) need to create and maintain digital certificates, called device attestation certificates (DACs), to allow their devices to interoperate with devices from other vendors. DACs must be issued by a Matter device attestation certificate authority (CA). The CSA mandates multi-party approval for creating Matter compliant CAs. You can use AWS Private CA to create your Matter device attestation CA, which will store two important certificates: the product attestation authority (PAA) and product attestation intermediate (PAI) certificate. The PAA is the root CA that signs the PAI; the PAI is the intermediate CA that issues DACs. In this blog post, we will show how to implement multi-party approval for creation of these two certificates within AWS Private CA.
The CSA allows the use of delegated service providers (DSP) to provide you with public key infrastructure (PKI) services to create your Matter device attestation CA. You can use AWS Private CA as a DSP to create a Matter device attestation CA to issue DACs.
You should carefully plan to implement and demonstrate compliance with the Matter PKI Certificate Policy (CP) requirements when you issue Matter certificates by using the CA infrastructure services provided by AWS Private CA. Matter PKI CP is not just a technical standard; it also covers people, processes, and technology. For information about the requirements to comply with the Matter PKI CP and a reference list of acronyms, see the Matter PKI Compliance Guide. In this blog post, we address one of the Matter requirements for technical security controls for implementing multi-party approval for the creation of PAA and PAI certificates
Note: The solution presented in this post uses AWS Systems Manager Change Manager, a capability of AWS Systems Manager, for demonstrating multi-party approval as required by the Matter CP for the creation of the PAA and PAI. Additionally, the solution also uses AWS Systems Manager documents (SSM documents), which contain the code to automate the creation of PAA and PAI DAC certificates.
Implementing multi-party approval: Personas and IAM roles
For the process of achieving the multi-party approval required for Matter compliance, we will use the following human personas:
Jane Doe and Paulo Santos as the two approvers responsible for signing off on the creation of PAA and PAI.
Shirley Rodriguez as the persona responsible for setting up the prerequisite infrastructure and creating the change template that governs the multi-party approval process and specifying the human personas who are authorized to approve change requests.
Richard Roe as the persona responsible for reviewing and approving change template changes made by Shirley Rodriguez, to verify the separation of duties.
AWS offers support for identity federation to enable federated single sign-on (SSO). This allows users to sign into the AWS Management Console or call AWS API operations by using the credentials of an IAM role. To establish a secure authentication and authorization model, we highly recommend that you map the identities of the human personas to IAM roles.
TmpltReview-Role — Richard Roe will assume this role to review and approve changes to the change template that is used to run the SSM document to create the matter CAs.
CreatePAA-Role and CreatePAI-Role — Clone the solution GitHub repository and create the roles by using the policies from the repository:
CreatePAA-Role — This role is assumed by the AWS Systems Manager service to create the PAA.
CreatePAI-Role — This role is assumed by the AWS Systems Manager service to create the PAI.
MatterCA-Admin-1 and MatterCA-Admin-2 — Jane Doe will use the MatterCA-Admin-1 role, while Paulo Santos will use the MatterCA-Admin-2 role. These individuals will serve as the two approvers for the multi-party approval process.
Note: It’s important that one person cannot approve an action by themselves. If a person is allowed to assume the MatterCA-Admin-1 role, they must not be allowed to assume the MatterCA-Admin-2 role also. If the same person can assume both roles, then that person can bypass the requirement for two different people to approve.
To create the IAM roles
Create IAM rolesMatterCA-Admin-1 and MatterCA-Admin-2, and attach the following AWS-managed policies:
You should configure the trust relationship to allow Jane Doe to use the Matter-CA-Admin-1-Role and Paulo Santos to use the Matter-CA-Admin-2-Role for the multi-party approval process. This is intended to restrict Jane Doe and Paulo Santos from assuming each other’s roles. Use the following policy as a guide, and make sure to replace <AccountNumber> and <Role_Name> with your own information, depending on the federated identity models that you have chosen.
Modify the trust relationship to allow only Richard Roe to use the role, as shown in the following policy. Make sure to replace <AccountNumber> and <Role-Name> with your own information.
Preventive security controls recommended for this solution
We recommend that you apply the following security controls for this solution:
Dedicate an AWS account to this solution – It is important that the only users who can perform actions on the PAA and PAI are the users in this account. By deploying these items in a dedicated AWS account, you limit the number of users who might have elevated privileges, but don’t have cause to use those privileges here.
SCPs (service control policies) – The IAM policies in this solution do not prevent someone with privileges, such as an administrator, from bypassing your expected controls and approving usage of the CA. SCPs, if they are applied by using AWS Organizations, can restrict the creation of CAs (certificate authorities) exclusively to CreatePAA-Role and CreatePAI-Role.
The following example SCP will enforce this type of restriction. Make sure to replace <AccountNumber> with your own information. With a strong SCP, even the root account will not be able to perform these operations or change these security controls.
Shirley Rodriguez will download the following sample Systems Manager (SSM) documents from our GitHub repository and perform the listed steps in this section.
In the left navigation pane, under Shared Resources, choose Documents.
Choose the Owned by me tab, choose Create document, and from the dropdown list, choose Automation.
Figure 1: Create the automation document
Under Create automation, choose the Editor tab, and then choose Edit.
Figure 2: Automation document editor
Copy the sample automation code from the file CreatePAA.yaml that you downloaded from the GitHub repository, and paste it into the editor.
For Name, enter CreatePAA, and then choose Create automation.
To check that the CreatePAA document was created successfully, choose the Owned by me tab. You should see the Systems Manager document, as shown in Figure 3.
Figure 3: Successful creation of the CreatePAA document
Repeat the preceding steps for creating the PAI. Make sure that you paste the code from the file CreatePAI.yaml into the editor and enter the name CreatePAI to create the PAI CA.
To check that the CreatePAI document was created successfully, choose the Owned by me tab. You should see the CreatePAI Systems Manager document, as shown in Figure 4.
Figure 4: Successful creation of the PAA and PAI documents
You’ve now completed the creation of an SSM document that contains the automation code to create certificate authorities PAA and PAI. The next step is to create Change Manager templates, which will use the SSM document and apply multi-party approval before the creation of the PAA and PAI.
Create the Change Manager templates
Shirley Rodriguez will next create two change templates that run the SSM documents: one for the PAA and one for the PAI.
In the left navigation pane, under Change Management, choose Change Manager.
On the Change Manager page, in the top right, choose Create template.
For Name, enter CreatePAATemplate.
In the Builder section, add a description (optional), and for Runbook, search and select CreatePAA. Keep the defaults for the other selections.
Figure 5: Select the runbook CreatePAA in the change template
Scroll down to the Change request approvals section and choose Add approval level. This is where you configure multi-party approval for the change template.
Because there are two approvers, for Number of approvers required at this level, choose 1 from the dropdown.
Choose Add approver, choose Template specified approvers, and then select the MatterCA-Admin-1. Then choose Add another approval level for the second approver.
Figure 6: Add first level approver for the template
Choose Template specified approvers, and then select the MatterCA-Admin-2 role for multi-party approval. These roles can now approve the change request.
Figure 7: Add second level approver for the template.
Keep the defaults for the rest of the options, and at the bottom of the screen, choose Save and preview.
On the preview screen, review the configurations, and then on the top right, choose Submit for review. This pushes the template to be reviewed by template reviewer Richard Roe. In the Templates tab, the template status shows as Pending review.
Figure 8: Template with a status of pending review
Repeat the preceding steps to create the PAI change template. Make sure to name it CreatePAITemplate, and at step 5, for Runbook, select the CreatePAI document.
Figure 9: Both templates ready for review
You’ve successfully created two change templates, CreatePAATemplate and CreatePAITemplate, that generate a change request that contains an SSM document with automation code for building the PAA and PAI. These change requests are configured with multi-party approval before running the SSM document. However, before you can proceed with running the change template, it must undergo review and approval by the template reviewer Richard Roe.
Review and approve the Change Manager templates
First you need to make sure that TmpltReview-Role is added as a reviewer and approver of change templates. Shirley Rodriguez will follow the steps in this section to add TmpltReview-Role as change template reviewer.
To add the change template reviewer
Follow the instructions in the Systems Manager documentation to configure the IAM role TmpltReview-Role to review and approve the change template. Figure 10 shows how this setup looks in the Systems Manager console.
Figure 10: The template reviewer role in Settings
Now you have TmpltReview-Role added as a reviewer. Change templates that are created or modified will now need to be reviewed and approved by this role. Richard Roe will use the role TmpltReview-Role for governance of change templates, to make sure changes made by Shirley Rodriguez are in alignment with the organization’s compliance needs for Matter.
Richard Roe will follow the steps in the Systems Manager documentation for reviewing and approving change templates, to approve CreatePAATemplate and CreatePAITemplate. After the change template is approved, its status changes to Approved, and it’s ready to be run.
Figure 11: Change template approval details
You now have the change templates CreatePAATemplate and CreatePAITemplate in approved status.
Create the PAA and PAI with multi-party approval for Matter compliance
Up to this point, these instructions have described one-time configurations of AWS Systems Manager to set up the IAM roles, SSM documents, and change templates that are required to enforce multi-party approval. Now you are ready to use these change templates to create the PAA and PAI and perform multi-party approval.
Shirley Rodriguez will generate change requests that require approval from Jane Doe and Paulo Santos. This manual approval process will then run the SSM documents to create the PAA and PAI.
Create a change request for the PAA
Perform the following steps to create a change request for the PAA.
In the left navigation pane, choose Change Manager, and then choose Create request.
Search for and select CreatePAATemplate, and then choose Next.
For Name, enter the name CreatePAA_ChangeRequest.
(Optional) For Change request information, provide additional information about the change request.
For Workflow start time, choose Run the operation as soon as possible after approval to run the change immediately after the request is approved.
For Change request approvals, validate that the list of First-level approvals includes the change request approvers MatterCA-Admin-1 and MatterCA-Admin-2, which you configured previously in the section Create Change Manager template. Then choose Next.
Figure 12: Change request approvers
For Automation assume role, select the IAM role CreatePAA_Role for creating the PAA.
Figure 13: Change request role
For Runbook parameters, enter the PAA certificate details for CommonName, Organization, VendorId, and ValidityInYears, and then choose Next.
Review the change request content and then, at the bottom of the screen, choose Submit for approval. Optionally, you can set up an SNS topic to notify the approvers.
You have successfully created a change request that is currently awaiting approval from Jane Doe and Paulo Santos. Let’s now move on to the approval steps.
Multi-party approval: Approve the change request for the PAA
Each of the approvers should now follow the steps in this section for approval. Jane Doe will use the IAM role MatterCA-Admin-1, while Paulo Santos will need to use the IAM role MatterCA-Admin-2.
Choose the Approvals tab, select the CreatePAA change request, and then choose Approve.
Figure 14: Change request approval
After Jane Doe and Paulo Santos each follow these steps to approve the change request, the change request will run and will complete with status “Success,” and the PAA will be created in AWS Private CA.
Check that the status of the change request is Success, as shown in Figure 15.
Figure 15: The change request ran successfully
Validate that the PAA is created in AWS Private CA
Next, you need to validate that the PAA was created successfully and copy its Amazon Resource Name (ARN) to use for PAI creation.
To validate the creation of the PAA and retrieve its ARN
In the AWS Private CA console, choose the PAA CA that you created in the previous step.
Copy the ARN of the PAA root CA. You will use PAA CA ARN when you set up the PAI change request.
Figure 16: ARN of the PAA root CA PAA
After successfully completing these steps, you have created the certificate authority PAA by using AWS Private CA with multi-party approval. You can now proceed to the next section, where we will demonstrate how to use this PAA to issue a CA for PAI.
Create a change request for the PAI
Perform the following steps to create a change request for the PAI.
Note: Creation of a valid PAA is a prerequisite for creating the PAI in the following steps.
To create a change request for the PAI
After the PAA is created successfully, you can complete the creation of the PAI by repeating the same steps that you did in the Create a change request for the PAA section, but with the following changes:
At step 3, make sure that you search for and select CreatePAITemplate.
Figure 17: CreatePAITemplate template
At step 4, for Name, enter CreatePAI_ChangeRequest.
At step 8, for Automation assume role, select the IAM role CreatePAI_Role.
Figure 18: Change request IAM role selection
At step 9, for Runbook parameters, enter the PAA CA ARN that you made note of earlier, along with the CommonName, Organization, VendorId, ProductId, and ValidityInYears for the PAI, and then choose Next.
Multi-party approval: Approve the change request for the PAI
Each of the approvers should now follow the steps in this section for approval for the PAI. Jane Doe will need to use IAM role MatterCA-Admin-1, and Paulo Santos will need to use IAM role MatterCA-Admin-2.
Choose the Approvals tab, select the CreatePAI change request, and choose Approve.
After both approvers (Jane Doe and Paulo Santos) approve the change request, the change request will run, and the PAA will be created inside AWS Private CA.
Check that the status of the change request shows Success, as shown in Figure 19.
Figure 19: The change requests for the PAA and PAI have run successfully
In the AWS Private CA console, verify that the PAA and PAI have been created successfully, as shown in Figure 20.
Figure 20: PAA and PAI in AWS Private CA
After successfully completing these steps, you have created the certificate authority PAI by using AWS Private CA with multi-party approval. You can now issue DAC certificates by using this PAI. Next, we will show how to validate the logs to confirm multi-party approval.
Demonstrate compliance with multi-party approval requirements of the Matter CP by using the change manager timeline
To keep audit records that show that multi-party approval was used to create the PAA and PAI to issue DACs, you can use the Change Manager timeline.
In the left navigation pane, choose Change Manager.
Choose Requests, and then select either the CreatePAA_ChangeRequest or the CreatePAI_ChangeRequest change request.
Select the Timeline tab. Figure 21 shows an example of a timeline with complete runbook steps for PAA creation. It also shows the two approvers, Jane Doe and Paulo Santos, approving the change request. You can use this information to demonstrate multi-party approval.
Figure 21: Audit trail for approval and creation of the PAA
Likewise, Figure 22 shows an example of a timeline with complete runbook steps for creating the PAI by using multi-party approval.
Figure 22: Audit trail for approval and creation of the PAI
Conclusion
In this post, you learned how to use AWS Private CA to facilitate the creation of Matter CAs in compliance with the Matter PKI CP. By using AWS Systems Manager, you can effectively fulfill the technical security control outlined in the Matter PKI CP for implementing multi-party approval for the creation of PAA and PAI certificates.
In this blog post, we focus on two recently released features of AWS Security Hub: the consolidated controls view and consolidated control findings. You can use these features to manage controls across standards and to consolidate findings, which can help you significantly reduce finding noise and administrative overhead.
Security Hub is a cloud security posture management service that you can use to apply security best practice controls, such as “EC2 instances should not have a public IP address.” With Security Hub, you can check that your environment is properly configured and that your existing configurations don’t pose a security risk. Security Hub has more than 200 controls that cover more than 30 AWS services, such as Amazon Elastic Compute Cloud (Amazon EC2), Amazon Simple Storage Service (Amazon S3), and AWS Lambda. In addition, Security Hub has integrations with more than 85 partner products. Security Hub can centralize findings across your AWS accounts and AWS Regions into a single delegated administrator account in your aggregation Region of choice, creating a single pane of glass to view findings. This can help you to triage, investigate, and respond to findings in a simpler way and improve your security posture.
The Security Hub controls are grouped into the following security standards:
With the new features — consolidated controls view and consolidated control findings—you can now do the following:
Enable or disable controls across standards in a single action. Previously, if you wanted to maintain the same enablement status of controls between standards, you had to take the same action across multiple standards (up to six times!).
If you choose to turn on consolidated control findings, you will receive only a single finding for a security check, even if the security check is enabled across several standards. This reduces the number of findings and helps you focus on the most important misconfigured resources in your AWS environment. It allows you to apply actions and updates (such as suppressing the finding or changing its severity) one time rather than having to do so multiple times across non-consolidated findings.
Overview of new features
Now we’ll discuss some of the details of how you can use the two new features to streamline the management of controls.
The new consolidated controls view
On the new Controls page, now available in the Security Hub console as shown in Figure 1, you can view and configure security controls across standards from one central location.
Figure 1: Security Hub Controls page
Before this release, controls had to be managed within the context of individual security standards. Even if the same control was part of multiple standards, the control had different IDs in each of them. With this recent release, Security Hub now assigns controls a unique security control ID across standards, so that it’s simpler for you to reference the controls and view their findings. Following the current naming convention of the AWS FSBP standard, the consolidated control IDs start with the relevant service in scope for the control. In fact, whenever possible, the new consolidated control ID is the same as the previous FSBP control ID.
For example, before this release, control IAM.6 in FSBP was also referenced as 1.14 in CIS 1.2, and 1.6 in CIS 1.4, PCI.IAM.4, and CT.IAM.6. After the release, the control is now referenced as IAM.6 in the Security Hub standards. This change does not affect the pre-existing API calls for Security Hub, such as UpdateStandardsControl, where you can still provide the previous StandardControlARN in order to make the call.
By using the new Controls view, you can understand the status of controls across your system, view control findings, and prioritize next steps without context switching. The following information is available on the Controls page of the Security Hub console:
An overall security score, which is based on the proportion of passed controls to the total number of enabled controls.
A breakdown of security checks across controls, with the percentage of failed security checks highlighted. Because many controls can contain multiple security checks and multiple findings, this value might be different from the security score, which considers controls as a single object. You can use this metric, as well as your security score, to monitor your progress as you work to remediate findings.
A list of controls that are categorized into different tabs based on enablement and compliance status. If you are an administrator of an organization within Security Hub, the enablement and compliance status will reflect the aggregate status of the entire organization. In your finding aggregation Region, the status will also be aggregated across linked Regions.
From the controls page, you can select a control to view its details (including its title and the standards it belongs to), and view and act on the findings generated by the control.
Security Hub also offers new API operations that match the capabilities of the controls page. Unlike the pre-existing API operations, these new API operations use the consolidated control IDs (also known as security control IDs) to provide a way to know and manage the relationship between controls and standards. You can use these API operations to manage each Security Hub control across standards, to make sure that the status of controls in the standards is aligned. The new API operations include the following:
BatchGetSecurityControls — Given a list of security control IDs, returns the full definition of those controls.
BatchGetStandardsControlAssociations — Given a list of security control IDs and standards, returns whether each control is turned on in the relevant standard or not.
We also provide an example script that makes use of these API calls and applies them across accounts and Regions so that your configuration is consistent. You can use our script to enable or disable Security Hub controls across your various accounts or Regions.
Consolidating control findings between standards
Before we released the consolidated control findings feature, Security Hub generated separate findings per standard for each related control. Now, you can turn on consolidated control findings, and after doing so, Security Hub will produce a single finding per security check, even when the underlying control is shared across multiple standards. Having a single finding per check across standards will help you investigate, update, and remediate failed findings more quickly, while also reducing finding noise.
As an example, we can look at control CloudTrail.2, which is shared between standards supported by Security Hub. Before you turn on this capability, you might potentially receive up to six findings for each security check generated by this control—with one finding for each security standard. After you turn on consolidated control findings, these older findings will be archived and Security Hub will generate one finding per security check in this control, regardless of how many security standards you have enabled. For an example of how the standard-specific findings compare to the new consolidated finding, see Sample control findings. The following is an example of a consolidated finding for the CloudTrial.2 control; we’ve highlighted the part that shows this finding is shared across standards.
{
"SchemaVersion": "2018-10-08",
"Id": "arn:aws:securityhub:us-east-2:123456789012:security-control/CloudTrail.2/finding/a1b2c3d4-5678-90ab-cdef-EXAMPLE11111",
"ProductArn": "arn:aws:securityhub:us-east-2::product/aws/securityhub",
"ProductName": "Security Hub",
"CompanyName": "AWS",
"Region": "us-east-2",
"GeneratorId": "security-control/CloudTrail.2",
"AwsAccountId": "123456789012",
"Types": [
"Software and Configuration Checks/Industry and Regulatory Standards"
],
"FirstObservedAt": "2022-10-06T02:18:23.076Z",
"LastObservedAt": "2022-10-28T16:10:06.956Z",
"CreatedAt": "2022-10-06T02:18:23.076Z",
"UpdatedAt": "2022-10-28T16:10:00.093Z",
"Severity": {
"Label": "MEDIUM",
"Normalized": "40",
"Original": "MEDIUM"
},
"Title": "CloudTrail should have encryption at-rest enabled",
"Description": "This AWS control checks whether AWS CloudTrail is configured to use the server-side encryption (SSE) AWS Key Management Service (AWS KMS) customer master key (CMK) encryption. The check will pass if the KmsKeyId is defined.",
"Remediation": {
"Recommendation": {
"Text": "For directions on how to correct this issue, consult the AWS Security Hub controls documentation.",
"Url": "https://docs.aws.amazon.com/console/securityhub/CloudTrail.2/remediation"
}
},
"ProductFields": {
"RelatedAWSResources:0/name": "securityhub-cloud-trail-encryption-enabled-fe95bf3f",
"RelatedAWSResources:0/type": "AWS::Config::ConfigRule",
"aws/securityhub/ProductName": "Security Hub",
"aws/securityhub/CompanyName": "AWS",
"Resources:0/Id": "arn:aws:cloudtrail:us-east-2:123456789012:trail/AWSMacieTrail-DO-NOT-EDIT",
"aws/securityhub/FindingId": "arn:aws:securityhub:us-east-2::product/aws/securityhub/arn:aws:securityhub:us-east-2:123456789012:security-control/CloudTrail.2/finding/a1b2c3d4-5678-90ab-cdef-EXAMPLE11111"
}
"Resources": [
{
"Type": "AwsCloudTrailTrail",
"Id": "arn:aws:cloudtrail:us-east-2:123456789012:trail/AWSMacieTrail-DO-NOT-EDIT",
"Partition": "aws",
"Region": "us-east-2"
}
],
"Compliance": {
"Status": "FAILED",
"RelatedRequirements": [
"PCI DSS v3.2.1/3.4",
"CIS AWS Foundations Benchmark v1.2.0/2.7",
"CIS AWS Foundations Benchmark v1.4.0/3.7"
],
"SecurityControlId": "CloudTrail.2","AssociatedStandards": [ { "StandardsId": "standards/aws-foundational-security-best-practices/v/1.0.0"}, { "StandardsId": "standards/pci-dss/v/3.2.1"}, { "StandardsId": "ruleset/cis-aws-foundations-benchmark/v/1.2.0"}, { "StandardsId": "standards/cis-aws-foundations-benchmark/v/1.4.0"}, { "StandardsId": "standards/service-managed-aws-control-tower/v/1.0.0"}, ]},
"WorkflowState": "NEW",
"Workflow": {
"Status": "NEW"
},
"RecordState": "ACTIVE",
"FindingProviderFields": {
"Severity": {
"Label": "MEDIUM",
"Normalized": "40",
"Original": "MEDIUM"
},
"Types": [
"Software and Configuration Checks/Industry and Regulatory Standards"
]
}
}
In the left navigation pane, choose Settings, and then choose the General tab.
Under Controls, turn on Consolidated control findings, and then choose Save.
Figure 2: Turn on consolidated control findings
If you are using the Security Hub integration with AWS Organizations or have invited member accounts through a manual invitation process, consolidated control findings can only be turned on by the administrator account. When this action is taken in the administrator account, the action will also be reflected in each member account in the current Region. It can take up to 18 hours for Security Hub to archive existing standard-specific findings and generate the new, standard-agnostic, findings.
You can also enable consolidated control findings by using the API (calling the UpdateSecurityHubConfiguration API with the ControlFindingGenerator parameter equal to SECURITY_CONTROL), or by using the AWS CLI (running the update-security-hub-configuration command with control-finding-generator equal to SECURITY_CONTROL), as in the following example.
aws securityhub ‐‐region <Region of choice> update-security-hub-configuration ‐‐control-finding-generator SECURITY_CONTROL
Much like the console behavior, if you have an organizational setup in Security Hub, this API action can only be taken by the administrator, and it will be reflected in each member account in the same Region.
What to expect when you enable consolidated control findings
To allow for these new capabilities to be launched, changes to the AWS Security Finding Format (ASFF) are required. This format is used by Security Hub for findings it generates from its controls or ingests from external providers. When you turn on finding consolidation, Security Hub will archive old standard-specific findings and generate standard-agnostic findings instead. This action will only affect control findings that Security Hub generates, and it will not affect findings ingested from partner products. However, in Security Hub findings, turning on consolidated control findings might cause some updates that you previously made to findings to be archived. Despite this one-time change, after the migration is complete (it can take up to 18 hours), you will be able to update finding fields in a single action and the updates will apply across standards, without the need to make multiple updates.
One field affected by the new capabilities is the Workflow field, which provides information about the status of the investigation into a finding. Manipulating this field can also update the overall compliance status of the control that the finding is related to. For example, if you have a control with one failed finding (and the rest have passed), and the failed finding comes from a resource for which you’d like to make an exception, you can decide to suppress that failed finding by updating the Workflow field. If you suppress failed findings in a control, its compliance status can change to pass.
Before turning on consolidated control findings, if you want to maintain an aligned compliance status in controls that belong to multiple standards, you have to update the Workflow status of findings in each standard. After turning on finding consolidation, you will only have to update the Workflow status once, and the suppression will be applied across standards, helping you to reduce the number of steps needed to suppress the same findings across standards.
As mentioned earlier, when you turn on this new capability, some updates made to the previous, standard-specific findings will be archived and will not be included in the new consolidated control findings generated by Security Hub. In the case of the Workflow status, the new consolidated findings will be created with a value of NEW (for failed findings) or RESOLVED (for new findings) in the Workflow field. However, after you have onboarded to the new finding format, you can update the value of the Workflow field, as well as other fields, and this value will be maintained without requiring you to make continuous updates. For the full list of fields that can be affected by the migration to the consolidated finding format, see Consolidated control findings – ASFF changes. Before you turn on finding consolidation, we suggest that you check if your custom automations refer to those affected fields. If they do, you can update your automations and test them by using the Sample control findings in the documentation.
Conclusion
This blog post covers new Security Hub features that make it simpler for you to manage controls across standards. With the new consolidated control findings feature, you can focus on the most relevant findings and reduce noise, which is why we recommend that you review the new feature and its associated changes and turn it on at your earliest convenience.
If you have feedback about this blog post, submit comments in the Comments section below. If you have questions about this blog post, start a new thread on the Security Hub forum or contact AWS Support.
Want more AWS Security news? Follow us on Twitter.
No surprise, but Google just changed its privacy policy to reflect broader uses of all the surveillance data it has captured over the years:
Research and development: Google uses information to improve our services and to develop new products, features and technologies that benefit our users and the public. For example, we use publicly available information to help train Google’s AI models and build products and features like Google Translate, Bard, and Cloud AI capabilities.
(I quote the privacy policy as of today. The Mastodon link quotes the privacy policy from ten days ago. So things are changing fast.)
In March 2023, IBM Consulting delivered an Innovation Hackathon in France, aimed at designing and building new innovative solutions for real customer use cases using the AWS Cloud.
In this post, we briefly explore six of the solutions considered and demonstrate the AWS architectures created and implemented during the Hackathon.
Hackathon solutions
Solution 1: Optimize digital channels monitoring and management for Marketing
Monitoring Marketing campaign impact can require a lot of effort, such as customers and competitors’ reactions on digital media channels. Digital campaign managers need this data to evaluate customer segment penetration and overall campaign effectiveness. Information can be collected via digital-channel API integrations or on the digital channel user interface (UI): digital-channel API integrations require frequent maintenance, while UI data collection can be labor-intensive.
On the AWS Cloud, IBM designed an augmented digital campaign manager solution, to assist digital campaign managers with digital-channel monitoring and management. This solution monitors social media APIs and, when APIs change, automatically updates the API integration, ensuring accurate information collection (Figure 1).
Figure 1. Optimize digital channels monitoring and management for Marketing
Lambda retrieves the required information from Amazon DynamoDB, like the most relevant brands; natural language processing (NLP) is applied to retrieved data, like URL, bio, about, verification status.
Amazon S3 and Amazon CloudFront are used to present a dashboard where end-users can check, enrich, and validate collected data.
When graph API calls detect an error/change, Lambda checks API documentation to update/correct the API call.
A new Lambda function is generated, with updated API call.
Solution 2: 4th party logistics consulting service for a greener supply chain
Logistics companies have a wealth of trip data, both first- and third-party, and can leverage these data to provide new customer services, such as options for trips booking with optimized carbon footprint, duration, or costs.
IBM designed an AWS solution (Figure 2) enabling the customer to book goods transport by selecting from different route options, combining transport modes, selecting departure-location, arrival, cargo weight and carbon emissions. Proposed options include the greenest, fastest, and cheapest routes. Additionally, the user can provide financial and time constraints.
Figure 2. Optimized transport booking architecture
User connects to web-app UI, hosted on Amazon S3.
Amazon API Gateway receives user requests from web app; requests are forwarded to Lambda.
Lambda calculates the best trip options based on the user’s prerequisites, such as carbon emissions.
Lambda estimates carbon emissions; estimates are combined with trip options at Step 3.
Amazon Neptune graph database is used to efficiently store and query trip data.
Different Lambda instances are used to ingest data from on-premises data sources and send customer bookings through the customer ordering system.
Solution 3: Purchase order as a service
In the context of vendor-managed inventory and vendor-managed replenishment, inventory and logistics companies want to check on warehouse stock levels to identify the best available options for goods transport. Their objective is to optimize the availability of warehouse stock for order fulfillment; therefore, when a purchase order (PO) is received, required goods are identified as available in the correct warehouse, enabling swift delivery with minimal lead time and costs.
IBM designed an AWS PO as a service solution (Figure 3), using warehouse data to forecast future customer’s POs. Based on this forecast, the solution plans and optimizes warehouse goods availability and, hence, logistics required for the PO fulfillment.
Figure 3. Purchase order as a service AWS solution
AWS Amplify provides web-mobile UI where users can set constraints (such as warehouse capacity, minimum/maximum capacity) and check: warehouses’ states, POs in progress. Additionally, UI proposes possible optimized POs, which are automatically generated by the solution. If the user accepts one of these solution-generated POs, the user will benefit from optimized delivery time, costs and carbon-footprint.
Lambda receives Amazon Forecast inferences and reads/writes PO information on Amazon DynamoDB.
Forecast provides inferences regarding the most probable future POs. Forecast uses POs, warehouse data, and goods delivery data to automatically train a machine learning (ML) model that is used to generate forecast inferences.
Amazon DynamoDB stores PO and warehouse information.
Lambda pushes PO, warehouse, and goods delivery data from Amazon DynamoDB into Amazon S3. These data are used in the Forecast ML-model re-train, to ensure high quality forecasting inferences.
Solution 4: Optimize environmental impact associated with engineers’ interventions for customer fiber connections
Telco companies that provide end-users’ internet connections need engineers executing field tasks, like deploying, activating, and repairing subscribers’ lines. In this scenario, it’s important to identify the most efficient engineers’ itinerary.
IBM designed an AWS solution that automatically generates engineers’ itineraries that consider criteria such as mileage, carbon-emission generation, and electric-/thermal-vehicle availability.
The solution (Figure 4) provides:
Customer management teams with a mobile dashboard showing carbon-emissions estimates for all engineers’ journeys, both in-progress and planned
Engineers with a mobile application including an optimized itinerary, trip updates based on real time traffic, and unexpected events
Figure 4. AWS telco solution for greener customer service
Management team and engineers connect to web/mobile application, respectively. Amazon Cognito provides authentication and authorization, Amazon S3 stores application static content, and API Gateway receives and forwards API requests.
AWS Step Functions implements different workflows. Application logic is implemented in Lambda, which connects to DynamoDB to get trip data (current route and driver location); Amazon Location Service provides itineraries, and Amazon SageMaker ML model implements itinerary optimization engine.
Independently from online users, trip data are periodically sent to API Gateway and stored in Amazon S3.
SageMaker notebook periodically uses Amazon S3 data to re-train the trip optimization ML model with updated data.
Solution 5: Improve the effectiveness of customer SAP level 1 support by reducing response times for common information requests
Companies using SAP usually provide first-level support to their internal SAP users. SAP users engage the support (usually via ticketing system) to ask for help when facing SAP issues or to request additional information. A high number of information requests requires significant effort to retrieve and provide the available information on resources like SAP notes/documentation or similar support requests.
IBM designed an AWS solution (Figure 5), based on support request information, that can automatically provide a short list of most probable solutions with a confidence score.
Figure 5. SAP customer support solution
Lambda receives ticket information, such as ticket number, business service, and description.
Lambda processes ticket data and Amazon Translate translates text into country native-language and English.
SageMaker ML model receives the question and provides the inference.
If the inference has a high confidence score, Lambda provides it immediately as output.
If the inference has a low confidence score, Amazon Kendra receives the question, searches automatically through indexed company information and provides the best answer available. Lambda then provides the answer as output.
Solution 6: Improve contact center customer experience providing faster and more accurate customer support
Insured customers often interact with insurer companies using contact centers, requesting information and services regarding their insurance policies.
IBM designed an AWS solution improving end-customer experience and contact center agent efficiency by providing automated customer-agent call/chat summarization. This enables:
The agent to quickly recall the customer need in following interactions
Contact center supervisor to quickly understand the objective of each case (intervening if necessary)
Insured customers to quickly have the information required, without repeating information already provided
Figure 6. Improving contact center customer experience
Summarization capability is provided by generative AI, leveraging large language models (LLM) on SageMaker.
Pretrained LLM model from Hugging Face is stored on Amazon S3.
LLM model is fine-tuned and trained using Amazon SageMaker.
LLM model is made available as SageMaker API endpoint, ready to provide inferences.
Insured user contact customer support; the user request goes through voice/chatbot, then reaches Amazon Connect.
Lambda queries the LLM model. The inference is provided by LLM and it’s sent to an Amazon Connect instance, where inference is enriched with knowledge-based search, using Amazon Connect Wisdom.
If the user–agent conversation was a voice interaction (like a phone call), then the call recording is transcribed using Amazon Transcribe. Then, Lambda is called for summarization.
Conclusion
In this blog post, we have explored how IBM Consulting delivered an Innovation Hackathon in France. During the Hackathon, IBM worked backward from real customer use cases, designing and building innovative solutions using AWS services.
To facilitate the huge scale of Cloudflare’s customer base, we maintain data centers which span more than 300 cities in over 100 countries, including approximately 30 locations in Mainland China.
The Cloudflare global network is built to be continuously updated in a zero downtime manner, but some changes may need a server reboot to safely take effect. To enable this, we have mechanisms for the whole fleet to automatically reboot with changes gated on a unique identifier for the reboot cycle. Each data center has a maintenance window, which is a time period – usually a couple of hours – during which reboots are permitted.
We take our customer experience very seriously, and hence we have several mechanisms to ensure that disruption to customer traffic does not occur. One example is Unimog, our in-house load balancer that spreads load across the servers in a data center, ensuring that there is no disruption when a server is taken out for routine maintenance.
The SRE team decided to further reduce risk by only allowing reboots in a data center when the customer traffic is at the lowest. We also needed to automate the existing manual process for determining the window – eliminating toil.
In this post, we’ll discuss how the team improved this manual process and automated the determination of these windows using a trigonometric function – sinusoidal wave fitting.
When is the best time to reboot?
Thanks to how efficient our load-balancing framework is within a data center, technically we could proceed to schedule reboots throughout the day with zero impact to traffic flowing through the data center. However, operationally the management is simplified by requiring reboots take place between certain times for each data center. It both acts as a rate-limiter to avoid rebooting all servers in our larger data centers in a single day, and makes remediating any unforeseen issues that arise during the reboots more straightforward, as issues can be caught within the first batch of reboots.
One of the first steps is to determine the time window during which we are going to allow these reboots to take place; choosing the relative low-traffic period for a data center makes the most sense for obvious reasons. In the past, these low-traffic windows were found manually by humans reviewing historical traffic trends present in our metrics; it was SRE who were responsible for creating and maintaining the definition of these windows, which became particularly toilsome:
Traffic trends are always changing, requiring increasingly frequent reviews of maintenance hours.
We move quickly at Cloudflare, there is always a data center in a state of provisioning, making it difficult to keep maintenance windows up-to-date.
The system was inflexible, and provided no dynamic decision-making.
This responsibility became SRE toil as it was repetitive, process-based work that could and should be automated.
Time to be more efficient
We quickly realized that we needed to make this process more efficient using automation. An ideal solution would be one that was accurate, easy to maintain, re-usable, and could be consumed by other teams.
A theoretical solution to this was sine-fitting on the CPU pattern of the data center over a configurable period. e.g. two weeks. This method is a way to transform the pattern into a theoretical sinusoidal wave as shown in the image below.
With a sine wave, the most common troughs can be determined. The periods where these troughs occur are then used as options for the maintenance window.
Sinusoidal wave theory – the secret sauce
We think math is fun and were excited to see how this held up in practice. To implement the logic and tests, we needed to understand the theory. This section details the important bits for anyone that is interested in implementing this for their maintenance cycles as well.
The image below shows a theoretical representation of a sine wave. It is represented by the mathematical function y(t) = Asin(2πft + φ) where A = Amplitude, f = Frequency, t = Time and φ = Phase.
In practice, various programming language packages exist to fit an arbitrary dataset on a curve. For example, Python has the scipy curve_fit function.
We used Python and to make the result more accurate, it is recommended to include arbitrary values as initial guesses. These are described below;
Amplitude: This is the distance from the peak/valley to the time axis, and is approximated as the standard deviation multiplied by √2. The standard deviation represents the variability in the data points, and for a sine wave that varies between -1 and +1, the standard deviation is approximately 0.707 (or 1/√2). Therefore, by multiplying the standard deviation of the data by √2, we can represent an approximation of the amplitude.
Frequency: This is the number of cycles (time periods) in one second. We are concerned with the daily CPU pattern, meaning that the guess should be one full wave every 24 hours (i.e. 1/86400).
Phase: This is the position of the wave at T=0. No guess is needed for this.
Offset: To fit the sine wave on the CPU values, we need to shift upwards by the offset. This offset is the mean of the CPU values.
Here’s a basic example of how it can be implemented in Python:
With the theory understood, we implemented this logic in our reboot system. To determine the window, the reboot system queries Prometheus for the data center CPU over a configurable period and attempts to fit a curve on the resultant pattern.
If there’s an accurate enough fit, the window is cached in Consul along with other metadata. Otherwise, fallback logic is implemented. For various reasons, some data centers might not have enough data for a fit at that moment. For example, a data center which was only recently provisioned and hasn’t served enough traffic yet.
When a server requests to reboot, the system checks if the current time is within the maintenance window first, before running other pre-flight checks. In most cases the window already exists because of the prefetch mechanism implemented, but when it doesn’t due to Consul session expiry or some other reason, it is computed using the CPU data in Prometheus.
The considerations in this phase were:
Caching: Calculation of the window should only be done over a pre-decided validity period. To achieve this we store the information in a Consul KV, along with a session lock that expires after the validity period. We have mentioned in the past that we use Consul as a service-discovery and key-value storage mechanism. This is an example of the latter.
Pre-fetch: In practice, it makes sense to control when this computation happens. There are several options but the most efficient was to implement a pre-fetch of this window on startup of the reboot system.
Observability: We exported a couple of metrics to Prometheus, which help us understand the decisions being made and any errors we need to address. We also export the maintenance window itself for consumption by other automated systems and teams.
How accurate is this fit?
Most load patterns fit into the sine wave, but there are some edge cases occasionally. e.g. a smaller data center that has a constant CPU. In those cases we have fallback mechanisms, but it also got us thinking about how to determine the accuracy of each fit.
With accuracy data we can make smarter decisions about accepting the automatic window, track regressions and unearth data centers with unexpected patterns. The theoretical solution here is referred to as the goodness of fit.
Curve fitting in Python with curve_fit describes curve fitting and calculating the chi-squared value. The formula for a goodness of fit chi-squared test in the image below:
The different values are the observed (Yi), expected (f(Xi)) and uncertainty. In this theory, the closer the chi-square value to the length of the sample, the better the fit is. Chi-squared values that are a lot smaller than the length represent an overestimated uncertainty and much larger represent a bad fit.
This is implemented with a simple formula:
def goodness_of_fit(observed, expected):

    chisq = numpy.sum(((observed - expected)/ numpy.std(observed)) ** 2)

    # Present the chisq value percentage relative to the sample length
    n = len(observed)
    return ((n - chisq) / n) * 100
The observed result of this is that the smaller the chi-squared, the more accurate the fit and vice versa. Hence we can provide a fit percentage of the difference between the length and the chi-squared.
There are three main types of fit, as shown in the images below.
Bad Fit
These data centers do not exhibit a sinusoidal pattern and the maintenance window can only be determined arbitrarily. This is common in test data centers which do not handle customer traffic. In these cases, it makes sense to turn off load-based reboots and use an arbitrary window. In these cases, it is common to require faster reboots on a different schedule to catch any potential issues early.
Skewed Fit
These data centers exhibit sinusoidal traffic patterns but are a bit skewed, with some smaller troughs within the wave cycle. The troughs (and hence the windows) are still correct, but the accuracy of fit is reduced.
Great Fit
These are data centers with very clear patterns and great fits. This is the ideal scenario and most fall into this category.
What’s next?
We will continue to iterate on this to make it more accurate, and provide more ways to consume the information. We have a variety of maintenance use-cases that cut across multiple organizations, and it’s exciting to see the information used more widely besides reboots. For example, teams can use maintenance windows to make automated decisions in downstream services such as running compute-intensive background tasks only in those periods.
I want to do this type of work
If you found this post very interesting and want to contribute, take a look at our careers page for open positions! We’d love to have a conversation with you.
Security updates have been issued by Debian (erlang, symfony, thunderbird, and yajl), Fedora (cutter-re, kernel, rizin, and yt-dlp), Red Hat (grafana), SUSE (kernel and python-Django), and Ubuntu (dotnet6, dotnet7 and firefox).
Миналата седмица се състоя едно от най-важните събития за България след 2007 г., когато тя беше приета в ЕС, ако не и най-важното. На посещение в страната ни дойде украинският президент Володимир Зеленски. И не само дойде, ами си тръгна жив и здрав. А това не е саморазбиращо се в страна, в която осем години няма особено движение по разследването на отравянето на оръжеен търговец по всяка вероятност с новичок. Но според тогавашния главен прокурор проблемът ще да е бил салата от рукола с пестициди. Да припомним: новичок е „запазена марка“ на руската държавна власт.
Три социологически агенции и три спада в подкрепата
Във вътрешнополитически план обаче проблемите както пред правителството, така и пред коалициите, от които то се състои, са сериозни. Три изследвания на различни социологически агенции („Тренд“, „Алфа Рисърч“ и „Маркет Линкс“), проведени от юни до началото на юли, очертават сходни тенденции – три спада в подкрепата.
Първият спад е за ПП–ДБ. Вторият, по-незначителен от първия, е за ГЕРБ. Третият – за президента. Румен Радев „се радва“ на най-ниското одобрение и най-високото неодобрение, откакто заема този пост, след като влезе в открита война с новото правителство още когато трябваше да връчи мандата на Николай Денков. Трите изследвания са отпреди резила на Радев при посещението на Зеленски.
Въпреки че избирателите биха предпочели да има редовно правителство, част от гласуващите за ПП–ДБ и за ГЕРБ не могат да им простят съюзяването с доскорошните им най-големи врагове.
Разочарованите привърженици на ГЕРБ са по-малко поради няколко причини. От една страна, в голямата си част медиите реагират безкритично на посланията на силните на деня. От друга страна, в ГЕРБ са натрупали сериозен политически стаж и знаят как да припишат всички позитиви на себе си, а негативите – на конкурентите си. Освен това електоратът на ПП и особено на ДБ се слави с особена критичност и принципност, стигаща до неприемане на каквито и да е компромиси, както и с хетерогенните изисквания на различните избиратели към политическите им избраници.
На този фон е важно да се припомня отново и отново какво е постигнало новото правителство и чия е заслугата за това.
Потвърждаване на външнополитическата ориентация на България
Посещението на украинския президент, с което започнахме, е по покана на ротационното правителство на Николай Денков и Мария Габриел и е от огромно значение за България. То е знак за препотвърждаване евроатлантическата ни ориентация – в период, в който тя беше престанала да изглежда безвъпросна.
Дългата поредица от служебни правителства доведе до еднолична власт на президента Румен Радев, чиито цели съвпадат по-скоро с дневния ред на Русия, отколкото с международните договори, по които България е страна. А Русия не само води война с Украйна, а и се опитва да дестабилизира Балканите. Последното се потвърждава от българските разузнавателни и контраразузнавателни служби, чиито данни виждат бял свят, защото редовното правителство ги публикува.
Една от темите в годишните доклади на службите впрочем е ролята на Русия в конфликтите между България и Северна Македония. Това дава допълнителна тежест на хипотезата, че зад българо-македонските драми с имена на културни клубове и побои стоят професионално организирани активни мероприятия.
Заслугите за препотвърждаването на външнополитическата ориентация на България са основно на ПП–ДБ, макар и не без съдействието на ГЕРБ. Но по време на дългото управление на Бойко Борисов водената политика беше по-скоро имитативно евроатлантическа, а реалните политики и инфраструктурни проекти бяха все от полза на Русия.
Посещението на Зеленски – практически ползи
Посещението на Володимир Зеленски беше съпроводено с три важни решения. Първото е, че България започва преговори за продажбата на оборудването за АЕЦ „Белене“ на Украйна. Точещото се с десетилетия изграждане на втората атомна централа у нас беше част от цялостното поставяне на страната в енергийна зависимост от Русия. Така Украйна ще може да се сдобие с оборудване, подходящо за нейните централи, а България – с финансови средства, предоставени на Украйна от ЕС за целта.
Второто решение е потвърждаване на ангажимента на страната ни за предоставяне на военна помощ на Украйна. По време на правителството на Кирил Петков оръжие и боеприпаси се изпращаха под сурдинка, защото председателката на БСП Корнелия Нинова беше против „директната помощ“. Служебното правителство на Гълъб Донев отказа да се съобрази с решението на парламента за предоставянето на военна помощ. Сега вече тя ще се осъществява с подкрепата на правителството „Денков–Габриел“.
С третото решение България се присъединява към държавите членки на НАТО, подкрепящи присъединяването на Украйна към Алианса.
Освен че е морален акт, заставането „от правилната страна на историята“ носи и практически ползи. България ще има възможност да обнови военното си оборудване с изтичащ срок на годност, както и да участва във възстановяването на Украйна след края на войната.
Още от по-значителните постижения на управлението на ПП–ДБ и ГЕРБ
Управлението на ПП–ДБ и ГЕРБ успя да постигне наченки на правосъдна реформа. Конституцията още не е реформирана в частта ѝ за главния прокурор, а свалянето на Иван Гешев и замяната му с Борислав Сарафов беше карикатурно и послужи най-вече за да покаже защо правосъдната система има нужда от сериозна трансформация. Беше въведен обаче механизъм за контрол на главния прокурор – разследване от независим съдия. Гешев обжалва този механизъм в Конституционния съд.
Въпреки всичките си кусури и спънки обаче, наченките на правосъдна реформа са най-сериозните усилия в тази посока от началото на 90-те години насам. Не на последно място, в резултат на тях механизмът за сътрудничество и проверка на България най-сетне беше прекратен. Това от своя страна увеличи шансовете на България за скорошно влизане в Шенген.
Заслугата и за тези постижения е основно на ДБ, за които това е кауза от години, и на ПП. Да си спомним, че репликата на Николай Кокинов към Бойко Борисов „Ти си го избра“ стана символ на кадруването на председателя на ГЕРБ в системата на правосъдието.
Изготвен беше бюджет, който изпълнява изискването за 3% дефицит за влизане на България в еврозоната. Служебният кабинет на Гълъб Донев беше заложил два пъти по-голям дефицит, което превръщаше еврозоната в мираж. Тук основната заслуга е на финансовия министър Асен Василев, който успя да намери някой и друг „мистично“ изчезнал милиард, а също така състави план за повишаване на събираемостта на данъците, без да ги увеличава и без да съкращава социални разходи. Управлението на ГЕРБ от своя страна ще се запомни с безследно потъналите милиарди в нискокачествено изпълнени инфраструктурни проекти и къде ли още не.
Освен това парламентът отхвърли референдума на „Възраждане“ против еврото. „Възраждане“ може да обжалва в Конституционния съд. И все пак парламентарният вот е знак за поне две неща: затвърждаване на европейската ориентация на България и демонстриране, че с пряката демокрация не бива да се злоупотребява. Отхвърлянето на референдума също стана с основната заслуга на ПП и ДБ. В парламентарната комисия от ГЕРБ гласуваха „въздържали се“, а в пленарната зала вотът на депутатите от ГЕРБ–СДС не беше единен, но в последна сметка референдумът не мина – оцеляването на ГЕРБ зависи в немалка степен от европейския им имидж и те не биха си позволили да играят евроскептици точно в този момент.
Правителството идентифицира неонацизма като проблем. Премиерът Николай Денков окачестви „Възраждане“ като „неофашистка партия“. Това стана след поредица от изяви на председателя на партията Костадин Костадинов, нейни политици и последователи – от хомофобски атаки и антиеврейски послания, през заливане на Дома на Европа с червена боя, та до призиви за „унищожение“ на хората, чиито възгледи на съвпадат с тези на „Възраждане“.
Отново да припомним: след 2017 г. управлението на ГЕРБ се крепеше благодарение на коалицията с „Обединени патриоти“, която се състоеше от неонацистките по същество партии ВМРО–БНД, НФСБ, а до 2019 г. към тях се числеше и „Атака“.
Повторения, повторения, повторения
Започнахме с необходимостта да се припомня какво е постигнало новото правителство и чия е заслугата. Рейтингът зависи не само от това кой какво е направил, а и как се представя направеното. По данни на платформата „Стража“ най-гласовити в парламента са от „Възраждане“, следвани от ПП–ДБ и ГЕРБ. От ПП–ДБ най-голямо участие е вземал Асен Василев, който понастоящем е министър. С изключение на него няма депутат от ПП–ДБ, който по словесна хиперактивност да съперничи на Петър Петров, Костадин Костадинов и Цончо Ганев от „Възраждане“, Десислава Атанасова от ГЕРБ и председателката на БСП Корнелия Нинова.
Навремето Иван Костов казваше: „Трябва да обясняваме на хората.“ При всички несъвършенства на управлението на неговото правителство, по отношение на тази реплика важи убеждението на последователите му „Костов беше прав“. Трябва да се обяснява. И да се повтаря.
Effective planning and tracking is essential for developer teams of all shapes and sizes. Last year, we announced the general availability of GitHub Projects, connecting your planning directly to the work your teams are doing in GitHub. Today, we’re making GitHub Projects faster and more powerful. The projectcommand for the gh CLI is now generally available!
In this blog, we’ll take a look at how to get started with the new command, share some examples you can try on the command line and in GitHub Actions, and list the steps to upgrade from the archived gh-projects extension. Let’s take a look at how you can conveniently manage and collaborate on GitHub Projects from the command line.
The components of GitHub Projects
Let’s start by familiarizing ourselves with the key components of GitHub Projects. A project is made up of three components—the Project, Project field(s), and Project item(s).
A Project belongs to an owner (which can be either a user or an organization), and is identified by a project number. As an example, the GitHub public roadmap project is number 4247 in the github organization. We’ll use this project in some of our examples later on.
Project fields belong to a Project and have a type such as Status, Assignee, or Number, while field values are set on an item. See understanding fields for more details.
Project items are one of type draft issue, issue, or pull request. An item of type draft issue belongs to a single Project, while items of type issue and pull request can be added to multiple projects.
These three components make up the subcommands of gh project, for example:
Project subcommands include: create, copy, list, and view.
Project field subcommands include: field-create, field-list , and field-delete.
Project item subcommands include: item-add, item-edit, item-archive, and item-list.
For the full list of project commands, check out the manual.
Permissions check
In order to get started with the new command, you’ll need to ensure you have the right permissions. The project command requires the project auth scope, which isn’t part of the default scopes of the gh auth token.
In your terminal, you can check your current scopes with this command:
$ gh auth status
github.com
✓ Logged in to github.com as mntlty (keyring)
✓ Git operations for github.com configured to use https protocol.
✓ Token: gho_************************************
✓ Token scopes: gist, read:org, repo, workflow
If you don’t see project in the list of token scopes, you can add it by following the interactive prompts from this command:
$ gh auth refresh -s project
In GitHub Actions, you must choose one of the options from the documentation to make a token with the project scope available.
Running project commands
Now that you have the permissions you need, let’s look at some examples of running project commands using my user and the GitHub public roadmap project, which you can adapt to your team’s use cases.
List the projects owned by the current user (note that no --owner flag is set):
$ gh project list
NUMBER TITLE STATE ID
1 my first project open PVT_kwxxx
2 @mntlty's second project open PVT_kwxxx
$ gh project view --owner github 4247

Title

GitHub public roadmap

## Description

--

## Visibility

Public

## URL

<https://github.com/orgs/github/projects/4247>

## Item count

208

## Readme

--

## Field Name (Field Type)

Title (ProjectV2Field)

Assignees (ProjectV2Field)

Status (ProjectV2SingleSelectField)

Labels (ProjectV2Field)

Repository (ProjectV2Field)

Milestone (ProjectV2Field)

Linked pull requests (ProjectV2Field)

Reviewers (ProjectV2Field)

Tracks (ProjectV2Field)

Tracked by (ProjectV2Field)
List the items in the GitHub public roadmap project:
$ gh project item-list --owner github 4247

TYPE TITLE NUMBER REPOSITORY ID
Issue Kotlin security analysis support in CodeQL code scanning
(public beta) 207 github/roadmap
PVTI_lADNJr_NE13OAALQgw
Issue Swift security analysis support in CodeQL code scanning
(beta) 206 github/roadmap
PVTI_lADNJr_NE13OAALQhA
Issue Fine-grained PATs (v2 PATs) - [Public Beta]
184 github/roadmap PVTI_lADNJr_NE13OAALQmw
Copy the GitHub public roadmap project structure to a new project owned by mntlty:
Note that if you are using a TTY and do not pass a --owner flag or the project number argument to a command which requires those values, an interactive prompt will be shown from which you can select those values.
JSON format
Now, let’s look at how to format the command output in JSON, which displays more information for use in scripting, automation, and piping into other commands. Every project subcommand supports outputting to JSON format by setting the --format=json flag:
Combining JSON formatted output with a tool such as jq enables you to unlock even more capabilities. For example, you can create a list of the URLs from all of the Issues on the GitHub public roadmap project that have status “Future”:
You can also level up your team’s usage of GitHub Projects with project commands in your GitHub Actions workflows to enhance automation, generate on demand reports, and react to events such as when a project item is modified. For example, you can create a workflow which is triggered by a workflow_dispatch event and will close all projects that are owned by mntlty and which have no items:
The latest version of gh is automatically available in the GitHub Actions environment. For more information on using GitHub Actions, see https://docs.github.com/en/actions.
Upgrading from the gh-projects extension
Now that the project command is officially part of the CLI, the gh-projectsextension repository has been archived. If you’re currently using the extension, you don’t need to change anything. You can continue installing and using the gh-projects extension; however, it won’t receive any future enhancements. Fortunately, it’s very simple to make the transition from the gh-project extension to the project command:
Upgrade to the latest version of gh.
Replace flags for --user and --org with --owner in project commands. owner is the login of the project owner, which is either a user or an organization.
Replace gh projects with gh project.
To avoid confusion, I also recommend removing the extension by running the following command:
$ gh ext remove gh-projects
Thank you to the community, @mislav, @samcoe, and @vilmibm for providing invaluable feedback and support on gh-projects!
Get started with GitHub CLI project command today
If you’re interested in learning more or giving us feedback, check out these links:
Microsoft is addressing 130 vulnerabilities this July Patch Tuesday, including five zero-day vulnerabilities, and eight further critical remote code execution (RCE) vulnerabilities. Overall, it’s safe to say that this is a busier Patch Tuesday than the past couple of months. Note that the total count of vulnerabilities reported no longer includes any Edge-on-Chromium fixes.
Office zero-day maldoc vuln: no patch, no problem
Surprisingly, there is no patch yet for one of the five zero-day vulnerabilities. Microsoft is actively investigating publicly-disclosed Office RCE CVE-2023-36884, and promises to update the advisory as soon as further guidance is available. Exploitation requires the victim to open a specially crafted malicious document, which would typically be delivered via email.
A Microsoft Security Research Centre (MSRC) blog post links exploitation of this vulnerability with Storm-0978, Microsoft’s designation for a cybercriminal group based out of Russia also tracked across the wider industry under the name RomCom. MSRC suggests that RomCom / Storm-0978 is operating in support of Russian intelligence operations. The same threat actor has also been associated with ransomware attacks targeting a wide array of victims.
Defenders who are understandably unsettled by the lack of immediate patches for CVE-2023-36884 should consult the multiple mitigation options on the advisory. Microsoft claims that assets with Defender for Office 365 are already protected. Further options include an existing optional Defender for Endpoint Attack Surface Reduction (ASR) rule to prevent Office from creating child processes, and a registry modification to disable the vulnerable cross-protocol file navigation. The registry option might be the most straightforward option for organizations without a mature Defender program, but Microsoft does warn that certain use cases relying on the functionality would be impacted if this mitigation is deployed.
There are broad similarities to last year’s Follina vulnerability, which was discussed publicly for over two weeks starting late May 2023 before Microsoft patched it on June 14th as part of Patch Tuesday. While it’s possible that a patch for CVE-2023-36884 will be issued as part of next month’s Patch Tuesday, Microsoft Office is deployed just about everywhere, and this threat actor is making waves; admins should be ready for an out-of-cycle security update for CVE-2023-26884.
The menu of mitigation options here should offer something for every Microsoft shop, but it will come as something of a relief that Microsoft is offering patches for the four other zero-day vulnerabilities mentioned in this month’s Security Update Guide.
MSHTML, Windows Error Reporting: zero-day elevation of privilege vulns
CVE-2023-32046 describes a vulnerability in the MSHTML browser rendering engine which would allow an attacker to act with the same rights as the exploited user account. Successful exploitation requires the victim to open a specially-crafted malicious file, typically delivered either via email or a web page. Assets where Internet Explorer 11 has been fully disabled are still vulnerable until patched; the MSHTML engine remains installed within Windows regardless of the status of IE11, since it is used in other contexts (e.g. Outlook).
A separate vulnerability in the Windows Error Reporting Service allows elevation to the Administrator role via abuse of Windows performance tracing. To exploit CVE-2023-36874, an attacker must already have existing local access to an asset, so this vulnerability will most likely make up part of a longer exploit chain.
Rounding out this month’s zero-day vulnerabilities are two security feature bypass flaws. CVE-2023-32049 allows an attacker to formulate a URL which will bypass the Windows SmartScreen “Do you want to open this file?” dialog. Previous SmartScreen bypasses have been exploited extensively, not least for no-notice delivery of ransomware.
Broadly similar is CVE-2023-35311, which describes a bypass of the Microsoft Outlook Security Notice dialog via a specially-crafted URL.
Windows RRAS: critical RCEs
Eight further critical RCE vulnerabilities are also patched, including three related vulnerabilities in the Windows Routing and Remote Access Service (RRAS) with CVSS v3 base score of 9.8 (CVE-2023-35365, CVE-2023-35366, and CVE-2023-35367). In each case, an attacker can send specially-crafted packets to vulnerable assets to achieve RCE. Happily, RRAS is not installed or configured by default, but admins with RRAS-enabled Windows Server installations will undoubtedly want to prioritize remediation.
SharePoint: critical RCEs
Anyone responsible for on-prem SharePoint should patch to avoid a variety of potential impacts from exploitation of CVE-2023-33157 and CVE-2023-33160, including information disclosure and editing, as well as reduced availability of the targeted environment. While both of these vulnerabilities require that an attacker already be authenticated as a user with at least Site Member privileges, this isn’t necessarily much of a defense, since this is the lowest standard permission group with the least privileges other than the read-only Site Visitor role, and will typically be widely granted. Microsoft assesses exploitation as more likely for both of these.
Windows core components: critical RCEs
The remainder of this month’s critical RCE patches target flaws in the Windows Layer-2 Bridge Network Driver (CVE-2023-35315), and usual suspects Windows Message Queuing (CVE-2023-32057) and Windows PGM (CVE-2023-35297).
Windows Remote Desktop: security feature bypass
CVE-2023-35352 will be of interest to anyone running an RDP server. Although the advisory is short on detail, an attacker could bypass certificate or private key authentication when establishing a remote desktop protocol session. Although the CVSS v3 base score of 7.5 falls short of the critical band, this is only because Microsoft has scored this vulnerability as having no impact on either confidentiality or availability, probably because the scoring is against the RDP service itself rather than whatever may be accessed downstream; this seems like a case where CVSS cannot fully capture the potential risk, and Microsoft’s Security Update Severity Rating System does rank this vulnerability as critical.
Summary Charts
Windows RPC is back!Many of those Remote Code Execution vulnerabilities require user interaction.An unremarkable distribution of CVSSv3 base scores.This heatmap shows distribution of vulnerabilities, rather than risk.
Using embedded analytics from Amazon QuickSight can simplify the process of equipping your application with functional visualizations without any complex development. There are multiple ways to embed QuickSight dashboards into application. In this post, we look at how it can be done using React and the Amazon QuickSight Embedding SDK.
Dashboard consumers often don’t have a user assigned to their AWS account and therefore lack access to the dashboard. To enable them to consume data, the dashboard needs to be accessible for anonymous users. Let’s look at the steps required to enable an unauthenticated user to view your QuickSight dashboard in your React application.
After loading the web page on the browser, the browser makes a call to API Gateway, which invokes a Lambda function that calls the QuickSight API to generate a dashboard URL for an anonymous user. The Lambda function needs to assume an IAM role with the required permissions. The following diagram shows an overview of the architecture.
Prerequisites
You must have the following prerequisites:
An AWS account
A QuickSight account with session capacity pricing enabled
Make sure to change the value of <YOUR_DASHBOARD_ID> to the value of the dashboard ID. Note this ID to use in a later step as well.
For the second statement object with logs, permissions are optional. It allows you to create a log group with the specified name, create a log stream for the specified log group, and upload a batch of log events to the specified log stream.
In this policy, we allow the user to perform the GenerateEmbedUrlForAnonymousUser action on the dashboard ID within the list of dashboard IDs inserted in the placeholder.
Enter a name for your policy (for example, AnonymousEmbedPolicy) and choose Create policy.
Next, we create a role and attach this policy to the role.
Choose Roles in the navigation pane, then choose Create role.
Choose Lambda for the trusted entity.
Search for and select AnonymousEmbedPolicy, then choose Next.
Enter a name for your role, such as AnonymousEmbedRole.
Make sure the policy name is included in the Add permissions section.
Finish creating your role.
You have just created the AnonymousEmbedRole execution role. You can now move to the next step.
Generate an anonymous embed URL Lambda function
In this step, we create a Lambda function that interacts with QuickSight to generate an embed URL for an anonymous user. Our domain needs to be allowed. There are two ways to achieve the integration of Amazon QuickSight:
By adding the URL to the list of allowed domains in the Amazon QuickSight admin console (explained later in [Optional] Add your domain in QuickSight section).
[Recommended] By adding the embed URL request during runtime in the API call. Option 1 is recommended when you need to persist the allowed domains. Otherwise, the domains will be removed after 30 minutes, which is equivalent to the session duration. For other use cases, it is recommended to use the second option (described and implemented below).
On the Lambda console, create a new function.
Select Author from scratch.
For Function name, enter a name, such as AnonymousEmbedFunction.
For Runtime¸ choose Python 3.9.
For Execution role¸ choose Use an existing role.
Choose the role AnonymousEmbedRole.
Choose Create function.
On the function details page, navigate to the Code tab and enter the following code:
If you don’t use localhost, replace http://localhost:3000 in the returns with the hostname of your application. To move to production, don’t forget to replace http://localhost:3000 with your domain.
On the Configuration tab, under General configuration, choose Edit.
Increase the timeout from 3 seconds to 30 seconds, then choose Save.
Under Environment variables, choose Edit.
Add the following variables:
Add DashboardIdList and list your dashboard IDs.
Add DashboardRegion and enter the Region of your dashboard.
Choose Save.
Your configuration should look similar to the following screenshot.
On the Code tab, choose Deploy to deploy the function.
Set up API Gateway to invoke the Lambda function
To set up API Gateway to invoke the function you created, complete the following steps:
On the API Gateway console, navigate to the REST API section and choose Build.
Under Create new API, select New API.
For API name, enter a name (for example, QuicksightAnonymousEmbed).
Choose Create API.
On the Actions menu, choose Create resource.
For Resource name, enter a name (for example, anonymous-embed).
Now, let’s create a method.
Choose the anonymous-embed resource and on the Actions menu, choose Create method.
Choose GET under the resource name.
For Integration type, select Lambda.
Select Use Lambda Proxy Integration.
For Lambda function, enter the name of the function you created.
Choose Save, then choose OK.
Now we’re ready to deploy the API.
On the Actions menu, choose Deploy API.
For Deployment stage, select New stage.
Enter a name for your stage, such as embed.
Choose Deploy.
[Optional] Add your domain in QuickSight
If you added Allowed domains in Generate an anonymous embed URL Lambda function part, feel free to move to Turn on capacity pricing section.
To add your domain to the allowed domains in QuickSight, complete the following steps:
On the QuickSight console, choose the user menu, then choose Manage QuickSight.
Choose Domains and Embedding in the navigation pane.
For Domain, enter your domain (http://localhost:<PortNumber>).
Make sure to replace <PortNumber> to match your local setup.
Choose Add.
Make sure to replace the localhost domain with the one you will use after testing.
Turn on capacity pricing
If you don’t have session capacity pricing enabled, follow the steps in this section. It’s mandatory to have this function enabled to proceed further.
Capacity pricing allows QuickSight customers to purchase reader sessions in bulk without having to provision individual readers in QuickSight. Capacity pricing is ideal for embedded applications or large-scale business intelligence (BI) deployments. For more information, visit Amazon QuickSight Pricing.
To turn on capacity pricing, complete the following steps:
On the Manage QuickSight page, choose Your Subscriptions in the navigation pane.
In the Capacity pricing section, select Get monthly subscription.
To set up your React application, complete the following steps:
In your React project folder, go to your root directory and run npm i amazon-quicksight-embedding-sdk to install the amazon-quicksight-embedding-sdk package.
In your App.js file, replace the following:
Replace YOUR_API_GATEWAY_INVOKE_URL/RESOURCE_NAME with your API Gateway invoke URL and your resource name (for example, https://xxxxxxxx.execute-api.xx-xxx-x.amazonaws.com/embed/anonymous-embed).
Replace YOUR_DASHBOARD1_ID with the first dashboardId from your DashboardIdList. This is the dashboard that will be shown on the initial render.
Replace YOUR_DASHBOARD2_ID with the second dashboardId from your DashboardIdList.
The following code snippet shows an example of the App.js file in your React project. The code is a React component that embeds a QuickSight dashboard based on the selected dashboard ID. The code contains the following key components:
State hooks – Two state hooks are defined using the useState() hook from React:
dashboard – Holds the currently selected dashboard ID.
quickSightEmbedding – Holds the QuickSight embedding object returned by the embedDashboard() function.
Ref hook – A ref hook is defined using the useRef() hook from React. It’s used to hold a reference to the DOM element where the QuickSight dashboard will be embedded.
useEffect() hook – The useEffect() hook is used to trigger the embedding of the QuickSight dashboard whenever the selected dashboard ID changes. It first fetches the dashboard URL for the selected ID from the QuickSight API using the fetch() method. After it retrieves the URL, it calls the embed() function with the URL as the argument.
Change handler – The changeDashboard() function is a simple event handler that updates the dashboard state whenever the user selects a different dashboard from the drop-down menu. As soon as new dashboard ID is set, the useEffect hook is triggered.
10-millisecond timeout – The purpose of using the timeout is to introduce a small delay of 10 milliseconds before making the API call. This delay can be useful in scenarios where you want to avoid immediate API calls or prevent excessive requests when the component renders frequently. The timeout gives the component some time to settle before initiating the API request. Because we’re building the application in development mode, the timeout helps avoid errors caused by the double run of useEffect within StrictMode. For more information, refer to Updates to Strict Mode.
Now it’s time to test your app. Start your application by running npm start in your terminal. The following screenshots show examples of your app as well as the dashboards it can display.
Conclusion
In this post, we showed you how to embed a QuickSight dashboard into a React application using the AWS SDK. Sharing your dashboard with anonymous users allows them to access your dashboard without granting them access to your AWS account. There are also other ways to share your dashboard anonymously, such as using 1-click public embedding.
Join the Quicksight Community to ask, answer and learn with others and explore additional resources.
About the Author
Adrianna is a Solutions Architect at AWS Global Financial Services. Having been a part of Amazon since August 2018, she has had the chance to be involved both in the operations as well as the cloud business of the company. Currently, she builds software assets which demonstrate innovative use of AWS services, tailored to a specific customer use cases. On a daily basis, she actively engages with various aspects of technology, but her true passion lies in combination of web development and analytics.
This is a guest post by Gonzalo Lezma from Amazon Mexico FP&A.
The Financial Planning and Analysis (FP&A) team in Mexico provides strategic support to Amazon’s CFO and executive team on planning, analysis, and reporting related to Amazon Mexico. We produce and manage key finance deliverables, such as internal profit and loss (P&L) reports for all business groups. We are also involved in planning processes, such as monthly forecast estimates, annual operating plans, and 3-year forecasts.
Our team needed to address five key challenges: manual recurrent reporting, managing data from different sources, moving away from large and slow spreadsheets, enabling ad hoc data insights extraction by business users, and variance analysis. To tackle these issues, we chose Amazon QuickSight for our business intelligence (BI) needs.
In this post, I discuss how QuickSight has enabled us to focus on financial and business analysis that helps drive business strategy.
Fully automating recurrent reporting
Creating and maintaining reports manually is time-consuming due to dense data granularity and multiple business groups and sub-products. This involves a lot of data to process and numerous stakeholders to please. Therefore, recurrent reporting requires allocating human hours to elaborate those reports, check the spreadsheet formulas, and rely on attention to detail to validate the numbers to report.
QuickSight dashboards show the Profit and Loss (P&L), which update as soon as databases refresh, simplifying recurrent reporting dramatically. There is no need for human intervention, which eliminates any risk of error during the elaboration of recurrent reporting. The maintenance and elaboration time has decreased from a week to zero for processes that are currently in QuickSight. We employ the QuickSight alerts feature (as shown in the following screenshot) to remain informed when specific metrics exceed a predefined threshold. This enables us to stay cognizant of significant changes in our P&L at a granular level.
Data from different sources
With new marketplaces and channels constantly emerging in Mexico, not all of them are integrated into the financial planning system; therefore, shadow P&Ls and reports are common and unavoidable. Therefore, the team has to find ways to track them without compromising accuracy or consistency, which poses significant additional challenges. Moreover, with multiple channels and teams reporting those numbers, it’s time-consuming to manually update the data source from every team we work with.
QuickSight can onboard data on channels and products that are relatively new and haven’t been onboarded to official planning systems. The team has numerous options to load data, including Amazon Redshift, CSV files, and Excel spreadsheets. There is virtually no limit on the granularity and scope of our reports.
Large and slow spreadsheets
Although spreadsheets are a popular tool for financial analysis, they have limitations for large and complex datasets. This affects performance, reliability, and validation. Spreadsheets become slow, bulky, and prone to errors, making it challenging to manage large datasets efficiently.
The SPICE (Super-fast, Parallel, In-memory Calculation Engine) in-memory engine that QuickSight uses is unparalleled, compared with other solutions the team tried in the past such as Tableau and Excel, eliminating the need for large spreadsheets dramatically. In addition to the time spent in elaborating the reports, the team was having a hard time reading and visualizing them.
The MX Financial Planning and Analysis Dashboard shown below shows the main contributors to the Gross Merchandise Sales for our business. If sales growth is at 20.92% as it says in the graph, we know that 9.09% is due to our NAFN channel. The graph at the bottom shows which products drove the sales increase.
Ad hoc data insights extraction
The finance space frequently requires ad hoc financial data on recent historic trends for a particular product and timespan. Given the number of channels, products, and scenarios the team works on, this creates a big problem to tackle. Extracting these data insights requires significant bandwidth, which can take away from other essential tasks the team needs to focus on.
Amazon QuickSight Q can answer any simple question about the data in a straightforward and nimble manner, allowing the team to handle ad hoc data insights using natural language requests. The following screenshot shows a graph we frequently get using Q to report shipping costs.
Variance analysis
Providing accurate and insightful variance analysis is a significant challenge for anyone working in financial analysis (for example, explaining price or profit per unit by separating mix effect and rate effect). Huge and difficult-to-understand spreadsheets might sound familiar to anyone who has tried to tackle this problem in the finance space.
With QuickSight URL actions (as shown in the following gif and screenshot), the team can right-click on the variance they want to dissect and link to another sheet with granular detail that has a decomposition of the main drivers explaining that particular variance, replacing the huge and cumbersome Excel variance analysis tool the team used to have.
Summary
All in all, the dynamic and interactive nature of the dashboards allows our internal users to go deeper into the data with just a click of the mouse. Now, building visualizations is intuitive, insightful, and fast. In fact, the whole solution and tools were built without the need of a dedicated BI team. In addition to this, we developed internal QuickSight dashboards to view our own customers’ QuickSight usage, so we have perfect visibility on which areas and users are more active and which features are more used by our partners.
With our QuickSight solution, we have automation, self-service, speedy reaction to requests, and flexibility.
To learn more about how QuickSight can help your business with dashboards, reports, and more, visit Amazon QuickSight.
About the Author
Gonzalo Lezma is the Mexico Finance Manager for the Amazon LATAM Finance Team. He is a lifelong learner, tech and data lover.
Projects and technologies come and go, and with each new tool comes new workflow changes. But changing the way you move media around can be tough. Maybe you’ve always done things a certain way, and using a new tool feels like too much of a learning curve especially when you’re pressed for time. But the way you’ve always done things isn’t always the best, easiest, or fastest way. Sometimes you need to change the status quo to level up your media operations.
As a freelance editor, I worked on a recent project that presented some challenges that demanded new approaches to media storage challenges you might also be facing. I solved them with the cloud—but not an all-in-one cloud. My solution was a mix of cloud tools, including Adobe Premiere Pro, which gives me customization and flexibility—the best of all worlds in media workflows.
Right Opportunity at the Right Time
Last year I had the opportunity to serve as a digital imaging technician (DIT) on the set of an indie film titled “Vengeance” produced by Falcon Pictures. The role of a DIT can vary. In many instances you’re simply a data wrangler making backups of the data being shot. In others, you work in the color space of the project creating color corrected dailies on set. For “Vengeance”, I was mostly data wrangling.
“Vengeance” was an 11-day shoot in the mountains of Northern California near Bass Lake. While the rest of the crew spent their days hiking around with equipment, I was stationed back at home base with my DIT cart. With a lot of free time, I found myself logging data as it came in. Logging clip names soon turned into organizing bins and prepping the project for editing. And, while I was not the editor on the project, I was happy to help edit while I was on set.
The Challenge
A few months after my work as DIT ended, it became clear that “Vengeance” needed a boost in post-production. The editing was a bit stuck—they had no assistant editor to complete logging and to sound sync all the footage. So, I was asked to help out. The only problem: I needed to be able to share my work with another editor who lived 45 miles away.
Editing “Vengeance” in Adobe Premiere Pro.
Evaluating the World of Workflows and Cloud Tools
So we began to evaluate a few different solutions. It was clear that Adobe Premiere Pro would be used, but data storage was still a big question. We debated a few methods for sharing media:
The traditional route: Sharing a studio. With the other editor 45 miles away, commuting and scheduling time with each other was going to be cumbersome.
Email: We could email project files back and forth as we worked, but how would we keep track of versioning? Project bloat was a big concern.
Sharing a shuttle drive. Or what I’m calling “Sneakernet 2.0.” This is a popular method, but far from efficient.
Google Drive or Dropbox: Another popular option, but also one that comes with costs and service limitations like rate limiting.
None of these options were great, so we went back to the drawing board.
The Solution: A Hybrid Workflow Designed for Our Needs
To come to a final decision for this workflow, we made a list of our needs:
The ability to share a Premiere Pro project file for updates.
The ability to share media for the project.
No exchanging external hard drives.
No driving (a car).
Changes need to be real time.
Based on those needs, here’s where we landed.
Sharing Project Files
Adobe recently released a new update to its Team Projects features within Premiere Pro. Team Projects allows you to host a Premiere Pro project in the Adobe cloud and share it with other Adobe Creative Cloud users. This gave us the flexibility to share a single project and share updates in real time. This means no emailing of project files, versioning issues, or bloated files. That left the issues of the media. How do we share media?
Sharing Media Files
You may think that it would be obvious to share files in the Adobe Creative Cloud where you get 100GB free. And while 100GB may be enough storage for .psd and .ai files, 100GB is nothing for video, especially when we are talking about RED (.r3d) files which start off as approximately 4GB chunks and can quickly add up to terabytes of footage.
So we put everything in a Backblaze B2 Bucket. All the .r3d source files went directly from my Synology network attached storage (NAS) into a Backblaze B2 Bucket using the Synology Cloud Sync tool. In addition to the source files, I used Adobe Media Encoder to generate proxy files of all the .r3d files. This folder of proxy files also synced with Backblaze automatically.
Making Changes in Real Time
What was great about this solution is that all of the uploading is done automatically via a seamless Backblaze + Synology integration, and the Premiere Pro Team Project had a slew of publish functions perfect for real-time updates. And because the project files and proxies are stored in the cloud, I could get to them from several computers. I spent time at my desktop PC logging and syncing footage, but was also able to move to my couch and do the same from my MacBook Pro. I never had to move hard drives around, copy projects files, or worry about version control.
The other editor was able to connect to my Backblaze B2 Bucket using Cyberduck, a cloud storage browser for Mac. Using Cyberduck, he was able to pull down all the proxy files I created and share any files that he created. So, we were synced for the entire duration of the project.
Once the technology was configured, I was able to finish logging for “Vengeance”, sync all the sound, build out stringouts and assemblies, and even a rough cut of every scene for the entire movie, giving the post-production process the boost it needed.
The Power of Centralized Storage for Media Workflows
Technology is constantly evolving, and, in most circumstances, technology makes how we work a lot easier. For years filmmakers have worked on projects by physically moving our source material, whether it was on film reels, tapes, or hard drives. The cloud changed all that.
The key to getting “Vengeance” through post-production was our centralized approach to file management. Files existed in Backblaze already, we simply brought Premiere Pro to the data rather than moving the huge amount of files to Premiere Pro via the Creative Cloud.
The mix of technologies lets us create a customized flow that works for us. Creative Cloud had the benefit of providing a project sharing mechanism, and Backblaze provided a method of sharing media (Synology and Cyberduck) regardless of the tooling each editor had.
Once we hit picture lock, the centralized files will serve as a distribution point for VFX, color, and sound, making turnover a breeze. It can even be used as a distribution hub—check out how American Public Television uses Backblaze to distribute their finished assets.
Centralizing in the cloud not only made it easy for me to work from home, it allowed us to collaborate on a project with ease eliminating the overhead of driving, shuttle drive delivery (Sneakernet 2.0), and version control. The best part? A workflow like this is affordable for any size production and can be set up in minutes.
Have you recently moved to a cloud workflow? Let us know what you’re using and how it went in the comments.
Amazon OpenSearch Serverless helps you index, analyze, and search your logs and data using OpenSearch APIs and dashboards. The OpenSearch Serverless collection is a group of indexes. API and dashboard clients can access the collections from public networks or one or more VPCs. For VPC access to collections and dashboards, you can create VPC endpoints. In this post, we demonstrate how you can create and use VPC endpoints and OpenSearch Serverless network policies to control access to your collections and OpenSearch dashboards from multiple network locations.
The demo in this post uses an AWS Lambda-based client in a VPC to ingest data into a collection via a VPC endpoint and a browser in a public network accessing the same collection.
Solution overview
To illustrate how you can ingest data into an OpenSearch Serverless collection from within a VPC, we use a Lambda function. We use a VPC-hosted Lambda function to create an index in an OpenSearch Serverless collection and add documents to the index using a VPC endpoint. We then use a publicly accessible OpenSearch Serverless dashboard to see the documents ingested from Lambda function.
The following sections detail the steps to ingest data into the collection using Lambda and access the OpenSearch Serverless dashboard.
Prerequisites
This setup assumes that you have already created a VPC with private subnets.
Ingest data using Lambda and access the OpenSearch Serverless dashboard
To set up your solution, complete the following steps:
On the OpenSearch Service console, create a private connection between your VPC and OpenSearch Serverless using a VPC endpoint. Use the private subnets and a security group from your VPC.
Create a network policy to enable VPC access to the OpenSearch endpoint so the Lambda function can ingest documents to the collection. You should also enable public access to the OpenSearch dashboard endpoint so we can see the documents ingested.
Additionally, grant read access to the dashboard user’s IAM role.
Add IAM permissions to the Lambda function’s IAM role and the dashboard user’s IAM role for the OpenSearch Serverless collection.
Create a Lambda function in the same VPC and subnet that we used for the OpenSearch endpoint (see the following code). This function creates an index called sitcoms-eighties in the OpenSearch Serverless collection and adds a sample document to the index:
import datetime
import time
from opensearchpy import OpenSearch, RequestsHttpConnection
from requests_aws4auth import AWS4Auth
import boto3

host = '<Insert-OpenSearch-Serverless-Endpoint>'
region = 'us-east-1'
service = 'aoss'
credentials = boto3.Session().get_credentials()
awsauth = AWS4Auth(credentials.access_key, credentials.secret_key, region, service,session_token=credentials.token)

# Build the OpenSearch client
client = OpenSearch(
    hosts=[{'host': host, 'port': 443}],
    http_auth=awsauth,
    use_ssl=True,
    verify_certs=True,
    connection_class=RequestsHttpConnection,
    timeout=300
)

def lambda_handler (event, context):

    # Create index
    response = client.indices.create('sitcoms-eighties')
    print('\nCreating index:')
    print(response)
    time.sleep(5)

    dt = datetime.datetime.now()
    # Add a document to the index.
    response = client.index(
        index='sitcoms-eighties',
        body={
            'title': 'Seinfeld',
            'creator': 'Larry David',
            'year': 1989,
            'createtime': dt
        },
        id='1',
    )
    print('\nDocument added:')
    print(response)
Run the Lambda function, and you should see the output as shown in the following screenshot.
You can now see the documents from this index through your publicly accessible OpenSearch Dashboards URL.
Create the index pattern in OpenSearch Dashboards, and then you can see the documents as shown in the following screenshot.
Use a VPC DNS resolver from your network
A client in your VPN network can connect to the collection or dashboards over a VPC endpoint. The client needs to find the VPC endpoint’s IP address using an Amazon Route 53 inbound resolver endpoint. To learn more about Route 53 inbound resolver endpoints, refer to Resolving DNS queries between VPCs and your network. The following diagram shows a sample setup.
The flow for this architecture is as follows:
The DNS query for the OpenSearch Serverless client is routed to a locally configured on-premises DNS server.
The on-premises DNS as configured performs conditional forwarding for the zone us-east-1.aoss.amazonaws.com to a Route 53 inbound resolver endpoint IP address. You must replace your Region name in the preceding zone name.
The inbound resolver endpoint performs DNS resolution by forwarding the query to the private hosted zone that was created along with the OpenSearch Serverless VPC endpoint.
The IP addresses returned by the DNS query are the private IP addresses of the interface VPC endpoint, which allow your on-premises host to establish private connectivity over AWS Site-to-Site VPN.
The interface endpoint is a collection of one or more elastic network interfaces with a private IP address in your account that serves as an entry point for traffic going to an OpenSearch Serverless endpoint.
Summary
OpenSearch Serverless allows you to set up and control access to the service using VPC endpoints and network policies. In this post, we explored how to access an OpenSearch Serverless collection API and dashboard from within a VPC, on premises, and public networks. If you have any questions or suggestions, please write to us in the comments section.
About the Authors
Raj Ramasubbu is a Senior Analytics Specialist Solutions Architect focused on big data and analytics and AI/ML with Amazon Web Services. He helps customers architect and build highly scalable, performant, and secure cloud-based solutions on AWS. Raj provided technical expertise and leadership in building data engineering, big data analytics, business intelligence, and data science solutions for over 18 years prior to joining AWS. He helped customers in various industry verticals like healthcare, medical devices, life science, retail, asset management, car insurance, residential REIT, agriculture, title insurance, supply chain, document management, and real estate.
Vivek Kansal works with the Amazon OpenSearch team. In his role as Principal Software Engineer, he uses his experience in the areas of security, policy engines, cloud-native solutions, and networking to help secure customer data in OpenSearch Service and OpenSearch Serverless in an evolving threat landscape.
The collective thoughts of the interwebz
Manage Consent
To provide the best experiences, we use technologies like cookies to store and/or access device information. Consenting to these technologies will allow us to process data such as browsing behavior or unique IDs on this site. Not consenting or withdrawing consent, may adversely affect certain features and functions.
Functional
Always active
The technical storage or access is strictly necessary for the legitimate purpose of enabling the use of a specific service explicitly requested by the subscriber or user, or for the sole purpose of carrying out the transmission of a communication over an electronic communications network.
Preferences
The technical storage or access is necessary for the legitimate purpose of storing preferences that are not requested by the subscriber or user.
Statistics
The technical storage or access that is used exclusively for statistical purposes.The technical storage or access that is used exclusively for anonymous statistical purposes. Without a subpoena, voluntary compliance on the part of your Internet Service Provider, or additional records from a third party, information stored or retrieved for this purpose alone cannot usually be used to identify you.
Marketing
The technical storage or access is required to create user profiles to send advertising, or to track the user on a website or across several websites for similar marketing purposes.


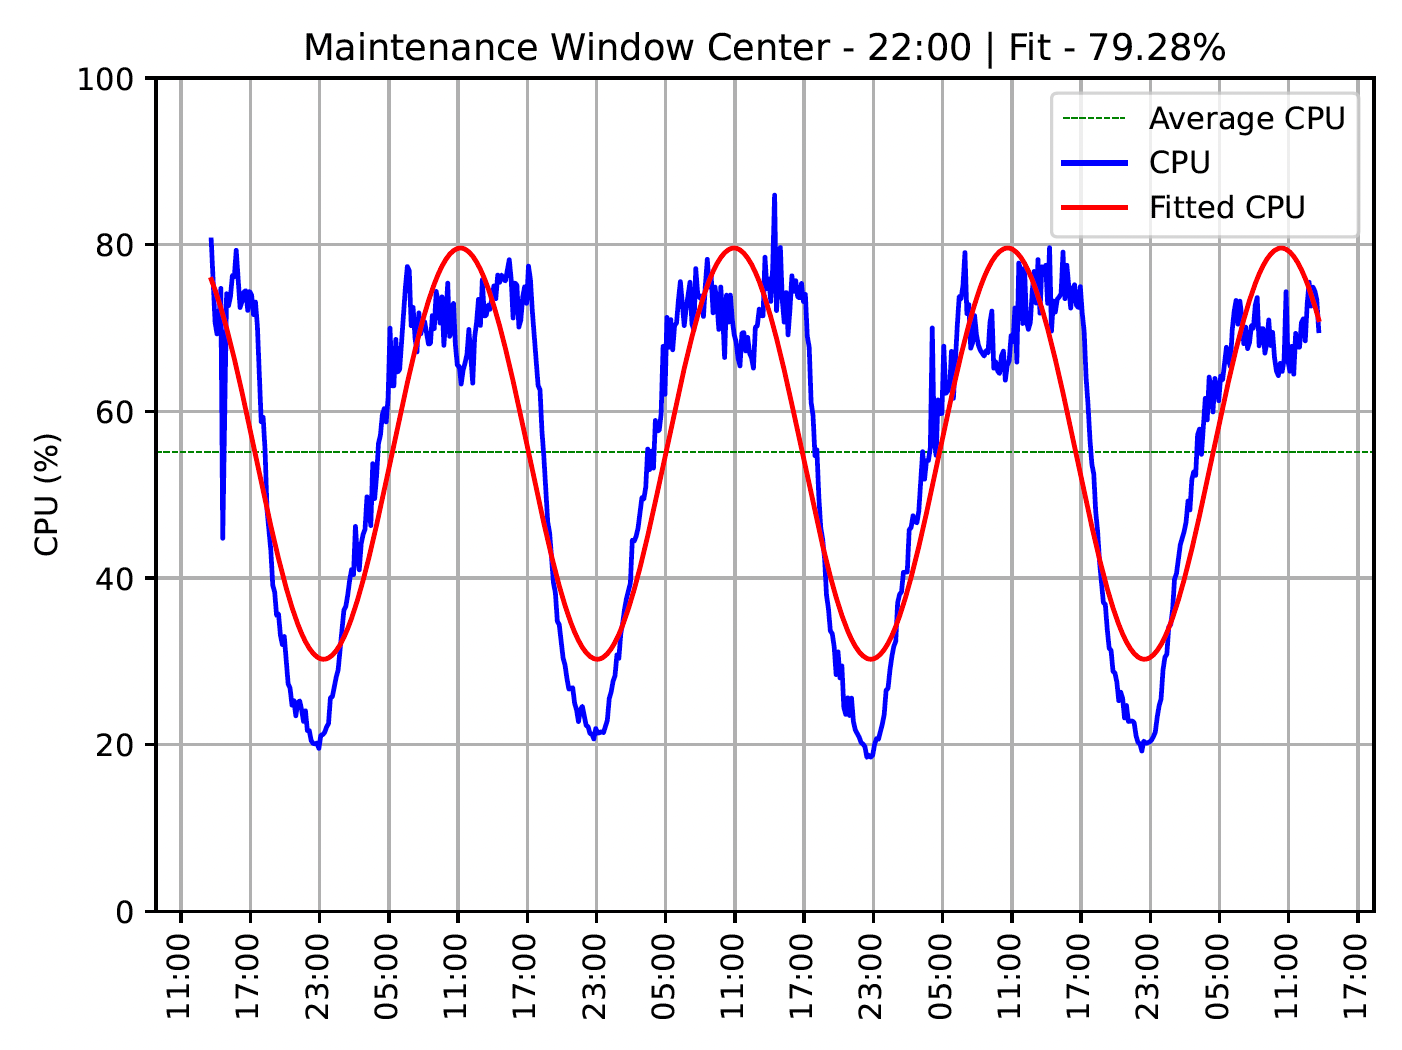
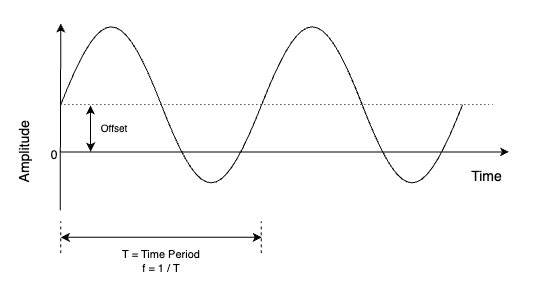
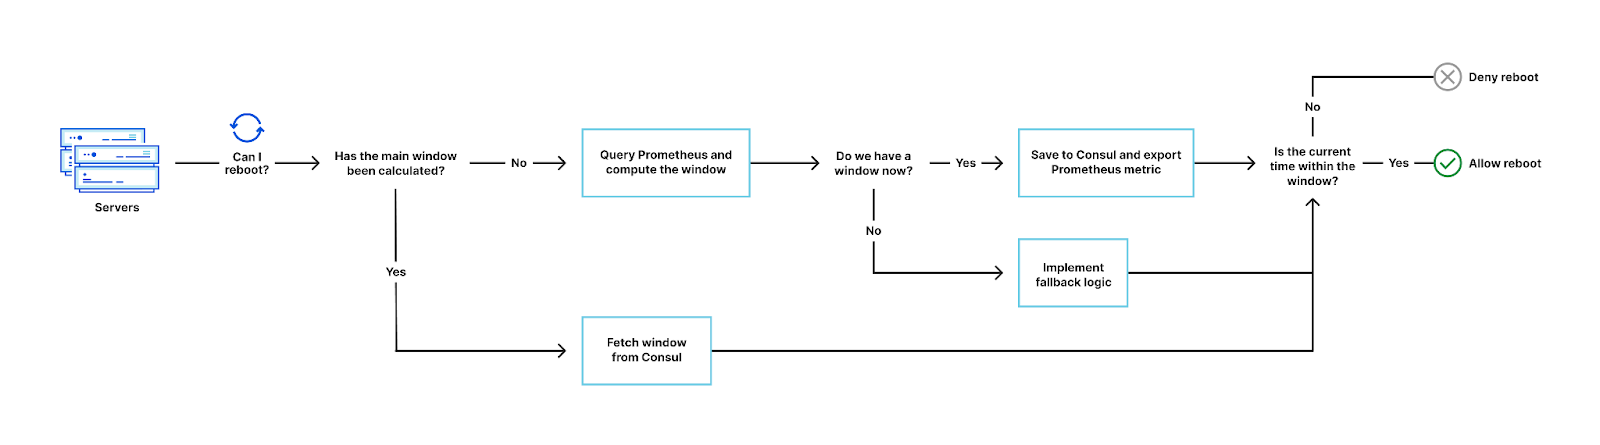

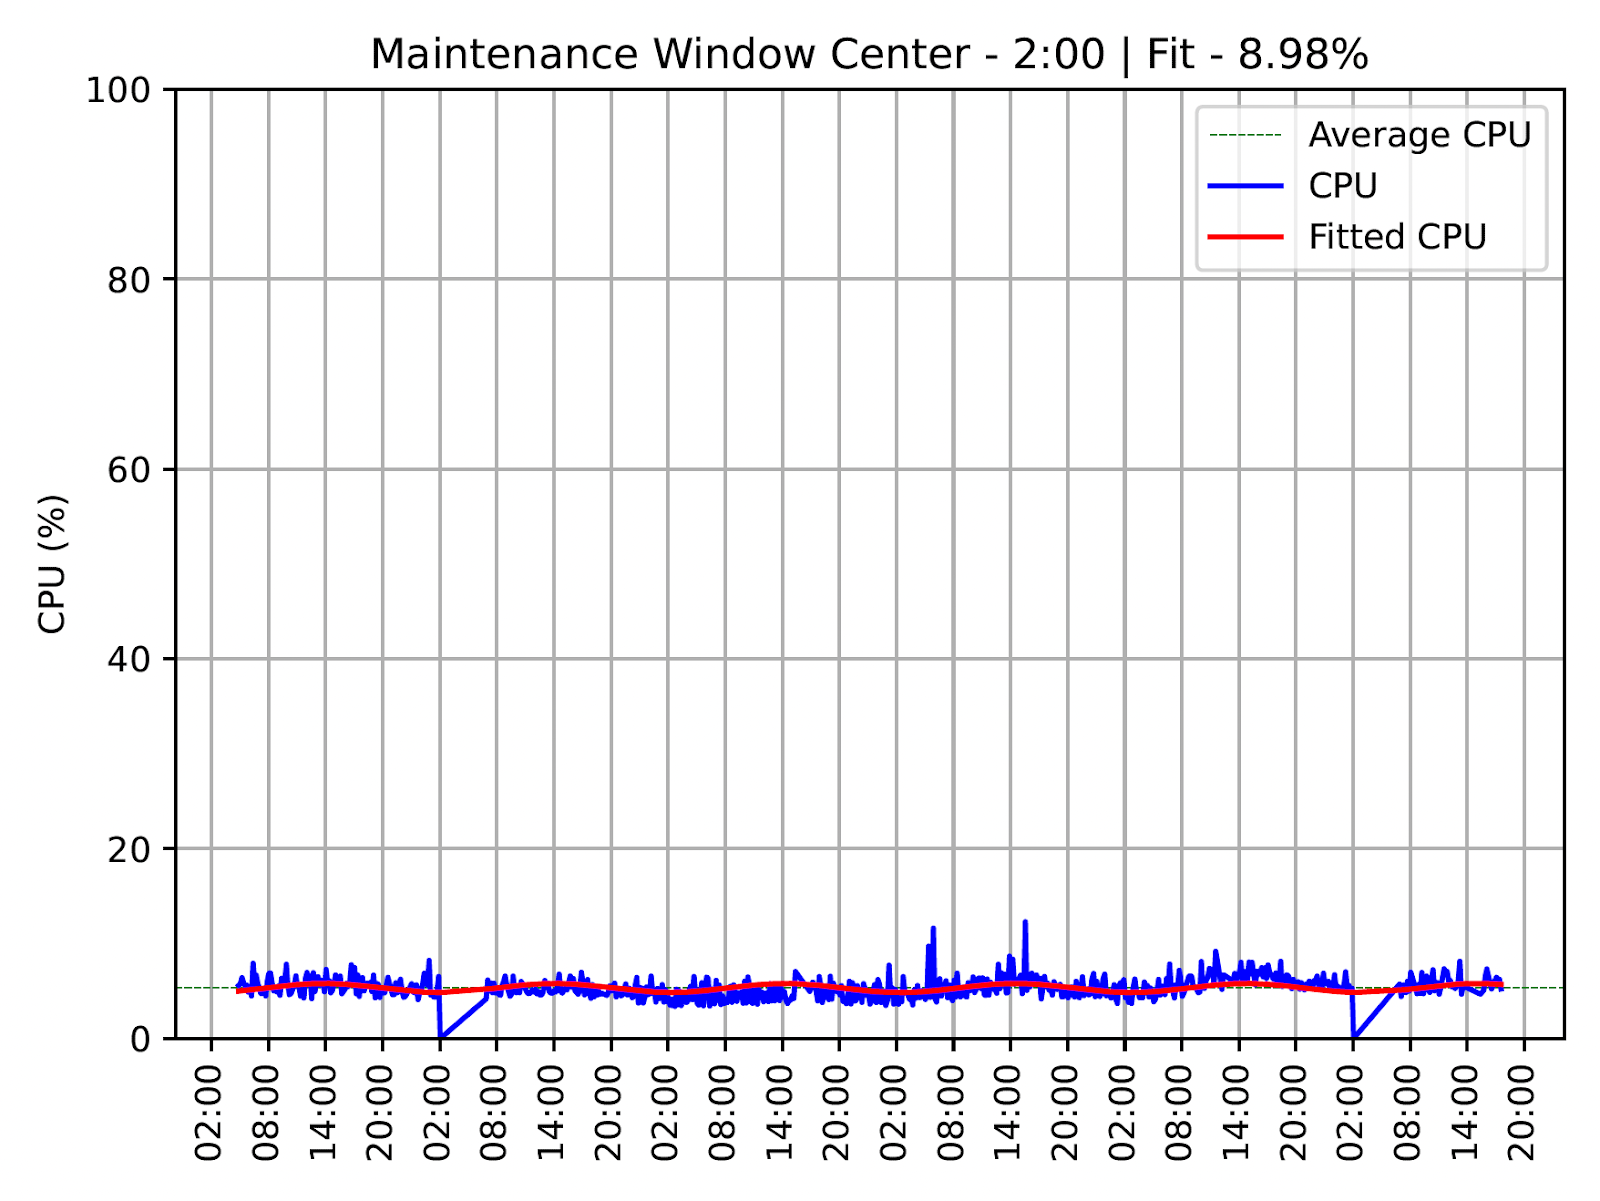
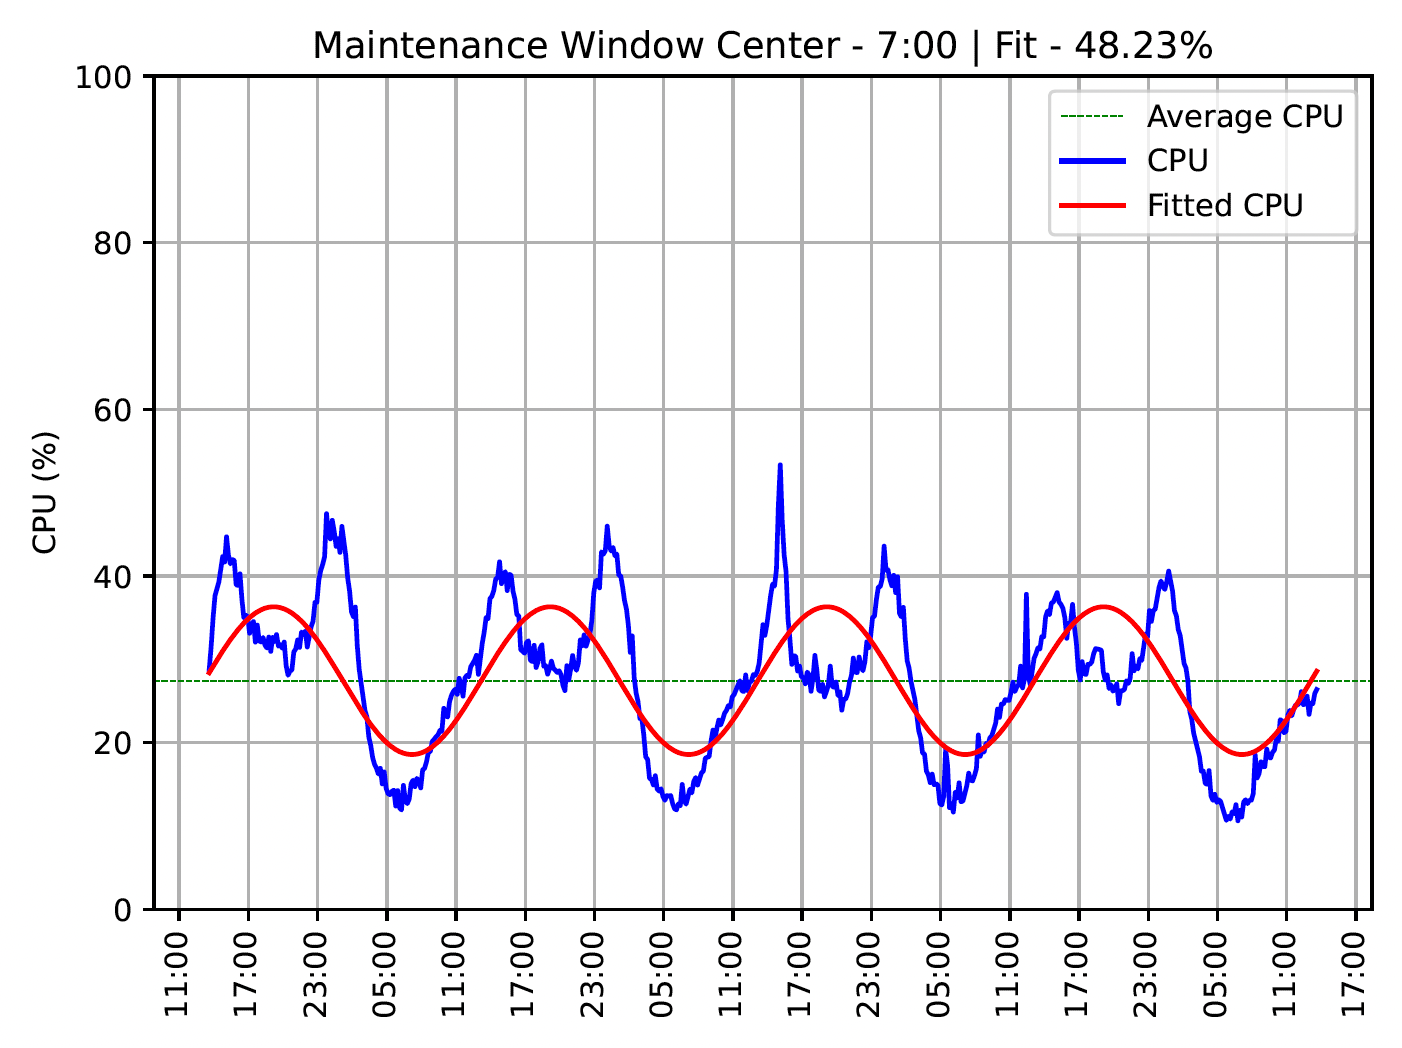
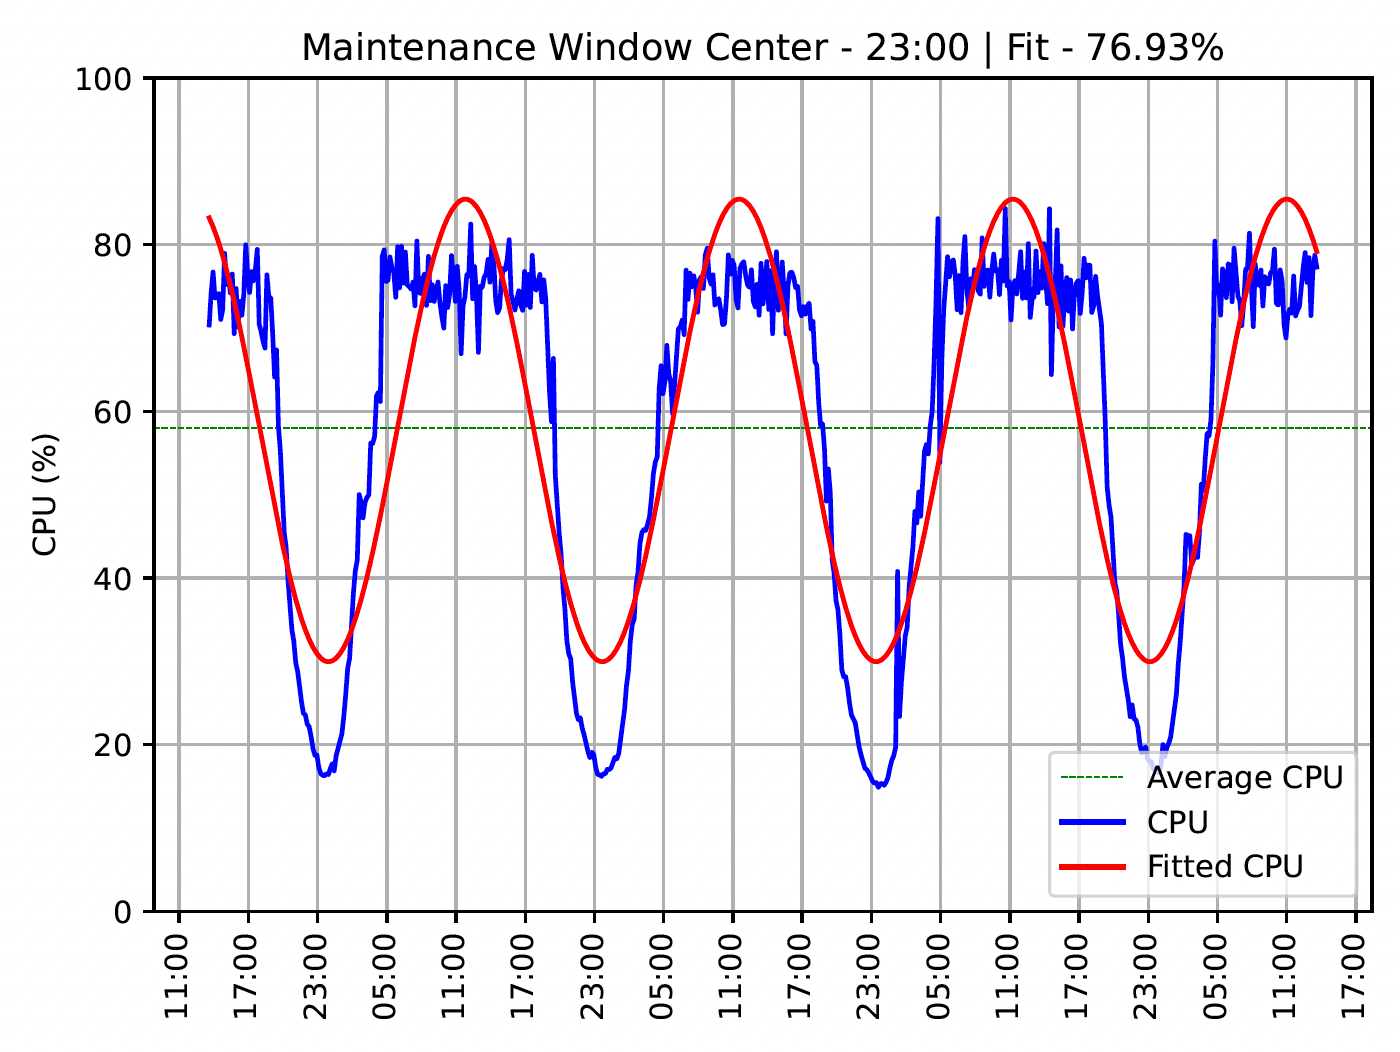



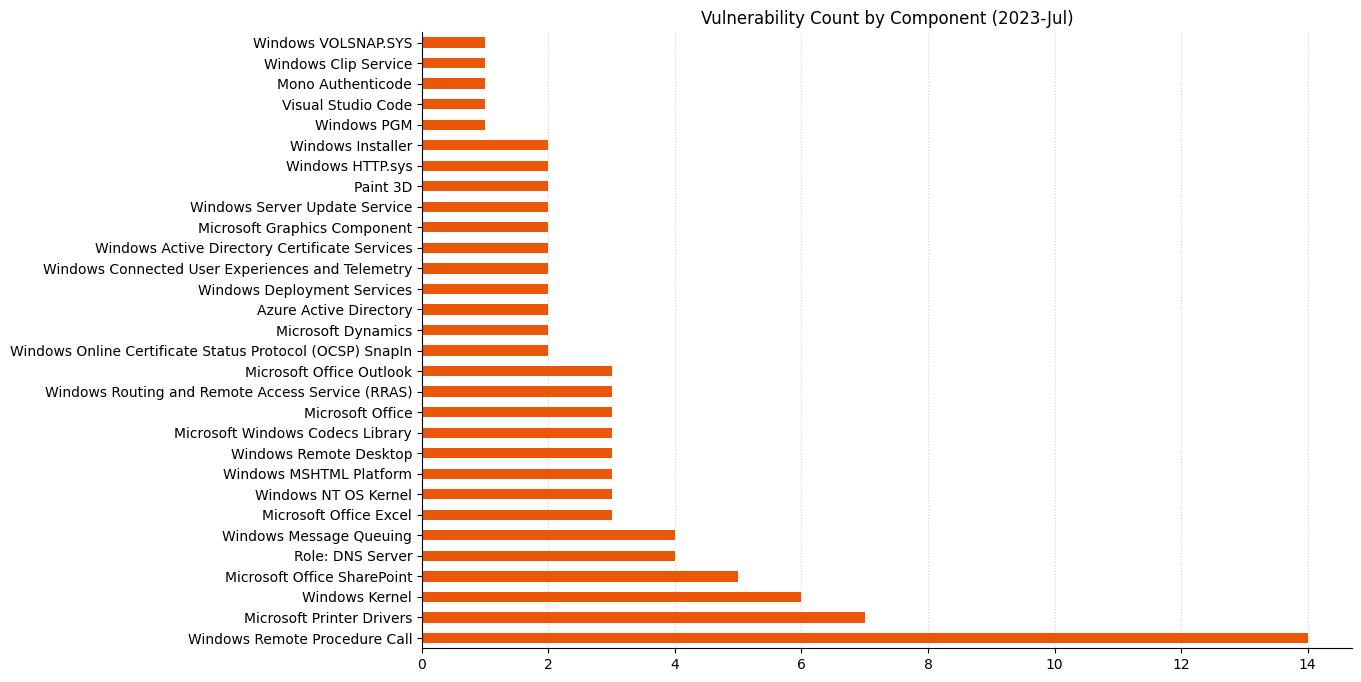
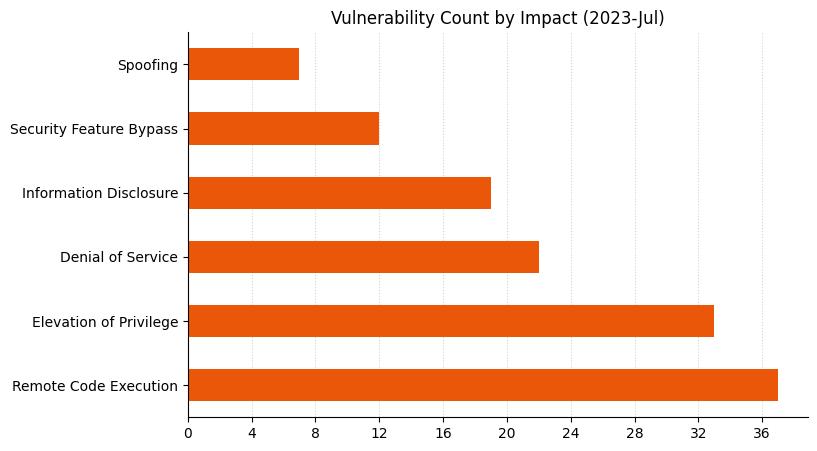
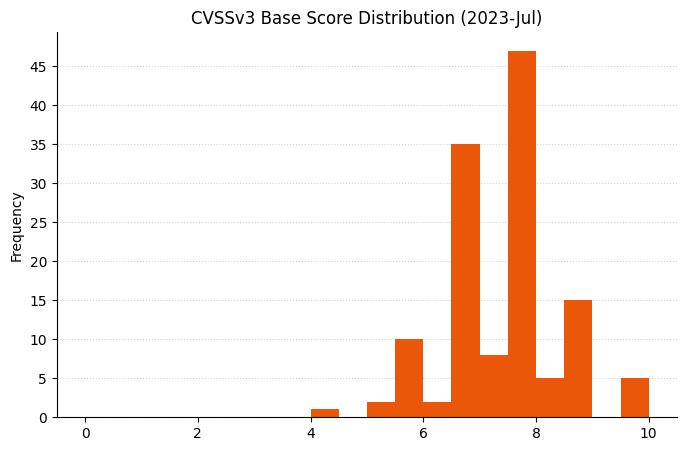
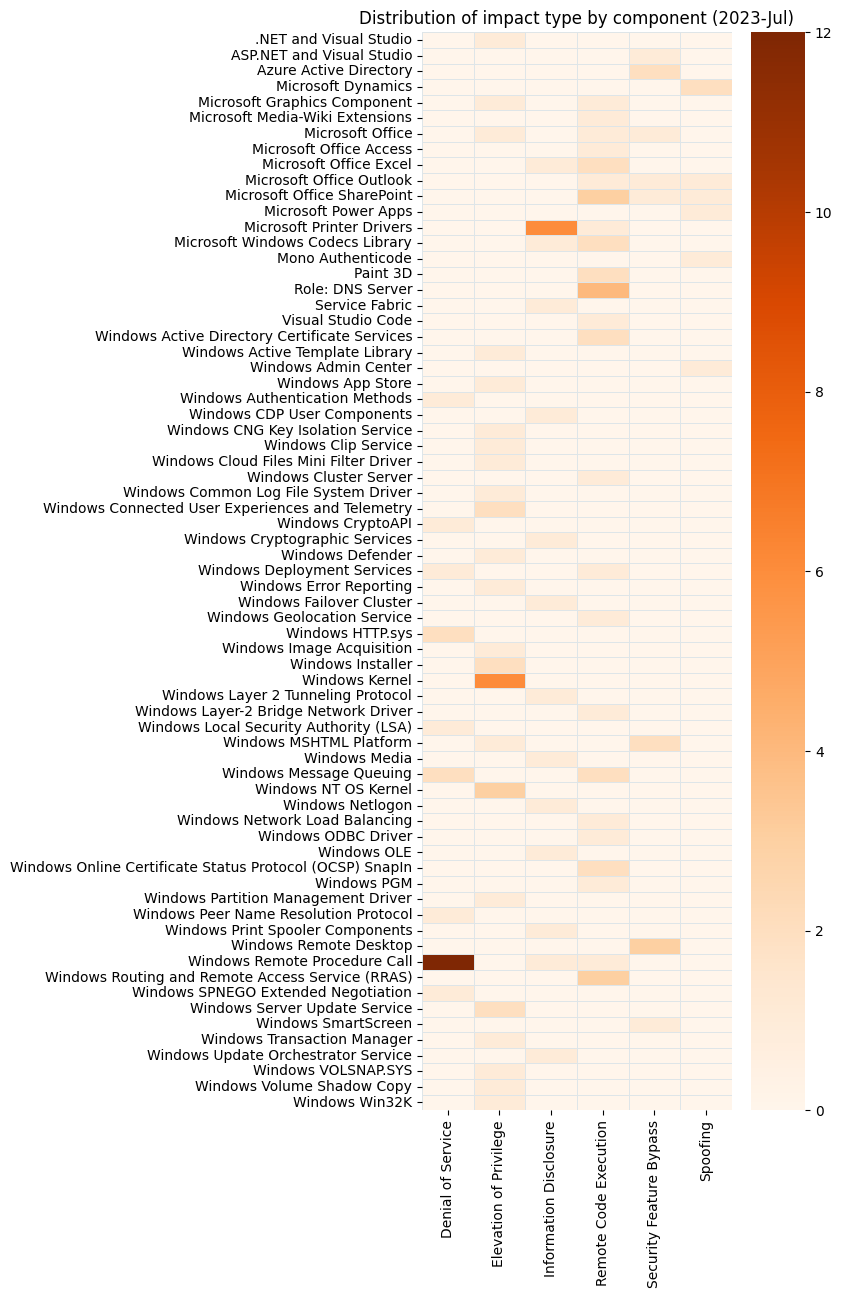


 Gonzalo Lezma is the Mexico Finance Manager for the Amazon LATAM Finance Team. He is a lifelong learner, tech and data lover.


 Raj Ramasubbu is a Senior Analytics Specialist Solutions Architect focused on big data and analytics and AI/ML with Amazon Web Services. He helps customers architect and build highly scalable, performant, and secure cloud-based solutions on AWS. Raj provided technical expertise and leadership in building data engineering, big data analytics, business intelligence, and data science solutions for over 18 years prior to joining AWS. He helped customers in various industry verticals like healthcare, medical devices, life science, retail, asset management, car insurance, residential REIT, agriculture, title insurance, supply chain, document management, and real estate.
 Vivek Kansal works with the Amazon OpenSearch team. In his role as Principal Software Engineer, he uses his experience in the areas of security, policy engines, cloud-native solutions, and networking to help secure customer data in OpenSearch Service and OpenSearch Serverless in an evolving threat landscape.