How to Use Veeam’s V12 Direct-to-Object Storage Feature

Post Syndicated from Kari Rivas original https://www.backblaze.com/blog/how-to-use-veeams-v12-direct-to-object-storage-feature/
A decorative image showing the word Veeam and a cloud with the Backblaze logo.

If you already use Veeam, you’re probably familiar with using object storage, typically in the cloud, as your secondary repository using Veeam’s Scale-Out Backup Repository (SOBR). But Veeam v12, released on February 14, 2023, introduced a new direct-to-object storage feature that expands the way enterprises can use cloud storage and on-premises object storage for data protection.

Today, I’m talking through some specific use cases as well as the benefits of the direct-to-object storage feature, including fortifying your 3-2-1 backup strategy, ensuring your business is optimizing your cloud storage, and improving cyber resilience.

Meet Us at VeeamON

We hope to see you at this year’s VeeamON conference. Here are some highlights you can look forward to:

  • Check out our breakout session “Build a DRaaS Offering at No Extra Cost” on Tuesday, May 23, 1:30 p.m. ET to create your affordable, right-sized disaster recovery plan.
  • Join our Miami Beach Pub Crawl with phoenixNAP Tuesday, May 23 at 6 p.m. ET.
  • Come by the Backblaze booth for demos, swag, and more. Don’t forget to book your meeting time.

The Basics of Veeam’s Direct-to-Object Storage

Veeam’s v12 release added the direct-to-object storage feature that allows you to add object storage as a primary backup repository. This object storage can be an on-premises object storage system like Pure Storage or Cloudian or a cloud object storage provider like Backblaze B2 Cloud Storage’s S3 compatible storage. You can configure the job to run as often as you would like, set your retention policy, and configure all the other settings that Veeam Backup & Replication provides.

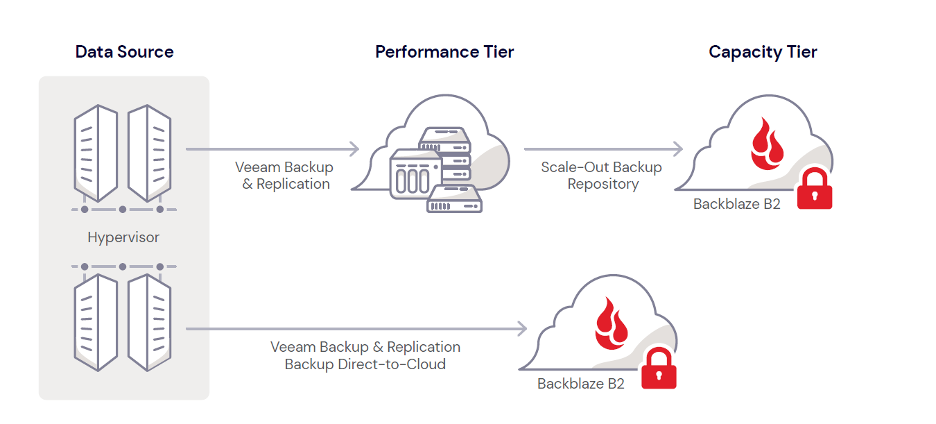
Prior to v12, you had to use Veeam’s SOBR to save data to cloud object storage. Setting up the SOBR requires you to first add a local storage component, called your Performance Tier, as a primary backup repository. You can then add a Capacity Tier where you can copy backups to cloud object storage via the SOBR. Your Capacity Tier can be used for redundancy and disaster recovery (DR) purposes, or older backups can be completely off-loaded to cloud storage to free up space on your local storage component.

The diagram below shows how both the SOBR and direct-to-object storage methods work. As you can see, with the direct-to-object feature, you no longer have to first land your backups in the Performance Tier before sending them to cloud storage.
Why Use Cloud Object Storage With Veeam?

On-premises object storage systems can be a great resource for storing data locally and achieving the fastest recoveries, but they’re expensive especially if you’re maintaining capacity to store multiple copies of your data, and they’re still vulnerable to on-site disasters like fire, flood, or tornado. Cloud storage allows you to keep a backup copy in an off-site, geographically distanced location for DR purposes.

Additionally, while local storage will provide the fastest recovery time objective (RTO), cloud object storage can be effective in the case of an on-premises disaster as it serves the dual purpose of protecting your data and being off-site.

To be clear, the addition of direct-to-object storage doesn’t mean you should immediately abandon your SOBR jobs or your on-premises devices. The direct-to-object storage feature gives you more options and flexibility, and there are a few specific use cases where it works particularly well, which I’ll get into later.

How to Use Veeam’s Direct-to-Object Storage Feature

With v12, you can now use Veeam’s direct-to-object storage feature in the Performance Tier, the Capacity Tier, or both. To understand how to use the direct-to-object storage feature to its full potential, you need to understand the implications of using object storage in your different tiers. I’ll walk through what that means.

Using Object Storage in Veeam’s Performance Tier

In earlier versions of Veeam’s backup software, the SOBR required the Performance Tier to be an on-premises storage device like a network attached storage (NAS) device. V12 changed that. You can now use an on-premises system or object storage, including cloud storage, as your Performance Tier.

So, why would you want to use cloud object storage, specifically Backblaze B2, as your Performance Tier?

  • Scalability: With cloud object storage as your Performance Tier, you no longer have to worry about running out of storage space on your local device.
  • Immutability: By enabling immutability on your Veeam console and in your Backblaze B2 account (using Object Lock), you can prevent your backups from being corrupted by a ransomware network attack like they might be if your Performance Tier was a local NAS.
  • Security: By setting cloud storage as your Performance Tier in the SOBR, you remove the threat of your backups being affected by a local disaster. With your backups safely protected off-site and geographically distanced from your primary business location, you can rest assured they are safe even if your business is affected by a natural disaster.

Understandably, some IT professionals prefer to keep on-premises copies of their backups because they offer the shortest RTO, but for many organizations, the pros of using cloud storage in the Performance Tier can outweigh the slightly longer RTO.

Using Object Storage in the Performance AND Capacity Tiers

If you’re concerned about overreliance on cloud storage but also feeling eager to eliminate often unwieldy, expensive, space-consuming physical local storage appliances, consider that Veeam v12 allows you to set cloud object storage as both your Performance and Capacity tier, which could add redundancy to ease your worries.

For instance, you could follow this approach:

  1. Create a Backblaze B2 Bucket in one region and set that as your primary repository using the SOBR.
  2. Send your Backup Jobs to that bucket (and make it immutable) as often as you would like.
  3. Create a second Backblaze B2 account with a bucket in a different region, and set it as your secondary repository.
  4. Create Backup Copy Jobs to replicate your data to that second region for added redundancy.

This may ease your concerns about using the cloud as the sole location for your backup data, as having two copies of your data—in geographically disparate regions—satisfies the 3-2-1 rule (since, even though you’re using one cloud storage service, the two backup copies of your data are kept in different locations.

Refresher: What is the 3-2-1 Backup Strategy?

A 3-2-1 strategy means having at least three total copies of your data, two of which are local but on different media, and at least one off-site copy (in the cloud).

Use Cases for Veeam’s Direct-to-Object Storage Feature

Now that you know how to use Veeam’s direct-to-object storage feature, you might be wondering what it’s best suited to do. There are a few use cases where Veeam’s direct-to-object storage feature really shines, including:

  • In remote offices
  • For NAS backup
  • For end-to-end immutability
  • For Veeam Cloud and Service Providers (VCSP)

Using Direct-to-Object Storage in Remote Offices

The new functionality works well to support distributed and remote work environments.

Veeam had the ability to back up remote offices in v11, but it was unwieldy. When you wanted to back up the remote office, you had to back up the remote office to the main office, where the primary on-premises instance of Veeam Backup & Replication is installed, then use the SOBR to copy the remote office’s data to the cloud. This two-step process puts a strain on the main office network. With direct-to-object storage, you can still use a SOBR for the main office, and remote offices with smaller IT footprints (i.e. no on-premises device on which to create a Performance Tier) can send backups directly to the cloud.

If the remote office ever closes or suffers a local disaster, you can bring up its virtual machines (VMs) at the main office and get back in business quickly.

Using Direct-to-Object Storage for NAS Backup

NAS devices are often used as the Performance Tier for backups in the SOBR, and a business using a NAS may be just as likely to be storing its production data on the same NAS. For instance, a video production company might store its data on a NAS because it likes how easily a NAS incorporates into its workflows. Or a remote office branch may be using a NAS to store its data and make it easily accessible to the employees at that location.

With v11 and earlier versions, your production NAS had to be backed up to a Performance Tier and then to the cloud. And, with many Veeam users utilizing a NAS as their Performance Tier, this meant you had a NAS backing up to …another NAS, which made no sense.

For media and entertainment professionals in the field or IT administrators at remote offices, having to back up the production NAS to the main office (wherever that is located) before sending it to the cloud was inconvenient and unwieldy.

With v12, your production NAS can be backed up directly to the cloud using Veeam’s direct-to-object storage feature.

Direct-to-Object Storage for End-to-End Immutability

As I mentioned, previous versions of Veeam required you to use local storage like a NAS as the Performance Tier in your SOBR, but that left your data vulnerable to security attacks. Now, with direct-to-object storage functionality, you can achieve an end-to-end immutability. Here’s how:

  • In the SOBR, designate an on-premises appliance that supports immutability as your primary repository (Performance Tier). Cloudian and Pure Storage are popular names to consider here.
  • Set cloud storage like Backblaze B2 as your secondary repository (Capacity Tier).
  • Enable Object Lock for immutability in your Backblaze B2 account and set the date of your lock.

With this setup, you check a lot of boxes:

  • You fulfill a 3-2-1 backup strategy.
  • Both your local data and your off-site data are protected from deletion, encryption, or modification.
  • Your infrastructure is provisioned for the fastest RTO with your local storage.
  • You’ve also fully protected your data—including your local copy—from a ransomware attack.

Immutability for NAS Data in the Cloud

Backing up your NAS straight to the cloud with Veeam’s direct-to-object storage feature means you can enable immutability using the Veeam console and Object Lock in Backblaze B2. Few NAS devices natively support immutability, so using Veeam and B2 Cloud Storage to back up your NAS offers all the benefits of secure, off-site backup plus protection from ransomware.

Direct-to-Object Storage for VCSPs

The direct-to-object storage feature also works well for VCSPs. It changes how VCSPs use Cloud Connect, Veeam’s offering for service partners. A VCSP can send customer backups straight to the cloud instead of first sending them to the VCSP’s own systems.

Veeam V12 and Cyber Resiliency

When it comes to protecting your data, ultimately, you want to make the decision that best meets your business continuity and cyber resilience requirements. That means ensuring you not only have a sound backup strategy, but that you also consider what your data restoration process will look like during an active security incident (because a security incident is more likely to happen than not).

Veeam’s direct-to-object storage feature gives you more options for establishing a backup strategy that meets your RTO and DR requirements while also staying within your budget and allowing you to use the most optimal and preferred kind of storage for your use case.

Veeam + Backblaze: Now Even Easier

Get started today for $5/TB per month, pay-as-you-go cloud storage. Or contact your favorite reseller, like CDW or SHI to purchase Backblaze via B2 Reserve, our all-inclusive, capacity-based bundles.

The post How to Use Veeam’s V12 Direct-to-Object Storage Feature appeared first on Backblaze Blog | Cloud Storage & Cloud Backup.

New MikroTik L009UiGS-2HaxD-IN Updates the Low-Cost RB2011 RouterBoard Series

Post Syndicated from Rohit Kumar original https://www.servethehome.com/new-mikrotik-l009uigs-2haxd-in-updates-the-low-cost-rb2011-routerboard-series/

The MikroTik RB2011 series is super popular, but the new MikroTik L009UiGS-2HaxD-IN is designed to replace the aging low-cost stalwart router

The post New MikroTik L009UiGS-2HaxD-IN Updates the Low-Cost RB2011 RouterBoard Series appeared first on ServeTheHome.

[$] Reconsidering the direct-map fragmentation problem

Post Syndicated from original https://lwn.net/Articles/931406/

Mike Rapoport has put a considerable amount of effort into solving the
problem of direct-map fragmentation over the years; this has resulted in
proposals like __GFP_UNMAPPED and
a session at the 2022 Linux Storage,
Filesystem, Memory-Management, and BPF Summit. Rapoport returned at the 2023 Summit to revisit this issue, but he
started with a somewhat surprising spoiler.

[$] A storage standards update at LSFMM+BPF

Post Syndicated from original https://lwn.net/Articles/931282/

Storage technology may seem like a slow-moving area, but there is, instead,
a lot of development activity happening there. An early session at the
2023 Linux Storage, Filesystem,
Memory-management and BPF Summit
,
led by Martin Petersen and Vincent Haché, updated the assembled group on
the latest changes to the storage landscape, with an emphasis on the
Compute Express Link (CXL) 3.0 specification.

Security updates for Thursday

Post Syndicated from original https://lwn.net/Articles/931638/

Security updates have been issued by Debian (firefox-esr and nvidia-graphics-drivers-legacy-390xx), Fedora (firefox, java-11-openjdk, LibRaw, moodle, python-django3, and vtk), Slackware (mozilla), SUSE (buildah, cloud-init, container-suseconnect, firefox, golang-github-prometheus-prometheus, kernel, and ntp), and Ubuntu (heat, linux-azure-fde-5.15, linux-raspi, linux-oem-5.17, linux-oem-6.0, linux-raspi, linux-raspi-5.4, linux-raspi2, neutron, openvswitch, and sqlparse).

Catanzaro: GNOME Core Apps Update

Post Syndicated from original https://lwn.net/Articles/931586/

Michael Catanzaro has posted an
update
on the state of the GNOME core apps collection and the process
used to make changes to it.

Although most of the core app changes have gone smoothly, we ran
into some trouble replacing Terminal with Console. Console provides
a fresher and simpler user interface on top of vte, the same
terminal backend used by Terminal, so Console and Terminal share
much of the same underlying functionality. This means work of the
Terminal maintainers is actually key to the success of
Console. Using a new terminal app rather than evolving Terminal
allowed for bigger changes to the default user experience without
upsetting users who prefer the experience provided by Terminal. I
think Console is generally nicer than Terminal, but it is missing a
few features that Fedora Workstation developers thought were
important to have before replacing Terminal with Console. Long
story short: this core app change was effectively rejected by one
of our most important downstreams. Since then, Console has not seen
very much development.

Building Trustworthy AI

Post Syndicated from Bruce Schneier original https://www.schneier.com/blog/archives/2023/05/building-trustworthy-ai.html

We will all soon get into the habit of using AI tools for help with everyday problems and tasks. We should get in the habit of questioning the motives, incentives, and capabilities behind them, too.

Imagine you’re using an AI chatbot to plan a vacation. Did it suggest a particular resort because it knows your preferences, or because the company is getting a kickback from the hotel chain? Later, when you’re using another AI chatbot to learn about a complex economic issue, is the chatbot reflecting your politics or the politics of the company that trained it?

For AI to truly be our assistant, it needs to be trustworthy. For it to be trustworthy, it must be under our control; it can’t be working behind the scenes for some tech monopoly. This means, at a minimum, the technology needs to be transparent. And we all need to understand how it works, at least a little bit.

Amid the myriad warnings about creepy risks to well-being, threats to democracy, and even existential doom that have accompanied stunning recent developments in artificial intelligence (AI)—and large language models (LLMs) like ChatGPT and GPT-4—one optimistic vision is abundantly clear: this technology is useful. It can help you find information, express your thoughts, correct errors in your writing, and much more. If we can navigate the pitfalls, its assistive benefit to humanity could be epoch-defining. But we’re not there yet.

Let’s pause for a moment and imagine the possibilities of a trusted AI assistant. It could write the first draft of anything: emails, reports, essays, even wedding vows. You would have to give it background information and edit its output, of course, but that draft would be written by a model trained on your personal beliefs, knowledge, and style. It could act as your tutor, answering questions interactively on topics you want to learn about—in the manner that suits you best and taking into account what you already know. It could assist you in planning, organizing, and communicating: again, based on your personal preferences. It could advocate on your behalf with third parties: either other humans or other bots. And it could moderate conversations on social media for you, flagging misinformation, removing hate or trolling, translating for speakers of different languages, and keeping discussions on topic; or even mediate conversations in physical spaces, interacting through speech recognition and synthesis capabilities.

Today’s AIs aren’t up for the task. The problem isn’t the technology—that’s advancing faster than even the experts had guessed—it’s who owns it. Today’s AIs are primarily created and run by large technology companies, for their benefit and profit. Sometimes we are permitted to interact with the chatbots, but they’re never truly ours. That’s a conflict of interest, and one that destroys trust.

The transition from awe and eager utilization to suspicion to disillusionment is a well worn one in the technology sector. Twenty years ago, Google’s search engine rapidly rose to monopolistic dominance because of its transformative information retrieval capability. Over time, the company’s dependence on revenue from search advertising led them to degrade that capability. Today, many observers look forward to the death of the search paradigm entirely. Amazon has walked the same path, from honest marketplace to one riddled with lousy products whose vendors have paid to have the company show them to you. We can do better than this. If each of us are going to have an AI assistant helping us with essential activities daily and even advocating on our behalf, we each need to know that it has our interests in mind. Building trustworthy AI will require systemic change.

First, a trustworthy AI system must be controllable by the user. That means that the model should be able to run on a user’s owned electronic devices (perhaps in a simplified form) or within a cloud service that they control. It should show the user how it responds to them, such as when it makes queries to search the web or external services, when it directs other software to do things like sending an email on a user’s behalf, or modifies the user’s prompts to better express what the company that made it thinks the user wants. It should be able to explain its reasoning to users and cite its sources. These requirements are all well within the technical capabilities of AI systems.

Furthermore, users should be in control of the data used to train and fine-tune the AI system. When modern LLMs are built, they are first trained on massive, generic corpora of textual data typically sourced from across the Internet. Many systems go a step further by fine-tuning on more specific datasets purpose built for a narrow application, such as speaking in the language of a medical doctor, or mimicking the manner and style of their individual user. In the near future, corporate AIs will be routinely fed your data, probably without your awareness or your consent. Any trustworthy AI system should transparently allow users to control what data it uses.

Many of us would welcome an AI-assisted writing application fine tuned with knowledge of which edits we have accepted in the past and which we did not. We would be more skeptical of a chatbot knowledgeable about which of their search results led to purchases and which did not.

You should also be informed of what an AI system can do on your behalf. Can it access other apps on your phone, and the data stored with them? Can it retrieve information from external sources, mixing your inputs with details from other places you may or may not trust? Can it send a message in your name (hopefully based on your input)? Weighing these types of risks and benefits will become an inherent part of our daily lives as AI-assistive tools become integrated with everything we do.

Realistically, we should all be preparing for a world where AI is not trustworthy. Because AI tools can be so incredibly useful, they will increasingly pervade our lives, whether we trust them or not. Being a digital citizen of the next quarter of the twenty-first century will require learning the basic ins and outs of LLMs so that you can assess their risks and limitations for a given use case. This will better prepare you to take advantage of AI tools, rather than be taken advantage by them.

In the world’s first few months of widespread use of models like ChatGPT, we’ve learned a lot about how AI creates risks for users. Everyone has heard by now that LLMs “hallucinate,” meaning that they make up “facts” in their outputs, because their predictive text generation systems are not constrained to fact check their own emanations. Many users learned in March that information they submit as prompts to systems like ChatGPT may not be kept private after a bug revealed users’ chats. Your chat histories are stored in systems that may be insecure.

Researchers have found numerous clever ways to trick chatbots into breaking their safety controls; these work largely because many of the “rules” applied to these systems are soft, like instructions given to a person, rather than hard, like coded limitations on a product’s functions. It’s as if we are trying to keep AI safe by asking it nicely to drive carefully, a hopeful instruction, rather than taking away its keys and placing definite constraints on its abilities.

These risks will grow as companies grant chatbot systems more capabilities. OpenAI is providing developers wide access to build tools on top of GPT: tools that give their AI systems access to your email, to your personal account information on websites, and to computer code. While OpenAI is applying safety protocols to these integrations, it’s not hard to imagine those being relaxed in a drive to make the tools more useful. It seems likewise inevitable that other companies will come along with less bashful strategies for securing AI market share.

Just like with any human, building trust with an AI will be hard won through interaction over time. We will need to test these systems in different contexts, observe their behavior, and build a mental model for how they will respond to our actions. Building trust in that way is only possible if these systems are transparent about their capabilities, what inputs they use and when they will share them, and whose interests they are evolving to represent.

This essay was written with Nathan Sanders, and previously appeared on Gizmodo.com.

Микродозирането и някои макротеми, свързани с него

Post Syndicated from Мария П. Василева original https://www.toest.bg/mikrodoziraneto-i-nyakoi-makrotemi-svurzani-s-nego/

Микродозирането и някои макротеми, свързани с него

През последните няколко години в западната преса се нароиха като гъби статии за микродозирането – нова пресечна точка между наркопазара и лъскавия свят на уелнес индустрията. Към това се добавя и все по-честото отразяване на терапевтичните свойства на халюциногените и психеделиците в документални и художествени филми и сериали. Практиката явно набира популярност извън обичайните субкултури, които редовно използват нелегални субстанции.

Терминът „микродозиране“ влиза в по-широка употреба през 2011 г. с книгата „Пътеводител на психеделичния откривател“ (The Psychedelic Explorer's Guide) на Джеймс Фадиман, която подробно описва ползите и принципите на практиката и събира личните разкази на малка група хора, експериментиращи с микродозиране и доволни от ефекта му – подобрено настроение, енергия, концентрация, отношения с близките. През 2015 г. списание Rolling Stone отразява нарастващата тенденция и цитира Фадиман, който описва микродозирането като все по-популярен феномен сред програмистите в Силициевата долина.

Какво е микродозиране?

Това е редовен прием с терапевтична цел на много малки количества халюциногени – най-често класически психеделици, като псилоцибин (активна съставка на магическите гъби), LSD¹ или DMT² (активна съставка в аяуаската³), но също кетамин⁴ или психоактивни канабиноиди⁵. Става дума за психотропни вещества, които иначе се приемат в по-големи количества с цел цялостна промяна на действието на сетивата и временно отдалечаване от твърдата почва на реалността.

Микродозирането обаче цели ефектът на веществото да остане под халюциногенния праг – тоест да не предизвика халюцинации и да не повлияе силно на сетивата, но все пак да подейства на рецепторите за серотонин в мозъка, които са важна част от системата за регулация на човешкото тяло. Докато един стандартен гъбен „трип“ е резултат от консумацията на около 35 мг псилоцибин (съдържанието на около 3 г сушени халюциногенни гъби), средната микродоза е около 1–2 мг.

Има и междинна степен: дозата около 10 мг шеговито се нарича „музеен трип“, защото е достатъчно силна, за да предизвика лека версия на желаните сетивни халюцинации, но все пак позволява на пациента да общува със заобикалящия го свят – например да се разходи из най-близкия музей, – без да се набива на очи със странното си поведение. А при по-големи дози халюциногените могат да доведат и до т.нар. смърт на егото – мистично преживяване, в което пациентът психонавт губи усещане за границите на собствената си личност и вместо това се приобщава към нещо по-голямо и често непонятно за трезвеното съзнание.

Макро- или микротерапевтичен потенциал?

За да разберем новата мода на микродозирането, трябва първо да разгледаме терапевтичния потенциал на макродозирането – с други думи, ползите от старомодния халюциногенен трип. С възобновяването на клиничните изследвания на вещества като псилоцибина и LSD, които зачестяват през последното десетилетие, се появиха и обещаващи резултати в лечението на депресия и тревожност (включително при пациенти в последен стадий на нелечими заболявания), посттравматичен стрес, зависимост от пристрастяващи вещества (включително алкохол и никотин), мигрени и клъстерно главоболие, а също така станаха ясни потенциалните ползи от активните вещества на халюциногените върху невровъзпалителни процеси в тялото.

Част от проучванията са резултат от примирието на този фронт във войната срещу наркотиците в САЩ. Съвременните изследвания стъпват върху основите на проучвания от 50-те и 60-те години, които тогава биват прекъснати от реакционната политика на президента Ричард Никсън срещу антивоенната контракултура и движенията за граждански права.

Преразказани на ненаучен език, изследванията показват, че една обикновена (тоест халюциногенна) доза псилоцибин или LSD води до трайното създаване на нови невронни връзки в мозъка и увеличава неговата невропластичност. Изображения на мозъчната дейност по време на халюциногенен трип, получени от ядрено-магнитен резонанс, показват, че се потиска дейността на т.нар. мрежа за пасивен режим на работа на мозъка (default mode network). Това са свързани области в мозъка, които са активни, когато човек не е съсредоточен върху задача от външния свят, и чиято дейност също се активира при мисли за себе си, за други хора, за собственото минало и бъдеще.

Същевременно под влияние на халюциногените се наблюдава и активност между центрове на мозъка, които обикновено не си общуват. Способността на мозъка да филтрира и ограничава входящата информация от сетивата намалява, затова цветовете са по-ярки, очертанията на предметите – по-размити, звуците – по-силни и живи. Намалява и способността това преживяване да се интерпретира спрямо привичните мисли и схеми на индивидуалната психика. Терапевтичният ефект остава дълго след приключването на самия трип и се описва като облекчаване на обичайните тревожни или потискащи мисли, намалено желание за консумация на пристрастяващи вещества и възобновен интерес към външния свят.

Теорията зад микродозирането е, че тези ефекти на халюциногените – невропластичност, възможност за превъзмогване на тежки психически и емоционални състояния – се активират и при приема на много малки количества от същото вещество. Микродозите трябва да са достатъчно малки, за да не влияят силно на сетивата, но все пак да могат да въздействат на рецепторите за серотонин в мозъка и на мозъчната дейност. Микродозата, разбира се, не води до внушителни промени в психиката след еднократен прием. Целта ѝ е дългосрочно да подпомогне психическото здраве на пациента, като е добре да се комбинира и с други терапевтични практики.

Официалните клинични изследвания на ефекта от микродозирането засега не са толкова еднозначни, колкото тези за стандартните дози халюциногени. Проведените досега проучвания са малко на брой и не отчитат особено силен ефект. Методиката им обаче не съответства на начина, по който повечето доброволци подхождат към микродозирането – разглеждат се ефектите от няколко на брой малки дози в сляпо проучване, а не от редовен дългосрочен прием.

За сметка на това анкети, съставени от университетски изследователи и проведени сред посетителите на интернет форуми за микродозиране, показват, че практиката има редица положителни ефекти върху психическото здраве, енергия и общо благосъстояние и че тези ефекти са трайни при дългосрочен прием. И все пак популярността на микродозирането усложнява обективното му научно изследване – все повече хора попадат на информация за тази практика и подхождат към нея с огромни очаквания, което създава т.нар. позитивно пристрастие и може би влияе на описаните ефекти.

Важен елемент и от макродозирането, и от микродозирането с терапевтична цел са съпътстващите техники за интеграция на преживяването. При макродозирането в медицински контекст лекарите и терапевтите провеждат разговори с пациента преди, след и по време на лечението, като му помагат да осмисли своя лечебен трип.

При микродозирането се препоръчва комбинация с разговорна терапия, медитация или дихателни упражнения, водене на дневник или други техники за ума и тялото, които да помогнат на пациента да забележи промените в психическото си състояние и да насочи съзнанието си в желаната посока. Микродозирането е помощно средство и част от комплекс терапевтични дейности, които се подпомагат от свойствата на халюциногените да повишават невропластичността на мозъка. Ако не се комбинира със съзнателни промени в поведението, пациентът няма да извлече максималния ефект. Често микродозата се приема като алтернатива на класическите антидепресанти, в сравнение с които има предимството да е с по-гъвкав метод на прием – не е нужно да се взема всеки ден и не е известно рязкото спиране да води до неприятни странични ефекти.

Колко често се взема микродозата?

Всеки лекар следва да намери схема според нуждите и предпочитанията на пациента си. Експертът миколог Пол Стаметс (участник в епизода, посветен на псилоцибина в сериала на Netflix „Пътуване до дълбините на ума“) препоръчва микродозата да се взема четири поредни дни, последвани от три дни почивка.

Джеймс Фадиман препоръчва редуване на един ден микродозиране с два дни почивка – в първия се усеща остатъчното „сияние“ на дозата, а във втория пациентът се връща на базовата си линия, което му помага да оцени и осмисли ефекта от веществото. Той съветва също така да се прави и почивка от няколко седмици на всеки няколко месеца.

Като всяка друга терапия в сферата на психическото здраве, микродоза от халюциноген може да се използва за различни проблеми и има различен ефект за всеки пациент. Хора, страдащи от депресия, споделят, че са си възвърнали способността и интереса да общуват с близките си и да бъдат активни във всекидневието си; други – с тревожност или обсесивно-компулсивно разстройство – се чувстват по-спокойни и по-облекчени от бремето на нежеланите мисли; трети успяват да намалят симптомите на посттравматичен стрес или честотата на мигрените. Някои пациенти пробват микродозиране с различни вещества и усещат различни ефекти.

Какви са рисковете?

Известните рискове от микродозирането са сравнително малко. Халюциногените не водят до пристрастяване. Една стандартна доза LSD или магически гъби временно повишава толерантността на тялото към активните им съставки, поради което е почти невъзможно да се правят множество силни трипове в кратък интервал от време. При микродозирането това не е фактор, защото става дума за много малко количество активно вещество.

Стандартните дози халюциногени носят известен риск – възможно е трипът да събуди негативни спомени от миналото и да се превърне в трудно изживяване, но с предварителна подготовка и правилната нагласа това може да доведе и до превъзмогване на въпросната травма и дълготрайно облекчение от лошия спомен. (Затова и изследванията показват огромния потенциал на халюциногените за лечение на посттравматичен стрес.)

Най-голям е рискът за пациенти с биполярно разстройство или шизофрения, или за хора с генетична обремененост с тези разстройства. При тях една голяма доза халюциногени може да отключи епизод на мания или психоза. Хората, които приемат лекарства, действащи на рецепторите за серотонин, като например повечето видове антидепресанти, също не бива да експериментират.

Съществува потенциален риск за сърдечното здраве. Халюциногените се свързват с рецептори, които освен в мозъка са налични и в сърдечните клапи. На теория е възможно редовното приемане на малки дози с времето да доведе до заболявания на сърдечните клапи – този риск е доказан и при някои лекарства за епилепсия, паркинсон, наднормено тегло, които влияят на същите рецептори.

Хак за креативност

Статиите за микродозиране често го рекламират като хак за продуктивност и креативност, което е признак на съвременната тенденция всяко вещество, влияещо на мозъка или психическото здраве, да се разглежда и като допълнително гориво за работното място. Неслучайно популяризирането на микродозирането се свързва със Силициевата долина – място, където дългото работно време е въпрос на чест и всички ресурси на служителите се превръщат в ресурси на самата компания. Мерната единица за психическото и емоционалното здраве на човека е умението му да се отдаде пълноценно на работното си място.

Микродозирането често се обсъжда в интернет форуми, чиято цел е постигането на т.нар. състояние на „поток“ (оптимална концентрация, енергия и креативност) по време на работа чрез редица съставки и практики: модни диети (периодично гладуване, палео или кето), хранителни добавки (от гъбен, растителен или животински произход), дизайнерски дроги (функционални аналози на забранени вещества, които обаче не попадат в официалните черни списъци на законодателството, защото имат различна молекулярна структура), обезболяващи, стимуланти, специални физически тренировки, медитация или дихателни упражнения (например на Вим Хоф). Всъщност повишената продуктивност и креативност, които се свързват с микродозирането, са вторичен ефект от облекчаването на умората, депресията или тревогата, често предизвикани или влошени от стреса в работната среда.

Условията за навлизането на микродозирането в световния културен цайтгайст са до известна степен продукт на внушителните неравенства в американското общество. От една страна, се създава търсене и легитимност за тези практики от либералната (поне по отношение на употребата на наркотици) култура на Силициевата долина и Холивуд, където продуктивността и креативността се култивират под високо налягане.

Под върха на този елитен айсберг, който отразяват медиите, обаче се крие мнозинство от съвсем обикновени хора, търсещи лечение за пристрастявания, депресия, мигрена, посттравматичен стрес (широко разпространен сред военнослужещите). Липсата на достъпно и качествено здравеопазване, особено в сферата на психическото здраве, и вездесъщият достъп до информационни мрежи, които рекламират ползите от микродозирането или обясняват къде да купиш или как да отгледаш магически гъби, допринасят за популярността на метода.

Всичко е на един клик разстояние

Един от порталите към света на микродозирането е популярният мегафорум Reddit. Търсачката му позволява на потребител, който страда от депресия и още не е намерил ефективно лечение, да прескача от форум на форум и да разглежда безброй теми с лични истории за всякакви видове антидепресанти, терапевтични модалности, хранителни добавки, фитнес режими, видове медитация, подкасти, религиозни практики, диети и житейски философии. И насред този поток от информация да попадне на тема, в която анонимен непознат споделя, че е намерил „лекарство“ без особени странични ефекти – редовна микродоза LSD или псилоцибин. А в отговор на въпроса „Ами откъде да намеря гъби?“ веднага ще му кажат, директно или завоалирано, че в определени форуми всичко е описано изключително подробно, че е лесно да започнеш и определено си заслужава, и че все повече учени споделят това мнение.

След това всичко е на един клик разстояние. В Reddit може да попаднеш сред т.нар. психонавти, които редовно вземат високи дози халюциногени в търсене на мистични и религиозни преживявания, а после сравняват портрети на съществата, с които са общували в космическото пространството на своя трип. Може да намериш един от многото форуми за микология, където ентусиасти отглеждат всякакви видове гъби в домашни условия или в специални градини, или да влезеш в лабораторен форум, който описва процеса на добиване на DMT.

Може да прелистиш виртуален справочник за бактериите и плесените, които саботират домашно отглежданите гъби (модераторите са специалисти по химия и биология, които не позволяват на аматьорите да дават категоричен отговор на чужди въпроси). И разбира се, може да попаднеш в огромния форум, посветен на микродозирането, който е любопитна смес от сериозни изследвания, проведени в престижни университети и публикувани във водещи научни списания, и личните истории на безброй анонимни опитни зайчета. Компанията, която се е събрала там, е привлякла вниманието и на научната общност, набираща доброволци за анкети и проучвания сред потребителите.

Същата информация е подробно описана в много YouTube канали, които нагледно показват всяка стъпка в процеса на отглеждане на магически гъби или приготвяне на микродози псилоцибин или LSD. Създателите носят ръкавици, когато ръцете им са в кадър, и прикриват гласовете си чрез филтри, но основно разчитат на факта, че халюциногените не са приоритет в борбата срещу наркотиците и че клиповете им са капка в огромния океан от интернет съдържание, което е на ръба на закона.

На ръба на закона и извън интернет

Друг фактор за популярността на тези вещества и практики е законовият статус на халюциногените. В Нидерландия халюциногенните гъби не са легални, но е оставена отворена вратичка в закона за друг ефективен продукт – халюциногенните трюфели, които растат под земята и съответно не влизат в забранената надземна категория. Трюфелите са с по-ниско съдържание на активната съставка псилоцибин в сравнение с най-разпространените видове магически гъби, затова и в повечето сайтове с информация за микро- и макродозиране се уточняват препоръчителните количества за консумация според вида гъба или трюфел.

Заради тази особеност на нидерландското законодателство любопитни потребители и пациенти на територията на Европейския съюз лесно могат да кликнат върху една от многото реклами в социалните мрежи, да поръчат специално подготвен блистер за микродозиране (трюфелите са разделени на дневни дози) и да се надяват, че митницата няма да разгледа поръчката им.

Легализирането на канабиса в голяма част от САЩ се превърна в златна мина за инвеститорите. Резултатите на фондовия пазар наклоняват везните в полза на предстоящото легализиране на федерално равнище. Същото по всяка вероятност предстои да стане и с халюциногените. Акциите на компании, активно участващи в клинични изследвания на халюциногенни терапии, се считат за обещаваща инвестиция в сектор, който тепърва ще се разрасне.

Щатът Орегон вече декриминализира психоактивните гъби. В Канада законът позволява на лекари да кандидатстват за разрешение за псилоцибинова терапия за пациентите си. Провинция Албърта наскоро изцяло узакони халюциногенната терапия, а безброй онлайн магазини продават магически гъби без притеснение. В Ямайка, където халюциногенните гъби никога не са били забранявани, има специални туристически центрове за псилоцибинна терапия, като държавата цели да привлече инвеститори за развиващата се халюциногенна индустрия.

Често се говори за халюциногените като за утопични лекарства, които облекчават всеобщата депресия, апатия и изолация в съвременното общество. Халюциногените обаче попадат и в ръцете на учени и компании, които искат да извлекат основно печалба от техния потенциал, както и в сферите на интерес на влиятелни личности, чиито политически нагласи са противоположни на утопичната хипарска егалитарност. Милиардерът Питър Тийл – съосновател на PayPal, първи външен инвеститор във Facebook, член на Републиканската партия и привърженик на националконсерватизма, също залага на бъдещето на психеделичното лечение и инвестира в тази сфера. А фактор за популяризирането на практиката са и инфлуенсъри и медийни звезди като Джордан Питърсън и Джо Роугън.

Онлайн общностите, които организират и споделят информация за отглеждането на магически гъби и употребата на халюциногени, донякъде контрират тези тенденции. Дори и някоя компания да изобрети лекарство с активна съставка мескалин или псилоцибин и да се опита да го присвои под своята търговска марка, никой не може да патентова гъбите, които се срещат из целия свят.

1 LSD – диетиламид на лизергиновата киселина. Психоактивно вещество от групата на халюциногените и ентеогените. Синтезира се от паразитна гъба, която се среща при тревисти и житни растения.

2 DMT – диметилтриптамин. Природен халюциноген, съдържащ се в растения, животни и в човешкия организъм (в малки дози).

3 Аяуаска – така се нарича и растението (амазонска гигантска лиана), и психоактивните настойки, които се правят от него и се използват за шамански, знахарски и религиозни цели.

4 Кетамин – дисоциативен анестетик. Използвал се е за започване и поддържане на анестезия. Към момента се употребява предимно във ветеринарната практика. Отскоро се използва и за лечение на резистентна депресия.

5 Всички химически субстанции (без значение каква е структурата или произходът им), които се свързват с канабиноидните рецептори в тялото.

Monitor Amazon SNS-based applications end-to-end with AWS X-Ray active tracing

Post Syndicated from Pascal Vogel original https://aws.amazon.com/blogs/compute/monitor-amazon-sns-based-applications-end-to-end-with-aws-x-ray-active-tracing/

This post is written by Daniel Lorch, Senior Consultant and David Mbonu, Senior Solutions Architect.

Amazon Simple Notification Service (Amazon SNS), a messaging service that provides high-throughput, push-based, many-to-many messaging between distributed systems, microservices, and event-driven serverless applications, now supports active tracing with AWS X-Ray.

With AWS X-Ray active tracing enabled for SNS, you can identify bottlenecks and monitor the health of event-driven applications by looking at segment details for SNS topics, such as resource metadata, faults, errors, and message delivery latency for each subscriber.

This blog post reviews common use cases where AWS X-Ray active tracing enabled for SNS provides a consistent view of tracing data across AWS services in real-world scenarios. We cover two architectural patterns which allow you to gain accurate visibility of your end-to-end tracing: SNS to Amazon Simple Queue Service (Amazon SQS) queues and SNS topics to Amazon Kinesis Data Firehose streams.

Getting started with the sample serverless application

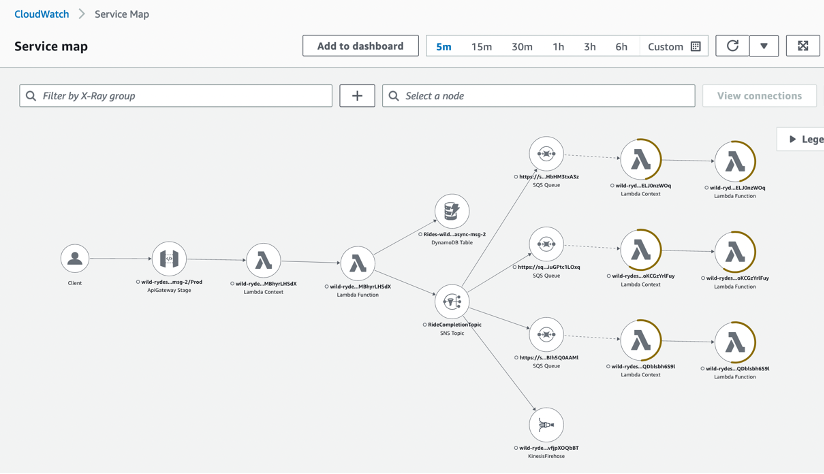
To demonstrate AWS X-Ray active tracing for SNS, we will use the Wild Rydes serverless application as shown in the following figure. The application uses a microservices architecture which implements asynchronous messaging for integrating independent systems.

Wild Rydes serverless application architecture

This is how the sample serverless application works:

  1. An Amazon API Gateway receives ride requests from users.
  2. An AWS Lambda function processes ride requests.
  3. An Amazon DynamoDB table serves as a store for rides.
  4. An SNS topic serves as a fan-out for ride requests.
  5. Individual SQS queues and Lambda functions are set up for processing requests via various back-office services (customer notification, customer accounting, and others).
  6. An SNS message filter is in place for the subscription of the extraordinary rides service.
  7. A Kinesis Data Firehose delivery stream archives ride requests in an Amazon Simple Storage Service (Amazon S3) bucket.

Deploying the sample serverless application

Prerequisites

Deployment steps using AWS SAM

The sample application is provided as an AWS SAM infrastructure as code template.

This demonstrative application will deploy an API without authorization. Please consider controlling and managing access to your APIs.

  1. Clone the GitHub repository:
    git clone https://github.com/aws-samples/sns-xray-active-tracing-blog-source-code
    cd sns-xray-active-tracing-blog-source-code
  2. Build the lab artifacts from source:
    sam build
  3. Deploy the sample solution into your AWS account:
    export AWS_REGION=$(aws --profile default configure get region)
    sam deploy \
    --stack-name wild-rydes-async-msg-2 \
    --capabilities CAPABILITY_IAM \
    --region $AWS_REGION \
    --guided

    Confirm SubmitRideCompletionFunction may not have authorization defined, Is this okay? [y/N]: with yes.

  4. Wait until the stack reaches status CREATE_COMPLETE.

See the sample application README.md for detailed deployment instructions.

Testing the application

Once the application is successfully deployed, generate messages and validate that the SNS topic is publishing all messages:

  1. Look up the API Gateway endpoint:
    export AWS_REGION=$(aws --profile default configure get region)
    aws cloudformation describe-stacks \
    --stack-name wild-rydes-async-msg-2 \
    --query 'Stacks[].Outputs[?OutputKey==`UnicornManagementServiceApiSubmitRideCompletionEndpoint`].OutputValue' \
    --output text
  2. Store this API Gateway endpoint in an environment variable:
    export ENDPOINT=$(aws cloudformation describe-stacks \
    --stack-name wild-rydes-async-msg-2 \
    --query 'Stacks[].Outputs[?OutputKey==`UnicornManagementServiceApiSubmitRideCompletionEndpoint`].OutputValue' \
    --output text)
  3. Send requests to the submit ride completion endpoint by executing the following command five or more times with varying payloads:
    curl -XPOST -i -H "Content-Type\:application/json" -d '{ "from": "Berlin", "to": "Frankfurt", "duration": 420, "distance": 600, "customer": "cmr", "fare": 256.50 }' $ENDPOINT
  4. Validate that messages are being passed in the application using the CloudWatch service map:
    Messages being passed on the CloudWatch service map

See the sample application README.md for detailed testing instructions.

The sample application shows various use-cases, which are described in the following sections.

Amazon SNS to Amazon SQS fanout scenario

A common application integration scenario for SNS is the Fanout scenario. In the Fanout scenario, a message published to an SNS topic is replicated and pushed to multiple endpoints, such as SQS queues. This allows for parallel asynchronous processing and is a common application integration pattern used in event-driven application architectures.

When an SNS topic fans out to SQS queues, the pattern is called topic-queue-chaining. This means that you add a queue, in our case an SQS queue, between the SNS topic and each of the subscriber services. As messages are buffered in a persistent manner in an SQS queue, no message is lost should a subscriber process run into issues for multiple hours or days, or experience exceptions or crashes.

By placing an SQS queue in front of each subscriber service, you can leverage the fact that a queue can act as a buffering load balancer. As every queue message is delivered to one of potentially many consumer processes, subscriber services can be easily scaled out and in, and the message load is distributed over the available consumer processes. In an event where suddenly a large number of messages arrives, the number of consumer processes has to be scaled out to cope with the additional load. This takes time and you need to wait until additional processes become operational. Since messages are buffered in the queue, you do not lose any messages in the process.

To summarize, in the Fanout scenario or the topic-queue-chaining pattern:

  • SNS replicates and pushes the message to multiple endpoints.
  • SQS decouples sending and receiving endpoints.

The fanout scenario is a common application integration scenario for SNS

With AWS X-Ray active tracing enabled on the SNS topic, the CloudWatch service map shows us the complete application architecture, as follows.

Fanout scenario with an SNS topic that fans out to SQS queues in the CloudWatch service map

Prior to the introduction of AWS X-Ray active tracing on the SNS topic, the AWS X-Ray service would not be able to reconstruct the full service map and the SQS nodes would be missing from the diagram.

To see the integration without AWS X-Ray active tracing enabled, open template.yaml and navigate to the resource RideCompletionTopic. Comment out the property TracingConfig: Active, redeploy and test the solution. The service map should then show an incomplete diagram where the SNS topic is linked directly to the consumer Lambda functions, omitting the SQS nodes.

For this use case, given the Fanout scenario, enabling AWS X-Ray active tracing on the SNS topic provides full end-to-end observability of the traces available in the application.

Amazon SNS to Amazon Kinesis Data Firehose delivery streams for message archiving and analytics

SNS is commonly used with Kinesis Data Firehose delivery streams for message archival and analytics use-cases. You can use SNS topics with Kinesis Data Firehose subscriptions to capture, transform, buffer, compress and upload data to Amazon S3, Amazon Redshift, Amazon OpenSearch Service, HTTP endpoints, and third-party service providers.

We will implement this pattern as follows:

  • An SNS topic to replicate and push the message to its subscribers.
  • A Kinesis Data Firehose delivery stream to capture and buffer messages.
  • An S3 bucket to receive uploaded messages for archival.

Message archiving and analytics using Kinesis Data Firehose delivery streams consumer to the SNS topic

In order to demonstrate this pattern, an additional consumer has been added to the SNS topic. The same Fanout pattern applies and the Kinesis Data Firehose delivery stream receives messages from the SNS topic alongside the existing consumers.

The Kinesis Data Firehose delivery stream buffers messages and is configured to deliver them to an S3 bucket for archival purposes. Optionally, an SNS message filter could be added to this subscription to select relevant messages for archival.

With AWS X-Ray active tracing enabled on the SNS topic, the Kinesis Data Firehose node will appear on the CloudWatch service map as a separate entity, as can be seen in the following figure. It is worth noting that the S3 bucket does not appear on the CloudWatch service map as Kinesis does not yet support AWS X-Ray active tracing at the time of writing of this blog post.

Kinesis Data Firehose delivery streams consumer to the SNS topic in the CloudWatch Service Map

Prior to the introduction of AWS X-Ray active tracing on the SNS topic, the AWS X-Ray service would not be able to reconstruct the full service map and the Kinesis Data Firehose node would be missing from the diagram. To see the integration without AWS X-Ray active tracing enabled, open template.yaml and navigate to the resource RideCompletionTopic. Comment out the property TracingConfig: Active, redeploy and test the solution. The service map should then show an incomplete diagram where the Kinesis Data Firehose node is missing.

For this use case, given the data archival scenario with Kinesis Delivery Firehose, enabling AWS X-Ray active tracing on the SNS topic provides additional visibility on the Kinesis Data Firehose node in the CloudWatch service map.
Review faults, errors, and message delivery latency on the AWS X-Ray trace details page

The AWS X-Ray trace details page provides a timeline with resource metadata, faults, errors, and message delivery latency for each segment.
With AWS X-Ray active tracing enabled on SNS, additional segments for the SNS topic itself, but also the downstream consumers (AWS::SNS::Topic, AWS::SQS::Queue and AWS::KinesisFirehose) segments are available, providing additional faults, errors, and message delivery latency for these segments. This allows you to analyze latencies in your messages and their backend services. For example, how long a message spends in a topic, and how long it took to deliver the message to each of the topic’s subscriptions.

Additional faults, errors, and message delivery latency information on AWS X-Ray trace details page

Enabling AWS X-Ray active tracing for SNS

AWS X-Ray active tracing is not enabled by default on SNS topics and needs to be explicitly enabled.

The example application used in this blog post demonstrates how to enable active tracing using AWS SAM.

You can enable AWS X-Ray active tracing using the SNS SetTopicAttributes API, SNS Management Console, or via AWS CloudFormation. See Active tracing in Amazon SNS in the Amazon SNS Developer Guide for more options.

Cleanup

To clean up the resources provisioned as part of the sample serverless application, follow the instructions as outlined in the sample application README.md.

Conclusion

AWS X-Ray active tracing for SNS enables end-to-end visibility in real-world scenarios involving patterns like SNS to SQS and SNS to Amazon Kinesis.

But it is not only useful for these patterns. With AWS X-Ray active tracing enabled for SNS, you can identify bottlenecks and monitor the health of event-driven applications by looking at segment details for SNS topics and consumers, such as resource metadata, faults, errors, and message delivery latency for each subscriber.

Enable AWS X-Ray active tracing for SNS to gain accurate visibility of your end-to-end tracing.

For more serverless learning resources, visit Serverless Land.

Първата ферма за октоподи: Пет въпроса

Post Syndicated from Севда Семер original https://www.toest.bg/purvata-ferma-za-oktopodi-pet-vuprosa/

Първата ферма за октоподи: Пет въпроса

В Испания предстои да отворят първата ферма за октоподи, която ще убива по милион от тези животни на година. Обществеността реагира бурно – например с подписка срещу това. Колкото повече подробности излизат, толкова повече притеснения намират публичен израз. Наскоро BBC публикува статия по повода, в която се говори за редица етични проблеми около тази ферма.

Струва ми се, че причината толкова хора да изразяват мнение е, че

в популярната култура се отвори пространство за тези същества – за разлика от много други.

В последно време се появиха безкрайно интересни книги с изследвания за октоподи (на български е издадена „Душата на октопода“), а по тази тема е и филмът „Моят учител октоподът“, спечелил „Оскар“.

За някого като мен, на когото това е любимото животно, всяко отиване в книжарницата може да е повод за радост. Преди няколко години за октоподите имаше две-три книги, а вече са споменати в много популярни заглавия и постоянно научаваме все повече за тях.

Неведнъж съм чувала „не мога да прочета или гледам това, защото ще спра да ям октоподи“. Няма как да не ми стане тъжно от подобно твърдение.

Хомо сапиенс, мислещият човек, съвсем съзнателно отказва да мисли по трудни теми, защото… така е по-лесно.

Според мен имаме задължение да разсъждаваме за начина, по който живеем – особено когато е буквално въпрос на живот и смърт за други същества. Именно заради това искам да задам няколко въпроса, които ми се струва важно да не пропускаме около тази тема.

Въпросната ферма съществува единствено защото има пазар за нея.

Всяка година ние убиваме хиляди тонове октоподи.

(1) Ако фермата действа единствено като посредник на нашите желания, проблемът не са ли нашите желания?

Като алтернатива на убиването на октоподи в ледена вода се предлага по-хуманен начин, а именно… Да се удрят по главата, докато умрат. (2) Можем ли наистина да твърдим, че съществува хуманен начин да се убие животно, когато смъртта му е ненужна?

Светлана Алексиевич казва, че е човешко право да не се учиш да убиваш.

(3) Ако аз не мога да понеса да убия с удар по главата животно, за да го изям за вечеря, етично ли е да оставя друг човек да го прави вместо мен?

Ако пък предпочитаме да ядем диви октоподи, нека не забравяме, че хората в момента ядат повече морски животни от всякога. Съществуват данни, че по този начин

до няколко десетилетия ще успеем да убием цялата риба в океаните.

(4) Кое е по-съществено: да отгледаме деца, които ще очакват да видят морски животни в чинията си – или в океана?

Първата ферма за октоподи: Пет въпроса
Източник: Canva

Беше повдигнат въпросът за интелигентността на тези животни. Те използват инструменти; разпознават хора и имат любимци сред тях и такива, които не харесват; решават различни задачи, конструирани от нас. Между другото, Испания е на едно от първите места в Европа по отглеждане на прасета за храна – вид, който се привързва към хората също толкова лесно, колкото и кучетата, и който според някои данни е по-интелигентен от тях. А впрочем е и също толкова чист, колкото тях.

Но ако бъдем истински смели, ще си зададем въпроса: (5) има ли значение каква е нашата човешка дефиниция за интелигентност? Защото нека забележим, че мерим интелигентността единствено спрямо конструирани от нас тестове, а не спрямо това, което прави животното в собствената си среда? Или всъщност

колко е умно едно живо същество, не би трябвало да има отношение към правото му на живот?

Докато размишляваме по тези въпроси, нека не забравяме, че според официалните данни на най-големите асоциации на експерти диетата без животински продукти е здравословна за всички фази на живота, включително за бременни и за атлети.

Наясно съм, че това са не просто въпроси, а огромни предизвикателства – към културата на хранене, към възприети от поколения идеи за мястото на различните животински видове в човешката йерархия, към консуматорските решения на съвсем всекидневно, банално ниво.

За над 80 милиарда животни годишно, които губят единствения си живот заради нашите решения обаче, това изобщо не е банален въпрос – а фундаментален.

Говорим за населението на Земята, умножено по над 10 (като това са единствено животните, отглеждани за месо във ферми, без да се брои риболовът или онези животни, които умират в производството на яйца и мляко).

Именно тук е проблемът, а не в частния случай на фермата за октоподи. Нека размишляваме върху него със сериозността, която дори само числото на убитите животни изисква от нас.

[$] MicroPython 1.20: Python for microcontrollers

Post Syndicated from original https://lwn.net/Articles/931051/

The MicroPython programming language
implements a sizable subset of Python that can run on microcontrollers,
thus bringing Python’s easy-to-learn syntax, readability, and
versatility to the embedded world. With its recent 1.20
release
, MicroPython introduces a new package manager, reduces its
code size, and adds support
for many new boards, including the Raspberry Pi
Pico W
. The project has come a long way since its inception ten
years ago, making it an easy-to-use tool for developing software for
resource-constrained environments.

Debugging SnapStart-enabled Lambda functions made easy with AWS X-Ray

Post Syndicated from Marcia Villalba original https://aws.amazon.com/blogs/compute/debugging-snapstart-enabled-lambda-functions-made-easy-with-aws-x-ray/

This post is written by Rahul Popat (Senior Solutions Architect) and Aneel Murari (Senior Solutions Architect) 

Today, AWS X-Ray is announcing support for SnapStart-enabled AWS Lambda functions. Lambda SnapStart is a performance optimization that significantly improves the cold startup times for your functions. Announced at AWS re:Invent 2022, this feature delivers up to 10 times faster function startup times for latency-sensitive Java applications at no extra cost, and with minimal or no code changes.

X-Ray is a distributed tracing system that provides an end-to-end view of how an application is performing. X-Ray collects data about requests that your application serves and provides tools you can use to gain insight into opportunities for optimizations. Now you can use X-Ray to gain insights into the performance improvements of your SnapStart-enabled Lambda function.

With today’s feature launch, by turning on X-Ray tracing for SnapStart-enabled Lambda functions, you see separate subsegments corresponding to the Restore and Invoke phases for your Lambda function’s execution.

How does Lambda SnapStart work?

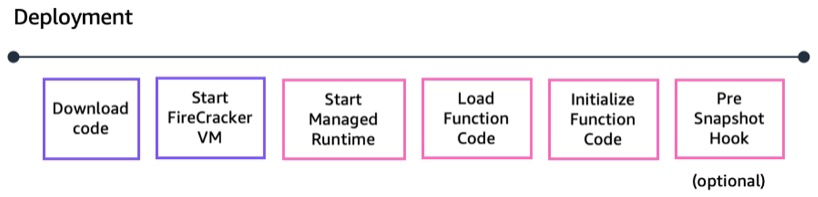
With SnapStart, the function’s initialization is done ahead of time when you publish a function version. Lambda takes an encrypted snapshot of the initialized execution environment and persists the snapshot in a tiered cache for low latency access.

When the function is first invoked or scaled, Lambda restores the cached execution environment from the persisted snapshot instead of initializing anew. This results in reduced startup times.

X-Ray tracing before this feature launch

Using an example of a Hello World application written in Java, a Lambda function is configured with SnapStart and fronted by Amazon API Gateway:

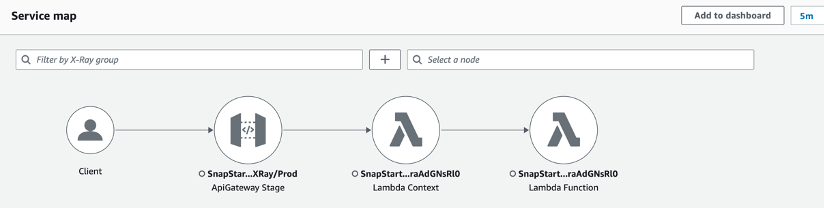
Before today’s launch, X-Ray was not supported for SnapStart-enabled Lambda functions. So if you had enabled X-Ray tracing for API Gateway, the X-Ray trace for the sample application would look like:

The trace only shows the overall duration of the Lambda service call. You do not have insight into your function’s execution or the breakdown of different phases of Lambda function lifecycle.

Next, enable X-Ray for your Lambda function and see how you can view a breakdown of your function’s total execution duration.

Prerequisites for enabling X-Ray for SnapStart-enabled Lambda function

SnapStart is only supported for Lambda functions with Java 11 and newly launched Java 17 managed runtimes. You can only enable SnapStart for the published versions of your Lambda function. Once you’ve enabled SnapStart, Lambda publishes all subsequent versions with snapshots. You may also create a Lambda function alias, which points to the published version of your Lambda function.

Make sure that the Lambda function’s execution role has appropriate permissions to write to X-Ray.

Enabling AWS X-Ray for your Lambda function with SnapStart

You can enable X-Ray tracing for your Lambda function using AWS Management Console, AWS Command Line Interface (AWS CLI), AWS Serverless Application Model (AWS SAM), AWS CloudFormation template, or via AWS Cloud Deployment Kit (CDK).

This blog shows how you can achieve this via AWS Management Console and AWS SAM. For more information on enabling SnapStart and X-Ray using other methods, refer to AWS Lambda Developer Guide.

Enabling SnapStart and X-Ray via AWS Management Console

To enable SnapStart and X-Ray for Lambda function via the AWS Management Console:

  1. Navigate to your Lambda Function.
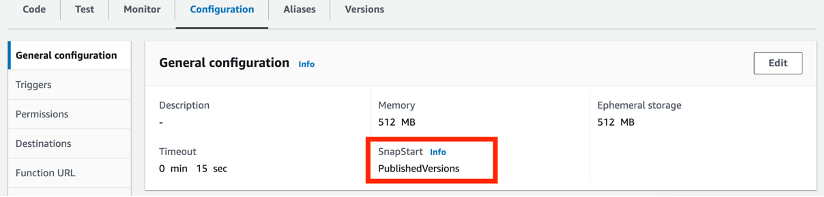
  2. On the Configuration tab, choose Edit and change the SnapStart attribute value from None to PublishedVersions.
  3. Choose Save.

To enable X-Ray via the AWS Management Console:

  1. Navigate to your Lambda Function.
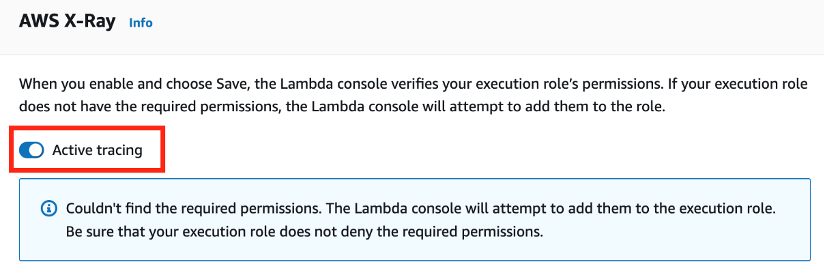
  2. ­On the Configuration tab, scroll down to the Monitoring and operations tools card and choose Edit.
  3. Under AWS X-Ray, enable Active tracing.
  4. Choose Save

To publish a new version of Lambda function via the AWS Management Console:

  1. Navigate to your Lambda Function.
  2. On the Version tab, choose Publish new version.
  3. Verify that PublishedVersions is shown below SnapStart.
  4. Choose Publish.

To create an alias for a published version of your Lambda function via the AWS Management Console:

  1. Navigate to your Lambda Function.
  2. On the Aliases tab, choose Create alias.
  3. Provide a Name for an alias and select a Version of your Lambda function to point the alias to.
  4. Choose Save.

Enabling SnapStart and X-Ray via AWS SAM

To enable SnapStart and X-Ray for Lambda function via AWS SAM:

    1. Enable Lambda function versions and create an alias by adding a AutoPublishAlias property in template.yaml file. AWS SAM automatically publishes a new version for each new deployment and automatically assigns the alias to the newly published version.
      Resources:
        my-function:
          type: AWS::Serverless::Function
          Properties:
            […]
            AutoPublishAlias: live
    2. Enable SnapStart on Lambda function by adding the SnapStart property in template.yaml file.
      Resources: 
        my-function: 
          type: AWS::Serverless::Function 
          Properties: 
            […] 
            SnapStart:
             ApplyOn: PublishedVersions
    3. Enable X-Ray for Lambda function by adding the Tracing property in template.yaml file.
      Resources:
        my-function:
          type: AWS::Serverless::Function
          Properties:
            […]
            Tracing: Active 

You can find the complete AWS SAM template for the preceding example in this GitHub repository.

Using X-Ray to gain insights into SnapStart-enabled Lambda function’s performance

To demonstrate X-Ray integration for your Lambda function with SnapStart, you can build, deploy, and test the sample Hello World application using AWS SAM CLI. To do this, follow the instructions in the README file of the GitHub project.

The build and deployment output with AWS SAM looks like this:

Once your application is deployed to your AWS account, note that SnapStart and X-Ray tracing is enabled for your Lambda function. You should also see an alias `live` created against the published version of your Lambda function.

You should also have an API deployed via API Gateway, which is pointing to the `live` alias of your Lambda function as the backend integration.

Now, invoke your API via `curl` command or any other HTTP client. Make sure to replace the url with your own API’s url.

$ curl --location --request GET https://{rest-api-id}.execute-api.{region}.amazonaws.com/{stage}/hello

Navigate to Amazon CloudWatch and under the X-Ray service map, you see a visual representation of the trace data generated by your application.

Under Traces, you can see the individual traces, Response code, Response time, Duration, and other useful metrics.

Select a trace ID to see the breakdown of total Duration on your API call.

You can now see the complete trace for the Lambda function’s invocation with breakdown of time taken during each phase. You can see the Restore duration and actual Invocation duration separately.

Restore duration shown in the trace includes the time it takes for Lambda to restore a snapshot on the microVM, load the runtime (JVM), and run any afterRestore hooks if specified in your code. Note that, the process of restoring snapshots can include time spent on activities outside the microVM. This time is not reported in the Restore sub-segment, but is part of the AWS::Lambda segment in X-Ray traces.

This helps you better understand the latency of your Lambda function’s execution, and enables you to identify and troubleshoot the performance issues and errors.

Conclusion

This blog post shows how you can enable AWS X-Ray for your Lambda function enabled with SnapStart, and measure the end-to-end performance of such functions using X-Ray console. You can now see a complete breakdown of your Lambda function’s execution time. This includes Restore duration along with the Invocation duration, which can help you to understand your application’s startup times (cold starts), diagnose slowdowns, or troubleshoot any errors and timeouts.

To learn more about the Lambda SnapStart feature, visit the AWS Lambda Developer Guide.

For more serverless learning resources, visit Serverless Land.

Implementing cross-account CI/CD with AWS SAM for container-based Lambda functions

Post Syndicated from Eric Johnson original https://aws.amazon.com/blogs/compute/implementing-cross-account-cicd-with-aws-sam-for-container-based-lambda/

This post is written by Chetan Makvana, Sr. Solutions Architect.

Customers use modular architectural patterns and serverless operational models to build more sustainable, scalable, and resilient applications in modern application development. AWS Lambda is a popular choice for building these applications.

If customers have invested in container tooling for their development workflows, they deploy to Lambda using the container image packaging format for workloads like machine learning inference or data intensive workloads. Using functions deployed as container images, customers benefit from the same operation simplicity, automation scaling, high availability, and native integration with many services.

Containerized applications often have several distinct environments and accounts, such as dev, test, and prod. An application has to go through a process of deployment and testing in these environments. One common pattern for deploying containerized applications is to have a central AWS create a single container image, and carry out deployment across other AWS accounts. To achieve automated deployment of the application across different environments, customers use CI/CD pipelines with familiar container tooling.

This blog post explores how to use AWS Serverless Application Model (AWS SAM) Pipelines to create a CI/CD deployment pipeline and deploy a container-based Lambda function across multiple accounts.

Solution overview

This example comprises three accounts: tooling, test, and prod. The tooling account is a central account where you provision the pipeline, and build the container. The pipeline deploys the container into Lambda in the test and prod accounts using AWS CodeBuild. It also requires the necessary resources in the test and prod account. This consists of an Identity and Access Management (IAM) role that trusts the tooling account and provides the required deployment-specific permissions. AWS CodeBuild assumes this IAM role in the tooling account to carry out deployment.

The solution uses AWS SAM Pipelines to create CI/CD deployment pipeline resources. It provides commands to generate the required AWS infrastructure resources and a pipeline configuration file that CI/CD system can use to deploy using AWS SAM. Find the example code for this solution in the GitHub repository.

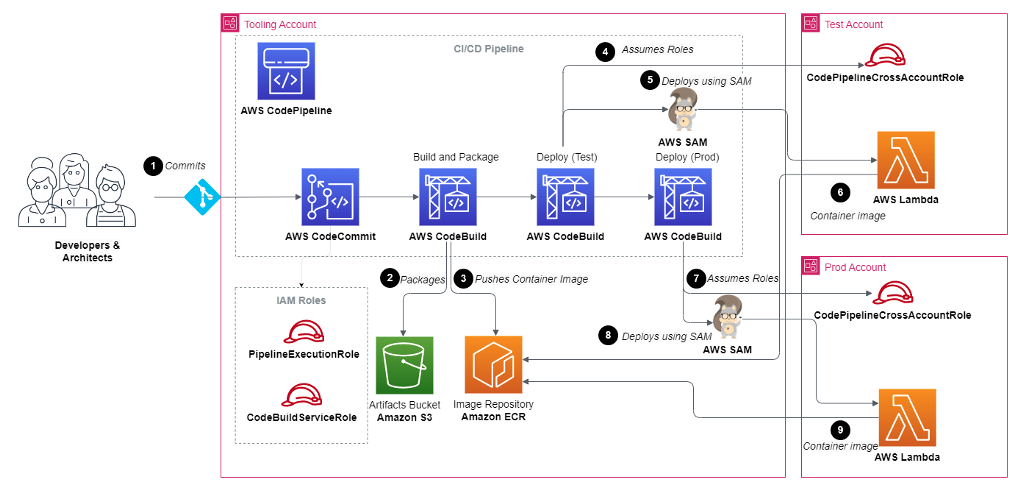
Full solution architecture

Full solution architecture

AWS CodePipeline goes through these steps to deploy the container-based Lambda function in the test and prod accounts:

  1. The developer commits the code of Lambda function into AWS CodeCommit or other source control repositories, which triggers the CI/CD workflow.
  2. AWS CodeBuild builds the code, creates a container image, and pushes the image to the Amazon Elastic Container Registry (ECR) repository using AWS SAM.
  3. AWS CodeBuild assumes a cross-account role for the test account.
  4. AWS CodeBuild uses AWS SAM to deploy the Lambda function by pulling image from Amazon ECR.
  5. If deployment is successful, AWS CodeBuild deploys the same image in prod account using AWS SAM.

Deploying the example

Prerequisites

  • An AWS account. The IAM user that you use must have sufficient permissions to make necessary AWS service calls and manage AWS resources.
  • AWS CLI installed and configured.
  • Git installed.
  • AWS SAM installed.
  • Setup .aws/credentials named profiles for tooling, test and prod accounts so you can run CLI and AWS SAM commands against them.
  • Set the TOOLS_ACCOUNT_ID, TEST_ACCOUNT_ID, and PROD_ACCOUNT_ID env variables:
    export TOOLS_ACCOUNT_ID=<Tooling Account Id>
    export TEST_ACCOUNT_ID=<Test Account Id>
    export PROD_ACCOUNT_ID=<Prod Account Id>

Creating a Git Repository and pushing the code

Run the following command in the tooling account from your terminal to create a new CodeCommit repository:

aws codecommit create-repository --repository-name lambda-container-repo --profile tooling

Initialize the Git repository and push the code.

cd ~/environment/cicd-lambda-container
git init -b main
git add .
git commit -m "Initial commit"
git remote add origin codecommit://lambda-container-repo
git push -u origin main

Creating cross-account roles in test and prod accounts

For the pipeline to gain access to the test and production environment, it must assume an IAM role. In cross-account scenario, the IAM role for the pipeline must be created on the test and production accounts.

Change directory to the directory templates and run the following command to deploy roles to test and prod using respective named profiles.

Test Profile

cd ~/environment/cicd-lambda-container/templates
aws cloudformation deploy --template-file crossaccount_pipeline_roles.yml --stack-name codepipeline-crossaccount-roles --capabilities CAPABILITY_NAMED_IAM --profile test --parameter-overrides ToolAccountID=${TOOLS_ACCOUNT_ID}
aws cloudformation describe-stacks --stack-name codepipeline-crossaccount-roles --query "Stacks[0].Outputs" --output json --profile test

Open the codepipeline_parameters.json file from the root directory. Replace the value of TestCodePipelineCrossAccountRoleArn and TestCloudFormationCrossAccountRoleArn with the CloudFormation output value of CodePipelineCrossAccountRole and CloudFormationCrossAccountRole respectively.

Prod Profile

aws cloudformation deploy --template-file crossaccount_pipeline_roles.yml --stack-name codepipeline-crossaccount-roles --capabilities CAPABILITY_NAMED_IAM --profile prod --parameter-overrides ToolAccountID=${TOOLS_ACCOUNT_ID}
aws cloudformation describe-stacks --stack-name codepipeline-crossaccount-roles --query "Stacks[0].Outputs" --output json --profile prod

Open the codepipeline_parameters.json file from the root directory. Replace the value of ProdCodePipelineCrossAccountRoleArn and ProdCloudFormationCrossAccountRoleArn with the CloudFormation output value of CodePipelineCrossAccountRole and CloudFormationCrossAccountRole respectively.

Creating the required IAM roles and infrastructure in the tooling account

Change to the templates directory and run the following command using tooling named profile:

aws cloudformation deploy --template-file tooling_resources.yml --stack-name tooling-resources --capabilities CAPABILITY_NAMED_IAM --parameter-overrides TestAccountID=${TEST_ACCOUNT_ID} ProdAccountID=${PROD_ACCOUNT_ID} --profile tooling
aws cloudformation describe-stacks --stack-name tooling-resources --query "Stacks[0].Outputs" --output json --profile tooling

Open the codepipeline_parameters.json file from the root directory. Replace value of ImageRepositoryURI, ArtifactsBucket, ToolingCodePipelineExecutionRoleArn, and ToolingCloudFormationExecutionRoleArn with the corresponding CloudFormation output value.

Updating cross-account IAM roles

The cross-account IAM roles on the test and production account require permission to access artifacts that contain application code (S3 bucket and ECR repository). Note that the cross-account roles are deployed twice. This is because there is a circular dependency on the roles in the test and prod accounts and the pipeline artifact resources provisioned in the tooling account.

The pipeline must reference and resolve the ARNs of the roles it needs to assume to deploy the application to the test and prod accounts, so the roles must be deployed before the pipeline is provisioned. However, the policies attached to the roles need to include the S3 bucket and ECR repository. But the S3 bucket and ECR repository don’t exist until the resources deploy in the preceding step. By deploying the roles twice, once without a policy so their ARNs resolve, and a second time to attach policies to the existing roles that reference the resources in the tooling account.

Replace ImageRepositoryArn and ArtifactBucketArn with output value from the above step in the below command and run it from the templates directory using Test and Prod named profiles.

Test Profile

aws cloudformation deploy --template-file crossaccount_pipeline_roles.yml --stack-name codepipeline-crossaccount-roles --capabilities CAPABILITY_NAMED_IAM --profile test --parameter-overrides ToolAccountID=${TOOLS_ACCOUNT_ID} ImageRepositoryArn=&lt;ImageRepositoryArn value&gt; ArtifactsBucketArn=&lt;ArtifactsBucketArn value&gt;

Prod Profile

aws cloudformation deploy --template-file crossaccount_pipeline_roles.yml --stack-name codepipeline-crossaccount-roles --capabilities CAPABILITY_NAMED_IAM --profile prod --parameter-overrides ToolAccountID=${TOOLS_ACCOUNT_ID} ImageRepositoryArn=&lt;ImageRepositoryArn value&gt; ArtifactsBucketArn=&lt;ArtifactsBucketArn value&gt;

Deploying the pipeline

Replace DeploymentRegion value with the current Region and CodeCommitRepositoryName value with the CodeCommit repository name in codepipeline_parameters.json file.

Push the changes to CodeCommit repository using Git commands.

Replace CodeCommitRepositoryName value with the CodeCommit repository name created in the first step and run the following command from the root directory of the project using tooling named profile.

sam deploy -t codepipeline.yaml --stack-name cicd-lambda-container-pipeline --capabilities=CAPABILITY_IAM --parameter-overrides CodeCommitRepositoryName=&lt;CodeCommit Repository Name&gt; --profile tooling

Cleaning Up

  1. Run the following command in root directory of the project to delete the pipeline:
    sam delete --stack-name cicd-lambda-container-pipeline --profile tooling
  2. Empty the artifacts bucket. Replace the artifacts bucket name with the output value from the preceding step:
    aws s3 rm s3://&lt;Arifacts bucket name&gt; --recursive --profile tooling
  3. Delete the Lambda functions from the test and prod accounts:
    aws cloudformation delete-stack --stack-name lambda-container-app-test --profile test
    aws cloudformation delete-stack --stack-name lambda-container-app-prod --profile prod
  4. Delete cross-account roles from the test and prod accounts:
    aws cloudformation delete-stack --stack-name codepipeline-crossaccount-roles --profile test
    aws cloudformation delete-stack --stack-name codepipeline-crossaccount-roles --profile prod
  5. Delete the ECR repository:
    aws ecr delete-repository --repository-name image-repository --profile tooling --force
  6. Delete resources from the tooling account:
    aws cloudformation delete-stack --stack-name tooling-resources --profile tooling

Conclusion

This blog post discusses how to automate deployment of container-based Lambda across multiple accounts using AWS SAM Pipelines.

Navigate to the GitHub repository and review the implementation to see how CodePipeline pushes container image to Amazon ECR, and deploys image to Lambda using cross-account role. Examine the codepipeline.yml file to see how the AWS SAM Pipelines creates CI/CD resources using this template.

For more serverless learning resources, visit  Serverless Land.

Detect threats to your data stored in RDS databases by using GuardDuty

Post Syndicated from Marshall Jones original https://aws.amazon.com/blogs/security/detect-threats-to-your-data-stored-in-rds-databases-by-using-guardduty/

With Amazon Relational Database Service (Amazon RDS), you can set up, operate, and scale a relational database in the AWS Cloud. Amazon RDS provides cost-efficient, resizable capacity for an industry-standard relational database and manages common database administration tasks.

If you use Amazon RDS for your workloads, you can now use Amazon GuardDuty RDS Protection to help detect threats to your data stored in Amazon Aurora databases. GuardDuty is a continuous security monitoring service that can help you identify and prioritize potential threats in your AWS environment. By analyzing and profiling RDS login activity to your Aurora databases, GuardDuty can detect threats, such as high severity brute force events, suspicious logins, access from Tor, and access by known threat actors.

In this post, we will provide an overview of how to get started with RDS Protection, dive into its finding types, and walk you through examples of how to investigate and remediate findings.

Overview of RDS Protection

RDS Protection in GuardDuty analyzes and profiles Amazon RDS login activity to identify potential threats to your data stored in Aurora databases by using a combination of threat intelligence and machine learning. At launch, RDS Protection supports Aurora MySQL versions 2.10.2 and 3.2.1 or later and Aurora PostgreSQL versions 10.17, 11.12, 12.7, 13.3, and 14.3 or later. An updated list of the supported engines and versions is available in the GuardDuty documentation. RDS Protection doesn’t require additional infrastructure, and you don’t need to configure, collect, or store RDS logs in your own account. RDS Protection is also designed to have no impact on the performance of your database instances so that you don’t have to worry about compromising performance to better secure your data stored in Amazon RDS.

When RDS Protection detects a suspicious or anomalous login attempt that indicates a potential threat to your database instance, GuardDuty generates a finding with details to help you quickly identify relevant information to assist in remediation. RDS Protection findings include details on both anomalous and normal login activity in addition to information such as database instance details, database user details, action information, and actor information. These findings are available to you in the GuardDuty console, AWS Command Line Interface (AWS CLI), and API, and all GuardDuty findings are sent to Amazon EventBridge and AWS Security Hub, giving you options to respond by sending alerts to chat or ticketing systems, or by using AWS Lambda and AWS Systems Manager for automatic remediation.

Enable RDS Protection

Getting started with RDS Protection is simple, and you can do it with just a few steps in the console. Both new and existing GuardDuty customers can take advantage of the GuardDuty RDS Protection 30-day free trial. You can turn RDS Protection on or off for each of your accounts in supported AWS Regions. If you already use GuardDuty, you will need to enable RDS Protection either in the console or CLI, or through the API. You will have the option to enable it in the account that you are currently in, or if you are using a GuardDuty delegated administrator account (as shown in Figure 1), you can enable it for all accounts in your AWS Organizations organization. You’ll also have the ability to auto-enable. The auto-enable feature helps ensure that RDS Protection is enabled for each new account added to your organization, without the need for you to configure anything in each member account. If you are turning on GuardDuty for the first time, RDS Protection is enabled by default.

Figure 1: GuardDuty RDS Protection enablement page

Figure 1: GuardDuty RDS Protection enablement page

Investigate RDS Protection findings

After GuardDuty generates a finding, you will need to analyze the finding so that you understand the potential impact to your environment. We recommend that you familiarize yourself with the GuardDuty finding types. Understanding GuardDuty finding types can help you understand the types of activity that GuardDuty is looking for and help you prepare for how to respond if they occur in your environment.

As adversaries become more sophisticated, it becomes even more important for you to align to a common framework to understand the tactics, techniques, and procedures (TTPs) behind an individual event. GuardDuty aligns findings using the MITRE ATT&CK framework, which is a globally-accessible knowledge base of adversary tactics and techniques based on real-world observations. GuardDuty findings have a specific finding format that helps you understand the details of each finding. You can examine the Threat Purpose section of the GuardDuty finding types to see finding types associated with various MITRE ATT&CK tactics, including CredentialAccess and Discovery. This can help you identify and understand the type of activity associated with a finding.

For example, consider two finding types that seem similar: CredentialAccess:RDS/MaliciousIPCaller.SuccessfulLogin and Discovery:RDS/MaliciousIPCaller. The difference between them is the ThreatPurpose aspect, located at the beginning of the finding type. GuardDuty has determined that both are involved with MaliciousIPCaller, and the difference is the intent of the activity associated with each finding. CredentialAccess SuccessfulLogin indicates that there was a successful login to your RDS database from a known malicious IP address. Discovery indicates that a threat actor opened a connection to the database, but didn’t attempt to authenticate. This indicates scanning behavior, but it might not be targeted at RDS instances. For more information, see GuardDuty RDS Protection finding types.

GuardDuty uses threat intelligence and machine learning to continually monitor and identify potential threats in your environment. To understand how to investigate RDS Protection finding types, you need to understand the details of a finding type that are derived from machine learning. As shown in Figure 2, RDS Protection finding types have two sections: one that shows the unusual behavior and one that shows the normal, historical behavior. To determine this, GuardDuty uses machine learning models to evaluate API requests to your account and identify anomalous events that are associated with tactics used by adversaries. The machine learning model tracks various factors of the API request, such as the user that made the request, the location the request was made from, and the specific API that was requested. It also looks at information such as successfulLoginCount, failedLoginCount, and incompleteConnectionCount for anomalies based on login activity. For more information about anomalous activity in GuardDuty findings, see Anomalous behavior.

Figure 2: GuardDuty finding details showing unusual and historical behavior sections

Figure 2: GuardDuty finding details showing unusual and historical behavior sections

With RDS Protection, you now have an additional mechanism to gain insight into your Amazon RDS databases across your accounts to continuously monitor for suspicious activity. RDS Protection can alert you to suspicious activity in Amazon RDS, such as a potentially suspicious or anomalous login attempt, unusual pattern in a series of successful, failed, or incomplete login attempts, and unauthorized access to your database instance from a previously unseen internal or external actor. With this new feature, GuardDuty also extends support for finding types that you might already be familiar with that also apply to RDS databases. These finding types include calls to an RDS database API from a Tor node, or calls to an RDS database from a known malicious IP address, which can indicate that there are interactions with your RDS database from sources that are associated with known malicious activity.

Remediate RDS Protection findings

In this section, we describe two RDS Protection findings and how you can investigate and remediate them. Understanding how to remediate these findings can help you maintain the integrity of your database. We share recommendations that focus specifically on security groups, network access control lists (network ACLs), and firewall rules.

CredentialAccess:RDS/AnomalousBehavior.SuccessfulLogin

The CredentialAccess:RDS/AnomalousBehavior.SuccessfulLogin finding informs you that an anomalous successful login was observed on an RDS database in your AWS environment. It might indicate that a previous unseen user logged in to an RDS database for the first time. A common scenario involves an internal user logging in to a database that is accessed programmatically by applications and not by individual users. A potential malicious actor might have compromised and accessed the role on your RDS database. The default Severity for this finding varies, depending on the anomalous behavior associated with the finding.

Figure 3 shows an example of this finding.

Figure 3: Finding of an anomalous behavior successful login

Figure 3: Finding of an anomalous behavior successful login

How to remediate

If the activity is unexpected for the associated database, AWS recommends that you change the password of the associated database user, and review available audit logs for activity that the user performed. Medium and high severity findings might indicate an overly permissive access policy to the database, and user credentials might have been exposed or compromised. We recommend that you place the database in a private virtual private cloud (VPC), and limit the security group rules to allow traffic only from necessary sources. For more information, see Remediating potentially compromised database with successful login events.

We recommend that you take the following steps to remediate this finding:

Remediation step 1: Identify the affected database and user

Identify the affected database and user and confirm whether the behavior is expected or unexpected by looking through the GuardDuty finding details, which provide the name of the affected database instance and the corresponding user details. Use the findings to confirm if the behavior is expected or not—for example, the findings might help you identify a user who logs in to their database instance after a long time has passed; a user who logs in to their database instance only occasionally, such as a financial analyst who logs in each quarter; or a suspicious actor who is involved in a successful login attempt that isn’t authorized and potentially compromises the database instance. Review the IP address of the finding. Public IP addresses might signify overly permissive access if it’s not a known network associated with your account.

Figure 4: Finding with details showing Amazon RDS database instance and user details

Figure 4: Finding with details showing Amazon RDS database instance and user details

If the behavior is unexpected, complete the following steps:

Remediation step 2: Restrict database instance credential access

Restrict database instance access for the suspected accounts and the source of the login activity. For more information, see Remediating potentially compromised credentials and Restrict network access. You can identify the user in the RDS DB user details section within the finding panel in the console, or within the resource.rdsDbUserDetails of the findings JSON. These user details include user name, application used, database accessed, SSL version, and authentication method.

To revoke access or rotate passwords for specific users that are involved in the finding, see Security with Amazon Aurora MySQL or Security with Amazon Aurora PostgreSQL. To securely store and automatically rotate the secrets for RDS databases, use AWS Secrets Manager. For more information, see AWS Secrets Manager tutorials. To manage database users’ access without the need for passwords, use IAM database authentication. For more information, see Security best practices for Amazon RDS.

The following CLI command is an example of how to revoke access to a user in a MySQL database. If the behavior is unexpected, you can revoke the privileges while you assess if the user is malicious.

REVOKE CONNECTION_ADMIN ON *.* FROM 'fakeadmin'@'%';

You can revoke privileges from the user, but when taking this action, you should make sure that the user isn’t vital to your system and that revoking permissions won’t break your production or development application. The following CLI command is an example of how to revoke privileges from a user:

REVOKE ALL PRIVILEGES ON *.* FROM 'fakeadmin'@'%';

If you know that the user isn’t necessary for your database or application to function, then you can remove the user from the system. To make sure that your security team can run forensics, check your company’s incident response policy. If you need help getting started with incident response, see AWS sample incident response playbooks. The following CLI command is an example of how to remove a user:

DROP USER 'fakeadmin'@'%';

Let’s say that you find the behavior unexpected, but the user turns out to be the application user, and making a change to the database credential will break your application. You can use AWS Systems Manager to help in this scenario, in which the affected RDS user is the account that is tied to your application. In many cases, a password rotation can break your application, depending on how you connect. If you rotate the password without notifying your application, the application might require additional cascading changes. You could lose connectivity to your application because the credentials that your application is using to connect to your database didn’t change, and now you are experiencing an outage that will remain until you update the credentials. Systems Manager can tie into your application code to automatically update the rotated database credentials in your application. For more information, see Rotate Amazon RDS database credentials automatically with AWS Secrets Manager.

The following figure shows a CLI command to get a secret from Secrets Manager — for this example, we assume the secret is compromised.

Figure 5: Example compromised credentials

Figure 5: Example compromised credentials

The following figures shows that we have a new set of credentials that replace our old credentials, as indicated by “CreatedDate”.

Figure 6: Example remediated credentials

Figure 6: Example remediated credentials

Remediation step 3: Assess the impact and determine what information was accessed

If available, review the audit logs to identify which information might have been accessed. For more information, see Monitoring events, logs, and streams in an Amazon Aurora DB cluster. Determine if sensitive or protected information was accessed or modified.

Remediation step 4: Restrict database instance network access

Restrict database instance access for the suspected accounts and the source of the login activity. For more information, see Remediating potentially compromised credentials and Restrict network access.

To learn how to restrict IP access on a security group, see Control traffic to resources using security groups. You can identify the user in the RDS DB user details section within the finding panel in the console, or within the resource.rdsDbUserDetails of the findings JSON. These user details include user name, application used, database accessed, SSL version, and authentication method.

Remediation step 5: Perform root-cause analysis and determine the steps that potentially led to this activity

Implementing a lessons-learned framework and methodology can help improve your incident response capabilities and also help prevent the incident from recurring. By learning from each incident, you can help avoid repeating the same mistakes, exposures, or misconfigurations, which can both improve your security posture and reduce the time lost to preventable situations. To learn more about post-incident activity, see AWS Security Incident Response Guide.

You can set up an alert to be notified when an activity modifies a networking policy and creates an insecure state by using AWS Config and Amazon Simple Notification Service (Amazon SNS). You can use an EventBridge rule with a custom event pattern and an input transformer to match an AWS Config evaluation rule output as NON_COMPLIANT. Then, you can route the response to an Amazon SNS topic. For more information, see How can I be notified when an AWS resource is non-compliant using AWS Config? or Firewall policies in AWS Network Firewall.

CredentialAccess:RDS/AnomalousBehavior.SuccessfulBruteForce

The CredentialAccess:RDS/AnomalousBehavior.successfulBruteForce finding informs you that an anomalous login occurred that is indicative of a successful brute force event, as observed on an RDS database in your AWS environment. Before the anomalous successful login, a consistent pattern of unusual failed login attempts was observed. This indicates that the user and password associated with the RDS database in your account might have been compromised, and a potentially malicious actor might have accessed the RDS database. The Severity of this finding is high. Figure 7 shows an example of this finding.

Figure 7: Example of an anomalous successful brute force finding

Figure 7: Example of an anomalous successful brute force finding

How to remediate

This activity indicates that database credentials might have been exposed or compromised. We recommend that you change the password of the associated database user, and review available audit logs for activity performed by the potentially compromised user. A consistent pattern of unusual failed login attempts indicates an overly permissive access policy to the database, or that the database might also have been publicly exposed. AWS recommends that you place the database in a private VPC, and limit the security group rules to allow traffic only from necessary sources. For more information, see Remediating potentially compromised database with successful login events.

We recommend that you take the following steps to remediate this finding

Remediation step 1: Identify the affected database and user

The generated GuardDuty finding provides the name of the affected database instance and the corresponding user details. For more information, see Finding details.

Figure 8: Finding details showing Amazon RDS database instance and user details

Figure 8: Finding details showing Amazon RDS database instance and user details

Remediation step 2: Identify the source of the failed login attempts

In the generated GuardDuty finding, you can find the IP address, and if it was a public connection, the ASN organization in the Actor section of the finding panel. An autonomous system is a group of one or more IP prefixes (lists of IP addresses accessible on a network) run by one or more network operators that maintain a single, clearly-defined routing policy. Network operators need autonomous system numbers (ASNs) to control routing within their networks and to exchange routing information with other internet service providers.

Figure 9: Action and actor details related to GuardDuty brute force finding

Figure 9: Action and actor details related to GuardDuty brute force finding

Remediation step 3: Confirm that the behavior is unexpected

Examine if this activity represents an attempt to gain additional unauthorized access to the database instance as follows:

  • If the source is internal to your network, examine if an application is misconfigured and attempting a connection repeatedly.
  • If this is an external actor, examine whether the corresponding database instance is public facing or is misconfigured and thus allowing potential malicious actors to attempt to log in with common user names.

If the behavior is unexpected, complete the following steps:

Remediation step 4: Restrict database instance access

Restrict database instance access for the suspected accounts and the source of the login activity. For more information, see Remediating potentially compromised credentials and Restrict network access.

As discussed previously for the CredentialAccess:RDS/AnomalousBehavior.SuccessfulLogin finding, you can restrict access to the database through credentials or network access:

Remediation step 5: Perform root-cause analysis and determine the steps that potentially led to this activity

By learning from each incident, you can help avoid repeating the same mistakes, exposures, or misconfigurations, which can both improve your security posture and reduce time lost to preventable situations.

Conclusion

In this post, you learned about the new GuardDuty RDS Protection feature and how to understand, operationalize, and respond to the new findings. You can enable this feature through the GuardDuty console, CLI, or APIs to start monitoring your Amazon RDS workloads today.

If you’ve created EventBridge rules to send findings from GuardDuty to a target, make sure that you’ve configured your rules to deliver the newly added findings. After you enable GuardDuty findings, consider creating IR playbooks, doing tabletops and AWS gamedays, and mapping out what you want to automate. For more information, see the AWS Security Incident Response Guide and AWS Incident Response Playbook resources. To gain hands-on experience with different AWS Security services, see AWS Activation Days. The Activation Days workshops begin with hands-on work with different services in sandbox accounts, and then take you through the steps to deploy them across your organization.

To make it more efficient for you to operate securely on AWS, we are committed to continually improving GuardDuty, and we value your feedback. If you have feedback about this post, submit comments in the Comments section below. If you have questions about this post, start a new thread on AWS re:Post or contact AWS Support.

Want more AWS Security news? Follow us on Twitter.

Author

Marshall Jones

Marshall is a senior security specialist solutions architect at AWS. His background is in AWS consulting and security architecture, focused on a variety of security domains including edge, threat detection, and compliance. Today, he helps enterprise customers adopt and operationalize AWS security services to increase security effectiveness and reduce risk.

Deric Martinez

Deric Martinez

Deric is a Solutions Architect with Amazon Web Services currently supporting non-profit organizations. He enjoys helping customers solve their technology problems by leveraging the power of AWS Cloud. His interests include security, threat detection and incident response, and data analytics.

How the coronation of King Charles III affected Internet traffic

Post Syndicated from João Tomé original http://blog.cloudflare.com/how-the-coronation-of-king-charles-iii-affected-internet-traffic/

How the coronation of King Charles III affected Internet traffic

How the coronation of King Charles III affected Internet traffic

When major events in a country happen Internet traffic patterns are often impacted, depending on the type of event. But what about the coronation of a king or queen? There’s no similar precedent, with a worldwide impact, in the Internet age, except maybe the coronation of the king of Thailand, in 2019. The last time it happened in the United Kingdom was 70 years ago (June 2, 1953), with Queen Elizabeth II; it was the first British coronation to be fully televised. Neither the Internet nor ARPANET were around at the time.

Imagine a grand royal event (if you saw the broadcast or the news, there’s no need), filled with pomp and pageantry, that's so captivating it impacts Internet traffic. That's what happened during the coronation of Charles III and Camilla, the newly crowned king and queen of the United Kingdom and other Commonwealth realms. As the coronation ceremony unfolded, on Saturday morning, May 6, 2023, there were clear spikes and dips in traffic, each coinciding with key moments of the ceremony.

Then came Sunday, and with it, the Coronation Big Lunch event. As the nation sat down to enjoy a communal meal throughout the country, Internet traffic took a significant nosedive, dropping by as much as 18%. The Sunday trends didn't stop there. As night fell and Prince William took to the stage to deliver a speech during the Coronation Concert, there was a clear drop in Internet traffic. Monday, May 8, was a bank holiday in the UK in honor of the coronation, and after a weekend of outdoor coronation events, Internet traffic was buzzing, noticeably higher than usual.

In the past, we’ve seen Internet traffic drop when a national televised event is happening — last year, we saw it, including in the UK, during the Eurovision, although traffic does increase when results are in. Different types of events and broadcasts yield different Internet patterns.

How the coronation of King Charles III affected Internet traffic

Coronation day: a rollercoaster of Internet traffic

Let's take a closer look at coronation day, May 6, 2023, when Internet traffic in the UK had its own peaks and valleys. There were moments when the digital realm seemed to hold its breath, with traffic dipping to its lowest points. The arrival of the royals and their guests marked one such moment. As the anticipation built and all eyes turned to the grand entrances, Internet traffic dipped to a notable 7% lower than the previous week.

Here's a play-by-play of the day's traffic trends, compared to the previous week. We’re using a 15-minute granularity, and aligning with key events as reported live by the BBC:

Traffic decreases (Saturday, May 6, 2023)

Rank by drop (compared with previous week) Coronation events (from the BBC)
#1 — 10:45-11:00 local time (-7% in traffic) When the royals and guests were arriving at Westminster Abbey. The King and Queen arrived at 11:00.
#2 — 12:00 (-2%) When King Charles III (12:02) was crowned.
#3 — 13:00 (-3%) When King Charles and Queen Camilla left Westminster Abbey. The Coronation Procession started.

On Saturday, May 6, 2023, a downward trend in traffic began after 06:15, with traffic 5% lower than the previous week. This trend shifted to a traffic increase after 11:15 (+6%), coinciding with the ongoing ceremony. The exceptions were the previously mentioned traffic dips. The following table illustrates clear traffic spikes after significant moments, some of which are represented in the previous table. Here's a list of periods with higher growth:

Traffic increases (Saturday, May 6, 2023)

Rank by increase (compared with previous week) Coronation events (from the BBC)
#1 — 14:45 local time (+14% in traffic) This happened after the military flypast (14:35), when the royals were on the balcony of Buckingham Palace.
#2 — 12:30 (+13.7%) After King Charles III was crowned at 12:02 (at which time traffic dropped 2%) and after Queen Camilla (12:16) was crowned, when a choir was singing Agnus Dei (12:30).
#3 — 15:30-16:15 (+13%) During the highlights of the event and reactions from royal fans.
#4 — 14:00 (+13%). When the UK’s national anthem was played in the gardens of Buckingham Palace.
#5 — 11:30 (+11%). Just after the coronation oath and during the choir’s singing.

As guests and royals arrived and during moments like the king's crowning, Internet traffic noticeably dropped. However, during parts of the ceremony such as the choir singing, Internet traffic seemed to increase. That was also clear after the military flypast, over the Buckingham Palace balcony.

The following chart illustrates UK Internet traffic during the weekend, with the purple dotted line representing the previous weekend.

How the coronation of King Charles III affected Internet traffic

On a daily basis, daily traffic was 4% higher on Saturday, May 6, compared to the previous Saturday.

The Big Lunch and Prince William’s speech

Another trend from the coronation weekend relates to the events that took place on Sunday, May 7. Internet trends here align with what we observed almost a year ago during Queen Elizabeth II's Platinum Jubilee. Sunday was a day of celebration with both the Coronation Big Lunch (where neighbors and communities were invited to share food and fun together across the country) and the Coronation Concert taking place.

Next, we present the percentages of increase/decrease in requests during this past weekend, compared with the previous week (a slightly different perspective from the previous chart):

How the coronation of King Charles III affected Internet traffic

On Sunday, May 7, it's clear that UK traffic was lower than usual right after 07:00 local time (-2% in traffic), but it dropped the most after 12:00 (-5%), compared to the previous week. The moment with the biggest drop in traffic, compared to the previous week, was between 14:15 and 15:30, when traffic was around 18% lower. That was still Big Lunch time, given that it’s a multiple hour event full of “food and fun” — there were more than 65,000 Coronation Big Lunch events around the UK. During last year's Queen Elizabeth II's Platinum Jubilee, traffic dropped as much as 25% on Sunday, June 5, 2022, at 15:00.

At night, the Coronation Concert took center stage, broadcast live from Windsor Castle on the BBC after 20:00. The lineup included musical guests such as Take That, Lionel Richie, Katy Perry, and Andrea Bocelli. However, the star of the event, at least in terms of when Internet traffic was at its lowest that evening, was William, Prince of Wales. Cloudflare observed another significant drop in traffic, compared to the previous week, around 21:15-21:30, when traffic was 7% lower than the previous week. At that time, Lionel Richie had just performed, and Prince William was on stage for a special address to the king.

In terms of daily traffic, if on Coronation Saturday we saw an increase (4%), on Coronation Sunday there was a 6% drop compared to the previous week. On Monday, the coronation bank holiday, there weren't any major coronation events, and traffic was 4% higher than the previous week (May 1, also a bank holiday in the UK).

Coronation, a mobile devices day

Zooming in on the distribution of traffic from mobile devices, we find that Saturday, May 6, stands out in 2023. On this day, mobile traffic accounted for 61% of total traffic, a figure only matched by April 15 and January 1, 2023. Similarly, Sunday, May 7, was one of the Sundays with the highest percentage of mobile traffic, at 60%. This percentage was only surpassed by Easter Sunday, April 9 (60.4%), and, unsurprisingly, January 1, 2023 (61%).

How the coronation of King Charles III affected Internet traffic

Wales sees the largest Sunday drop in Internet traffic

Which UK countries were more impacted? Looking at both coronation weekend days, we saw a similar pattern (growth in traffic at around the time of the coronation ceremony on Saturday, and decrease on Sunday) in all of them. Looking at the Sunday drop, England had as much as 16% in traffic at 15:30; Scotland had as much as a 17% drop at around 13:30; Wales had as much as a 19% drop at around 15:00; and Northern Ireland had as much as an 18% drop in traffic, compared to the previous week, at the same time. Wales had the biggest drop.

How the coronation of King Charles III affected Internet traffic

From Canada to Australia

Last year, in early June, we observed the impact of Queen Elizabeth II’s Platinum Jubilee on the Internet in the UK. This event, which celebrated the first British monarch to reach a 70th anniversary on the throne, caused a significant drop in traffic, as much as 25% (on Sunday, June 5, 2022). This trend was also noticeable in other Commonwealth countries.

Several Commonwealth countries also held notable events to celebrate both the Queen’s Platinum Jubilee and the recent coronation. In Canada, events and activities related to the coronation mirrored those for the Queen’s Platinum Jubilee. Whether related or not, we observed on Saturday, May 6, as much as an ~8% drop in Internet traffic compared to the previous week, between 09:30 and 16:30 Toronto time. On Sunday, the drop was even larger, with about 10% less traffic between 10:30 and 12:00.

How the coronation of King Charles III affected Internet traffic

In Australia, the difference in traffic wasn't as pronounced as in Canada. However, traffic was 7% lower than the previous week at 20:00 Sydney time (10:00 UTC), when the coronation ceremony began on May 6. This was the only period over the past weekend when traffic was lower than the previous one.

And what about the impact on DNS traffic to our 1.1.1.1 resolver from UK users? Social media apps certainly felt the ripple. Domains linked to social media platforms, which typically surge in popularity during major events, such as Twitter, experienced a notable uptick. We saw a 33% increase in DNS traffic in those around 14:00 local time on Saturday, May 6, compared to the previous week. By 18:00 on May 7, traffic had soared to 64% higher, and it remained elevated during the Coronation Concert: at 22:00, it was 36% higher.

Meanwhile, video-centric social media platforms, like TikTok, hit their peak at around 20:00 on May 7, when the Coronation Concert was starting, with a whopping 57% surge in DNS traffic.

How the coronation of King Charles III affected Internet traffic

During the coronation weekend, the peak period for DNS traffic to domains related to the royal family fell between 11:00 and 12:00 local time. In this hour, traffic was an impressive forty times higher than the same time the previous weekend (that growth is higher, more than 40x, when using a May 2022 baseline, as is seen in the next chart).

How the coronation of King Charles III affected Internet traffic

If we broaden our view to the past 12 months, we see that the domains associated with the royal family hit their highest point on the day Queen Elizabeth II passed away, September 8. Around 18:00 local time, DNS traffic was 12x higher than the previous week. This was followed by the day of Her Majesty's funeral, September 19, when around 11:00, DNS traffic was 6x higher than usual.

How the coronation of King Charles III affected Internet traffic

A similar impact was seen, related to the Queen's death, on British news organizations, in the past 12 months. September 8, around 18:00, was the peak of the whole year in terms of DNS traffic to news organizations, according to our data. At that time, DNS traffic was 263% higher than at the same time in the previous week. During the September 19 funeral, at 11:00, DNS traffic was 24% higher than before.

How the coronation of King Charles III affected Internet traffic

During the recent coronation weekend, DNS traffic to UK news organizations on Saturday, May 6, was higher than usual during the morning by as much as 47%, at 11:00, and continued higher than before mostly during that day.

September 8, 2022: The end of a 70-year reign

We already mentioned domain trends related to when Queen Elizabeth II passed away on September 8, 2022. But what about the impact on Internet traffic? We saw a 7% decrease in Internet traffic in the UK on that day at around 18:30 local time compared to the previous week, coinciding with the announcement of her death.

The following weekend, on Saturday, September 10, 2022, traffic was as much as 17% lower at 15:00. This was the day Charles was proclaimed the new king and people flocked to the royal palaces to pay their respects — Prince William and Kate, and Prince Harry and Meghan, paused outside Windsor Castle to read messages left by mourners.

How the coronation of King Charles III affected Internet traffic

Internet traffic dropped even further compared to the previous week during Queen Elizabeth II’s funeral: on September 19, 2022, traffic was 27% lower at 10:45. According to Wikipedia, this was when the Queen's coffin was transported from Westminster Hall to Westminster Abbey on the State Gun Carriage of the Royal Navy.

How the coronation of King Charles III affected Internet traffic

Old traditions in a recent medium

In this blog post, we've seen how a very old tradition, like the British coronation, can impact a very recent innovation, the Internet. Almost 70 years ago, Queen Elizabeth II's coronation was the first ever to be televised, at a time when television in the UK was less than 20 years old. The event, which took place at Westminster Abbey in London (the site of coronations since 1066), was watched by 27 million people in the UK alone and millions more around the world.

This time around, King Charles III's coronation could be viewed through that now old medium called television, or online, via streaming services. The Internet is much younger than Britain’s former monarch's reign or even Sir Tim Berners-Lee (born in 1955), and it was only 30 years ago that the World Wide Web protocol and code were made available royalty-free, enabling the web's widespread use.

Streaming media events online, on the other hand, at least on a large scale, are a more recent development — YouTube was launched in 2005. Looking at video platforms trends in the UK, we could see how DNS traffic was 13% higher at around 12:00, during the coronation ceremony, on May 6 — it was broadcast on YouTube.

How the coronation of King Charles III affected Internet traffic

British broadcasters, such as the BBC, also included a streaming version of the event. There, the increase in DNS traffic was even higher. Between 11:00 and 12:00, on May 6, DNS traffic was 197% higher than in the previous week.

How the coronation of King Charles III affected Internet traffic

The difference in DNS traffic to UK's streaming services was even more pronounced when Queen Elizabeth II passed away on September 8, with a 470% increase in DNS traffic around 18:00 compared to the previous week. During the Queen's funeral on September 19, DNS traffic was 150% higher around 11:00 compared to the previous week.

You can check Internet trends related to events such as Easter, Ramadan, an ongoing civil war or a relevant UK outage here in our blog. You can also monitor changes in Internet patterns as they occur on Cloudflare Radar or using the Radar API. On social media, we’re at @CloudflareRadar on Twitter or cloudflare.social/@radar on Mastodon.

The collective thoughts of the interwebz