Post Syndicated from Home Assistant original https://www.youtube.com/watch?v=nlbwmnLi4Ms
Announcing the GNU Toolchain Infrastructure Project
Post Syndicated from original https://lwn.net/Articles/909704/
The backers of the GNU Toolchain Infrastructure Project, which was the
subject of an intense discussion at the GNU
Tools Cauldron, have finally posted
their plans publicly.
Linux Foundation IT services plans for the GNU Toolchain include
Git repositories, mailing lists, issue tracking, web sites, and
CI/CD, implemented with strong authentication, attestation, and
security posture. Utilizing the experience and infrastructure of
the LF IT team that is already used by the Linux kernel community
will provide the most effective solution and best experience for
the GNU Toolchain developer community.
What’s New in InsightVM and Nexpose: Q3 2022 in Review
Post Syndicated from Roshnee Mistry Shah original https://blog.rapid7.com/2022/09/28/whats-new-in-insightvm-and-nexpose-q3-2022-in-review/

Another quarter comes to a close! While we definitely had our share of summer fun, our team continued to invest in the product, releasing features and updates like recurring coverage for enterprise technologies, performance enhancements, and more. Let’s take a look at some of the key releases in InsightVM and Nexpose from Q3.
[InsightVM and Nexpose] Recurring coverage for VMware vCenter
Recurring coverage provides ongoing, automatic vulnerability coverage for popular enterprise technology and systems. We recently added VMware vCenter to our list.
VMware vCenter Server is a centralized management platform used to manage virtual machines, ESXi hosts, and dependent components from a single host. Last year, vCenter was a significant target for bad actors and became the subject of a number of zero-days. Rapid7 provided ad hoc coverage to protect you against the vulnerabilities. Now, recurring coverage ensures fast, comprehensive protection that provides offensive and defensive security against vCenter vulnerabilities as they arise.
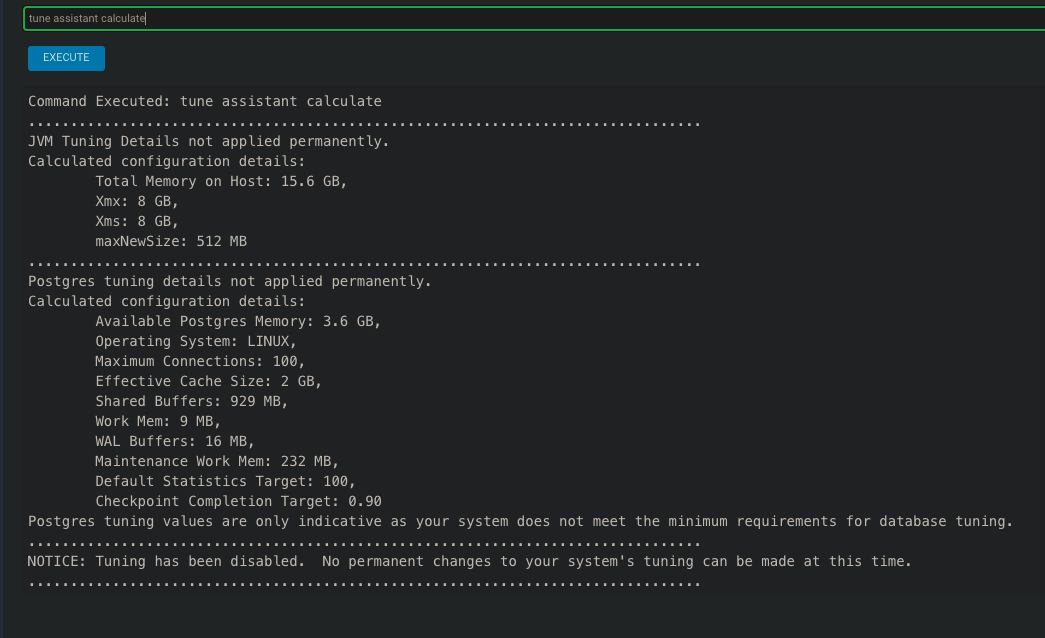
[InsightVM and Nexpose] Tune Assistant
The Security Console in InsightVM and Nexpose contains components that benefit from performance tuning. Tune Assistant is a built-in feature that will calculate performance tuning values based on resources allocated to the Security Console server, then automatically apply those values.
Tuning is calculated and applied to all new consoles when the product first starts up, and customers experiencing performance issues on existing consoles can now easily increase their own resources. For more information, read our docs page on configuring maximum performance in an enterprise environment.
[InsightVM and Nexpose] Windows Server 2022 Support
We want to ensure InsightVM and Nexpose are supported on business-critical technologies and operating systems. We added Windows Server 2022, the latest operating system for servers from Microsoft, to our list. The Scan Engine and Security Console can be installed and will be supported by Rapid7 on Windows Server 2022. Learn more about the systems we support.
[InsightVM and Nexpose] Checks for notable vulnerabilities
With exploitation of major vulnerabilities in Mitel MiVoice Connect, multiple Confluence applications, and other popular solutions, the threat actors definitely did not take it easy this summer. InsightVM and Nexpose customers can assess their exposure to many of these CVEs for vulnerability checks, including:
- Mitel MiVoice Connect Service Appliance | CVE-2022-29499: An onsite VoIP business phone system, MiVoice Connect had a data validation vulnerability, which arose from insufficient data validation for a diagnostic script. The vulnerability potentially allowed an unauthenticated remote attacker to send specially crafted requests to inject commands and achieve remote code execution. Learn more about the vulnerability and our response.
- “Questions” add-on for Confluence Application | CVE-2022-26138: This vulnerability affected “Questions,” an add-on for the Confluence application. It was quickly exploited in the wild once the hardcoded password was released on social media. Learn more about the vulnerability and our response.
- Multiple vulnerabilities in Zimbra Collaboration Suite: Zimbra, a business productivity suite, was affected by five different vulnerabilities, one of which was unpatched, and four of which were being actively and widely exploited in the wild by well-organized threat actors. Learn more about the vulnerability and our response.
- CVE-2022-30333
- CVE-2022-27924
- CVE-2022-27925
- CVE-2022-37042
- CVE-2022-37393
We were hard at work this summer making improvements and increasing the level of protections against attackers for our customers. As we head into the fall and the fourth quarter of the year, you can bet we will continue to make InsightVM the best and most comprehensive risk management platform available. Stay tuned for more great things, and have a happy autumn.
Additional reading:
Guadalajara: Mexico’s Pearl of the West
Post Syndicated from Geographics original https://www.youtube.com/watch?v=qRqgyozuI3M
ALP prototype ‘Les Droites’ is to be expected later this week (openSUSE News)
Post Syndicated from original https://lwn.net/Articles/909687/
The openSUSE News site is looking
forward to the imminent preview release of the openSUSE ALP
distribution:
As far as “Les Droites” goes, users can look forward to a SLE Micro
like HostOS with self-healing abilities contributing to our
OS-as-a-Service/ZeroTouch story. The Big Idea is that the user
focuses on the application rather than the underlying host, which
manages, heals, and self-optimizes itself. Both Salt
(pre-installed) and Ansible will be available to simplify further
management.Users can look forward to Full Disk Encryption (FDE) with TPM
support by default on x86_64. Another part of the deliverables are
numerous containerized system components including yast2, podman,
k3s, cockpit, Display Manager (GDM), and KVM. All of which users
can experiment with, which are simply referred to as Workloads.
A pile of stable kernel updates
Security updates for Wednesday
Post Syndicated from original https://lwn.net/Articles/909676/
Security updates have been issued by Debian (gdal, maven-shared-utils, thunderbird, webkit2gtk, and wpewebkit), Fedora (firefox and libofx), SUSE (dpdk, firefox, flatpak, grafana, kernel, libcaca, and opera), and Ubuntu (ghostscript and linux-gcp-5.15).
Announcing Turnstile, a user-friendly, privacy-preserving alternative to CAPTCHA
Post Syndicated from Reid Tatoris original https://blog.cloudflare.com/turnstile-private-captcha-alternative/

Today, we’re announcing the open beta of Turnstile, an invisible alternative to CAPTCHA. Anyone, anywhere on the Internet, who wants to replace CAPTCHA on their site will be able to call a simple API, without having to be a Cloudflare customer or sending traffic through the Cloudflare global network. Sign up here for free.
There is no point in rehashing the fact that CAPTCHA provides a terrible user experience. It’s been discussed in detail before on this blog, and countless times elsewhere. The creator of the CAPTCHA has even publicly lamented that he “unwittingly created a system that was frittering away, in ten-second increments, millions of hours of a most precious resource: human brain cycles.” We hate it, you hate it, everyone hates it. Today we’re giving everyone a better option.
Turnstile is our smart CAPTCHA alternative. It automatically chooses from a rotating suite of non-intrusive browser challenges based on telemetry and client behavior exhibited during a session. We talked in an earlier post about how we’ve used our Managed Challenge system to reduce our use of CAPTCHA by 91%. Now anyone can take advantage of this same technology to stop using CAPTCHA on their own site.
UX isn’t the only big problem with CAPTCHA — so is privacy
While having to solve a CAPTCHA is a frustrating user experience, there is also a potential hidden tradeoff a website must make when using CAPTCHA. If you are a small site using CAPTCHA today, you essentially have one option: an 800 pound gorilla with 98% of the CAPTCHA market share. This tool is free to use, but in fact it has a privacy cost: you have to give your data to an ad sales company.
According to security researchers, one of the signals that Google uses to decide if you are malicious is whether you have a Google cookie in your browser, and if you have this cookie, Google will give you a higher score. Google says they don’t use this information for ad targeting, but at the end of the day, Google is an ad sales company. Meanwhile, at Cloudflare, we make money when customers choose us to protect their websites and make their services run better. It’s a simple, direct relationship that perfectly aligns our incentives.
Less data collection, more privacy, same security
In June, we announced an effort with Apple to use Private Access Tokens. Visitors using operating systems that support these tokens, including the upcoming versions of macOS or iOS, can now prove they’re human without completing a CAPTCHA or giving up personal data.
By collaborating with third parties like device manufacturers, who already have the data that would help us validate a device, we are able to abstract portions of the validation process, and confirm data without actually collecting, touching, or storing that data ourselves. Rather than interrogating a device directly, we ask the device vendor to do it for us.
Private Access Tokens are built directly into Turnstile. While Turnstile has to look at some session data (like headers, user agent, and browser characteristics) to validate users without challenging them, Private Access Tokens allow us to minimize data collection by asking Apple to validate the device for us. In addition, Turnstile never looks for cookies (like a login cookie), or uses cookies to collect or store information of any kind. Cloudflare has a long track record of investing in user privacy, which we will continue with Turnstile.
We are opening our CAPTCHA replacement to everyone
To improve the Internet for everyone, we decided to open up the technology that powers our Managed Challenge to everyone in beta as a standalone product called Turnstile.
Rather than try to unilaterally deprecate and replace CAPTCHA with a single alternative, we built a platform to test many alternatives and rotate new challenges in and out as they become more or less effective. With Turnstile, we adapt the actual challenge outcome to the individual visitor/browser. First we run a series of small non-interactive JavaScript challenges gathering more signals about the visitor/browser environment. Those challenges include proof-of-work, proof-of-space, probing for web APIs, and various other challenges for detecting browser-quirks and human behavior. As a result, we can fine-tune the difficulty of the challenge to the specific request.
Turnstile also includes machine learning models that detect common features of end visitors who were able to pass a challenge before. The computational hardness of those initial challenges may vary by visitor, but is targeted to run fast.
Swap out your existing CAPTCHA in a few minutes
You can take advantage of Turnstile and stop bothering your visitors with a CAPTCHA even without being on the Cloudflare network. While we make it as easy as possible to use our network, we don’t want this to be a barrier to improving privacy and user experience.
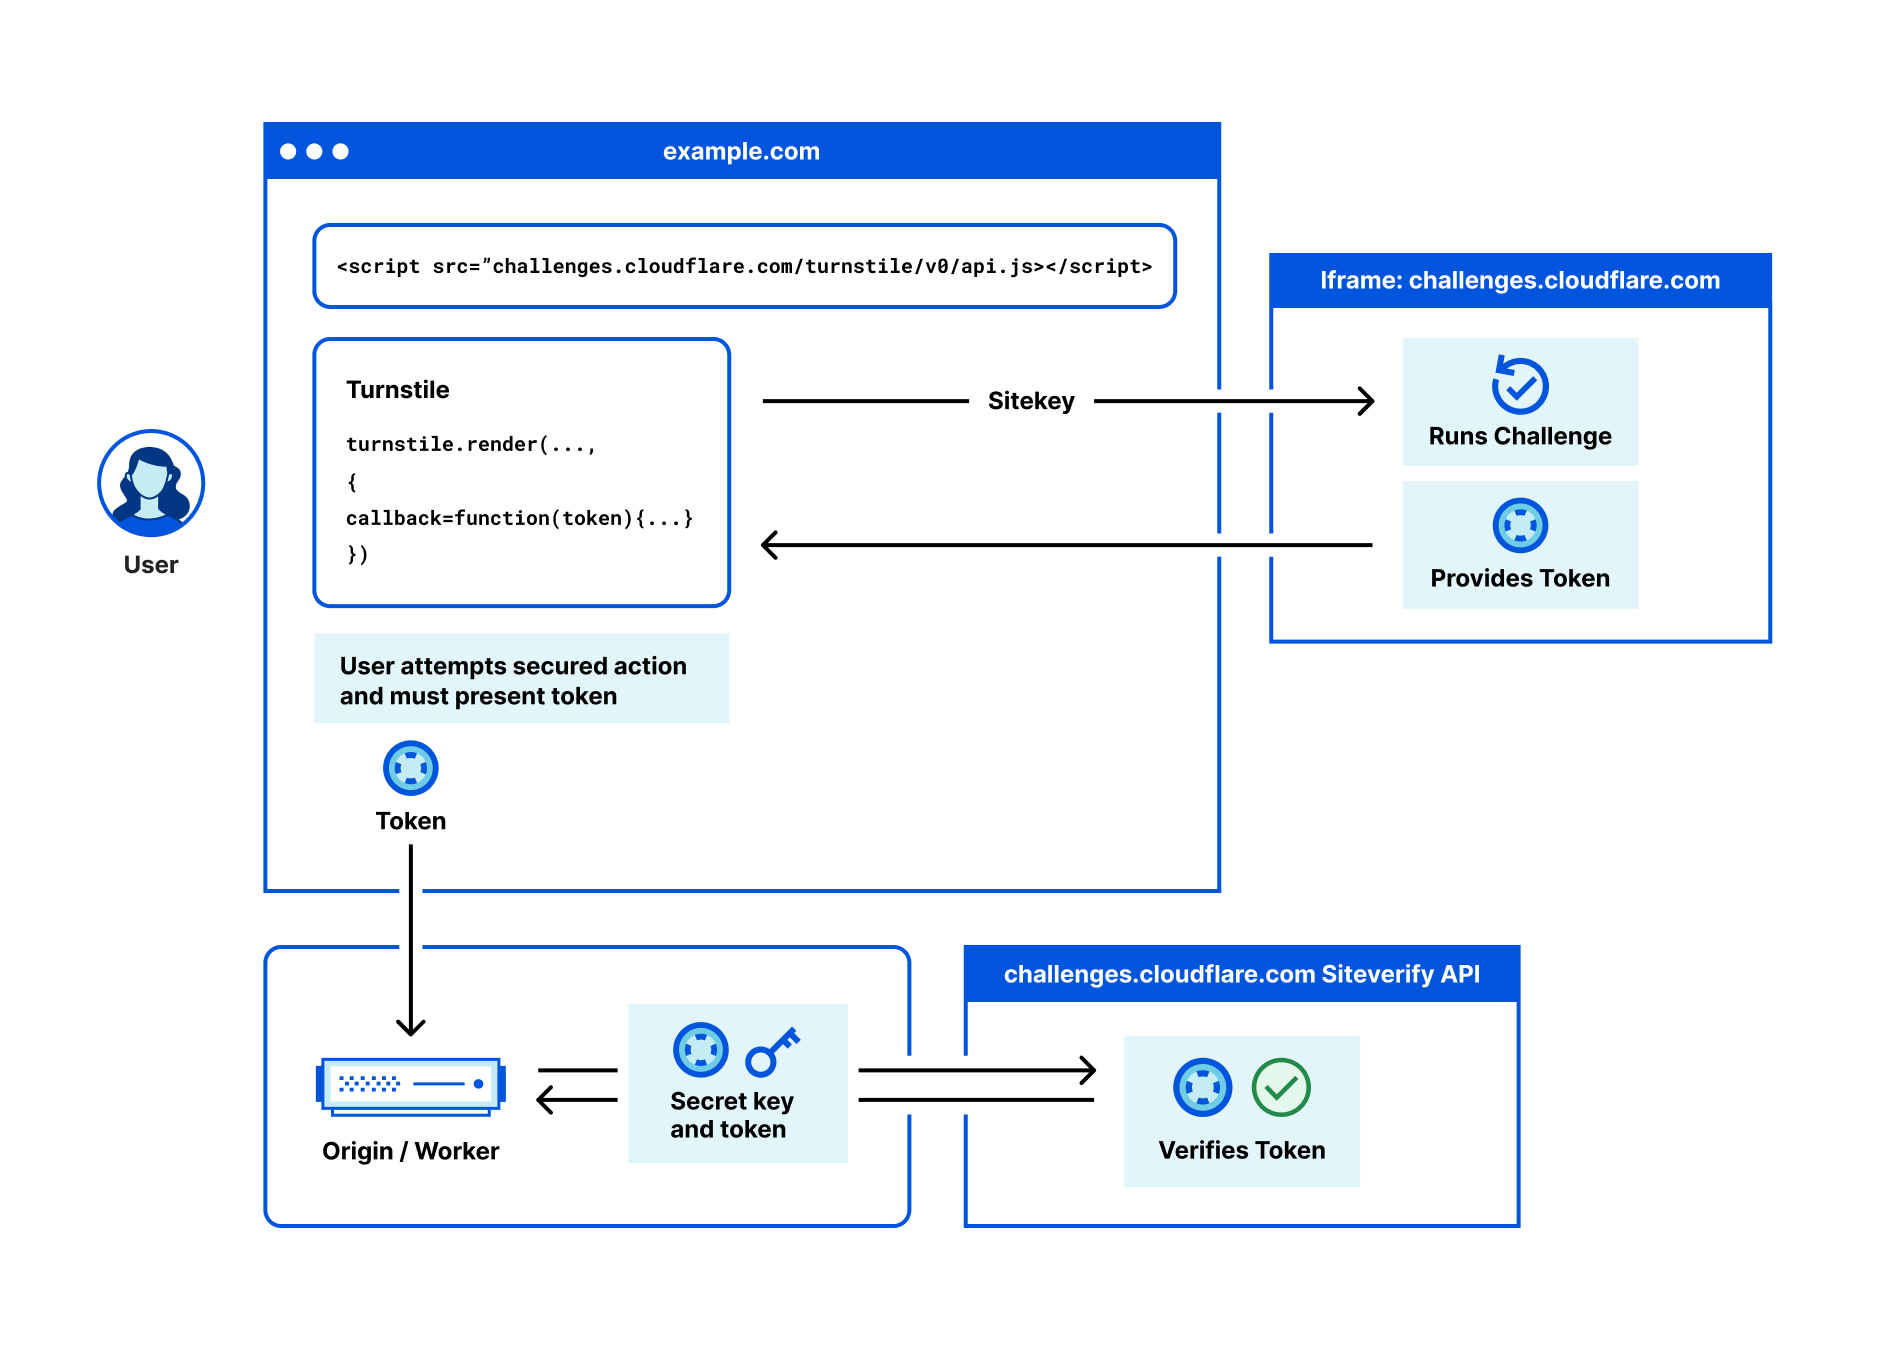
To switch from a CAPTCHA service, all you need to do is:
- Create a Cloudflare account, navigate to the `Turnstile` tab on the navigation bar, and get a sitekey and secret key.
- Copy our JavaScript from the dashboard and paste over your old CAPTCHA JavaScript.
- Update the server-side integration by replacing the old siteverify URL with ours.
There is more detail on the process below, including options you can configure, but that’s really it. We’re excited about the simplicity of making a change.
Deployment options and analytics
To use Turnstile, first create an account and get your site and secret keys.
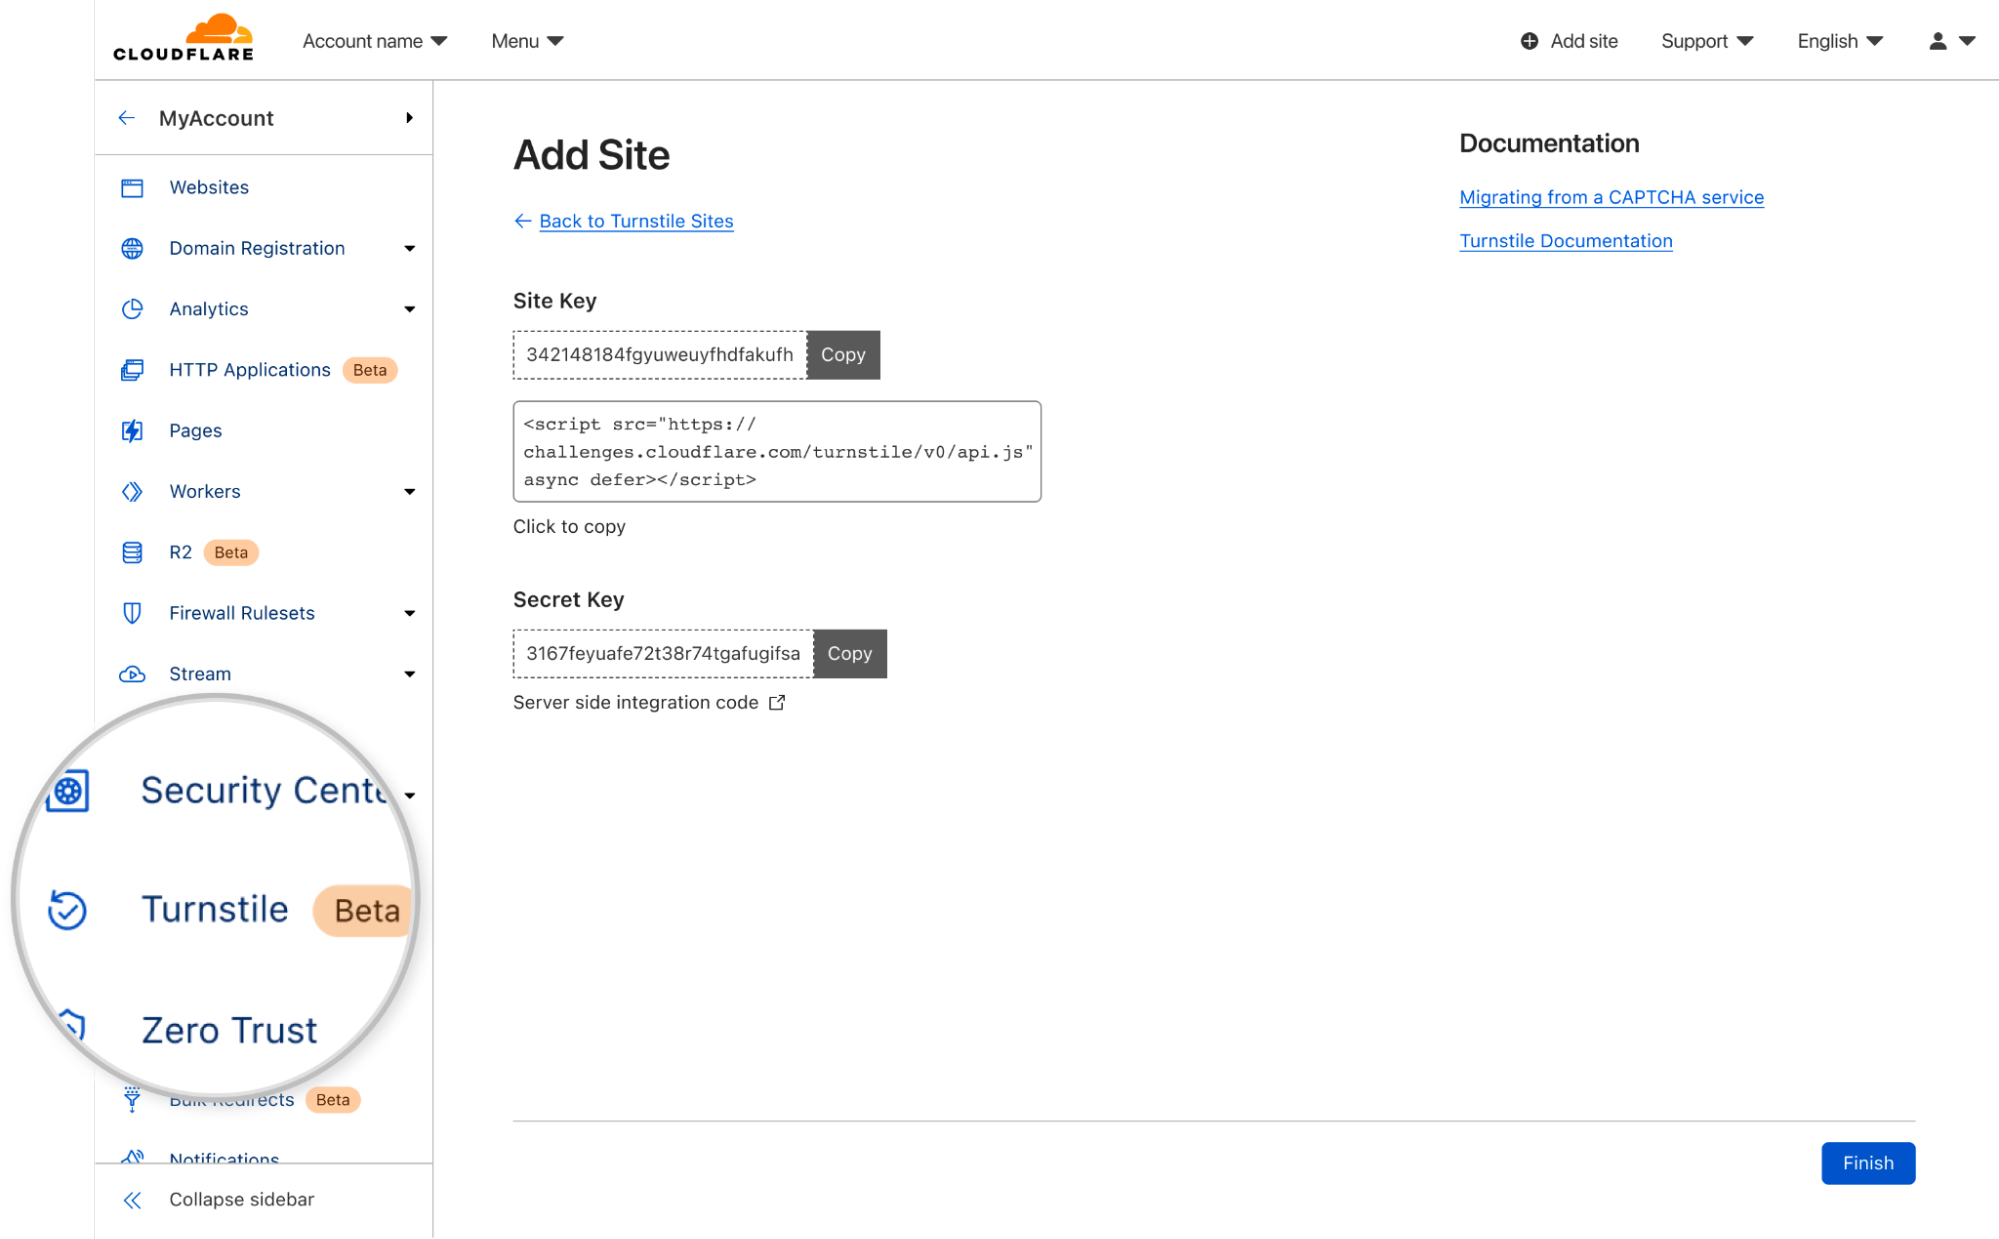
Then, copy and paste our HTML snippet:
<script src="https://challenges.cloudflare.com/turnstile/v0/api.js" async defer></script>
Once the script is embedded, you can use implicit rendering. Here, the HTML is scanned for elements that have a cf-turnstile class:
<form action="/login" method="POST">
  <div class="cf-turnstile" data-sitekey="yourSiteKey"></div>
  <input type="submit">
</form>
Once a challenge has been solved, a token is injected in your form, with the name cf-turnstile-response. This token can be used with our siteverify endpoint to validate a challenge response. A token can only be validated once, and a token cannot be redeemed twice. The validation can be done on the server side or even in the cloud, for example using a simple Workers fetch (see a demo here):
async function handleRequest() {
    // ... Receive token
    let formData = new FormData();
    formData.append('secret', turnstileISecretKey);
    formData.append('response', receivedToken);

    await fetch('https://challenges.cloudflare.com/turnstile/v0/siteverify',
        {
            body: formData,
            method: 'POST'
        });
    // ...
}
For more complex use cases, the challenge can be invoked explicitly via JavaScript:
<script>
    window.turnstileCallbackFunction = function () {
        const turnstileOptions = {
            sitekey: 'yourSitekey',
            callback: function(token) {
                console.log(`Challenge Success: ${token}`);
            }
        };
        turnstile.render('#container', turnstileOptions);
    };
</script>
<div id="container"></div>
You can also create what we call ‘Actions’. Custom labels that allow you to distinguish between different pages where you’re using Turnstile, like a login, checkout, or account creation page.
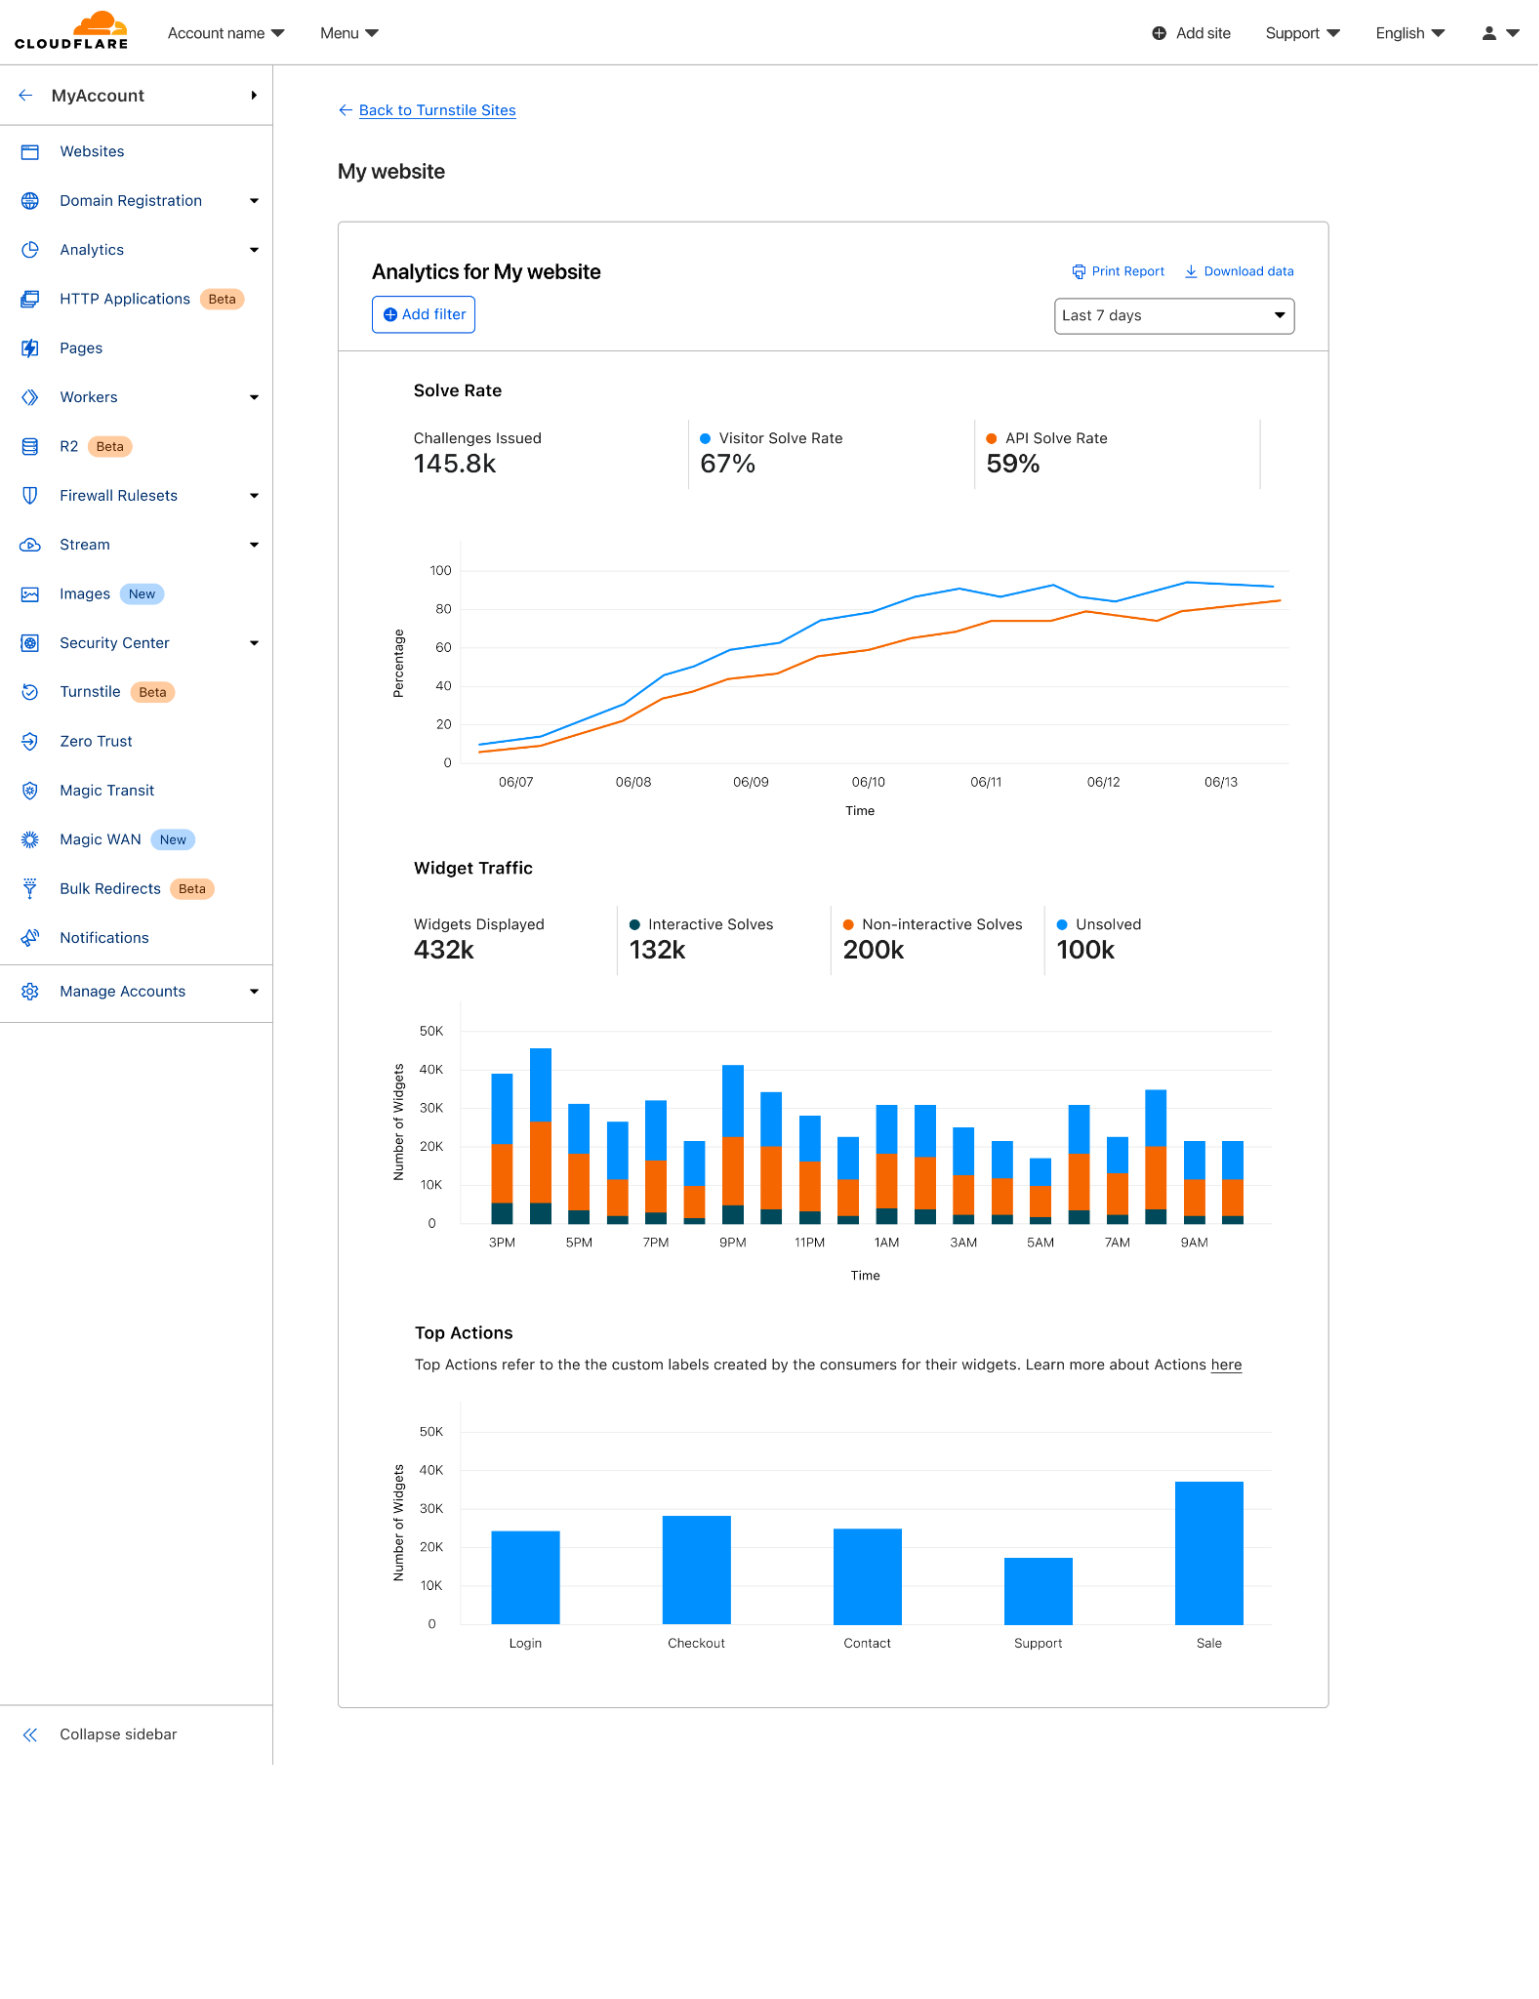
Once you’ve deployed Turnstile, you can go back to the dashboard and see analytics on where you have widgets deployed, how users are solving them, and view any defined actions.
Why are we giving this away for free?
While this is sometimes hard for people outside to believe, helping build a better Internet truly is our mission. This isn’t the first time we’ve built free tools that we think will make the Internet better, and it won’t be the last. It’s really important to us.
So whether or not you’re a Cloudflare customer today, if you’re using a CAPTCHA, try Turnstile for free, instead. You’ll make your users happier, and minimize the data you send to third parties.
Visit this page to sign up for the best invisible, privacy-first, CAPTCHA replacement and to retrieve your Turnstile beta sitekey.
We’ve shipped so many products the Cloudflare dashboard needed its own search engine
Post Syndicated from Emily Flannery original https://blog.cloudflare.com/quick-search-beta/


Today we’re proud to announce our first release of quick search for the Cloudflare dashboard, a beta version of our first ever cross-dashboard search tool to help you navigate our products and features. This first release is now available to a small percentage of our customers. Want to request early access? Let us know by filling out this form.
What we’re launching
We’re launching quick search to speed up common interactions with the Cloudflare dashboard. Our dashboard allows you to configure Cloudflare’s full suite of products and features, and quick search gives you a shortcut.
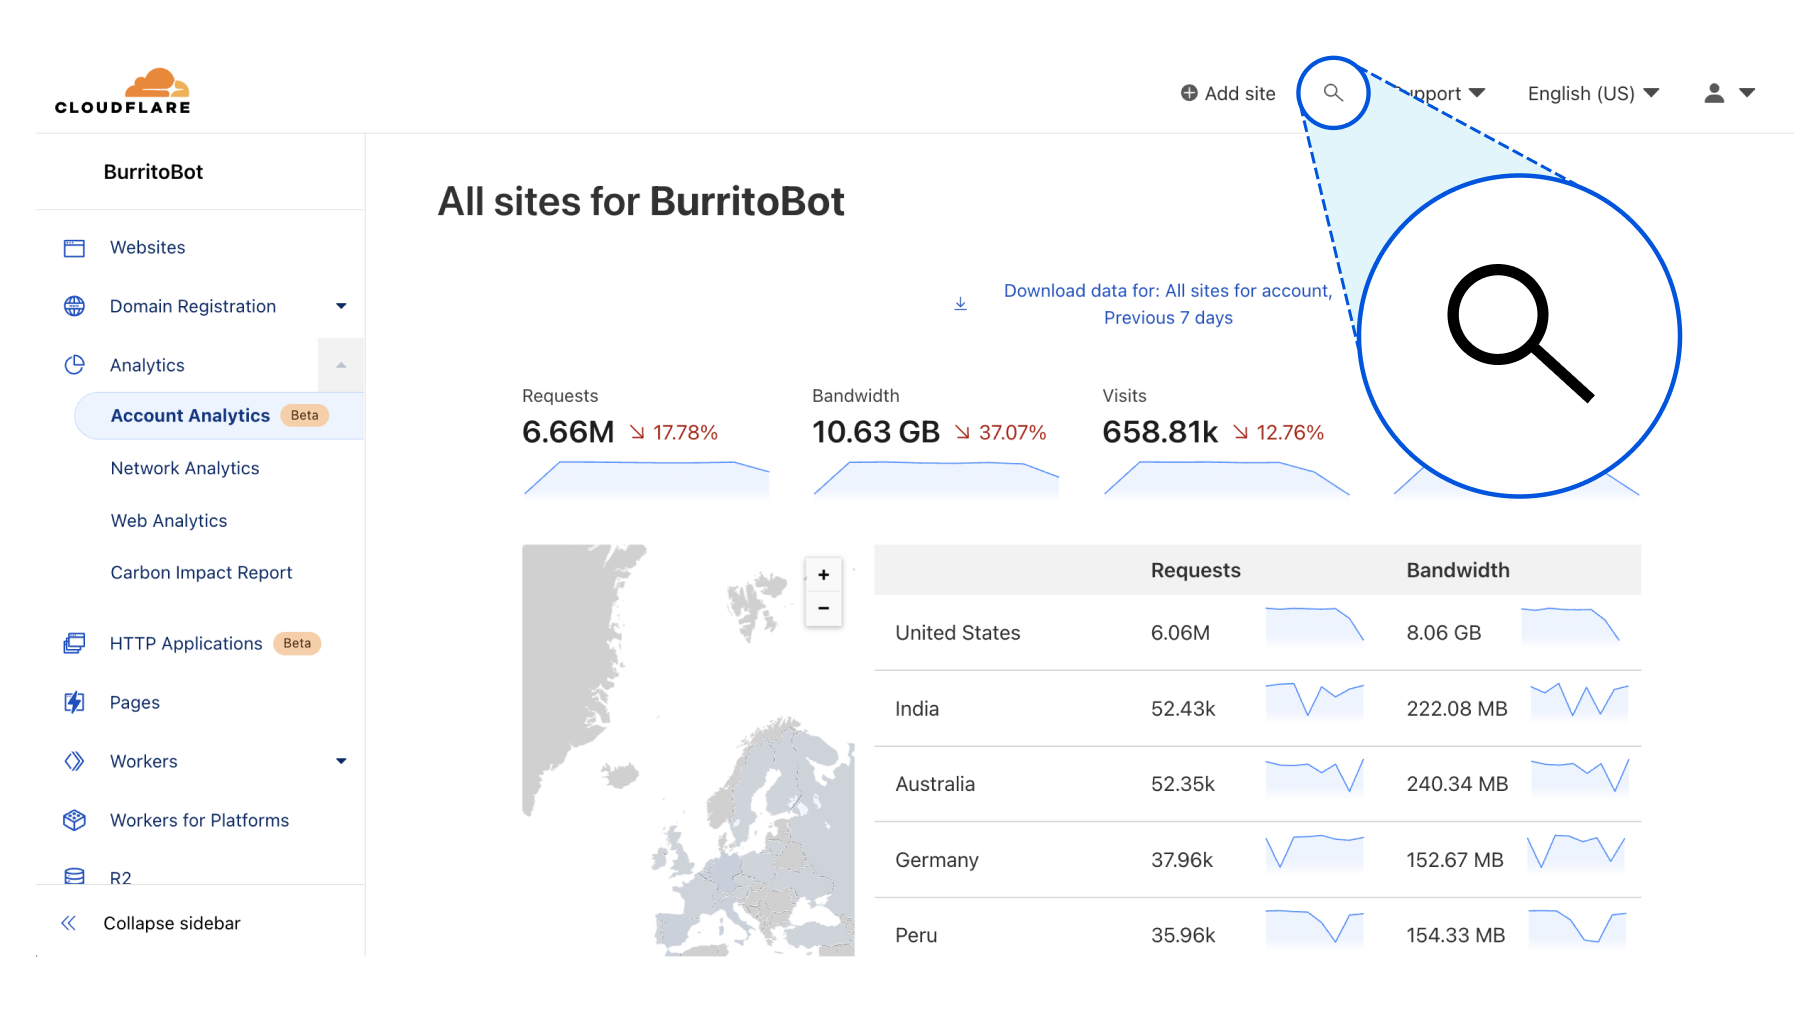
To get started, you can access the quick search tool from anywhere within the Cloudflare dashboard by clicking the magnifying glass button in the top navigation, or hitting Ctrl + K on Linux and Windows or ⌘ + K on Mac. (If you find yourself forgetting which key combination it is just remember that it’s ⌘ or Ctrl-K-wik.) From there, enter a search term and then select from the results shown below.
Current supported functionality
What functionality will you have access to? Below you’ll learn about the three core capabilities of quick search that are included in this release, as well as helpful tips for using the tool.
Search for a page in the dashboard
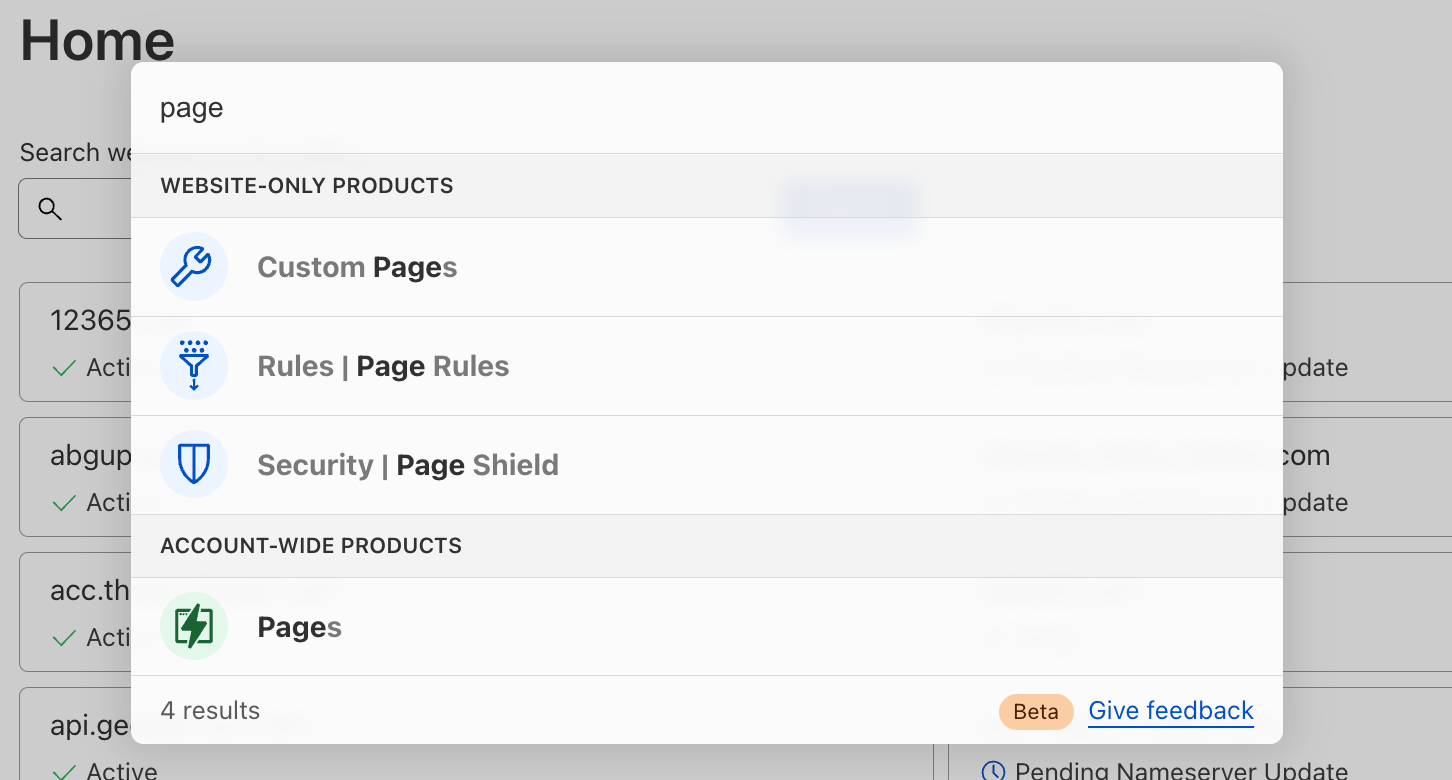
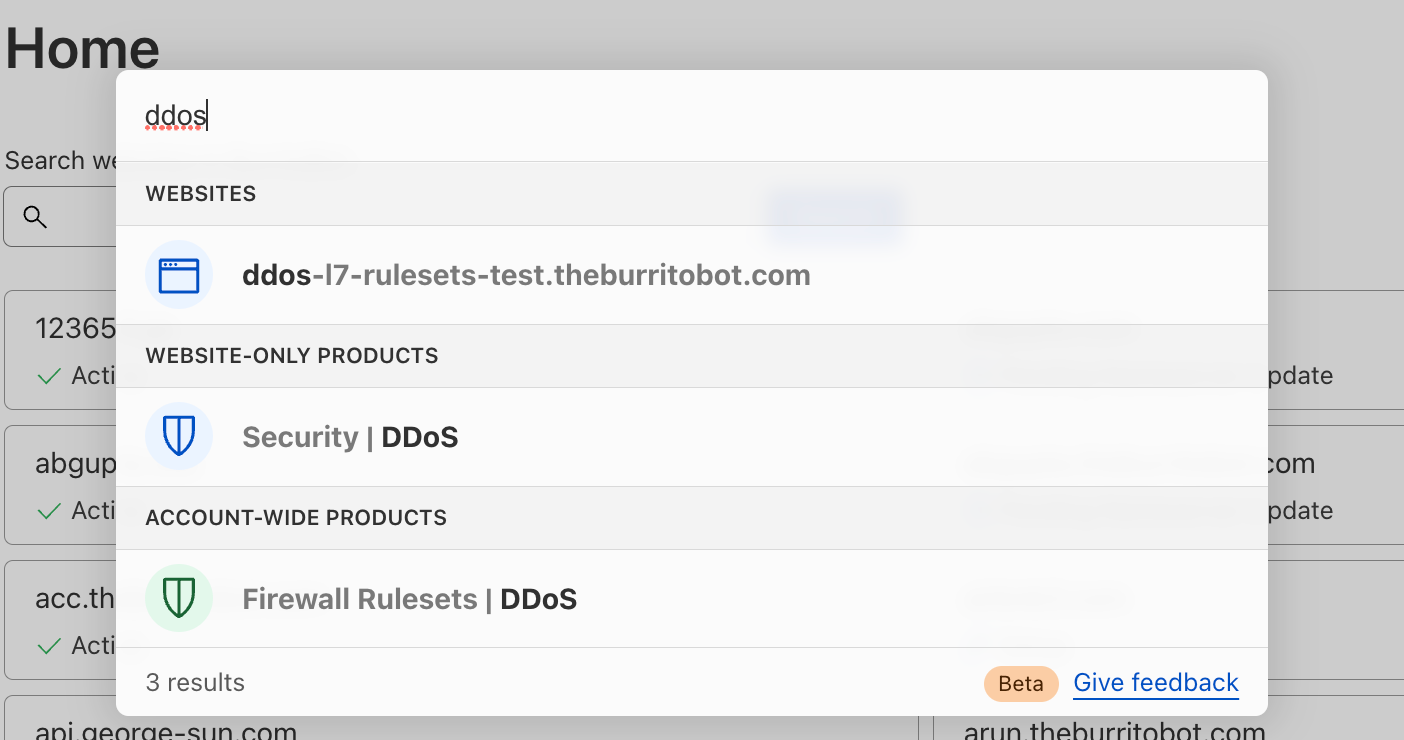
Start typing in the name of the product you’re looking for, and we’ll load matching terms after each key press. You will see results for any dashboard page that currently exists in your sidebar navigation. Then, just click the desired result to navigate directly there.
Search for website-only products
For our customers who manage a website or domain in Cloudflare, you have access to a multitude of Cloudflare products and features to enhance your website’s security, performance and reliability. Quick search can be used to easily find those products and features, regardless of where you currently are in the dashboard (even from within another website!).
You may easily search for your website by name to navigate to your website’s Overview page:
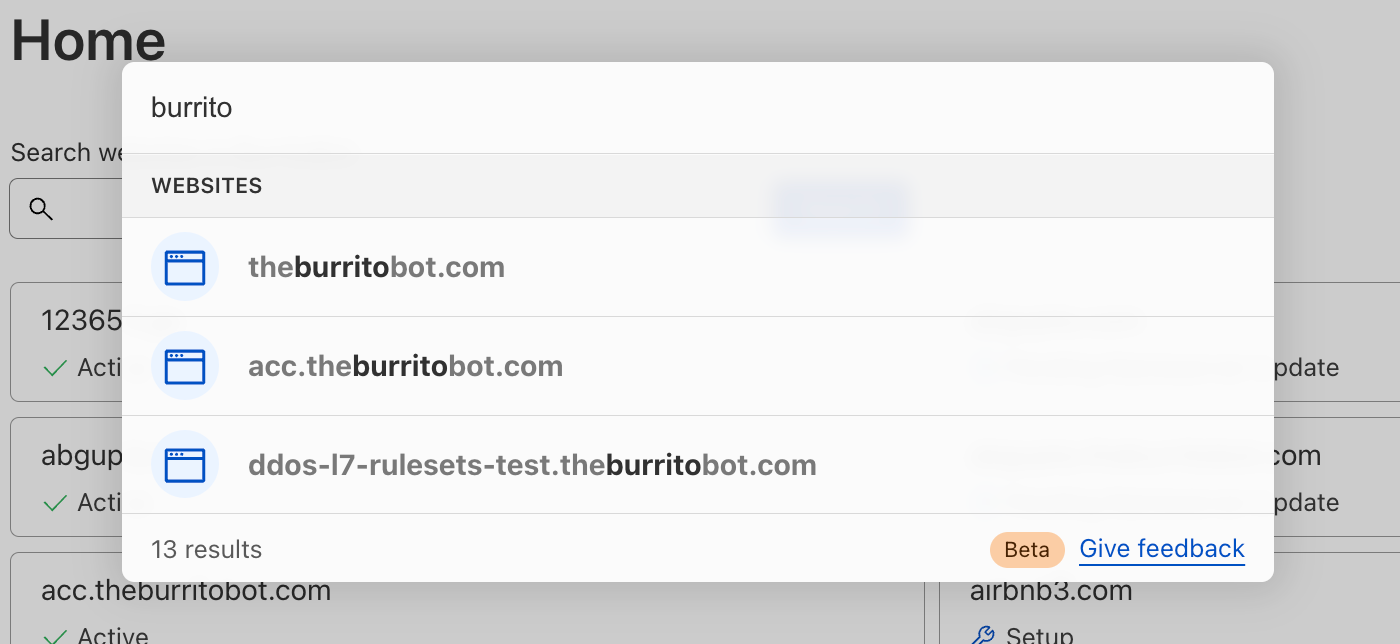
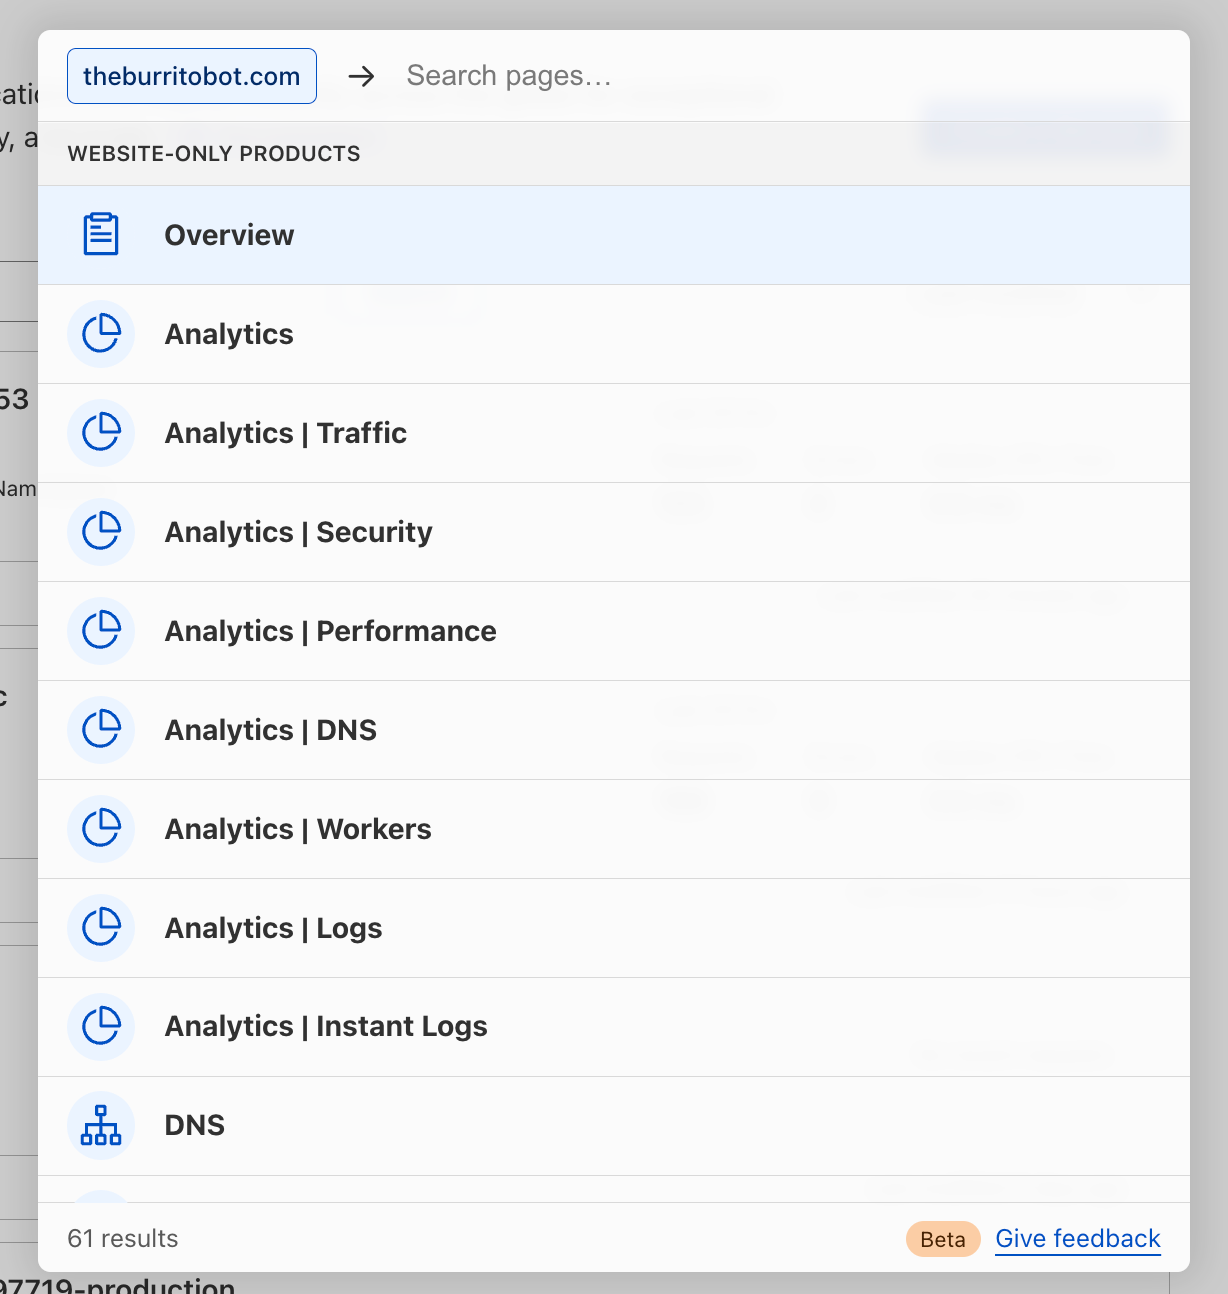
You may also navigate to the products and feature pages within your specific website(s). Note that you can perform a website-specific search from anywhere in your core dashboard using one of two different approaches, which are explained below.
First, you may search first for your website by name, then navigate search results from there:
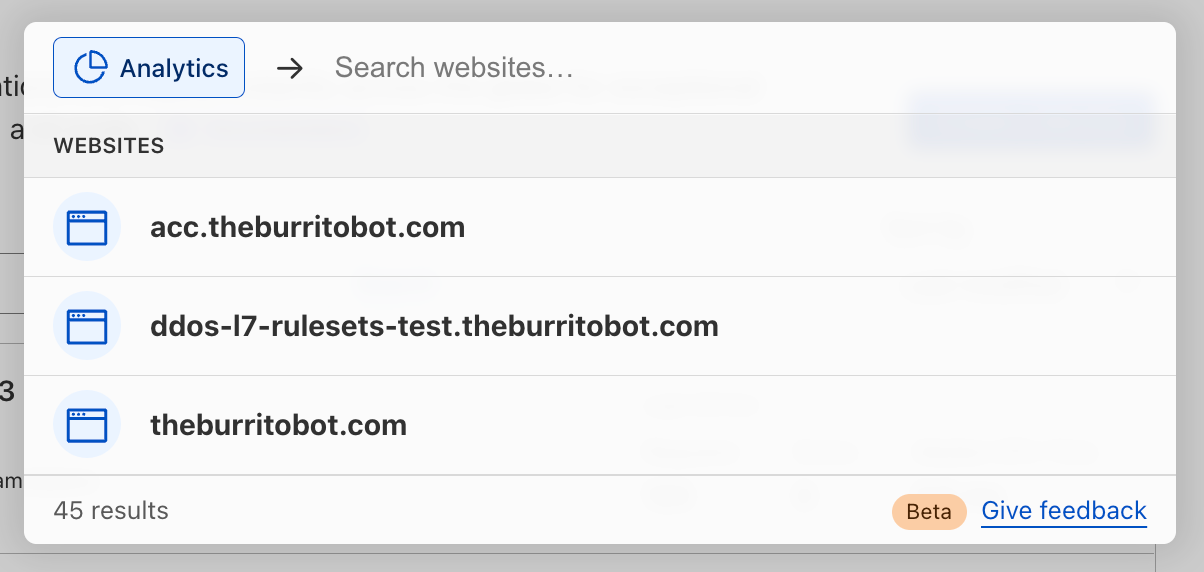
Alternatively, you may search first for the product or feature you’re looking for, then filter down by your website:
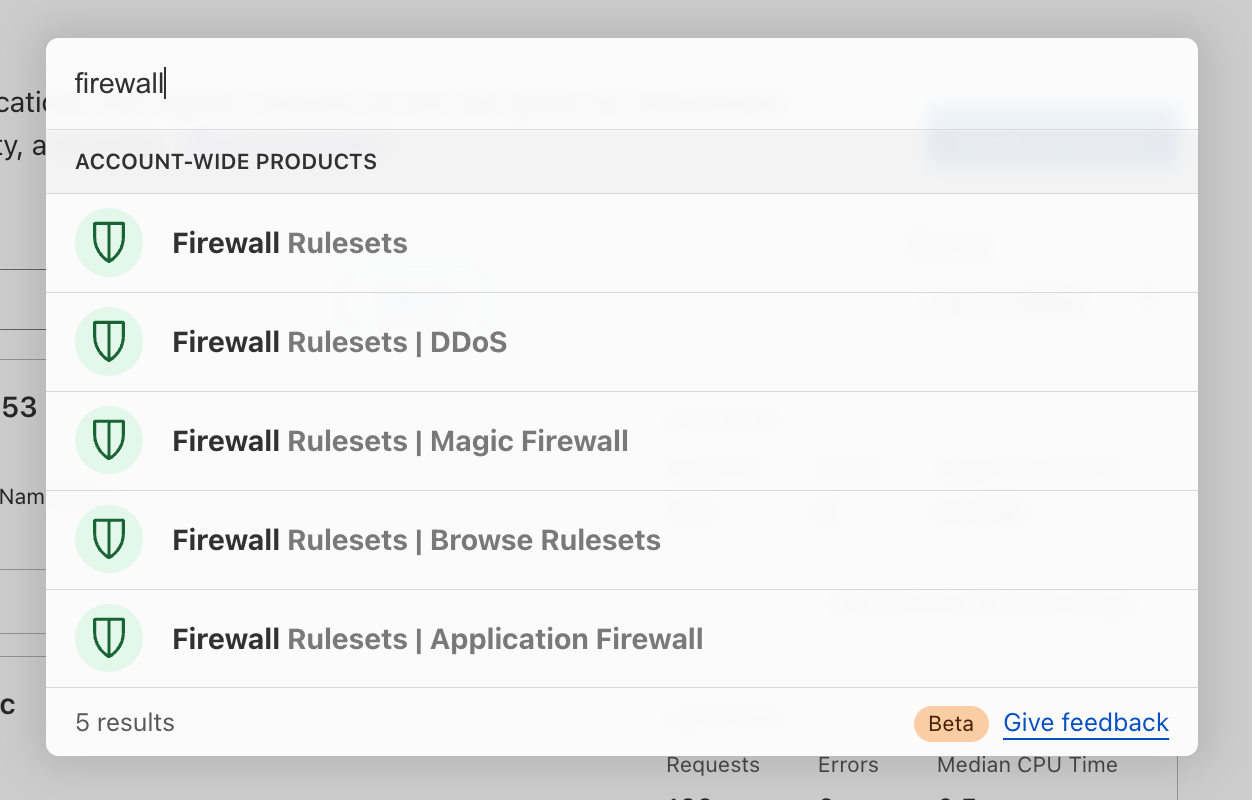
Search for account-wide products
Many Cloudflare products and features are not tied directly to a website or domain that you have set up in Cloudflare, like Workers, R2, Magic Transit—not to mention their related sub-pages. Now, you may use quick search to more easily navigate to those sections of the dashboard.
What’s next for quick search
Here’s an overview of what’s next on our quick search roadmap (and not yet supported today):
- Search results do not currently return results of product- and feature-specific names or configurations, such as Worker names, specific DNS records, IP addresses, Firewall Rules.
- Search results do not currently return results from within the Zero Trust dashboard.
- Search results do not currently return results for Cloudflare content living outside the dashboard, like Support or Developer documentation.
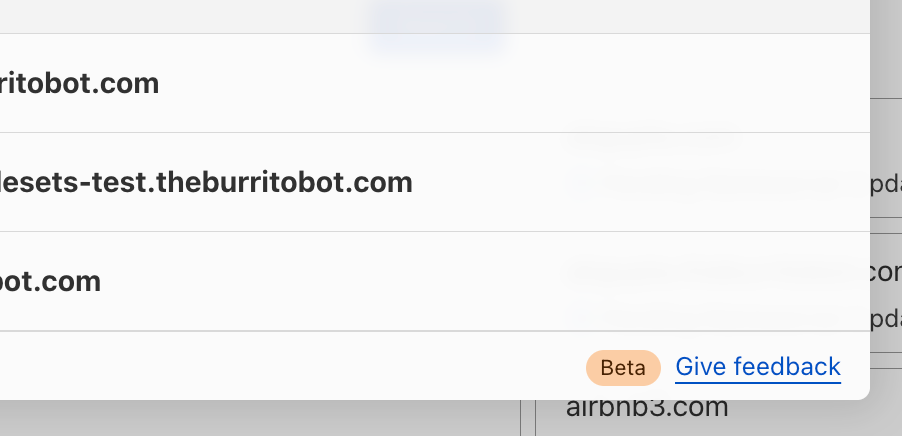
We’d love to hear what you think. What would you like to see added next? Let us know using the feedback link found at the bottom of the search window.
Our vision for the future of the dashboard
We’re excited to launch quick search and to continue improving our dashboard experience for all customers. Over time, we’ll mature our search functionality to index any and all content you might be looking for — including search results for all product content, Support and Developer docs, extending search across accounts, caching your recent searches, and more.
Quick search is one of many important user experience improvements we are planning to tackle over the coming weeks, months and years. The dashboard is central to your Cloudflare experience, and we’re fully committed to making your experience delightful, useful, and easy. Stay tuned for an upcoming blog post outlining the vision for the Cloudflare dashboard, from our in-app home experience to our global navigation and beyond.
For now, keep your eye out for the little search icon that will help you in your day-to-day responsibilities in Cloudflare, and if you don’t see it yet, don’t worry—we can’t wait to ship it to you soon.
If you don’t yet see quick search in your Cloudflare dashboard, you can request early access by filling out this form.
Private by design: building privacy-preserving products with Cloudflare’s Privacy Edge
Post Syndicated from Mari Galicer original https://blog.cloudflare.com/privacy-edge-making-building-privacy-first-apps-easier/


When Cloudflare was founded, our value proposition had three pillars: more secure, more reliable, and more performant. Over time, we’ve realized that a better Internet is also a more private Internet, and we want to play a role in building it.
User awareness and expectations of and for privacy are higher than ever, but we believe that application developers and platforms shouldn’t have to start from scratch. We’re excited to introduce Privacy Edge – Code Auditability, Privacy Gateway, Privacy Proxy, and Cooperative Analytics – a suite of products that make it easy for site owners and developers to build privacy into their products, by default.
Building network-level privacy into the foundations of app infrastructure
As you’re browsing the web every day, information from the networks and apps you use can expose more information than you intend. When accumulated over time, identifiers like your IP address, cookies, browser and device characteristics create a unique profile that can be used to track your browsing activity. We don’t think this status quo is right for the Internet, or that consumers should have to understand the complex ecosystem of third-party trackers to maintain privacy. Instead, we’ve been working on technologies that encourage and enable website operators and app developers to build privacy into their products at the protocol level.
Getting privacy right is hard. We figured we’d start in the area we know best: building privacy into our network infrastructure. Like other work we’ve done in this space – offering free SSL certificates to make encrypted HTTP requests the norm, and launching 1.1.1.1, a privacy-respecting DNS resolver, for example – the products we’re announcing today are built upon the foundations of open Internet standards, many of which are co-authored by members of our Research Team.
Privacy Edge – the collection of products we’re announcing today, includes:
- Privacy Gateway: A lightweight proxy that encrypts request data and forwards it through an IP-blinding relay
- Code Auditability: A solution to verifying that code delivered in your browser hasn’t been tampered with
- Private Proxy: A proxy that offers the protection of a VPN, built natively into application architecture
- Cooperative Analytics: A multi-party computation approach to measurement and analytics based on an emerging distributed aggregation protocol.
Today’s announcement of Privacy Edge isn’t exhaustive. We’re continuing to explore, research and develop new privacy-enabling technologies, and we’re excited about all of them.
Privacy Gateway: IP address privacy for your users
There are situations in which applications only need to receive certain HTTP requests for app functionality, but linking that data with who or where it came from creates a privacy concern.
We recently partnered with Flo Health, a period tracking app, to solve exactly that privacy concern: for users that have turned on “Anonymous mode,” Flo encrypts and forwards traffic through Privacy Gateway so that the network-level request information (most importantly, users’ IP addresses) are replaced by the Cloudflare network.
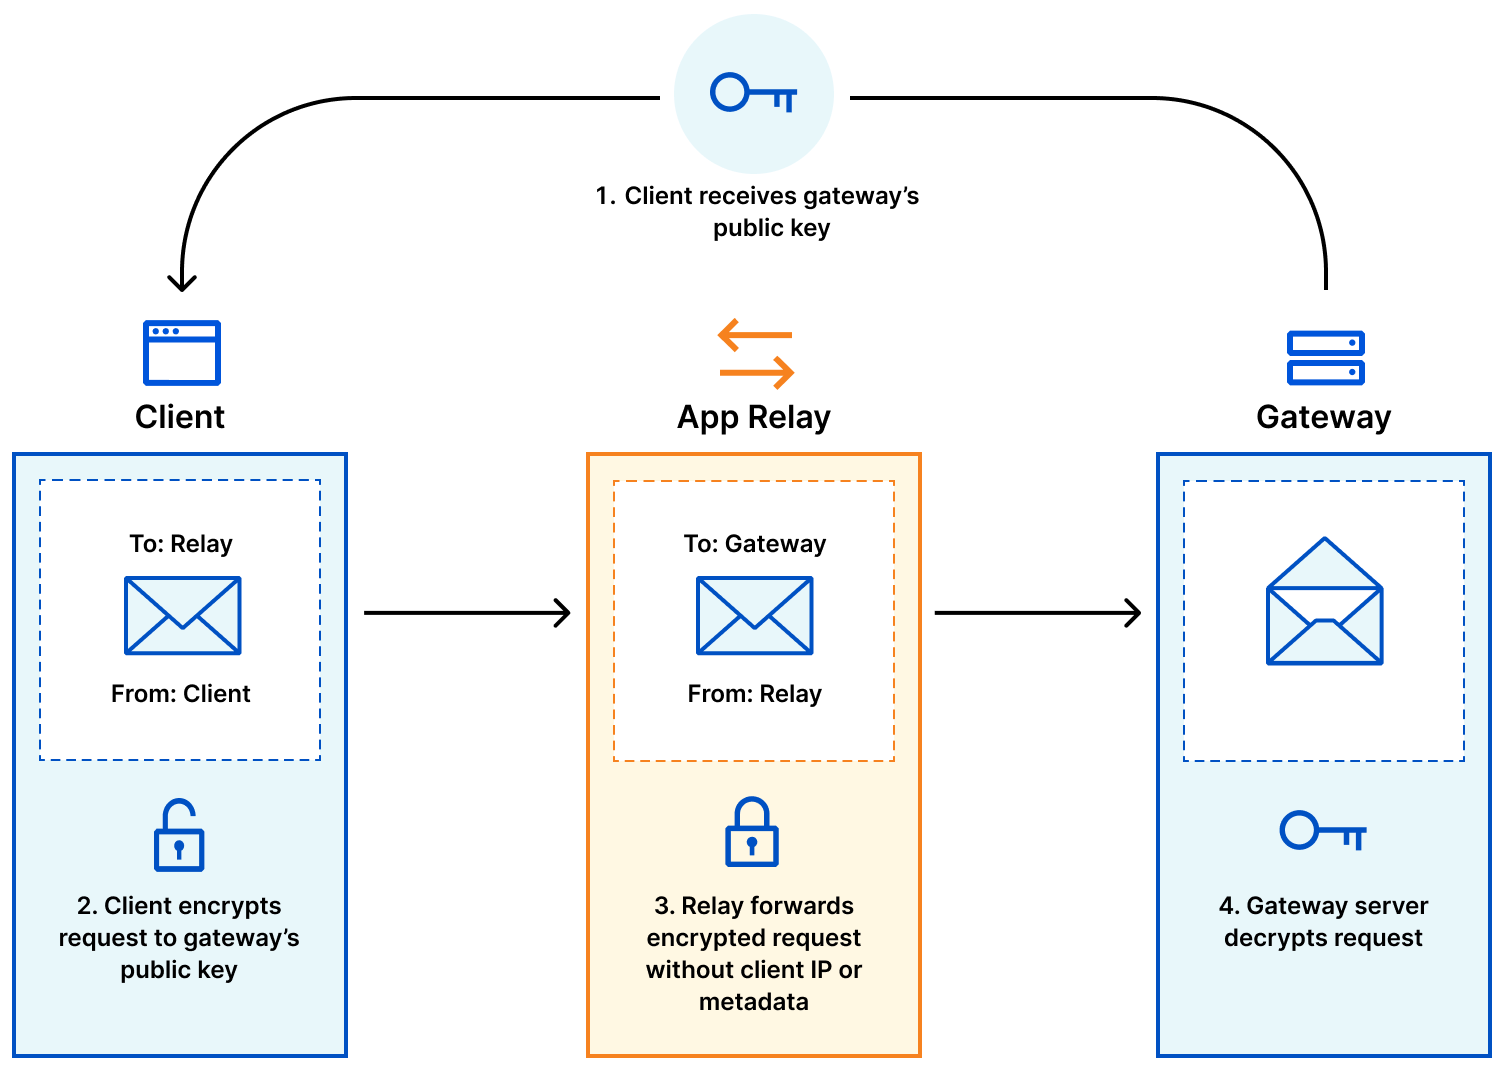
So how does it work? Privacy Gateway is based on Oblivious HTTP, an emerging IETF standard, and at a high level describes the following data flow:
- The client encapsulates an HTTP request using the public key of the customer’s gateway server, and sends it to the relay over a client<>relay HTTPS connection.
- The relay forwards the request to the server over its own relay<>gateway HTTPS connection.
- The gateway server decapsulates the request, forwarding it to the application server.
- The gateway server returns an encapsulated response to the relay, which then forwards the result to the client.
The novel feature Privacy Gateway implements from the OHTTP specification is that messages sent through the relay are encrypted (via HPKE) to the application server, so that the relay learns nothing of the application data beyond the source and destination of each message.
The end result is that the relay will know where the data request is coming from (i.e. users’ IP addresses) but not what it contains (i.e. contents of the request), and the application can see what the data contains but won’t know where it comes from. A win for end-user privacy.
Delivering verifiable and authentic code for privacy-critical applications
How can you ensure that the code — the JavaScript, CSS or even HTML —delivered to a browser hasn’t been tampered with?
One way is to generate a hash (a consistent, unique, and shorter representation) of the code, and have two independent parties compare those hashes when delivered to the user’s browser.
Our Code Auditability service does exactly that, and our recent partnership with Meta deployed it at scale to WhatsApp Web. Installing their Code Verify browser extension ensures users can be sure that they are delivered the code they’re intended to run – free of tampering or corrupted files.
With WhatsApp Web:
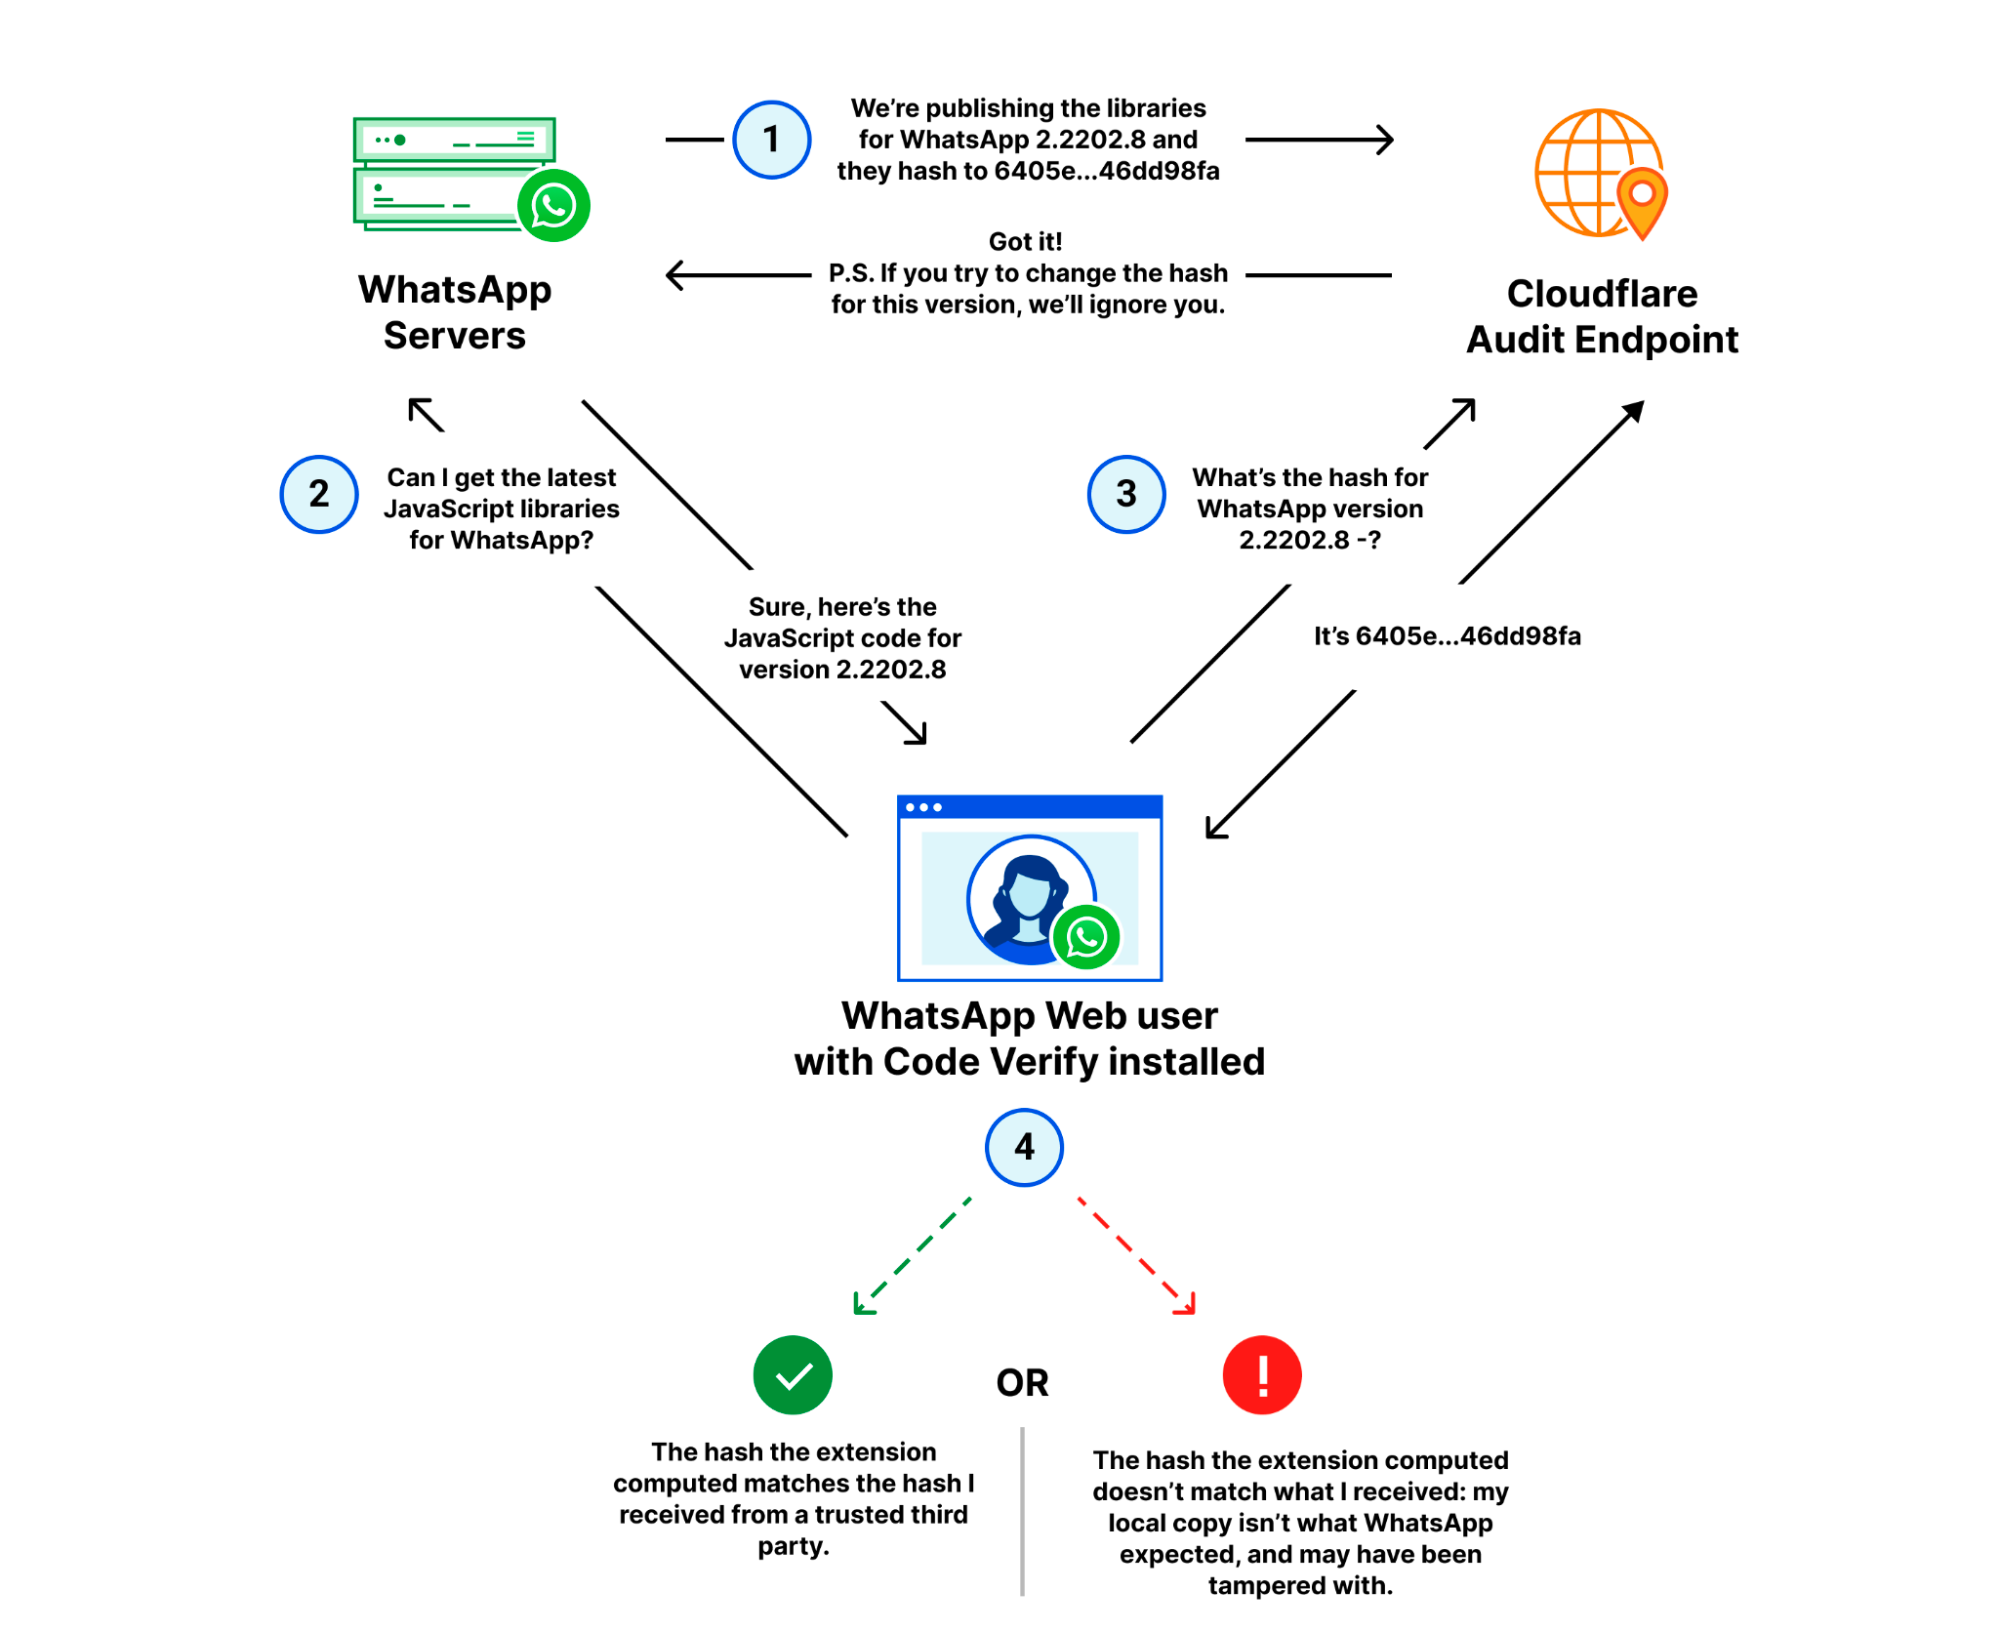
- WhatsApp publishes the latest version of their JavaScript libraries to their servers, and the corresponding hash for that version to Cloudflare’s audit endpoint.
- A WhatsApp web client fetches the latest libraries from WhatsApp.
- The Code Verify browser extension subsequently fetches the hash for that version from Cloudflare over a separate, secure connection.
- Code Verify compares the “known good” hash from Cloudflare with the hash of the libraries it locally computed.
If the hashes match, as they should under almost any circumstance, the code is “verified” from the perspective of the extension. If the hashes don’t match, it indicates that the code running on the user’s browser is different from the code WhatsApp intended to run on all its user’s browsers.
Right now, we call this “Code Auditability” and we see a ton of other potential use cases including password managers, email applications, certificate issuance – all technologies that are potentially targets of tampering or security threats because of the sensitive data they handle.
In the near term, we’re working with other app developers to co-design solutions that meet their needs for privacy-critical products. In the long term, we’re working on standardizing the approach, including building on existing Content Security Policy standards, or the Isolated Web Apps proposal, and even an approach towards building Code Auditability natively into the browser so that a browser extension (existing or new) isn’t required.
Privacy-preserving proxying – built into applications
What if applications could build the protection of a VPN into their products, by default?
Privacy Proxy is our platform to proxy traffic through Cloudflare using a combination of privacy protocols that make it much more difficult to track users’ web browsing activity over time. At a high level, the Privacy Proxy Platform encrypts browsing traffic, replaces a device’s IP address with one from the Cloudflare network, and then forwards it onto its destination.
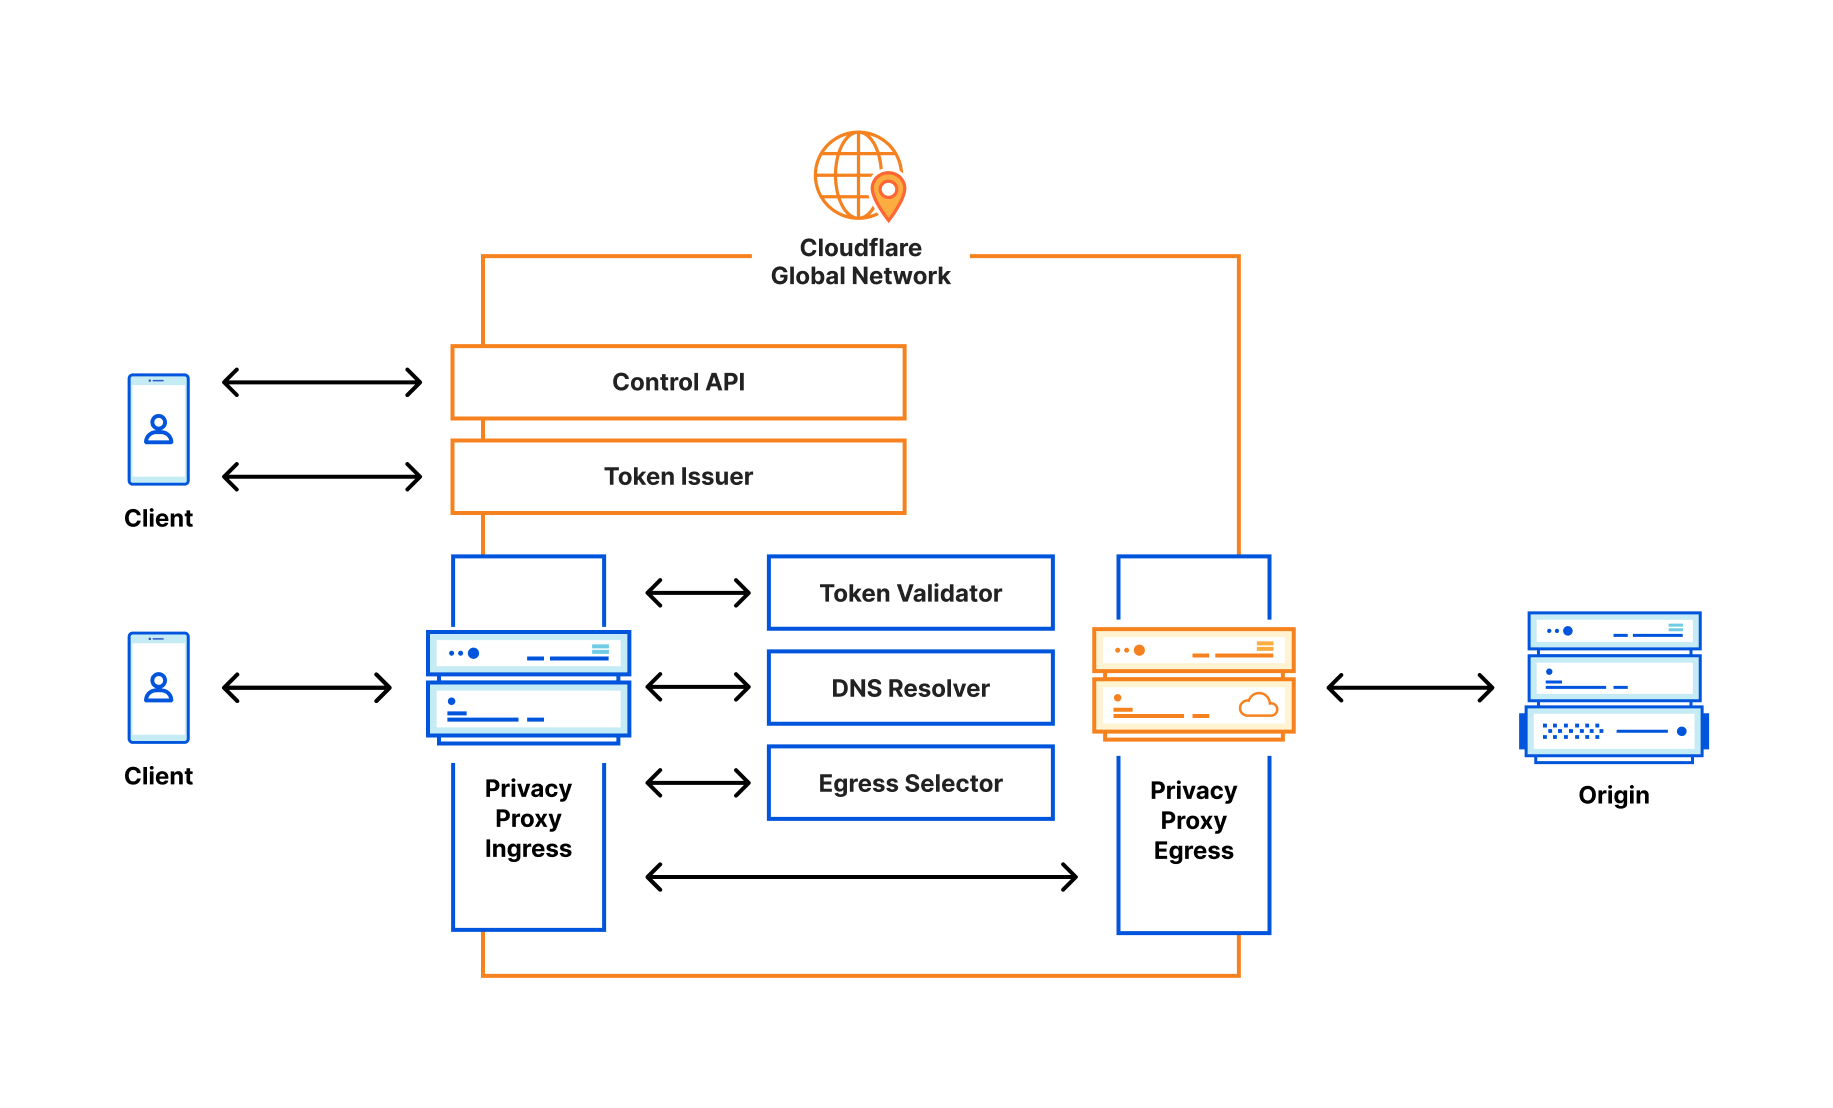
The Privacy Proxy platform consists of several pieces and protocols to make it work:
- Privacy API: a service that issues unique cryptographic tokens, later redeemed against the proxy service to ensure that only valid clients are able to connect to the service.
- Geolocated IP assignment: a service that assigns each connection a new Cloudflare IP address based on the client’s approximate location.
- Privacy Proxy: the HTTP CONNECT-based service running on Cloudflare’s network that handles the proxying of traffic. This service validates the privacy token passed by the client, enforces any double spend prevention necessary for the token.
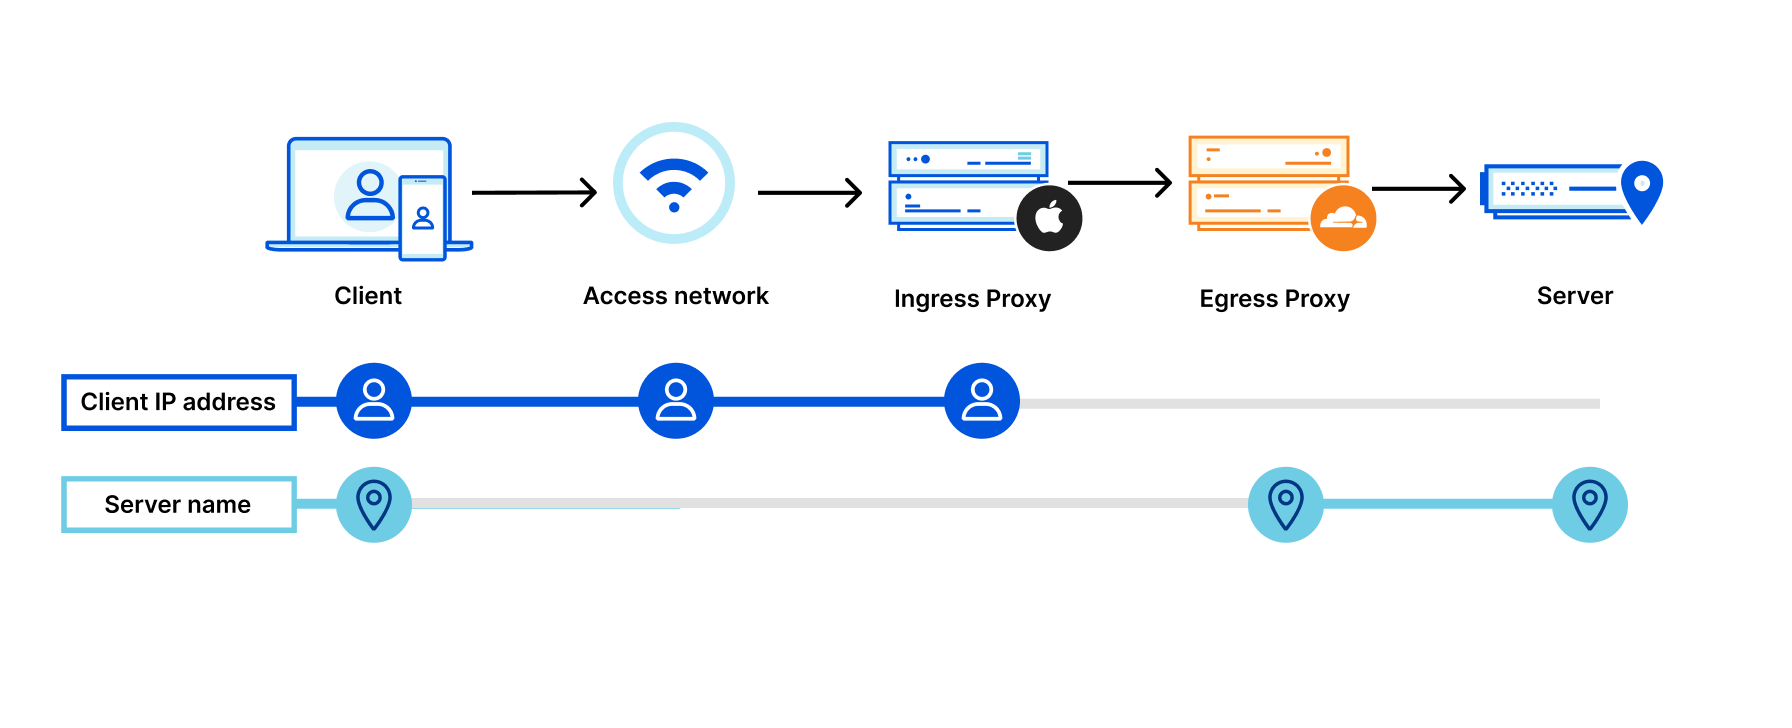
We’re working on several partnerships to provide network-level protection for user’s browsing traffic, most recently with Apple for Private Relay. Private Relay’s design adds privacy to the traditional proxy design by adding an additional hop – an ingress proxy, operated by Apple – that separates handling users’ identities (i.e., whether they’re a valid iCloud+ user) from the proxying of traffic – the egress proxy, operated by Cloudflare.
Measurements and analytics without seeing individual inputs
What if you could calculate the results of a poll, without seeing individuals’ votes, or update inputs to a machine learning model that predicted COVID-19 exposure without seeing who was exposed?
It might seem like magic, but it’s actually just cryptography. Cooperative Analytics is a multi-party computation system for aggregating privacy-sensitive user measurements that doesn’t reveal individual inputs, based on the Distributed Aggregation Protocol (DAP).
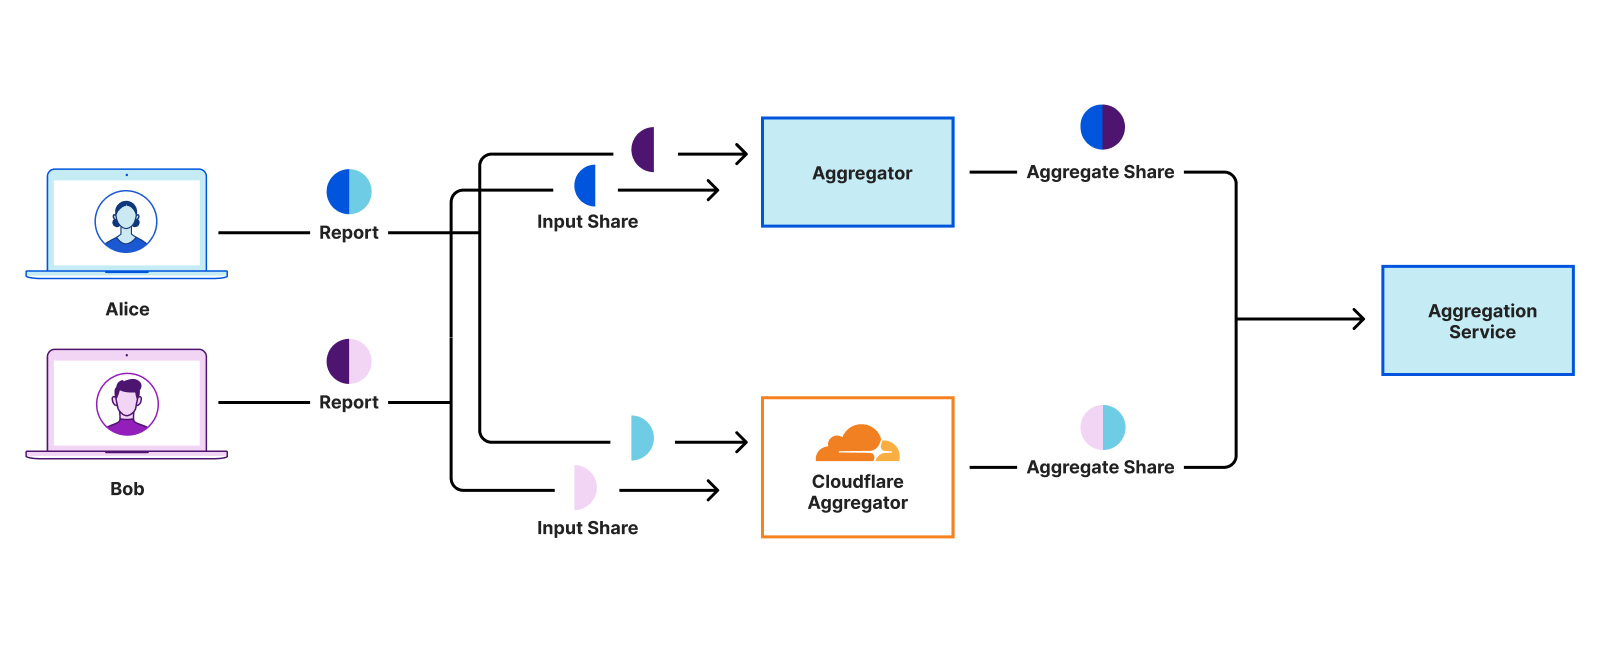
At a high-level, DAP takes the core concept behind MapReduce — what became a fundamental way to aggregate large amounts of data — and rethinks how it would work with privacy-built in, so that each individual input cannot be (provably) mapped back to the original user.
Specifically:
- Measurements are first “secret shared,” or split into multiple pieces. For example, if a user’s input is the number 5, her input could be split into two shares of [10,-5].
- The input share pieces are then distributed between different, non-colluding servers for aggregation (in this example, simply summed up). Similar to Privacy Gateway or Private Proxy, no one party has all the information needed to reconstruct any user’s input.
- Depending on the use case, the servers will then communicate with one another in order to verify that the input is “valid” – so that no one can insert an input that throws off the entire results. The magic of multi-party computation is that the servers can perform this computation without learning anything about the input beyond its validity.
- Once enough input shares have been aggregated to ensure strong anonymity and a statistically significant sample size – each server sends its sum of the input shares to the overall consumer of this service to then compute the final result.
For simplicity, the above example talks about measurements as summed up numbers, but DAP describes algorithms for multiple different types of inputs: the most common string input, or a linear regression, for example.
Early iterations of this system have been implemented by Apple and Google for COVID-19 exposure notifications, but there are many other potential use cases for a system like this: think sensitive browser telemetry, geolocation data – any situation where one has a question about a population of users, but doesn’t want to have to measure them directly.
Because this system requires different parties to operate separate aggregation servers, Cloudflare is working with several partners to act as one of the aggregation servers for DAP. We’re calling our implementation Daphne, and it’s built on top of Cloudflare Workers.
Privacy still requires trust
Part of what’s cool about these systems is that they distribute information — whether user data, network traffic, or both — amongst multiple parties.
While we think that products included in Privacy Edge are moving the Internet in the right direction, we understand that trust only goes so far. To that end, we’re trying to be as transparent as possible.
- We’ve open sourced the code for Privacy Gateway’s server and DAP’s aggregation server, and all the standards work we’re doing is in public with the IETF.
- We’re also working on detailed and accessible privacy notices for each product that describe exactly what kind of network data Cloudflare sees, doesn’t see, and how long we retain it for.
- And, most importantly, we’re continuing to develop new protocols (like Oblivious HTTP) and technologies that don’t just require trust, but that can provably minimize the data observed or logged.
We’d love to see more folks get involved in the standards space, and we welcome feedback from privacy experts and potential customers on how we can improve the integrity of these systems.
We’re looking for collaborators
Privacy Edge products are currently in early access.
We’re looking for application developers who want to build more private user-facing apps with Privacy Gateway; browser and existing VPN vendors looking to improve network-level security for their users via Privacy Proxy; and anyone shipping sensitive software on the Internet that is looking to iterate with us on code auditability and web app signing.
If you’re interested in working with us on furthering privacy on the Internet, then please reach out, and we’ll be in touch!
Introducing Cloudflare’s free Botnet Threat Feed for service providers
Post Syndicated from Omer Yoachimik original https://blog.cloudflare.com/botnet-threat-feed-for-isp/
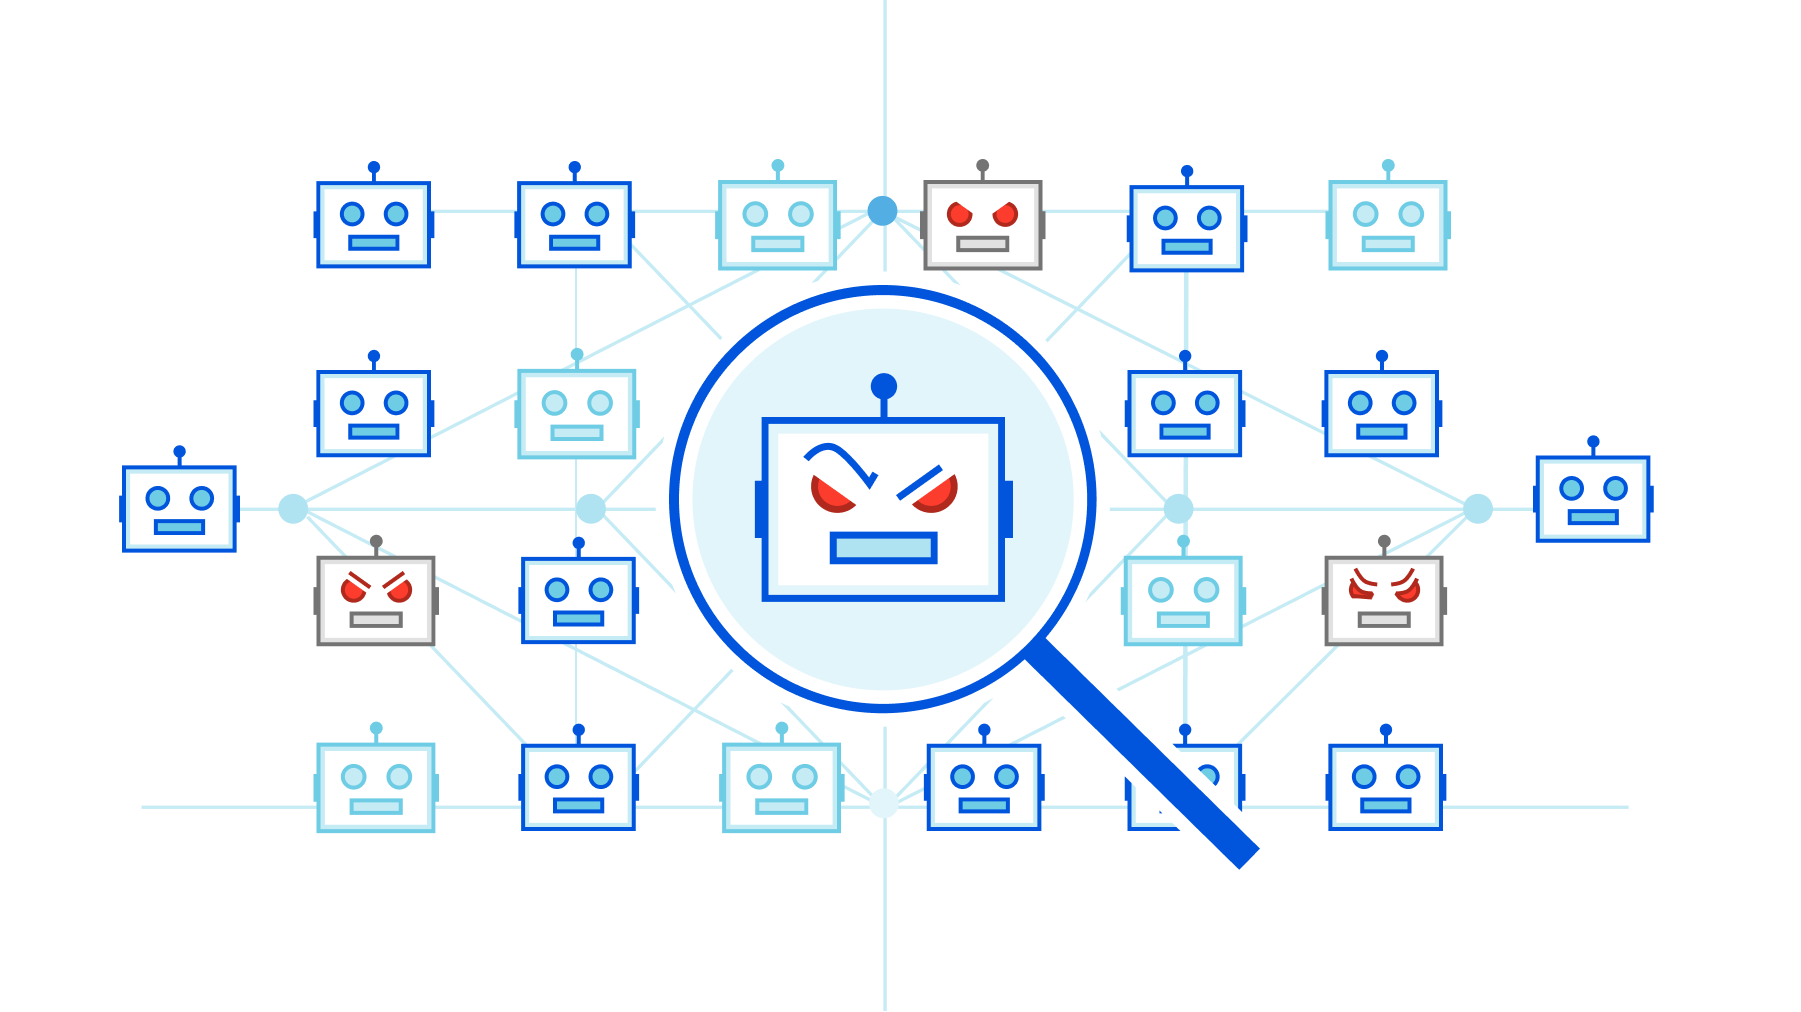
We’re pleased to introduce Cloudflare’s free Botnet Threat Feed for Service Providers. This includes all types of service providers, ranging from hosting providers to ISPs and cloud compute providers.
This feed will give service providers threat intelligence on their own IP addresses that have participated in HTTP DDoS attacks as observed from the Cloudflare network — allowing them to crack down on abusers, take down botnet nodes, reduce their abuse-driven costs, and ultimately reduce the amount and force of DDoS attacks across the Internet. We’re giving away this feed for free as part of our mission to help build a better Internet.
Service providers that operate their own IP space can now sign up to the early access waiting list.
Cloudflare’s unique vantage point on DDoS attacks
Cloudflare provides services to millions of customers ranging from small businesses and individual developers to large enterprises, including 29% of Fortune 1000 companies. Today, about 20% of websites rely directly on Cloudflare’s services. This gives us a unique vantage point on tremendous amounts of DDoS attacks that target our customers.
DDoS attacks, by definition, are distributed. They originate from botnets of many sources — in some cases, from hundreds of thousands to millions of unique IP addresses. In the case of HTTP DDoS attacks, where the victims are flooded with HTTP requests, we know that the source IP addresses that we see are the real ones — they’re not spoofed (altered). We know this because to initiate an HTTP request a connection must be established between the client and server. Therefore, we can reliably identify the sources of the attacks to understand the origins of the attacks.
As we’ve seen in previous attacks, such as the 26 million request per second DDoS attack that was launched by the Mantis botnet, a significant portion originated from service providers such as French-based OVH (Autonomous System Number 16276), the Indonesian Telkomnet (ASN 7713), the US-based iboss (ASN 137922), the Libyan Ajeel (ASN 37284), and others.
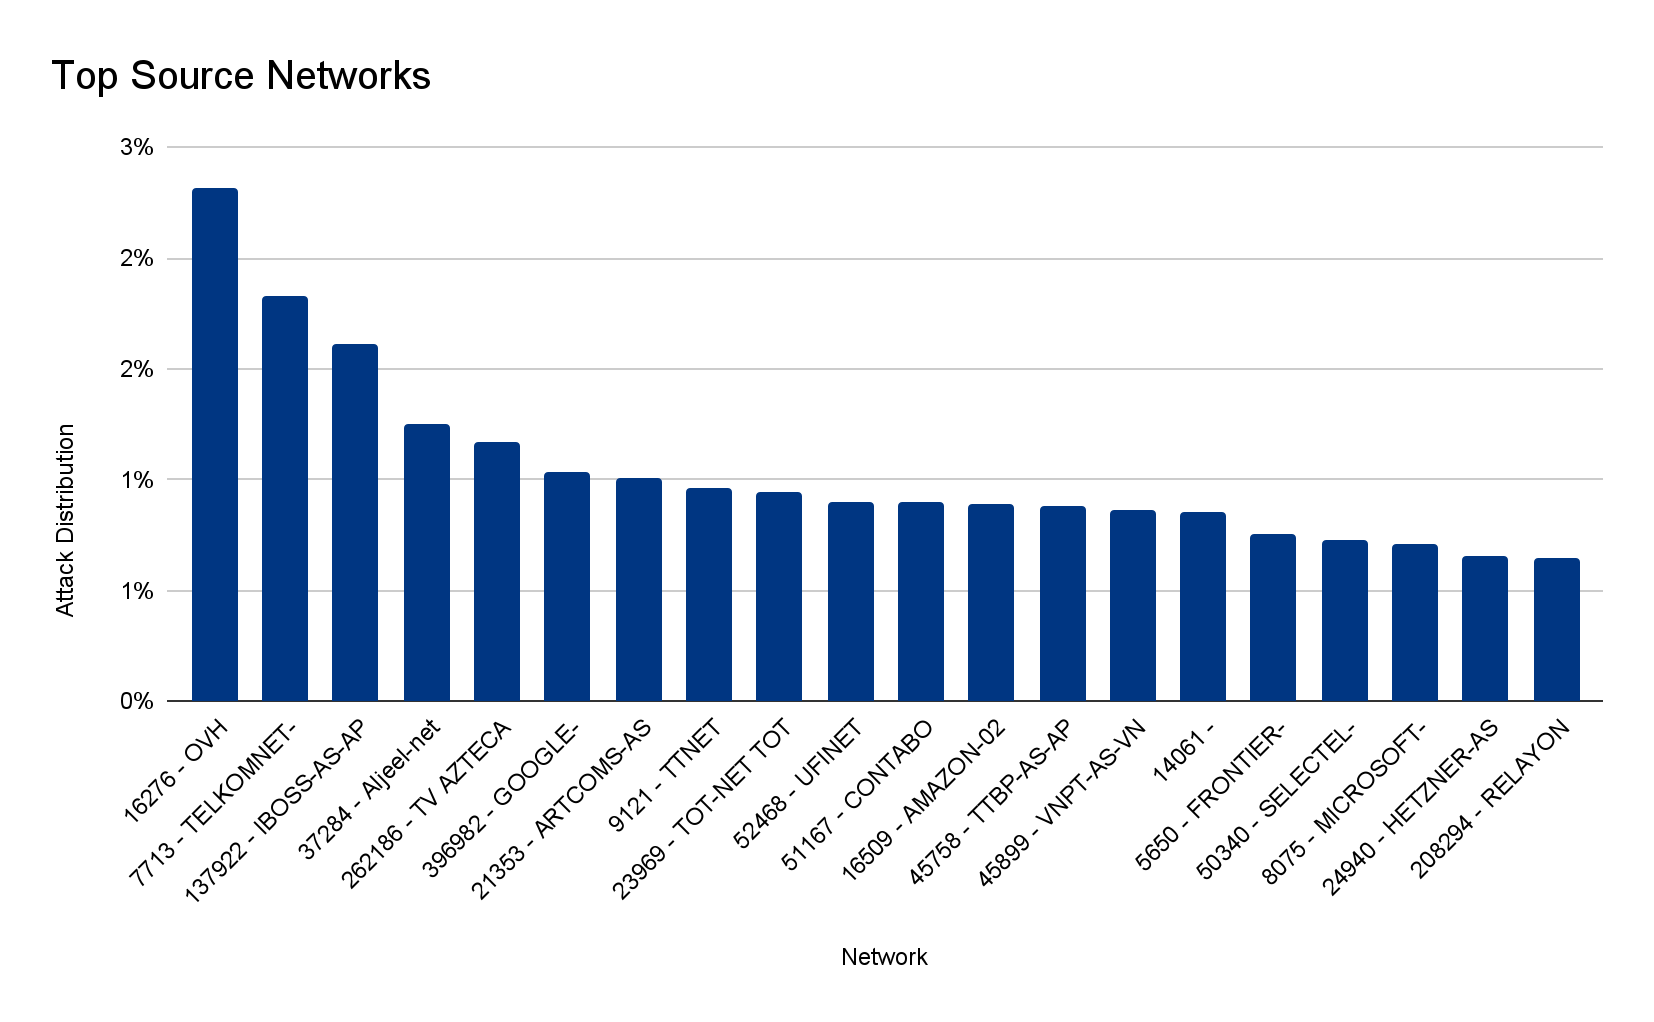
The service providers are not to blame. Their networks and infrastructure are abused by attackers to launch attacks. But, it can be hard for service providers to identify the abusers. In some cases, we’ve seen as little as one single IP of a service provider participate in a DDoS attack consisting of thousands of bots — all scattered across many service providers. And so, the service providers usually only see a small fraction of the attack traffic leaving their network, and it can be hard to correlate it to malicious activity.
Even more so, in the case of HTTPS DDoS attacks, the service provider would only see encrypted gibberish leaving their network without any possibility to decrypt or understand if it is malicious or legitimate traffic. However, at Cloudflare, we see the entire attack and all of its sources, and can use that to help service providers stop the abusers and attacks.
Leveraging our unique vantage point, we go to great lengths to ensure that our threat intelligence includes actual attackers and not legitimate clients.
Partnering with service providers around the world to help build a better Internet
Since our previous experience mitigating Mantis botnet attacks, we’ve been working with providers around the world to help them crack down on abusers. We realized the potential and decided to double down on this effort. The result is that each service provider can subscribe to a feed of their own offending IPs, for free, so they can take action and take down the abused systems.
Our mission at Cloudflare is to help build a better Internet — one that is safer, more performant, and more reliable for everyone. We believe that providing this threat intelligence will help us all move in that direction — cracking down on DDoS attackers and taking down malicious botnets.
If you are a service provider and operate your own IP space, you can now sign up to the early access waiting list.
Monitor your own network with free network flow analytics from Cloudflare
Post Syndicated from Chris Draper original https://blog.cloudflare.com/free-magic-network-monitoring/


As a network engineer or manager, answering questions about the traffic flowing across your infrastructure is a key part of your job. Cloudflare built Magic Network Monitoring (previously called Flow Based Monitoring) to give you better visibility into your network and to answer questions like, “What is my network’s peak traffic volume? What are the sources of that traffic? When does my network see that traffic?” Today, Cloudflare is excited to announce early access to a free version of Magic Network Monitoring that will be available to everyone. You can request early access by filling out this form.
Magic Network Monitoring now features a powerful analytics dashboard, self-serve configuration, and a step-by-step onboarding wizard. You’ll have access to a tool that helps you visualize your traffic and filter by packet characteristics including protocols, source IPs, destination IPs, ports, TCP flags, and router IP. Magic Network Monitoring also includes network traffic volume alerts for specific IP addresses or IP prefixes on your network.
Making Network Monitoring easy
Magic Networking Monitoring allows customers to collect network analytics without installing a physical device like a network TAP (Test Access Point) or setting up overly complex remote monitoring systems. Our product works with any hardware that exports network flow data, and customers can quickly configure any router to send flow data to Cloudflare’s network. From there, our network flow analyzer will aggregate your traffic data and display it in Magic Network Monitoring analytics.
Analytics dashboard
In Magic Network Monitoring analytics, customers can take a deep dive into their network traffic data. You can filter traffic data by protocol, source IP, destination IP, TCP flags, and router IP. Customers can combine these filters together to answer questions like, “How much ICMP data was requested from my speed test server over the past 24 hours?” Visibility into traffic analytics is a key part of understanding your network’s operations and proactively improving your security. Let’s walk through some cases where Magic Network Monitoring analytics can answer your network visibility and security questions.
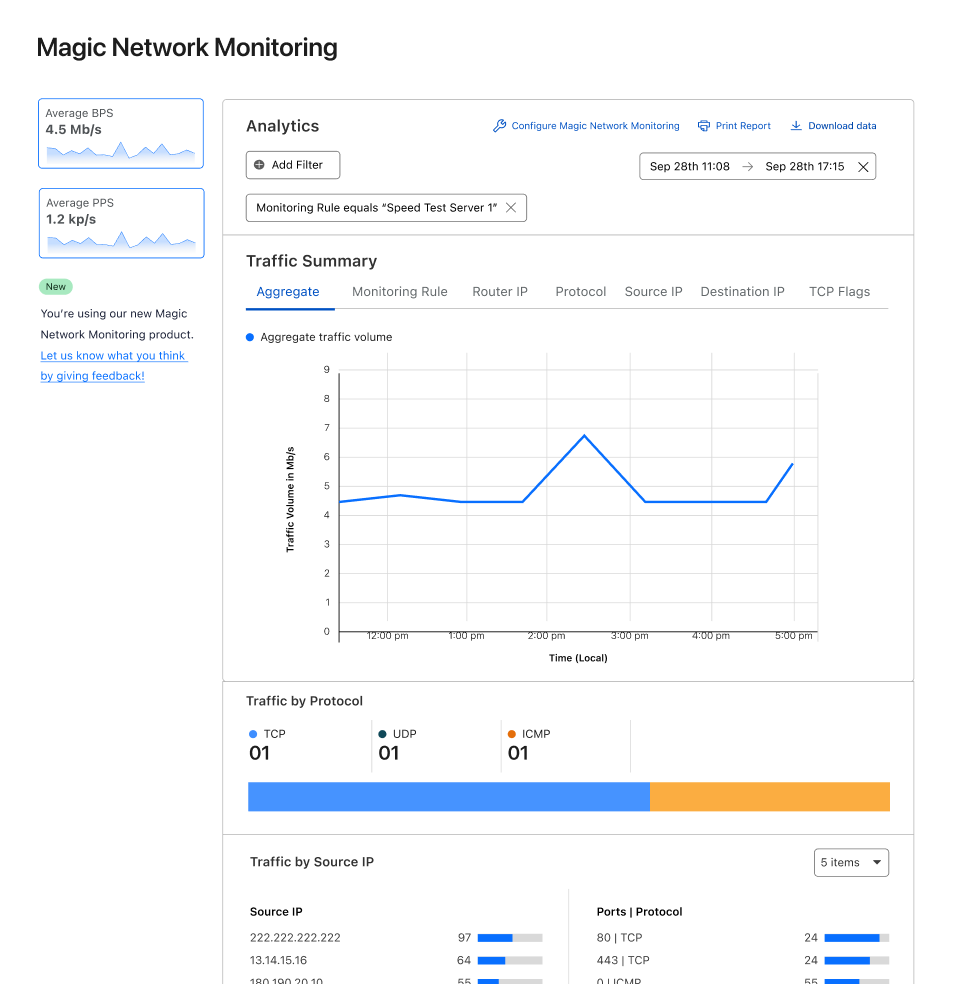
Create network volume alert thresholds per IP address or IP prefix
Magic Network Monitoring is incredibly flexible, and it can be customized to meet the needs of any network hobbyist or business. You can monitor your traffic volume trends over time via the analytics dashboard and build an understanding of your network’s traffic profile. After gathering historical network data, you can set custom volumetric threshold alerts for one IP prefix or a group of IP prefixes. As your network traffic changes over time, or their network expands, they can easily update their Magic Network Monitoring configuration to receive data from new routers or destinations within their network.
Monitoring a speed test server in a home lab
Let’s run through an example where you’re running a network home lab. You decide to use Magic Network Monitoring to track the volume of requests a speed test server you’re hosting receives and check for potential bad actors. Your goal is to identify when your speed test server experiences peak traffic, and the volume of that traffic. You set up Magic Network Monitoring and create a rule that analyzes all traffic destined for your speed test server’s IP address. After collecting data for seven days, the analytics dashboard shows that peak traffic occurs on weekdays in the morning, and that during this time, your traffic volume ranges from 450 – 550 Mbps.
As you’re checking over the analytics data, you also notice strange traffic spikes of 300 – 350 Mbps in the middle of the night that occur at the same time. As you investigate further, the analytics dashboard shows the source of this traffic spike is from the same IP prefix. You research some source IPs, and find they’re associated with malicious activity. As a result, you update your firewall to block traffic from this problematic source.
Identifying a network layer DDoS attack
Magic Network Monitoring can also be leveraged to identify a variety of L3, L4, and L7 DDoS attacks. Let’s run through an example of how ACME Corp, a small business using Magic Network Monitoring, can identify a Ping (ICMP) Flood attack on their network. Ping Flood attacks aim to overwhelm the targeted network’s ability to respond to a high number of requests or overload the network connection with bogus traffic.
At the start of a Ping Flood attack, your server’s traffic volume will begin to ramp up. Magic Network Monitoring will analyze traffic across your network, and send an email, webhook, or PagerDuty alert once an unusual volume of traffic is identified. Your network and security team can respond to the volumetric alert by checking the data in Magic Network Monitoring analytics and identifying the attack type. In this case, they’ll notice the following traffic characteristics:
- Network traffic volume above your historical traffic averages
- An unusually large amount of ICMP traffic
- ICMP traffic coming from a specific set of source IPs
Now, your network security team has confirmed the traffic is malicious by identifying the attack type, and can begin taking steps to mitigate the attack.
Magic Network Monitoring and Magic Transit
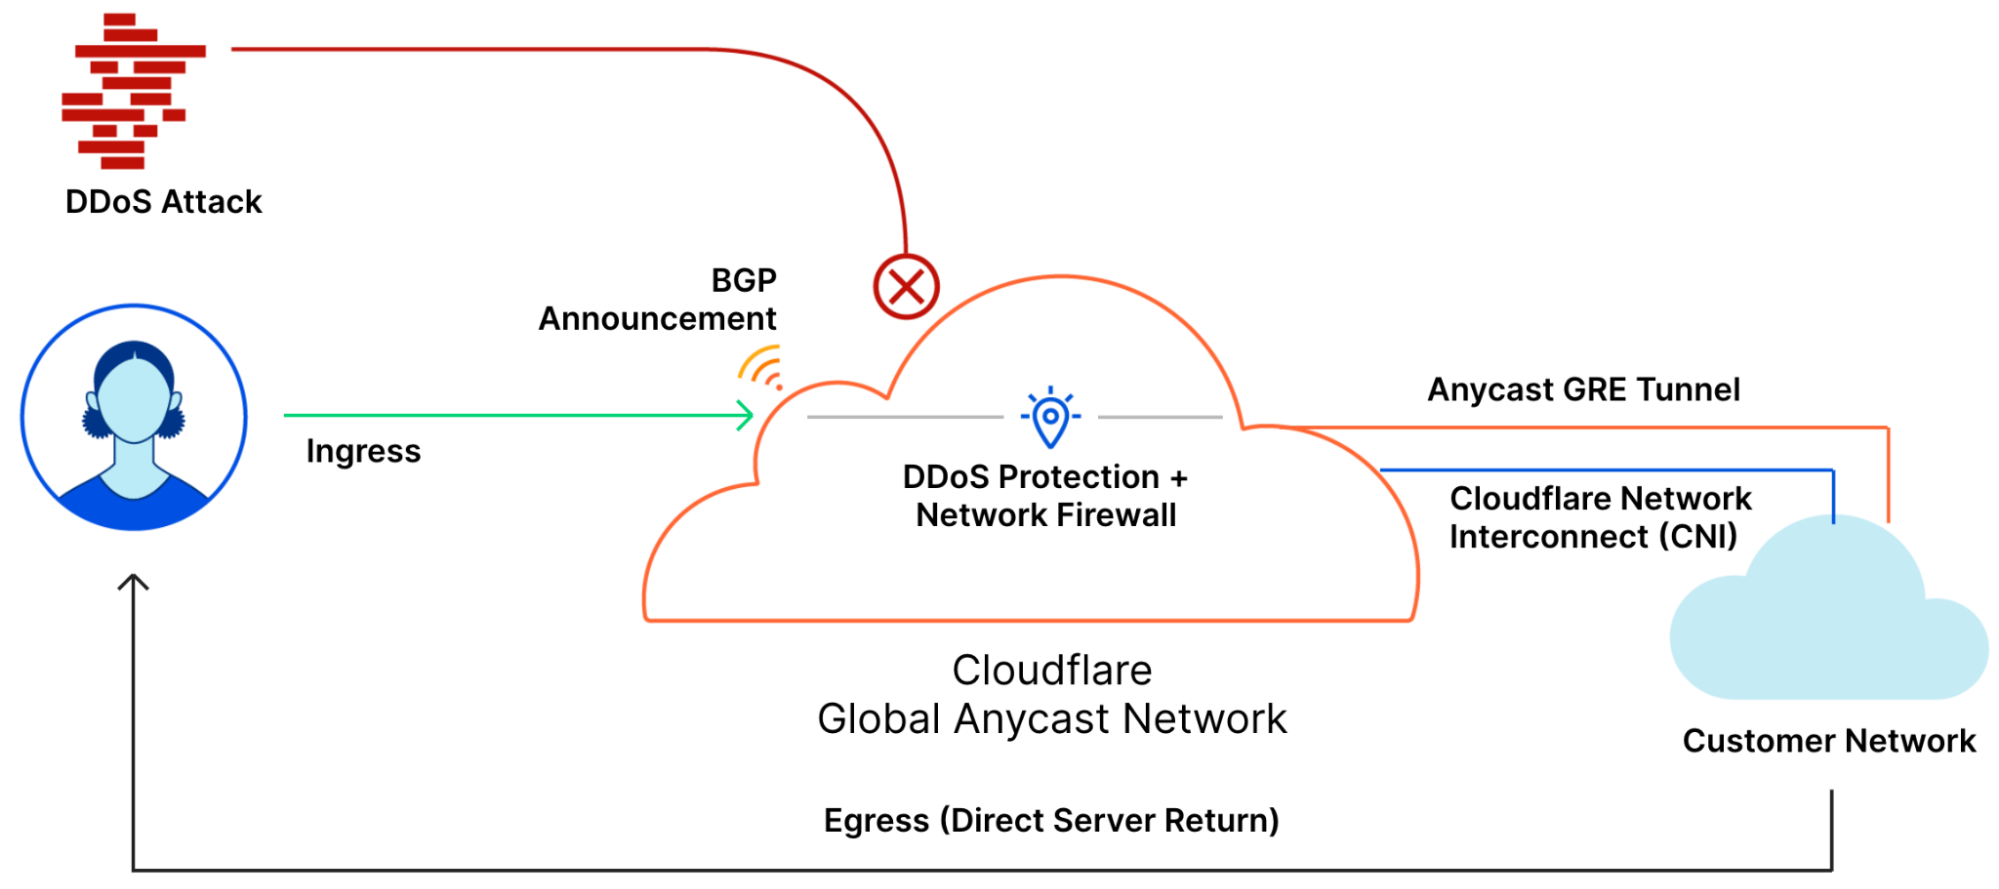
If your business is impacted by DDoS attacks, Magic Network Monitoring will identify attacks, and Magic Transit can be used to mitigate those DDoS attacks. Magic Transit protects customers’ entire network from DDoS attacks by placing our network in front of theirs. You can use Magic Transit Always On to reduce latency and mitigate attacks all the time, or Magic Transit On Demand to protect your network during active attacks. With Magic Transit, you get DDoS protection, traffic acceleration, and other network functions delivered as a service from every Cloudflare data center. Magic Transit works by allowing Cloudflare to advertise customers’ IP prefixes to the Internet with BGP to route the customer’s traffic through our network for DDoS protection. If you’re interested in protecting your network with Magic Transit, you can visit the Magic Transit product page and request a demo today.
Sign up for early access and what’s next
The free version of Magic Network Monitoring (MNM) will be released in the next few weeks. You can request early access by filling out this form.
This is just the beginning for Magic Network Monitoring. In the future, you can look forward to features like advanced DDoS attack identification, network incident history and trends, and volumetric alert threshold recommendations.
USS Essex and the Forgotten War
Post Syndicated from The History Guy: History Deserves to Be Remembered original https://www.youtube.com/watch?v=EFXiqHz0RPU
Cold War Bugging of Soviet Facilities
Post Syndicated from Bruce Schneier original https://www.schneier.com/blog/archives/2022/09/cold-war-bugging-of-soviet-facilities.html
Found documents in Poland detail US spying operations against the former Soviet Union.
The file details a number of bugs found at Soviet diplomatic facilities in Washington, D.C., New York, and San Francisco, as well as in a Russian government-owned vacation compound, apartments used by Russia personnel, and even Russian diplomats’ cars. And the bugs were everywhere: encased in plaster in an apartment closet; behind electrical and television outlets; bored into concrete bricks and threaded into window frames; inside wooden beams and baseboards and stashed within a building’s foundation itself; surreptitiously attached to security cameras; wired into ceiling panels and walls; and secretly implanted into the backseat of cars and in their window panels, instrument panels, and dashboards. It’s an impressive— and impressively thorough— effort by U.S. counterspies.
We have long read about sophisticated Russian spying operations—bugging the Moscow embassy, bugging Selectric typewriters in the Moscow embassy, bugging the new Moscow embassy. These are the first details I’ve read about the US bugging the Russians’ embassy.
Wing Lift
Post Syndicated from original https://xkcd.com/2678/

[$] Finding bugs with sanitizers
Post Syndicated from original https://lwn.net/Articles/909245/
Andrey Konovalov began his 2022 Linux
Security Summit Europe (LSS EU) talk with a bold statement: “fuzzing is
useless”. As might be guessed, he qualified that assertion quickly by
adding “without dynamic bug detectors”. These bug detectors include
“sanitizers” of various sorts, such as the Kernel Address
Sanitizer (KASAN), but there are others. Konovalov looked in detail at KASAN
and gave an overview of the
sanitizer landscape along with some ideas of ways to push these bug
detectors further—to find even more kernel bugs.
How AWS Data Lab helped BMW Financial Services design and build a multi-account modern data architecture
Post Syndicated from Rahul Shaurya original https://aws.amazon.com/blogs/big-data/how-aws-data-lab-helped-bmw-financial-services-design-and-build-a-multi-account-modern-data-architecture/
This post is co-written by Martin Zoellner, Thomas Ehrlich and Veronika Bogusch from BMW Group.
BMW Group and AWS announced a comprehensive strategic collaboration in 2020. The goal of the collaboration is to further accelerate BMW Group’s pace of innovation by placing data and analytics at the center of its decision-making. A key element of the collaboration is the further development of the Cloud Data Hub (CDH) of BMW Group. This is the central platform for managing company-wide data and data solutions in the cloud. At the AWS re:Invent 2019 session, BMW and AWS demonstrated the new Cloud Data Hub platform by outlining different archetypes of data platforms and then walking through the journey of building BMW Group’s Cloud Data Hub. To learn more about the Cloud Data Hub, refer to BMW Cloud Data Hub: A reference implementation of the modern data architecture on AWS.
As part of this collaboration, BMW Group is migrating hundreds of data sources across several data domains to the Cloud Data Hub. Several of these sources pertain to BMW Financial Services.
In this post, we talk about how the AWS Data Lab is helping BMW Financial Services build a regulatory reporting application for one of the European BMW market using the Cloud Data Hub on AWS.
Solution overview
In the context of regulatory reporting, BMW Financial Services works with critical financial services data that contains personally identifiable information (PII). We need to provide monthly insights on our financial data to one of the European National Regulator, and we also need to be compliant with the Schrems II and GDPR regulations as we process PII data. This requires the PII to be pseudonymized when it’s loaded into the Cloud Data Hub, and it has to be processed further in pseudonymized form. For an overview of pseudonymization process, check out Build a pseudonymization service on AWS to protect sensitive data .
To address these requirements in a precise and efficient way, BMW Financial Services decided to engage with the AWS Data Lab. The AWS Data Lab has two offerings: the Design Lab and the Build Lab.
Design Lab
The Design Lab is a 1-to-2-day engagement for customers who need a real-world architecture recommendation based on AWS expertise, but aren’t ready to build. In the case of BMW Financial Services, before beginning the build phase, it was key to get all the stakeholders in the same room and record all the functional and non-functional requirements introduced by all the different parties that might influence the data platform—from owners of the various data sources to end-users that would use the platform to run analytics and get business insights. Within the scope of the Design Lab, we discussed three use cases:
- Regulatory reporting – The top priority for BMW Financial Services was the regulatory reporting use case, which involves collecting and calculating data and reports that will be declared to the National Regulator.
- Local data warehouse – For this use case, we need to calculate and store all key performance indicators (KPIs) and key value indicators (KVIs) that will be defined during the project. The historical data needs to be stored, but we need to apply a pseudonymization process to respect GDPR directives. Moreover, historical data has to be accessed on a daily basis through a tableau visualization tool. Regarding the structure, it would be valuable to define two levels (at minimum): one at the contract level to justify the calculation of all KPIs, and another at an aggregated level to optimize restitutions. Personal data is limited in the application, but a reidentification process must be possible for authorized consumption patterns.
- Accounting details – This use case is based on the BMW accounting tool IFT, which provides the accounting balance at the contract level from all local market applications. It must run at least once a month. However, if some issues are identified on IFT during closing, we must be able to restart it and erase the previous run. When the month-end closing is complete, this use case has to keep the last accounting balance version generated during the month and store it. In parallel, all accounting balance versions have to be accessible by other applications for queries and be able to retrieve the information for 24 months.

Based on these requirements, we developed the following architecture during the Design Lab.
This solution contains the following components:
- The main data source that hydrates our three use cases is the already available in the Cloud Data Hub. The Cloud Data Hub uses AWS Lake Formation resource links to grant access to the dataset to the consumer accounts.
- For standard, periodic ETL (extract, transform, and load) jobs that involve operations such as converting data types, or creating labels based on numerical values or Boolean flags based on a label, we used AWS Glue ETL jobs.
- For historical ETL jobs or more complex calculations such as in the account details use case, which may involve huge joins with custom configurations and tuning, we recommended to use Amazon EMR. This gives you the opportunity to control cluster configurations at a fine-grained level.
- To store job metadata that enables features such as reprocessing inputs or rerunning failed jobs, we recommended building a data registry. The goal of the data registry is to create a centralized inventory for any data being ingested in the data lake. A schedule-based AWS Lambda function could be triggered to register data landing on the semantic layer of the Cloud Data Hub in a centralized metadata store. We recommended using Amazon DynamoDB for the data registry.
- Amazon Simple Storage Service (Amazon S3) serves as the storage mechanism that powers the regulatory reporting use case using the data management framework Apache Hudi. Apache Hudi is useful for our use cases because we need to develop data pipelines where record-level insert, update, upsert, and delete capabilities are desirable. Hudi tables are supported by both Amazon EMR and AWS Glue jobs via the Hudi connector, along with query engines such as Amazon Athena and Amazon Redshift Spectrum.
- As part of the data storing process in the regulatory reporting S3 bucket, we can populate the AWS Glue Data Catalog with the required metadata.
- Athena provides an ad hoc query environment for interactive analysis of data stored in Amazon S3 using standard SQL. It has an out-of-the-box integration with the AWS Glue Data Catalog.
- For the data warehousing use case, we need to first de-normalize data to create a dimensional model that enables optimized analytical queries. For that conversion, we use AWS Glue ETL jobs.
- Dimensional data marts in Amazon Redshift enable our dashboard and self-service reporting needs. Data in Amazon Redshift is organized into several subject areas that are aligned with the business needs, and a dimensional model allows for cross-subject area analysis.
- As a by-product of creating an Amazon Redshift cluster, we can use Redshift Spectrum to access data in the regulatory reporting bucket of the architecture. It acts as a front to access more granular data without actually loading it in the Amazon Redshift cluster.
- The data provided to the Cloud Data Hub contains personal data that is pseudonymized. However, we need our pseudonymized columns to be re-personalized when visualizing them on Tableau or when generating CSV reports. Both Athena and Amazon Redshift support Lambda UDFs, which can be used to access Cloud Data Hub PII APIs to re-personalize the pseudonymized columns before presenting them to end-users.
- Both Athena and Amazon Redshift can be accessed via JDBC (Java Database Connectivity) to provide access to data consumers.
- We can use a Python shell job in AWS Glue to run a query against either of our analytics solutions, convert the results to the required CSV format, and store them to a BMW secured folder.
- Any business intelligence (BI) tool deployed on premises can connect to both Athena and Amazon Redshift and use their query engines to perform any heavy computation before it receives the final data to fuel its dashboards.
- For the data pipeline orchestration, we recommended using AWS Step Functions because of its low-code development experience and its full integration with all the other components discussed.
With the preceding architecture as our long-term target state, we concluded the Design Lab and decided to return for a Build Lab to accelerate solution development.
Preparing for Build Lab
The typical preparation of a Build Lab that follows a Design Lab involves identifying a few examples of common use case patterns, typically the more complex ones. To maximize the success in the Build Lab, we reduce the long-term target architecture to a subset of components that addresses those examples and can be implemented within a 3-to-5-day intense sprint.
For a successful Build Lab, we also need to identify and resolve any external dependencies, such as network connectivity to data sources and targets. If that isn’t feasible, then we find meaningful ways to mock them. For instance, to make the prototype closer to what the production environment would look like, we decided to use separate AWS accounts for each use case, based on the existing team structure of BMW, and use a consumer S3 bucket instead of BMW network-attached storage (NAS).
Build Lab
The BMW team set aside 4 days for their Build Lab. During that time, their dedicated Data Lab Architect worked alongside the team, helping them to build the following prototype architecture.
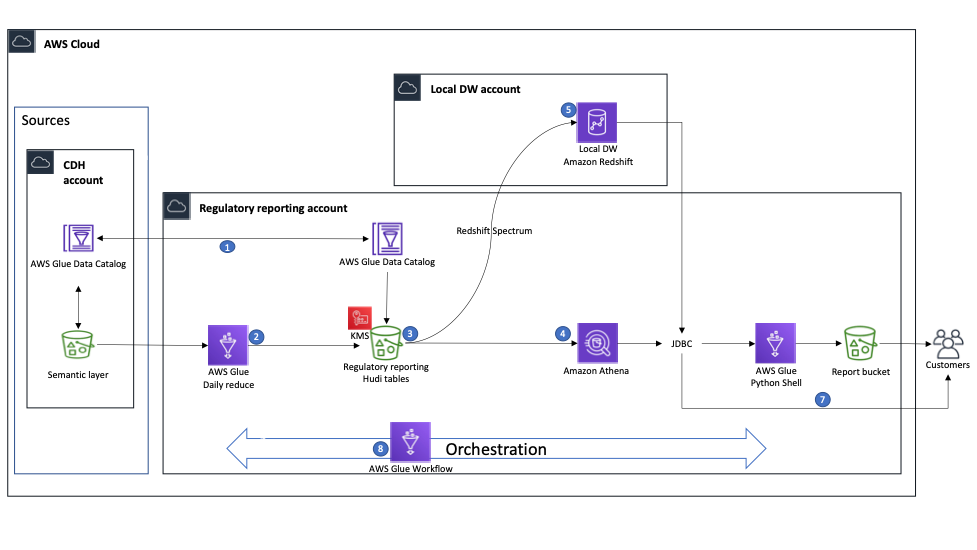
This solution includes the following components:
- The first step was to synchronize the AWS Glue Data Catalog of the Cloud Data Hub and regulatory reporting accounts.
- AWS Glue jobs running on the regulatory reporting account had access to the data in the Cloud Data Hub resource accounts. During the Build Lab, the BMW team implemented ETL jobs for six tables, addressing insert, update, and delete record requirements using Hudi.
- The result of the ETL jobs is stored in the data lake layer stored in the regulatory reporting S3 bucket as Hudi tables that are catalogued in the AWS Glue Data Catalog and can be consumed by multiple AWS services. The bucket is encrypted using AWS Key Management Service (AWS KMS).
- Athena is used to run exploratory queries on the data lake.
- To demonstrate the cross-account consumption pattern, we created an Amazon Redshift cluster on it, created external tables from the Data Catalog, and used Redshift Spectrum to query the data. To enable cross-account connectivity between the subnet group of the Data Catalog of the regulatory reporting account and the subnet group of the Amazon Redshift cluster on the local data warehouse account, we had to enable VPC peering. To accelerate and optimize the implementation of these configurations during the Build Lab, we received support from an AWS networking subject matter expert, who ran a valuable session, during which the BMW team understood the networking details of the architecture.
- For data consumption, the BMW team implemented an AWS Glue Python shell job that connected to Amazon Redshift or Athena using a JDBC connection, ran a query, and stored the results in the reporting bucket as a CSV file, which would later be accessible by the end-users.
- End-users can also directly connect to both Athena and Amazon Redshift using a JDBC connection.
- We decided to orchestrate the AWS Glue ETL jobs using AWS Glue Workflows. We used the resulting workflow for the end-of-lab demo.
With that, we completed all the goals we had set up and concluded the 4-day Build Lab.
Conclusion
In this post, we walked you through the journey the BMW Financial Services team took with the AWS Data Lab team to participate in a Design Lab to identify a best-fit architecture for their use cases, and the subsequent Build Lab to implement prototypes for regulatory reporting in one of the European BMW market.
To learn more about how AWS Data Lab can help you turn your ideas into solutions, visit AWS Data Lab.
Special thanks to everyone who contributed to the success of the Design and Build Lab: Lionel Mbenda, Mario Robert Tutunea, Marius Abalarus, Maria Dejoie.
About the authors
 Martin Zoellner is an IT Specialist at BMW Group. His role in the project is Subject Matter Expert for DevOps and ETL/SW Architecture.
 Thomas Ehrlich is the functional maintenance manager of Regulatory Reporting application in one of the European BMW market.
 Veronika Bogusch is an IT Specialist at BMW. She initiated the rebuild of the Financial Services Batch Integration Layer via the Cloud Data Hub. The ingested data assets are the base for the Regulatory Reporting use case described in this article.
 George Komninos is a solutions architect for the Amazon Web Services (AWS) Data Lab. He helps customers convert their ideas to a production-ready data product. Before AWS, he spent three years at Alexa Information domain as a data engineer. Outside of work, George is a football fan and supports the greatest team in the world, Olympiacos Piraeus.
 Rahul Shaurya is a Senior Big Data Architect with AWS Professional Services. He helps and works closely with customers building data platforms and analytical applications on AWS. Outside of work, Rahul loves taking long walks with his dog Barney.
Customize Amazon QuickSight dashboards with the new bookmarks functionality
Post Syndicated from Mei Qu original https://aws.amazon.com/blogs/big-data/customize-amazon-quicksight-dashboards-with-the-new-bookmarks-functionality/
Amazon QuickSight users now can add bookmarks in dashboards to save customized dashboard preferences into a list of bookmarks for easy one-click access to specific views of the dashboard without having to manually make multiple filter and parameter changes every time. Combined with the “Share this view” functionality, you can also now share your bookmark views with other readers for easy collaboration and discussion.
In this post, we introduce the bookmark functionality and its capabilities, and demonstrate typical use cases. We also discuss several scenarios extending the usage of bookmarks for sharing and presentation.
Create a bookmark
Open the published dashboard that you want to view and make changes to the filters, controls, or select the sheet that you want. For example, you can filter to the Region that interests you, or you can select a specific date range using a sheet control on the dashboard.
To create a bookmark of this view, choose the bookmark icon, then choose Add bookmark.
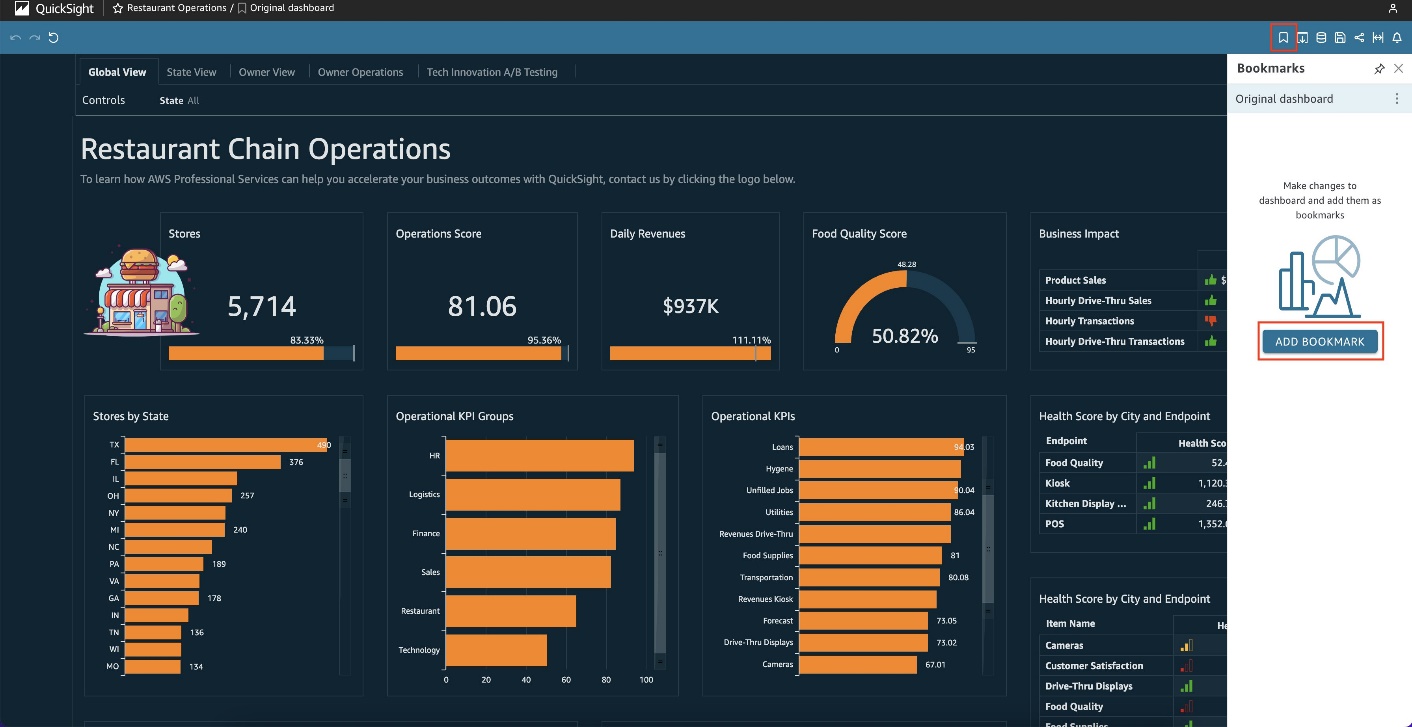
Enter a name, then choose Save.

The bookmark is saved, and the dashboard name on the banner updates with the bookmark name.

You can return to the original dashboard view that the author published at any time by going back to the bookmark icon and choosing Original dashboard.

Rename or delete a bookmark
To rename or delete a bookmark, on the bookmark pane, choose the context menu (three vertical dots) and choose Rename or Delete.

Although you can make any of these edits to bookmarks you have created, the Original dashboard view can’t be renamed, deleted, or updated, because it’s what the author has published.

Update a bookmark
At any time, you can change a bookmark dashboard view and update the bookmark to always reflect those changes.
After you make your edits, on the banner, you can see Modified next to the bookmark you’re currently editing.

To save your updates, on the bookmarks pane, choose the context menu and choose Update.
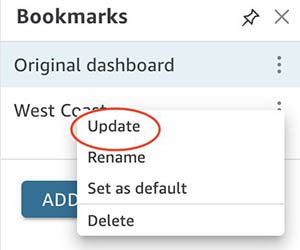
Make a bookmark the default view
After you create a bookmark, you can set it as the default view of the dashboard that you see when you open the dashboard in a new session. This doesn’t affect anyone else’s view of the dashboard. You can also set the Original dashboard that the author published as the default view. When a default view is set, any time that you open the dashboard, the bookmark view is presented to you, regardless of the changes you made during your last session. However, if no default bookmark has been set, QuickSight will persist your current filter selections when you leave the dashboard. This way, readers can still pick up where they left off and don’t have to re-select filters.
To do this, in the Bookmarks pane, choose the context menu (the three dots) for the bookmark that you want to set as your default view, then choose Set as default.

Share a bookmark
After you create a bookmark, you can share a URL link for the view with others who have permission to view the dashboard. They can then save that view as their own bookmark. The shared view is a snapshot of your bookmark, meaning that if you make any updates to your bookmark after generating the URL link, the shared view doesn’t change.
To do this, choose the bookmark that you want to share so that the dashboard updates to that view. Choose the share icon, then choose Share this view. You can then copy the generated URL to share it with others.

Presentation with bookmarks
One extended use case of the new bookmarks feature is the ability to create a presentation through visuals in a much more elegant fashion. Previously, you may have had to change multiple filters and controls before arriving at your next presentation. Now you can save each presentation as a bookmark beforehand and just go through each bookmark like a slideshow. By creating a snapshot for each of the configurations you want to show, you create a smoother and cleaner experience for your audience.
For example, let’s prepare a presentation through bookmarks using a Restaurant Operations dashboard. We can start with the global view of all the states and their related KPIs.

Best vs. worst performing restaurant
We’re interested in analyzing the difference between the best performing and worst performing store based on revenue. If we had to filter this dashboard on the fly, it would be much more time-consuming because we would have to manually enter both store names into the filter. However, with bookmarks, we can pre-filter to the two addresses, save the bookmark, and be automatically directed to the desired stores when we select it.
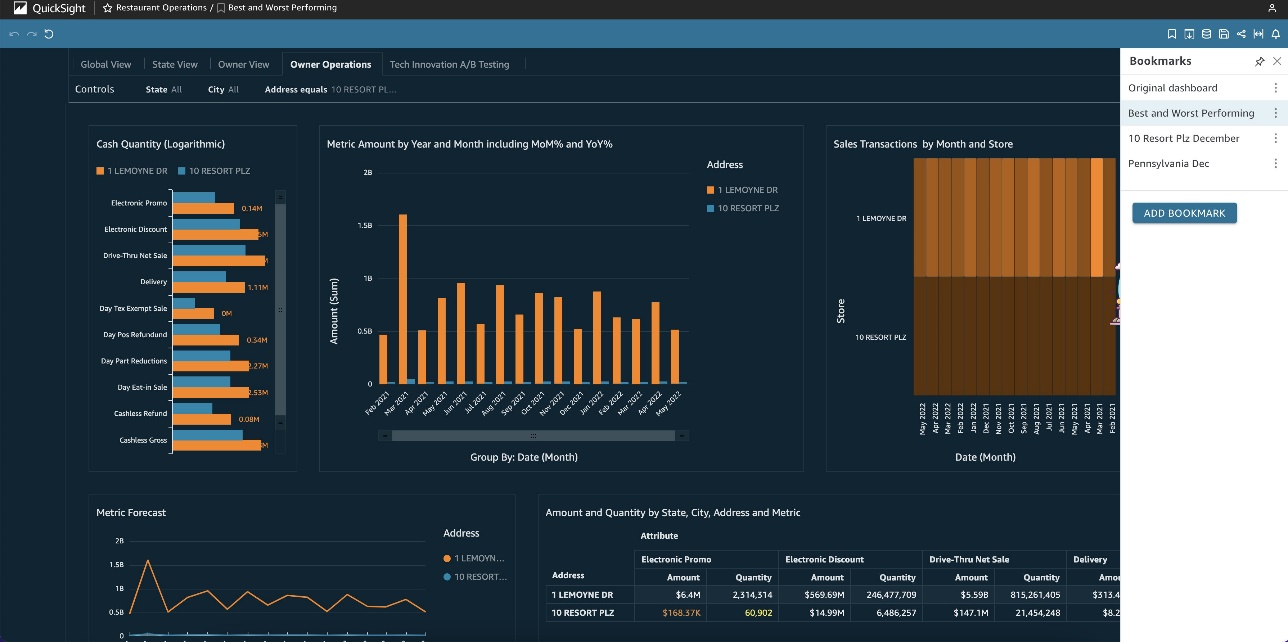
Worst performing restaurant analysis
When comparing the best and worst performing stores, we see that the worst performing store (10 Resort Plz) had a below average revenue amount in December 2021. We’re interested in seeing how we can better boost sales around the holiday season and if there is something the owner lacked in that month. We can create a bookmark that directs us to the Owner View with the filters selected to December 2021 and the address and city pre-filtered.
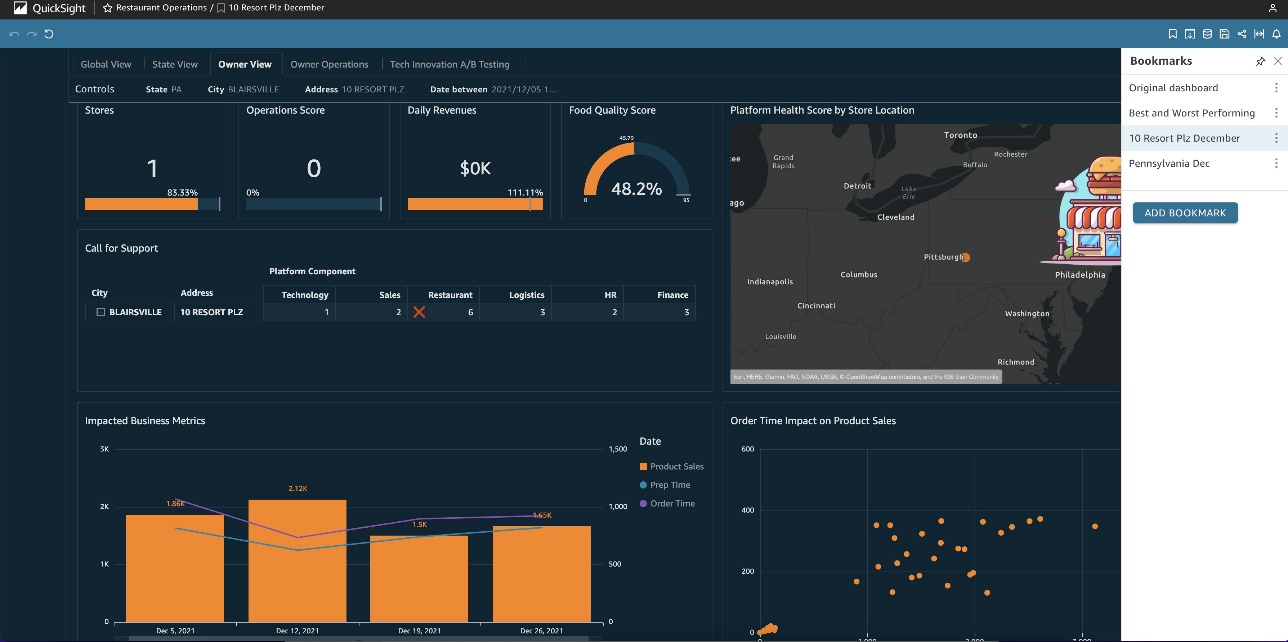
Pennsylvania December 2021 analysis
After looking at this bookmark, we found that in the month of December, the call for support score in the restaurant category was high. Additionally, in the week of December 19, 2021 product sales were at the monthly low. We want to see how these KPIs compare to other stores in the same state for that week. Is it just a seasonal trend, or do we need to look even deeper and take action? Again, we can create a bookmark that gives us this comparison on a state level.
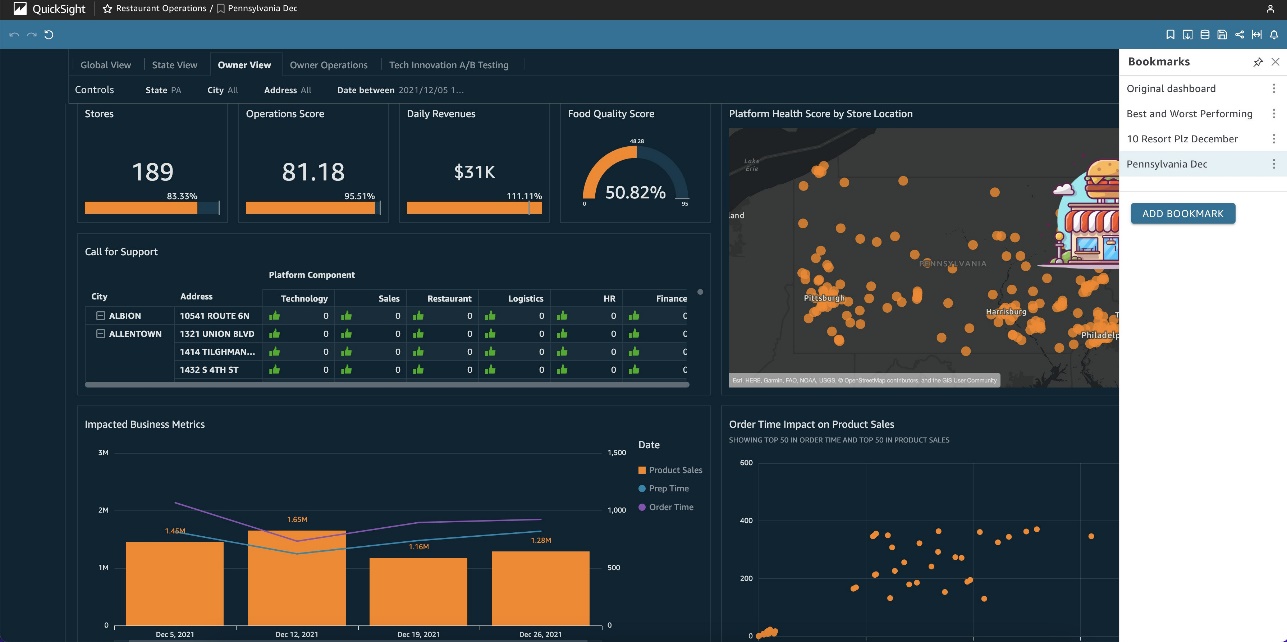
From the last bookmark, we can see that the other store in the same state (Pennsylvania) also had lower than average product sales in the week of December 19, 2021. For the purpose of this demo, we can go ahead and stop here, but we could create even more bookmarks to help answer additional questions, such as if we see this trend across other cities and states.
With these three bookmarks, we have created a top-down presentation looking at the worst performing store and its relevant metrics and comparisons. If we wanted to present this, it would be as simple as cycling through the bookmarks we’ve created to put together a cohesive presentation instead of having distracting onscreen filtering.
Conclusion
In this post, we discussed how we can create, modify, and delete bookmarks, along with setting it as a default view and sharing bookmarks. We also demonstrated an extended use case of presentation with bookmarks. The new bookmarks functionality is now generally available in all supported QuickSight Regions.
We’re looking forward to your feedback and stories on how you apply these calculations for your business needs.
Did you know that you can also ask questions of you data in natural language with QuickSight Q? Watch this video to learn more.
About the Authors
 Mei Qu is a Business Intelligence Engineer on the AWS QuickSight ProServe Team. She helps customers and partners leverage their data to develop key business insights and monitor ongoing initiatives. She also develops QuickSight proof of concept projects, delivers technical workshops, and supports implementation projects.
 Emily Zhu is a Senior Product Manager at Amazon QuickSight, AWS’s cloud-native, fully managed SaaS BI service. She leads the development of QuickSight analytics and query capabilities. Before joining AWS, she was working in the Amazon Prime Air drone delivery program and the Boeing company as senior strategist for several years. Emily is passionate about potentials of cloud-based BI solutions and looks forward to helping customers advance in their data-driven strategy-making.
AWS IoT FleetWise Now Generally Available – Easily Collect Vehicle Data and Send to the Cloud
Post Syndicated from Channy Yun original https://aws.amazon.com/blogs/aws/aws-iot-fleetwise-now-generally-available-easily-collect-vehicle-data-and-send-to-the-cloud/
Today we announce the general availability of AWS IoT FleetWise, a fully managed AWS service that makes it easier to collect, transform, and transfer vehicle data to the cloud. Last AWS re:Invent 2021, we previewed AWS IoT FleetWise, heard customer feedback, and improved features for various use cases of near-real-time vehicle data processing.
With AWS IoT FleetWise, automakers, fleet operators, and automotive suppliers can take the complex variability out of collecting data from vehicle fleets at scale. You can access standardized fleet-wide vehicle data and avoid developing custom data collection systems, or you can integrate AWS IoT FleetWise to enhance your existing systems. AWS IoT FleetWise enables intelligent data collection that sends the exact data you need from the vehicle to the cloud. You can use the data to analyze vehicle fleet health to more quickly identify potential maintenance issues or make in-vehicle infotainment systems smarter. Furthermore, you can use it to train machine learning (ML) models that improve autonomous driving and advanced driver assistance systems (ADAS).
For example, electric vehicle (EV) battery temperature is a critical metric that should be continuously analyzed for the entire vehicle fleet. In order to avoid costly continuous data ingestion, you may want to optimize the data collection by setting a threshold on EV battery temperature. The results of this analysis would be provided to the automaker’s quality engineering department, enabling fast assessment of the criticality and possible root causes of any issues identified at certain temperatures. Based on the root cause analysis, the automaker can then take short-term actions to support the driver affected by the issue, as well as midterm actions to improve vehicle quality.
How AWS IoT FleetWise Works
AWS IoT FleetWise provides a vehicle modeling framework that you can use to model your vehicle and its sensors and actuators in the cloud. To enable secure communication between your vehicle and the cloud, AWS IoT FleetWise also provides the AWS IoT FleetWise Edge Agent application that you can use to download and install in-vehicle electronic control units (ECUs) such as the gateway, in-vehicle infotainment controller, etc. You define data collection schemes in the cloud and deploy them to your vehicle.
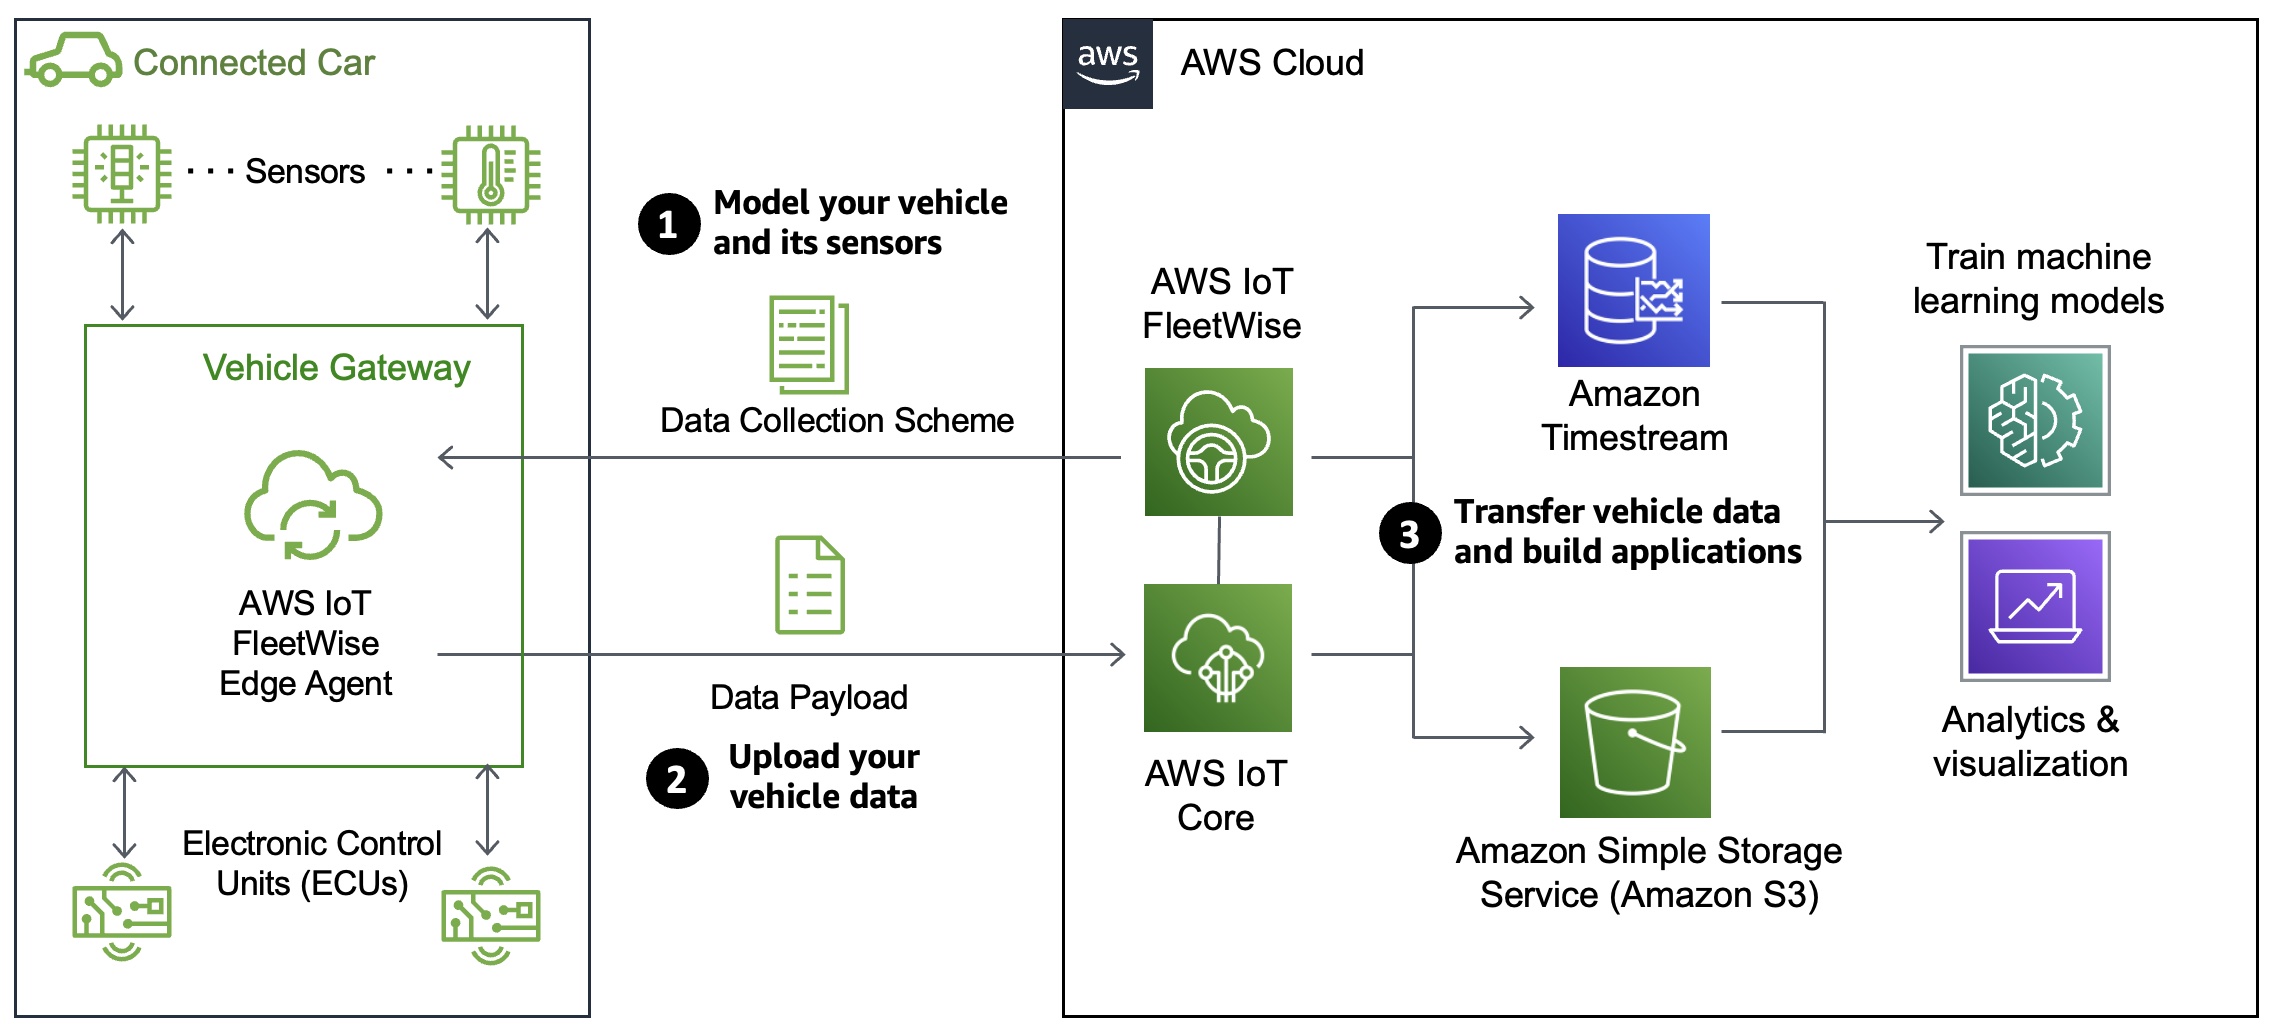
The AWS IoT FleetWise Edge Agent running in your vehicle uses data collection schemes to control what data to collect and when to transfer it to the cloud. Data collected and ingested through AWS IoT FleetWise Edge Agent software goes directly into your Amazon Timestream table or Amazon Simple Storage Service (Amazon S3) repositories via AWS IoT Core.
AWS IoT FleetWise Features
To get started with AWS IoT FleetWise, you can register your account and configure the settings via the AWS console. AWS IoT FleetWise automatically registers your AWS account, IAM role, and Amazon Timestream resources.
The Edge Agent software is a C++ application distributed as source code and is available on GitHub to collect, decode, normalize, cache, and ingest vehicle data to AWS. It supports multiple deployment options, such as vehicle gateways, infotainment systems, telematics control units (TCUs), or aftermarket devices. When vehicles are connected to the cloud, the Edge Agent continually receives data collection schemes and collects, decodes, normalizes and ingests the transformed vehicle data to AWS.
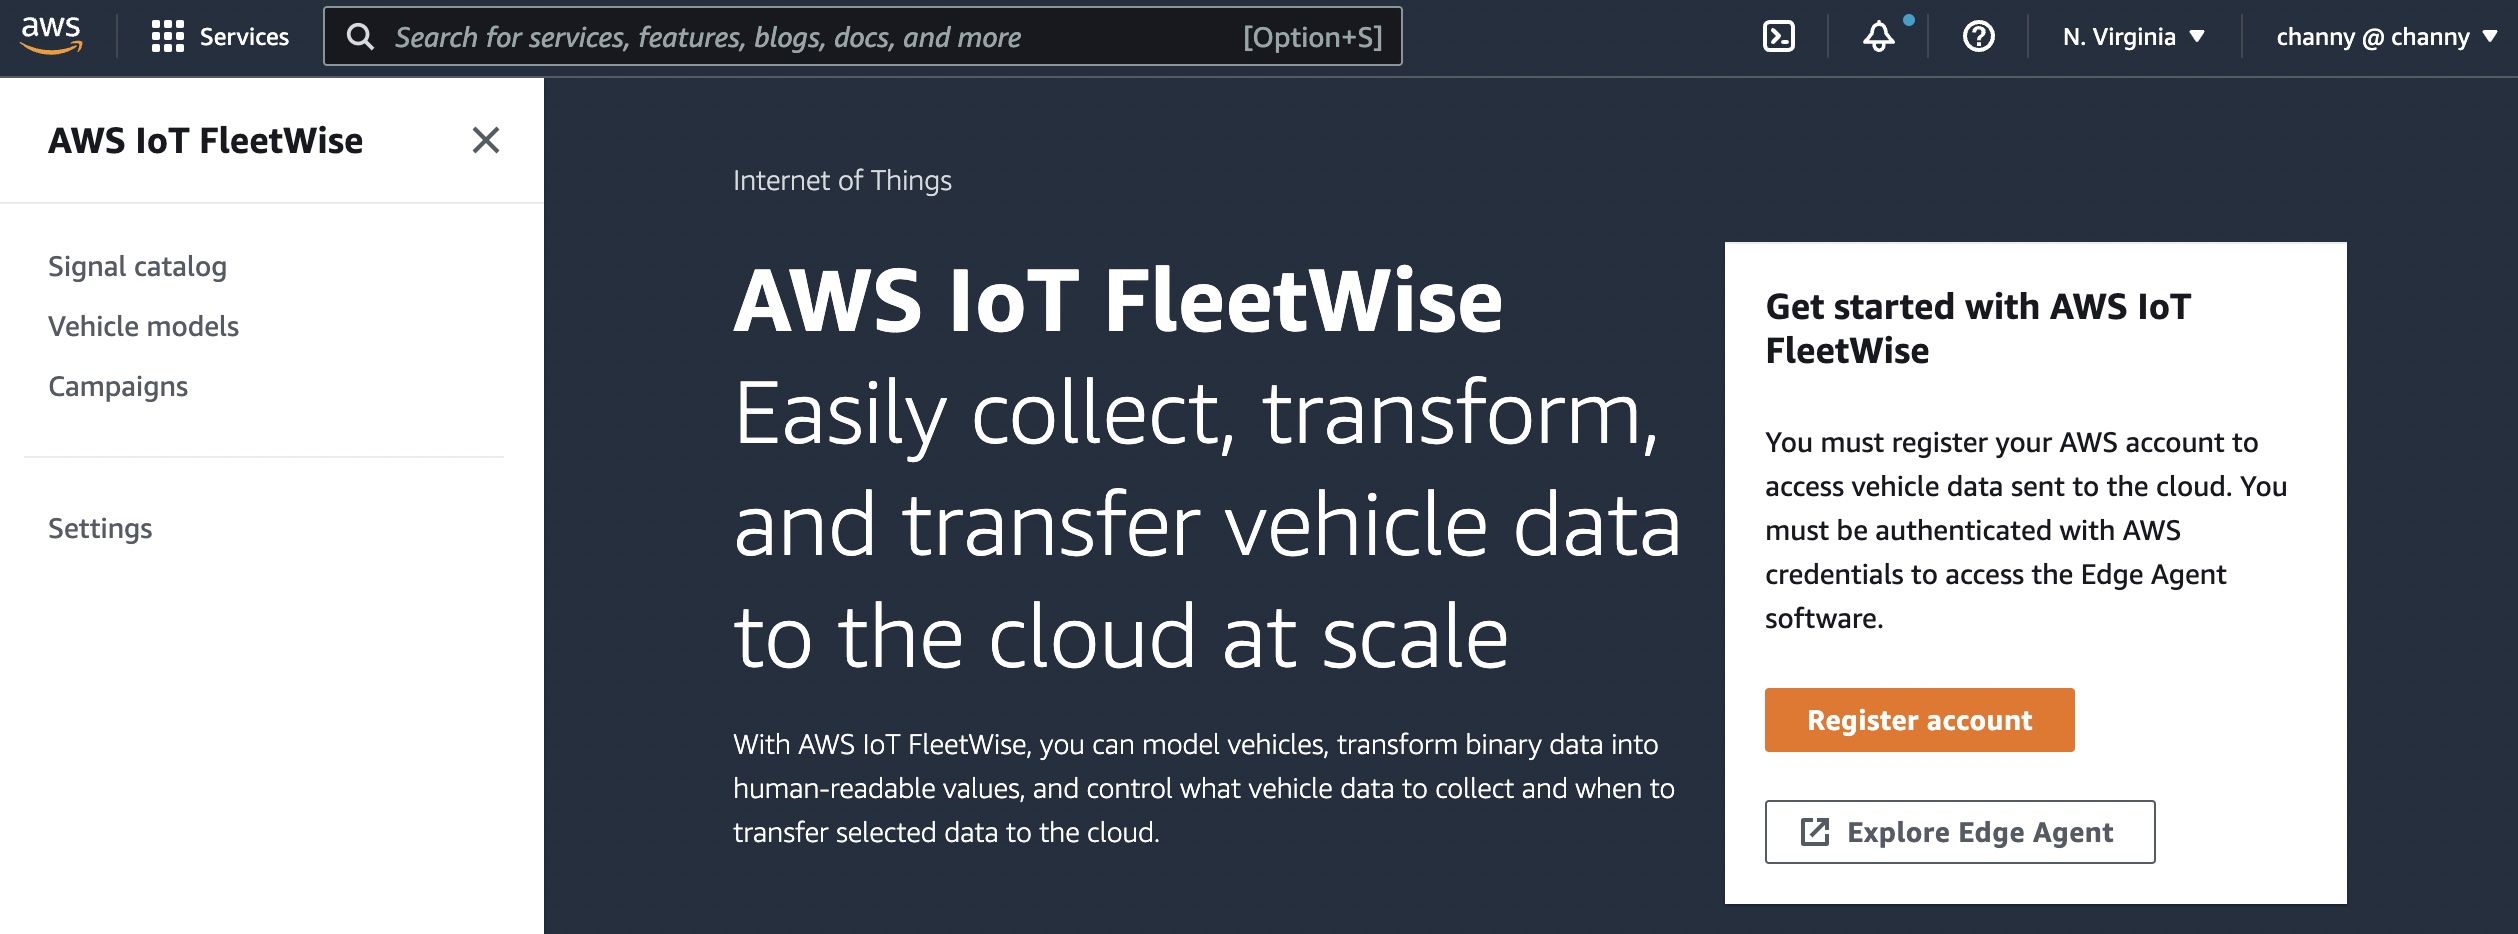
Let’s see the benefits and features of AWS IoT FleetWise:
Signal catalog
A signal catalog contains a collection of vehicle signals. Signals are fundamental structures that you define to contain vehicle data and its metadata. A signal can be a sensor and its status, an attribute as static information of the manufacturer, a branch to represent a nested structure such as Vehicle.Powertrain.combustionEngine expression, or an actuator such as the state of a vehicle device. For example, you can create a sensor to receive in-vehicle temperature values and store its metadata, including a sensor name, a data type, and a unit.
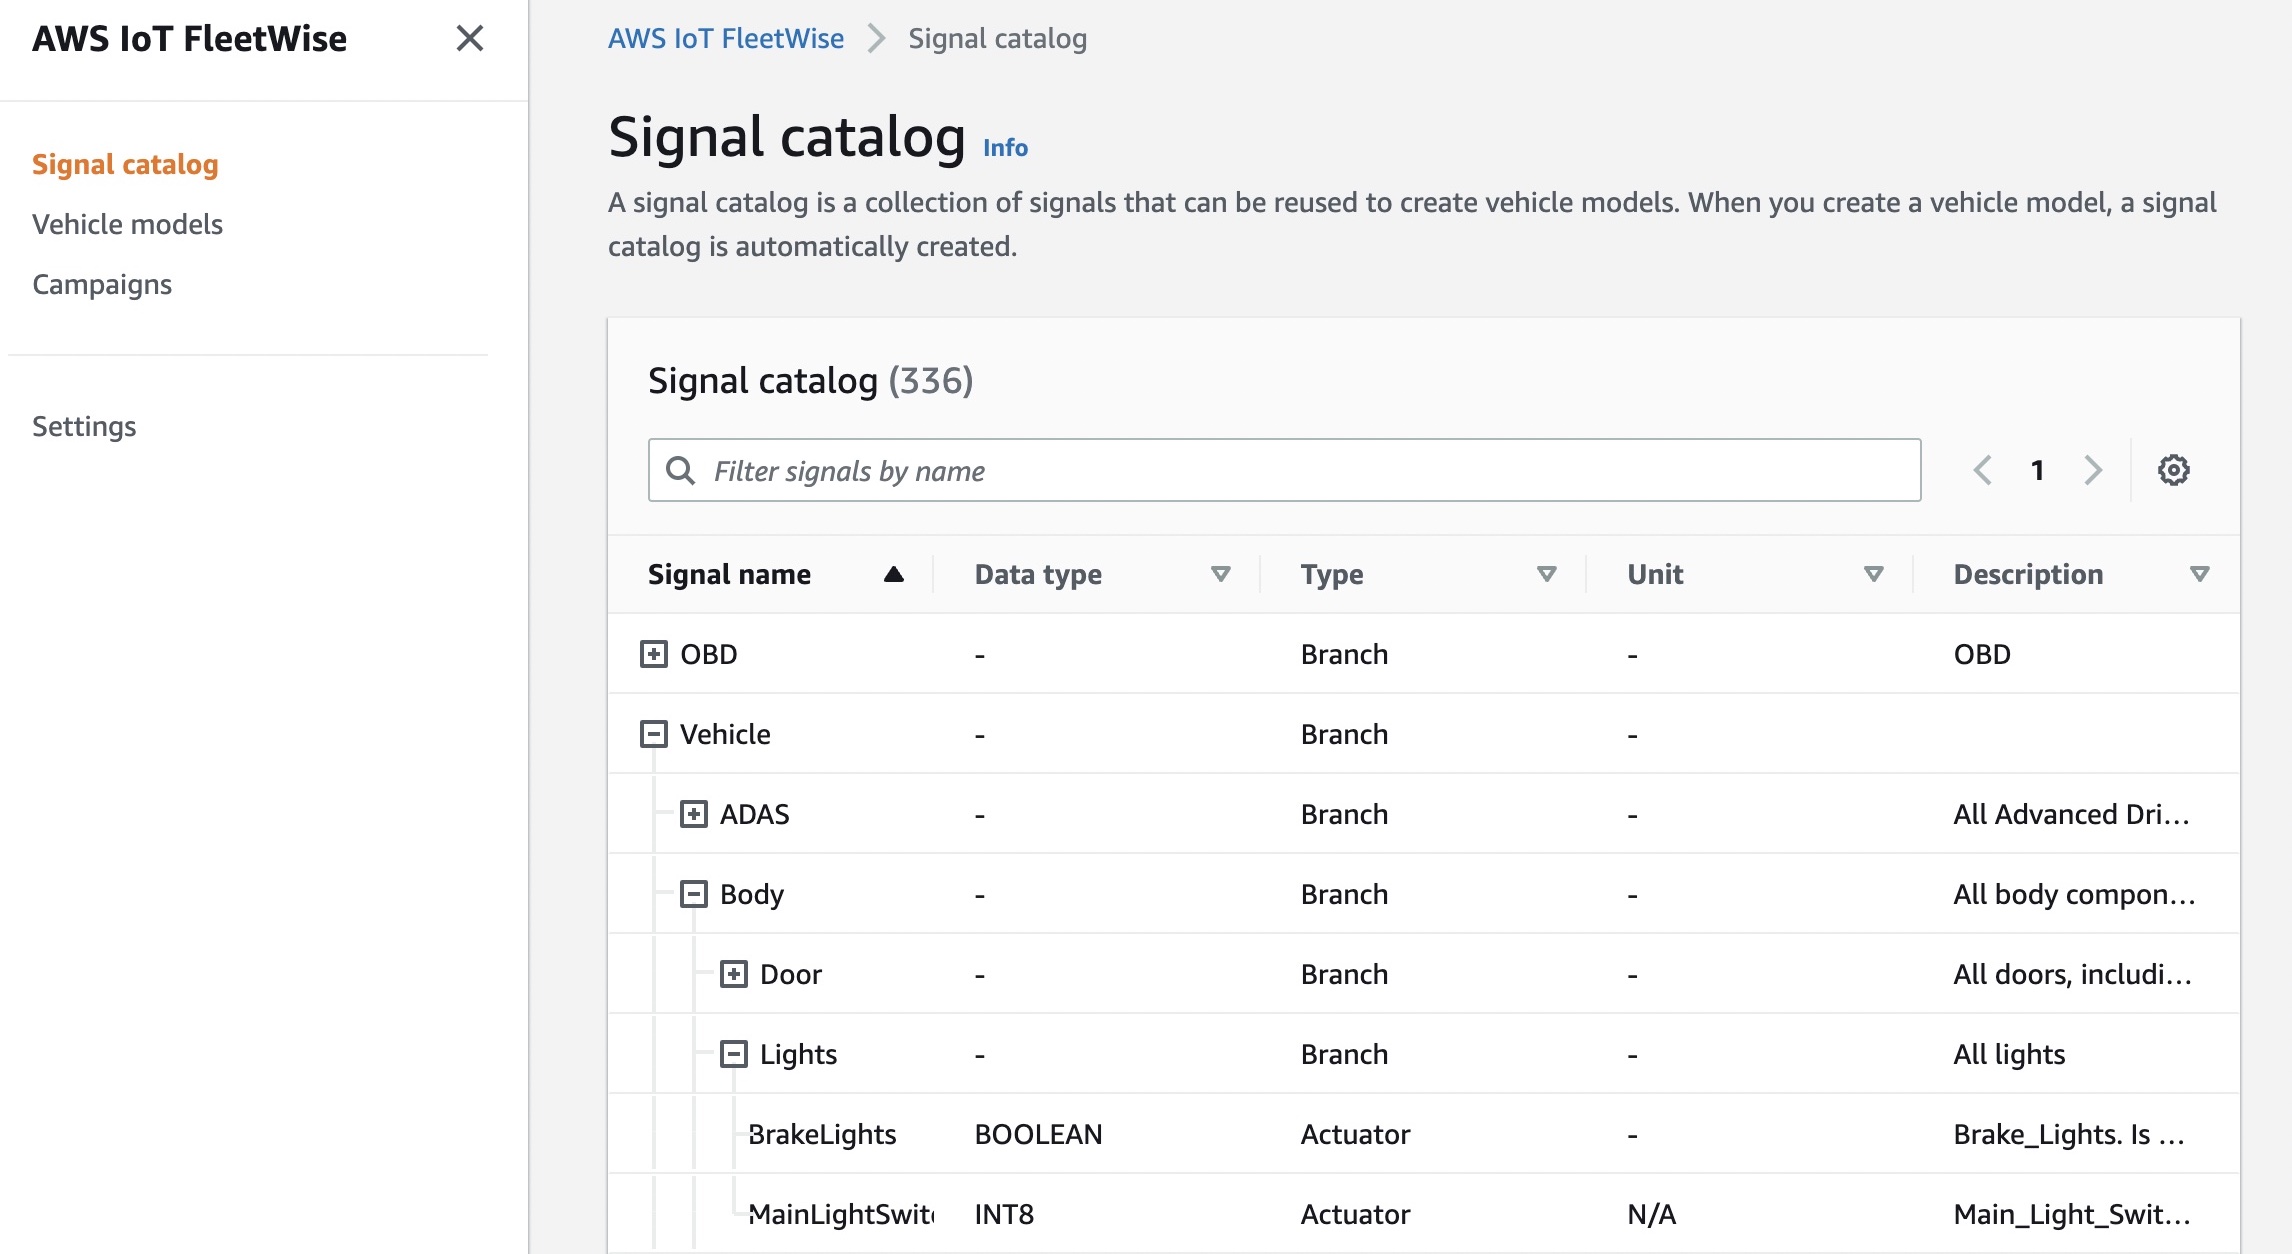
Signals in a signal catalog can be used to model vehicles that use different protocols and data formats. For example, there are two cars made by different automakers: one uses the Controller Area Network (CAN) to transmit the in-vehicle temperature data and the other uses On-board Diagnostic (OBD) protocol.
You can define a sensor in the signal catalog to receive in-vehicle temperature values. This sensor can be used to represent the thermocouples in both cars, irrespective of how this temperature data is available within the vehicle networks. For more information, see Create and manage signal catalogs in the AWS documentation.
Vehicle models
Vehicle models are virtual declarative representations that standardize the format of your vehicles and define relationships between signals in the vehicles. Vehicle models enforce consistent information across multiple vehicles of the same type so that you can quickly configure and create a vehicle fleet. In each vehicle model, you can add signals, including attributes, branches (signal hierarchies), sensors, and actuators.
You can define condition-based schemes to control what data to collect, such as data in-vehicle temperature values that are greater than 40 degrees. You can also define time-based schemes to control how often to collect data. For more information, see Create and manage vehicle models in the AWS documentation.
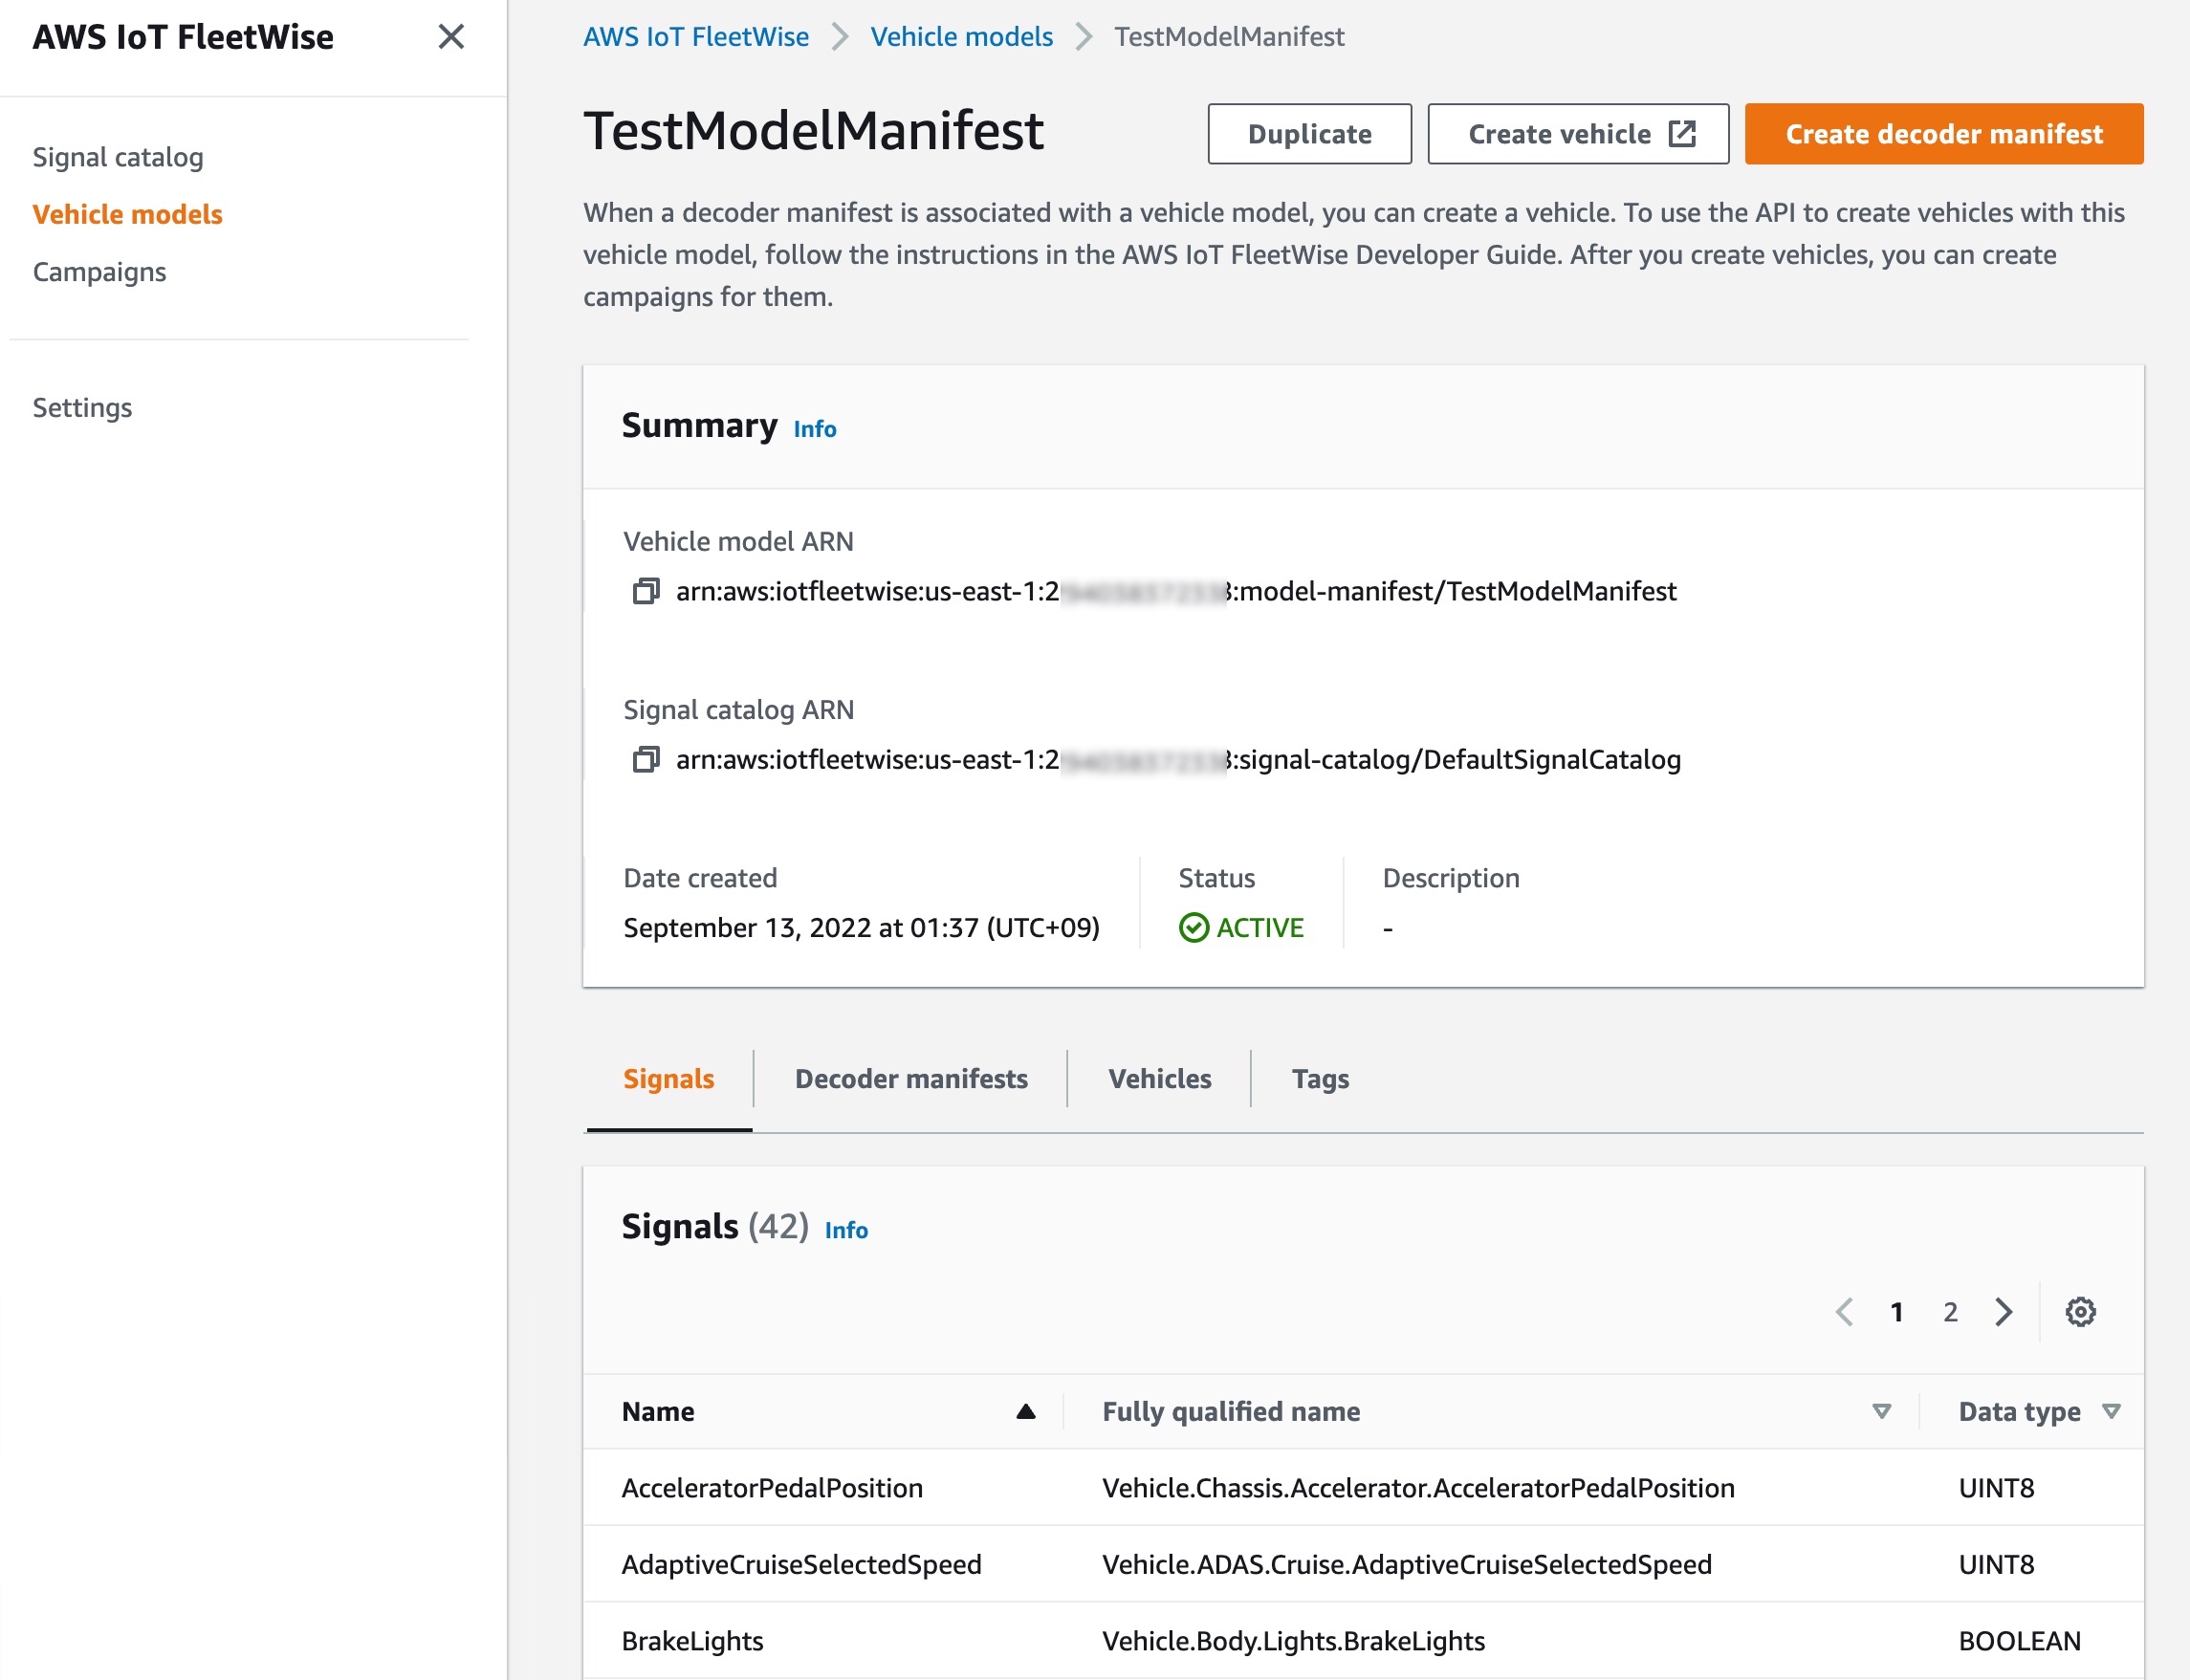
When a decoder manifest is associated with a vehicle model, you can create a vehicle. Each vehicle corresponds to an AWS IoT thing. You can use an existing AWS IoT thing to create a vehicle or set AWS IoT FleetWise to automatically create an AWS IoT thing for your vehicle. For more information, see Provision vehicles in the AWS documentation. After you create vehicles, you can create campaigns for them.
Campaigns
A campaign gives the AWS IoT FleetWise Edge Agent instructions on how to select, collect, and transfer data to the cloud. You can make a campaign with vehicle attributes that you added when creating vehicles, and a data collection scheme. You can manually define the data collection scheme either condition-based logical expressions such as $variable.myVehicle.InVehicleTemperature > 40.0, or time-based data collection in milliseconds such as from 10000 – 60000 milliseconds. To learn more, see Create a campaign in the AWS documentation.
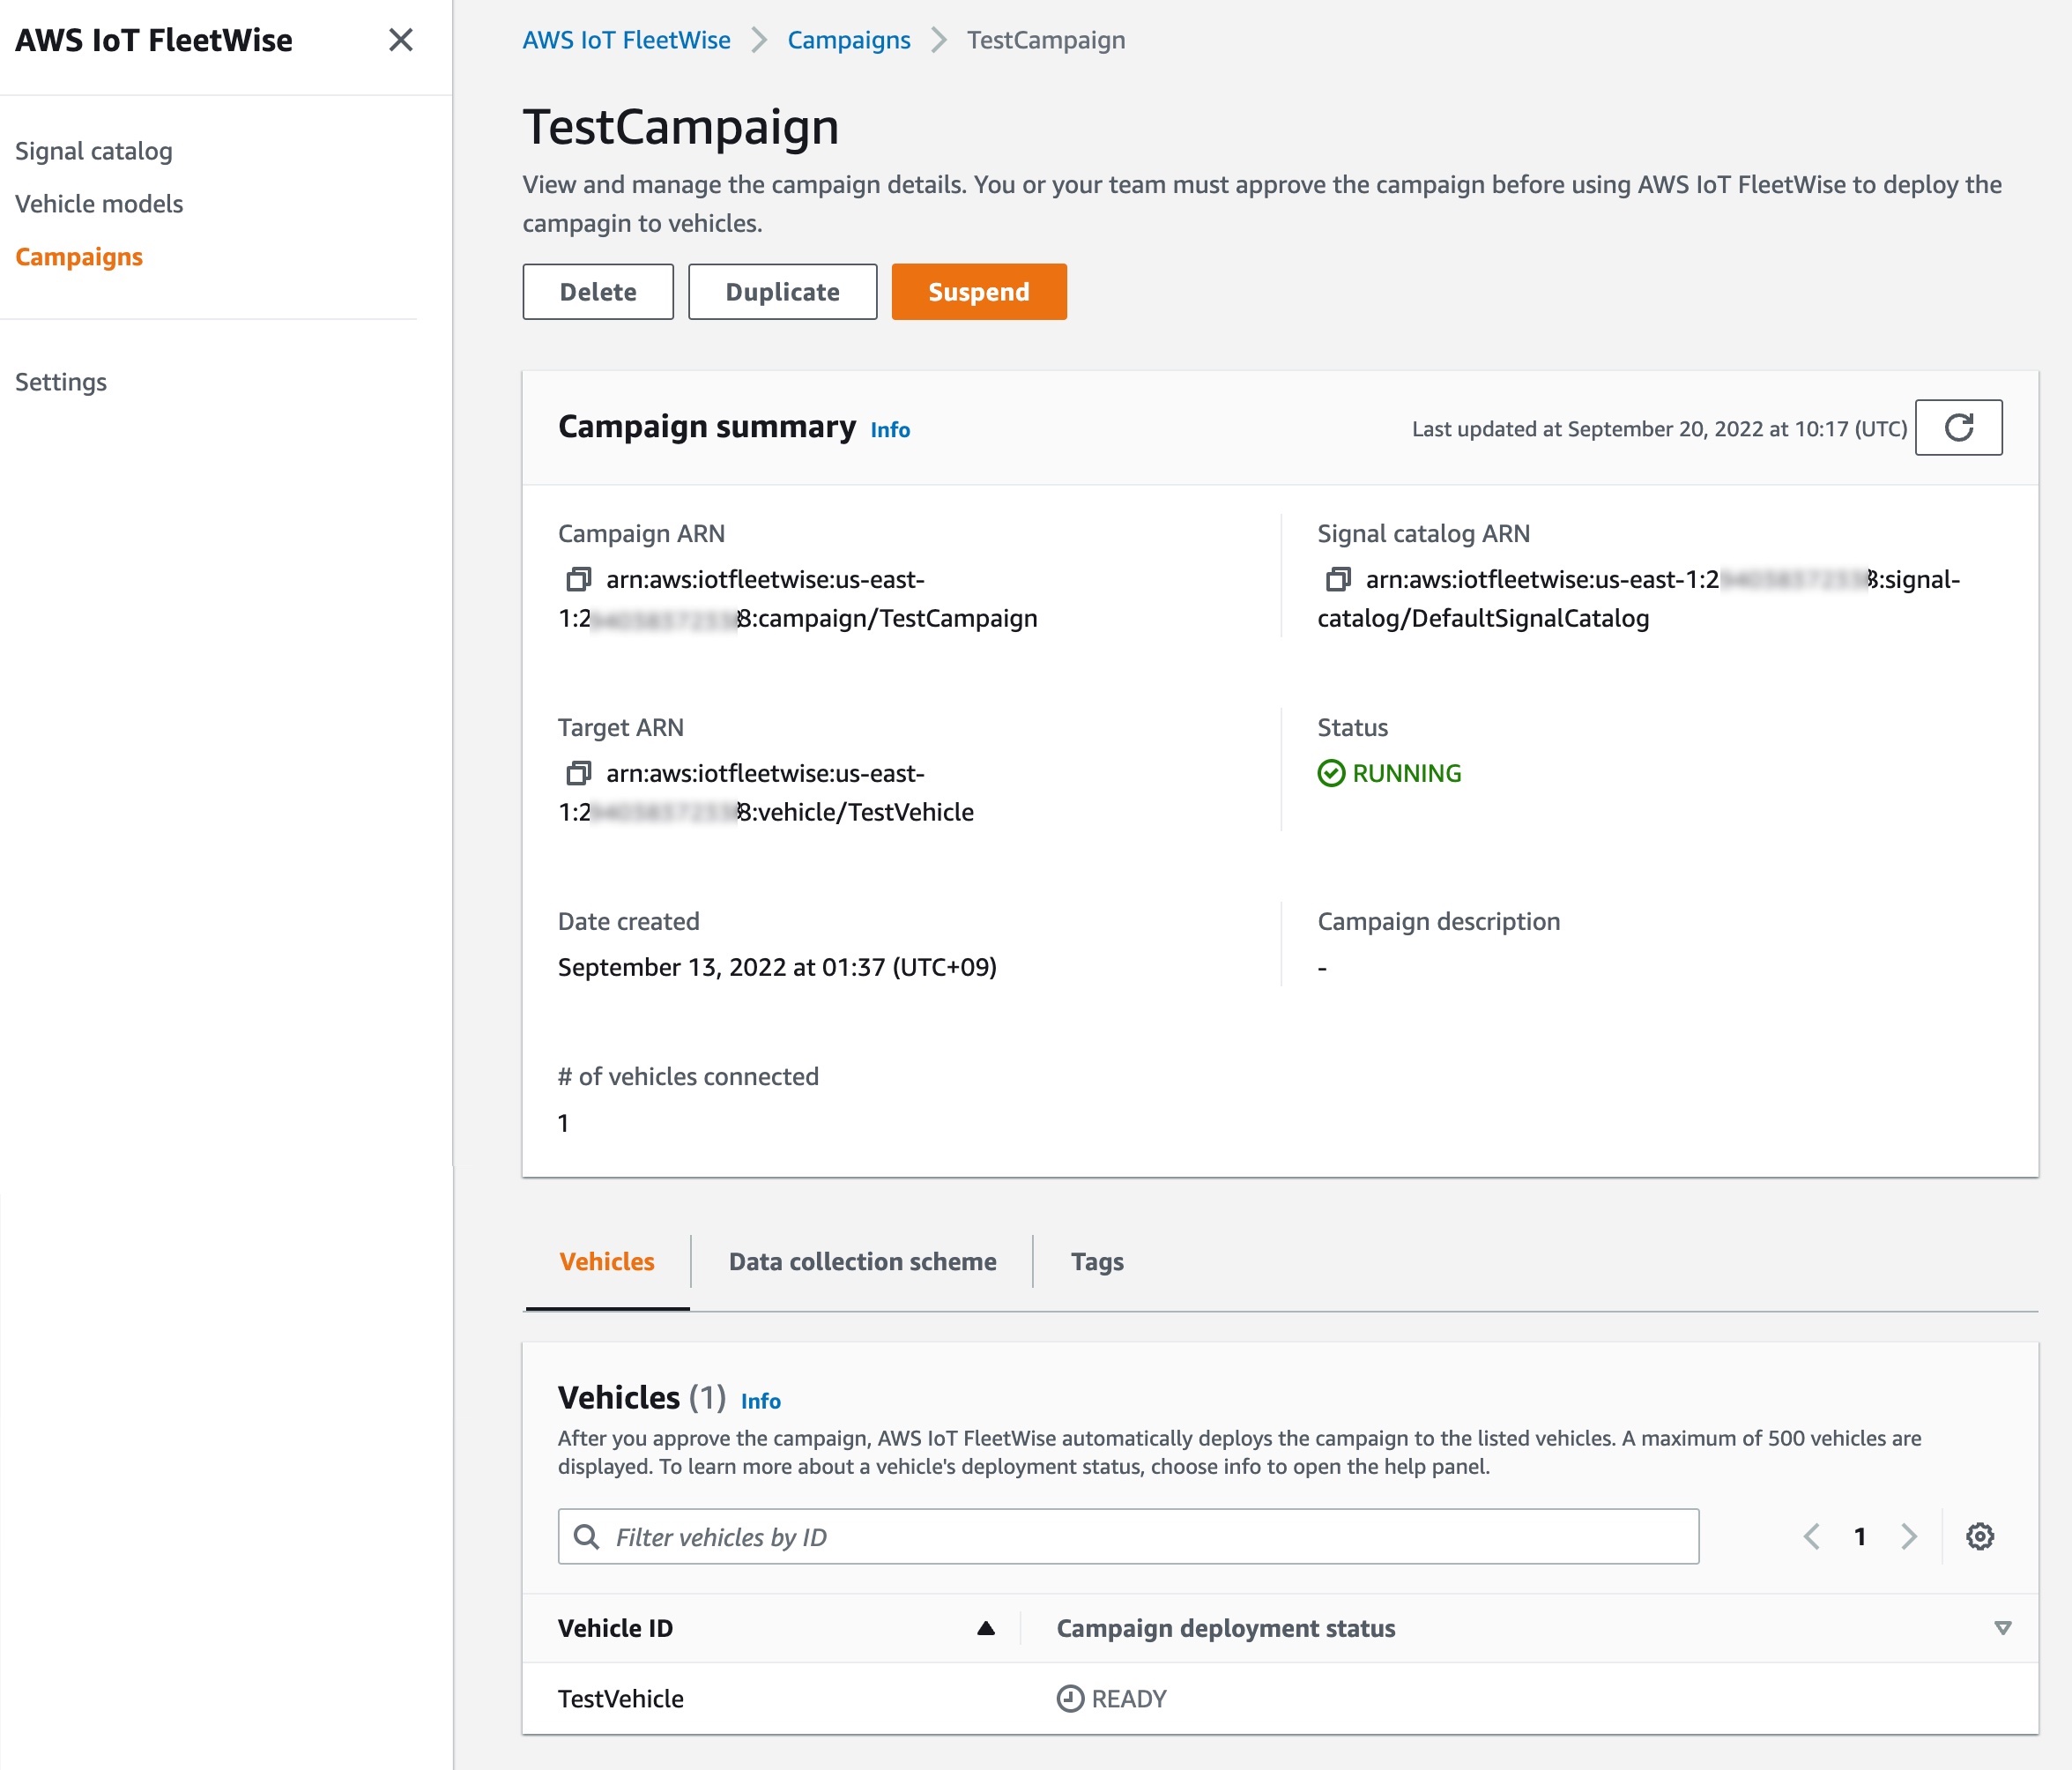
After you create and approve the campaign, AWS IoT FleetWise automatically deploys the campaign to the listed vehicles. The AWS IoT FleetWise Edge Agent software doesn’t start collecting data until a running campaign is deployed to the vehicle. If you want to pause collecting data from vehicles connected to the campaign, on the Campaign summary page, choose Suspend. To resume collecting data from vehicles connected to the campaign, choose Resume.
Demo – Visualizing Vehicle Data
Here is a demo that aims to show how AWS IoT FleetWise can make it easy to collect vehicle data and use it to build visualizing applications. In this demo, you can simulate two kinds of vehicles, an NXP GoldBox powered by an Automotive Grade Linux distribution that runs the AWS IoT FleetWise agent as an AWS IoT Greengrass component or a completely virtual vehicle implemented as an AWS Graviton ARM-based Amazon EC2 instance. To learn more, see the getting started guide and source code in the GitHub repository.
The vehicle in CARLA Simulator can self-drive or be driven with a game steering wheel connected to your desktop. You can watch a live demo video.
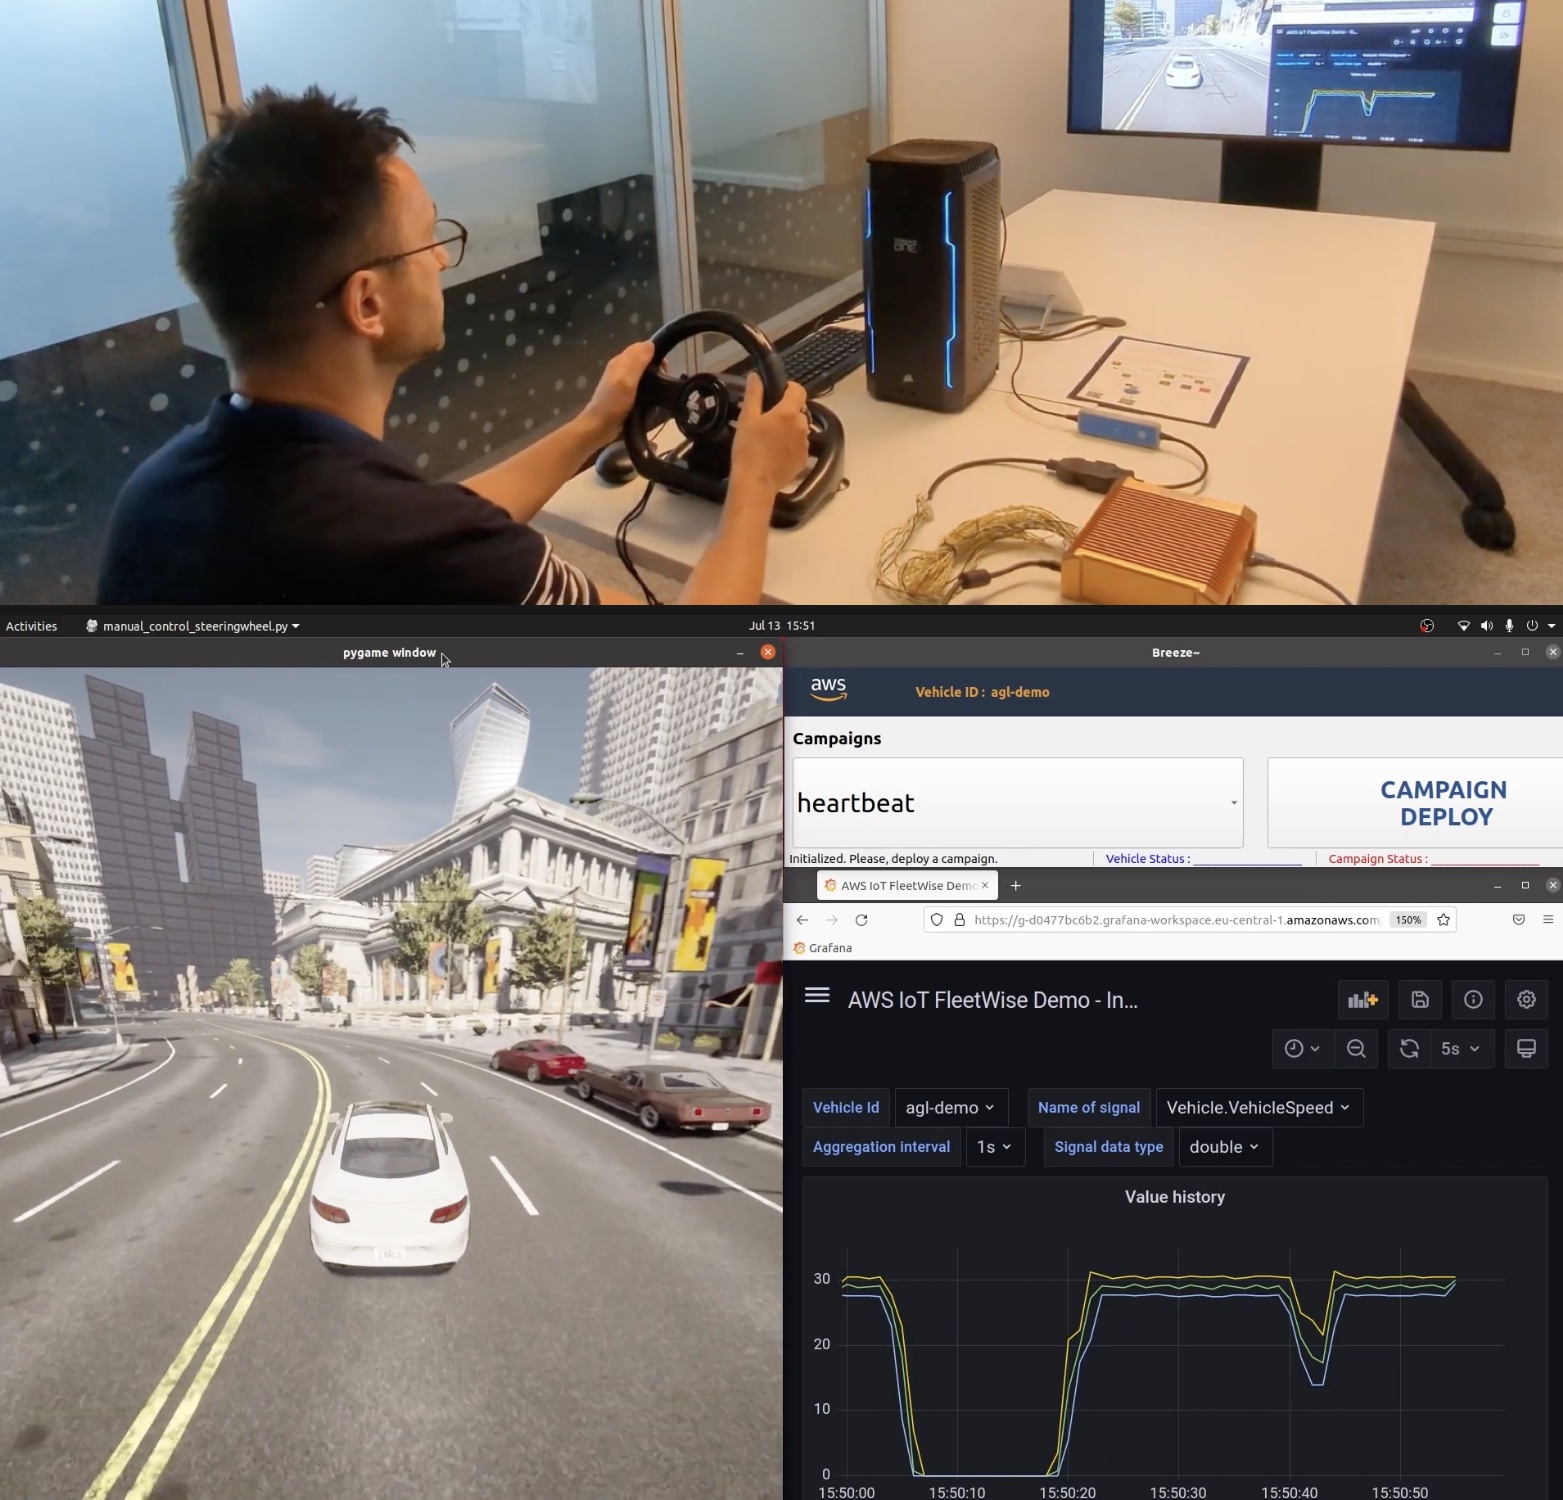
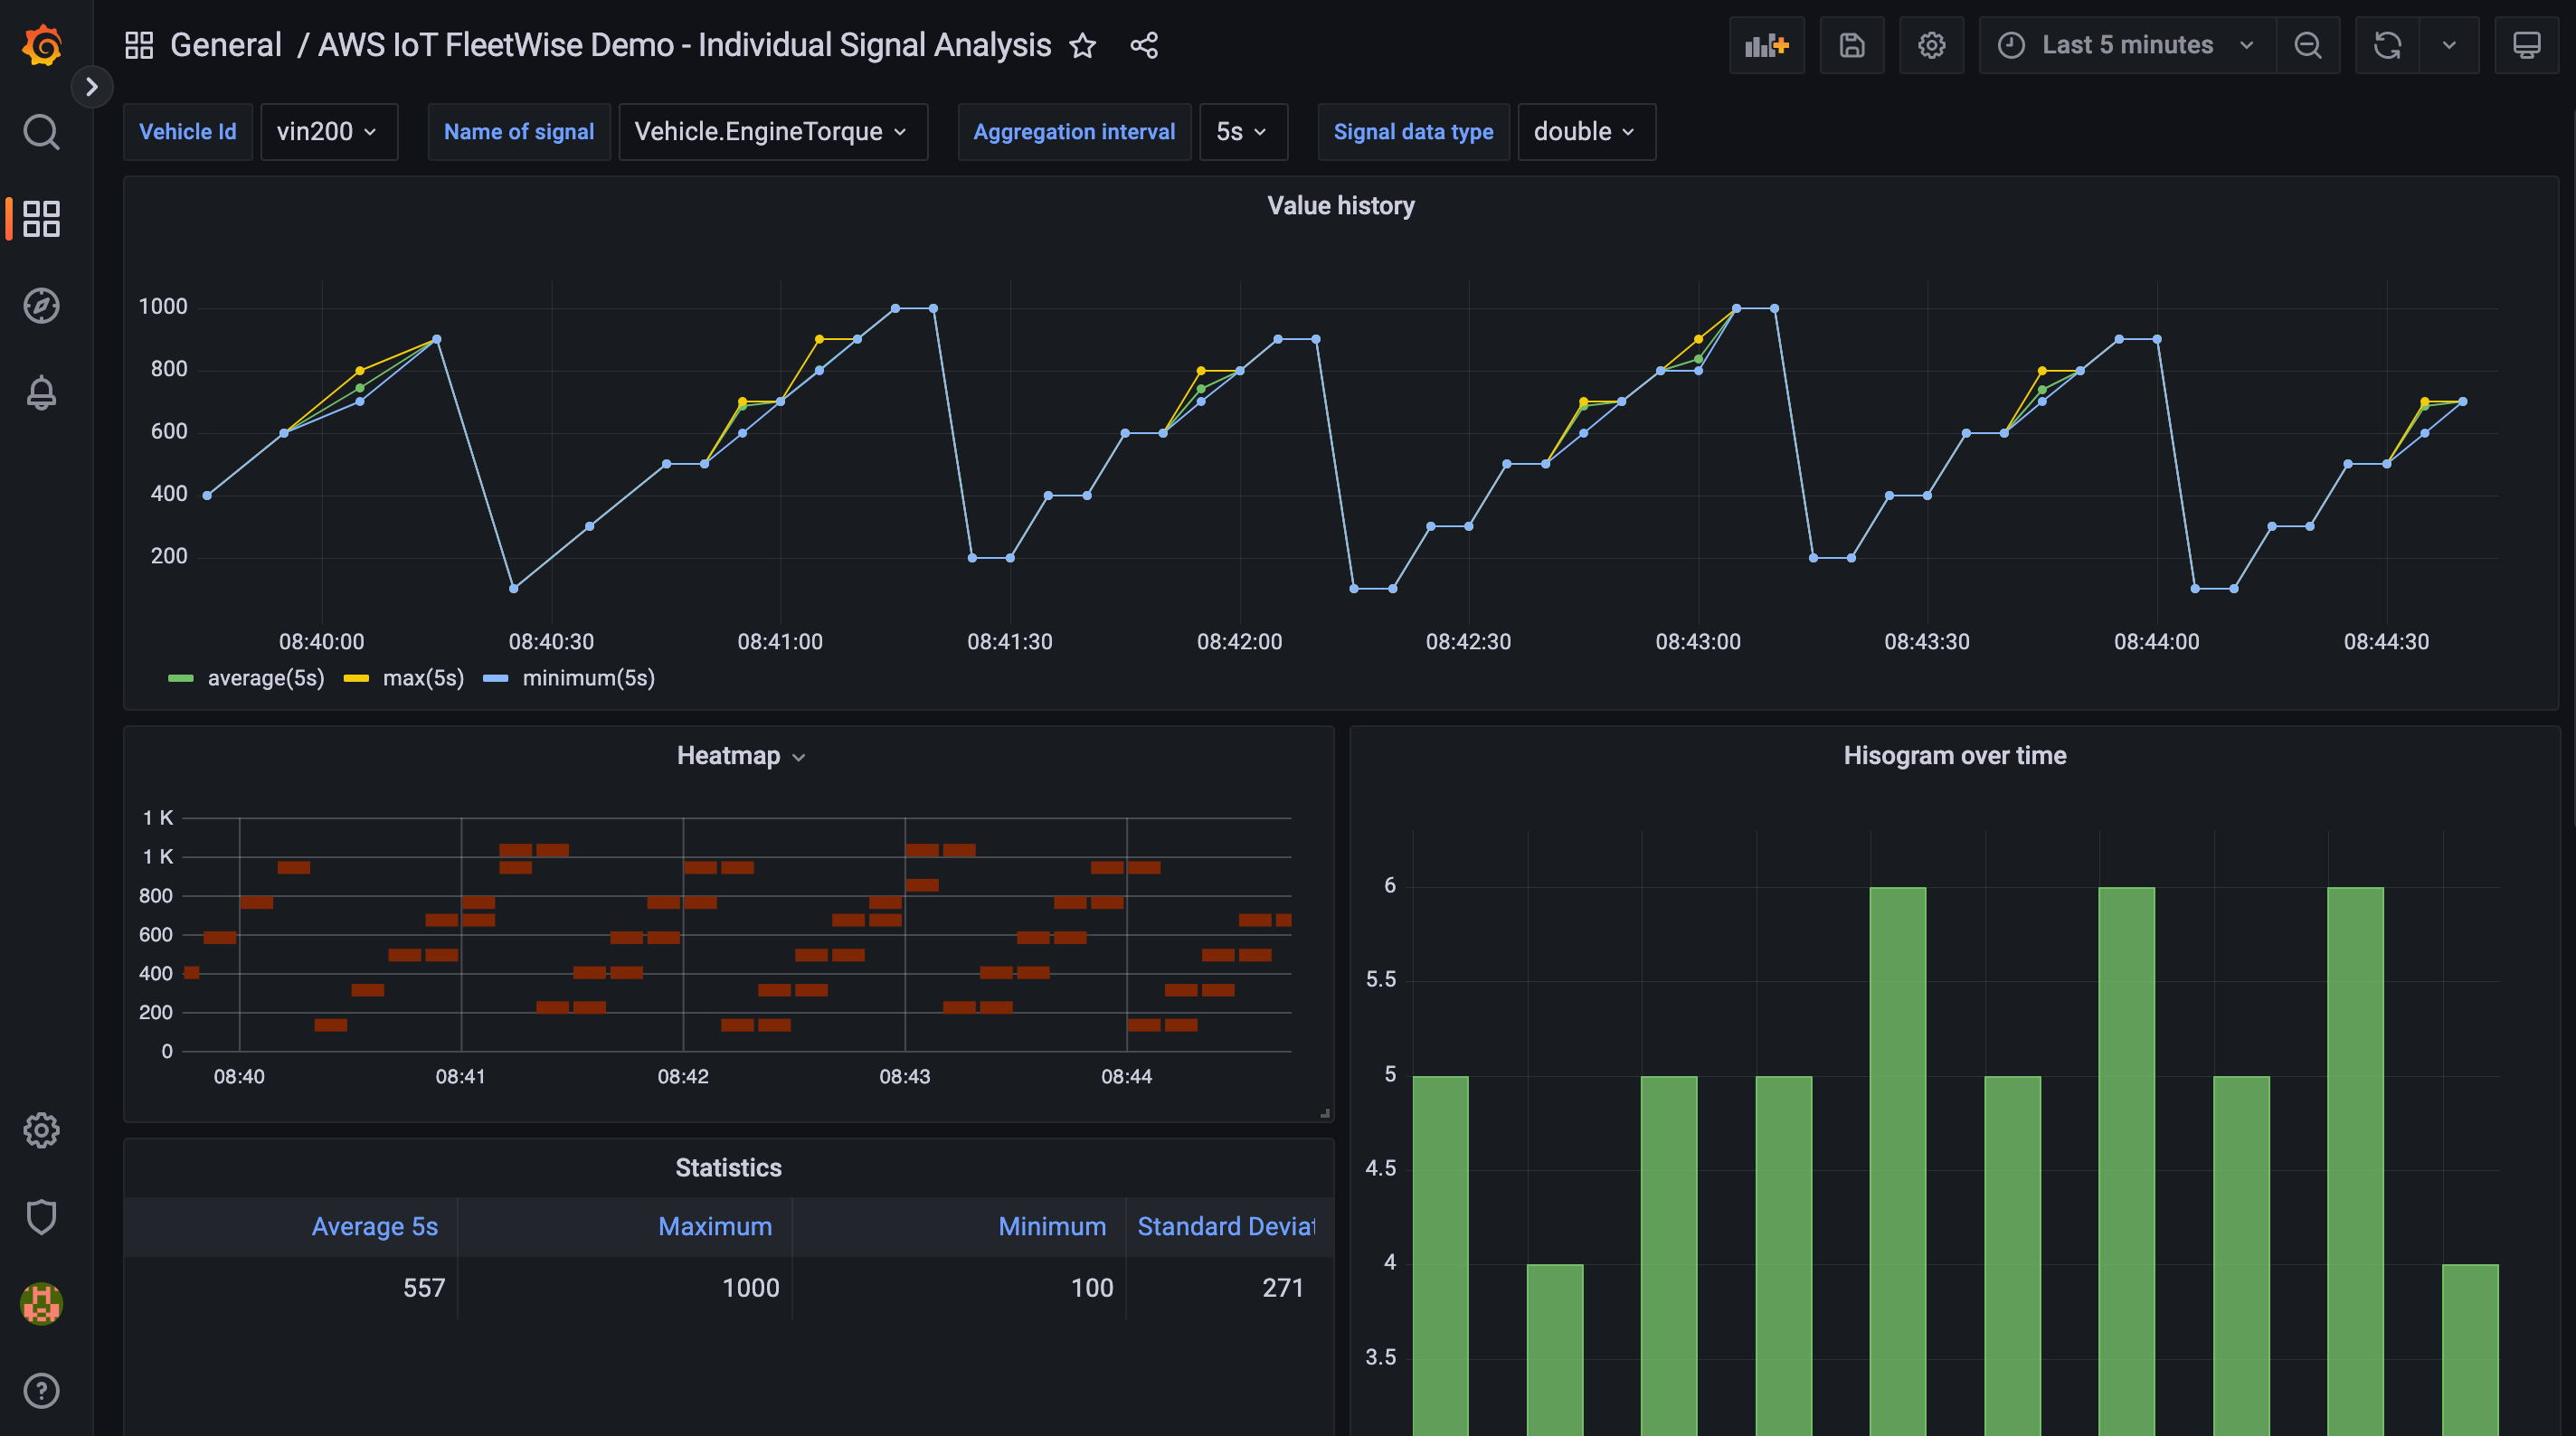
Data is collected by AWS IoT FleetWise and stored in the Amazon Timestream table, and visualized on a Grafana Dashboard.
Customer and Partner Voices
During the preview period, we heard lots of feedback from our customers and partners in automotive industry such as automakers, fleet operators, and automotive suppliers.
 For example, Hyundai Motor Group (HMG) is a global vehicle manufacturer that offers consumers a technology-rich lineup of cars, sport utility vehicles, and electrified vehicles. HMG has used AWS services, such as using Amazon SageMaker, to reduce its ML model training time for autonomous driving models.
Hae Young Kwon, vice president and head of the infotainment development group at HMG, said:
“As a leading global vehicle manufacturer, we have come to appreciate the breadth and depth of AWS services to help create new connected vehicle capabilities. With more data available from our expanding global fleet of connected cars, we look forward to leveraging AWS IoT FleetWise to discover how we can build more personalized ownership experiences for our customers.”
 LG CNS is a global IT service provider and AWS Premier Consulting Partner that is transforming smart transportation services by building an advanced transportation system that is convenient and safe by maximizing the operational efficiency of multiple modes of transport, including buses, subways, taxis, railways, and airplanes.
Jae Seung Lee, vice president at LG CNS, said:
“At LG CNS, we are committed to advancing the technology that is powering the future of transportation. By using AWS IoT FleetWise, we are creating a new data platform that allows us to ingest, analyze, and simulate vehicle conditions in real-time. With these advanced insights, our customers can gain a better understanding of their vehicles and, as a result, improve decision-making about their fleets.”
 Bridgestone is a global leader in tires and rubber building on its expertise to provide solutions for safe and sustainable mobility. Bridgestone has worked with AWS for several years to develop a system that delivers insights derived from the interaction between a tire and a vehicle using advanced machine learning capabilities on Amazon SageMaker.
Brian Goldstine, president of mobility solutions and fleet management at Bridgestone Americas Inc. said:
“Bridgestone has been working with AWS to transform the digital services we provide to our automotive manufacturer, fleet, and retail customers. We look forward to exploring how AWS IoT FleetWise will make it easier for our customers to collect detailed tire data, which can provide new insights for their products and applications.”
 Renesas Electronics Corporation is a global leader in microcontrollers, analog, power, and system on chips (SoC) products. Renesas launched cellular-to-cloud IoT development platforms and its cloud development kits to run on AWS IoT Core and FreeRTOS.
Yusuke Kawasaki, director at Renesas Electronics Corporation, said:
“The volume of connected vehicle data is forecast to increase dramatically over the next few years, driven by new and evolving customer expectations. As a result, Renesas is focused on addressing the needs of automotive engineers facing increasing system complexity. Incorporating AWS IoT FleetWise into our vehicle gateway solution will enable our customers to enjoy our market-ready approach for large-scale data collection and accelerate their cloud development strategy. We look forward to further collaborating with AWS to provide a better and simpler development environment for our customers.”
By working with AWS IoT FleetWise Partners, you can take advantage of solutions to streamline your IoT projects, reduce the risk of your efforts, and accelerate time to value. To learn more how AWS accelerates the automotive industry’s digital transformation, see AWS for Automotive.
Now Available
AWS IoT FleetWise is now generally available in the US East (N. Virginia) and Europe (Frankfurt) Regions. You pay for the vehicles you have created and messages per vehicle per month. Additional services used alongside AWS IoT FleetWise, such as AWS IoT Core and Amazon Timestream, are billed separately. For more detail, see the AWS IoT FleetWise pricing page.
To learn more, see the AWS IoT FleetWise resources page including documentations, videos, and blog posts. Please send feedback to AWS re:Post for AWS IoT FleetWise or through your usual AWS support contacts.
– Channy
LXD 5.6 released
Post Syndicated from original https://lwn.net/Articles/909604/
Version
5.6 of the LXD container manager is out. Changes include the ability
to stream log messages to a Grafana Loki server, Infiniband support for
virtual machines, a restricted network access mode, and more.