Internship Experience: Software Development Intern

Post Syndicated from Ulysses Kee original https://blog.cloudflare.com/internship-experience-software-development-intern/

Internship Experience: Software Development Intern

Before we dive into my experience interning at Cloudflare, let me quickly introduce myself. I am currently a master’s student at the National University of Singapore (NUS) studying Computer Science. I am passionate about building software that improves people’s lives and making the Internet a better place for everyone. Back in December 2021, I joined Cloudflare as a Software Development Intern on the Partnerships team to help improve the experience that Partners have when using the platform. I was extremely excited about this opportunity and jumped at the prospect of working on serverless technology to build viable tools for our partners and customers. In this blog post, I detail my experience working at Cloudflare and the many highlights of my internship.

Interview Experience

The process began for me back when I was taking a software engineering module at NUS where one of my classmates had shared a job post for an internship at Cloudflare. I had known about Cloudflare’s DNS service prior and was really excited to learn more about the internship opportunity because I really resonated with the company’s mission to help build a better Internet.

I knew right away that this would be a great opportunity and submitted my application. Soon after, I heard back from the recruiting team and went through the interview process – the entire interview process was extremely accommodating and is definitely the most enjoyable interview experience I have had. Throughout the process, I was constantly asked about the kind of things I would like to work on and the relevance of the work that I would be doing. I felt that this thorough communication carried on throughout the internship and really was a cornerstone of my experience interning at Cloudflare.

My Internship

My internship began with onboarding and training, and then after, I had discussions with my mentor, Ayush Verma, on the projects we aimed to complete during the internship and the order of objectives. The main issues we wanted to address was the current manual process that our internal teams and partners go through when they want to duplicate the configuration settings on a zone, or when they want to compare one zone to other zones to ensure that there are no misconfigurations. As you can imagine, with the number of different configurations offered on the Cloudflare dashboard for customers, it could take significant time to copy over every setting and rule manually from one zone to another. Additionally, this process, when done manually, poses a potential threat for misconfigurations due to human error. Furthermore, as more and more customers onboard different zones onto Cloudflare, there needs to be a more automated and improved way for them to make these configuration setups.

Initially, we discussed using Terraform as Cloudflare already supports terraform automation. However, this approach would only cater towards customers and users that have more technical resources and, in true Cloudflare spirit, we wanted to keep it simple such that it could be used by any and everyone. Therefore, we decided to leverage the publicly available Cloudflare APIs and create a browser-based application that interacts with these APIs to display configurations and make changes easily from a simple UI.

With the end goal of simplifying the experience for our partners and customers in duplicating zone configurations, we decided to build a Zone Copier web application solely built on Cloudflare Workers. This tool would, in a click of a button, automatically copy over every setting that can be copied from one zone to another, significantly reducing the amount of time and effort required to make the changes.

Alongside the Zone Copier, we would have some auxiliary tools such as a Zone Viewer, and Zone Comparison, where a customer can easily have a full view of their configurations on a single webpage and be able to compare different zones that they use respectively. These other applications improve upon the existing methods through which Cloudflare users can view their zone configurations, and allow for the direct comparison between different zones.

Importantly, these applications are not to replace the Cloudflare Dashboard, but to complement it instead – for deeper dives into a single particular configuration setting, the Cloudflare Dashboard remains the way to go.

To begin building the web application, I spent the first few weeks diving into the publicly available APIs offered by Cloudflare as part of the v4 API to verify the outputs of each endpoint, and the type of data that would be sent as a response from a request. This took much longer than expected as certain endpoints provided different default responses for a zone that has either an empty setting – for example, not having any Firewall Rules created – or uses a nested structure for its relevant response. These different potential responses have to be examined so that when the web application calls the respective API endpoint, the responses are handled appropriately. This process was quite manual as each endpoint had to be verified individually to ensure the output would work seamlessly with the application.

Once I completed my research, I was able to start designing the web application. Building the web application was a very interesting experience as the stack rested solely on Workers, a serverless application platform. My prior experiences building web applications used servers that require the deployment of a server built using Express and Node.js, whereas for my internship project, I completely relied on a backend built using the itty-router library on Workers to interface with the publicly available Cloudflare APIs. I found this extremely exciting as building a serverless application required less overhead compared to setting up a server and deploying it, and using Workers itself has many other added benefits such as zero cold starts. This introduction to serverless technology and my experience deep-diving into the capabilities of Workers has really opened my eyes to the possibilities that Workers as a platform can offer. With Workers, you can deploy any application on Cloudflare’s global network like I did!

For the frontend of the web application, I used React and the Chakra-UI library to build the user interface for which the Zone Viewer, Zone Comparison, and Zone Copier, is based on. The routing between different pages was done using React Router and the application is deployed directly through Workers.

Here is a screenshot of the application:

Internship Experience: Software Development Intern

Presenting the prototype application

As developers will know, the best way to obtain feedback for the tool that you’re building is to directly have your customers use them and let you know what they think of your application and the kind of features they want to have built on top of it. Therefore, once we had a prototype version of the web application for the Zone Viewer and Zone Comparison complete, we presented the application to the Solutions Engineering team to hear their thoughts on the impact the tool would have on their work and additional features they would like to see built on the application. I found this process very enriching as they collectively mentioned how impactful the application would be for their work and the value add this project provides to them.

Some interesting feedback and feature requests I received were:

  1. The Zone Copier would definitely be very useful for our partners who have to replicate the configuration of one zone to another regularly, and it’s definitely going to help make sure there are less human errors in the process of configuring the setups.
  2. Besides duplicating configurations from zone-to-zone, could we use this to replicate the configurations from a best-in-class setup for different use cases and allow partners to deploy this with a few clicks?
  3. Can we use this tool to generate quarterly reports?
  4. The Zone Viewer would be very helpful for us when we produce documentation on a particular zone’s configuration as part of a POC report.
  5. The Zone Viewer will also give us much deeper insight to better understand the current zone configurations and provide recommendations to improve it.

It was also a very cool experience speaking to the broad Solutions Engineering team as I found that many were very technically inclined and had many valid suggestions for improving the architecture and development of the applications. A special thanks to Edwin Wong for setting up the sharing session with the internal team, and many thanks to Xin Meng, AQ Jiao, Yonggil Choi, Steve Molloy, Kyouhei Hayama, Claire Lim and Jamal Boutkabout for their great insight and suggestions!

Impact of Cloudflare outside of work

While Cloudflare is known for its impeccable transparency throughout the company, and the stellar products it provides in helping make the Internet better, I wanted to take this opportunity to talk about the other endeavors that the company has too.

Cloudflare is part of the Pledge 1%, where the company dedicates 1% of products and 1% of our time to give back to the local communities as well as all the communities we support online around the world.

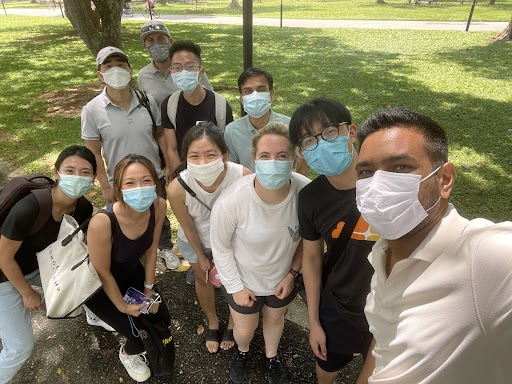
I took part in one of these activities, where we spent a morning cleaning up parts of the East Coast Park beach, by picking up trash and litter that had been left behind by other park users. Here’s a picture of us from that morning:

Internship Experience: Software Development Intern

From day one, I have been thoroughly impressed by Cloudflare’s commitment to its culture and the effort everyone at Cloudflare puts in to make the company a great place to work and have a positive impact on the surrounding community.

In addition to giving back to the community, other aspects of company culture include having a good team spirit and safe working environment where you feel appreciated and taken care of. At Cloudflare, I have found that everyone is very understanding of work commitments. I faced a few challenges during the internship where I had to spend additional time on university related projects and work, and my manager has always been very supportive and understanding if I required additional time to complete parts of the internship project.

Concluding takeaways

My experience interning at Cloudflare has been extremely positive, and I have seen first hand how transparent the company is with not only its employees but also its customers, and it truly is a great place to work. Cloudflare’s collaborative culture allowed me to access members from different teams, to obtain their thoughts and assistance with certain issues that I faced from time to time. I would not have been able to produce an impactful project without the help of the different brilliant, and motivated, people I worked with across the span of the internship, and I am truly grateful for such a rewarding experience.

We are getting ready to open intern roles for this coming Fall, so we encourage you to visit our careers page frequently, to be up-to-date on all the opportunities we have within our teams.

iPhone Malware that Operates Even When the Phone Is Turned Off

Post Syndicated from Bruce Schneier original https://www.schneier.com/blog/archives/2022/05/iphone-malware-that-operates-even-when-the-phone-is-turned-off.html

Researchers have demonstrated iPhone malware that works even when the phone is fully shut down.

t turns out that the iPhone’s Bluetooth chip­ — which is key to making features like Find My work­ — has no mechanism for digitally signing or even encrypting the firmware it runs. Academics at Germany’s Technical University of Darmstadt figured out how to exploit this lack of hardening to run malicious firmware that allows the attacker to track the phone’s location or run new features when the device is turned off.

[…]

The research is the first — or at least among the first — to study the risk posed by chips running in low-power mode. Not to be confused with iOS’s low-power mode for conserving battery life, the low-power mode (LPM) in this research allows chips responsible for near-field communication, ultra wideband, and Bluetooth to run in a special mode that can remain on for 24 hours after a device is turned off.

The research is fascinating, but the attack isn’t really feasible. It requires a jailbroken phone, which is hard to pull off in an adversarial setting.

Slashdot thread.

[$] Bringing bcachefs to the mainline

Post Syndicated from original https://lwn.net/Articles/895266/

Bcachefs is a longstanding out-of-tree
filesystem that grew out of the bcache caching
layer
that has been in the kernel for nearly ten years. Based on a
session led by Kent Overstreet at the
2022 Linux Storage,
Filesystem, Memory-management and BPF Summit
(LSFMM), though, it would
seem that bcachefs is likely to be heading upstream soon. He intends to
start the process toward mainline inclusion over the next six months or so.

“We Were Stoked”: Santa Cruz Skateboards on Cloud Storage That Just Works

Post Syndicated from Molly Clancy original https://www.backblaze.com/blog/we-were-stoked-santa-cruz-skateboards-on-cloud-storage-that-just-works/

For a lot of us here at Backblaze, skateboarding culture permeated our most formative years. That’s why we were excited to hear from the folks at Santa Cruz Skateboards about how they use Backblaze B2 Cloud Storage to protect decades of skateboarding history. The company is the pinnacle of cool for millennials of a certain age, and, let’s face it, anyone not living under a rock since the mid-70s.

We got the chance to talk shop with Randall Vevea, Information Technology Specialist for Santa Cruz Skateboards, and he shared how they:

  • Implemented a cloud disaster recovery strategy to protect decades of data in a tsunami risk zone.
  • Created an automated production and VM backup solution using rclone.
  • Backed up more data affordably and efficiently in truly accessible storage.

Read on to learn how they did it.

Professional skater Fabiana Delfino.

Santa Cruz Skateboards: The Origin Story

It’s 1973 in sunny Santa Cruz, California. Three local guys—Richard Novak, Doug Haut, and Jay Shuirman—are selling raw fiberglass to the folks that make surfboards, boats, and race car parts. On a surf trip in Hawaii, the trio gets a request to throw together some skateboards. They make 500 and sell out immediately. Twice. Just like that, Santa Cruz Skateboards is born.
 
Fast forward to today, and Santa Cruz Skateboards is considered the backbone of skateboarding. For over five decades, the company has been putting out a steady stream of skateboards, apparel, accessories, and so much more, all emblazoned with the kinds of memorable art that have shaped skate culture.
 
Their video archives trace the evolution of skateboarding, following big name players, introducing rising stars, and documenting the events and competitions that connect the skate community all over the world, and it all needs to be protected, accessible, and organized.

A Little Storm Surge Can’t Stop Santa Cruz Skateboards

Randall estimates that the company stores about 40 terabytes of data just in art and media assets alone. Those files form an important historical archive, but the creative team is also constantly referencing and updating existing art—losing it isn’t an option. But potential data loss situations abound, particularly in the weather-prone area of Santa Cruz Harbor.

In January 2022, an underwater volcanic eruption off the coast of Tonga caused a tsunami that flooded Santa Cruz to the tune of $6 million in damage to the harbor. Businesses in the area are used to living with tsunami advisories (there was another scare just two years ago), but that doesn’t make dealing with the damage any easier. “The tsunami lit a fire under us to make sure that in the event that something were to go wrong here, we had our data somewhere else,” Randall said.

On top of weather threats, the pandemic forced Santa Cruz Skateboards to transition from a physical, on-premises setup to a more virtualized infrastructure that could support remote work. That transition was one of the main reasons Santa Cruz Skateboards started looking for a cloud data storage solution; it’s not just easier to back up that virtual machine data, but also to spin up those machines on a hypervisor in the event that something does go wrong.

Professional skater Justin Sommer.

Dropping in on a Major Bummer Called AWS Glacier

Before Randall joined Santa Cruz Skateboards, the company had been using AWS Glacier, a cold storage solution. “When I came on, Glacier was not in a working state,” Randall recalled. Data had been uploaded, but wasn’t syncing. “I’m not an AWS expert—I feel like you could go to school for four years and never learn all the inner workings of AWS. We needed a solution that we could implement quickly and without the hassle,” he said.

Glacier posed the problems above and beyond that heavy lift, including:

  • Changes to the AWS architecture made Santa Cruz Skateboards’ data inaccessible.
  • Requests to download data timed out due to cold storage delays.
  • Endless support emails failed to answer questions or give Randall access to the data trapped in AWS’ black box.

“We were in a situation where we were paying AWS for nothing, basically,” Randall remembered. “I started looking around for different solutions and everywhere I turned, Backblaze was the answer.” Assuming it would take a long time, Randall started small with an FTP server and a local file server. Within two days, all that data was fully backed up. Impressed with those results, he contacted Backblaze for a more thorough introduction. “We were super stoked on something that just worked. I was able to deliver that to our executives and say look, our data is in Backblaze now. We don’t have to worry about this anymore,” Randall said.

“I feel like you could go to school for four years and never learn all the inner workings of AWS. We were in a situation where we were paying AWS for nothing, basically.”
—Randall Vevea, Information Technology Specialist, Santa Cruz Skateboards

Backups Are Like Helmets—They Let You Do the Big Things Better

When a project that Randall had expected to take three or four months was completed in one, Randall started to ask, “What else can we put in Backblaze?” They ended up expanding their scope considerably, including:

  • Decades of art, image, and video files.
  • Mission critical business files.
  • Virtual machine backups.
  • OneDrive backups.

All told, that amounted to about 60TB of data all managed by a small IT team supporting about 150 employees company-wide. In order to return his valuable time and attention to critical everyday IT tasks—everything from fixing printers to preventing ransomware attacks—Randall needed to find a backup solution that could run reliably in the background without much manual input or upkeep, and Backblaze delivered.

Today, Santa Cruz Skateboards uses two network attached storage devices that clone each other and both back up to the cloud using rclone, an open-source command line program that people use to manage or migrate content. Rclone is also able to handle the company’s complex file names with characters in foreign scripts, like files with names written in Chinese, for example, which solved Randall’s worry about mismatched data as the creative team pulls down files to work with art and other visual assets. He set up a Linux box as a backup manager, which he uses to run rclone cronjobs weekly. By the time Randall shows up to work on Monday mornings, the sync is complete.

With Backups Out of the Way, Santa Cruz Lives to Shred Another Day

“I like the fact that I don’t have to think about backups on a day-to-day basis.”
—Randall Vevea, Information Technology Specialist, Santa Cruz Skateboards

Now, all Randall has to do is check the logs to make sure everything is working as it should. With the backup process automated, there’s a long list of projects that the IT team can devote their time to.

Since making the move to Backblaze B2, Santa Cruz Skateboards is spending less to back up more data. “We have a lot more data in Backblaze than we ever thought we would have in AWS,” Randall said. “As far as cost savings, I think we’re spending about the same amount to store more data that we can actually access.”

The company’s creative team relies on the art and media assets that are now stored and always available in Backblaze B2. Now it’s easy to find and download the specific files should they need to restore them. Meanwhile, the IT team is relieved not to have to navigate AWS’ giant dashboards and complex issues of hot and cold storage with the Glacier service.

Santa Cruz Skateboards had been feeling like a small fish in the huge AWS pond, using a product that amounted to a single cog in a complex machine. Instead of having to divert his attention to research every time questions arise, Randall feels confident that he can rely on Backblaze to get his questions answered right away. “Personally, it’s a big lift off my shoulders,” he said. “Our data’s safe and sound and is getting backed up regularly, and I’m happy with that. I think everybody else is pretty happy with that, too.”

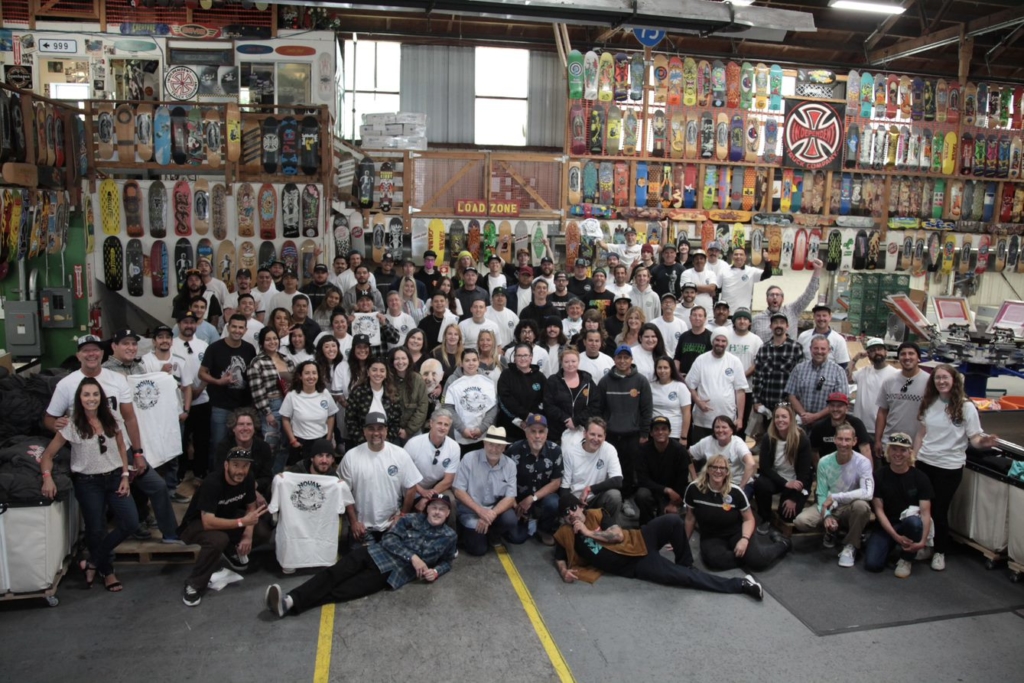
The Santa Cruz Skateboards team.

Is disaster recovery on your to-do list? Learn about our backup and archive solutions to safeguard your data against threats like natural disasters and ransomware.

The post “We Were Stoked”: Santa Cruz Skateboards on Cloud Storage That Just Works appeared first on Backblaze Blog | Cloud Storage & Cloud Backup.

Integrating Network Analytics Logs with your SIEM dashboard

Post Syndicated from Omer Yoachimik original https://blog.cloudflare.com/network-analytics-logs/

Integrating Network Analytics Logs with your SIEM dashboard

Integrating Network Analytics Logs with your SIEM dashboard

We’re excited to announce the availability of Network Analytics Logs. Magic Transit, Magic Firewall, Magic WAN, and Spectrum customers on the Enterprise plan can feed packet samples directly into storage services, network monitoring tools such as Kentik, or their Security Information Event Management (SIEM) systems such as Splunk to gain near real-time visibility into network traffic and DDoS attacks.

What’s included in the logs

By creating a Network Analytics Logs job, Cloudflare will continuously push logs of packet samples directly to the HTTP endpoint of your choice, including Websockets. The logs arrive in JSON format which makes them easy to parse, transform, and aggregate. The logs include packet samples of traffic dropped and passed by the following systems:

  1. Network-layer DDoS Protection Ruleset
  2. Advanced TCP Protection
  3. Magic Firewall

Note that not all mitigation systems are applicable to all Cloudflare services. Below is a table describing which mitigation service is applicable to which Cloudflare service:

Mitigation System Cloudflare Service
Magic Transit Magic WAN Spectrum
Network-layer DDoS Protection Ruleset ✅ ❌ ✅
Advanced TCP Protection ✅ ❌ ❌
Magic Firewall ✅ ✅ ❌

Packets are processed by the mitigation systems in the order outlined above. Therefore, a packet that passed all three systems may produce three packet samples, one from each system. This can be very insightful when troubleshooting and wanting to understand where in the stack a packet was dropped. To avoid overcounting the total passed traffic, Magic Transit users should only take into consideration the passed packets from the last mitigation system, Magic Firewall.

An example of a packet sample log:

{"AttackCampaignID":"","AttackID":"","ColoName":"bkk06","Datetime":1652295571783000000,"DestinationASN":13335,"Direction":"ingress","IPDestinationAddress":"(redacted)","IPDestinationSubnet":"/24","IPProtocol":17,"IPSourceAddress":"(redacted)","IPSourceSubnet":"/24","MitigationReason":"","MitigationScope":"","MitigationSystem":"magic-firewall","Outcome":"pass","ProtocolState":"","RuleID":"(redacted)","RulesetID":"(redacted)","RulesetOverrideID":"","SampleInterval":100,"SourceASN":38794,"Verdict":"drop"}

All the available log fields are documented here: https://developers.cloudflare.com/logs/reference/log-fields/account/network_analytics_logs/

Setting up the logs

In this walkthrough, we will demonstrate how to feed the Network Analytics Logs into Splunk via Postman. At this time, it is only possible to set up Network Analytics Logs via API. Setting up the logs requires three main steps:

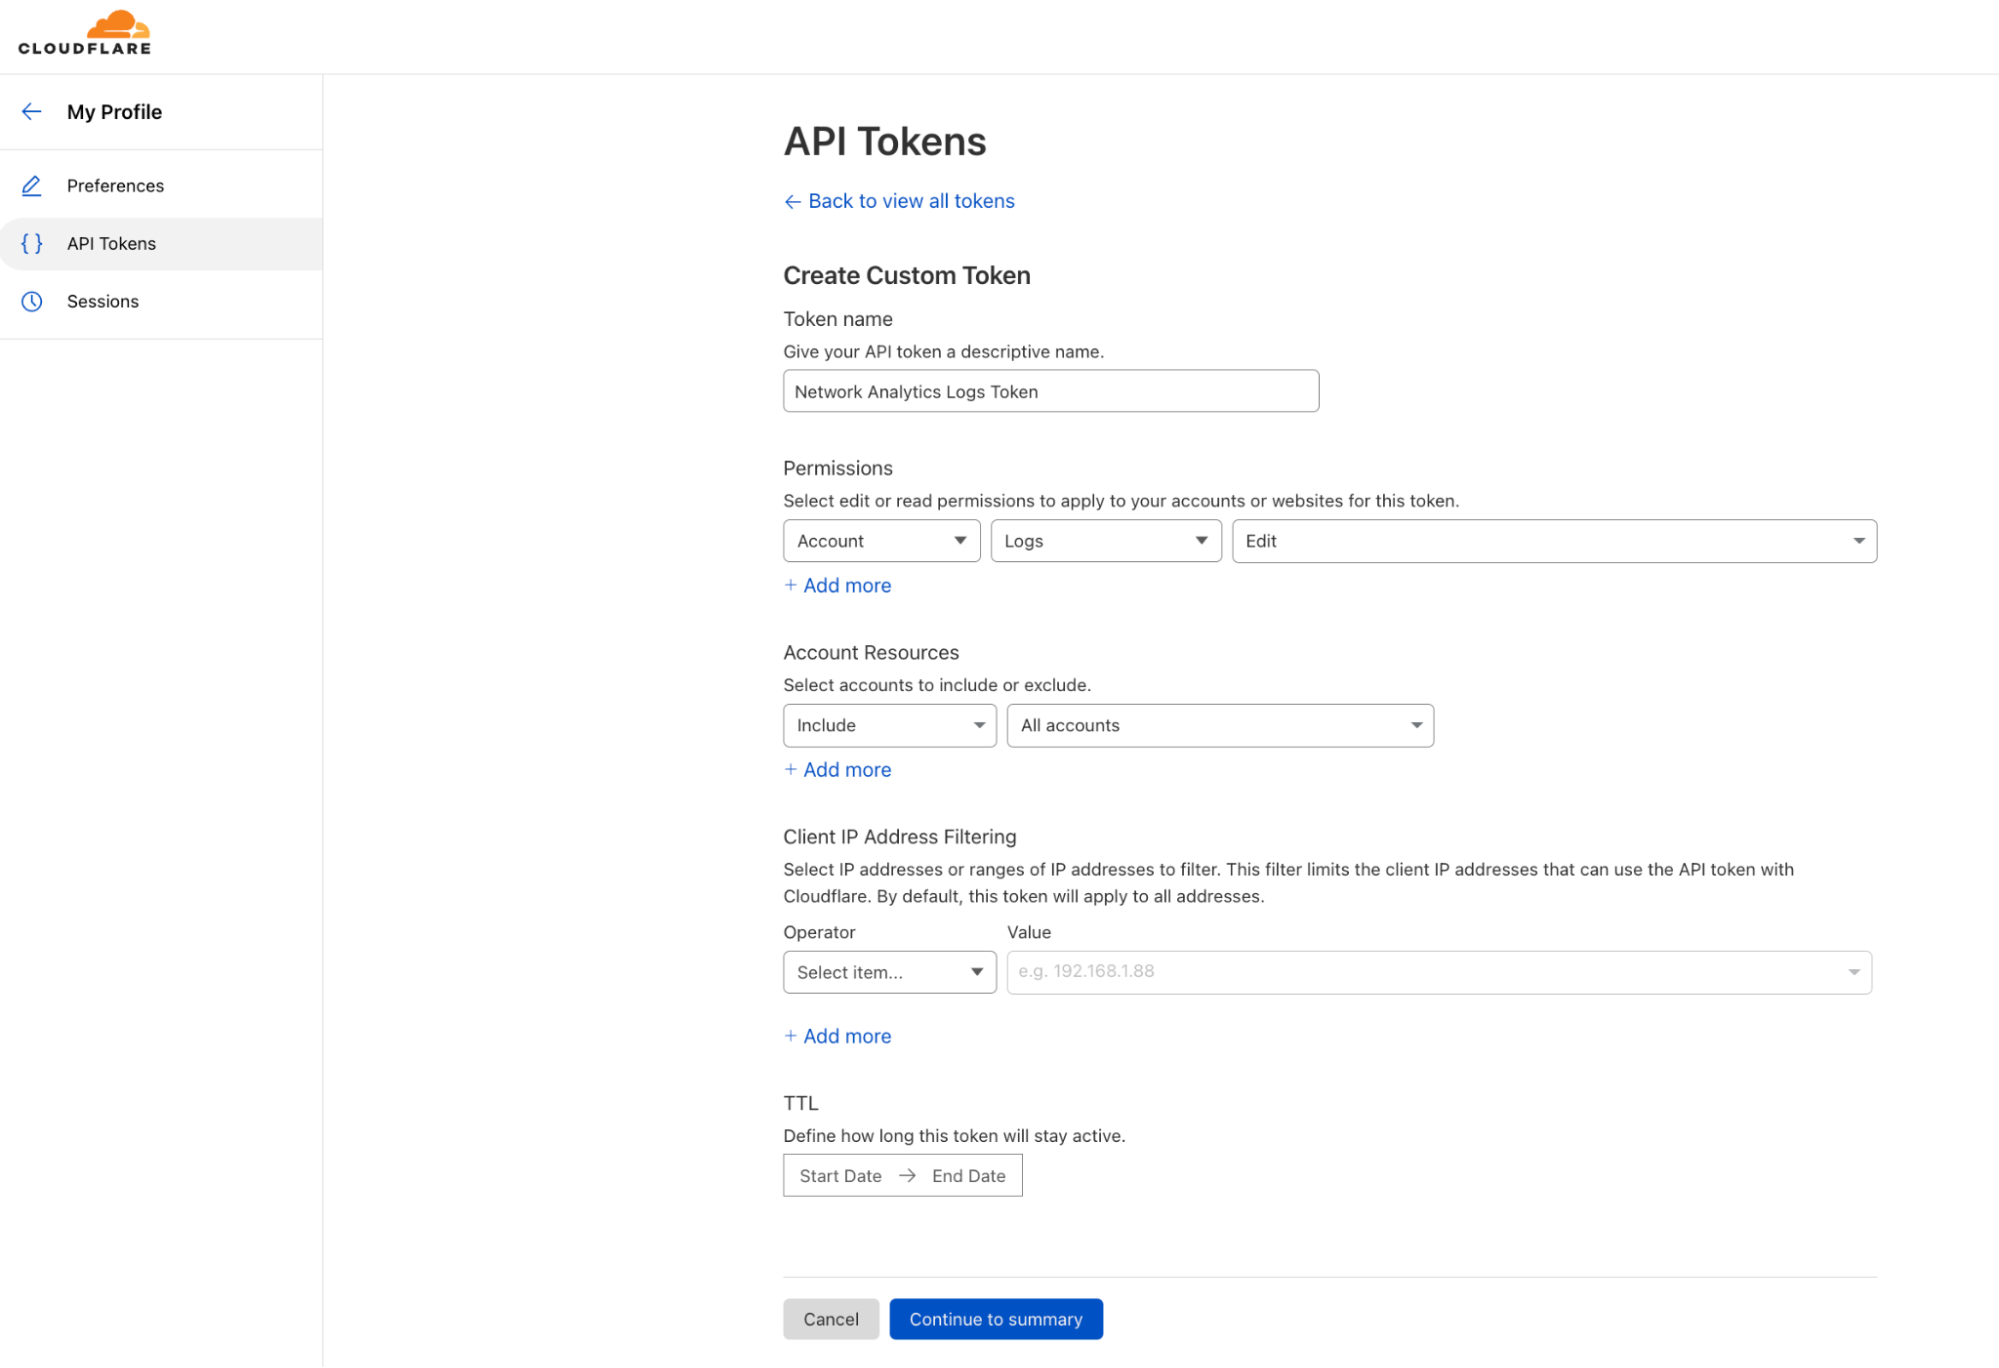
  1. Create a Cloudflare API token.
  2. Create a Splunk Cloud HTTP Event Collector (HEC) token.
  3. Create and enable a Cloudflare Logpush job.

Let’s get started!

1) Create a Cloudflare API token

  1. Log in to your Cloudflare account and navigate to My Profile.
  2. On the left-hand side, in the collapsing navigation menu, click API Tokens.
  3. Click Create Token and then, under Custom token, click Get started.
  4. Give your custom token a name, and select an Account scoped permission to edit Logs. You can also scope it to a specific/subset/all of your accounts.
  5. At the bottom, click Continue to summary, and then Create Token.
  6. Copy and save your token. You can also test your token with the provided snippet in Terminal.

When you’re using an API token, you don’t need to provide your email address as part of the API credentials.

Integrating Network Analytics Logs with your SIEM dashboard

Read more about creating an API token on the Cloudflare Developers website: https://developers.cloudflare.com/api/tokens/create/

2) Create a Splunk token for an HTTP Event Collector

In this walkthrough, we’re using a Splunk Cloud free trial, but you can use almost any service that can accept logs over HTTPS. In some cases, if you’re using an on-premise SIEM solution, you may need to allowlist Cloudflare IP address in your firewall to be able to receive the logs.

  1. Create a Splunk Cloud account. I created a trial account for the purpose of this blog.
  2. In the Splunk Cloud dashboard, go to Settings > Data Input.
  3. Next to HTTP Event Collector, click Add new.
  4. Follow the steps to create a token.
  5. Copy your token and your allocated Splunk hostname and save both for later.
Integrating Network Analytics Logs with your SIEM dashboard

Read more about using Splunk with Cloudflare Logpush on the Cloudflare Developers website: https://developers.cloudflare.com/logs/get-started/enable-destinations/splunk/

Read more about creating an HTTP Event Collector token on Splunk’s website: https://docs.splunk.com/Documentation/Splunk/8.2.6/Data/UsetheHTTPEventCollector

3) Create a Cloudflare Logpush job

Creating and enabling a job is very straightforward. It requires only one API call to Cloudflare to create and enable a job.

To send the API calls I used Postman, which is a user-friendly API client that was recommended to me by a colleague. It allows you to save and customize API calls. You can also use Terminal/CMD or any other API client/script of your choice.

One thing to notice is Network Analytics Logs are account-scoped. The API endpoint is therefore a tad different from what you would normally use for zone-scoped datasets such as HTTP request logs and DNS logs.

This is the endpoint for creating an account-scoped Logpush job:

https://api.cloudflare.com/client/v4/accounts/{account-id}/logpush/jobs

Your account identifier number is a unique identifier of your account. It is a string of 32 numbers and characters. If you’re not sure what your account identifier is, log in to Cloudflare, select the appropriate account, and copy the string at the end of the URL.

https://dash.cloudflare.com/{account-id}

Then, set up a new request in Postman (or any other API client/CLI tool).

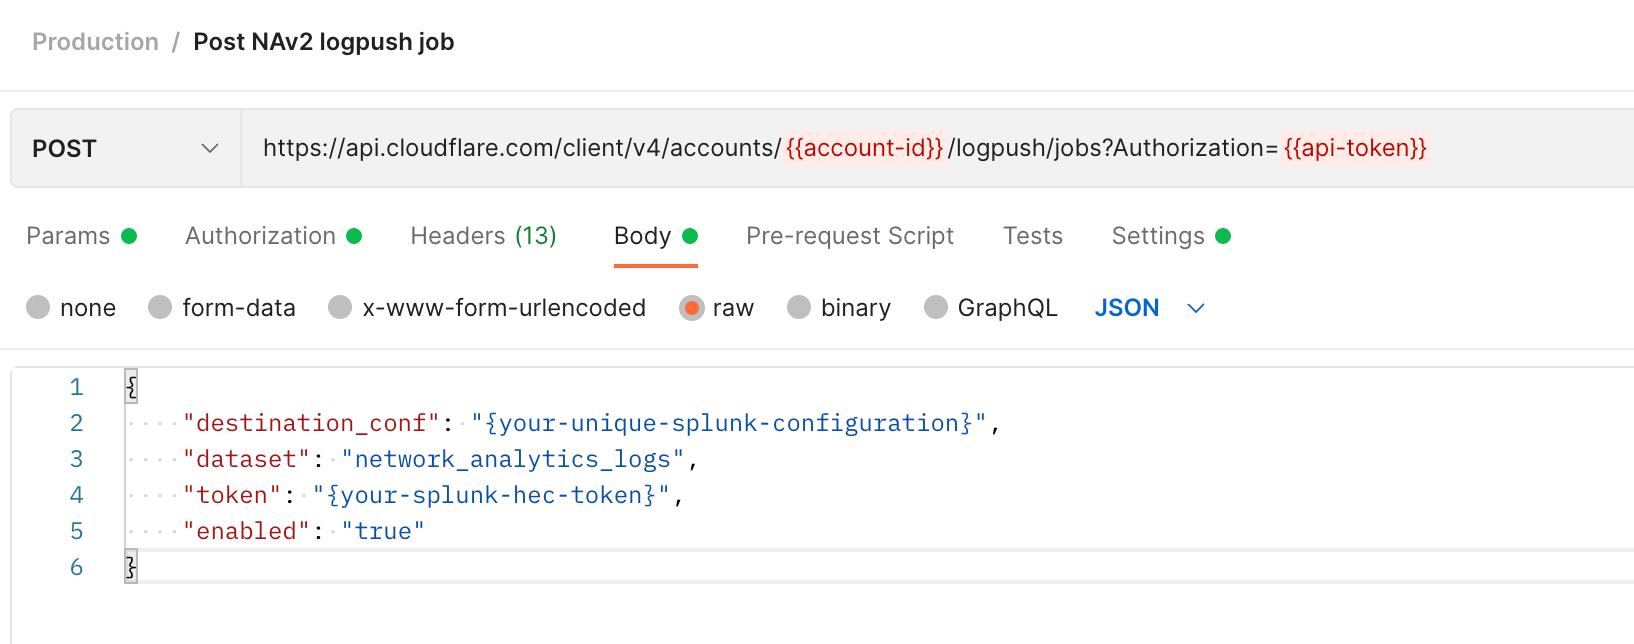
To successfully create a Logpush job, you’ll need the HTTP method, URL, Authorization token, and request body (data). The request body must include a destination configuration (destination_conf), the specified dataset (network_analytics_logs, in our case), and the token (your Splunk token).

Integrating Network Analytics Logs with your SIEM dashboard

Method:

POST

URL:

https://api.cloudflare.com/client/v4/accounts/{account-id}/logpush/jobs

Authorization: Define a Bearer authorization in the Authorization tab, or add it to the header, and add your Cloudflare API token.

Body: Select a Raw > JSON

{
"destination_conf": "{your-unique-splunk-configuration}",
"dataset": "network_analytics_logs",
"token": "{your-splunk-hec-tag}",
"enabled": "true"
}

If you’re using Splunk Cloud, then your unique configuration has the following format:

{your-unique-splunk-configuration}=splunk://{your-splunk-hostname}.splunkcloud.com:8088/services/collector/raw?channel={channel-id}&header_Authorization=Splunk%20{your-splunk–hec-token}&insecure-skip-verify=false

Definition of the variables:

{your-splunk-hostname}= Your allocated Splunk Cloud hostname.

{channel-id} = A unique ID that you choose to assign for.`{your-splunk–hec-token}` = The token that you generated for your Splunk HEC.

An important note is that customers should have a valid SSL/TLS certificate on their Splunk instance to support an encrypted connection.

After you’ve done that, you can create a GET request to the same URL (no request body needed) to verify that the job was created and is enabled.

The response should be similar to the following:

{
    "errors": [],
    "messages": [],
    "result": {
        "id": {job-id},
        "dataset": "network_analytics_logs",
        "frequency": "high",
        "kind": "",
        "enabled": true,
        "name": null,
        "logpull_options": null,
        "destination_conf": "{your-unique-splunk-configuration}",
        "last_complete": null,
        "last_error": null,
        "error_message": null
    },
    "success": true
}

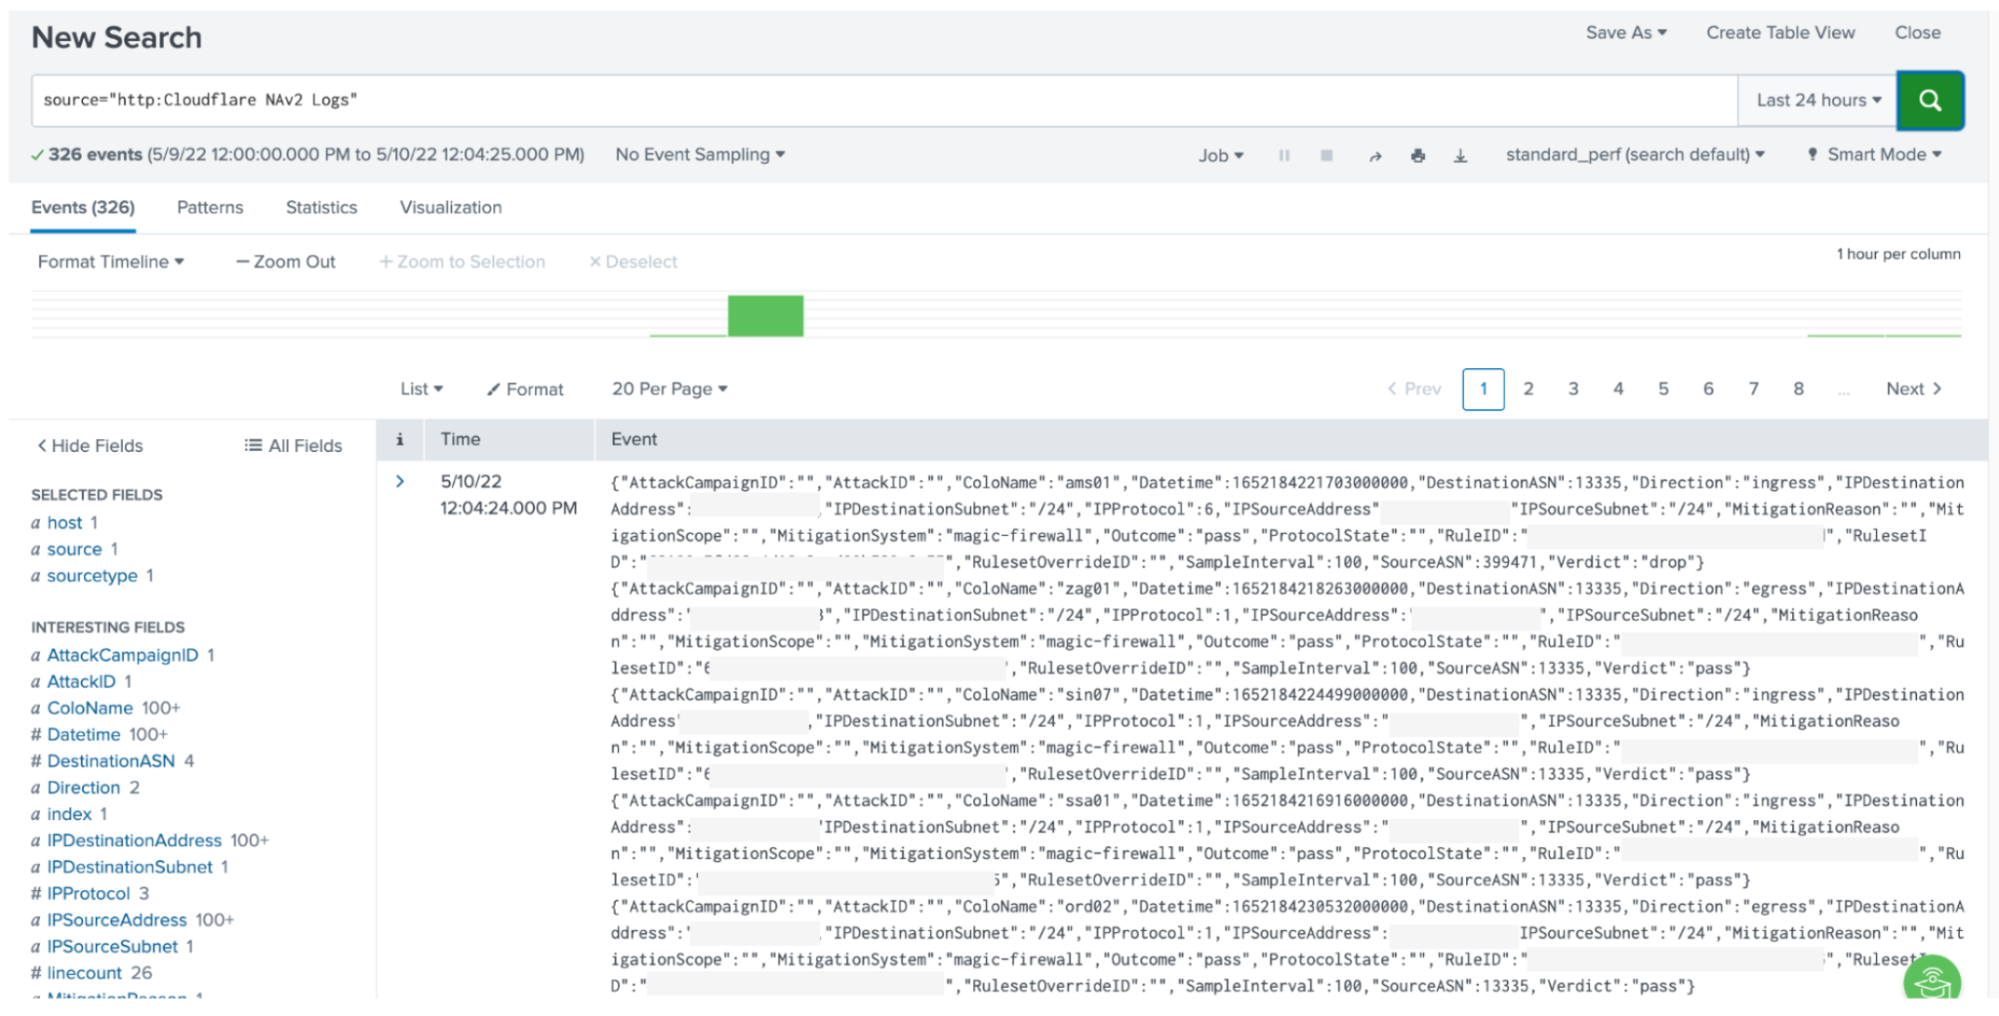
Shortly after, you should start receiving logs to your Splunk HEC.

Integrating Network Analytics Logs with your SIEM dashboard

Read more about enabling Logpush on the Cloudflare Developers website: https://developers.cloudflare.com/logs/reference/logpush-api-configuration/examples/example-logpush-curl/

Reduce costs with R2 storage

Depending on the amount of logs that you read and write, the cost of third party cloud storage can skyrocket — forcing you to decide between managing a tight budget and being able to properly investigate networking and security issues. However, we believe that you shouldn’t have to make those trade-offs. With R2’s low costs, we’re making this decision easier for our customers. Instead of feeding logs to a third party, you can reap the cost benefits of storing them in R2.

To learn more about the R2 features and pricing, check out the full blog post. To enable R2, contact your account team.

Cloudflare logs for maximum visibility

Cloudflare Enterprise customers have access to detailed logs of the metadata generated by our products. These logs are helpful for troubleshooting, identifying network and configuration adjustments, and generating reports, especially when combined with logs from other sources, such as your servers, firewalls, routers, and other appliances.

Network Analytics Logs joins Cloudflare’s family of products on Logpush: DNS logs, Firewall events, HTTP requests, NEL reports, Spectrum events, Audit logs, Gateway DNS, Gateway HTTP, and Gateway Network.

Not using Cloudflare yet? Start now with our Free and Pro plans to protect your websites against DDoS attacks, or contact us for comprehensive DDoS protection and firewall-as-a-service for your entire network.

Deep dive into Amazon EMR Kerberos authentication integrated with Microsoft Active Directory

Post Syndicated from Anandkumar Kaliaperumal original https://aws.amazon.com/blogs/big-data/deep-dive-into-amazon-emr-kerberos-authentication-integrated-with-microsoft-active-directory/

Many of our customers that use Amazon EMR as their big data platform need to integrate with their existing Microsoft Active Directory (AD) for user authentication. This integration requires the Kerberos daemon of Amazon EMR to establish a trusted connection with an AD domain, which involves a lot of moving pieces and can be difficult to get right.

This post describes what a one-way trust with Active Directory means, and how the commands work that are used in setting it up. We describe how DNS names, Kerberos realms, and AD domains are different, and the consequences of that for Amazon EMR security configuration and cluster one-way trust settings. We also discuss how you can’t use AWS Managed Microsoft AD for the Amazon EMR key distribution center (KDC) trust, and must either use an existing or new AD server.

AWS has already put out documentation and blog posts that cover some of this area, and this post is meant to complement them rather than replace them. As such, we recommend reading the following before continuing:

Is this the right architecture for you?

There are several options for authenticating Amazon EMR with Kerberos, and choosing the right approach will depend on your use case. For more information, refer to Kerberos architecture options. In this post, we cover the case where your users are already in your AD domain, and you want to use those identities to authorize actions in Amazon EMR. If you don’t already have an AD, or you want to extend an existing non-AD Kerberos realm, then one of the other options will be better suited. Don’t make more work for yourself than you have to!

Connecting to Active Directory

There are two goals when connecting Amazon EMR to AD:

  • Establish a one-way trust with from Kerberos to AD so that users working in Amazon EMR can use their AD credentials to access services. This requires ports 88, 464 (for Kerberos), and 139 (for LDAP) to be accessible from the EMR cluster.
  • Connect the EMR cluster with AD so that the servers making up the EMR cluster can be registered in the AD domain. This requires a user configured in the AD domain with sufficient privileges to make those registrations—typically called a bind user.

Types of Active Directory

The combination of the preceding requirements means that only an AD server can meet the goals. You can’t use AWS Managed Microsoft AD, nor Microsoft Azure AD. This leaves two options as the best practice.

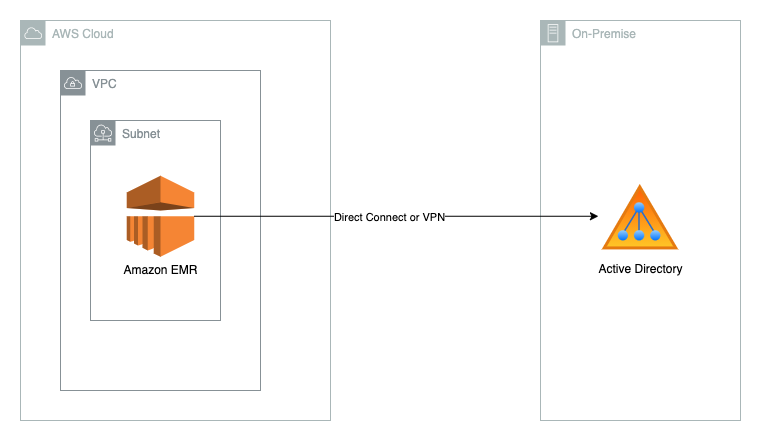
Firstly, you can connect Amazon EMR directly to an existing AD server (whether on premises or in the cloud), as shown in the following diagram.

Alternatively, you can build a new AD server on Amazon Elastic Compute Cloud (Amazon EC2), add it to the existing corporate AD forest, and have Amazon EMR connect to this new cloud-based AD server (as shown in the following diagram).

Domains vs. realms

It is critical to understand which terms apply to which technology to avoid confusion.

Active Directory manages domains, which contain many registered entities like users and computers. They’re typically written in lowercase (for example, corp.mycompany.com) and look very similar to internet domains. They don’t necessarily have to resolve to an IP address, but they typically do.

Kerberos uses realms for a similar concept, and its registered entities are referred to as principals. Realms are typically written in uppercase, and often use a naming style that looks like an internet domain except for the case (for example, EMR.MYCOMPANY.COM). They don’t need to resolve to an IP address and typically do not.

When configuring the realm for an EMR cluster’s Kerberos daemon, the name is completely arbitrary. It serves as a namespace for the principals defined within it, but it doesn’t have to match the domain names of the instances in your EMR cluster. For example, if the private DNS names of your EC2 machines use the default ec2.internal domain, your EMR realm name doesn’t have to be ec2.internal; it could be mykerberosrealm or anything you like.

Bind user

A bind user has to be created in Active Directory with the permission to register (“bind”) EMR computers into the AD domain. Amazon EMR registers these computers under CN=Computers.

The Kerberos principals that Amazon EMR creates for use with the components of Hadoop are strictly local to the Amazon EMR Kerberos installation—they’re not registered in the AD domain.

DNS

The EMR Kerberos daemon has to be able to resolve the DNS name of your AD server in order to establish the trust between them. If those DNS domains are managed in your corporate DNS servers, you need Amazon Route 53 forwarders to your corporate DNS servers for Amazon EMR to resolve them. Because the trust is only one-way, the AD server doesn’t need to be able to resolve the internal DNS names of the EMR cluster nodes.

Establish trust

The trust that you need to establish from Amazon EMR to AD only needs to be one-way (Amazon EMR trusts AD), not two-way (they trust each other). To establish the one-way trust, use the ksetup and netdom utilities on the command line of the AD machine. The recommended encryption type attribute (SetEncTypeAttr) for the domain is an AES-256 cipher. The following code uses the example of the EMR Kerberos realm EMR.MYCOMPANY.COM and the AD domain corp.mycompany.com:

C:\Users\Administrator> ksetup /addkdc EMR.MYCOMPANY.COM
C:\Users\Administrator> netdom trust EMR.MYCOMPANY.COM /Domain:corp.mycompany.com /add /realm /passwordt:MyVeryStrongPassword
C:\Users\Administrator> ksetup /SetEncTypeAttr EMR.MYCOMPANY.COM AES256-CTS-HMAC-SHA1-96

In the first ksetup command, you don’t need to provide the fully qualified domain name of the cluster KDC as a final argument. That is only needed for a two-way trust, and is optional in a one-way trust.

Amazon EMR security configuration

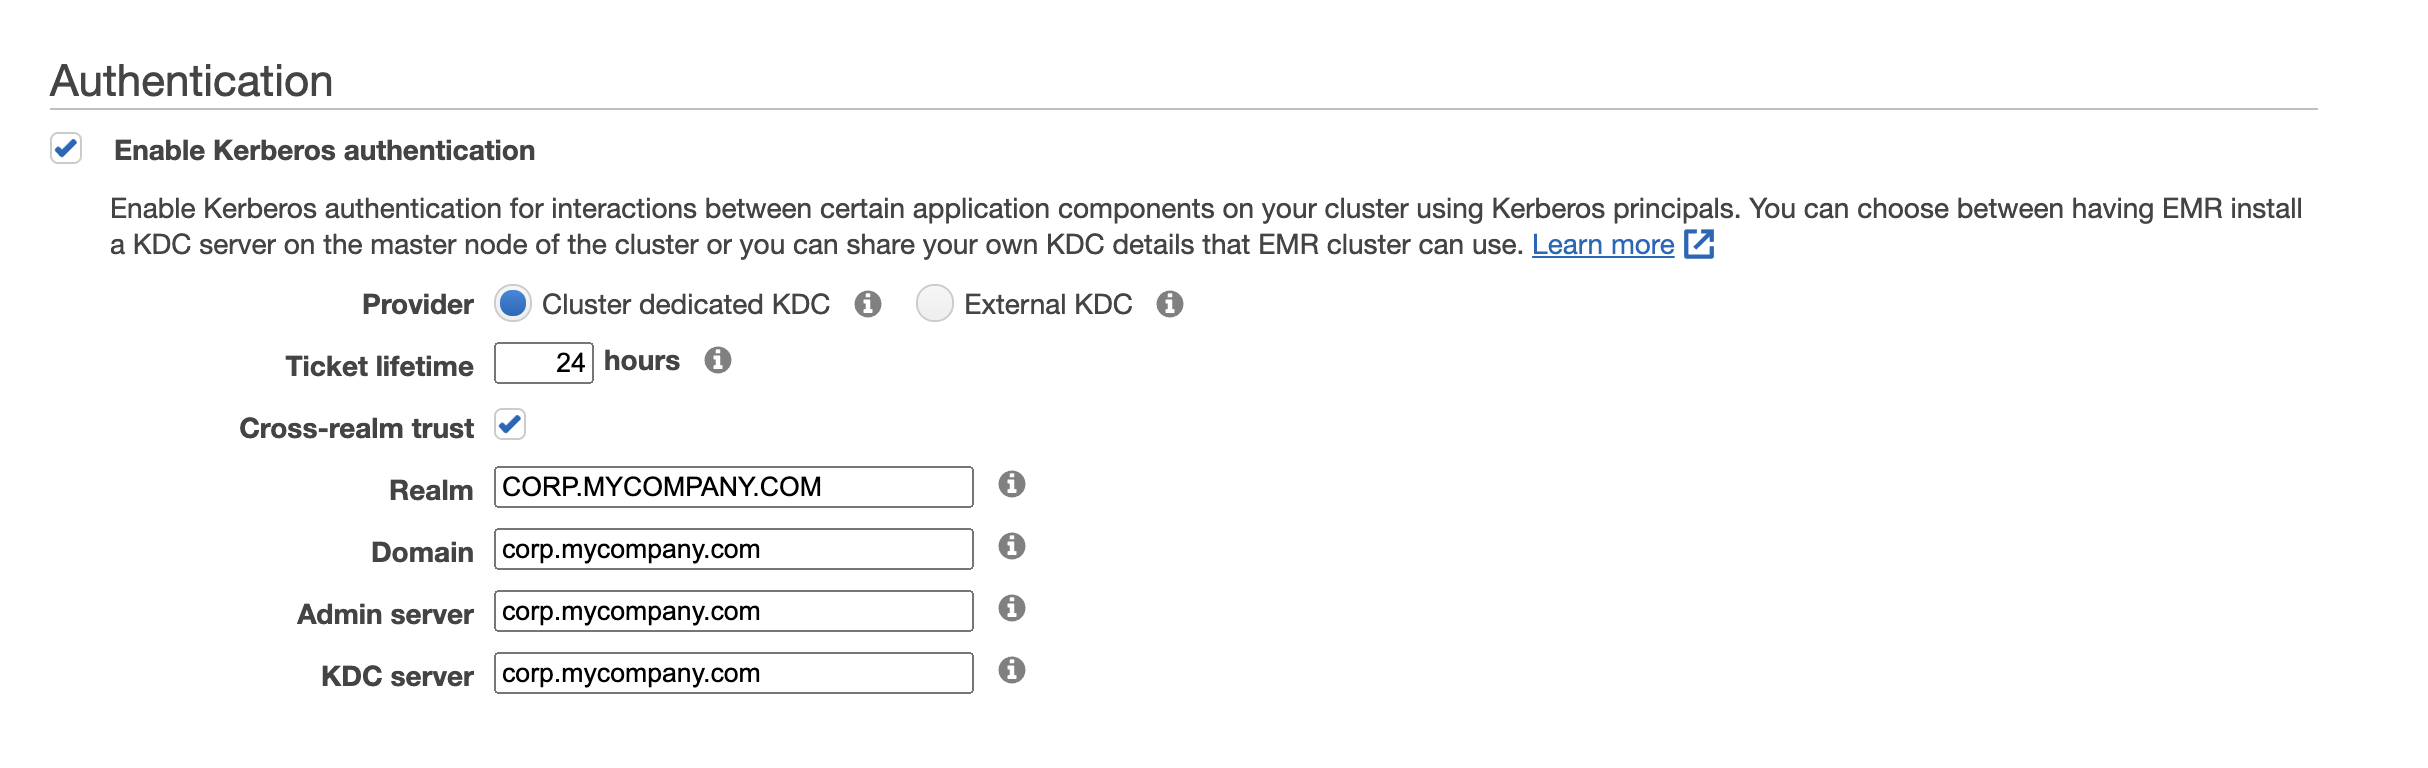
Before you start the EMR cluster, you must create a security configuration that contains the details of the AD server and domain to which you’re connecting. The following screenshot shows an example of that configuration.

These fields are case-sensitive, so make sure that you enter everything correctly. Note that the domain and realm in this configuration both refer to the AD server, and not to the EMR cluster! Because AD can act as a Kerberos daemon as well as Active Directory, both of those fields are configured here. In both cases, however, they refer to the AD server and not the EMR cluster’s Kerberos domain.

Amazon EMR security options when starting a cluster

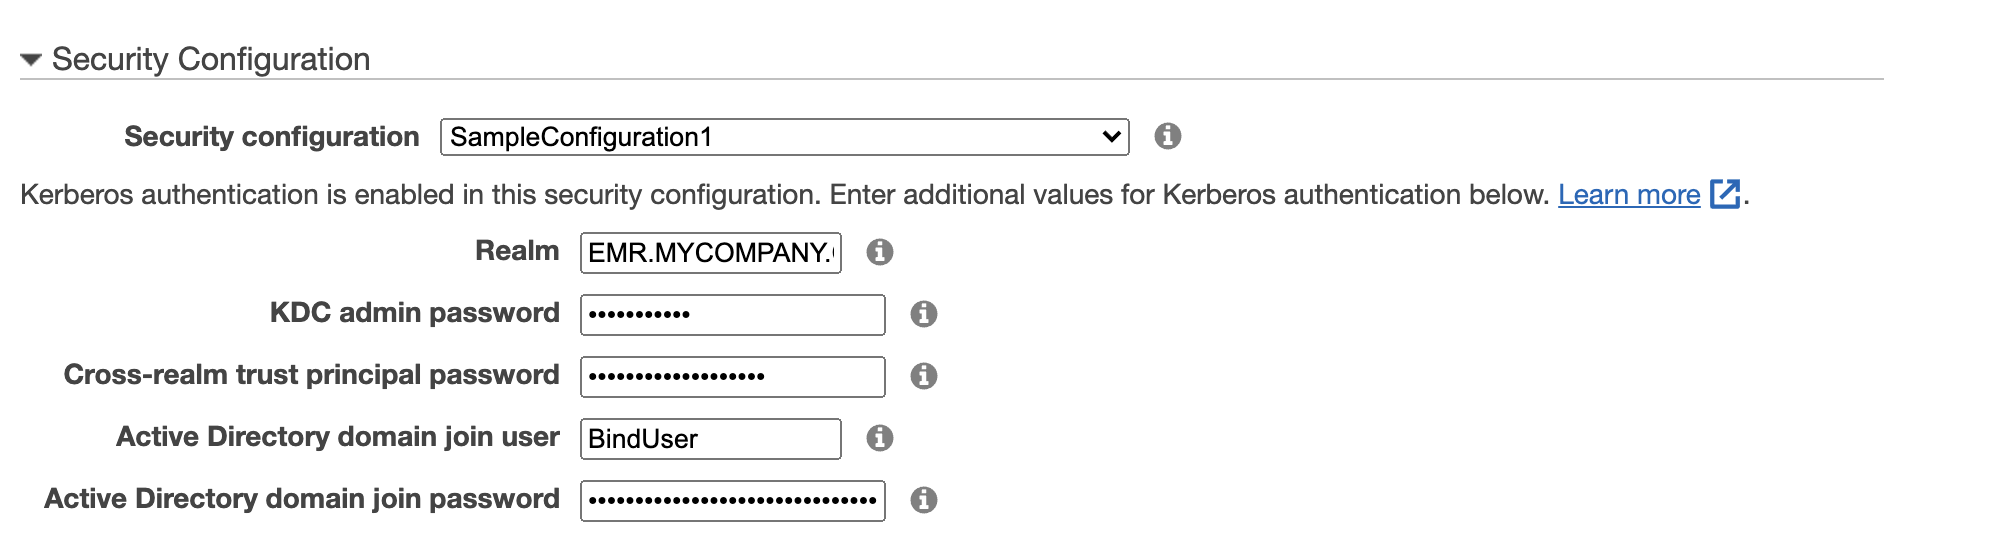
When you start an EMR cluster, you configure the security options as shown in the following screenshot.

Here you use the security configuration you just created, and specify the details of the EMR Kerberos realm as well as the parameters needed to establish the trust with the AD domain in the security configuration. You provide information for the following fields:

  • Realm – The Kerberos realm you specify is entirely up to you, but must be the same as the one you used when establishing the trust on the AD machine.
  • KDC admin password – This isn’t used anywhere else in the cluster configuration, so you can set it to something unique and secure specifically for this cluster. It’s only needed for any future management of the cluster-dedicated KDC.
  • Cross-realm trust principal password – This is the password you set with the netdom command.
  • Active Directory domain join user –This is the bind user your AD admin created.
  • Active Directory domain join password – This is the password for the bind user from AD.

Clean up

When you’re done testing this solution, remember to clean up the resources. If you used the CloudFormation templates to create the resources, then use the AWS CloudFormation console to delete the stack. Alternatively, you can use the AWS Command Line Interface (AWS CLI) or SDKs. For instructions, refer to Deleting a stack. Deleting a stack also deletes the resources created by that stack.

If one of your stacks doesn’t delete, make sure that there are no dependencies on the resources created by that stack. For example, if you deployed an Amazon VPC using AWS CloudFormation and then deployed a domain controller into that VPC using a different CloudFormation stack, you must first delete the domain controller stack before you can delete the VPC stack.

Conclusion

The steps in this post walked you through creating the trust between Amazon EMR’s Kerberos daemon and an Active Directory domain. We hope that this has demystified the process and makes it easy for you to create secure, AD-integrated EMR clusters in the future.


About the Authors

Anandkumar Kaliaperumal is a Senior Data Architect with the Professional Services SDT, where he focuses on helping customers with their Hadoop and data lake migrations. He lives with his growing family in Dallas.

Bharath Kumar Boggarapu is a Data Architect at AWS Professional Services with expertise in big data technologies. He is passionate about helping customers build performant and robust data-driven solutions and realize their data and analytics potential. His areas of interests are open-source frameworks, automation, and data architecting. In his free time, he loves to spend time with family, play tennis, and travel.

Oliver Meyn was a Senior Data Architect in the Canadian Professional Services Shared Delivery Team, where he helped customers with migrating their data and workflows to AWS. He lives in Toronto with his family and far too many bicycles.

Federate single sign-on access to Amazon Redshift query editor v2 with Okta

Post Syndicated from Sumeet Joshi original https://aws.amazon.com/blogs/big-data/federate-single-sign-on-access-to-amazon-redshift-query-editor-v2-with-okta/

Amazon Redshift query editor v2 is a web-based SQL client application that you can use to author and run queries on your Amazon Redshift data warehouse. You can visualize query results with charts and collaborate by sharing queries with members of your team. You can use query editor v2 to create databases, schemas, tables, and load data from Amazon Simple Storage Service (Amazon S3) using the COPY command or by using a wizard. You can browse multiple databases and run queries on your Amazon Redshift data warehouse or data lake, or run federated queries to operational databases such as Amazon Aurora. Because it’s a managed SQL editor in your browser and it’s integrated with your single sign-on (SSO) provider, Amazon Redshift query editor v2 reduces the number of steps to the first query so you gain insights faster.

Amazon Redshift query editor v2 integration with your identity provider (IdP) automatically redirects the user’s browser to the query editor v2 console instead of Amazon Redshift console. This enables your users to easily access Amazon Redshift clusters through query editor v2 using federated credentials without managing database users and passwords.

In this post, we focus on Okta as the IdP and illustrate how to set up your Okta application and AWS Identity and Access Management (IAM) permissions. We also demonstrate how you can limit the access for your users to use only query editor v2 without giving them access to perform any admin functions on the AWS Management Console.

Solution overview

The high-level steps in this post are as follows:

  1. Set up Okta, which contains your users organized into logical groups and AWS account federation application.
  2. Set up two IAM roles: one that establishes a trust relationship between your IdP and AWS, and a second role that Okta uses to access Amazon Redshift.
  3. Complete Okta advanced configuration:
    1. Finalize the Okta configuration by inputting the roles that you just created.
    2. Define a default relay state to direct users to Amazon Redshift query editor v2 after successful SAML authentication.
    3. Configure the SAML PrincipalTagAttribute. This element allows you to pass attributes as session tags in the SAML assertion. For more information about session tags, see Passing session tags in AWS STS.
  4. Set up Amazon Redshift database groups:
    1. Create groups within the Amazon Redshift database to match the Okta groups.
    2. Authorize these groups to access certain schemas and tables.
    3. Access Amazon Redshift query editor v2 using your enterprise credentials and query your Amazon Redshift database.
  5. Sign in to your Okta account and access the application assigned to you. The application directs you to Amazon Redshift query editor v2 using federated login.
  6. Access and query your Amazon Redshift database.

Prerequisites

This post assumes that you have the following prerequisites:

Set up Okta

First, we set up the Okta application and create users and groups. Complete the following steps:

  1. Log in to your Okta admin console using the URL https://<prefix>-admin.okta.com/admin/dashboard, where <prefix> is specific to your account and was created at account setup.
  2. On the admin console, choose Admin.
  3. Under Directory in the navigation pane, choose People.
  4. To add users, choose Add person.
    The following screenshot shows the users that we created.
  5. To add groups into Okta, choose Groups in the navigation pane, then choose Add group.
    The following screenshot shows two groups that we created. We added Jane to analyst_users and Mike to bi_users.
  6. Under Applications in the navigation pane, choose Applications and choose Browse App Catalog.
  7. Search for AWS Account Federation and choose Add.
  8. After you add the application, choose AWS Account Federation.
  9. Leave the values in General Settings at their default and choose Next.
  10. Under Sign-On Options, select SAML 2.0.
  11. Choose the Identity Provider metadata link to download the metadata file in .xml format.

Configure IAM roles

Next, you set up an IAM role that establishes a trust relationship between the IdP and AWS. You also create an IAM role that Okta uses to access Amazon Redshift query editor v2.

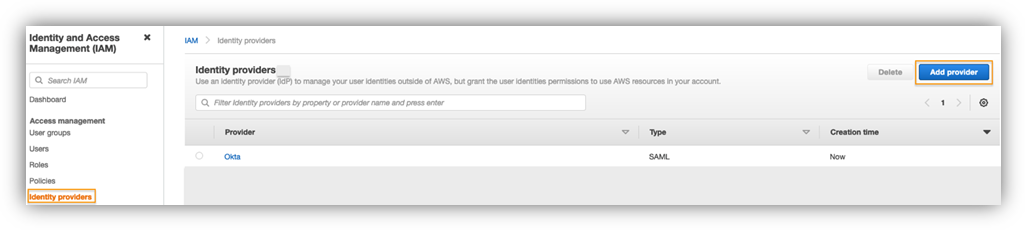
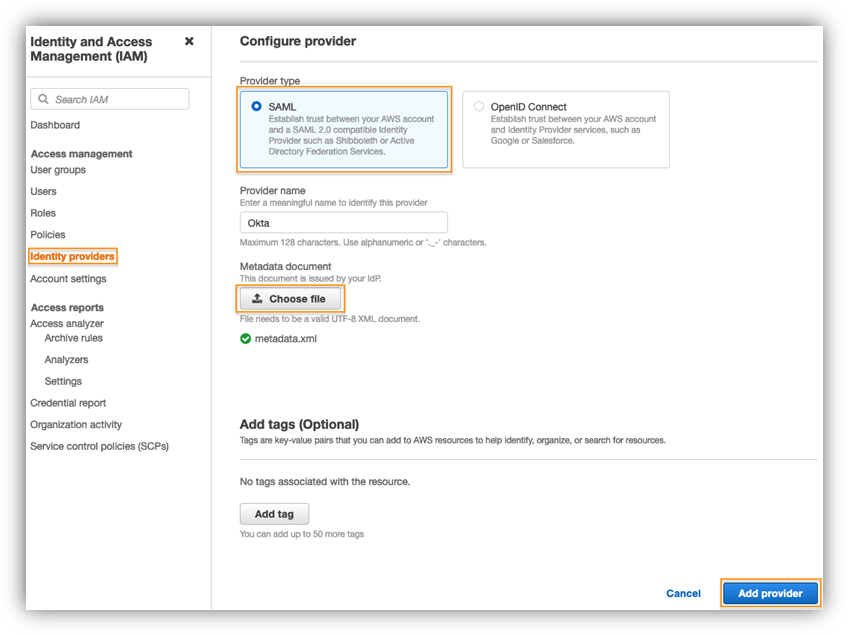
  1. On the IAM console, under Access management in the navigation pane, choose Identity providers.
  2. Choose Add provider.
  3. For Provider type¸ select SAML.
  4. For Provider name¸ enter a name.
  5. Choose Choose file and upload the metadata file you downloaded.
  6. Choose Add provider.

    Now you create the IAM SAML 2.0 federation role.
  7. On the IAM console, choose Roles in the navigation pane.
  8. Choose Create role.
  9. For Trusted entity type, select SAML 2.0 federation.
  10. For SAML 2.0-based provider, choose the IdP you created in the previous step.
  11. Select Allow programmatic and AWS Management Console access.
  12. Choose Next and then choose Create Policy.

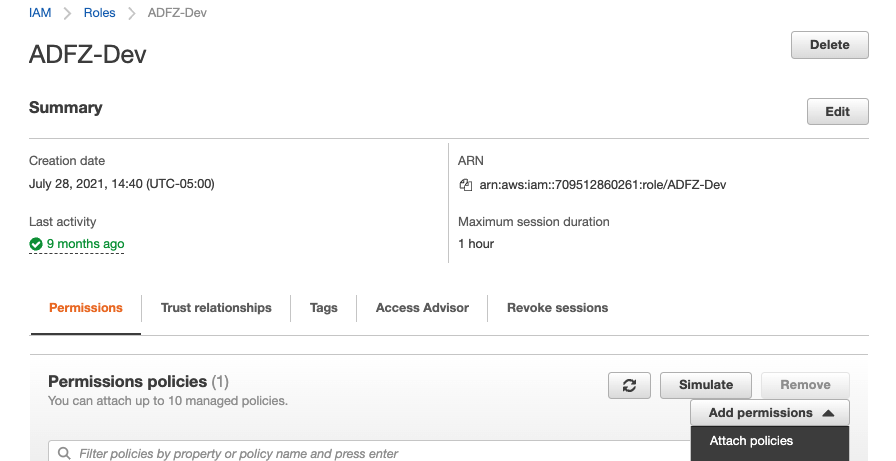
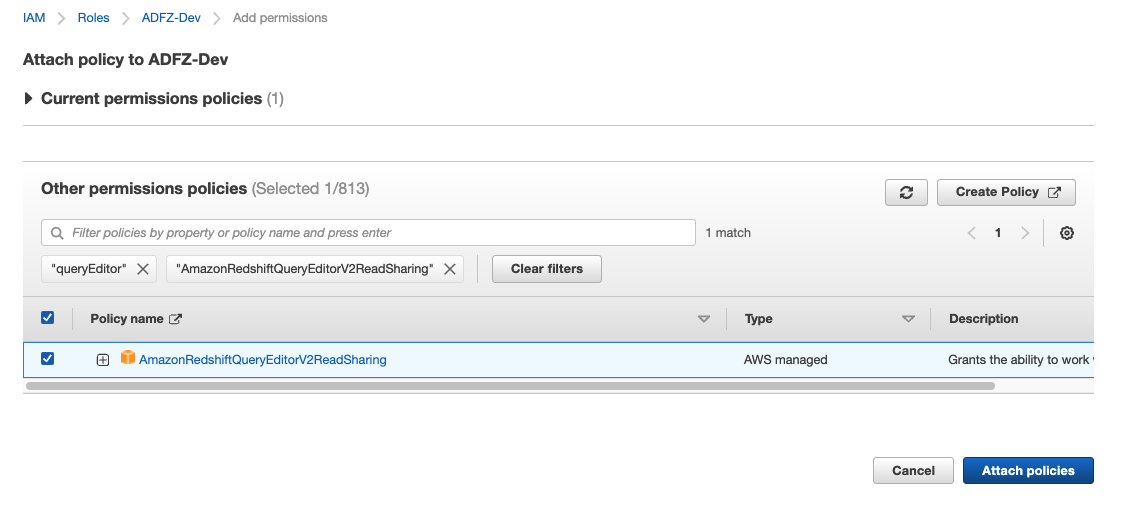
Amazon Redshift query editor v2 provides multiple managed policies to access the query editor. For a list of managed policies, refer to Configuring your AWS account. The managed policy enables you to limit the access for your users to use only query editor v2 without giving them access to perform any admin functions on the console. For this post, we use the AmazonRedshiftQueryEditorV2ReadSharing managed policy and create a custom policy.

In the following code, provide your Region, account, and cluster parameters to grant access to Amazon Redshift to get cluster credentials, create users, and allow users to join groups:

{
    "Version": "2012-10-17",
    "Statement": [
        {
            "Sid": "RedshiftClusterPermissions",
            "Effect": "Allow",
            "Action": [
                "redshift:GetClusterCredentials",
                "redshift:CreateClusterUser",
                "redshift:JoinGroup"
            ],
            "Resource": [
                "arn:aws:redshift:<region>:<account>:cluster:<cluster>,                 
                "arn:aws:redshift:<region>:<account>:dbuser:<cluster>/${aws:PrincipalTag/RedshiftDbUser}",
                "arn:aws:redshift:<region>:<account>:dbgroup:<cluster>/analyst_users",
                "arn:aws:redshift:<region>:<account>:dbgroup:<cluster>/bi_users",
                "arn:aws:redshift:<region>:<account>:dbname:<cluster>/${redshift:DBName}"
            ]
        }
    ]
}

The group membership lasts only for the duration of the user session. Additionally, there is no CreateGroup permission because groups need to be manually created and granted DB privileges.

  1. Attach the policy you created to the role.
    The following screenshot shows the summary page for the role.
  2. Modify the trust relationships for your role and add sts:TagSession permission.
    When using session tags, trust policies for all roles connected to the IdP passing tags must have the sts:TagSession permission. For roles without this permission in the trust policy, the AssumeRole operation fails.
  3. Choose Update policy.

Set up Okta advanced configuration

In this section, you finalize the Okta configuration by adding the IAM roles that you just created. You set up SAML PrincipalTag attributes such as RedshiftDbUser and RedshiftDbGroups, which are passed in the SAML assertion to federate the access to Amazon Redshift query editor v2. You also define a default relay state, which is the URL that users are directed to after a successful authentication through SAML.

  1. In your Okta account, open the AWS Account Federation app.
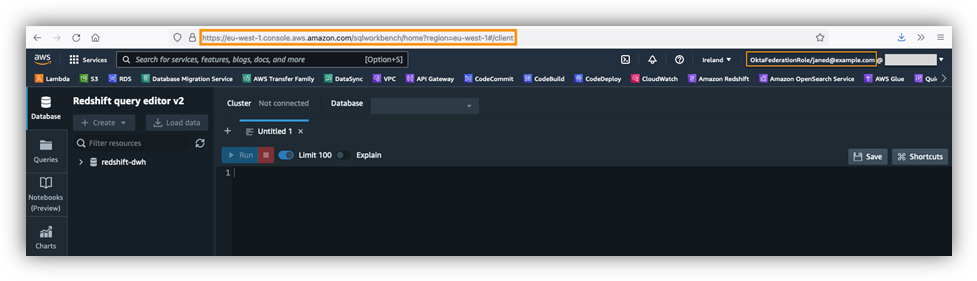
  2. On the Sign On tab, set Default Relay State to the query editor URL, using the format https://<region>.console.aws.amazon.com/sqlworkbench/home. For this post, we use https://eu-west-1.console.aws.amazon.com/sqlworkbench/home.
  3. Choose Attributes and set up the following attribute mappings:
    1. Set the DB user using PrincipalTag:RedshiftDbUser. This uses the user name in the directory. This is a required tag and defines the database user that is used by query editor v2.
    2. Set the DB groups using PrincipalTag:RedshiftDbGroups. This uses the Okta groups to fill the principal tags. Its value must be a colon-separated list.
    3. Set the transitive keys using TransitiveTagKeys. This prevents users from changing the session tags in case of role chaining.

These tags are forwarded to the redshift:GetClusterCredentials API to get credentials for your cluster. The following table summarizes their attribute configuration.

Name Name Format Value
https://aws.amazon.com/SAML/Attributes/PrincipalTag:RedshiftDbUser Unspecified user.username
https://aws.amazon.com/SAML/Attributes/PrincipalTag:RedshiftDbGroups Unspecified String.join(“:”, isMemberOfGroupName(“analyst_users”) ? ‘analyst_users’ : ”, isMemberOfGroupName(“bi_users”) ? ‘bi_users’ : ”)
https://aws.amazon.com/SAML/Attributes/TransitiveTagKeys Unspecified Arrays.flatten(“RedshiftDbUser”, “RedshiftDbGroups”)

  1. Under Advanced Sign-on Settings¸ select Use Group Mapping.
  2. Enter the IdP and IAM role ARNs, which are globally unique, and make sure that Okta is directed to your AWS account.
  3. Authorize users to use the AWS Account Federation application by selecting their respective groups or individual user accounts. In this example, we authorized users by group.

Set up Amazon Redshift database groups

Next, you set up groups in the Amazon Redshift database to match the Okta groups. You also authorize these groups to access certain schemas and tables.

  1. Log in to your Amazon Redshift cluster with an admin account.
  2. Create groups that match the IdP group names, and grant the appropriate permissions to tables and schemas:
CREATE GROUP analyst_users;
CREATE GROUP bi_users;

ALTER DEFAULT PRIVILEGES IN SCHEMA sales_analysis
GRANT SELECT on TABLES to GROUP analyst_users;
GRANT USAGE on SCHEMA sales_analysis to GROUP analyst_users;
GRANT SELECT on ALL TABLES in SCHEMA sales_analysis to GROUP analyst_users;

ALTER DEFAULT PRIVILEGES IN SCHEMA sales_bi
GRANT SELECT on TABLES to GROUP bi_users;
GRANT USAGE on SCHEMA sales_bi to GROUP bi_users;
GRANT SELECT on ALL TABLES in SCHEMA sales_bi to GROUP bi_users;

In Okta, you created the user Jane and assigned Jane to the analyst_users group.

In the Amazon Redshift database, you created two database groups: analyst_users and bi_users.

When user Jane logs in via federated authentication to Amazon Redshift using query editor v2, the user is created if it doesn’t already exist and the analyst_users database group is assumed. The user Jane can query tables only in sales_analysis schema.

Because user Jane isn’t part of the bi_users group, when they try to access the sales_bi schema, they get a permission denied error.

The following diagram illustrates this configuration.

Access Amazon Redshift query editor v2

Now you’re ready to connect to your Amazon Redshift cluster using Amazon Redshift query editor v2 using federated login. Log in to your Okta account with your user credentials and under My Apps¸ choose Amazon Redshift Query Editor V2.

You’re redirected to the Amazon Redshift query editor v2 URL that you specified as the default relay state.

Connect to an Amazon Redshift database and run queries

Now let’s set up the connection to your Amazon Redshift cluster.

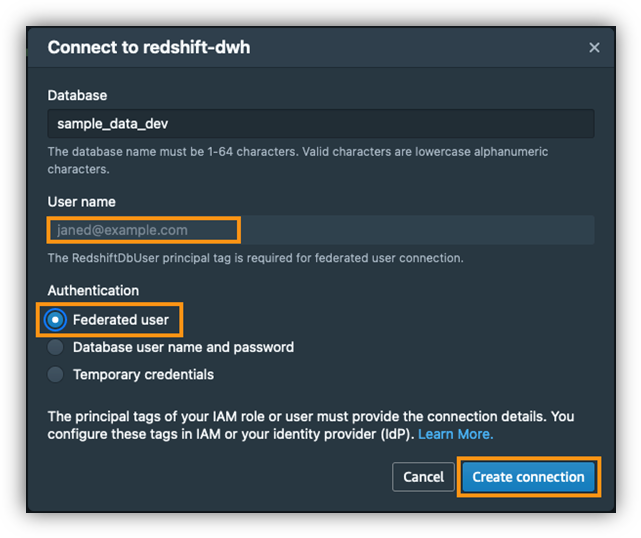
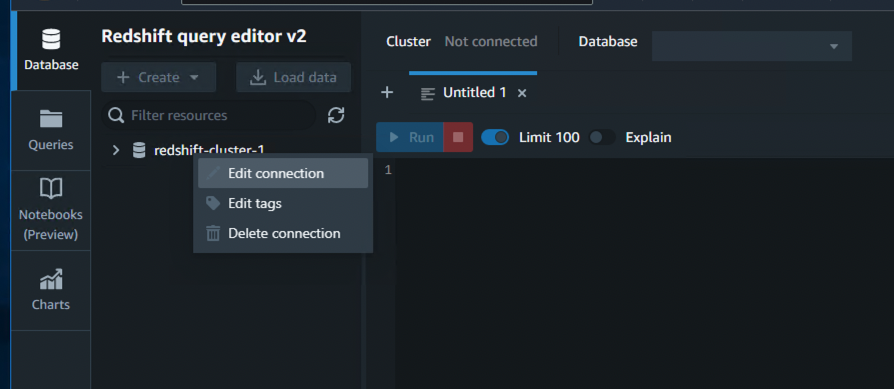
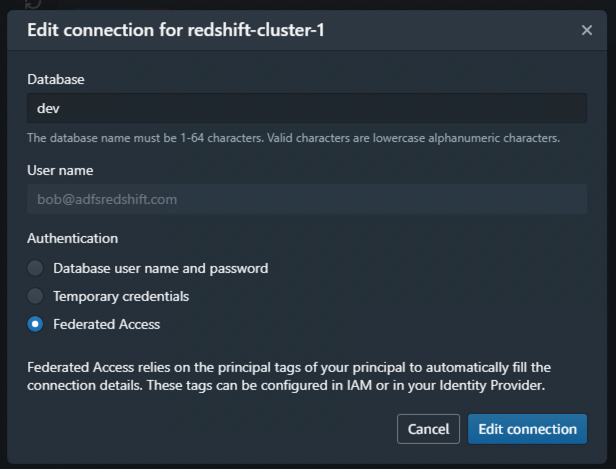
  1. In the query editor, choose your cluster (right-click) and choose Create connection.
  2. For Database, enter a name.
  3. For Authentication, select Federated user.
    The user name is prepopulated with your federated login information.
  4. Choose Create connection.

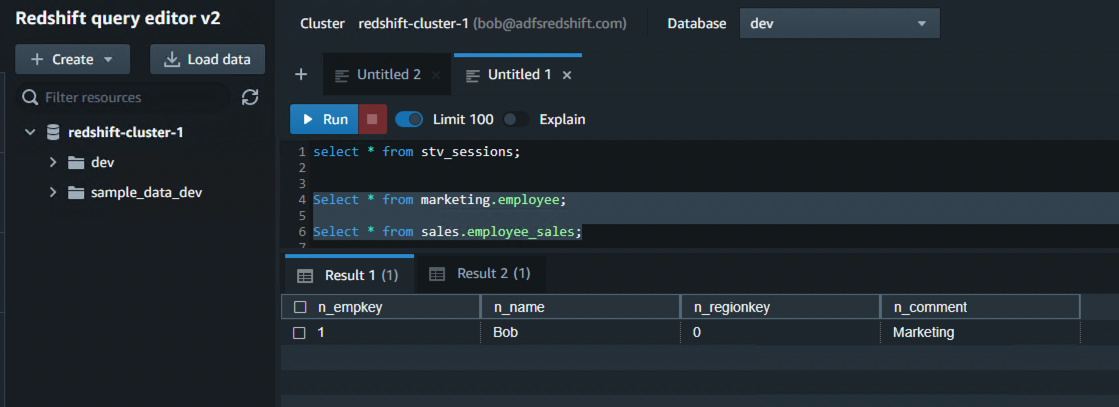
When you’re connected to your Amazon Redshift database, you can verify the connection details, as shown in the following screenshot. Notice the session-level group association as per the group assignment in your Okta application configuration. In this case, user Jane is assigned to the analyst_users group.

This user has access to SELECT all tables in the sales_analysis schema and no access to the sales_bi schema. You can run the following statements to test your access.

The following screenshot shows the results from a query to the sales_analysis.store_sales_us table.

When user Jane tries to access the tables in the sales_bi schema, they get a permission denied error.

Summary

In this post, we demonstrated how to federate SSO access to Amazon Redshift query editor v2 using Okta as your IdP. We showed how to set up Okta, set different PrinicpalTag attributes for query editor v2, and pass group memberships defined in your Okta IdP to your Amazon Redshift cluster. We showed how to log in to Amazon Redshift query editor v2 using federated login and validate the configuration by running a few queries. This solution allows you to control access to Amazon Redshift database objects, and your users can easily access Amazon Redshift clusters through query editor v2 using federated credentials without managing database users and passwords.

If you have any feedback or questions, please leave them in the comments.


About the Authors

Sumeet Joshi is an Analytics Specialist Solutions Architect based out of New York. He specializes in building large-scale data warehousing solutions. He has over 16 years of experience in the data warehousing and analytical space.

Bhanu Pittampally is an Analytics Specialist Solutions Architect based out of Dallas. He specializes in building analytical solutions. His background is in data and analytics for over 14 years. His LinkedIn profile can be found here.

Erol Murtezaoglu, a Technical Product Manager at AWS, is an inquisitive and enthusiastic thinker with a drive for self-improvement and learning. He has a strong and proven technical background in software development and architecture, balanced with a drive to deliver commercially successful products. Erol highly values the process of understanding customer needs and problems, in order to deliver solutions that exceed expectations.

Yanis Telaoumaten is a Software Development Engineer at AWS. His passions are building reliable software and creating tools to allow other engineers to work more efficiently. In the past years, he worked on identity, security and reliability of Redshift services

[$] Sharing page tables with mshare()

Post Syndicated from original https://lwn.net/Articles/895217/

The Linux kernel allows processes to share pages in memory, but the page
tables used to control that sharing are not, themselves, shared; as a
result, processes sharing memory maintain duplicate copies of the
page-table data. Normally this duplication imposes little overhead, but
there are situations where it can hurt. At the 2022 Linux Storage,
Filesystem, Memory-management and BPF Summit
(LSFMM), Khaled Aziz
(remotely) and Matthew Wilcox led a session to discuss a proposed mechanism
to allow those page tables to be shared between cooperating processes.

Security updates for Tuesday

Post Syndicated from original https://lwn.net/Articles/895521/

Security updates have been issued by Debian (cifs-utils, ffmpeg, libxml2, and vim), Fedora (rsyslog), Mageia (chromium-browser-stable), SUSE (chromium, containerd, docker, e2fsprogs, gzip, jackson-databind, jackson-dataformats-binary, jackson-annotations, jackson-bom, jackson-core, kernel, nodejs8, openldap2, pidgin, podofo, slurm, and tiff), and Ubuntu (clamav, containerd, libxml2, and openldap).

Debugging Hardware Performance on Gen X Servers

Post Syndicated from Yasir Jamal original https://blog.cloudflare.com/debugging-hardware-performance-on-gen-x-servers/

Debugging Hardware Performance on Gen X Servers

Debugging Hardware Performance on Gen X Servers

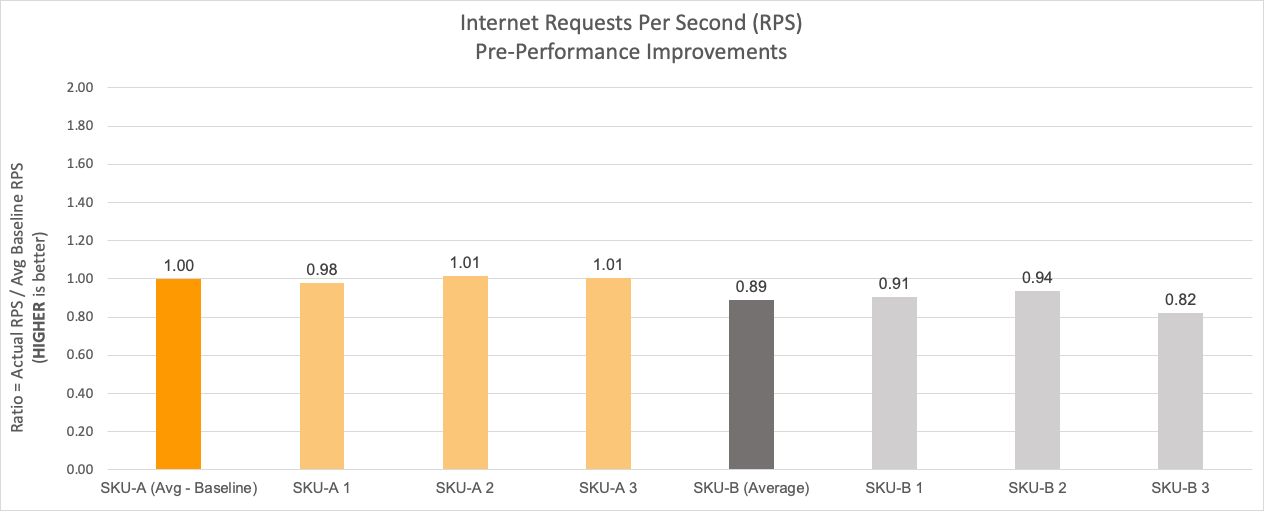
In Cloudflare’s global network, every server runs the whole software stack. Therefore, it’s critical that every server performs to its maximum potential capacity. In order to provide us better flexibility from a supply chain perspective, we buy server hardware from multiple vendors with the exact same configuration. However, after the deployment of our Gen X AMD EPYC Zen 2 (Rome) servers, we noticed that servers from one vendor (which we’ll call SKU-B) were consistently performing 5-10% worse than servers from second vendor (which we’ll call SKU-A).

The graph below shows the performance discrepancy between the two SKUs in terms of percentage difference. The performance is gauged on the metric of requests per second, and this data is an average of observations captured over 24 hours.

Debugging Hardware Performance on Gen X Servers
Machines before implementing performance improvements. The average RPS for SKU-B is approximately 10% below SKU-A.

Compute performance via DGEMM

The initial debugging efforts centered around the compute performance. We ran AMD’s DGEMM high performance computing tool to determine if CPU performance was the cause. DGEMM is designed to measure the sustained floating-point computation rate of a single server. Specifically, the code measures the floating point rate of execution of a real matrix–matrix multiplication with double precision. We ran a modified version of DGEMM equipped with specific AMD libraries to support the EPYC processor instruction set.

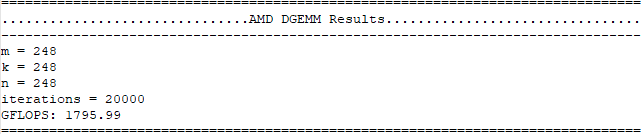
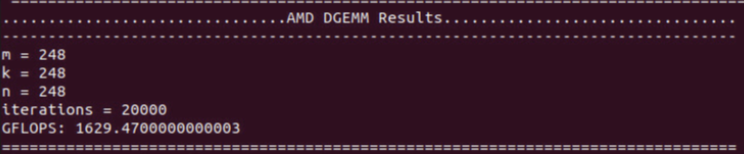
The DGEMM test brought out a few points related to the processor’s Thermal Design Power (TDP). TDP refers to the maximum power that a processor can draw for a thermally significant period while running a software application. The underperforming servers were only drawing 215 to 220 watts of power when fully stressed, whereas the max supported TDP on the processors is 240 watts. Additionally, their floating-point computation rate was ~100 gigaflops (GFLOPS) behind the better performing servers.

Screenshot from the DGEMM run of a good system:

Debugging Hardware Performance on Gen X Servers

Screenshot from an underperforming system:

Debugging Hardware Performance on Gen X Servers

To debug the issue, we first tried disabling idle power saving mode (also known as C-states) in the CPU BIOS configuration. The servers reported expected GFLOPS numbers and achieved max TDP. Believing that this could have been the root cause, the servers were moved back into the production test environment for data collection.

However, the performance delta was still there.

Further debugging

We started the debugging process all over again by comparing the BIOS settings logs of both SKU-A and SKU-B. Once this debugging option was exhausted, the focus shifted to the network interface. We ran the open source network interface tool iPerf to check if there were any bottlenecks — no issues were observed either.

During this activity, we noticed that the BIOS of both SKUs were not using the AMD Preferred I/O functionality, which allows devices on a single PCIe bus to obtain improved DMA write performance. We enabled the Preferred I/O option on SKU-B and tested the change in production. Unfortunately, there were no performance gains. After the focus on network activity, the team started looking into memory configuration and operating speed.

AMD HSMP tool & Infinity Fabric diagnosis

The Gen X systems are configured with DDR4 memory modules that can support a maximum of 2933 megatransfers per second (MT/s). With the BIOS configuration for memory clock Frequency set to Auto, the 2933 MT/s automatically configures the memory clock frequency to 1467 MHz. Double Data Rate (DDR) technology allows for the memory signal to be sampled twice per clock cycle: once on the rising edge and once on the falling edge of the clock signal. Because of this, the reported memory speed rate is twice the true memory clock frequency. Memory bandwidth was validated to be working quite well by running a Stream benchmark test.

Running out of debugging options, we reached out to AMD for assistance and were provided a debug tool called HSMP that lets users access the Host System Management Port. This tool provides a wide variety of processor management options, such as reading and changing processor TDP limits, reading processor and memory temperatures, and reading memory and processor clock frequencies. When we ran the HSMP tool, we discovered that the memory was being clocked at a different rate from AMD’s Infinity Fabric system — the architecture which connects the memory to the processor core. As shown below, the memory clock frequency was set to 1467 MHz while the Infinity Fabric clock frequency was set to 1333 MHz.

Debugging Hardware Performance on Gen X Servers

Ideally, the two clock frequencies need to be equal for optimized workloads sensitive to latency and throughput. Below is a snapshot for an SKU-A server where both memory and Infinity Fabric frequencies are equal.

Debugging Hardware Performance on Gen X Servers

Improved Performance

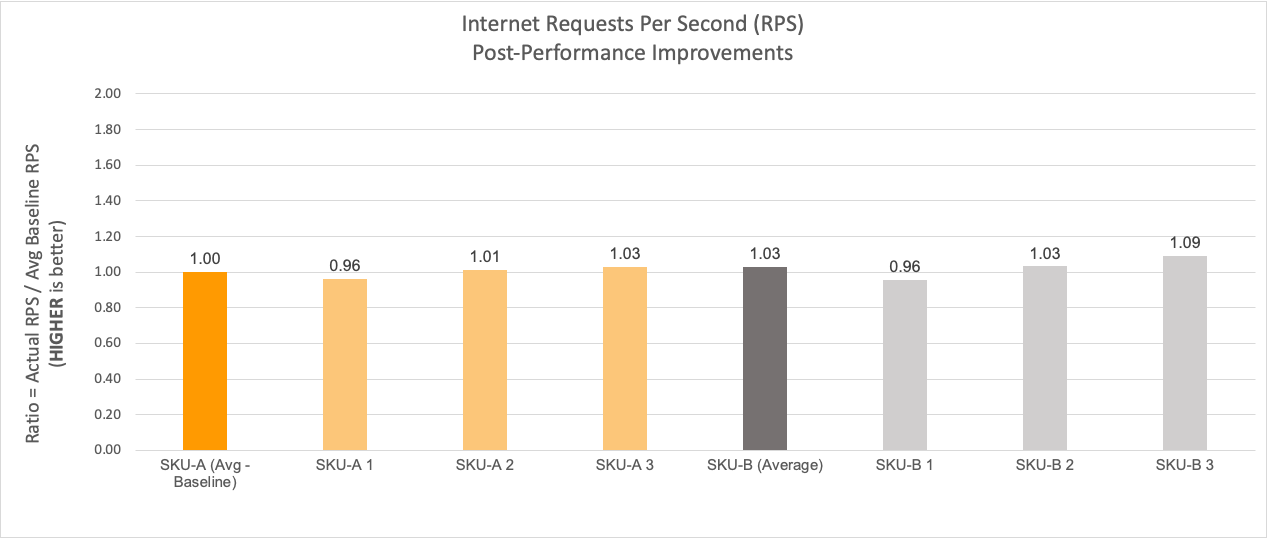
Since the Infinity Fabric clock setting was not exposed as a tunable parameter in the BIOS, we asked the vendor to provide a new BIOS that set the frequency to 1467 MHz during compile time. Once we deployed the new BIOS on the underperforming systems in production, we saw that all servers started performing to their expected levels. Below is a snapshot of the same set of systems with data captured and averaged over a 24 hours window on the same day of the week as the previous dataset. Now, the requests per second performance of SKU-B equals and in some cases exceeds the performance of SKU-A!

Debugging Hardware Performance on Gen X Servers
Internet Requests Per Second (RPS) for four SKU-A machines and four SKU-B machines after implementing the BIOS fix on SKU-B. The RPS of SKU-B now equals the RPS of SKU-A.

Hello, I am Yasir Jamal. I recently joined Cloudflare as a Hardware Engineer with the goal of helping provide a better Internet to everyone. If you share the same interest, come join us!

Announcing our Spring Developer Challenge

Post Syndicated from Albert Zhao original https://blog.cloudflare.com/announcing-our-spring-developer-challenge/

Announcing our Spring Developer Challenge

Announcing our Spring Developer Challenge

After many announcements from Platform Week, we’re thrilled to make one more: our Spring Developer Challenge!

The theme for this challenge is building real-time, collaborative applications — one of the most exciting use-cases emerging in the Cloudflare ecosystem. This is an opportunity for developers to merge their ideas with our newly released features, earn recognition on our blog, and take home our best swag yet.

Here’s a list of our tools that will get you started:

  • Workers can either be powerful middleware connecting your app to different APIs and an origin — or it can be the entire application itself. We recommend using Worktop, a popular framework for Workers, if you need TypeScript support, routing, and well-organized submodules. Worktop can also complement your existing app even if it already uses a framework,  such as Svelte.
  • Cloudflare Pages makes it incredibly easy to deploy sites, which you can make into truly dynamic apps by putting a Worker in front or using the Pages Functions (beta).
  • Durable Objects are great for collaborative apps because you can use websockets while coordinating state at the edge, seen in this chat demo. To help scale any load, we also recommend Durable Object Groups.
  • Workers KV provides a global key-value data store that securely stores and quickly serves data across Cloudflare’s network. R2 allows you to store enormous amounts of data without trapping you with costly egress services.

Last year, our Developer Spotlight series highlighted how developers around the world built entire applications on Cloudflare. Our Discord server maintained that momentum with users demonstrating that any type of application can be built. Need a way to organize thousands of lines of JSON? JSON Hero, built with Remix and deployed with Workers, provides an incredibly readable UI for your JSON files. Trying to deploy a GraphQL server for your app that scales? helix-flare deploys a GraphQL server easily through Workers and uses Durable Objects to coordinate data.

We hope developers continue to explore the boundaries of what they can build on Cloudflare as our platform evolves. During our Summer Developer Challenge in 2021, we received over 1,200 submissions that revealed you can build almost any app imaginable with Workers, Pages, and the rest of the developer ecosystem. We sent out hundreds of swag boxes to participants, to show our appreciation. The ensuing unboxing videos on Twitter and YouTube thrilled our team.

This year’s Spring Developer Challenge is all about making real-time, collaborative apps such as chat rooms, games, web-based editing tools, or anything else in your imagination! Here are the rules:

  • You must be at least 18 years old to participate
  • You can work in teams of up to 10 people per submission
  • The deadline to submit your repo is May 24

Enter the challenge by going to this site.

As you build your app, join our Discord if you or your team need any help. We will be enthusiastically reviewing submissions, promoting them on Twitter, and sending out swag boxes.

If you’re new to Cloudflare or have an exciting idea as a developer, this is your opportunity to see how far our platform has evolved and get rewarded for it!

Attacks on Managed Service Providers Expected to Increase

Post Syndicated from Bruce Schneier original https://www.schneier.com/blog/archives/2022/05/attacks-on-managed-service-providers-expected-to-increase.html

CISA, NSA, FBI, and similar organizations in the other Five Eyes countries are warning that attacks on MSPs — as a vector to their customers — are likely to increase. No details about what this prediction is based on. Makes sense, though. The SolarWinds attack was incredibly successful for the Russian SVR, and a blueprint for future attacks.

News articles.

Search architecture revamp

Post Syndicated from Grab Tech original https://engineering.grab.com/search-architecture-revamp

Background

Prior to 2021, Grab’s search architecture was designed to only support textual matching, which takes in a user query and looks for exact matches within the ecosystem through an inverted index. This legacy system meant that only textual matching results could be fetched.

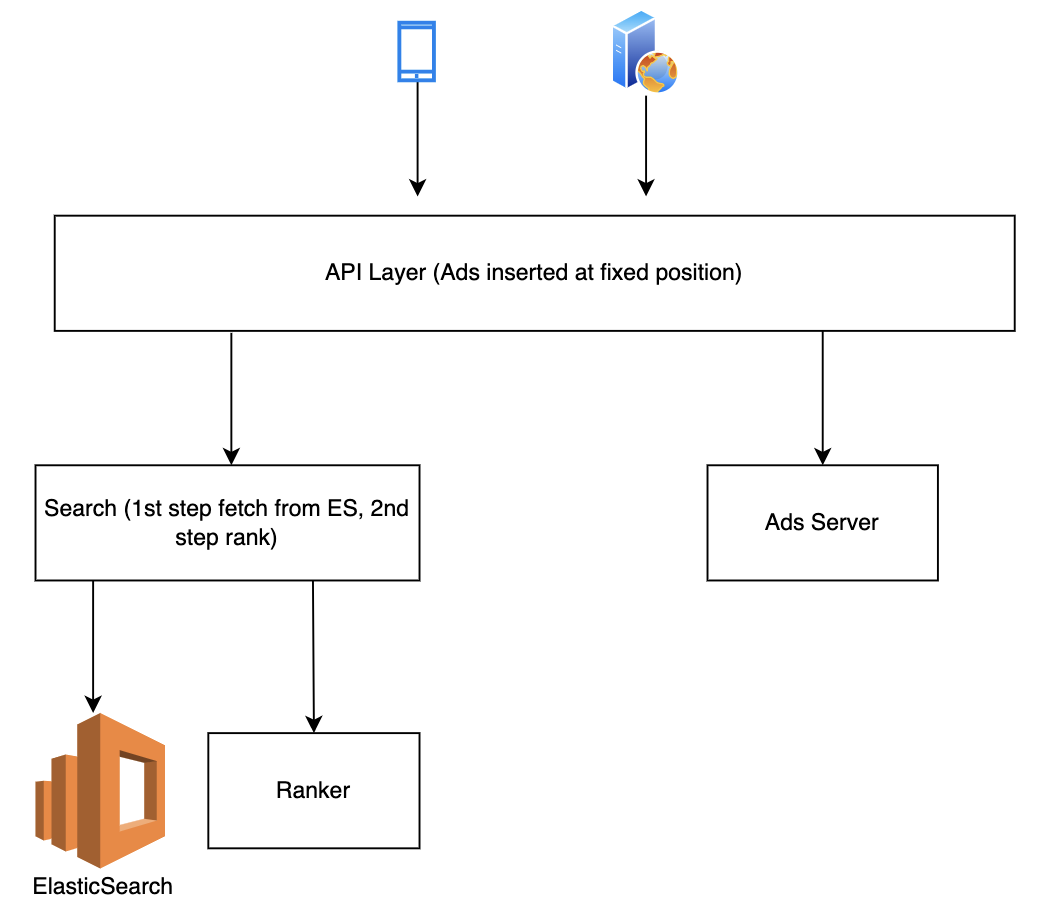
In the second half of 2021, the Deliveries search team worked on improving this architecture to make it smarter, more scalable and also unlock future growth for different search use cases at Grab. The figure below shows a simplified overview of the legacy architecture.

Point multiplier
Legacy architecture

Problem statement

With the legacy system, we noticed several problems.

Search results were textually matched without considering intention and context

If a user types in a query “Roti Prata” (flatbread), he is likely looking for Roti Prata dishes and those matches with the dish name should be prioritised compared with matches with the merchant-partner’s name or matches with other entities.

In the legacy system, all entities whose names partially matched “Roti Prata” were displayed and ranked according to hard coded weights, and matches with merchant-partner names were always prioritised, even if the user intention was clearly to search for the “Roti Prata” dish itself.  

This problem was more common in Mart, as users often intended to search for items instead of shops. Besides the lack of intention recognition, the search system was also unable to take context into consideration; users searching the same keyword query at different times and locations could have different objectives. E.g. if users search for “Bread” in the day, they may be likely to look for cafes while searches at night could be for breakfast the next day.

Search results from multiple business verticals were not blended effectively

In Grab’s context, results from multiple verticals were often merged. For example, in Mart searches, Ads and Mart organic search results were displayed together; in Food searches, Ads, Food and Mart organic results were blended together.

In the legacy architecture, multiple business verticals were merged on the Deliveries API layer, which resulted in the leak of abstraction and loss of useful data as data from the search recall stage was also not taken into account during the merge stage.

Inability to quickly scale to new search use cases and difficulty in reusing existing components

The legacy code base was not written in a structured way that could scale to new use cases easily. If new search use cases cannot be built on top of an existing system, it can be rather tedious to keep rebuilding the function every time there is a new search use case.

Solution

In this section, solutions from both architecture and implementation perspectives are presented to address the above problem statements.

Architecture

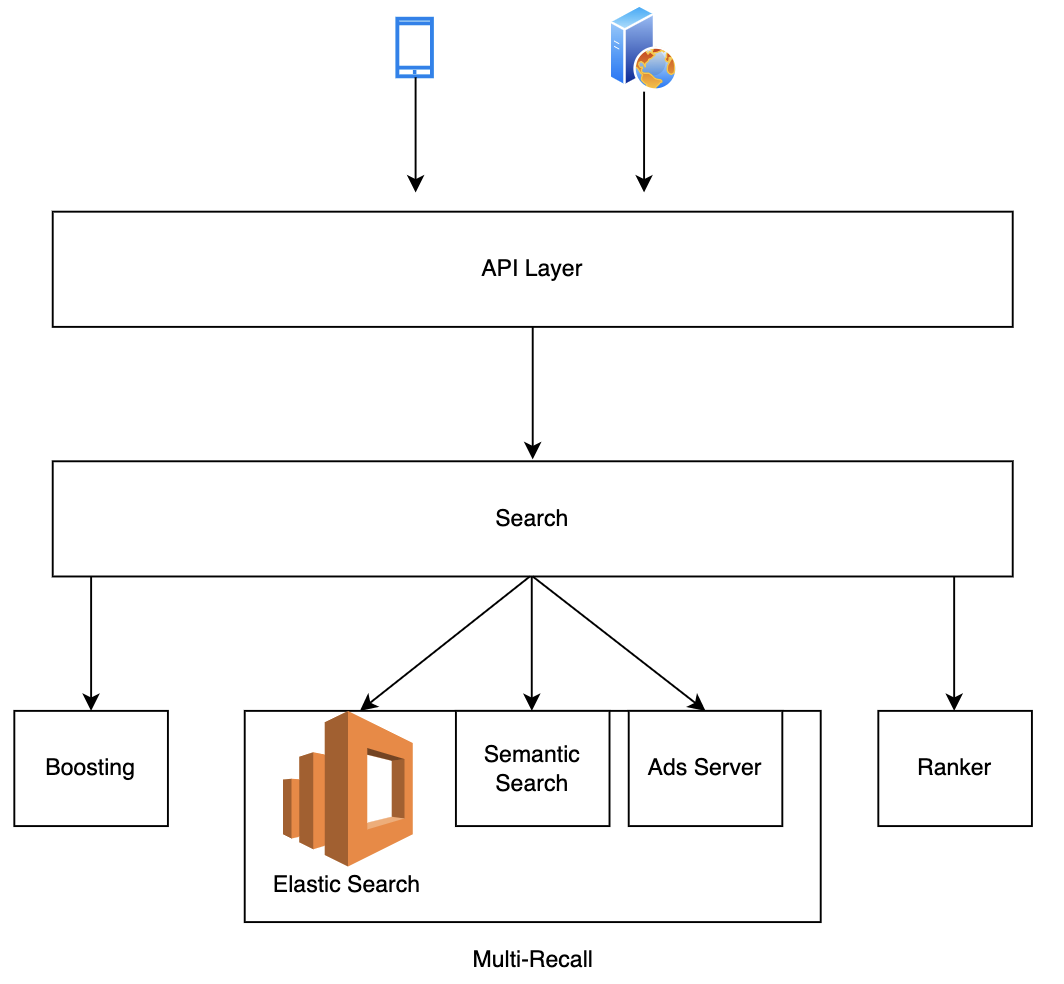
In the new architecture, the flow is extended from lexical recall only to multi-layer including boosting, multi-recall, and ranking. The addition of boosting enables capabilities like intent recognition and query expansion, while the change from single lexical recall to multi-recall opens up the potential for other recall methods, e.g. embedding based and graph based.

These help address the first problem statement. Furthermore, the multi-recall framework enables fetching results from multiple business verticals, addressing the second problem statement. In the new framework, results from different verticals and different recall methods were grouped and ranked together without any leak of abstraction or loss of useful data from search recall stage in ranking.

Point multiplier
Upgraded architecture

Implementation

We believe that the key to a platform’s success is modularisation and flexible assembling of plugins to enable quick product iteration. That is why we implemented a combination of a framework defined by the platform and plugins provided by service teams. In this implementation, plugins are assembled through configurations, which addresses the third problem statement and has two advantages:

  • Separation of concern. With the main flow abstracted and maintained by the platform, service team developers could focus on the application logic by writing plugins and fitting them into the main flow. In this case, developers without search experience could quickly enable new search flows.
  • Reusing plugins and economies of scale. With more use cases onboarded, more plugins are written by service teams and these plugins are reusable assets, resulting in scale effect. For example, an Ads recall plugin could be reused in Food keyword or non-keyword searches, Mart keyword or non-keyword searches and universal search flows as all these searches contain non-organic Ads. Similarly, a Mart recall plugin could be reused in Mart keyword or non-keyword searches, universal search and Food keyword search flows, as all these flows contain Mart results. With more plugins accumulated on our platform, developers might be able to ship a new search flow by just reusing and assembling the existing plugins.

Conclusion

Our platform now has a smart search with intent recognition and semantic (embedding-based) search. The process of adding new modules is also more straightforward and adds intention recognition to the boosting step as well as embedding as an additional recall to the multi-recall step. These modules can be easily reused by other use cases.

On top of that, we also have a mixed Ads and an organic framework. This means that data in the recall stage is taken into consideration and Ads can now be ranked together with organic results, e.g. text relevance.

With a modularised design and plugins provided by the platform, it is easier for clients to use our platform with a simple onboarding process. Furthermore, plugins can be reused to cater to new use cases and achieve a scale effect.

Join us

Grab is the leading superapp platform in Southeast Asia, providing everyday services that matter to consumers. More than just a ride-hailing and food delivery app, Grab offers a wide range of on-demand services in the region, including mobility, food, package and grocery delivery services, mobile payments, and financial services across 428 cities in eight countries.

Powered by technology and driven by heart, our mission is to drive Southeast Asia forward by creating economic empowerment for everyone. If this mission speaks to you, join our team today!

Service architecture revamp

Post Syndicated from Grab Tech original https://engineering.grab.com/service-architecture-revamp

Background

Prior to 2021, Grab’s search architecture was designed to only support textual matching, which takes in a user query and looks for exact matches within the ecosystem through an inverted index. This legacy system meant that only textual matching results could be fetched.

In the second half of 2021, the Deliveries search team worked on improving this architecture to make it smarter, more scalable and also unlock future growth for different search use cases at Grab. The figure below shows a simplified overview of the legacy architecture.

Point multiplier
Legacy architecture

Problem statement

With the legacy system, we noticed several problems.

Search results were textually matched without considering intention and context

If a user types in a query “Roti Prata” (flatbread), he is likely looking for Roti Prata dishes and those matches with the dish name should be prioritised compared with matches with the merchant-partner’s name or matches with other entities.

In the legacy system, all entities whose names partially matched “Roti Prata” were displayed and ranked according to hard coded weights, and matches with merchant-partner names were always prioritised, even if the user intention was clearly to search for the “Roti Prata” dish itself.  

This problem was more common in Mart, as users often intended to search for items instead of shops. Besides the lack of intention recognition, the search system was also unable to take context into consideration; users searching the same keyword query at different times and locations could have different objectives. E.g. if users search for “Bread” in the day, they may be likely to look for cafes while searches at night could be for breakfast the next day.

Search results from multiple business verticals were not blended effectively

In Grab’s context, results from multiple verticals were often merged. For example, in Mart searches, Ads and Mart organic search results were displayed together; in Food searches, Ads, Food and Mart organic results were blended together.

In the legacy architecture, multiple business verticals were merged on the Deliveries API layer, which resulted in the leak of abstraction and loss of useful data as data from the search recall stage was also not taken into account during the merge stage.

Inability to quickly scale to new search use cases and difficulty in reusing existing components

The legacy code base was not written in a structured way that could scale to new use cases easily. If new search use cases cannot be built on top of an existing system, it can be rather tedious to keep rebuilding the function every time there is a new search use case.

Solution

In this section, solutions from both architecture and implementation perspectives are presented to address the above problem statements.

Architecture

In the new architecture, the flow is extended from lexical recall only to multi-layer including boosting, multi-recall, and ranking. The addition of boosting enables capabilities like intent recognition and query expansion, while the change from single lexical recall to multi-recall opens up the potential for other recall methods, e.g. embedding based and graph based.

These help address the first problem statement. Furthermore, the multi-recall framework enables fetching results from multiple business verticals, addressing the second problem statement. In the new framework, results from different verticals and different recall methods were grouped and ranked together without any leak of abstraction or loss of useful data from search recall stage in ranking.

Point multiplier
Upgraded architecture

Implementation

We believe that the key to a platform’s success is modularisation and flexible assembling of plugins to enable quick product iteration. That is why we implemented a combination of a framework defined by the platform and plugins provided by service teams. In this implementation, plugins are assembled through configurations, which addresses the third problem statement and has two advantages:

  • Separation of concern. With the main flow abstracted and maintained by the platform, service team developers could focus on the application logic by writing plugins and fitting them into the main flow. In this case, developers without search experience could quickly enable new search flows.
  • Reusing plugins and economies of scale. With more use cases onboarded, more plugins are written by service teams and these plugins are reusable assets, resulting in scale effect. For example, an Ads recall plugin could be reused in Food keyword or non-keyword searches, Mart keyword or non-keyword searches and universal search flows as all these searches contain non-organic Ads. Similarly, a Mart recall plugin could be reused in Mart keyword or non-keyword searches, universal search and Food keyword search flows, as all these flows contain Mart results. With more plugins accumulated on our platform, developers might be able to ship a new search flow by just reusing and assembling the existing plugins.

Conclusion

Our platform now has a smart search with intent recognition and semantic (embedding-based) search. The process of adding new modules is also more straightforward and adds intention recognition to the boosting step as well as embedding as an additional recall to the multi-recall step. These modules can be easily reused by other use cases.

On top of that, we also have a mixed Ads and an organic framework. This means that data in the recall stage is taken into consideration and Ads can now be ranked together with organic results, e.g. text relevance.

With a modularised design and plugins provided by the platform, it is easier for clients to use our platform with a simple onboarding process. Furthermore, plugins can be reused to cater to new use cases and achieve a scale effect.

Join us

Grab is the leading superapp platform in Southeast Asia, providing everyday services that matter to consumers. More than just a ride-hailing and food delivery app, Grab offers a wide range of on-demand services in the region, including mobility, food, package and grocery delivery services, mobile payments, and financial services across 428 cities in eight countries.

Powered by technology and driven by heart, our mission is to drive Southeast Asia forward by creating economic empowerment for everyone. If this mission speaks to you, join our team today!

Federate access to Amazon Redshift query editor V2 with Active Directory Federation Services (AD FS): Part 3

Post Syndicated from Sumeet Joshi original https://aws.amazon.com/blogs/big-data/federate-access-to-amazon-redshift-query-editor-v2-with-active-directory-federation-services-ad-fs-part-3/

In the first post of this series, Federate access to your Amazon Redshift cluster with Active Directory Federation Services (AD FS): Part 1, you set up Microsoft Active Directory Federation Services (AD FS) and Security Assertion Markup Language (SAML) based authentication and tested the SAML federation using a web browser.

In Part 2, you learned to set up an Amazon Redshift cluster and use federated authentication with AD FS to connect from a JDBC SQL client tool.

In this post, we walk through the steps to configure Amazon Redshift query editor v2 to work with AD FS federation SSO.

Organizations want to enable their end-users such as data analysts, data scientists, and database developers to use the query editor v2 to accelerate self-service analytics. Amazon Redshift query editor v2 lets users explore, analyze, and collaborate on data. You can use the query editor to create databases, schemas, tables, and load data from Amazon Simple Storage Service (Amazon S3) using the COPY command or by using a wizard. You can browse multiple databases and run queries on your Amazon Redshift data warehouse or data lake, or run federated queries to operational databases such as Amazon Aurora.

In this post, we show how you can use your corporate Active Directory (AD) and the SAML 2.0 AD FS identity provider (IdP) to enable your users to easily access Amazon Redshift clusters through query editor v2 using corporate user names without managing database users and passwords. We also demonstrate how you can limit the access for your users to use only the query editor without giving them access to perform any admin functions on the AWS Management Console.

Solution overview

After you follow the steps explained in Part 1, you set up a deep link for federated users via the SAML 2.0 RelayState parameter in AD FS. You use the user you set up in your AD in Part 1 (Bob) to authenticate using AD FS and control access to database objects based on the group the user is assigned to. You also test if user Bob is integrated with Amazon Redshift database groups as controlled in AD groups.

By the end of this post, you will have created a unique deep link that authenticates the user Bob using AD FS and redirects them directly to the query editor v2 console, where they’re authenticated using the federation SSO option.

The sign-in process is as follows:

  1. The user chooses a deep link that redirects to the IdP for authentication with the information about the destination (query editor v2, in our case) URL embedded in the RelayState parameter. The user enters their credentials on the login page.
  2. Your IdP (AD FS in the case) verifies the user’s identity in your organization.
  3. Your IdP generates a SAML authentication response that includes assertions that identify the user and attributes about the user. The IdP sends this response to the user’s browser.
  4. The user’s browser is redirected to the AWS Single Sign-On endpoint and posts the SAML assertion and the RelayState parameter.
  5. The endpoint calls the AssumeRoleWithSAML API action to request temporary credentials from the AWS Identity and Access Management (IAM) role specified in the SAML assertion and creates a query editor v2 console sign-in URL that uses those credentials. The IAM role trusts the SAML federation entity and also has a policy that has access to query editor V2. If the SAML authentication response includes attributes that map to multiple IAM roles, the user is first prompted to choose the role to use for access to the query editor v2 console. The sign-in URL is the one specified by the RelayState parameter.
  6. AWS sends the sign-in URL back to the user’s browser as a redirect.
  7. The user’s browser is redirected to the Amazon Redshift query editor v2 console defined by the RelayState parameter.

The following diagram illustrates this flow.

In this post, we walk you through the following steps:

  1. Set up the Sales group in AD and set up the PrincipalTag claim rules in AD FS.
  2. Update the IAM roles.
  3. Construct the SSO URL to authenticate and redirect users to the Amazon Redshift query editor v2 console.
  4. Set up Amazon Redshift database groups and permissions on the Amazon Redshift cluster.
  5. Set up Amazon Redshift query editor v2 to use federated authentication with AD FS to connect directly from the query editor interface.
  6. Query Amazon Redshift objects to validate your authorization.

Prerequisites

For this walkthrough, complete the following prerequisite steps:

  1. Create an Amazon Redshift cluster. For instructions, refer to Create a sample Amazon Redshift cluster or complete the steps in Part 2 of this series.
  2. Complete the steps in Part 1 to set up SAML federation with AD FS:
    1. Set up an AD domain controller using an AWS CloudFormation template on a Windows 2016 Amazon Elastic Compute Cloud (Amazon EC2) instance.
    2. Configure federation in AD FS.
    3. Configure AWS as the relying party with AD FS using an IAM SAML provider and SAML roles with an attached policy to allow access to the Amazon Redshift cluster.
    4. Configure claim rules.
    5. Test the SAML authentication using a web browser.
  3. Verify that your IdP supports RelayState and is enabled. If you’re using AD FS 2.0, you need to download and install either Update Rollup 3 or Update Rollup 2 from Microsoft to enable the RelayState parameter.

Configure AD and AD FS

After you configure your AD FS and AD services by following the instructions in Part 1, you can set up the following AD group and claim rules.

In this post, you use the user Bob to log in to Amazon Redshift and check if Bob can access the Sales and Marketing schemas on the Amazon Redshift cluster. To create the sales group and assign the user [email protected] to it, log in to your AD FS server (Amazon EC2 machine) that you created in Part 1 and use the Windows command tool to run the following command:

dsadd group "cn=RSDB-sales, cn=Users, dc=adfsredshift, dc=com" -members "cn=Bob, cn=Users, dc=adfsredshift, dc=com"

Now you’re ready to create your custom claim rules: PrincipalTag:RedshiftDbUser and PrincipalTag:RedshiftDbGroup.

PrincipalTag:RedshiftDbUser

The custom claim rule PrincipalTag:RedshiftDbUser is mapped to the universal principal name in AD FS. When a user authenticates through federated SSO, this claim rule is mapped to the user name. If user doesn’t exist in the Amazon Redshift database, then the user is automatically created. The auto create option is granted through an IAM policy that is attached to the IAM role. The CreateClusterUser permission allows for auto creation of the user (you set this up as part of Part 1 as a prerequisite).

Complete the following steps to create your custom claim rule:

    1. On the AD FS management console, choose Relying Party Trusts.
    2. Choose Edit Claim Issuance Policy.
    3. Choose Choose Rule Type.
    4. For Claim rule template, choose Send Claims Using a Custom Rule.
    5. Choose Next.
    6. For Claims rule name, enter RedshiftDbUser.
    7. Add the following custom rule:
      c:[Type == "http://schemas.microsoft.com/ws/2008/06/identity/claims/windowsaccountname", Issuer == "AD AUTHORITY"]
       => issue(store = "Active Directory", types = ("https://aws.amazon.com/SAML/Attributes/PrincipalTag:RedshiftDbUser"), query = ";userPrincipalName;{0}", param = c.Value);

    8. Choose Finish.
    9. Capture the claim rules sent in a SAML assertion response through your browser. For instructions, refer to How to view a SAML response in your browser for troubleshooting.

In my example, I use the following SAML attribute for the RedshiftDbUser PrincipalTag:

<Attribute Name="https://aws.amazon.com/SAML/Attributes/PrincipalTag:RedshiftDbUser"> <AttributeValue>[email protected]</AttributeValue> 
</Attribute>

PrincipalTag:RedshiftDbGroup

The custom claim rule PrincipalTag:RedshiftDbGroup is built out of AD groups that the user is a member of. This rule is mapped to the Amazon Redshift database groups. The AD groups and Amazon Redshift database group names should match. JoinGroup permission set in the IAM policy allows the user to assume a database group and is session based. If the user is mapped to multiple groups in the AD group, the SAML assertion response should send those groups in : separated values and not as multiple value claims. The following steps demonstrate how to send AD groups as : separated values.

In this example, the user Bob is assigned to the marketing and sales groups. The following code shows how to send multiple groups through the SAML response when the user is in multiple groups, and also how to handle the situation when a user doesn’t exist in any particular group.

  1. Follow the same steps as in the previous section to create the rule Marketing, using the following code for the custom rule:
    c:[Type == " http://temp/groups", Value =~ "RSDB-Marketing"] => add(Type = " http://temp/marketing", Value = c.Value);

  2. Create the rule MarketingNotExists using the following code:
    NOT EXISTS([Type == "http://temp/variable", Value =~ "RSDB-marketing"]) => add(Type = "http://temp/marketing", Value = ""); 

  3. Create the rule sales using the following code:
    c:[Type == " http://temp/groups", Value =~ "RSDB-sales"] => add(Type = " http://temp/marketing", Value = c.Value);

  4. Create the rule SalesNotExists using the following code:
    NOT EXISTS([Type == "http://temp/variable", Value =~ "RSDB-sales"])
     => add(Type = "http://temp/sales", Value = ""); 

  5. Create the rule RedshiftDbGroups using the following code:
    c:[Type == "http://temp/marketing"]
     && c2:[Type == "http://temp/sales"]
     => issue(Type = "https://aws.amazon.com/SAML/Attributes/PrincipalTag:RedshiftDbGroups", Value = c.Value + ":" + c2.Value);

The following screenshot shows the list of rules that I created in my AD FS. Note the number of rules and the order in which they’re positioned. We created rules 6–11 as part of this post.

If you see a similar SAML response for RedshiftDbGroups, your setup is good:

<Attribute Name="https://redshift.amazon.com/SAML/Attributes/PrincipalTag:RedshiftDbGroups"> <AttributeValue> marketing:sales</AttributeValue>

If a user doesn’t exist in one of the groups, an empty value is passed to the claim rule. For example, if user bob is removed from the marketing group, the SAML response for PrincipalTag:RedshiftDbGroup would be :sales.

Update IAM roles

In Part 1 of this series, you created two IAM roles: ADFZ-Dev and ADFZ-Production. These two roles aren’t yet set up with grants on the query editor. In this section, you update these roles with query editor permissions.

Amazon Redshift query editor v2 provides multiple managed policies to access the query editor. For a list of all the managed policies, refer to Configuring your AWS account. For this post, we attach the AmazonRedshiftQueryEditorV2ReadSharing managed policy to the roles.

  1. On the IAM console, choose Roles in the navigation pane.
  2. Choose the role ADFZ-Dev.
  3. Choose Add permissions and then Attach policies.
  4. Under Other permission policies, search for the AmazonRedshiftQueryEditorV2ReadSharing managed policy.
  5. Select the policy and choose Attach policies.
  6. Modify the trust relationships for your role and add sts:TagSession. While in role select Trust relationships and click on Edit trust policy.When using session tags, trust policies for all roles connected to the IdP passing tags must have the sts:TagSession permission. For roles without this permission in the trust policy, the AssumeRole operation fails.
  7. Choose Update policy.
  8. Repeat these steps to attach the AmazonRedshiftQueryEditorV2ReadSharing managed policy to the ADFZ-Production role.

Limiting User access only to Query Editor

If you would like to limit users only access Query Editor then  update the policy redshift-marketing that you have created in Part 1 blog post as below.

Note: once updated, users will lose admin privileges such as create cluster.

Replace the region, account, and cluster parameters. This custom policy grants access to Amazon Redshift to get cluster credentials, create users, and allow users to join groups.

{
    "Version": "2012-10-17",
    "Statement": [
        {
            "Sid": "RedshiftClusterPermissions",
            "Effect": "Allow",
            "Action": [
                "redshift:GetClusterCredentials",
                "redshift:CreateClusterUser",
                "redshift:JoinGroup"
            ],
            "Resource": [
                "arn:aws:redshift:<region>:<account>:cluster:<cluster>,
                "arn:aws:redshift:<region>:<account>:dbuser:<cluster>/${aws:PrincipalTag/RedshiftDbUser}",
                "arn:aws:redshift:<region>:<account>:dbgroup:<cluster>/marketing",
                "arn:aws:redshift:<region>:<account>:dbgroup:<cluster>/sales",
                "arn:aws:redshift:<region>:<account>:dbname:<cluster>/${redshift:DBName}"
            ]
        }
    ]
}

There are a few important things to note:

  1. The group membership lasts only for the duration of the user session.
  2. There is no CreateGroup permission because groups need to be manually created and granted DB privileges.

Generate the SSO destination URL as the Amazon Redshift query editor v2 console

In this step, you construct the sign-in URL for the AD FS IdP to redirect users to the Amazon Redshift query editor v2 console. For instructions, refer to How to Use SAML to Automatically Direct Federated Users to a Specific AWS Management Console Page.

To provide a full SSO experience for the end-users, the SAML response can include an optional parameter called RelayState. This parameter contains the destination URL.

Microsoft provides a tool to help generate these SSO URLs for AD FS called the AD FS 2.0 RelayState Generator.

To build this URL, you need three pieces of information:

  • IdP URL string – The string is in the format https://ADFSSERVER/adfs/ls/idpinitiatedsignon.aspx. For this post, we use https://EC2AMAZ-F9TJOIC.adfsredshift.com/adfs/ls/IdpInitiatedSignOn.aspx.
  • Relying party identifier – For AWS, this is urn:amazon:webservices.
  • Relay state or target app – This is the AWS Management Console URL you want your authenticated users redirect to. In this case, it’s https://eu-west-1.console.aws.amazon.com/sqlworkbench/home?. For this post, we use the eu-west-1 Region, but you can adjust this as needed.

I followed the instructions in How to Use SAML to Automatically Direct Federated Users to a Specific AWS Management Console Page and used the AD FS 2.0 RelayState Generator to generate the URL shown in the following screenshot.

The following is an example of the final URL that you use to get authenticated and also get redirected to Amazon Redshift query editor v2 (this URL won’t work in your setup because it has been created specifically for an AD FS server in my account): https://EC2AMAZ-F9TJOIC.adfsredshift.com/adfs/ls/IdpInitiatedSignOn.aspx?RelayState=RPID%3Durn%253Aamazon%253Awebservices%26RelayState%3Dhttps%253A%252F%252Feu-west-1.console.aws.amazon.com%252Fsqlworkbench%252Fhome%253Fregion%253Deu-west-1%2523%252Fclient

You can now save this URL and use it from anywhere you can reach your AD FS server. After you enter the URL in a browser, you first authenticate to AD FS, then you’re redirected to the Amazon Redshift query editor v2 console.

Set up DB groups on Amazon Redshift cluster

In this step, you set up your Amazon Redshift database group. This step is necessary because when the user is authenticated, they have to be part of an Amazon Redshift DB group with proper permissions set on a schema or table (or view).

In Active Directory, the user Bob is part of two groups: Sales and Marketing. In your Amazon Redshift database, you have three database groups: Sales, Marketing, and Finance.

When user Bob logs in via federated authentication, the user assumes the Sales and Marketing database groups, so this user can query tables in both the Sales and Marketing schemas. Because the user Bob isn’t part of the Finance group, when they try to access the Finance schema, they receive a permission denied error.

The following diagram illustrates this configuration.

Complete the following steps to set up your DB groups:

  1. Connect as awsuser (a superuser).
  2. Create three database groups:
    CREATE GROUP sales;
    CREATE GROUP marketing;
    CREATE GROUP finance;

  3. Create three schemas:
    CREATE SCHEMA sales;
    CREATE SCHEMA marketing;
    CREATE SCHEMA finance;

  4. Create a table in each schema:
    CREATE TABLE IF NOT EXISTS marketing.employee
    (
    	n_empkey INTEGER   
    	,n_name CHAR(25)   
    	,n_regionkey INTEGER   
    	,n_comment VARCHAR(152)   
    )
    DISTSTYLE AUTO
     SORTKEY (n_empkey);
    
    CREATE TABLE IF NOT EXISTS sales.employee_sales
    (
    	n_empkey INTEGER   
    	,n_name CHAR(25)   
    	,n_regionkey INTEGER   
    	,n_comment VARCHAR(152)   
    )
    DISTSTYLE AUTO
     SORTKEY (n_empkey);
    
    
    CREATE TABLE IF NOT EXISTS finance.accounts
    (
    	account_id INTEGER   
    	,account_name CHAR(25)   
    	 
    )
    DISTSTYLE AUTO
     SORTKEY (account_id);

  5. Insert sample data into the three tables:
    INSERT INTO marketing.employee
    VALUES(1, 'Bob', 0, 'Marketing');
    
    INSERT INTO sales.employee_sales
    VALUES(1, 'John', 0, 'Sales');
    
    INSERT INTO finance.accounts
    VALUES(1, 'online company');

  6. Validate the data is available in the tables:
    Select * from marketing.employee;
    Select * from sales.employee_sales;
    Select * from finance.accounts;

You can now set up appropriate privileges for the sales, finance, and marketing groups. Groups are collections of users who are all granted privileges associated with the group. You can use groups to assign privileges by job function. For example, you can create different groups for sales, administration, and support, and give the users in each group the appropriate access to the data they require for their work. You can grant or revoke privileges at the group level, and those changes apply to all members of the group, except for superusers.

  1. Enter the following SQL queries to grant access to all tables in the sales schema to the sales group, access to all tables in the marketing schema to the marketing group, and access to all tables in the finance schema to the finance group:
ALTER DEFAULT PRIVILEGES IN SCHEMA sales
GRANT SELECT on TABLES to GROUP sales;
GRANT USAGE on SCHEMA sales to GROUP sales;
GRANT SELECT on ALL TABLES in SCHEMA sales to GROUP sales;

ALTER DEFAULT PRIVILEGES IN SCHEMA marketing
GRANT SELECT on TABLES to GROUP marketing;
GRANT USAGE on SCHEMA marketing to GROUP marketing;
GRANT SELECT on ALL TABLES in SCHEMA marketing to GROUP marketing;

ALTER DEFAULT PRIVILEGES IN SCHEMA finance
GRANT SELECT on TABLES to GROUP finance;
GRANT USAGE on SCHEMA finance to GROUP finance;
GRANT SELECT on ALL TABLES in SCHEMA finance to GROUP finance;

Access Amazon Redshift query editor v2 through federated authentication

Now that you have completed your SAML integration, deep link setup, and DB groups and access rights configuration, you can set up Amazon Redshift query editor v2 to use federated authentication with AD FS to connect from directly from the query editor interface.

  1. Navigate to the deep link URL you created earlier.
    You’re redirected to the AD FS login page.
  2. Sign in as [email protected].
    For this post, I accessed this URL from an Amazon EC2 machine, but you can access it from any location where you can reach the AD FS IdP.
    After AD FS successfully authenticates you, it redirects to the AWS SSO endpoint and posts the SAML assertion and RelayState parameter. Because you configured two IAM roles on the AWS side, you’re prompted to select a role.
  3. Select a role (for this example, ADFZ-Dev) and choose Sign In.

    AWS sends the sign-in URL that is based on the RelayState value back to your browser as a redirect. Your browser is redirected to the query editor v2 console automatically.
  4. Right-click your Amazon Redshift cluster (for this post, redshift-cluster-1) and choose Edit connection.

    The value for User name is automatically populated, and Federated Access is automatically selected.
  5. Choose Edit connection to save the connection and log in to the database.

    After you’re successfully logged in, you can browse the database objects in the left pane.
  6. Test the connection by running the following query:
    select * from stv_sessions;

The following screenshot shows the output.

The output shows that the user [email protected] was authenticated using AD FS. The user also joined the marketing and Sales groups as enforced by the AD FS PrincipalTag:RedshiftDbGroups claim rule and the policy associated with the ADFZ-Dev role, which the user assumes during this session.

Run queries to validate authorization through federated groups

In this final step, you validate how the groups and membership configured in AD are seamlessly integrated with Amazon Redshift database groups.

Run the following query against the marketing and sales schema:

select * from marketing.employee;
select * from sales.employee_sales;

The following screenshots shows the output:

The preceding images show that AD user Bob is part of the AD group RSDB-marketing and RSDB-sales, which are mapped to the DB groups marketing and sales. These DB groups have select access to the schemas marketing and sales and all tables in those schemas. Therefore, the user can successfully query the tables.

To run a query against the finance schema, enter the following code:

select * from finance.accounts;

The following screenshot shows the output.

The output shows that Bob is only part of the AD groups RSDB-marketing and RSDB-sales. Due to the way the claim rule is set up, Bob doesn’t have access to the database group finance, and therefore the query returns with a permission denied error.

Clean up

To avoid incurring future charges, delete the resources by deleting the CloudFormation stack. This cleans up all the resources from your AWS account that you set up in Part 1.

Conclusion

In this post, we demonstrated how to set up an AD FS server, configure different PrincipalTag attributes used for Amazon Redshift query editor v2, and generate an SSO URL with the query editor as the destination location. You then connected to the Amazon Redshift DB cluster using a database user with administrator privileges to set up DB groups and permissions, and used a federated user authentication with AD FS to run several queries. This solution enables you to control access to your Amazon Redshift database objects by using AD groups and memberships seamlessly.

If you have any feedback or questions, please leave them in the comments.


About the Authors

Sumeet Joshi is an Analytics Specialist Solutions Architect based out of New York. He specializes in building large-scale data warehousing solutions. He has over 16 years of experience in the data warehousing and analytical space.

Bhanu Pittampally is an Analytics Specialist Solutions Architect based out of Dallas. He specializes in building analytical solutions. His background is in data and analytics for over 14 years. His LinkedIn profile can be found here.

Erol Murtezaoglu, a Technical Product Manager at AWS, is an inquisitive and enthusiastic thinker with a drive for self-improvement and learning. He has a strong and proven technical background in software development and architecture, balanced with a drive to deliver commercially successful products. Erol highly values the process of understanding customer needs and problems, in order to deliver solutions that exceed expectations.

Yanis Telaoumaten is a Software Development Engineer at AWS. His passions are building reliable software and creating tools to allow other engineers to work more efficiently. In the past years, he worked on identity, security and reliability of Redshift services
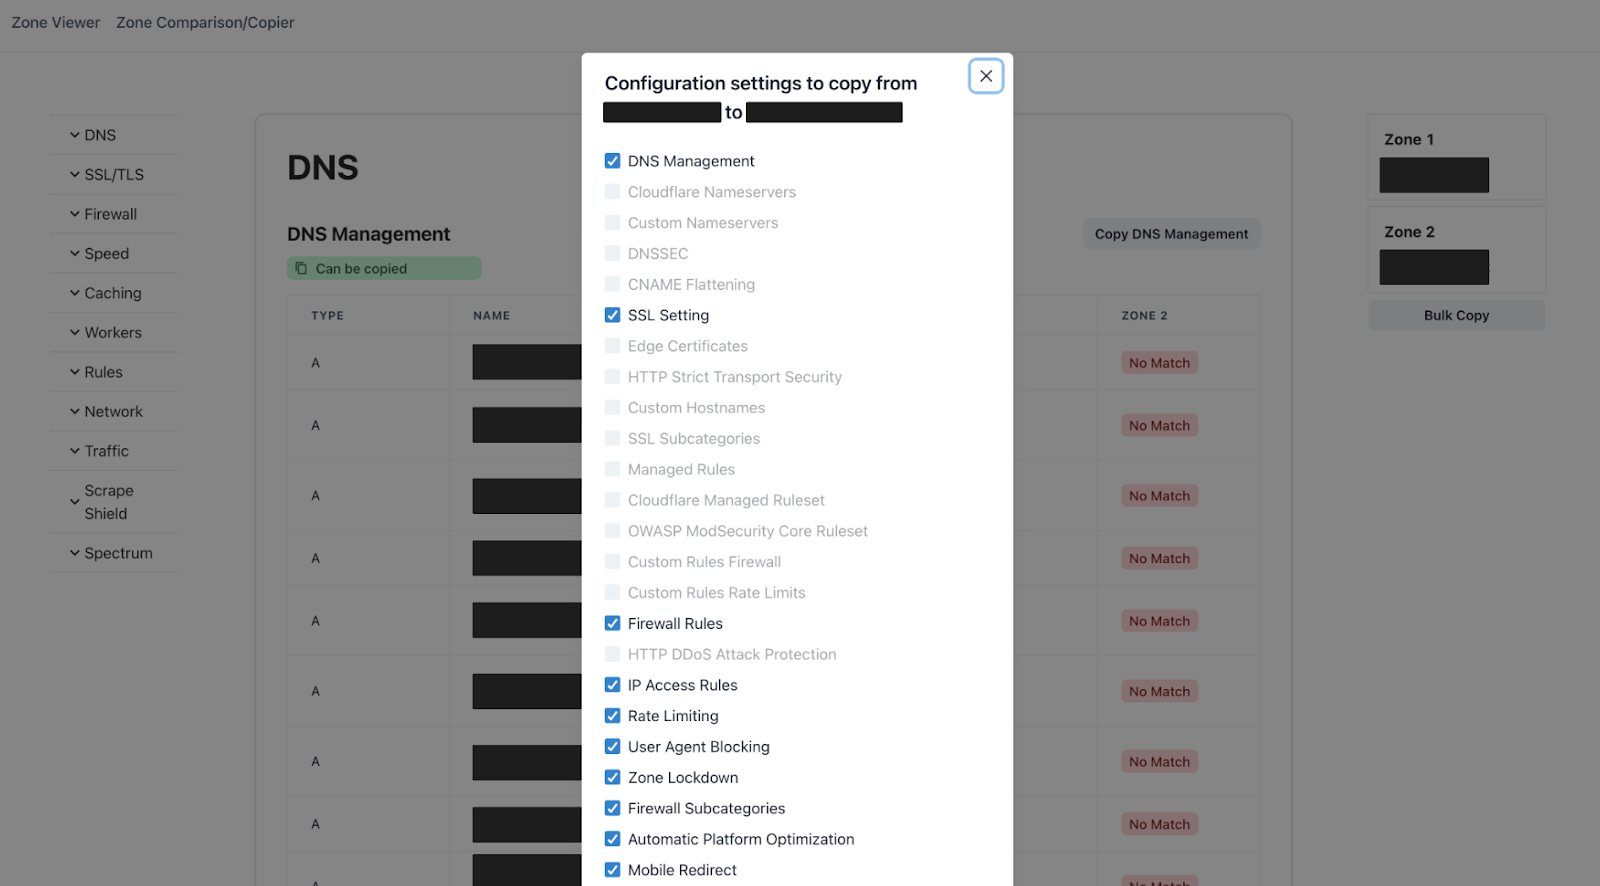
The collective thoughts of the interwebz