This post is written by Amr Ragab, Principal Solutions Architect, Amazon EC2.
AWS is excited to announce that the new Amazon Elastic Compute Cloud (Amazon EC2) DL1 instances are now generally available in US-East (N. Virginia) and US-West (Oregon). DL1 provides up to 40% better price performance for training deep learning models as compared to current generation GPU-based EC2 instances. The dl1.24xlarge instance type features eight Intel-Habana Gaudi accelerators, which are custom-built to train deep learning models. Each Gaudi accelerator has 32 GB of high bandwidth memory (HBM2) and a peer-to-peer bidirectional bandwidth of 100 Gbps RoCE, for a total bidirectional interconnect bandwidth of 700 Gbps per card. Further instance specifications are as follows:
Instance Size
vCPU
Instance Memory (GiB)
Gaudi Accelerators
Network Bandwidth (Gbps)
Total Accelerator Interconnect (Gbs)
Local Instance Storage
EBS Bandwidth (Gbps)
d1.24xlarge
96
768
8
4×100 Gbps
700
4x1TB NVMe
19
Instance Architecture
As the preceding instance architecture indicates, pairs of Gaudi accelerators (e.g., Gaudi0 and Gaudi1) are attached directly through a PCIe Gen3x16 link. Additionally, peer-to-peer networking via 100 Gbps RoCEv2 links – with seven active links per card – provides a torus configuration with a total of 700 Gbps of interconnect bandwidth per card. This topology is a separate interconnect outside of the two NUMA domains. Furthermore, the instance supports four EFA ENIs and 4x1TB of local NVMe SSD storage. We will provide a peer-direct driver over EFA, which will let you utilize high throughput, low latency peer-direct networking between accelerators across multiple instances to efficiently scale multi-node distributed training workloads.
Quick Start
Quickly get started with DL1 and SynapseAI SDK through with the following options:
After selecting an AMI, launch a dl1.24xlarge instance in either us-east-1 or us-west-2. To help identify in which availability zone(s) dl1.24xlarge is available, run the following command:
Once launched, you can connect to the instance over SSH (with the correct security group attached).
Habana Collectives Communication Library (HCL/HCCL)
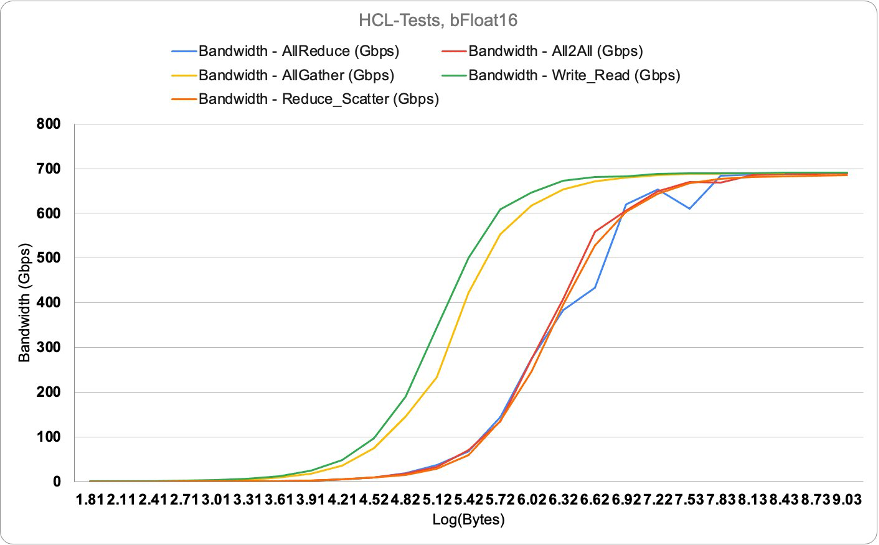
As part of the Habana SynapseAI SDK, Habana Gaudi’s use the HCCL library for handling the collectives between HPUs. Get more information on HCCL here. On DL1 through the HCL-tests, we can confirm close to 700 Gbps (689 Gbps) per card for the collectives tested as follows.
You can confirm these tests by cloning the github repo here.
Amazon EKS Quick Start
Support for DL1 on Amazon EKS is available today with Amazon EKS versions > 1.19. The following is a quick start to get up and running quickly with DL1.
The following dependencies will be needed:
eksctl – You need version 0.70.0+ of eksctl. kubectl – You use Kubernetes version 1.20 in this post.
Nodegroup configuration – save the following codeblock to a file called dl1-managed-ng.yaml. Replace the AMI ID in the code block with the AMI created earlier.
Once completed, you should see the Gaudi devices as an allocatable resource in your EKS cluster, presenting 8 Gaudi accelerators per DL1 node in the cluster.
You can find a more comprehensive list of ML models supported with performance data here. Support for containers with TensorFlow and Pytorch are also available. Furthermore, you can stay up-to-date with the operator support for TensorFlow and Pytorch.
CONCLUSION
We are excited to innovate on behalf of our customers and provide a diverse choice in ML accelerators with DL1 instances. The DL1 instances powered by Gaudi accelerators can provide up to 40% better price performance for training deep learning models as compared to current generation GPU-based EC2 instances. DL1 instances use the Habana SynapseAI SDK with framework support in Pytorch and TensorFlow. Additional future support for EFA with peer direct HPUs across nodes will also be supported. Now it’s time to go power up your ML workloads with Amazon EC2 DL1 instances.
Many organizations prefer SQL for data preparation because they already have developers for extract, transform, and load (ETL) jobs and analysts preparing data for machine learning (ML) who understand and write SQL queries. Amazon Athena is an interactive query service that makes it easy to analyze data in Amazon Simple Storage Service (Amazon S3) using standard SQL. Athena is serverless, so there is no infrastructure to manage, and you pay only for the queries that you run.
By default, Athena automatically writes SELECT query results in CSV format to Amazon S3. However, you might often have to write SELECT query results in non-CSV files such as JSON, Parquet, and ORC for various use cases. In this post, we walk you through the UNLOAD statement in Athena and how it helps you implement several use cases, along with code snippets that you can use.
Athena UNLOAD overview
CSV is the only output format used by the Athena SELECT query, but you can use UNLOAD to write the output of a SELECT query to the formats and compression that UNLOAD supports. When you use UNLOAD in a SELECT query statement, it writes the results into Amazon S3 in specified data formats of Apache Parquet, ORC, Apache Avro, TEXTFILE, and JSON.
Although you can use the CTAS statement to output data in formats other than CSV, those statements also require the creation of a table in Athena. The UNLOAD statement is useful when you want to output the results of a SELECT query in a non-CSV format but don’t require the associated table. For example, a downstream application might require the results of a SELECT query to be in JSON format, and Parquet or ORC might provide a performance advantage over CSV if you intend to use the results of the SELECT query for additional analysis.
In this post, we walk you through the following use cases for the UNLOAD feature:
Compress Athena query results to reduce storage costs and speed up performance for downstream consumers
Store query results in JSON file format for specific downstream consumers
Feed downstream Amazon SageMaker ML models that require files as input
When you’re using Athena to process and create large volumes of data, storage costs can increase significantly if you don’t compress the data. Furthermore, uncompressed formats like CSV and JSON require you to store and transfer a large number of files across the network, which can increase IOPS and network costs. To reduce costs and improve downstream big data processing application performance such as Spark applications, a best practice is to store Athena output into compressed columnar compressed file formats such as ORC and Parquet.
You can use the UNLOAD statement in your Athena SQL statement to create compressed ORC and Parquet file formats. In this example, we use a 3 TB TPC-DS dataset to find all items returned between a store and a website. The following query joins the four tables: item, store_returns, web_returns, and customer_address:
UNLOAD (
		select *
		from store_returns, item, web_returns, customer_address
		where sr_item_sk = i_item_sk and
		wr_item_sk = i_item_sk and
		wr_refunded_addr_sk = ca_address_sk
	) to 's3://your-bucket/temp/athenaunload/usecase1/' with (
		format = 'PARQUET',
		compression = 'SNAPPY',
		partitioned_by = ARRAY['ca_location_type']

	)
The resulting query output when Snappy compressed and stored in Parquet format resulted in a 62 GB dataset. The same output in a non-compressed CSV format resulted in a 248 GB dataset. The Snappy compressed Parquet format yielded a 75% smaller storage size, thereby saving storage costs and resulting in faster performance.
Use case 2: Store query results in JSON file format
Some downstream systems to Athena such as web applications or third-party systems require the data formats to be in JSON format. The JSON file format is a text-based, self-describing representation of structured data that is based on key-value pairs. It’s lightweight, and is widely used as a data transfer mechanism by different services, tools, and technologies. In these use cases, the UNLOAD statement with the parameter format value of JSON can unload files in JSON file format to Amazon S3.
The following SQL extracts the returns data for a specific customer within a specific data range against the 3 TB catalog_returns table and stores it to Amazon S3 in JSON format:
UNLOAD (
		select cr_returned_date_sk, cr_returning_customer_sk, cr_catalog_page_sk, cr_net_loss
		from catalog_returns
		where cr_returned_date_sk = 2450821 and cr_returning_customer_sk = 11026691
	) to 's3://your-bucket/temp/athenaunload/usecase2/' with (
		format = 'JSON', compression = 'NONE'
	)
By default, Athena uses Gzip for JSON and TEXTFILE formats. You can set the compression to NONE to store the UNLOAD result without any compression. The query result is stored as the following JSON file:
The query result can now be consumed by a downstream web application.
Use case 3: Feed downstream ML models
Analysts and data scientists rely on Athena for ad hoc SQL queries, data discovery, and analysis. They often like to quickly create derived columns such as aggregates or other features. These need to be written as files in Amazon S3 so a downstream ML model can directly read the files without having to rely on a table.
You can also parametrize queries using Athena prepared statements that are repetitive. Using the UNLOAD statement in a prepared statement provides the self-service capability to less technical users or analysts and data scientists to export files needed for their downstream analysis without having to write queries.
In the following example, we create derived columns and feature engineer for a downstream SageMaker ML model that predicts the best discount for catalog items in future promotions. We derive averages for quantity, list price, discount, and sales price for promotional items sold in stores where the promotion is not offered by mail or a special event. Then we restrict the results to a specific gender, marital, and educational status. We use the following query:
UNLOAD(
		Select i_item_id,
	        avg(ss_quantity) avg_sales,
	        avg(ss_list_price) avg_list_price,
	        avg(ss_coupon_amt) avg_coupon_amt,
	        avg(ss_sales_price) avg_sales_price
	 from store_sales, customer_demographics, date_dim, item, promotion
	 where cast(ss_sold_date_sk AS int) = d_date_sk and
	       ss_item_sk = i_item_sk and
	       ss_cdemo_sk = cd_demo_sk and
	       ss_promo_sk = p_promo_sk and
	       cd_gender = 'M' and
	       cd_marital_status = 'M' and
	       cd_education_status = '4 yr Degree' and
	       (p_channel_email = 'N' or p_channel_event = 'N') and
	       d_year = 2001
	 group by i_item_id
	 order by i_item_id
	) to 's3://your-bucket/temp/athenaunload/usecase3/' with (
		format = 'PARQUET',compression = 'SNAPPY'
	)
Use case 4: Simplify ETL pipelines with Step Functions
Step Functions is integrated with the Athena console to facilitate building workflows that include Athena queries and data processing operations. This helps you create repeatable and scalable data processing pipelines as part of a larger business application and visualize the workflows on the Athena console.
In this use case, we provide an example query result in Parquet format for downstream consumption. In this example, the raw data is in TSV format and gets ingested on a daily basis. We use the Athena UNLOAD statement to convert the data into Parquet format. After that, we send the location of the Parquet file as an Amazon Simple Notification Service (Amazon SNS) notification. Downstream applications can be notified via SNS to take further actions. One common example is to initiate a Lambda function that uploads the Athena transformation result into Amazon Redshift.
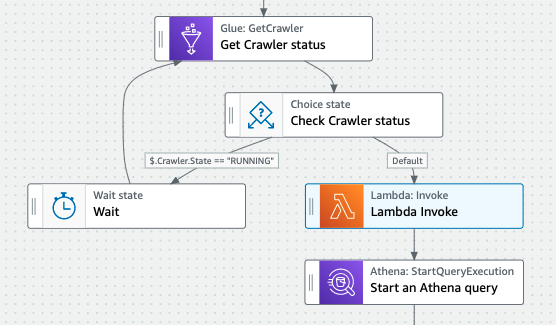
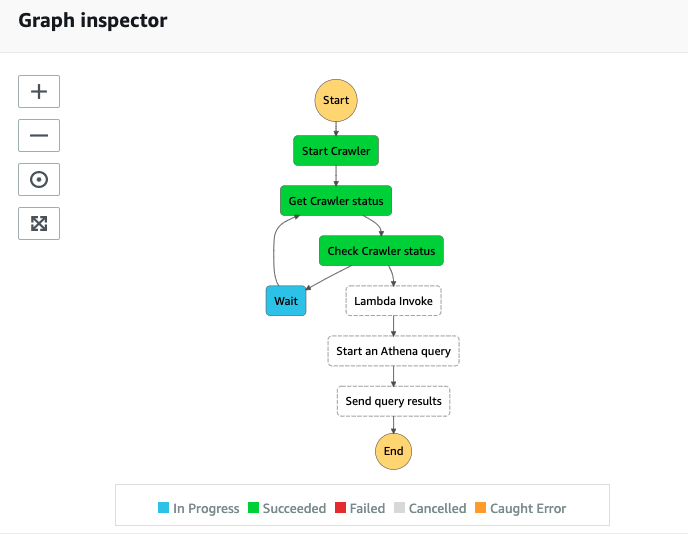
The following diagram illustrates the ETL workflow.
The workflow includes the following steps:
Start an AWS Glue crawler pointing to the raw S3 bucket. The crawler updates the metadata of the raw table with new files and partitions.
Invoke a Lambda function to clean up the previous UNLOAD result. This step is required because UNLOAD doesn’t write data to the specified location if the location already has data in it (UNLOAD doesn’t overwrite existing data). To reuse a bucket location as a destination for UNLOAD, delete the data in the bucket location, and then run the query again. Another common pattern is to UNLOAD data to a new partition with incremental data processing.
Start an Athena UNLOAD query to convert the raw data into Parquet.
Send a notification to downstream data consumers when the file is updated.
Set up resources with AWS CloudFormation
To prepare for querying both data sources, launch the provided AWS CloudFormation template:
Keep all the provided parameters and choose Create stack.
The CloudFormation template creates the following resources:
An Athena workgroup etl-workgroup, which holds the Athena UNLOAD queries.
An Athena output S3 bucket that holds the UNLOAD result and query metadata.
An AWS Glue database.
An AWS Glue crawler pointing to the data lake S3 bucket.
A LoadDataBucket Lambda function to load the Amazon Customer Reviews raw data into the S3 bucket.
A CleanUpS3Folder Lambda function to clean up previous Athena UNLOAD result.
An SNS topic to notify downstream systems when the UNLOAD is complete.
When the stack is fully deployed, navigate to the Outputs tab of the stack on the AWS CloudFormation console and note the value of the following resources:
AthenaWorkgroup
AthenaOutputBucket
CleanUpS3FolderLambda
GlueCrawler
SNSTopic
Build a Step Functions workflow
We use the Athena Workflows feature to build the ETL pipeline.
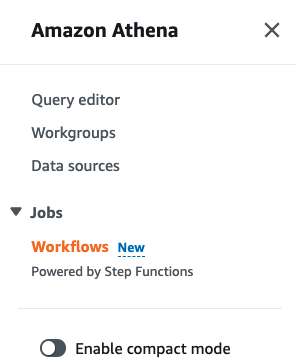
On the Athena console, under Jobs in the navigation pane, choose Workflows.
Under Create Athena jobs with Step Functions workflows, for Query large datasets, choose Get started.
Choose Create your own workflow.
Choose Continue.
The following is a screenshot of the default workflow. Compare the default workflow against the earlier ETL workflow we described. The default workflow doesn’t contain a Lambda function invocation and has an additional GetQueryResult step.
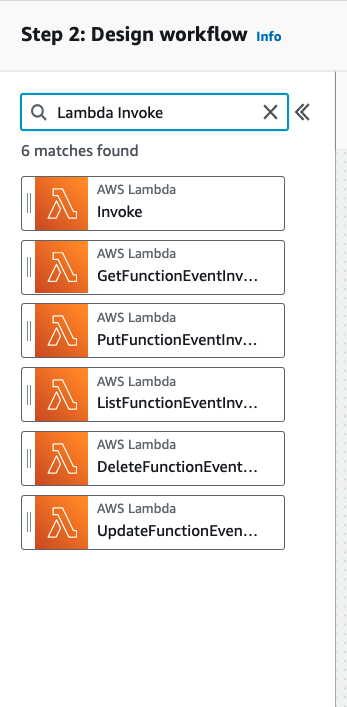
Next, we add a Lambda Invoke step.
Search for Lambda Invoke in the search bar.
Choose the Lambda:Invoke step and drag it to above the Athena: StartQueryExecution step.
Choose the Athena:GetQueryResults step (right-click) and choose Delete state.
Now the workflow aligns with the earlier design.
Choose the step Glue: StartCrawler.
In the Configuration section, under API Parameters, enter the following JSON (provide the AWS Glue crawler name from the CloudFormation stack output):
{
  "Name": "GlueCrawler"
}
Choose the step Glue: GetCrawler.
In the Configuration section, under API Parameters, enter the following JSON:
{
  "Name": "GlueCrawler"
}
Choose the step Lambda: Invoke.
In the Configuration section, under API Parameters, for Function name, choose the function -CleanUpS3FolderLambda-.
In the Payload section, enter the following JSON (include the Athena output bucket from the stack output):
In the Permissions section, choose Create new role.
Review the auto-generated permissions and choose Create state machine.
In the Add additional permissions to your new execution role section, choose Edit role in IAM.
Add permissions and choose Attach policies.
Search for the AWSGlueConsoleFullAccess managed policy and attach it.
This policy grants full access to AWS Glue resources when using the AWS Management console. Generate a policy based on access activity in production following the least privilege principle.
Test the workflow
Next, we test out the Step Functions workflow.
On the Athena console, under Jobs in the navigation pane, choose Workflows.
Under State machines, choose the workflow we just created.
Choose Execute, then choose Start execution to start the workflow.
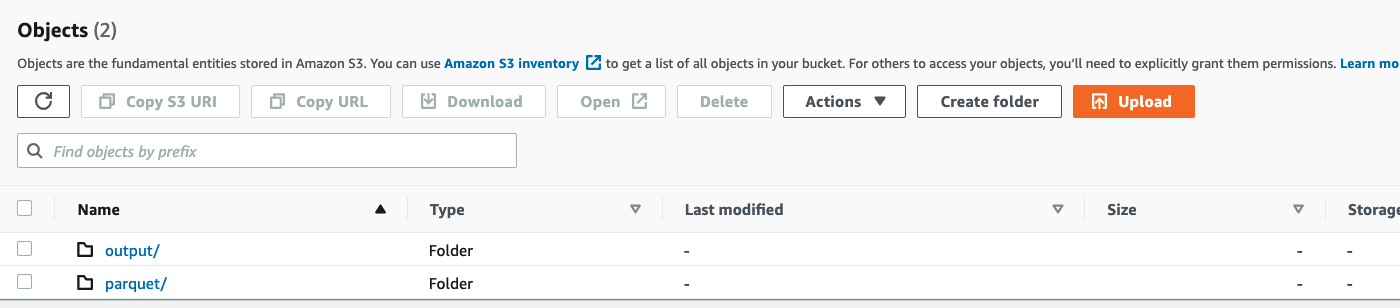
Wait until the workflow completes, then verify there are UNLOAD Parquet files in the bucket AthenaOutputBucket.
Clean up
To help prevent unwanted charges to your AWS account, delete the AWS resources that you used in this post.
On the Amazon S3 console, choose the -athena-unload-data-lake bucket.
Select all files and folders and choose Delete.
Enter permanently delete as directed and choose Delete objects.
Repeat these steps to remove all files and folders in the -athena-unload-output bucket.
On the AWS CloudFormation console, delete the stack you created.
Wait for the stack status to change to DELETE_COMPLETE.
Conclusion
In this post, we introduced the UNLOAD statement in Athena with some common use cases. We demonstrated how to compress Athena query results to reduce storage costs and improve performance, store query results in JSON file format, feed downstream ML models, and create and visualize ETL pipelines with Step Functions without creating a table.
Dylan Qu is a Specialist Solutions Architect focused on Big Data & Analytics with Amazon Web Services. He helps customers architect and build highly scalable, performant, and secure cloud-based solutions on AWS.
Harsha Tadiparthi is a Principal Solutions Architect focused on providing analytics and AI/ML strategies and solution designs to customers.
We are excited to announce another Project Jengo winner, and provide you with an important update on our fight against Sable Networks.
As a reminder, Project Jengo is Cloudflare’s efforts to flip the incentive structure that has encouraged the growth of patent trolls that seek to leverage overbroad and unpracticed patents to extract settlements from operating entities. We do this by refusing to settle patent cases brought against us by trolls, and instead, use a crowdsourced bounty to identify prior art that undermines the value of the troll’s patents, and not just the ones asserted against Cloudflare. This is the second iteration of Project Jengo, which is focused on a patent troll called Sable.
Even though the case against Sable has been active for over a year now, and we’ve already achieved some great results, we haven’t let up the pressure. We’re now also giving out Cloudflare T-shirts to new Project Jengo participants – all you need to do is submit prior art related to any of the Sable patents this year and the first 100 participants with a U.S. mailing address will receive a Cloudflare t-shirt.
$5,000 to Project Jengo’s round three winner!
We have already awarded $30,000 so far to winners of the Sable-focused Project Jengo. Last quarter, we awarded $10,000 to a former R&D engineer from Rennes, France who heard about Project Jengo through Hacker News. This round, we are excited to announce that we’ll be awarding Curtis Carter with $5,000!
In explaining why he participated in Project Jengo, Curtis said:
“As a maintainer/contributor for several open source projects (NuGetDefense being my main project), I’m always afraid some troll is going to attack one of my projects or a project I contribute to, and I may not be able to afford stopping it.”
That is why we started Project Jengo – to help support and protect innovators against malicious patent trolls. They hinder innovation of productive companies, and trade in fear as currency. As Curtis highlighted, the future is brighter without trolls:
“I think what you are doing is for the good of future generations, and I’m proud I got to participate even if I hadn’t won anything.”
Developers and innovators should not work in fear that trolls will target them for frivolous settlements. The patent system was built to promote innovation, not destroy it.
Not only does Curtis maintain NuGetDefense (a known vulnerability scanner for the .Net NuGet ecosystem), he’s also an engineer at Tech Friends, Inc., a software development company that he claims is the best employer for software developers in Northeast Arkansas. Impressively, he is self-taught.
“This was the first time in a while that I dug into old research documents and patents. Honestly, the people who originally put this stuff together were often brilliant, and their work is a joy to read (even if it’s a bit dry).”
As for his submission, Curtis Carter took on the challenge of finding prior art for United States Patent No. 8,085,775, an over broad patent that Sable owns and generally covers a mechanism for identifying, classifying, and controlling flows over a network.
Sable chose not to assert that patent against Cloudflare in our ongoing litigation. The prior art he found specifically addresses “methods, apparatuses and systems directed to a flow-based, traffic-classification-aware data collection and reporting system…” according to its abstract (US Patent No. 7,385,924). Furthermore, the prior art Curtis found pre-dates Sable’s patent by just over three years.
Curtis’s discovery has the added benefit of teaching many concepts to the narrower ’593 patent that Sable is asserting in the lawsuit. The narrower patent specifically addresses a method for identifying and penalizing misbehaving flows in a network. Side note: the patent is so old that its background description references some ancient applications:
“With the advent of file sharing applications such as KaZaA, Gnutella, BearShare, and Winny, the amount of peer-to-peer (P2P) traffic on the Internet has grown immensely in recent years.”
The prior art found by Curtis demonstrates TCP’s use of a sliding window scheme in which flow control is exercised over incoming flows. This is exactly the type of flow control both patents purport to cover. Furthermore, we were impressed with Curtis’ efforts to find prior art related to one of the narrower patents owned by Sable – well done, Mr. Carter!
As for what his discovery looks like, take a look at the first sentence of the patent’s abstract to get an idea.
Methods, apparatuses and systems directed to a flow-based, traffic-classification-aware data collection and reporting system that combine flow-based data collection technologies with enhanced traffic classification functionality to allow for analysis and reporting into aspects of network operations that prior art systems cannot provide.
If you haven’t won yet, don’t be discouraged. We have committed \$100,000 to this prior art search, so we still have \$65,000 to give out!
Sable has one less weapon in its arsenal as it admits defeat on a patent!
As part of our fight against Sable, we’ve been involved in a year-long process before the US Patent Office called Inter Partes Review (or “IPR”) with the goal of invalidating patents held by Sable Networks. You can check out our blog post from 2017 that outlines how the IPR process works. In our last blog post, we were pleased to announce that the Patent Office agreed to institute IPR on some of Sable’s patents. Today, we’re even happier to announce that we’ve officially killed off Sable’s ‘932 patent.
Once the Patent Office agrees to review the validity of a patent, the owner of the patent typically files a brief defending the validity of its patent (because if you own it you should think it’s valid, right?). But in this case, instead of explaining to the Patent Office why its ’932 patent is valid (or why Cloudflare is wrong), Sable simply decided to voluntarily cancel all claims of the patent. Since there is no claim left for the Patent Office to review, the IPR should be terminated soon, and we’ve effectively obtained the full relief requested!
This is a big win for anyone concerned with abuse of the patent system, including all the companies that Sable Networks previously attacked with this patent, including Dell, Cisco Systems, Hewlett Packard, Palo Alto Networks, Juniper Networks, Aruba Networks, amongst others. Yes, as absurd as it sounds, this patent has been used by Sable Networks to help squeeze out settlements from numerous productive technology companies. This victory means that Sable has one less patent to try to leverage in its attempts to abuse the patent system.
Coinbase announces that it will fight back against patent trolls
As we mentioned in our February blog post, part of our goal with Project Jengo is to spread the word that targets of these trolls can and should fight back and win. That’s why we were thrilled to see a recent blog post from Coinbase announcing that the company is following Cloudflare’s lead when it comes to pushing back on patent trolls. Trolls count on easy targets to fund their operations through settlements, so it’s great news that a major company like Coinbase has made clear that it will refuse to capitulate and will instead fight back.
Please keep your submissions coming!
We could not have gotten to this point without the help of the many Project Jengo participants. We have received hundreds of prior art references on Sable’s ten patents, and we have used many of those references in our efforts to kill off the patents that Sable asserted against us.
Thank you to everyone who has participated in Project Jengo for supporting the broader community and helping us take down a patent troll. If you haven’t participated yet, please consider submitting to our prior art contest.
“Hardware poisoning” is a mechanism for detecting and handling memory
errors in a running system. When a particular range of memory ceases to
remember correctly, it is “poisoned” and further accesses to it will
generate errors. The kernel has had support for
hardware poisoning for over a decade, but that doesn’t mean it can’t be
improved. At the 2022 Linux Storage,
Filesystem, Memory-management and BPF Summit, Yang Shi discussed the
challenges of dealing with hardware poisoning when it affects memory used
for the page cache.
Get your copy of Rapid7’s first comic: XDR vs. Exploito. Available now!
We’re all more connected than ever, and security practitioners keep everyone – governments, organizations, businesses, and 4.95 billion people – as safe as they can be.
“XDR vs Exploito” isn’t “Dr. Strange and the Multiverse of Madness” with a $200 million Marvel Comics budget – but it’s a laugh. And it puts security practitioners in the pantheon of greats like Spidey. Let’s be real, that’s the work you do (and we do too).
The effect the comic book had on us, as a thing we worked on, was refreshing. The Mayo Clinic says a little laugh enhances your intake of oxygen-rich air, reduces physical symptoms of stress, and increases the endorphins released by the brain. We say bring that on. You?
The story
Our CISO Adira Adama has tangled with the evil Exploito before, sometimes as her mild-mannered self, and sometimes as her superhero alter ego. Now, the two match wits again at Exploito’s next target – and Adira’s new job – where she plans to deploy InsightIDR, Rapid7’s unified SIEM and XDR.
But first, Adira confronts chaos: a hodgepodge of legacy tools, a burnt out SOC team, and nervous executives who’ll turn on her if she stumbles.
Security updates have been issued by Debian (firefox-esr), Fedora (firefox, java-1.8.0-openjdk, java-11-openjdk, java-17-openjdk, java-latest-openjdk, recutils, suricata, and zchunk), Oracle (firefox and kernel), Red Hat (firefox), Scientific Linux (firefox), Slackware (mozilla, openssl, and seamonkey), SUSE (apache2-mod_auth_mellon, libvirt, and pgadmin4), and Ubuntu (dpdk, mysql-5.7, networkd-dispatcher, openssl, openssl1.0, sqlite3, and twisted).
Cloudflare is reporting a large DDoS attack against an unnamed company “operating a crypto launchpad.”
While this isn’t the largest application-layer attack we’ve seen, it is the largest we’ve seen over HTTPS. HTTPS DDoS attacks are more expensive in terms of required computational resources because of the higher cost of establishing a secure TLS encrypted connection. Therefore it costs the attacker more to launch the attack, and for the victim to mitigate it. We’ve seen very large attacks in the past over (unencrypted) HTTP, but this attack stands out because of the resources it required at its scale.
The attack only lasted 15 seconds. No word on motive. Was this a test? Or was that 15-second delay critical for some other fraud?
There is a lot of work going on right now on speeding up Python; Kevin
Modzelewski gave a presentation at PyCon 2022 on some of that
work. Much of it has implications for Python programmers in terms of how
to best take advantage of these optimizations in their code. He gave an
overview of some of the projects, the kinds of optimizations being worked
on, and provided some benchmarks to give a general idea of how much faster
various Python implementations are getting—and which operations are most affected.
In April, we experienced three distinct incidents resulting in significant impact and degraded state of availability for Codespaces and GitHub Packages.
April 01 7:07 UTC (lasting 5 hours and 32 minutes)
Our alerting detected an increase in failures to create new Codespaces and start existing stopped Codespaces in the US West region. We immediately updated the GitHub status page and began to investigate.
Upon further investigation, we determined that some secrets that are used by the Codespaces service had expired. Codespaces maintains warm pools of resources to protect our users from intermittent failures in our dependent services. However, in the US West region, those pools were empty of resources due to the expired secret. In this case, we didn’t have an early enough warning on pools reaching low thresholds and didn’t have time to react until we ran out of capacity. As we worked to mitigate the incident, the pools in other regions also emptied due to the expired secret, and those regions began to see failures as well.
A limited number of GitHub engineers had access to rotate the secret, and communication issues delayed the start of the secret refresh process. The expired secret was eventually refreshed and rolled out to all regions, and the service was returned to full operation.
To prevent this failure pattern in the future, we now verify resources that expire and have monitors in place that alert well in advance if pool resources are not being maintained. We’ve also added monitors to notify us earlier when we approach resource exhaustion limits. In addition, we’ve initiated migrating the service to use a mechanism that doesn’t rely on secrets or the need to rotate credentials.
April 14 20:35 UTC (lasting 4 hours and 53 minutes)
We are still investigating the contributing factors and will provide a more detailed update in the May Availability Report, which will be published the first Wednesday of June. We will also share more about our efforts to minimize the impact of future incidents.
April 25 8:59 UTC (lasting 5 hours and 8 minutes)
During this incident, our alerting systems detected increased CPU utilization on one of the GitHub Packages Registry databases, which started approximately one hour before any customer impact occurred. The threshold for this alert was relatively low, and it was not a paging alert, so we did not immediately investigate. CPU continued to rise on the database causing the Package Registry to start responding to requests with internal server errors, eventually causing customer impact. This increased activity was due to a high volume of the “Create Manifest” command used in an unexpected manner.
The throttling criteria configured at the database level wasn’t enough to limit the above command, and this caused an outage for anyone using the GitHub Packages Registry. Users were unable to push or pull packages, as well as being unable to access the packages UI or the repository landing page.
After investigating, we determined there was a performance bug related to the high volume of “Create Manifest” commands. In order to limit impact and restore normal operation, we blocked the activity causing this problem. We are actively following up on this issue by improving the rate limiting in packages and fixing the performance problem that was uncovered. We’ve also modified database alerting thresholds and severity so we get alerted to unexpected issues more quickly (rather than after customer impact).
During this incident, we also discovered that the repository home page has a hard dependency on the packages infrastructure. When the package registry is down, the home pages for repositories that list packages also fail to load. We decoupled the package listing from the repository home page, but that required manual intervention during the outage. We are working on a fix that loosely binds the packages listing, so if it fails, it does not take down the repository home pages for repositories that list packages.
In summary
We will continue to keep you updated on the progress and investments we’re making to ensure the reliability of our services. Please follow our status page for real-time updates. To learn more about what we’re working on, check out the GitHub Engineering Blog.
The Internet is not only a human right according to the United Nations, and a way to get information, but it has also become an important element in geopolitical conflicts, like the war going on in Ukraine. We have previously written about Ukrainians moving westward to escape the war and Internet outages in the country, but also about the importance of the open Internet in Russia.
Over this past week, we observed an outage in the occupied city of Kherson, south Ukraine, coupled with an apparent shift in who controls the Internet within the region. First, let’s give some context and show what we saw.
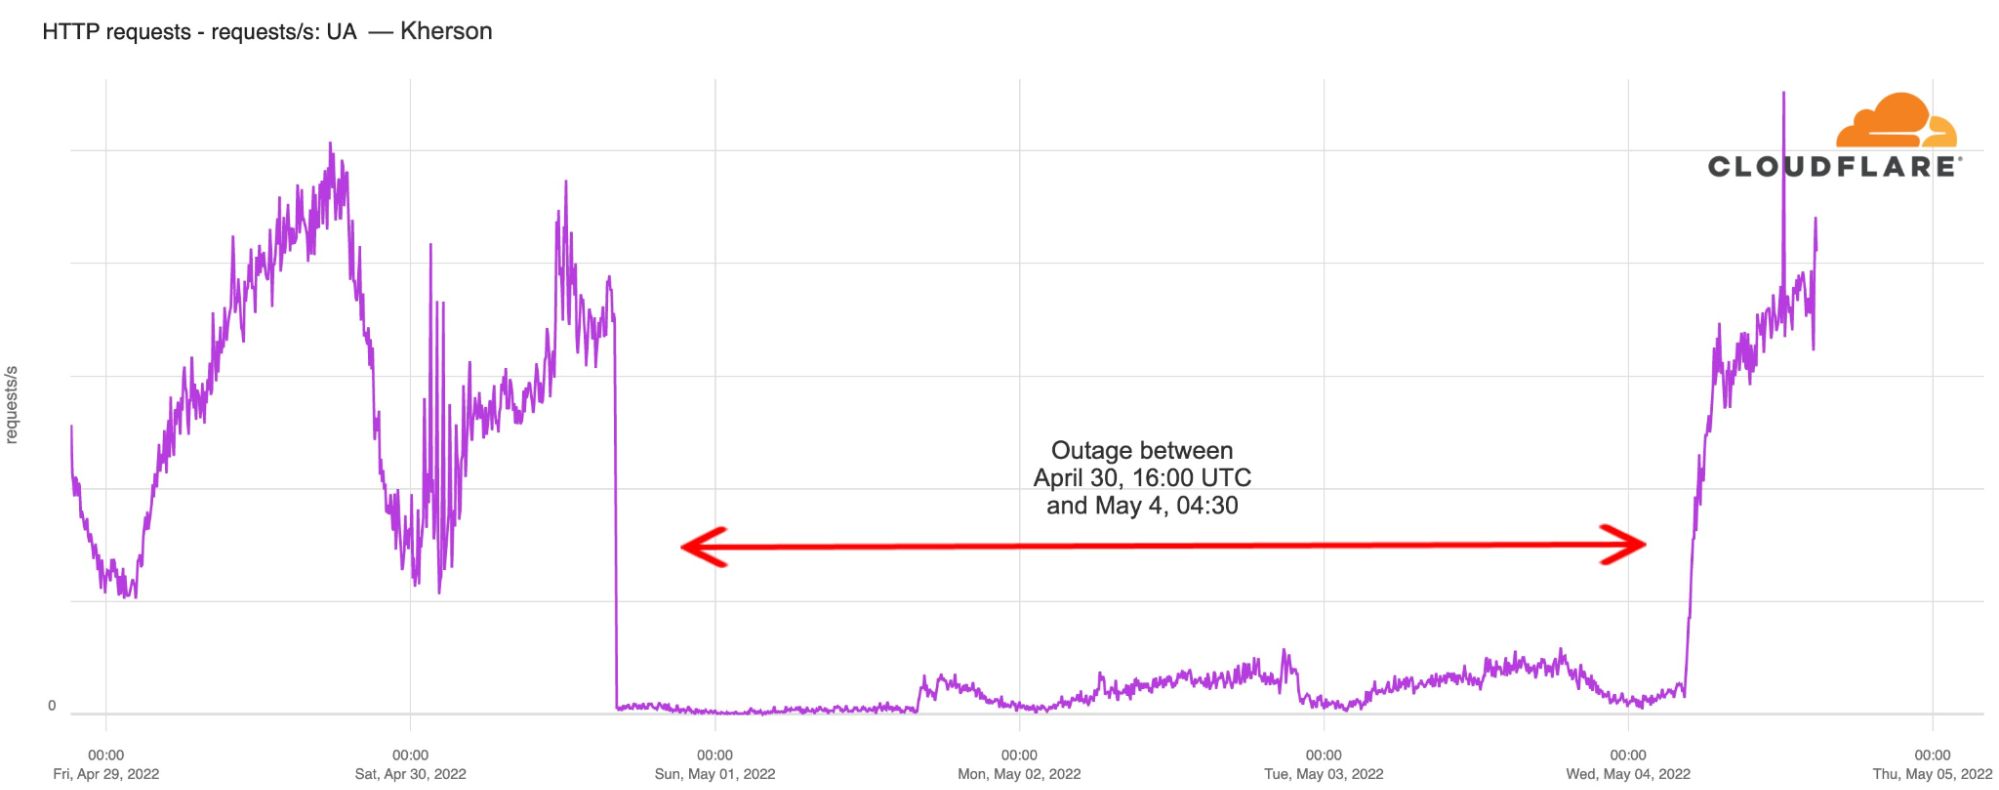
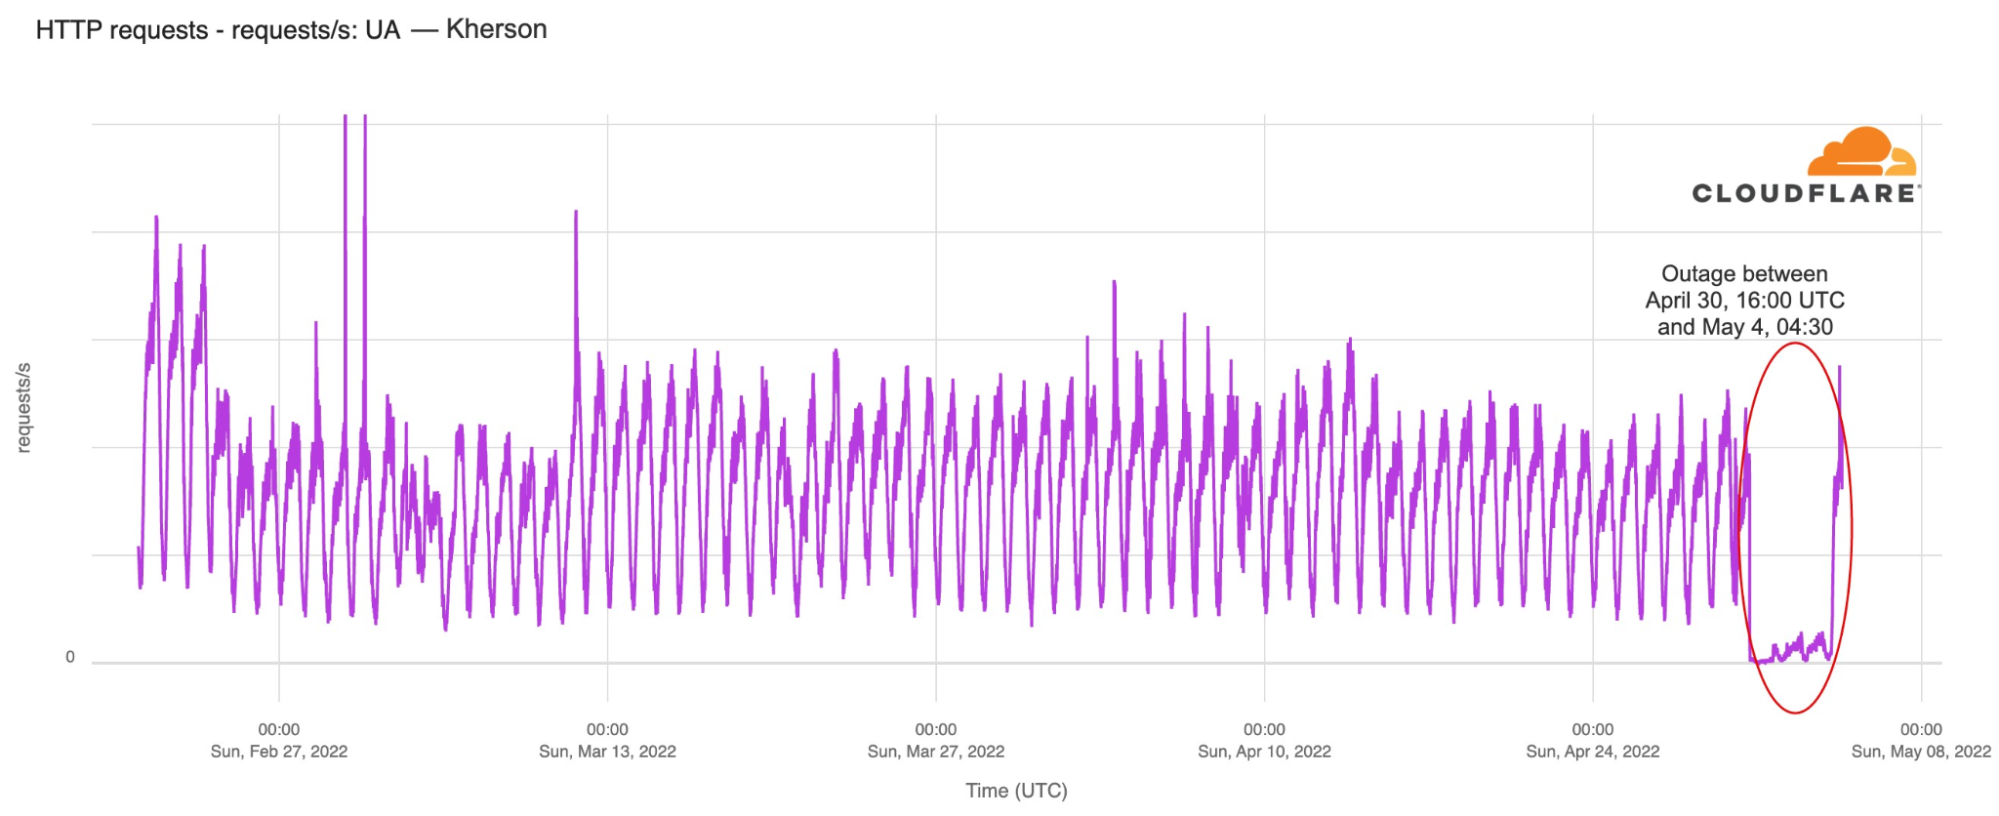
The Russian-occupied Kherson (a city of 280,000 people) experienced an Internet outage on Saturday, April 30, 2022, that began just after 16:00 UTC. The outage lasted until Wednesday, May 4, with traffic starting to return around 04:30 UTC traffic.
In the chart below, we can see that there was a 43% decrease in traffic from Kherson from February 23 to 24, after the war started. However, this weekend’s outage is the most significant disruption to Internet traffic in Kherson since the start of the war.
According to Ukraine’s vice Prime-Minister, Mykhailo Fedorov, and also the State Service of Special Communications and Information Protection, on Wednesday morning, May 4, “the communication cut off by the occupiers in Kherson and Kherson region was restored” using “backup power channels”. The reasons presented for the lack of communication “were interruptions of fiber-optic trunk lines and disconnection from the power supply of equipment of operators in the region”.
Yuriy Shchyhol, head of the organization, also said during a briefing that the occupiers had connected Ukrainian Internet users to the Russian network by switching fiber-optic lines and communication stations. “This is a gross violation of international law. We have already appealed to the International Telecommunication Union to impose sanctions on the Russian Federation”, he explained.
Shift in routing
Around the time that the outage referenced above began, we also observed a shift in routing for the IPv4 prefix announced by AS47598 (Khersontelecom). As shown in the table below, prior to the outage, it reached the Internet through several other Ukrainian network providers, including AS12883, AS3326, and AS35213. However, a day later, its routing path now showed a Russian network, AS201776 (Miranda) as the upstream provider. The path through Miranda also includes AS12389 (Rostelecom), which bills itself as “the largest digital services provider in Russia”. This aligns with the claims noted above about connecting Ukrainian Internet users to the Russian network.
Peer AS
Last Update
AS Path
AS1299 (TWELVE99 Arelion, fka Telia Carrier)
5/1/2022 16:02:26
1299 12389 201776 47598
AS6777 (AMS-IX-RS)
4/28/2022 11:23:33
12883 47598
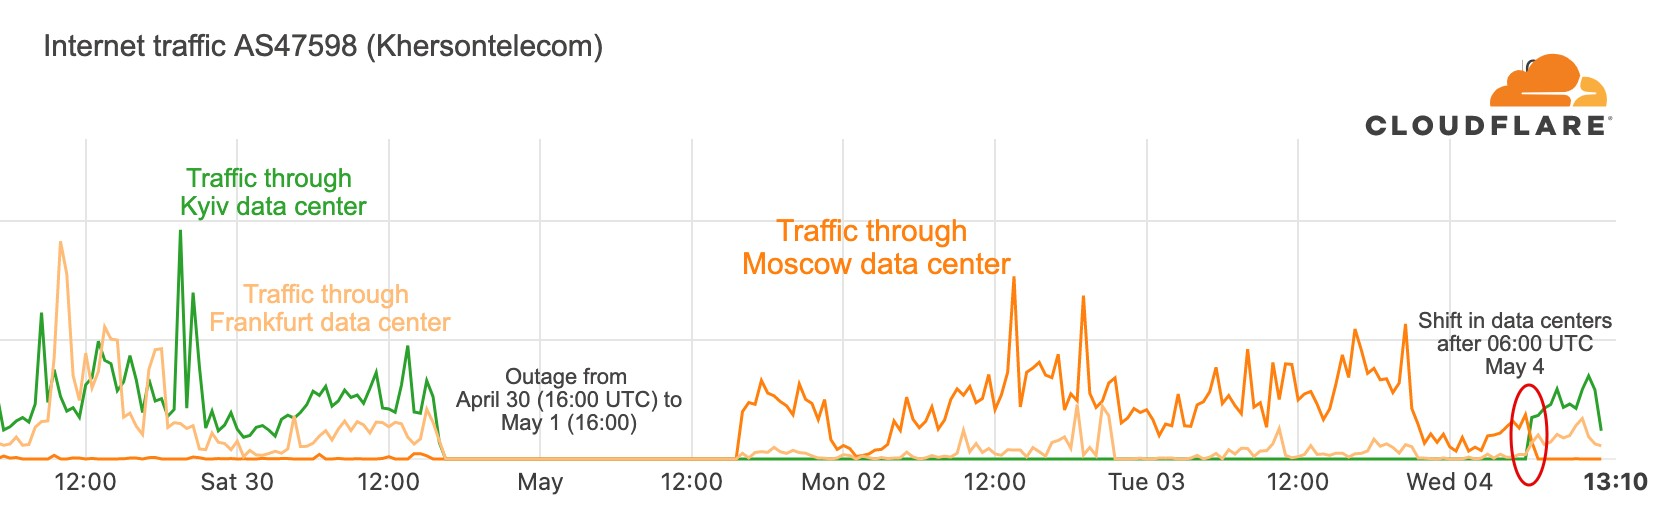
Because Cloudflare uses Anycast to route content requests to data centers on our network, routing changes such as this one can impact data center selection. This is clearly evident in the graph below. Prior to the outage, when Khersontelecom reached the Internet through other Ukrainian providers, requests from the network were handled by Cloudflare data centers in Kyiv, Ukraine and Frankfurt, Germany. On May 1, after the Russian network began to route traffic for Khersontelecom, requests were sent to our Moscow data center.
These requests continued to be handled by our Moscow data center for approximately three days. However, the graph also shows that traffic started being handled again by the Kyiv and Frankfurt data centers, with the Moscow data center no longer in the mix, around 06:00 UTC on May 4. This aligns with the observed update to the routing path for AS47598 shown in the table below – it no longer had Russian networks as upstream providers, but instead returned to reaching the Internet through other Ukrainian networks.
Peer AS
Last Update
AS Path
AS174 (COGENT-174)
5/4/2022 05:56:27
174 3326 3326 3326 47598
AS1273 (CW Vodafone Group PLC)
5/4/2022 03:11:25
1273 12389 201776 47598
Conclusion
As we saw, not only was there an Internet outage in the Kherson region, but there was also a shift in routing at least in one Kherson network that, for a few days, left traffic passing through Russian networks (along with all the restrictions and limitations, such as content blocking, such an arrangement could potentially have).
Availability of and control over physical resources have always been a key focus of war, but it is now clear that Internet resources now hold similar importance during times of conflict. This is also demonstrated by what happened to the Internet in Crimea after the annexation of 2014, as explained in-depth in this 2020 study.
This is a guest blog post co-written by Tal Knopf at Coralogix.
Digital data is expanding exponentially, and the existing limitations to store and analyze it are constantly being challenged and overcome. According to Moore’s Law, digital storage becomes larger, cheaper, and faster with each successive year. The advent of cloud databases is just one example of how this is happening. Previous hard limits on storage size have become obsolete since their introduction.
In recent years, the amount of available data storage in the world has increased rapidly, reflecting this new reality. If you took all the information just from US academic research libraries and lumped it together, it would add up to 2 petabytes.
Coralogix has worked with AWS to bring you a solution to allow for the flawless integration of high volumes of data with the Coralogix platform for analysis, using Amazon Kinesis Data Firehose.
Kinesis Data Firehose and Coralogix
Kinesis Data Firehose delivers real-time streaming data to destinations like Amazon Simple Storage Service (Amazon S3), Amazon Redshift, or Amazon OpenSearch Service (successor to Amazon Elasticsearch Service), and now supports delivering streaming data to Coralogix. There is no limit on the number of delivery streams, so you can use it to get data from multiple AWS services.
Kinesis Data Firehose provides built-in, fully managed error handling, transformation, conversion, aggregation, and compression functionality, so you don’t need to write applications to handle these complexities.
Coralogix is an AWS Partner Network (APN) Advanced Technology Partner with AWS DevOps Competency. The platform enables you to easily explore and analyze logs to gain deeper insights into the state of your applications and AWS infrastructure. You can analyze all your AWS service logs while storing only the ones you need, and generate metrics from aggregated logs to uncover and alert on trends in your AWS services.
Solution overview
Imagine a pipe flowing with data—messages, to be more specific. These messages can contain log lines, metrics, or any other type of data you want to collect.
Clearly, there must be something pushing data into the pipe; this is the provider. There must also be a mechanism for pulling data out of the pipe; this is the consumer.
Kinesis Data Firehose makes it easy to collect, process, and analyze real-time, streaming data by grouping the pipes together in the most efficient way to help with management and scaling.
It offers a few significant benefits compared to other solutions:
Integrates flawlessly – Most AWS services use Amazon CloudWatch by default to collect logs, metrics, and additional events data. CloudWatch logs can easily be sent using the Firehose delivery stream.
Flexible with minimum maintenance – To configure Kinesis Data Firehose with the Coralogix API as a destination, you only need to set up the authentication in one place, regardless of the amount of services or integrations providing the actual data. You can also configure an S3 bucket as a backup plan. You can back up all log events or only those exceeding a specified retry duration.
Scale, scale, scale – Kinesis Data Firehose scales up to meet your needs with no need for you to maintain it. The Coralogix platform is also built for scale and can meet all your monitoring needs as your system grows.
Prerequisites
To get started, you must have the following:
A Coralogix account. If you don’t already have an account, you can sign up for one.
A Coralogix private key.
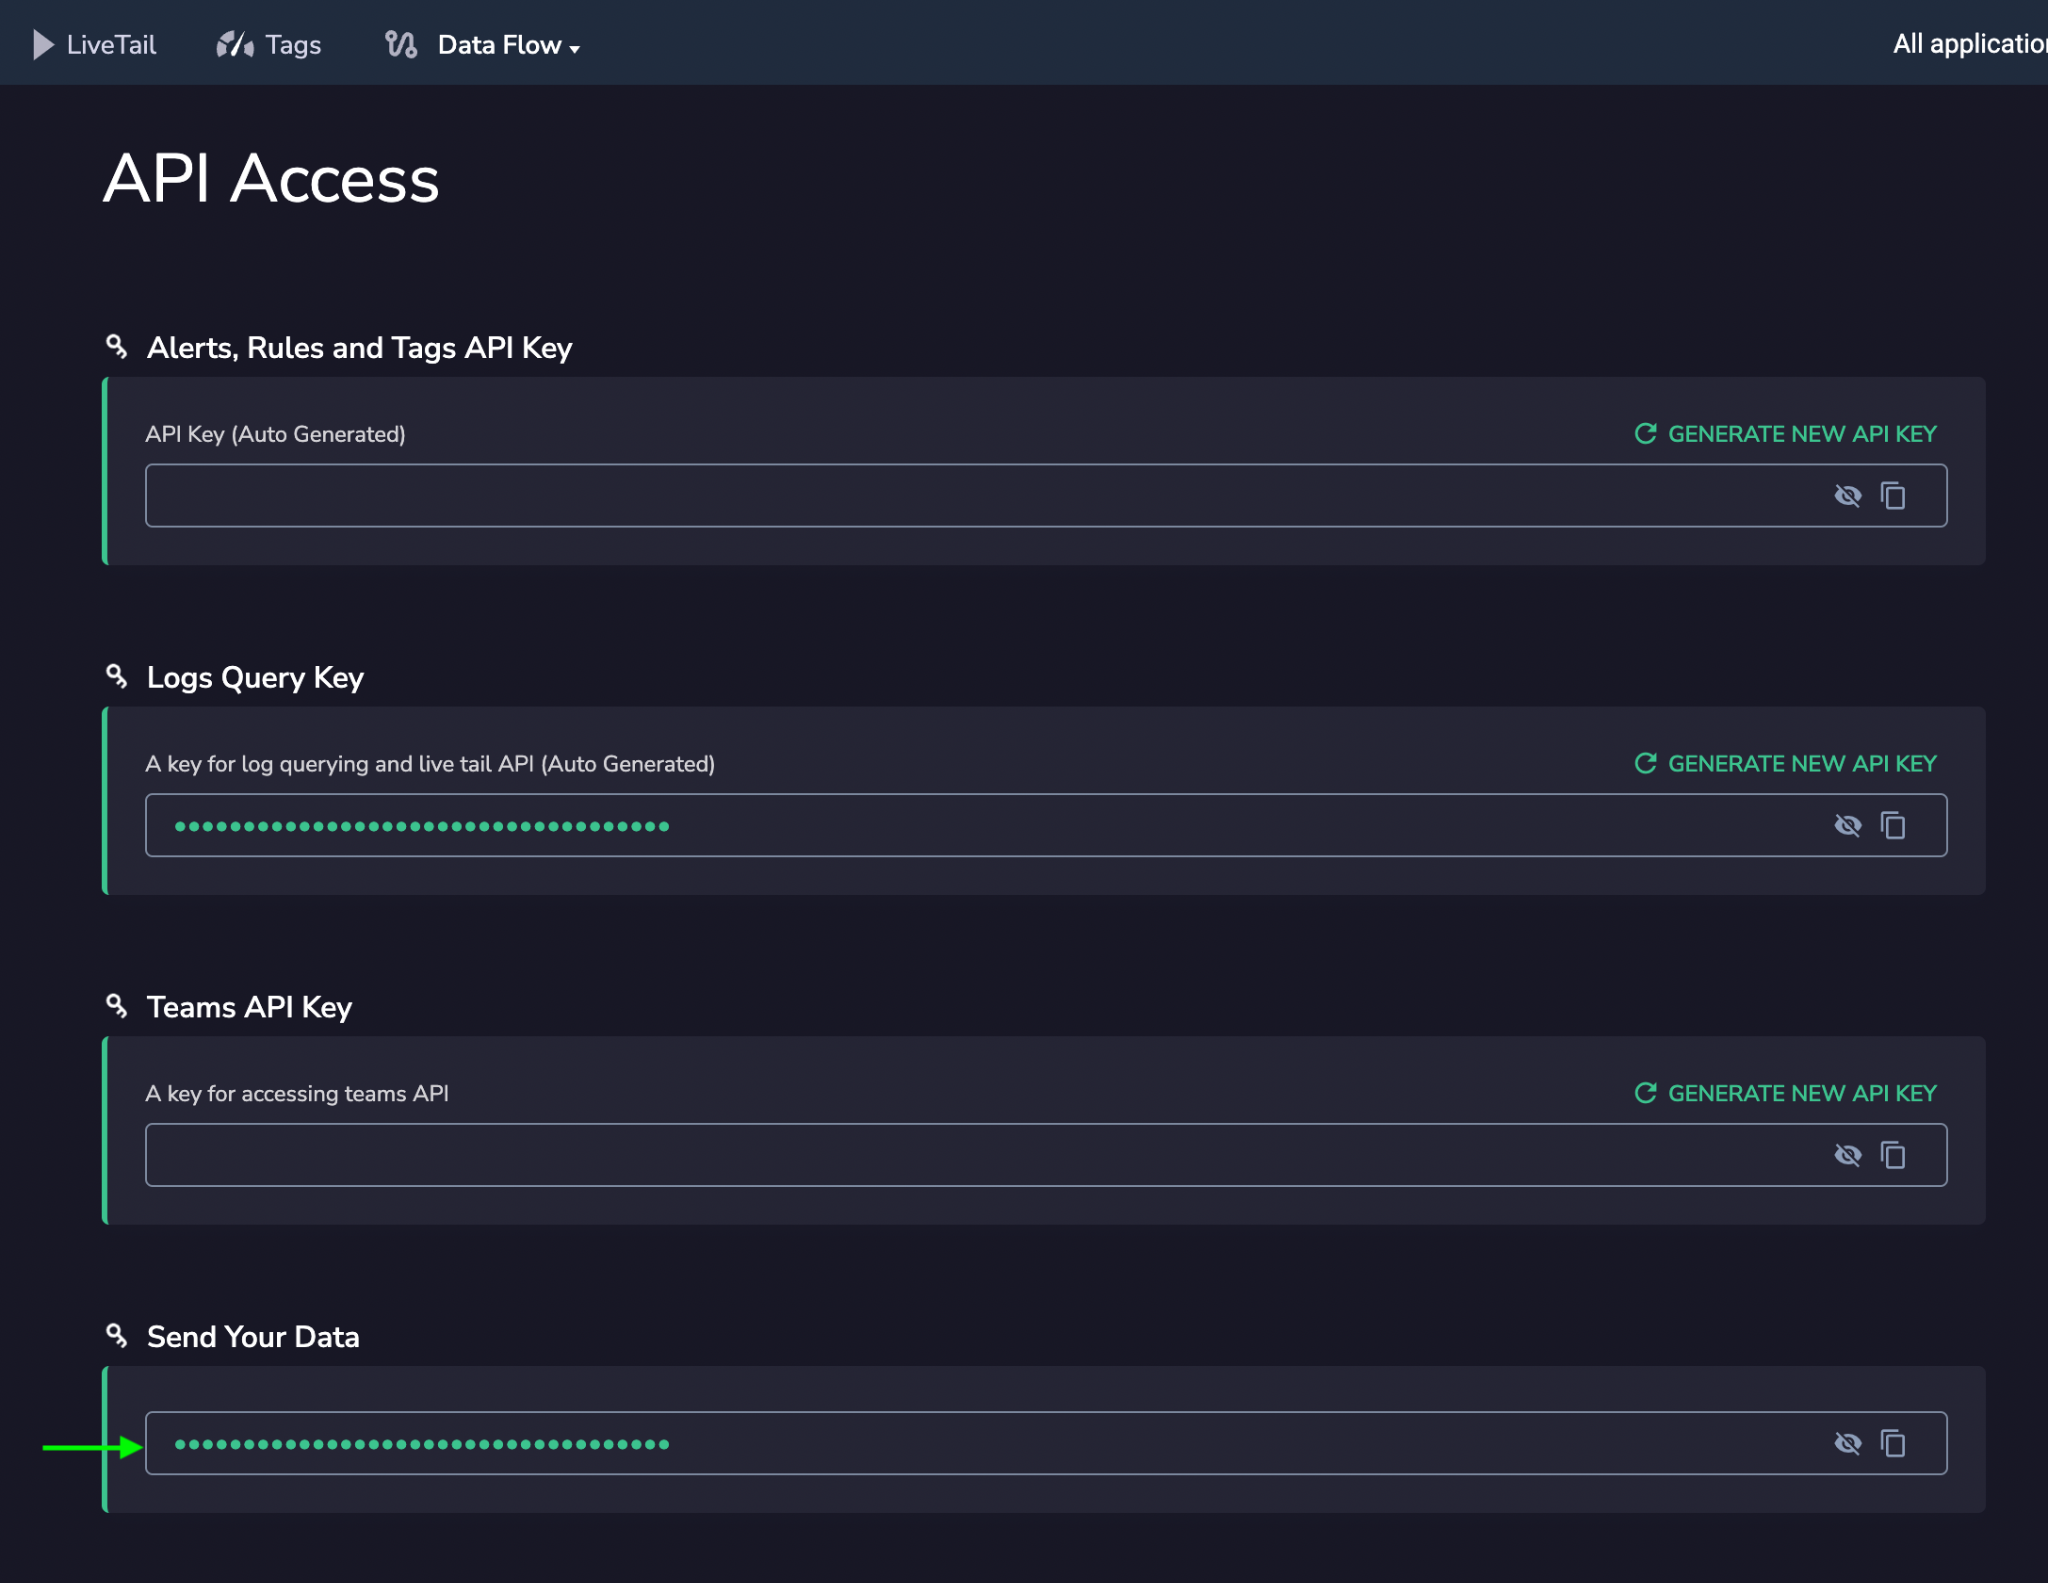
To find your key, in your Coralogix account, choose API Keys on the Data Flow menu.
Locate the key for Send Your Data.
Set up your delivery stream
To configure your deliver stream, complete the following steps:
On the Kinesis Data Firehose console, choose Create delivery stream.
Under Choose source and destination, for Source, choose Direct PUT.
For Destination, choose Coralogix.
For Delivery stream name¸ enter a name for your stream.
Under Destination settings, for HTTP endpoint name, enter a name for your endpoint.
For HTTP endpoint URL, enter your endpoint URL based on your Region and Coralogix account configuration.
For Access key, enter your Coralogix private key.
For Content encoding¸ select GZIP.
For Retry duration, enter 60.
To override the logs applicationName, subsystemName, or computerName, complete the optional steps under Parameters.
For Key, enter the log name.
For Value, enter a new value to override the default.
For this post, leave the configuration under Buffer hints as is.
In the Backup settings section, for Source record in Amazon S3, select Failed data only (recommended).
For S3 backup bucket, choose an existing bucket or create a new one.
Leave the settings under Advanced settings as is.
Review your settings and choose Create delivery stream.
Logs subscribed to your delivery stream are immediately sent and available for analysis within Coralogix.
Conclusion
Coralogix provides you with full visibility into your logs, metrics, tracing, and security data without relying on indexing to provide analysis and insights. When you use Kinesis Data Firehose to send data to Coralogix, you can easily centralize all your AWS service data for streamlined analysis and troubleshooting.
To get the most out of the platform, check out Getting Started with Coralogix, which provides information on everything from parsing and enrichment to alerting and data clustering.
About the Authors
Tal Knopf is the Head of Customer DevOps at Coralogix. He uses his vast experience in designing and building customer-focused solutions to help users extract the full value from their observability data. Previously, he was a DevOps engineer in Akamai and other companies, where he specialized in large-scale systems and CDN solutions.
Ilya Rabinov is a Solutions Architect at AWS. He works with ISVs at late stages of their journey to help build new products, migrate existing applications, or optimize workloads on AWS. His ares of interest include machine learning, artificial intelligence, security, DevOps culture, CI/CD, and containers.
Сайтът за разследваща журналистика “Биволъ” осъди министъра на иновациите и растежа Даниел Лорер в Бургаския административен съд (АСБ). Решението е без право на обжалване. Това се случи 4 месеца, след…
I recently wrote a blog post on injection-type vulnerabilities and how they were knocked down a few spots from 1 to 3 on the new OWASP Top 10 for 2022. The main focus of that article was to demonstrate how stack traces could be — and still are — used via injection attacks to gather information about an application to further an attacker’s goal. In that post, I skimmed over one of my all time favorite types of injections: cross-site scripting (XSS).
In this post, I’ll cover this gem of an exploit in much more depth, highlighting how it has managed to adapt to the newer environments of today’s modern web applications, specifically the API and Javascript Object Notation (JSON).
I know the term API is thrown around a lot when referencing web applications these days, but for this post, I will specifically be referencing requests made from the front end of a web application to the back end via ajax (Asynchronous JavaScript and XML) or more modern approaches like the fetch method in JavaScript.
Before we begin, I’d like to give a quick recap of what XSS is and how a legacy application might handle these types of requests that could trigger XSS, then dive into how XSS still thrives today in modern web applications via the methods mentioned so far.
What is cross-site scripting?
There are many types of XSS, but for this post, I’ll only be focusing on persistent XSS, which is sometimes referred to as stored XSS.
XSS is a type of injection attack, in which malicious scripts are injected into otherwise benign and trusted websites. XSS attacks occur when an attacker uses a web application to execute malicious code — generally in the form of a browser-side script like JavaScript, for example — against an unsuspecting end user. Flaws that allow these attacks to succeed are quite widespread and occur anywhere a web application accepts an input from a user without sanitizing, validating, escaping, or encoding it.
Because the end user’s browser has no way to know not to trust the malicious script, the browser will execute the script. Because of this broken trust, attackers typically leverage these vulnerabilities to steal victims’ cookies, session tokens, or other sensitive information retained by the browser. They could also redirect to other malicious sites, install keyloggers or crypto miners, or even change the content of the website.
Now for the “stored” part. As the name implies, stored XSS generally occurs when the malicious payload has been stored on the target server, usually in a database, from input that has been submitted in a message forum, visitor log, comment field, form, or any parameter that lacks proper input sanitization.
What makes this type of XSS so much more damaging is that, unlike reflected XSS – which only affects specific targets via cleverly crafted links – stored XSS affects any and everyone visiting the compromised site. This is because the XSS has been stored in the applications database, allowing for a much larger attack surface.
Old-school apps
Now that we’ve established a basic understanding of stored XSS, let’s go back in time a few decades to when web apps were much simpler in their communications between the front-end and back-end counterparts.
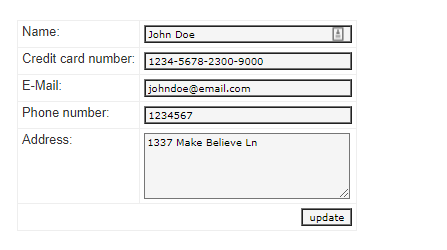
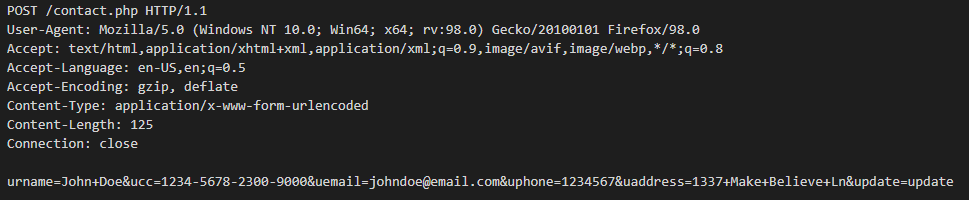
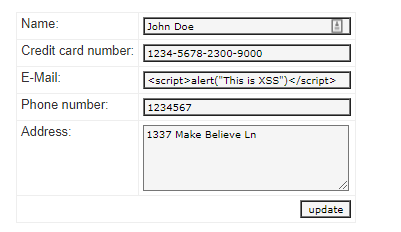
Let’s say you want to change some personal information on a website, like your email address on a contacts page. When you enter in your email address and click the update button, it triggers the POST method to send the form data to the back end to update that value in a database. The database updates the value in a table, then pushes a response back to the web applications front end, or UI, for you to see. This would usually result in the entire page having to reload to display only a very minimal amount of change in content, and while it’s very inefficient, nonetheless the information would be added and updated for the end user to consume.
In the example below, clicking the update button submits a POST form request to the back-end database where the application updates and stores all the values, then provides a response back to the webpage with the updated info.
Old-school XSS
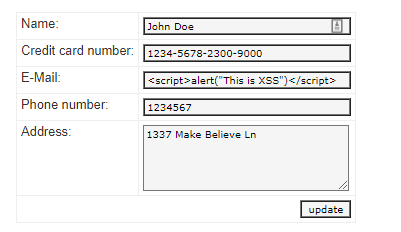
As mentioned in my previous blog post on injection, I give an example where an attacker enters in a payload of <script>alert(“This is XSS”)</script> instead of their email address and clicks the update button. Again, this triggers the POST method to take our payload and send it to the back-end database to update the email table, then pushes a response back to the front end, which gets rendered back to the UI in HTML. However, this time the email value being stored and displayed is my XSS payload, <script>alert(“This is XSS”)</script>, not an actual email address.
As seen above, clicking the “update” button submits the POST form data to the back end where the database stores the values, then pushes back a response to update the UI as HTML.
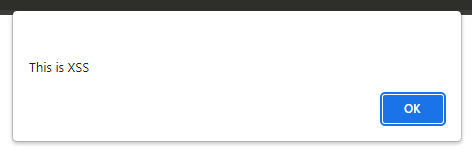
However, because our payload is not being sanitized properly, our malicious JavaScript gets executed by the browser, which causes our alert box to pop up as seen below.
While the payload used in the above example is harmless, the point to drive home here is that we were able to get the web application to store and execute our JavaScript all through a simple contact form. Anyone visiting my contact page will see this alert pop up because my XSS payload has been stored in the database and gets executed every time the page loads. From this point on, the possible damage that could be done here is endless and only limited by the attacker’s imagination… well, and their coding skills.
New-school apps
In the first example I gave, when you updated the email address on the contact page and the request was fulfilled by the backend, the entire page would reload in order to display the newly created or updated information. You can see how inefficient this is, especially if the only thing changing on the page is a single line or a few lines of text. Here is where ajax and/or the fetch method comes in.
Ajax, or the fetch method, can be used to get data from or post data to a remote source, then update the front-end UI of that web application without having to refresh the page. Only the content from the specific request is updated, not the entire page, and that is the key difference between our first example and this one.
And a very popular format for said data being sent and received is JavaScript Object Notation, most commonly known as JSON. (Don’t worry, I’ll get back to those curly braces in just a bit.)
New-school XSS
(Well, not really, but it sounds cool.)
Now, let’s pretend we’ve traveled back to the future and our contact page has been rewritten to use ajax or the fetch method to send and receive data to and from the database. From the user’s point of view, nothing has changed — still the same ol’ form. But this time, when the email address is being updated, only the contact form refreshes. The entire page and all of its contents do not refresh like in the previous version, which is a major win for efficiency and user experience.
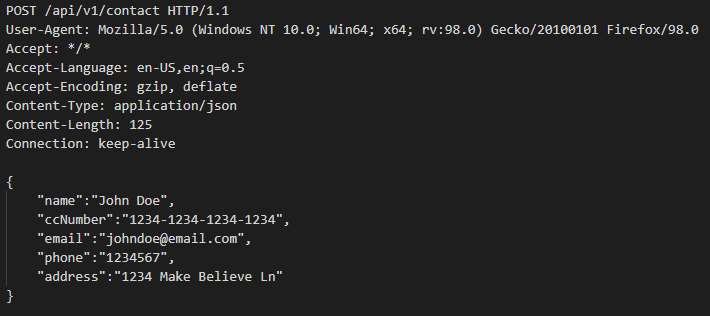
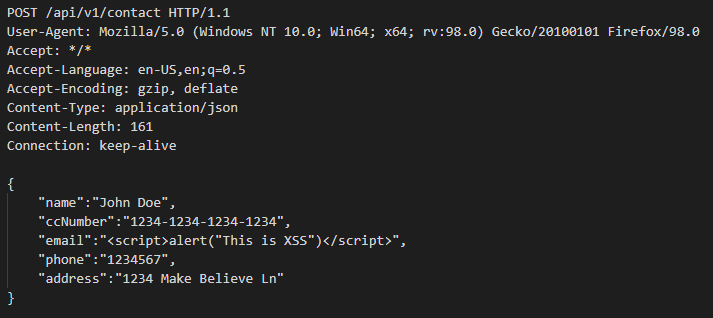
Below is an example of what a POST might look like formatted in JSON.
“What is JSON?” you might ask. Short for JavaScript Object Notation, it is a lightweight text format for storing and transferring data and is most commonly used when sending data to and from servers. Remember those curly braces I mentioned earlier? Well, one quick and easy way to spot JSON is the formatting and the use of curly braces.
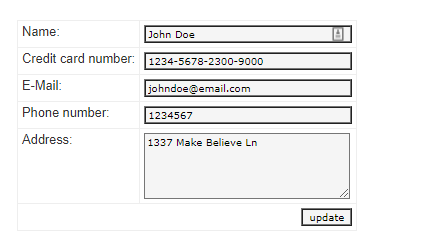
In the example above, you can see what our new POST looks like using ajax or the fetch method in JavaScript. While the end result is no different than before, as seen in the example below, the method that was used to update the page is quite different. The key difference here is that the data we’re wanting to update is being treated as just that: data, but in the form of JSON as opposed to HTML.
Now, let’s inject the same XSS payload into the same email field and hit update. In the example below, you can see that our POST request has been wrapped in curly braces, using JSON, and is formatted a bit differently than previously before being sent to the back end to be processed.
In the example above, you can see that the application is allowing my email address to be the XSS payload in its entirety. However, the JavaScript here is only being displayed and not being executed as code by the browser, so the alert “pop” message never gets triggered as in the previous example. That again is the key difference from the original way we were fulfilling the requests versus our new, more modern way — or in short, using JSON instead of HTML.
Now you might be asking yourself, what’s wrong with allowing the XSS payload to be the email address if it’s only being displayed and not being executed as JavaScript by the browser. That is a valid question, but hear me out.
See, I’ve been working in this industry long enough to know that the two most common responses to a question or statement regarding cybersecurity begin with either “that depends…” or “what if…” I’m going to go with the latter here and throw a couple what-ifs at you.
Now that my XSS is stored in your database, it’s only a matter of time before this ticking time bomb goes off. Just because my XSS is being treated as JSON and not HTML now does not mean that will always be the case, and attackers are betting on this.
Here are a few scenarios.
Scenario 1
What if team B handles this data differently from team A? What if team B still uses more traditional methods of sending and receiving data to and from the back end and does leverage the use of HTML and not JSON?
In that case, the XSS would most likely eventually get executed. It might not affect the website that the XSS was originally injected into, but the stored data can be (and usually is) also used elsewhere. The XSS stored in that database is probably going to be shared and used by multiple other teams and applications at some point. The odds of all those different teams leveraging the exact same standards and best practices are slim to none, and attackers know this.
Scenario 2
What if, down the road, a developer using more modern techniques like ajax or the fetch method to send and receive data to and from the back end decides to use the .innerHTML property instead of .innerTEXT to load that JSON into the UI? All bets are off, and the stored XSS that was previously being protected by those lovely curly braces will now most likely get executed by the browser.
Scenario 3
Lastly, what if the current app had been developed to use server-side rendering, but a decision from higher up has been made that some costs need to be cut and that the company could actually save money by recoding some of their web apps to be client-side rather than server-side?
Previously, the back end was doing all the work, including sanitizing all user input, but now the shift will be for the browser to do all the heavy lifting. Good luck spotting all the XSS stored in the DB — in its previous state, it was “harmless,” but now it could get rendered to the UI as HTML, allowing the browser to execute said stored XSS. In this scenario, a decision that was made upstream will have an unexpected security impact downstream, both figuratively and literally — a situation that is all too well-known these days.
Final thoughts
Part of my job as a security advisor is to, well, advise. And it’s these types of situations that keep me up at night. I come across XSS in applications every day, and while I may not see as many fun and exciting “pops” as in years past, I see something a bit more troubling.
This type of XSS is what I like to call a “sleeper vuln” – laying dormant, waiting for the right opportunity to be woken up. If I didn’t know any better, I’d say XSS has evolved and is aware of its new surroundings. Of course, XSS hasn’t evolved, but the applications in which it lives have.
At the end of the day, we’re still talking about the same XSS from its conception, the same XSS that has been on the OWASP Top 10 for decades — what we’re really concerned about is the lack of sanitization or handling of user input. But now, with the massive adoption of JavaScript frameworks like Angular, libraries like React, the use of APIs, and the heavy reliance on them to handle the data properly, we’ve become complacent in our duties to harden applications the proper way.
There seems to be a division in camps around XSS in JSON. On the one hand, some feel that since the JavaScript isn’t being executed by the browser, everything is fine. Who cares if an email address (or any data for that matter) is potentially dangerous — as long as it’s not being executed by the browser. And on the other hand, you have the more fundamentalist, dare I say philosophical thought that all user input should never be trusted: It should always be sanitized, regardless of whether it’s treated as data or not — and not solely because of following best coding and security practices, but also because of the “that depends” and “what if” scenarios in the world.
I’d like to point out in my previous statement above, that “as long as” is vastly different from “cannot.” “As long as” implies situational awareness and that a certain set of criteria need to be met for it to be true or false, while “cannot” is definite and fixed, regardless of the situation or criteria. “As long as the XSS is wrapped in curly braces” means it does not pose a risk in its current state but could in other states. But if input is sanitized and escaped properly, the XSS would never exist in the first place, and thus it “cannot” or could not be executed by the browser, ever.
I guess I cannot really complain too much about these differences of opinions though. The fact that I’m even having these conversations with others is already a step in the right direction. But what does concern me is that it’s 2022, and we’re still seeing XSS rampant in applications, but because it’s wrapped in JSON somehow makes it acceptable. One of the core fundamentals of my job is to find and prioritize risk, then report. And while there is always room for discussion around the severity of these types of situations, lots of factors have to be taken into consideration, a spade isn’t always a spade in application security, or cybersecurity in general for that matter. But you can rest assured if I find XSS in JSON in your environment, I will be calling it out.
I hope there will be a future where I can look back and say, “Remember that one time when curly braces were all that prevented your website from getting hacked?” Until then, JSON or not, never trust user data, and sanitize all user input (and output for that matter). A mere { } should never be the difference between your site getting hacked or not.
To provide the best experiences, we use technologies like cookies to store and/or access device information. Consenting to these technologies will allow us to process data such as browsing behavior or unique IDs on this site. Not consenting or withdrawing consent, may adversely affect certain features and functions.
Functional
Always active
The technical storage or access is strictly necessary for the legitimate purpose of enabling the use of a specific service explicitly requested by the subscriber or user, or for the sole purpose of carrying out the transmission of a communication over an electronic communications network.
Preferences
The technical storage or access is necessary for the legitimate purpose of storing preferences that are not requested by the subscriber or user.
Statistics
The technical storage or access that is used exclusively for statistical purposes.The technical storage or access that is used exclusively for anonymous statistical purposes. Without a subpoena, voluntary compliance on the part of your Internet Service Provider, or additional records from a third party, information stored or retrieved for this purpose alone cannot usually be used to identify you.
Marketing
The technical storage or access is required to create user profiles to send advertising, or to track the user on a website or across several websites for similar marketing purposes.