Post Syndicated from Bruce Schneier original https://www.schneier.com/blog/archives/2025/08/surveilling-your-children-with-airtags.html
Skechers is making a line of kid’s shoes with a hidden compartment for an AirTag.
Post Syndicated from Bruce Schneier original https://www.schneier.com/blog/archives/2025/08/surveilling-your-children-with-airtags.html
Skechers is making a line of kid’s shoes with a hidden compartment for an AirTag.
Post Syndicated from Nathan Liefting original https://blog.zabbix.com/migrating-nagios-to-zabbix-lessons-learned/30917/
Recently, a new customer of ours at Opensource ICT Solutions asked whether we could migrate their Nagios instance to Zabbix. Because Nagios and Zabbix are very different in their storage methods, we told them that we would have to investigate and see if we could come up with a viable solution. It wasn’t long until we found a way to do it and started building some script to get it done.
Table of Contents
The customer was clear in their wishes – we needed to turn off Nagios, but without losing historic data. As such, they wanted all their old data visible in Zabbix instead of having Nagios running somewhere as a backup. This meant that a script had to be built to get that Nagios data out and into Zabbix.
The good part here is that it starts simple. When we dive into the Nagios configuration data, we clearly see that Nagios has hosts just like Zabbix. They just have a slightly different build than our usual Zabbix hosts. For example, we can see three different names for a host in Nagios:
That immediately gives us a good way to hook up Nagios names to Zabbix host and visible names.
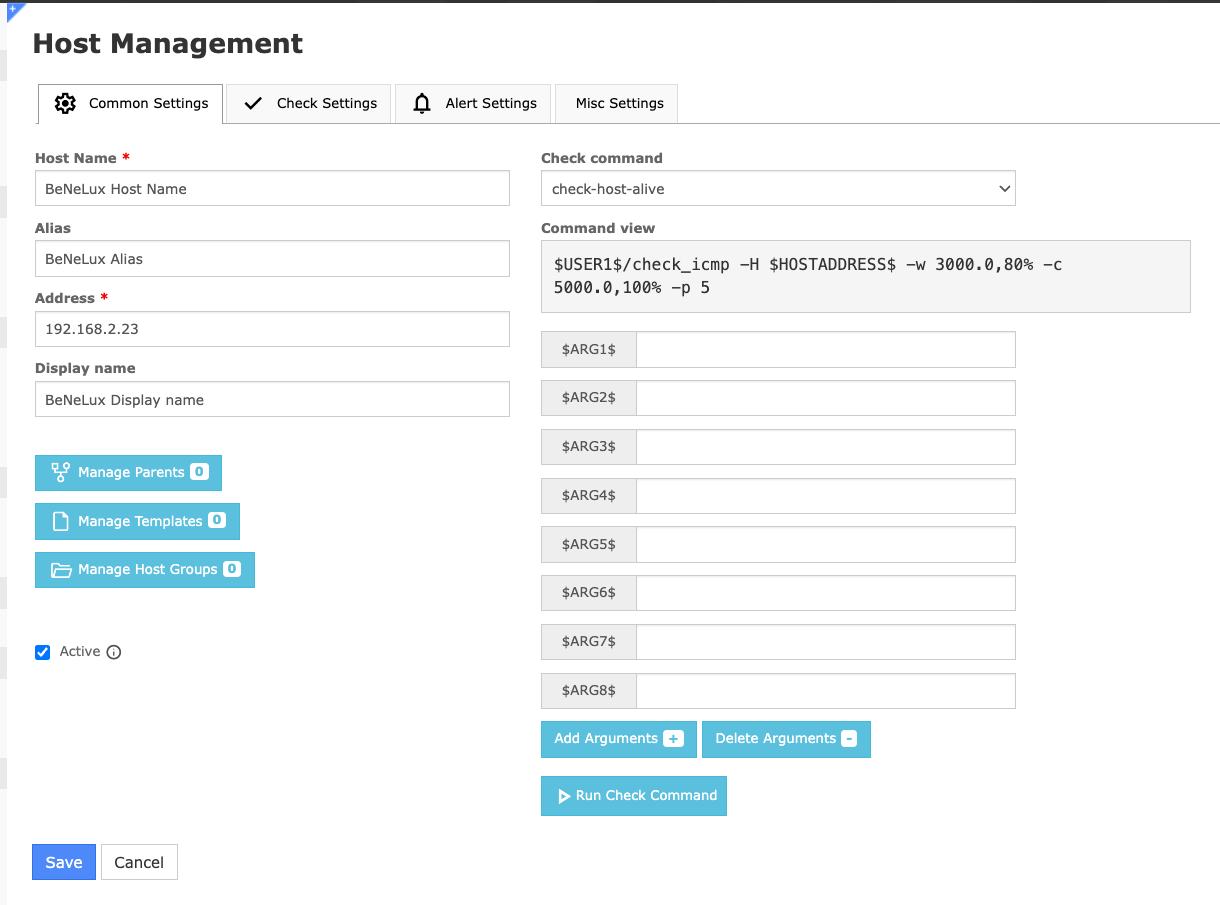
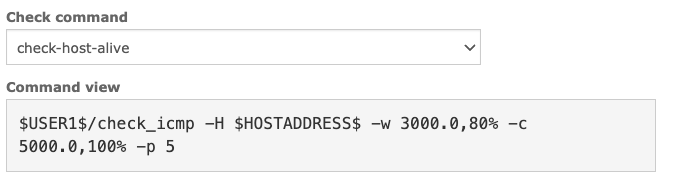
When we then take a look at the checks and how they are executed in Nagios, we also see similarities with Zabbix. In the end, both of them are monitoring solutions, of course. However, Nagios works more in a command execution kind of way, which is good for our migration. We can take this command and find an equivalent item in Zabbix. For example the check_icmp command can easily be translated into a simple check in Zabbix icmpping, icmppingloss, and icmppingsec.
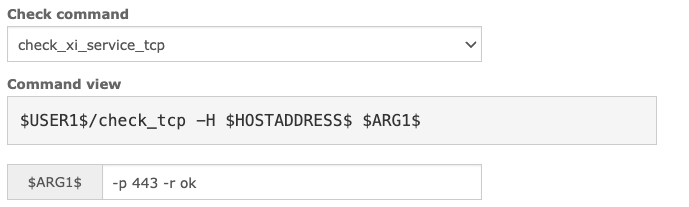
For the check_tcp command we can do a similar translation. Making sure we use the simple check net.tcp.service whenever this command is executed on a Nagios host.
Because of the big differences between Nagios and Zabbix, this does mean we need to make some manual translations between the Nagios commands and Zabbix items. Depending on your Nagios instance, this could be a big task. Luckily for us, this was a smaller instance with only ICMP and TCP port checks.
Now that we know how to start creating our hosts and items, we need to understand how Nagios is storing its data. Zabbix has a big centralized MariaDB or PostgreSQL database, which makes it easy to parse through and work with our data. Unfortunately, Nagios instances use a different technique. Nagios stores data in .rrd (Round Robin Database) files and with it a .xml file to interpret the RRD file. The RRD files are not centralized like a Zabbix database, but they are more manageable in terms of storage size. We can see an RRD file per type of check in Nagios, which means we will have to grab the data from that file while understanding what it is going to belong to in Zabbix.

To see the data in the RRD file, we can use a special command line tool.
rrdtool /usr/local/nagios/share/perfdata/BeNeLux-Host-Name/Availability.rrd LAST --start -30d --end now | grep -v "nan"
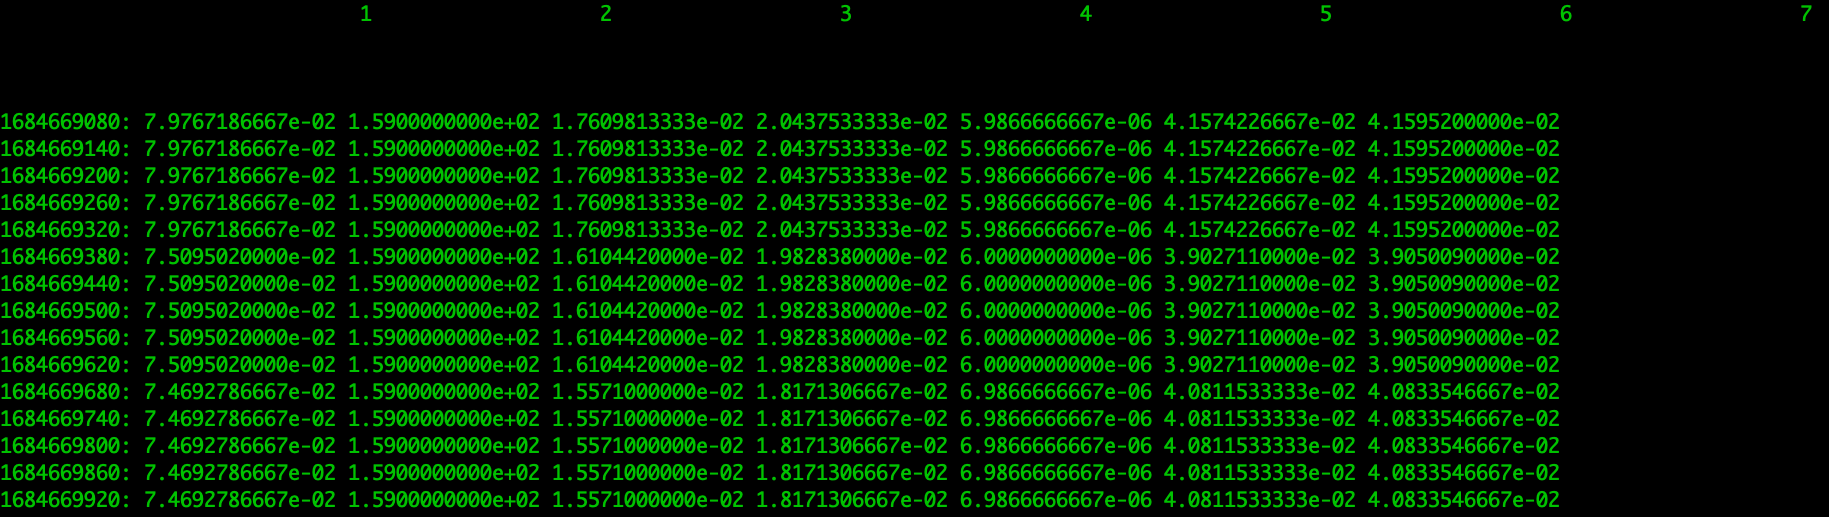
Now we can clearly see that this specific RRD file above contains 8 columns, 7 with a performance value. The first column contains the timestamp in Unixtime, which is great because it will be perfect for storing in the Zabbix database. The other 7 columns in this file are different though, because we do not know what the value in the column belongs to. This is where the .xml file comes into play. The XML file belongs with the RRD file and contains details on what is included in the RRD file.
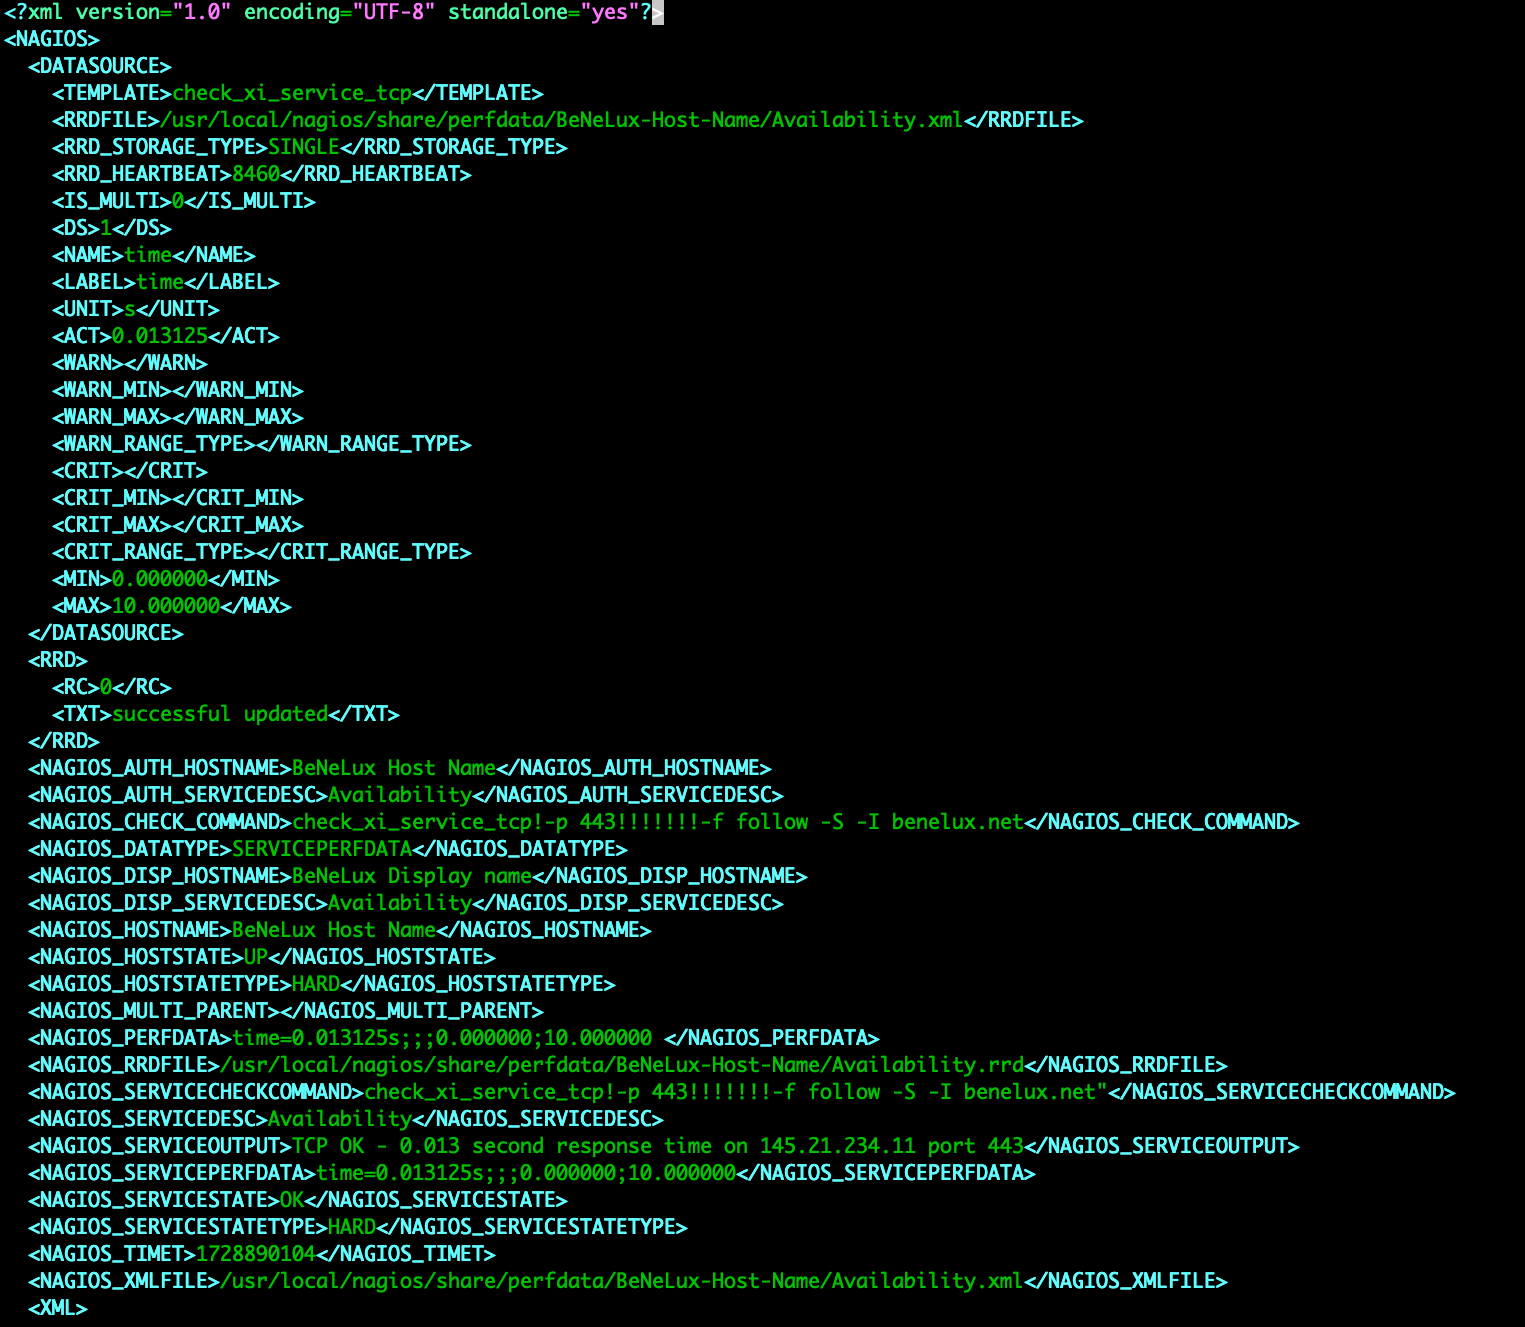
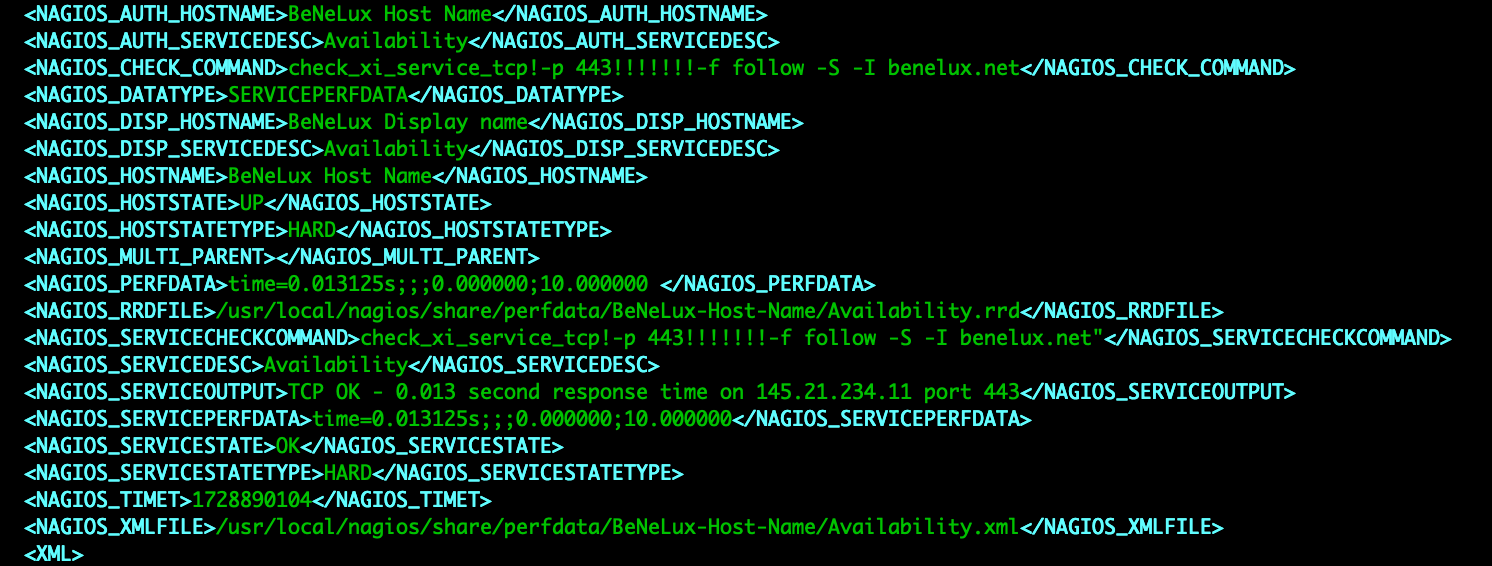
In this XML file we will find all of the required host information, which is great for creating the host in Zabbix. It also contains the check information, so we can also use this file to create the items in Zabbix. The biggest thing we will have to keep in mind is to make sure that the XML and RRD file match up in terms of number of RRD entries and columns. Column 1 in the RRD file will match with the first entry in our XML.
With the host, item and history data identified, we can start to create a script. In our case we decided to create a Python import tool. As Zabbix comes with some limitations in terms of which hostnames we can use (which are different from the limitations in Nagios), we need to sanitize our hostnames slightly.
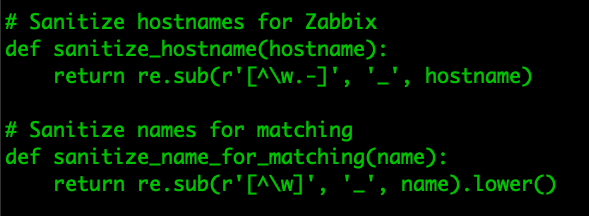
Then all we need to do is parse through all the XML files and create new hosts in Zabbix through the Zabbix API.
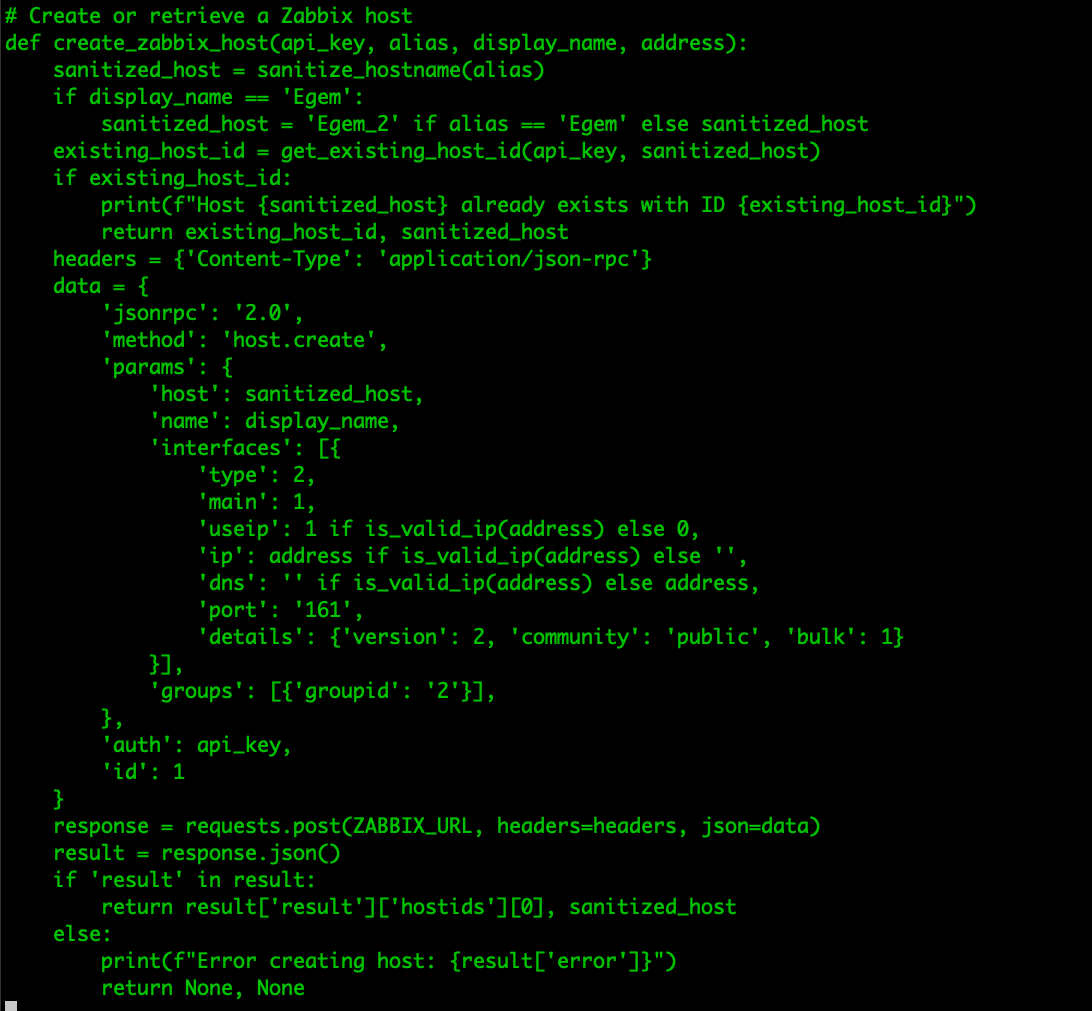
It will be a very similar process for our items, as we parse through our XML file and create all of the required items in Zabbix through the API.
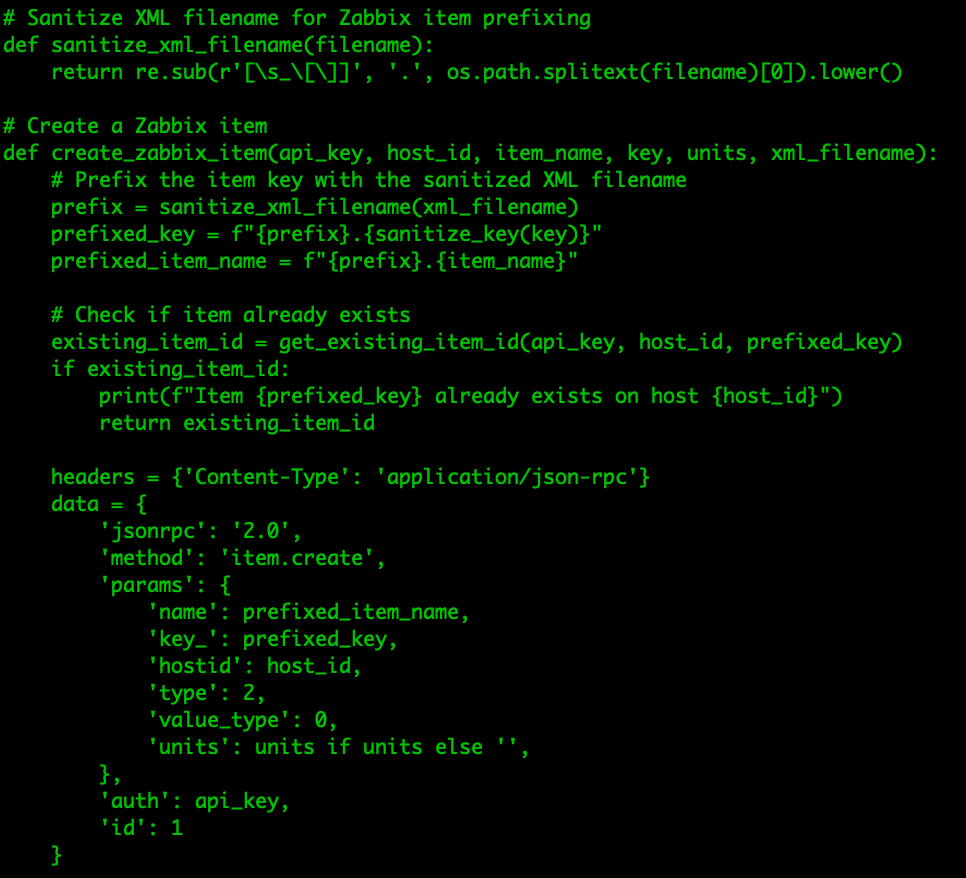
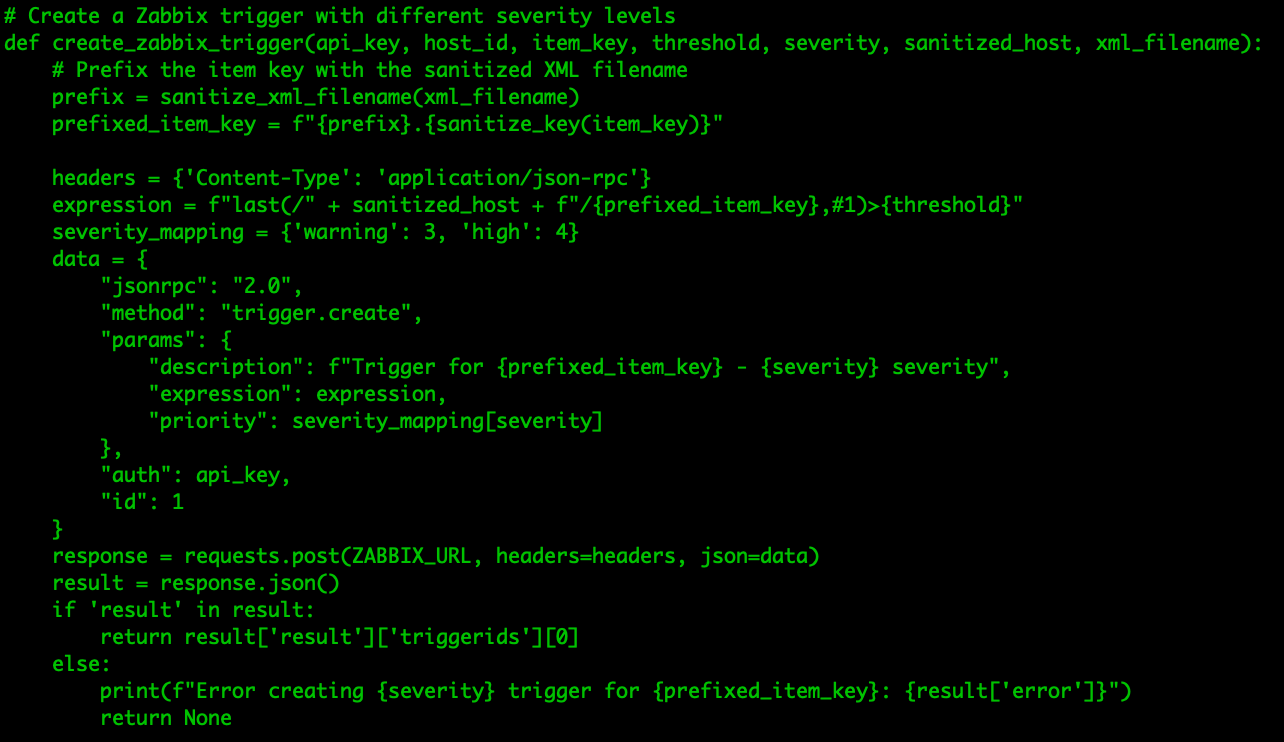
We can even create the triggers straight from the XML file by parsing through the different severities already set up in Nagios.
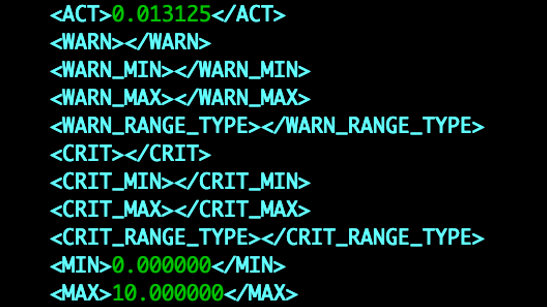
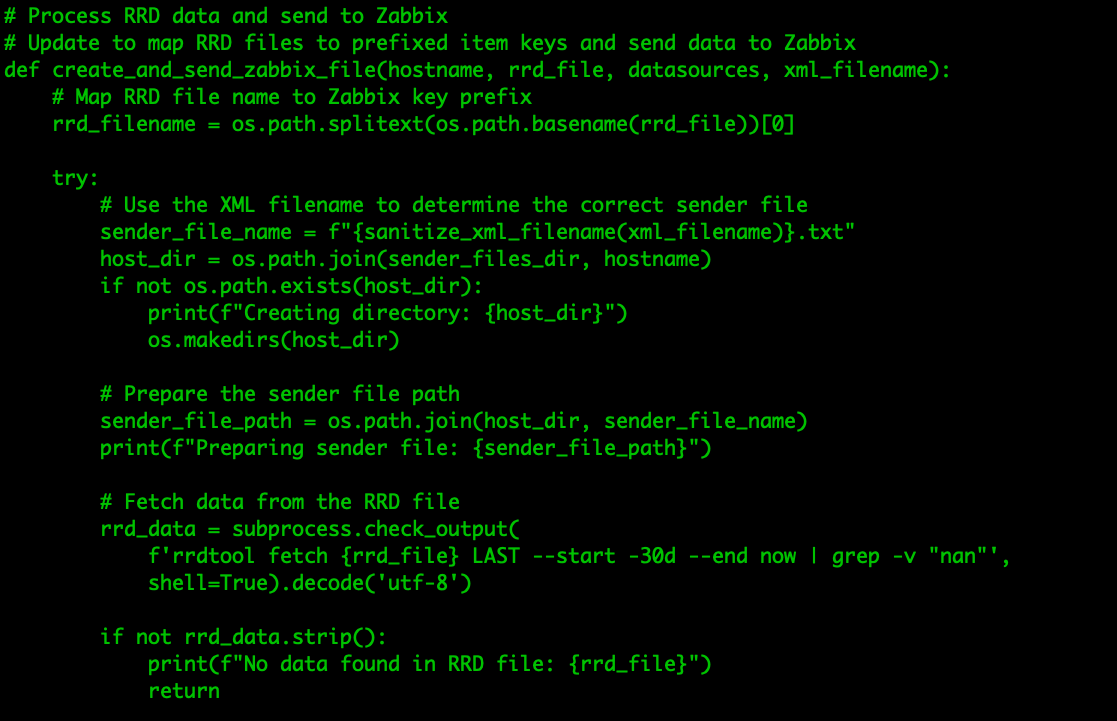
Once everything is created in Zabbix, the Python script can now start using RRDTool to parse through the RRD file, making sure to keep the XML file structure in mind when parsing through the columns.
This script can now create the hosts, the items, the triggers, and then import all of the data. We can see the hosts being created and data being imported.
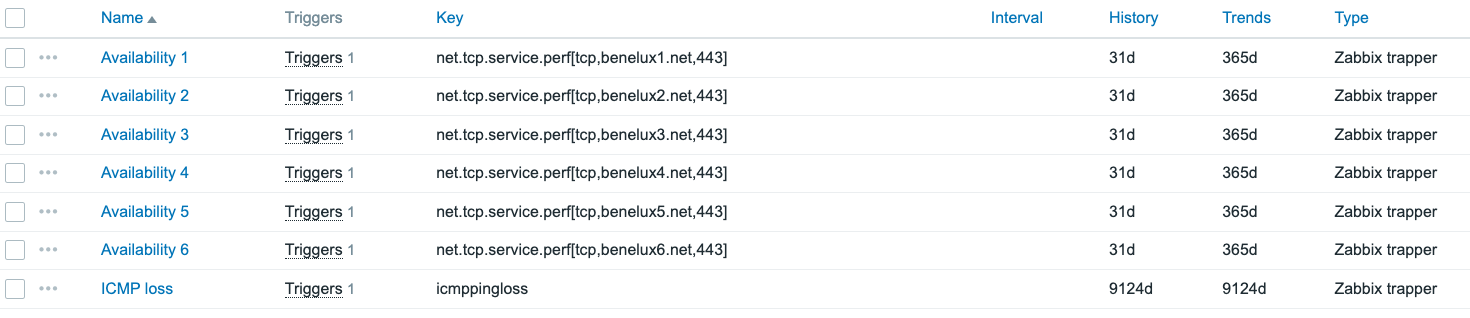

The beauty of importing history data into Zabbix while the triggers are already created is then also seen below.

All of the triggers will trigger and be resolved based on the data imported, meaning that we can create problems with historic data. This means that not only do we have our historic data, but also all the problems with the correct duration as they are now discovered from the actual imported data.
To make this possible we can use the Zabbix sender tool. It has an option to include the timestamp upon every historic value imported.

Our Python script grabs the values from the RRD file and then converts them into a new _HOST_.sender file. This file will be sent to the Zabbix server using the Zabbix sender tool.
Looking at the file, we can see it contains only the name of the host, the unixtime stamp, and the actual value to send.


All we need to do is make our script send this file to the correct item in Zabbix.
The last step will be our cleanup. We decided that we would start dirty with a one-on-one data import from Nagios. This means hostnames, item names, and trigger names are imported straight from Nagios. No templates will be created in Zabbix by the tool either, skipping the Zabbix best practice to use templates for all hosts.
We did this to make the initial import easier and not go overboard with scripting. It’s easier to have a messy Zabbix to clean up than to script everything perfectly in Python. Time is valuable.
What we did afterwards is create all the templates manually to take over the items as is from the hosts. For example, we can translate the ICMP ping and TCP stuff easily into a template.
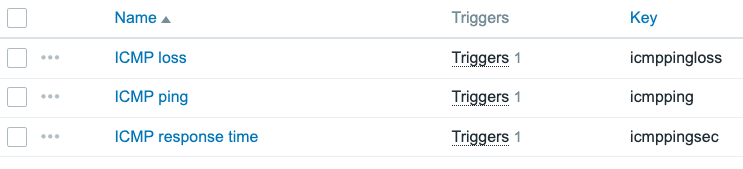
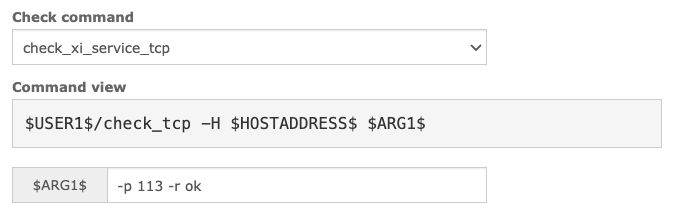

After doing so, we do end up with some bad looking templates, but we can now start cleaning up.
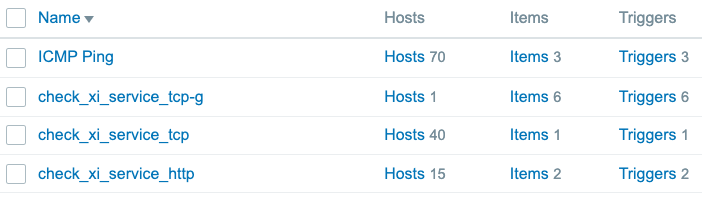
We can also start creating normal trigger names and clean up…

…while changing our dynamic port names for something more expected as well.

And that’s it!
The post Migrating Nagios to Zabbix: Lessons Learned appeared first on Zabbix Blog.
Post Syndicated from Bozho original https://blog.bozho.net/blog/4491
В края на предишни парламентарни сесии правих конкретни отчети на свършеното от мен като законодателна дейност и дейност по парламентарен контрол. Сега такъв няма да има, защото в опозиция почти нищо не минава и отчетът би изглеждал като каталог на неуспелите законодателни инициативи.
Сред тях (39 законопроекта и 26 предложения между 1-во и 2-ро четене) има множество такива, чието отхвърляне има политическа цена, но изброяването за целите на това да кажем „колко лоши са управляващите“ няма собствен смисъл. И е по-ефективно да се посочва в момента и в контекста, в който се случи (иначе примери за отхвърлени от управляващите добри инициативи има много – уведомленията за здравни събития по sms/viber за да се ограничи източването на НЗОК; мерките срещу имотните измами; отпадането на стикерите от предното стъкло; дигитализацията на болничните; облекченията при издаване на лични карти; дигитализацията на инвестиционното проектиране; и др.).
Вместо това, в една доста дълга публикация, ще разгледам политическите причини за неприемането на тези и много други неща. И то е, най-просто казано, че сме в опозиция, а приоритетите на опозицията не са важни. Дори когато опозицията предложи нещо смислено, управляващите, в желанието си да демонстрират силата на мнозинството, го отхвърлят. Или внасят аналогично свое предложение, което подкрепят, за да не бъдат обвинени, че са против правилните неща (имаше няколко такива примера, които можем да отчетем като успех – наши предложения, внесени от управляващите).
Но защо сме в опозиция? Кратката версия сме я казвали многократно: след като от Демократична България бяхме на масата на преговорите за правителство и поставихме въпросите за ограничаване на влиянието на Пеевски в институциите като елемент от коалиционното споразумение, бяхме извадени от преговорите (а тези няколко точки от споразумението – изтрити). Въпросът за премиера беше последващ, както многократно бяхме заявили, затова обяснението на ГЕРБ, че прекратяват преговорите, защото не одобряваме техния кандидат премиер, не беше убедително. Но нека да видим какво стои под тази фактология.
Участието в преговорите беше с цел да предотвратим нещата, които се случват в момента – дозавладяване на държавата от Пеевски, плавното преминаване към мека диктатура, попълването на регулаторите с многогодишни мандати с ключови хора на Пеевски, и др. Виждахме вкл. риска за еврозоната, който се оказа реален в началото на мандата, когато управляващите бяха силно разколебани и трябваше да действаме с натиск отвън. И за да не се реализират всички тези рискове, преговаряхме.
И когато сега някой казва „защо не спрете Х“, а преди 8 месеца същият човек е казвал „защо сядате с тия на преговори“, отговорът може би не е очевиден и трябва да се каже – в ролята на опозиция не можеш да спреш почти нищо. Не можем да спрем избора на човек на Пеевски в Конституционния съд, който след 2 месеца вероятно ще позволи на ВСС да избере Сарафов. И съответно можехме да спрем избора на Сарафов само временно през измененията в Закона за съдебната власт, но трайно можехме да спрем не само Сарафов, но и други подобни кандидатури за главен прокурор (на които Пеевски звъни с разпореждания), единствено ако бяхме част от мнозинство, което избира ВСС, и Пеевски е извън това мнозинство. Защото с 36 депутати не можем да спрем пропукването на светския характер на образованието; същото е за измененията в Закона за държавната собственост и екооценките – можем с процедурни хитрости да забавим или да вдигнем политическата цена на такива действия, но не можем да ги спрем; не можем да спрем тормоза спрямо бизнеса под претекст „борба със спекулата“ – успяхме само да го олекотим с остра реакция, но дотолкова.
Можем да постигаме разумни компромиси, когато управлението зависи от нас. А когато не зависи – „кучетата си лаят, керванът си върви“. Т.е. като опозиция не можем да спрем разпада на държавата. Ние го знаехме тогава, но това не изглеждаше като споделено разбиране. И ако октомври ВСС избере Сарафов на 7-годишен мандат, това ще е пряко следствие от нашето неучастие в управлението. Важно е да си даваме сметка за това, когато претегляме плюсовите и минусите.
Имаше мнения, че преговорите за управление са неморални. Аз не смятам, че политически преговори с наши опоненти са морално компрометиращи. Биха били, ако кажем „майната им на приоритетите, важното е да сме във властта“. Но ние бяхме в преговорите именно за да постигнем целите, които сме поставили преди изборите и сме получили гласове за тях. Моралният аспект в важен в лично качество – да не пристъпваш морални граници. И аз не смятам, че сме пристъпили такива.
Но кой носи морална отговорност за щетите, които носи това управление на държавата? Морално ли беше да оставим още дълго време всички пионки на Пеевски във ВСС, регулатори, служби (дали с изтекли мандати или да бъдат презаредени – все едно)? Личният ни комфорт да не бъдем критикувани, заемайки героична поза на твърда опозиция на всичко и всички, беше в конфликт с отговорността, която носим, и която ни е дадена от избирателите. Конфликт, който не беше явен, и който не преекспонирахме, но за който трябва да си даваме сметка, от дистанцията на времето.
Разбира се, с този анализ не можем да спестим историческата вина на ГЕРБ, че заковани за Пеевски чрез зависимостите си, правят почти невъзможни нормалните политически разговори и преговорите по приоритети. Борисов затова се скри от онези преговори и отказа да се среща с нас. Може би Пеевски не го пусна, че да не вземе да поеме ангажимент за нещо, дето не трябва. Този тандем, със своето нежелание да губи влияние в съдебната власт (където не би трябвало изобщо да има такова), но с позиционирането си в прозападния сегмент, е в основата на политическата криза, което усложнява задачата на политическите представители на демократичната общност.
Тогава отчетохме и друго – ако без широко разбиране за мотивите на нашите действия влезем в едно управление, електоралната ни подкрепа ще намалее дотолкова, че да няма значение какво опитваме да направим или спрем. Защото тежестта ти в едно управление не е функция само на броя депутати, с които го подкрепяш, а и на обществената легитимност, която носиш. Този факт беше използван при ротацията – знаейки, че обществената ни подкрепа е намаляла, Пеевски и Борисов избраха предсрочни избори пред това Пеевски да бъде лишен от гарантирана квота във ВСС. Защото знаеха, че сме в слаба позиция. Между другото, тази отслабена обществена подкрепа беше и една от причините Конституционният съд спокойно да отмени промените в Конституцията, с които Пеевски вече беше започнал да губи влияние – защото бяха наясно, че обществена реакция няма да има.
Сядането на масата на преговорите през декември миналата година беше съпроводено и с множество коментари, че преговори не трябва да се водят и че не трябва да сме на тази маса. Защото ще ни излъжат, защото са „лоши и комрумпирани“, защото не са подписали „декларацията“ и т.н. Други отидоха по-далеч и се усъмниха в нашите мотиви и преминат в публична атака – част от тях бяха тролове и симпатизанти на други партии, но част легитимно изразяваха мнението си. И то е „никога (пак) нищо с ГЕРБ“. Разбира се, има съгласие по „никога с ДПС-НН“ и „никога с проруската Възраждане“. От 48-ото (сега сме 51-о) Народно събрание досега, ГЕРБ, ДПС и Възраждане имат над 121 гласа. Т.е. когато абсолютизираме тези червени линии, значи, че трябва да сме опозиция.
В 48-ото и 50-ото НС заложихме на този подход. И затова нямаше избрано правителство и кризата се задълбочи. В 51-ото подходихме едновременно диалогично и твърдо – възможно е участие, но само при много ясни, писмени гаранции, че механизмите на завладяване на държавата (в настоящия момент – от Пеевски) ще бъдат разградени. Това видимо не беше прието, поради което ние останахме в опозиция – няма нищо трагично в това. Трябва да има периоди, в които политическите сили са в опозоциия. Такава е нормалната логика.
Но нека да ползваме този период на опозиция, за да проведем разговора за отношението към властта и условията, при които тя се упражнява. И защо се упражнява. И какво става, когато не се упражнява – тя не търпи вакуум, и тогава се упражнява от други – от тези, които не бива да я упражняват, по мнението на нас и нашите избиратели. И то без възпиращата ни роля.
В момента се упражнява от Пеевски, който не се впечатлява от фейсбук статуси, блогпостове и героични речи на протестите. Него го впечатляват битовите аспекти на властта – дали ще има достатъчно негови хора на ключови позции в служби, регулатори и най-вече ВСС. Дали законите и кадровата неадекватност на контролните механизми ще позволяват на неговите пионки да прилагат безогледна наказателна репресия и да нарушават конституционни права. А тези неща се променят с мнозинство, което се скрепява от правителство. Това е базовата политическа реалност и трябва да изхождаме от нея, когато формулираме отношението си към властта.
На протеста преди няколко седмици колегата Мирчев каза, че трябва да дадем отпор на завладяването на държавата и че ще представим план за това. Този план, неизбежно, трябва да включва формула за властта. Планът трябва да включва условията, при които да бъде упражнявана властта. И този план, поставяйки големи цели, трябва да е и реалистичен. Реалистичен би бил план за постигане на максимално силна позиция, от която да се правят разумни компромиси в името на целта – освобождавне на завладяната държава, премахване на бухалките, връщането на България в треактория на позитивно развитие като западна демокрация, а не като източна мека диктатура. Важно е да имаме реалистични очаквания, защото нарушаването на очакванията е лъжа, а хората най-много мразят да ги лъжат. Важно е и да поставим ясни цели, в името на които могат да бъдат правени определени компромиси – удържане на свободата от двата големи риска – вътрешния (Пеевски и корупцията) и външния – проникването на руското влияние (двата риска, в крайна сметка, конвергират, защото руското влияние прониква през корупционно-пробитите институции).
В огромната динамика на политическия живот напоследък, за политиците е изкушаващо да обещаят нещата, които ще успокоят избирателите им за следващите 2 месеца; които няма да създадат морални и естетически притесненния; които се плъзгат по повърхността на парадоксите на управлението в България. Това, обаче, ограничава възможността ни да постигаме целите, които същите тези избиратели искат от нас. И затова трябва да сме внимателни. Да не превръщаме политиката в карикатура на религия, която работи с опростени моралните категории за добро и зло. Тя не е това. И е опасно да бъде възприемана така. На пръв поглед „нашите са доброто, а останалите са злото“ е примамливо, но значи, че доброто трябва да взаимодейства със злото и „да се оцапа“. И разговорът отива в плоскост, която е вредна за основната цел на политиката – резултатите.
Защото ако влезем на моралната плоскост за лошите (и корумпираните), трябва да отчетем следното: в очите на много хора (особено на негласуващите) „всички сме маскари“. За избирателите на другите партии ние сме лошите и корумпирани. Защото това е преобладаващият политически дискурс в последните години. Той не е без основание такъв, но имаме параграф 22: заради липсата на обективна и работеща прокуратура, която да обвини корумпираните, всеки, който е бил в управление, е сочен за корумпиран. Но за да решим проблема с прокуратурата, е нужен хоризонт, какъвто дава само редовно управление. С това не казвам, че някой е или не е корумпиран (че четенето между редовете може да доведе до обвинение, което получих по време на преговорите – че лъскам нечий имидж). Значи само, че за да има последствия за корупцията, трябват много промени, а не само посочване.
Все пак, упражняването на власт не е просто за да можеш да спираш вредни неща. Тогава тя би била безмислена – „ще влезем в управление за да е по-малко гадно“ не звучи никак мотивиращо. Да, този аспект го има и това е един от малкото ефективни начини да се спират вредните неща. Но ние трябва да излезем извън противопоставянето на добрите срещу лошите и да имаме позитивен дневен ред за България – как трябва тя да изглежда тя след 5-10-20 години, и да имаме подготвени хора за да я „заведем“ там. Да, този дневен ред минава през премахването на инструментите за нелегитимни влияния в институциите и политиката, с които в момента злоупотребява Пеевски. В този смисъл, не можем да очакваме просто една картинка с красива поляна и цветя – има много кал да се изрине преди това. Но ограничаването на Пеевски не е защото той е злото, а защото неговият начин на управление разрушава държавността, делегитимира институциите и прави невъзможен позитивния план.
Част от нашата политическа общност е свикнала да гледа на властта като на нещо гадно, до което не трябва да се допираш, защото я ще е „с комунистите и чалгарите“, я ще изпереш някого, я някой друг морален императив ще бъде нарушен. Властта действително е опасна и трябва да се дозира и осмисля добре, но ако бъде изключена всеядността и бъде упражняването ѝ бъде подчинено на споделени с избирателите приоритети и ценности, тя е единственият начин за постигане на резултати.
Пеевски каза, че управлението ще трае 4 години, така че веднага искам да успокоя по-радикалните, които могат между тези редове да прочетат, че се готви почвата за „нова сглобка“ (съмнение, подхранвано непрекъснато от всякакви интриги, вкл. на Борисов) – не, нови сглобки (с неясни условия и правила, неясна отговорност, неясна принадлежност на министри и рязка промяна на предварително заета позиция) няма да има. Но нови коалиции все някога ще има. И трябва да сме си отговорили на въпроса за условията, при които наше участие в такива коалиции е възможно и допустимо, и в какви – не. На преговорите през зимата показахме, че при условие, че няма ангажимент за ограничаване на механизмите за нелегитимни влияния (на Пеевски и не само), ние нямаме място в коалиции.
Но въпросът как да има 121 гласа за управление и 160 гласа за избор на нов Висш съдебен съвет без участието на Пеевски, стои все по-остро и трябва да бъде намерен отговор, иначе политическата класа губи историческо време за страната, в което тя се отдалечава от европейския си път, а институциите биват разграждани и завладявани все повече. Безотговорно би било да не формулираме и да не опитаме да изпълним план как стигнем до тази точка, единствено след която може реално (а не проформа) да има позитивен дневен ред.
В заключение – не можем да се похвалим с кой знае какви резултати, защото сме в опозиция. Да, нашият натиск, особено по теми, свързани с еврозоната, понякога дава ефект, но той е трудно измерем и лесно може да се отрече от управляващите. В опозиция сме, защото условията, които поставихме за участие във властта, не бяха изпълнени, а те бяха такива, защото не си представяме успешно упражняване на власт без премахване на механизмите за нелегитимно влияние. Но трябва винаги при такива решения да отчитаме и обратната страна – че извън властта не можем нито да спираме вредни за страната неща, нито да постигаме позитивни резултати. И този въпрос трябва да поставяме всеки следващ път, достатъчно рано и достатъчно ясно, за да можем заедно с избирателите да намерим решението спрямо ситуацията. И това решение да е насочено не само „за да не става по-зле“, а за да напредваме с по-бързи и некриволичещи стъпки към това България да е европейска държава. Тази яснота и откровеност и наличието на ясен план пък са начинът да бъдем в по-силна електоралена позиция, от която да можем да налагаме тези условия.
Материалът Оценка на отношението към упражняването на власт е публикуван за пръв път на БЛОГодаря.
Post Syndicated from digiblur DIY original https://www.youtube.com/shorts/hn3_Vqd89D0
Post Syndicated from Matthew Garrett original https://mjg59.dreamwidth.org/73001.html
There’s a lovely device called a pistorm, an adapter board that glues a Raspberry Pi GPIO bus to a Motorola 68000 bus. The intended use case is that you plug it into a 68000 device and then run an emulator that reads instructions from hardware (ROM or RAM) and emulates them. You’re still limited by the ~7MHz bus that the hardware is running at, but you can run the instructions as fast as you want.
These days you’re supposed to run a custom built OS on the Pi that just does 68000 emulation, but initially it ran Linux on the Pi and a userland 68000 emulator process. And, well, that got me thinking. The emulator takes 68000 instructions, emulates them, and then talks to the hardware to implement the effects of those instructions. What if we, well, just don’t? What if we just run all of our code in Linux on an ARM core and then talk to the Amiga hardware?
We’re going to ignore x86 here, because it’s weird – but most hardware that wants software to be able to communicate with it maps itself into the same address space that RAM is in. You can write to a byte of RAM, or you can write to a piece of hardware that’s effectively pretending to be RAM[1]. The Amiga wasn’t unusual in this respect in the 80s, and to talk to the graphics hardware you speak to a special address range that gets sent to that hardware instead of to RAM. The CPU knows nothing about this. It just indicates it wants to write to an address, and then sends the data.
So, if we are the CPU, we can just indicate that we want to write to an address, and provide the data. And those addresses can correspond to the hardware. So, we can write to the RAM that belongs to the Amiga, and we can write to the hardware that isn’t RAM but pretends to be. And that means we can run whatever we want on the Pi and then access Amiga hardware.
And, obviously, the thing we want to run is Doom, because that’s what everyone runs in fucked up hardware situations.
Doom was Amiga kryptonite. Its entire graphical model was based on memory directly representing the contents of your display, and being able to modify that by just moving pixels around. This worked because at the time VGA displays supported having a memory layout where each pixel on your screen was represented by a byte in memory containing an 8 bit value that corresponded to a lookup table containing the RGB value for that pixel.
The Amiga was, well, not good at this. Back in the 80s, when the Amiga hardware was developed, memory was expensive. Dedicating that much RAM to the video hardware was unthinkable – the Amiga 1000 initially shipped with only 256K of RAM, and you could fill all of that with a sufficiently colourful picture. So instead of having the idea of each pixel being associated with a specific area of memory, the Amiga used bitmaps. A bitmap is an area of memory that represents the screen, but only represents one bit of the colour depth. If you have a black and white display, you only need one bitmap. If you want to display four colours, you need two. More colours, more bitmaps. And each bitmap is stored in an independent area of RAM. You never use more memory than you need to display the number of colours you want to.
But that means that each bitplane contains packed information – every byte of data in a bitplane contains the bit value for 8 different pixels, because each bitplane contains one bit of information per pixel. To update one pixel on screen, you need to read from every bitmap, update one bit, and write it back, and that’s a lot of additional memory accesses. Doom, but on the Amiga, was slow not just because the CPU was slow, but because there was a lot of manipulation of data to turn it into the format the Amiga wanted and then push that over a fairly slow memory bus to have it displayed.
The CDTV was an aesthetically pleasing piece of hardware that absolutely sucked. It was an Amiga 500 in a hi-fi box with a caddy-loading CD drive, and it ran software that was just awful. There’s no path to remediation here. No compelling apps were ever released. It’s a terrible device. I love it. I bought one in 1996 because a local computer store had one and I pointed out that the company selling it had gone bankrupt some years earlier and literally nobody in my farming town was ever going to have any interest in buying a CD player that made a whirring noise when you turned it on because it had a fan and eventually they just sold it to me for not much money, and ever since then I wanted to have a CD player that ran Linux and well spoiler 30 years later I’m nearly there. That CDTV is going to be our test subject. We’re going to try to get Doom running on it without executing any 68000 instructions.
We’re facing two main problems here. The first is that all Amigas have a firmware ROM called Kickstart that runs at powerup. No matter how little you care about using any OS functionality, you can’t start running your code until Kickstart has run. This means even documentation describing bare metal Amiga programming assumes that the hardware is already in the state that Kickstart left it in. This will become important later. The second is that we’re going to need to actually write the code to use the Amiga hardware.
First, let’s talk about Amiga graphics. We’ve already covered bitmaps, but for anyone used to modern hardware that’s not the weirdest thing about what we’re dealing with here. The CDTV’s chipset supports a maximum of 64 colours in a mode called “Extra Half-Brite”, or EHB, where you have 32 colours arbitrarily chosen from a palette and then 32 more colours that are identical but with half the intensity. For 64 colours we need 6 bitplanes, each of which can be located arbitrarily in the region of RAM accessible to the chipset (“chip RAM”, distinguished from “fast ram” that’s only accessible to the CPU). We tell the chipset where our bitplanes are and it displays them. Or, well, it does for a frame – after that the registers that pointed at our bitplanes no longer do, because when the hardware was DMAing through the bitplanes to display them it was incrementing those registers to point at the next address to DMA from. Which means that every frame we need to set those registers back.
Making sure you have code that’s called every frame just to make your graphics work sounds intensely irritating, so Commodore gave us a way to avoid doing that. The chipset includes a coprocessor called “copper”. Copper doesn’t have a large set of features – in fact, it only has three. The first is that it can program chipset registers. The second is that it can wait for a specific point in screen scanout. The third (which we don’t care about here) is that it can optionally skip an instruction if a certain point in screen scanout has already been reached. We can write a program (a “copper list”) for the copper that tells it to program the chipset registers with the locations of our bitplanes and then wait until the end of the frame, at which point it will repeat the process. Now our bitplane pointers are always valid at the start of a frame.
Ok! We know how to display stuff. Now we just need to deal with not having 256 colours, and the whole “Doom expects pixels” thing. For the first of these, I stole code from ADoom, the only Amiga doom port I could easily find source for. This looks at the 256 colour palette loaded by Doom and calculates the closest approximation it can within the constraints of EHB. ADoom also includes a bunch of CPU-specific assembly optimisation for converting the “chunky” Doom graphic buffer into the “planar” Amiga bitplanes, none of which I used because (a) it’s all for 68000 series CPUs and we’re running on ARM, and (b) I have a quad core CPU running at 1.4GHz and I’m going to be pushing all the graphics over a 7.14MHz bus, the graphics mode conversion is not going to be the bottleneck here. Instead I just wrote a series of nested for loops that iterate through each pixel and update each bitplane and called it a day. The set of bitplanes I’m operating on here is allocated on the Linux side so I can read and write to them without being restricted by the speed of the Amiga bus (remember, each byte in each bitplane is going to be updated 8 times per frame, because it holds bits associated with 8 pixels), and then copied over to the Amiga’s RAM once the frame is complete.
And, kind of astonishingly, this works! Once I’d figured out where I was going wrong with RGB ordering and which order the bitplanes go in, I had a recognisable copy of Doom running. Unfortunately there were weird graphical glitches – sometimes blocks would be entirely the wrong colour. It took me a while to figure out what was going on and then I felt stupid. Recording the screen and watching in slow motion revealed that the glitches often showed parts of two frames displaying at once. The Amiga hardware is taking responsibility for scanning out the frames, and the code on the Linux side isn’t synchronised with it at all. That means I could update the bitplanes while the Amiga was scanning them out, resulting in a mashup of planes from two different Doom frames being used as one Amiga frame. One approach to avoid this would be to tie the Doom event loop to the Amiga, blocking my writes until the end of scanout. The other is to use double-buffering – have two sets of bitplanes, one being displayed and the other being written to. This consumes more RAM but since I’m not using the Amiga RAM for anything else that’s not a problem. With this approach I have two copper lists, one for each set of bitplanes, and switch between them on each frame. This improved things a lot but not entirely, and there’s still glitches when the palette is being updated (because there’s only one set of colour registers), something Doom does rather a lot, so I’m going to need to implement proper synchronisation.
Except. This was only working if I ran a 68K emulator first in order to run Kickstart. If I tried accessing the hardware without doing that, things were in a weird state. I could update the colour registers, but accessing RAM didn’t work – I could read stuff out, but anything I wrote vanished. Some more digging cleared that up. When you turn on a CPU it needs to start executing code from somewhere. On modern x86 systems it starts from a hardcoded address of 0xFFFFFFF0, which was traditionally a long way any RAM. The 68000 family instead reads its start address from address 0x00000004, which overlaps with where the Amiga chip RAM is. We can’t write anything to RAM until we’re executing code, and we can’t execute code until we tell the CPU where the code is, which seems like a problem. This is solved on the Amiga by powering up in a state where the Kickstart ROM is “overlayed” onto address 0. The CPU reads the start address from the ROM, which causes it to jump into the ROM and start executing code there. Early on, the code tells the hardware to stop overlaying the ROM onto the low addresses, and now the RAM is available. This is poorly documented because it’s not something you need to care if you execute Kickstart which every actual Amiga does
and I’m only in this position because I’ve made poor life choices, but ok that explained things. To turn off the overlay you write to a register in one of the Complex Interface Adaptor (CIA) chips, and things start working like you’d expect.
Except, they don’t. Writing to that register did nothing for me. I assumed that there was some other register I needed to write to first, and went to the extent of tracing every register access that occurred when running the emulator and replaying those in my code. Nope, still broken. What I finally discovered is that you need to pulse the reset line on the board before some of the hardware starts working – powering it up doesn’t put you in a well defined state, but resetting it does.
So, I now have a slightly graphically glitchy copy of Doom running without any sound, displaying on an Amiga whose brain has been replaced with a parasitic Linux. Further updates will likely make things even worse. Code is, of course, available.
[1] This is why we had trouble with late era 32 bit systems and 4GB of RAM – a bunch of your hardware wanted to be in the same address space and so you couldn’t put RAM there so you ended up with less than 4GB of RAM
 comments
Post Syndicated from The History Guy: History Deserves to Be Remembered original https://www.youtube.com/shorts/Xjo1hvdQ8FI
Post Syndicated from Explosm.net original https://explosm.net/comics/woah-you-have-a-time-machine
New Cyanide and Happiness Comic
Post Syndicated from Cliff Robinson original https://www.servethehome.com/broadcom-jericho4-51-2tbps-ai-router-chip-now-shipping-with-3-2tbps-hyperports/
The new Broadcom Jericho4 is a 51.2Tbps AI router chip that is now shipping with 3.2Tbps HyperPorts for higher throughput
The post Broadcom Jericho4 51.2Tbps AI Router Chip Now Shipping with 3.2Tbps HyperPorts appeared first on ServeTheHome.
Post Syndicated from Cliff Robinson original https://www.servethehome.com/nvidia-cuda-toolkit-13-0-is-out/
NVIDIA CUDA Toolkit 13.0 is out and brings new features and driver version requirements to the AI ecosystem
The post NVIDIA CUDA Toolkit 13.0 Is Out appeared first on ServeTheHome.
Post Syndicated from Cliff Robinson original https://www.servethehome.com/storage-ai-project-by-snia-looks-to-re-frame-ai-storage-discussion/
The new SNIA Storage.AI project looks to rationalize where and how storage is connected to AI clusters using open standards
The post Storage.AI Project by SNIA Looks to Re-frame AI Storage Discussion appeared first on ServeTheHome.
Post Syndicated from LastWeekTonight original https://www.youtube.com/shorts/_R3uMbUyyaI
Post Syndicated from Amit Maindola original https://aws.amazon.com/blogs/big-data/develop-and-deploy-a-generative-ai-application-using-amazon-sagemaker-unified-studio/
Picture this: You’re a financial analyst starting your Monday morning with a steaming cup of coffee, ready to review your investment portfolio. But instead of manually scouring dozens of news websites, financial reports, and industry analyses, you simply ask your AI assistant: “What global events happened over the weekend that might impact my technology stock holdings?” Within seconds, you receive a comprehensive analysis of relevant news, sentiment scores, and potential investment implications—all powered by a sophisticated generative AI application you built yourself.
This scenario isn’t science fiction; it’s the reality that modern financial professionals can create today. In an era where information moves at the speed of light and industry conditions can shift dramatically overnight, staying informed isn’t just an advantage—it’s essential for survival in competitive financial landscapes. The challenge lies in processing the overwhelming volume of global information that could impact investments while distinguishing reliable insights from noise.
Luckily for us, technology is making this more straightforward. The next generation of Amazon SageMaker with Amazon SageMaker Unified Studio is a single data and AI development environment where you can find and access the data in your organization and act on it using the best tools across different use cases. SageMaker Unified Studio brings together the functionality and tools from existing AWS analytics and artificial intelligence and machine learning (AI/ML) services, including Amazon EMR , AWS Glue, Amazon Athena, Amazon Redshift , Amazon Bedrock, and Amazon SageMaker AI. From within SageMaker Unified Studio, you can find, access, and query data and AI assets across your organization, then work together in projects to securely build and share analytics and AI artifacts, including data, models, and generative AI applications.
With SageMaker Unified Studio, you can efficiently build generative AI applications in a trusted and secure environment using Amazon Bedrock. You can choose from a selection of high-performing foundation models (FMs) and advanced customization capabilities like Amazon Bedrock Knowledge Bases, Amazon Bedrock Guardrails, Amazon Bedrock Agents, and Amazon Bedrock Flows. You can rapidly tailor and deploy generative AI applications and share with the built-in catalog for discovery.
What makes SageMaker Unified Studio particularly powerful for organizations is its integration with Amazon Bedrock Flows to build generative AI workflows, which is changing how organizations think about AI application development.
With Amazon Bedrock Flows, you can build and execute complex generative AI workflows without writing code, using an intuitive visual interface that democratizes AI development. This capability is transformative for organizations where speed, accuracy, and adaptability are paramount. It offers the following benefits:
In this post, we explore a financial use case, in which we want to stay on top of latest global events and determine our investment or financial exposure based on this. We can use a SageMaker Unified Studio flow application to pull in latest news summaries, derive sentiment based on news summary, and determine their effects on my investments. The following diagram illustrates this use case.
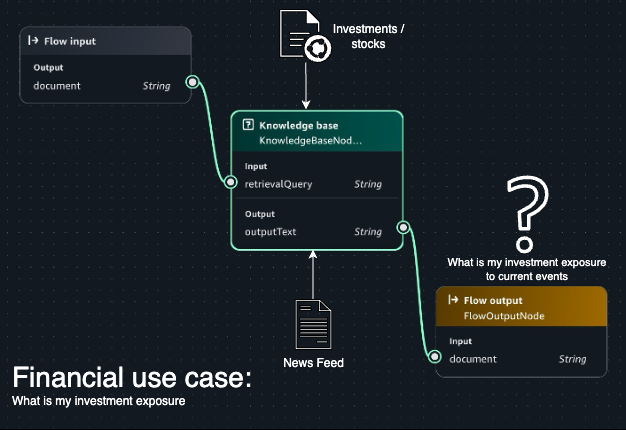
In the following sections, we show how to create a new project and build a flow application using a generative AI profile in SageMaker Unified Studio.
For this walkthrough, you must have the following prerequisites:
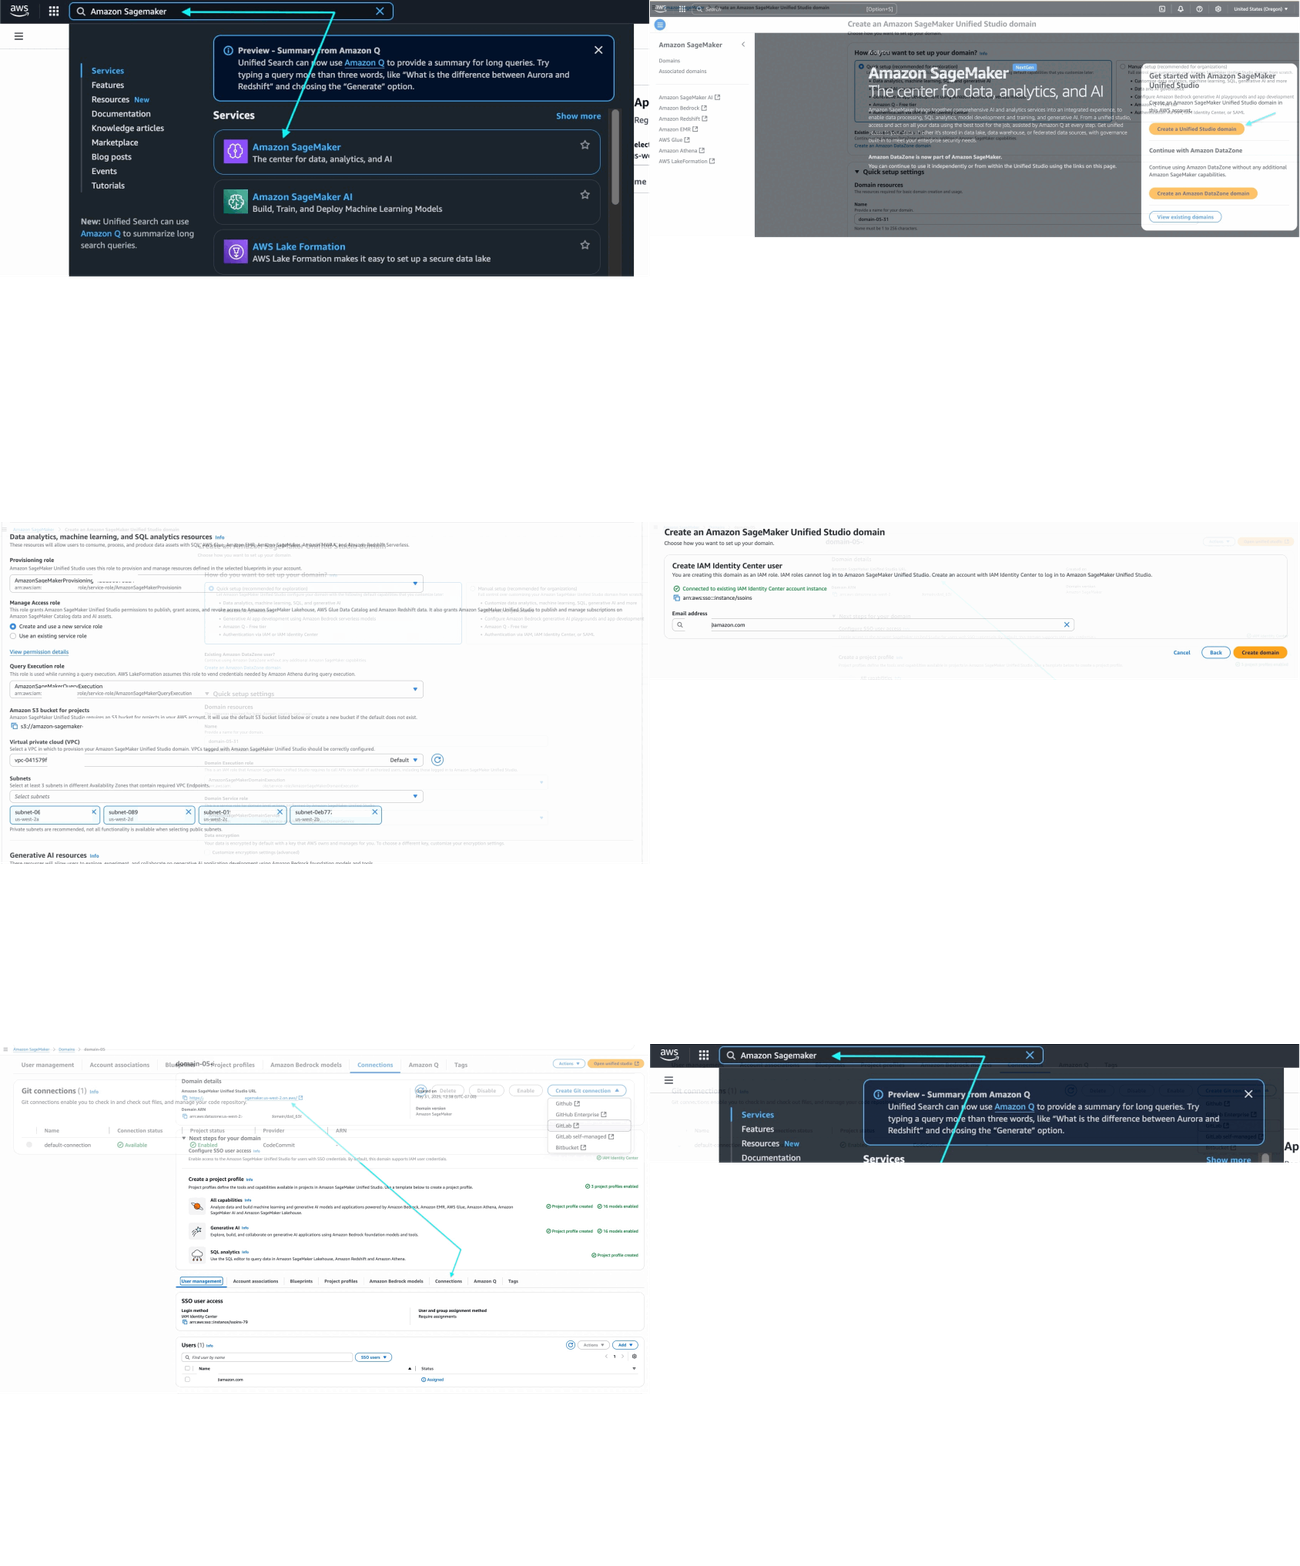
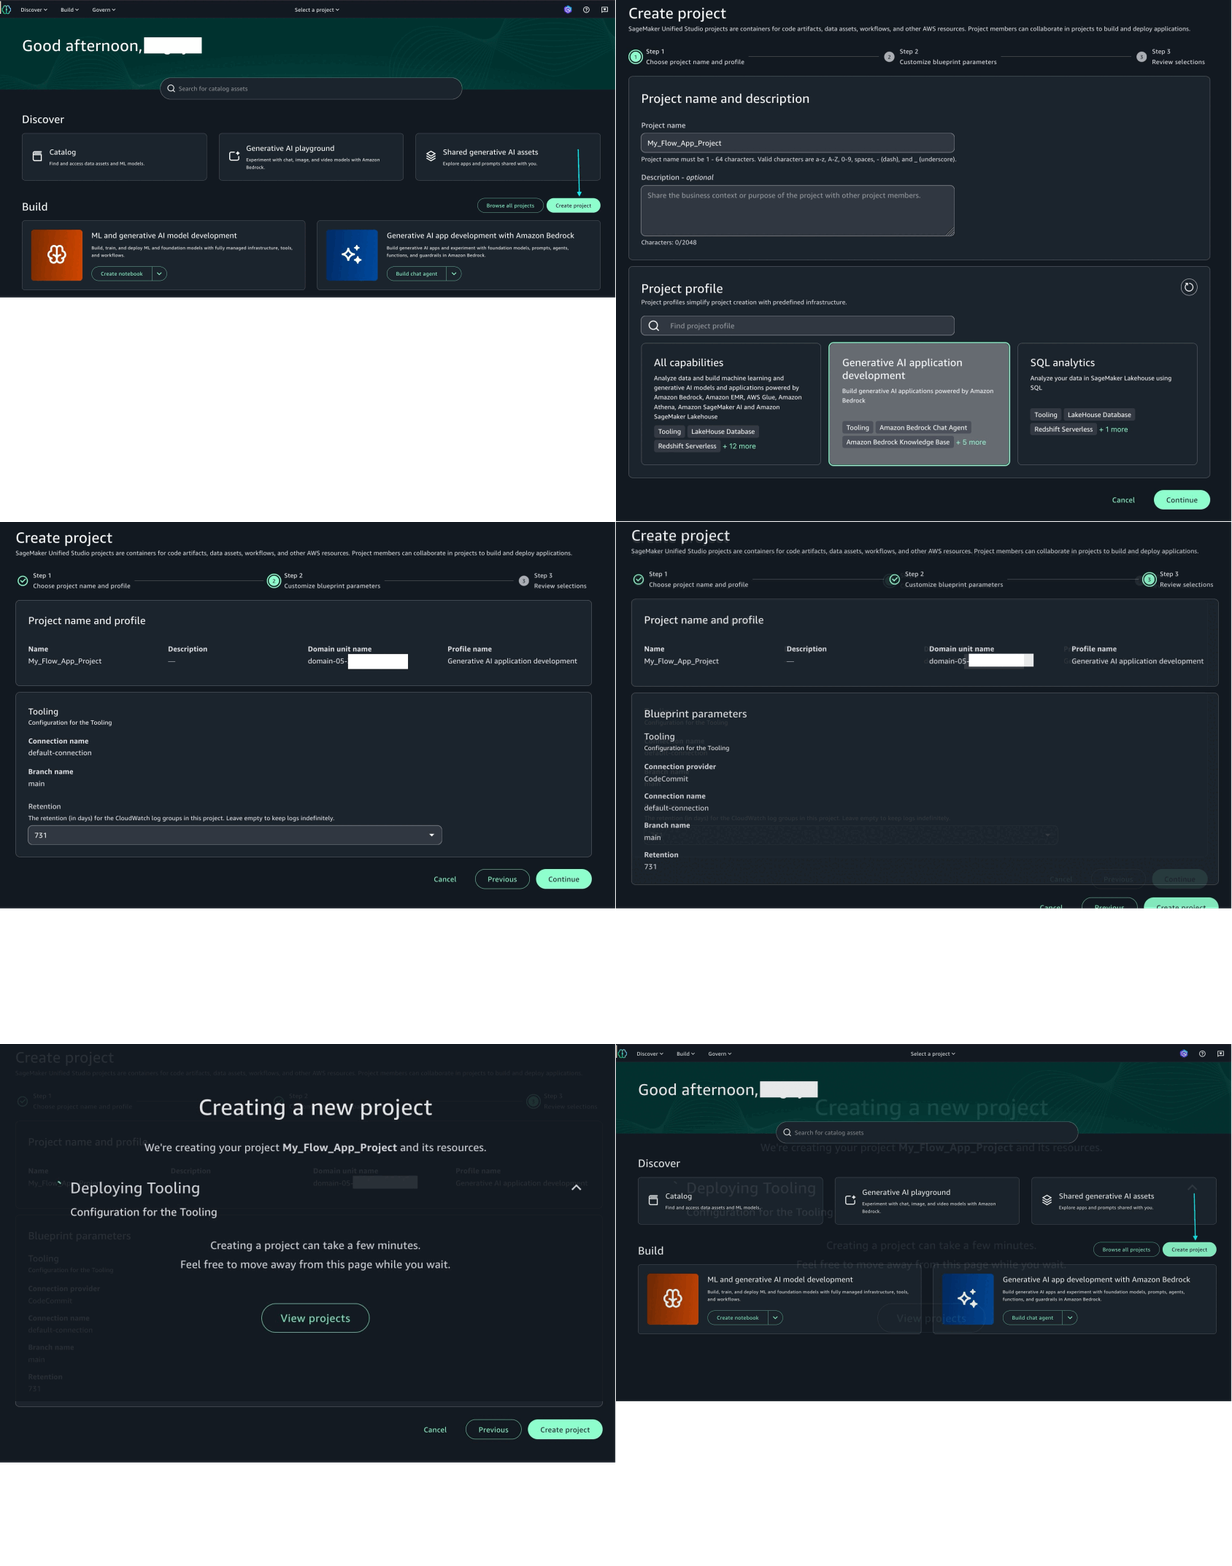
In this section, we create a new a flow application that uses an Amazon Bedrock knowledge base to provide information about your personal portfolio. Complete the following steps:
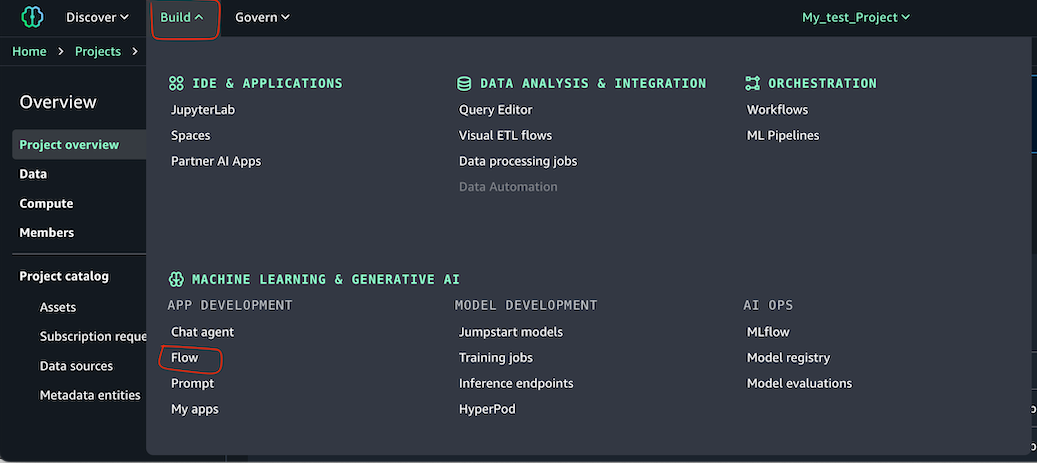
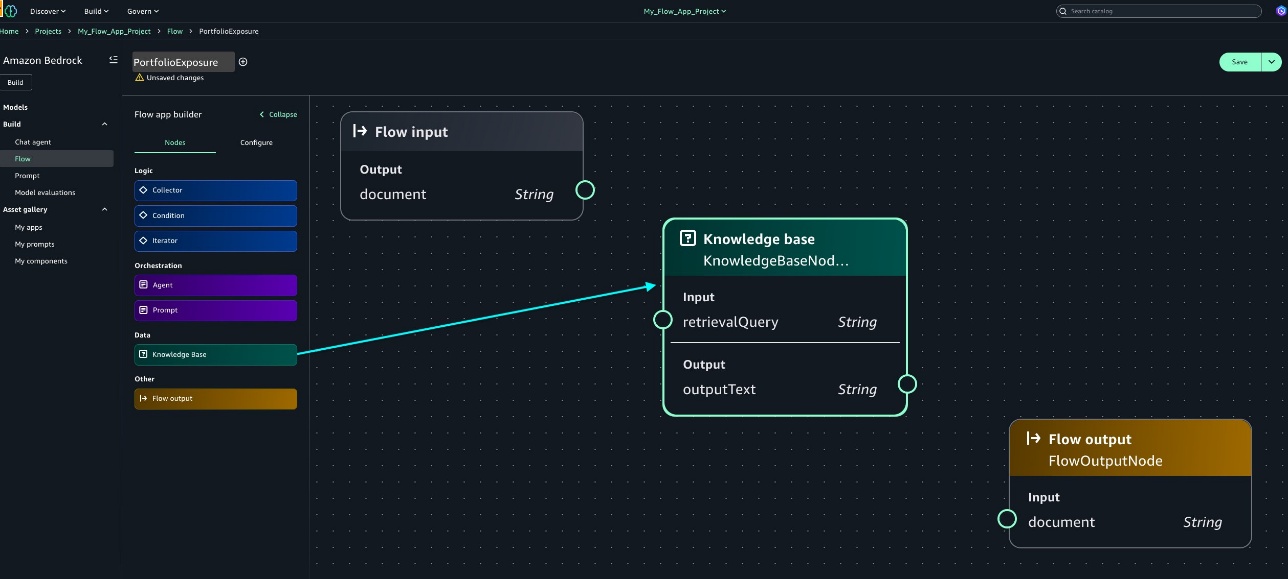
portfolio…).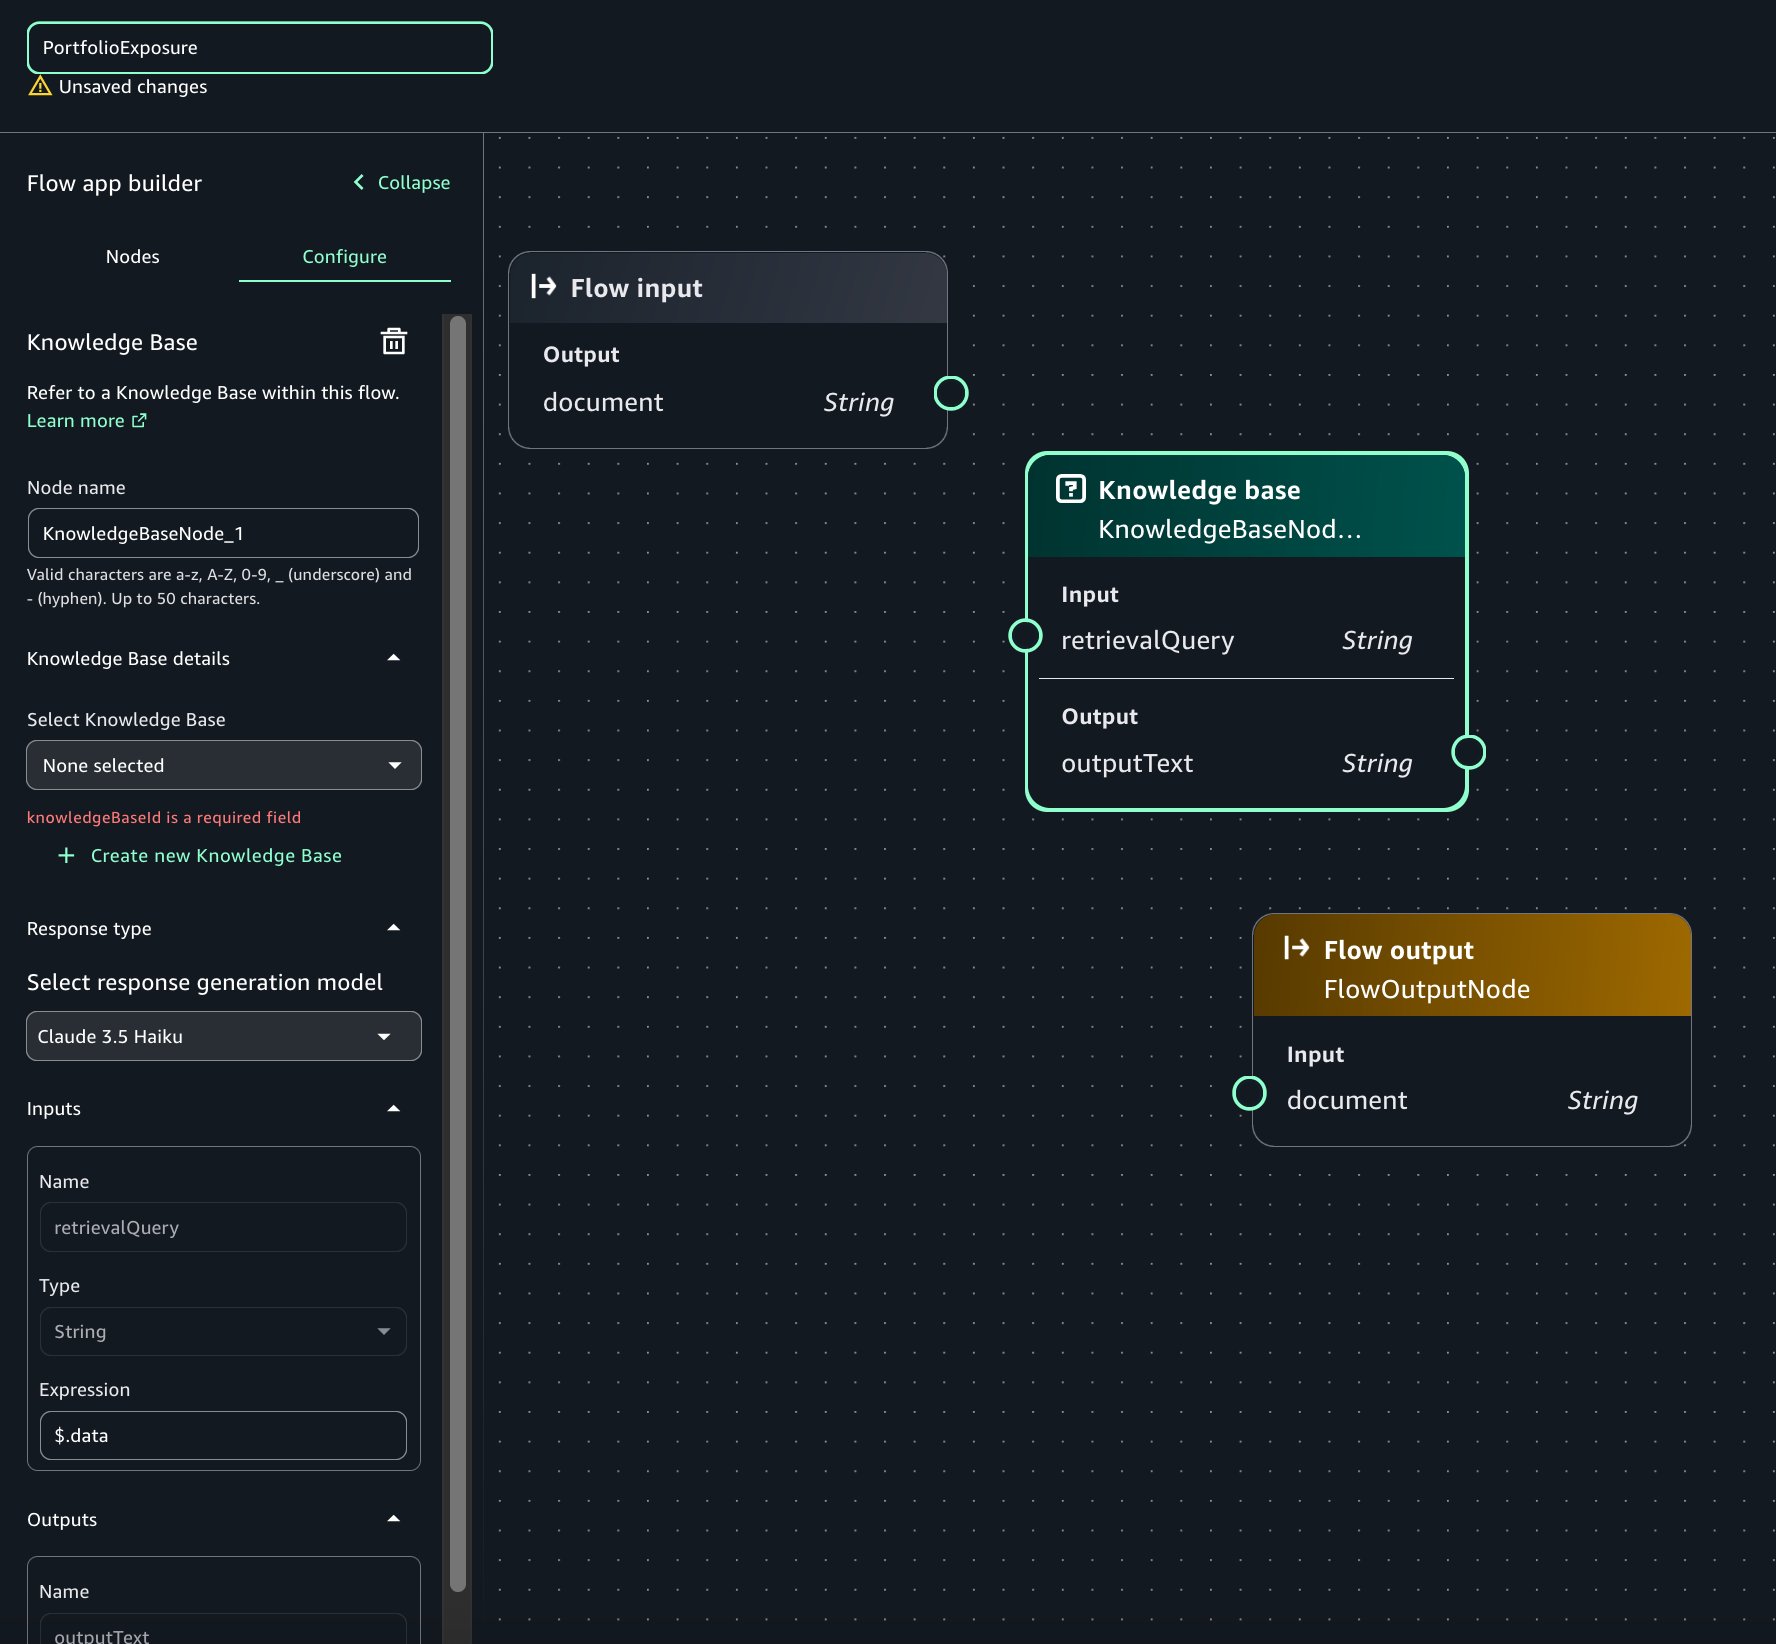
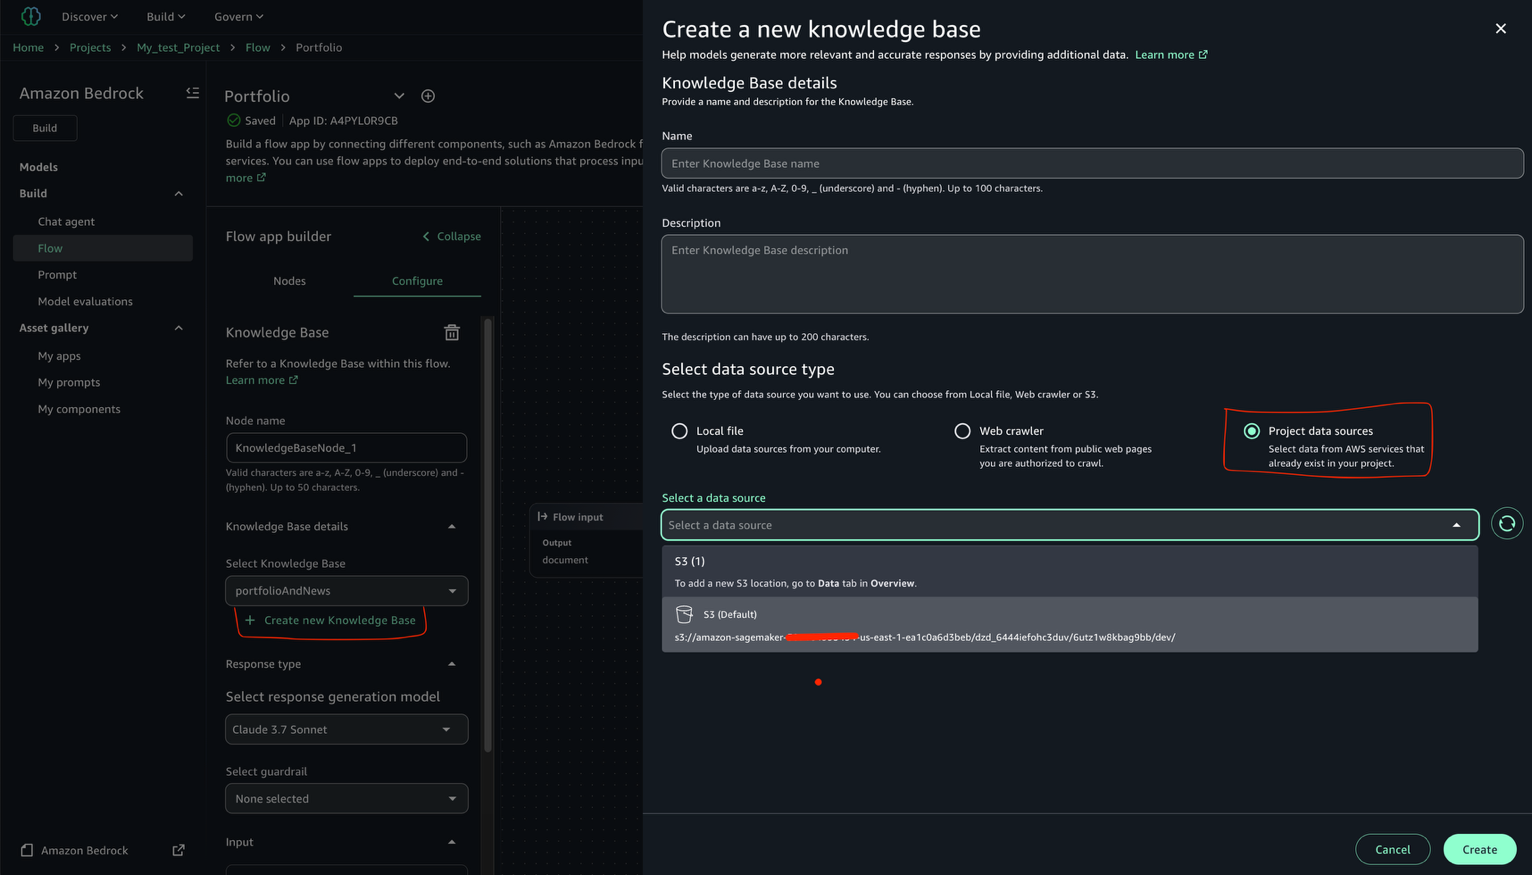
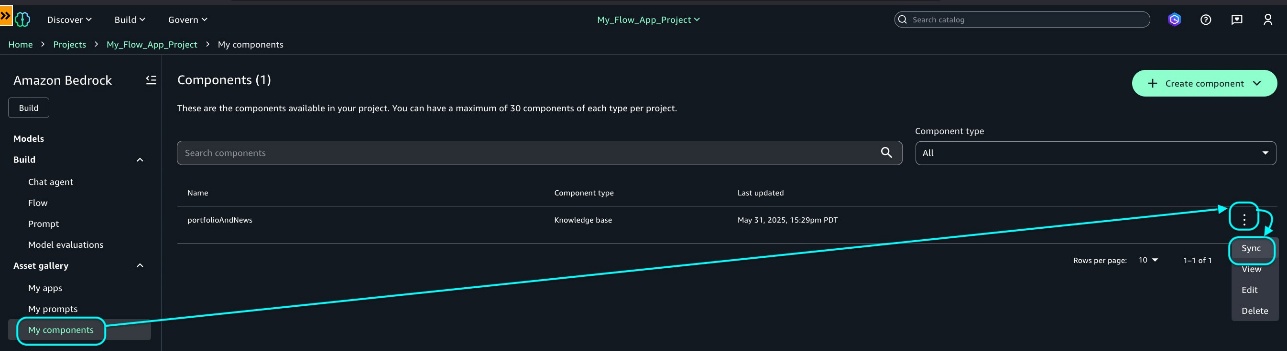
The knowledge base creation process takes a few minutes to complete.
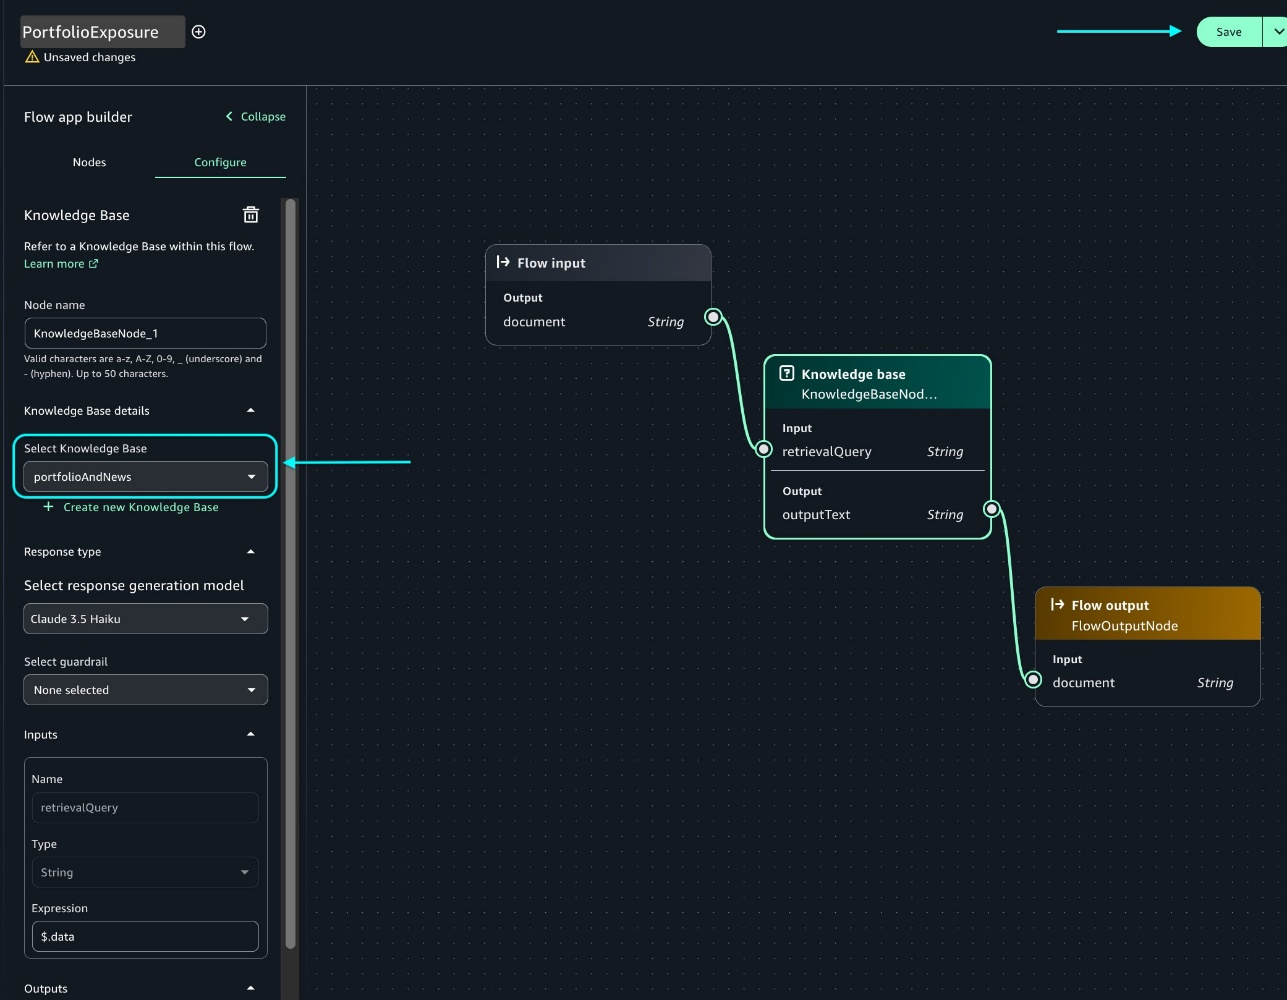
Make sure the S3 bucket has all the data (user portfolio data and latest news information data) before syncing the knowledge base.
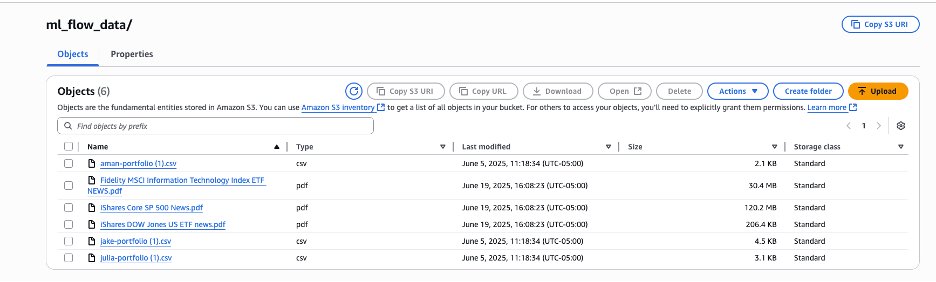
We don’t provide any financial or news information data as part of this post. Upload current events or news data and investment portfolio data from your own data sources.
After the knowledge base sync is complete, you can return to the flow application and ask questions. Using SageMaker Unified Studio flows, a financial analyst can provide a more personalized and customized financial outlook to their customers using rich internal financial information on their customer’s investment portfolio and latest publicly available current events and news information. The following are some example questions that you can ask to test the knowledge base:
Check if Tesla or Apple is in any of user's investment portfolio
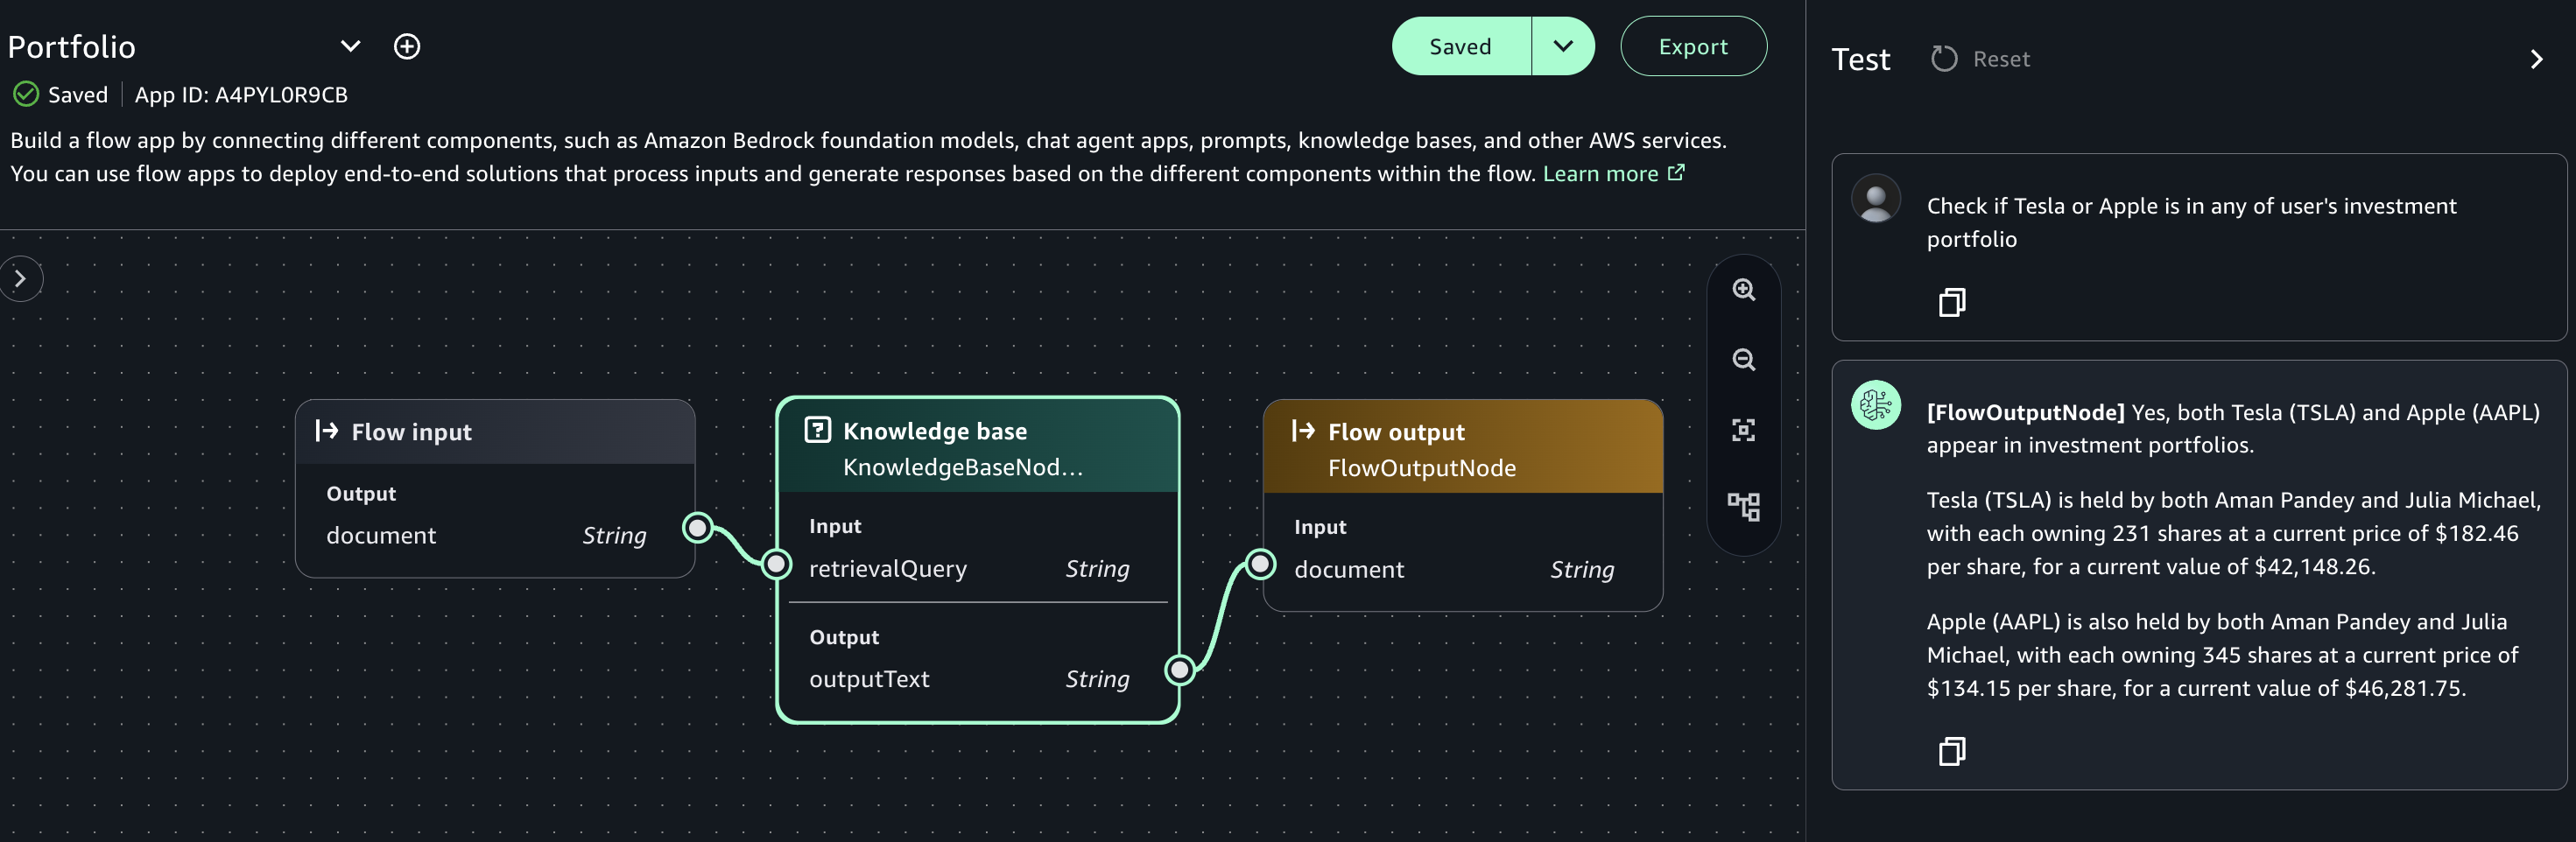
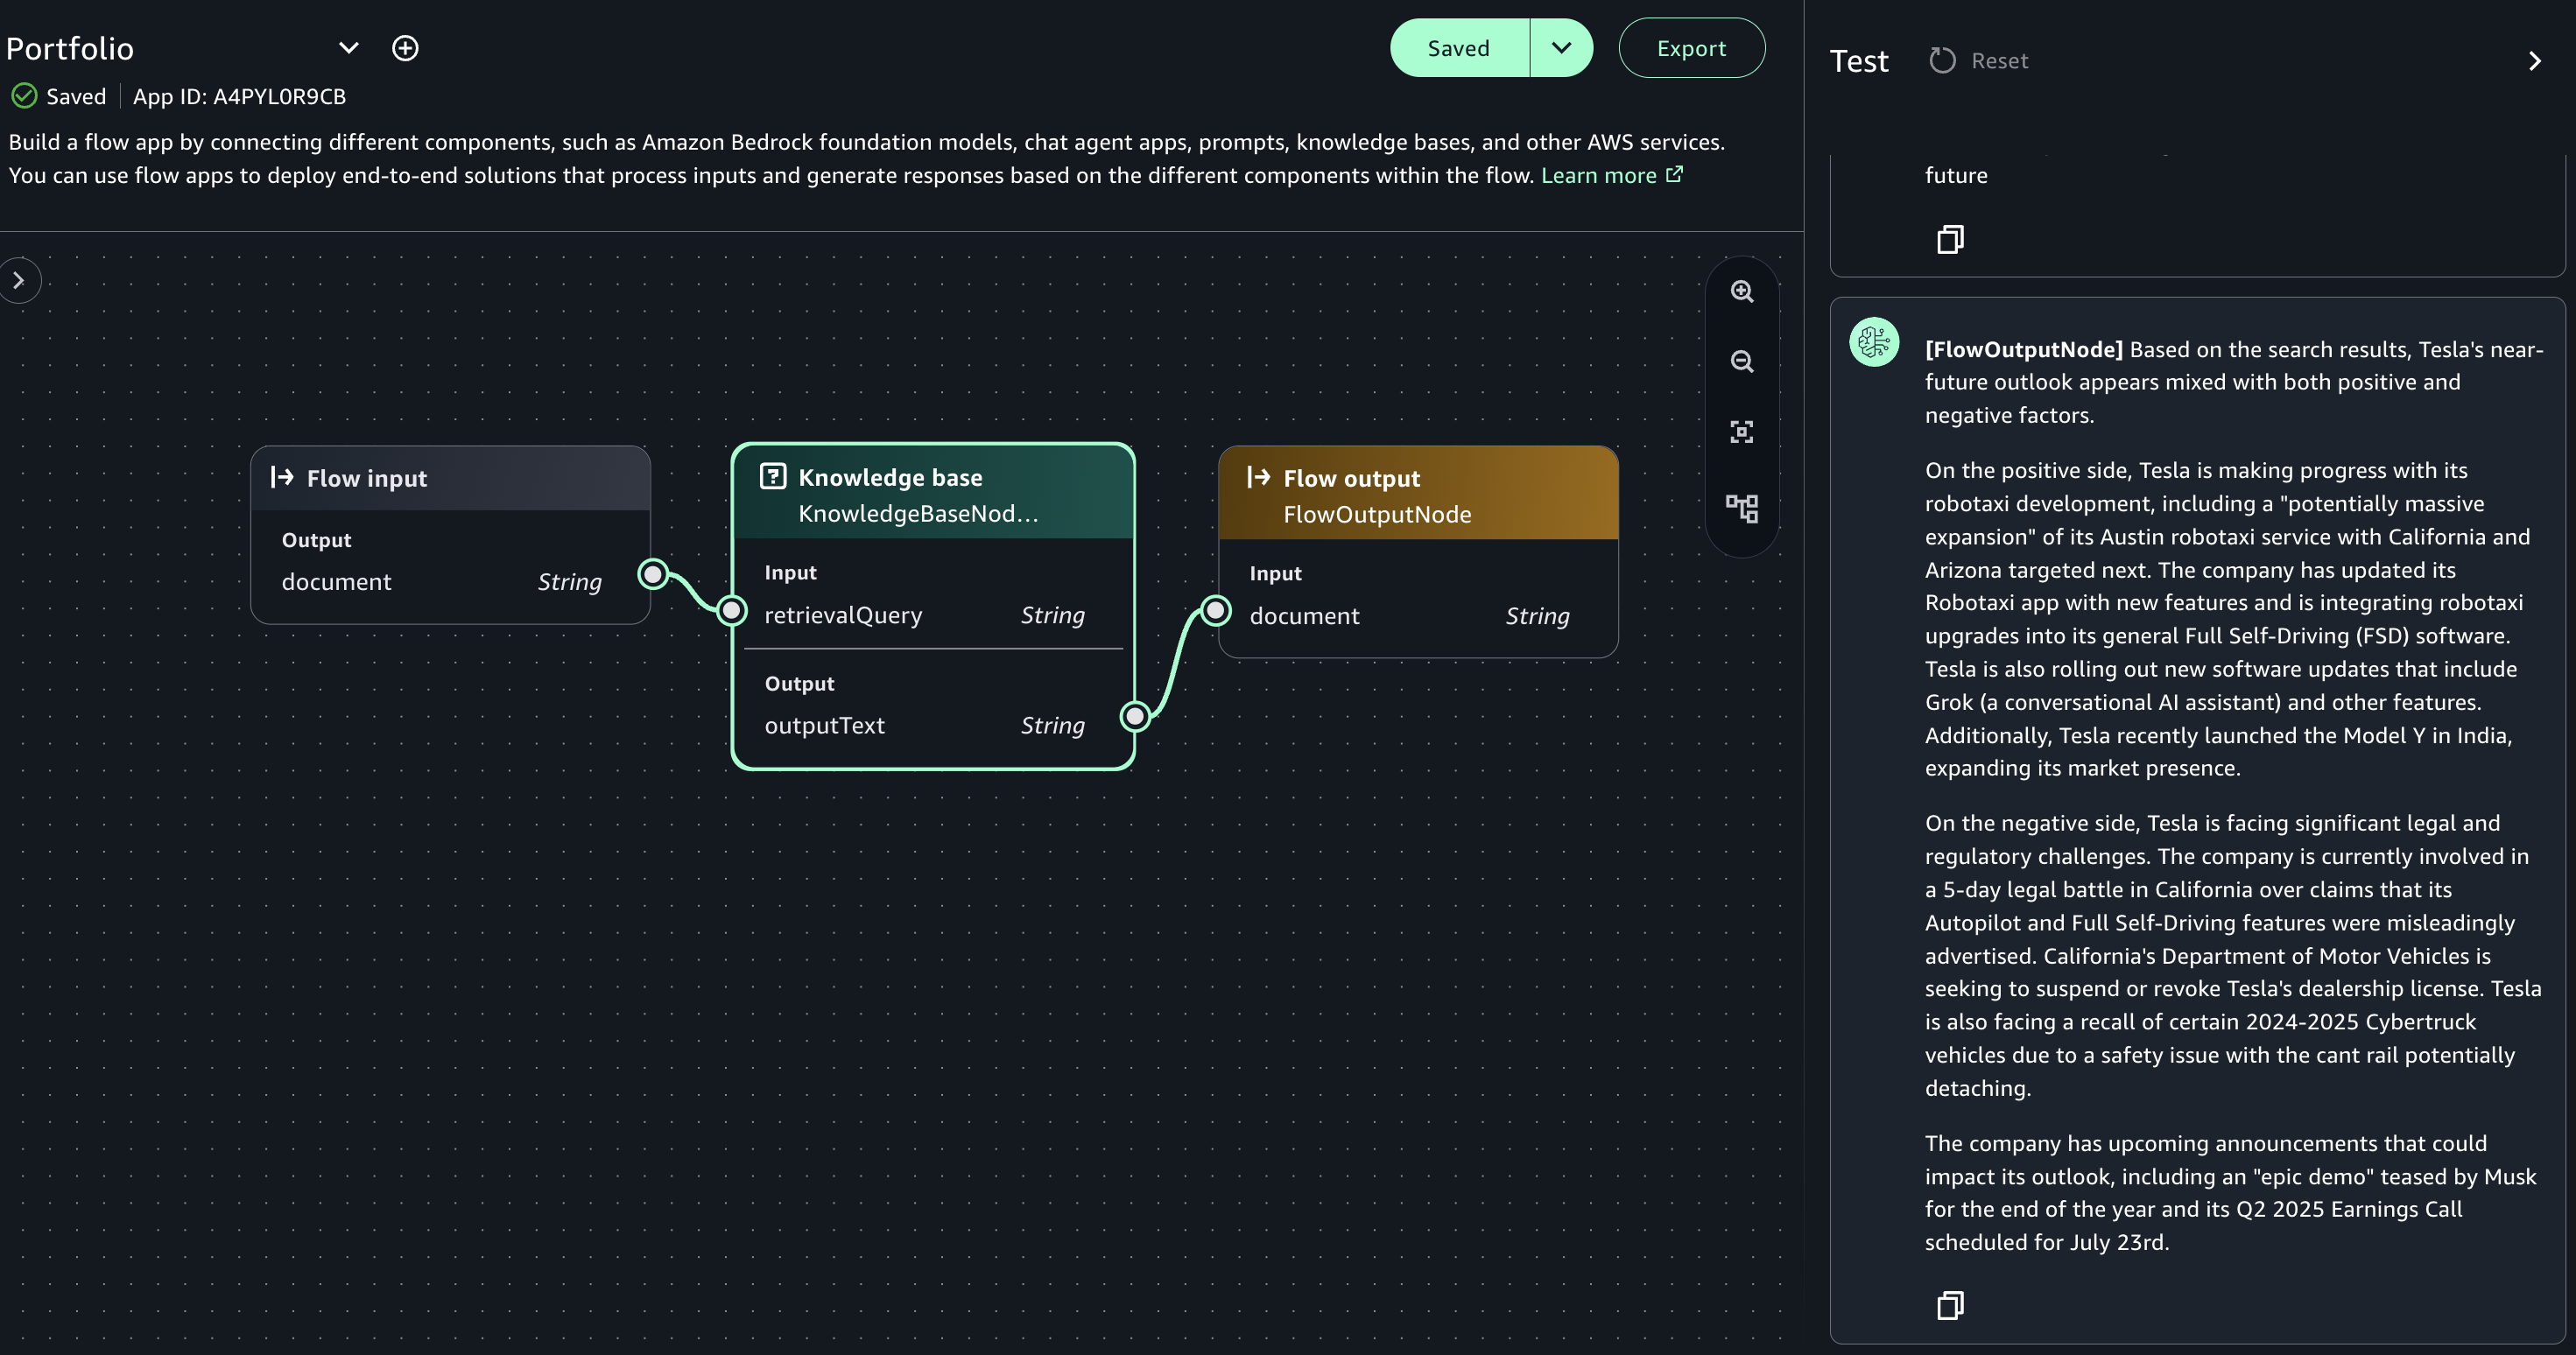
Flow-based applications offer a visual approach to creating complex AI workflows. By chaining different nodes, each optimized for specific functions, you can create sophisticated solutions that are more reliable, maintainable, and efficient than single-prompt approaches. These flows allow for conditional logic and branching paths, mimicking human decision-making processes and enabling more nuanced responses based on context and intermediate results.
To avoid ongoing charges in your AWS account, delete the resources you created during this tutorial:
In this post, we demonstrated how to use Amazon Bedrock Flows in SageMaker Unified Studio to build a sophisticated generative AI application for financial analysis and investment decision-making without extensive coding knowledge. With this integration, you can create sophisticated financial analysis workflows through an intuitive visual interface, where you can process industry data, analyze news sentiment, and assess investment implications in real time. The solution integrates seamlessly with AWS services and FMs while providing essential features like automatic scaling, compliance controls, and audit capabilities. The implementation process involves setting up a SageMaker Unified Studio domain, configuring knowledge bases with portfolio and news data, and creating visual workflows that can analyze complex financial information. This democratized approach to AI development allows both technical and business teams to collaborate effectively, significantly reducing development time while maintaining the sophisticated capabilities needed for modern financial analysis.
To get started, explore the SageMaker Unified Studio documentation, set up a project in your AWS environment, and discover how this solution can transform your organization’s data analytics capabilities.
 Amit Maindola is a Senior Data Architect focused on data engineering, analytics, and AI/ML at Amazon Web Services. He helps customers in their digital transformation journey and enables them to build highly scalable, robust, and secure cloud-based analytical solutions on AWS to gain timely insights and make critical business decisions.
 Arghya Banerjee is a Sr. Solutions Architect at AWS in the San Francisco Bay Area, focused on helping customers adopt and use the AWS Cloud. He is focused on big data, data lakes, streaming and batch analytics services, and generative AI technologies.
 Melody Yang is a Principal Analytics Architect for Amazon EMR at AWS. She is an experienced analytics leader working with AWS customers to provide best practice guidance and technical advice in order to assist their success in data transformation. Her areas of interests are open-source frameworks and automation, data engineering and DataOps.
 Gaurav Parekh is a Solutions Architect at AWS, specializing in generative AI and data analytics, with extensive experience building production AI systems on AWS.
Post Syndicated from Konstantinos Tzouvanas original https://aws.amazon.com/blogs/big-data/near-real-time-streaming-analytics-on-protobuf-with-amazon-redshift/
Organizations must often deal with a vast array of data formats and sources in their data analytics workloads. This range of data types, such as structured relational data, semi-structured formats like JSON and XML and even binary formats like Protobuf and Avro, has presented new challenges for companies looking to extract valuable insights.
Protocol Buffers (protobuf) has gained significant traction in industries that require efficient data serialization and transmission, particularly in streaming data scenarios. Protobuf’s compact binary representation, language-agnostic nature, and strong typing make it an attractive choice for companies in sectors such as finance, gaming, telecommunications, and ecommerce, where high-throughput and low-latency data processing is crucial.
Although protobuf offers advantages in efficient data serialization and transmission, its binary nature poses challenges when it comes to analytics use cases. Unlike formats like JSON or XML, which can be directly queried and analyzed, protobuf data requires an additional deserialization step to convert it from its compact binary format into a structure suitable for processing and analysis. This extra conversion step introduces complexity into data analytics pipelines and tools. It can potentially slow down data exploration and analysis, especially in scenarios where near real-time insights are crucial.
In this post, we explore an end-to-end analytics workload for streaming protobuf data, by showcasing how to handle these data streams with Amazon Redshift Streaming Ingestion, deserializing and processing them using AWS Lambda functions, so that the incoming streams are immediately available for querying and analytical processing on Amazon Redshift.
The solution provides a solid foundation for handling protobuf data in Amazon Redshift. You can further enhance the architecture to support schema evolution by incorporating AWS Glue Schema Registry. By integrating the AWS Glue Schema Registry, you can make sure your Lambda function uses the latest schema version for deserialization, even as your data structure changes over time. However, for the purpose of this post and to maintain simplicity, we focus on demonstrating how to invoke Lambda from Amazon Redshift to convert protobuf messages to JSON format, which serves as a solid foundation for handling binary data in near real-time analytics scenarios.
The following architecture diagram describes the AWS services and features needed to set up a fully functional protobuf streaming ingestion pipeline for near real-time analytics.
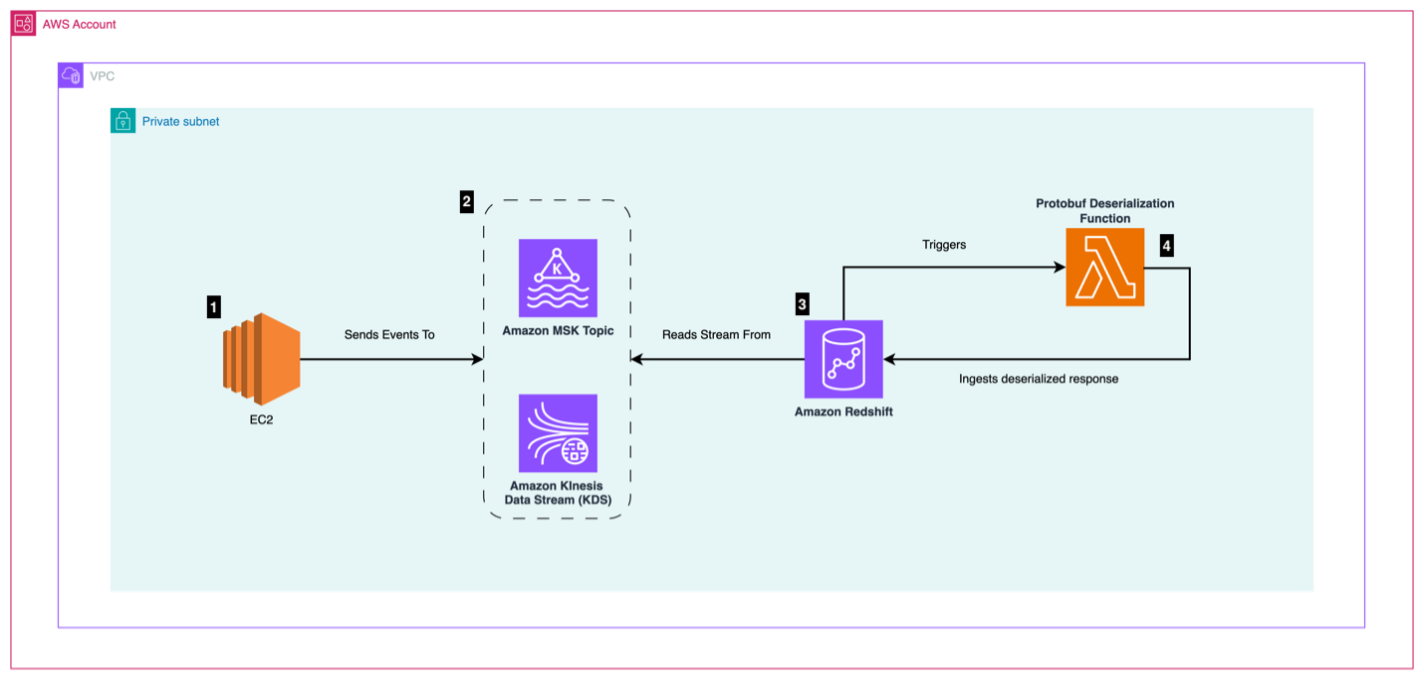
The workflow consists of the following steps:
To showcase protobuf’s deserialization functionality, we use a sample protobuf schema that represents a financial trade transaction. This schema will be used across the AWS services mentioned in this post.
In order for Amazon Redshift to ingest streaming data from Amazon MSK or Kinesis, an appropriate role needs to be assigned to Amazon Redshift and a materialized view needs to be properly defined. For detailed instructions on how to accomplish this, refer to Streaming ingestion to a materialized view or Simplify data streaming ingestion for analytics using Amazon MSK and Amazon Redshift.
In this section, we focus on the materialized view definition that makes it possible to deserialize protobuf data. Our example focuses on streaming ingestion from Amazon MSK. Typically, the materialized view ingests the Kafka metadata fields and the actual data (kafka_value) like in the following example:
When the incoming kafka_value is of type JSON, you can apply the built-in JSON_PARSE function and create a column of type SUPER so you can directly query the data.
In our case, accepting protobuf encoded data requires some additional steps. The first step is to create an Amazon Redshift Lambda user-defined function (UDF). This Amazon Redshift function is the link to a Lambda function that executes the actual deserialization. This way, when data is ingested, Amazon Redshift calls the Lambda function for deserialization.
Creating or updating our Amazon Redshift Lambda UDF is straightforward, as illustrated in the following code. Additional examples are available in the GitHub repo.
Because Lambda functions don’t (at the time of writing) accept binary data as input, you must first convert incoming binary data to its hex representation, prior to calling the function. You can do this by using the TO_HEX Amazon Redshift function.
Considering the hex conversation and with the Lambda UDF available, you can now use it in your materialized view definition:
Lambda functions require access to appropriate protobuf libraries, so that deserialization can take place. You can implement this through a Lambda layer. The layer is provided as a zip file, respecting the following folder structure, and contains the protobuf library, its dependencies, and user-provided code inside the custom folder, which includes the protobuf generated classes:
Because we implemented the Lambda functions in Python, the root folder of the zip file is the python folder. For additional languages, refer to the documentation on how to properly structure your folder structure.
A Lambda function converts incoming protobuf records to JSON records. As a first step, you must import your custom classes from the lambda Layer custom folder:
You can now deserialize incoming hex encoded binary data to objects. This is implemented in a two-step process. The first step is to decode the hex encoded binary data:
Next, you instantiate the protobuf defined classes and execute the actual deserialization process using the protobuf library method ParseFromString:
After you run deserialization and instantiate your objects, you can convert to other formats. In our case, we serialize into JSON format, so that Amazon Redshift ingests the JSON content in a single field of type SUPER:
Combining these steps together, the Lambda function should look as follows:
Post Syndicated from Danilo Poccia original https://aws.amazon.com/blogs/aws/aws-weekly-roundup-amazon-documentdb-aws-lambda-amazon-ec2-and-more-august-4-2025/
This week brings an array of innovations spanning from generative AI capabilities to enhancements of foundational services. Whether you’re building AI-powered applications, managing databases, or optimizing your cloud infrastructure, these updates help build more advanced, robust, and flexible applications.
Last week’s launches
Here are the launches that got my attention this week:
Additional updates
Here are some additional projects, blog posts, and news items that I found interesting:
Upcoming AWS events
Check your calendars so that you can sign up for these upcoming events:
AWS re:Invent 2025 (December 1-5, 2025, Las Vegas) — AWS’s flagship annual conference offering collaborative innovation through peer-to-peer learning, expert-led discussions, and invaluable networking opportunities.
AWS Summits — Join free online and in-person events that bring the cloud computing community together to connect, collaborate, and learn about AWS. Register in your nearest city: Mexico City (August 6) and Jakarta (August 7).
AWS Community Days — Join community-led conferences that feature technical discussions, workshops, and hands-on labs led by expert AWS users and industry leaders from around the world: Australia (August 15), Adria (September 5), Baltic (September 10), and Aotearoa (September 18).
Join the AWS Builder Center to learn, build, and connect with builders in the AWS community. Browse here upcoming in-person and virtual developer-focused events.
That’s all for this week. Check back next Monday for another Weekly Roundup!
– Danilo
Post Syndicated from jzb original https://lwn.net/Articles/1031750/
A pair of packages containing fortune “cookies” that were
deemed offensive have been removed from the upcoming Debian 13
(“trixie”) release. This has, of course, led to a lengthy discussion
and debate about what does, or does not, belong in the
distribution. It may also lead to a general resolution (GR) to decide
whether Debian’s code
of conduct (CoC) applies to the contents of packages.
Post Syndicated from jake original https://lwn.net/Articles/1032371/
Security updates have been issued by AlmaLinux (java-21-openjdk, kernel, libxml2, and lz4), Debian (exempi, ruby-graphql, and sope), Fedora (binutils, chromium, gdk-pixbuf2, libsoup3, poppler, and reposurgeon), Mageia (glib2.0 and wxgtk), Oracle (jackson-annotations, jackson-core, jackson-databind, jackson-jaxrs-providers, and jackson-modules-base and libxml2), Red Hat (kernel, pandoc, pcs, qemu-kvm, redis, and rsync), SUSE (chromedriver, coreutils, cosign, docker, gdk-pixbuf-devel, glib2, gnutls, grub2, gstreamer-plugins-base, helm, ignition, java-21-openjdk, jbigkit, jq, kernel, kubernetes1.28, kwctl, libxml2, nvidia-open-driver-G06-signed, opensc, pam-config, protobuf, python310, tgt, and valkey), and Ubuntu (linux-iot).
Post Syndicated from Gabriel Corral original https://blog.cloudflare.com/perplexity-is-using-stealth-undeclared-crawlers-to-evade-website-no-crawl-directives/
We are observing stealth crawling behavior from Perplexity, an AI-powered answer engine. Although Perplexity initially crawls from their declared user agent, when they are presented with a network block, they appear to obscure their crawling identity in an attempt to circumvent the website’s preferences. We see continued evidence that Perplexity is repeatedly modifying their user agent and changing their source ASNs to hide their crawling activity, as well as ignoring — or sometimes failing to even fetch — robots.txt files.
The Internet as we have known it for the past three decades is rapidly changing, but one thing remains constant: it is built on trust. There are clear preferences that crawlers should be transparent, serve a clear purpose, perform a specific activity, and, most importantly, follow website directives and preferences. Based on Perplexity’s observed behavior, which is incompatible with those preferences, we have de-listed them as a verified bot and added heuristics to our managed rules that block this stealth crawling.
We received complaints from customers who had both disallowed Perplexity crawling activity in their robots.txt files and also created WAF rules to specifically block both of Perplexity’s declared crawlers: PerplexityBot and Perplexity-User. These customers told us that Perplexity was still able to access their content even when they saw its bots successfully blocked. We confirmed that Perplexity’s crawlers were in fact being blocked on the specific pages in question, and then performed several targeted tests to confirm what exact behavior we could observe.
We created multiple brand-new domains, similar to testexample.com and secretexample.com. These domains were newly purchased and had not yet been indexed by any search engine nor made publicly accessible in any discoverable way. We implemented a robots.txt file with directives to stop any respectful bots from accessing any part of a website:

We conducted an experiment by querying Perplexity AI with questions about these domains, and discovered Perplexity was still providing detailed information regarding the exact content hosted on each of these restricted domains. This response was unexpected, as we had taken all necessary precautions to prevent this data from being retrievable by their crawlers.


Bypassing Robots.txt and undisclosed IPs/User Agents
Our multiple test domains explicitly prohibited all automated access by specifying in robots.txt and had specific WAF rules that blocked crawling from Perplexity’s public crawlers. We observed that Perplexity uses not only their declared user-agent, but also a generic browser intended to impersonate Google Chrome on macOS when their declared crawler was blocked.
|
Declared |
Mozilla/5.0 AppleWebKit/537.36 (KHTML, like Gecko; compatible; Perplexity-User/1.0; +https://perplexity.ai/perplexity-user) |
20-25m daily requests |
|
Stealth |
Mozilla/5.0 (Macintosh; Intel Mac OS X 10_15_7) AppleWebKit/537.36 (KHTML, like Gecko) Chrome/124.0.0.0 Safari/537.36 |
3-6m daily requests |
Both their declared and undeclared crawlers were attempting to access the content for scraping contrary to the web crawling norms as outlined in RFC 9309.
This undeclared crawler utilized multiple IPs not listed in Perplexity’s official IP range, and would rotate through these IPs in response to the restrictive robots.txt policy and block from Cloudflare. In addition to rotating IPs, we observed requests coming from different ASNs in attempts to further evade website blocks. This activity was observed across tens of thousands of domains and millions of requests per day. We were able to fingerprint this crawler using a combination of machine learning and network signals.
An example:

Of note: when the stealth crawler was successfully blocked, we observed that Perplexity uses other data sources — including other websites — to try to create an answer. However, these answers were less specific and lacked details from the original content, reflecting the fact that the block had been successful.
In contrast to the behavior described above, the Internet has expressed clear preferences on how good crawlers should behave. All well-intentioned crawlers acting in good faith should:
Be transparent. Identify themselves honestly, using a unique user-agent, a declared list of IP ranges or Web Bot Auth integration, and provide contact information if something goes wrong.
Be well-behaved netizens. Don’t flood sites with excessive traffic, scrape sensitive data, or use stealth tactics to try and dodge detection.
Serve a clear purpose. Whether it’s powering a voice assistant, checking product prices, or making a website more accessible, every bot has a reason to be there. The purpose should be clearly and precisely defined and easy for site owners to look up publicly.
Separate bots for separate activities. Perform each activity from a unique bot. This makes it easy for site owners to decide which activities they want to allow. Don’t force site owners to make an all-or-nothing decision.
Follow the rules. That means checking for and respecting website signals like robots.txt, staying within rate limits, and never bypassing security protections.
More details are outlined in our official Verified Bots Policy Developer Docs.
OpenAI is an example of a leading AI company that follows these best practices. They clearly outline their crawlers and give detailed explanations for each crawler’s purpose. They respect robots.txt and do not try to evade either a robots.txt directive or a network level block. And ChatGPT Agent is signing http requests using the newly proposed open standard Web Bot Auth.
When we ran the same test as outlined above with ChatGPT, we found that ChatGPT-User fetched the robots file and stopped crawling when it was disallowed. We did not observe follow-up crawls from any other user agents or third party bots. When we removed the disallow directive from the robots entry, but presented ChatGPT with a block page, they again stopped crawling, and we saw no additional crawl attempts from other user agents. Both of these demonstrate the appropriate response to website owner preferences.

All the undeclared crawling activity that we observed from Perplexity’s hidden User Agent was scored by our bot management system as a bot and was unable to pass managed challenges. Any bot management customer who has an existing block rule in place is already protected. Customers who don’t want to block traffic can set up rules to challenge requests, giving real humans an opportunity to proceed. Customers with existing challenge rules are already protected. Lastly, we added signature matches for the stealth crawler into our managed rule that blocks AI crawling activity. This rule is available to all customers, including our free customers.
We announced Content Independence Day almost one month ago, giving content creators and publishers more control over how their content is accessed. Today, over two and a half million websites have chosen to completely disallow AI training through our managed robots.txt feature or our managed rule blocking AI Crawlers. Every Cloudflare customer is now able to selectively decide which declared AI crawlers are able to access their content in accordance with their business objectives.
We expected a change in bot and crawler behavior based on these new features, and we expect that the techniques bot operators use to evade detection will continue to evolve. Once this post is live the behavior we saw will almost certainly change, and the methods we use to stop them will keep evolving as well.
Cloudflare is actively working with technical and policy experts around the world, like the IETF efforts to standardize extensions to robots.txt, to establish clear and measurable principles that well-meaning bot operators should abide by. We think this is an important next step in this quickly evolving space.

Post Syndicated from The History Guy: History Deserves to Be Remembered original https://www.youtube.com/watch?v=Os0Hoapyfyo
Post Syndicated from Bruce Schneier original https://www.schneier.com/blog/archives/2025/08/first-sentencing-in-scheme-to-help-north-koreans-infiltrate-us-companies.html
An Arizona woman was sentenced to eight-and-a-half years in prison for her role helping North Korean workers infiltrate US companies by pretending to be US workers.
From an article:
According to court documents, Chapman hosted the North Korean IT workers’ computers in her own home between October 2020 and October 2023, creating a so-called “laptop farm” which was used to make it appear as though the devices were located in the United States.
The North Koreans were hired as remote software and application developers with multiple Fortune 500 companies, including an aerospace and defense company, a major television network, a Silicon Valley technology company, and a high-profile company.
As a result of this scheme, they collected over $17 million in illicit revenue paid for their work, which was shared with Chapman, who processed their paychecks through her financial accounts.
“Chapman operated a ‘laptop farm’ where she received and hosted computers from the U.S. companies her home, so that the companies would believe the workers were in the United States,” the Justice Department said on Thursday.
“Chapman also shipped 49 laptops and other devices supplied by U.S. companies to locations overseas, including multiple shipments to a city in China on the border with North Korea. More than 90 laptops were seized from Chapman’s home following the execution of a search warrant in October 2023.”
Post Syndicated from LastWeekTonight original https://www.youtube.com/watch?v=xNo8Ve-Ej6U
 Konstantinos Tzouvanas is a Senior Enterprise Architect on AWS, specializing in data science and AI/ML. He has extensive experience in optimizing real-time decision-making in High-Frequency Trading (HFT) and applying machine learning to genomics research. Known for leveraging generative AI and advanced analytics, he delivers practical, impactful solutions across industries.
 Marios Parthenios is a Senior Solutions Architect working with Small and Medium Businesses across Central and Eastern Europe. He empowers organizations to build and scale their cloud solutions with a particular focus on Data Analytics and Generative AI workloads. He enables businesses to harness the power of data and artificial intelligence to drive innovation and digital transformation.
 Pavlos Kaimakis is a Senior Solutions Architect at AWS who helps customers design and implement business-critical solutions. With extensive experience in product development and customer support, he focuses on delivering scalable architectures that drive business value. Outside of work, Pavlos is an avid traveler who enjoys exploring new destinations and cultures.
 John Mousa is a Senior Solutions Architect at AWS. He helps power and utilities and healthcare and life sciences customers as part of the regulated industries team in Germany. John has interest in the areas of service integration, microservices architectures, as well as analytics and data lakes. Outside of work, he loves to spend time with his family and play video games.