This post from last year was posted to a forum, so I thought I’d write up some rebuttals to their comments.
The first comment is by David Chisnall, creator of CHERI C/C++, which proposes we can solve the problem with CPU instruction set extensions. It’s a good idea, but after 14 years, CPUs haven’t had their instruction-sets upgraded. Even mainstream RISC V processors haven’t been created using those extensions.
Chisnall: “If your safety requires you to insert explicit checks, it’s not safe“. This is true from one perspective, false from another. My proposal includes compilers spitting out warnings whenever bounds information doesn’t exist.
C is full of problems in theory that doesn’t exist in practice because the compiler spits out warnings telling programmers to fix the problem. Warnings can also note cases where programmers probably made mistakes. We can’t achieve perfect guarantees, because programmers can still make mistakes, but we can certainly achieve “good enough”.
Chisnall: ….tread safety….. I’m not sure I full understand the comment. I understand that CHERI can guarantee atomicity of bounds checking, which would require multiple (interruptible) instructions otherwise. The number of cases where this is a problem, and the C proposal would be no worse than other languages like Rust.
Chisnall: Temporal safety…. A lot of Rust “ownership” techniques can be applied to C with these annotations, namely, marking which variables OWN allocated memory and which simply BORROW it. I’ve reviewed a lot of famous use-after-free and double-free bugs, and most can be trivially fixed by annotation.
Chisnall: If you are writing a blog never having actually tried to make large (million line or more) C codebases memory safe, you probably underestimate the difficulty by at least one order of magnitude.I’m both a programmer who has written a million lines of code in my lifetime as well as a hacker with decades of experience looking for such bugs. The goal isn’t to pursue the ideal of 100% safe language, but of getting rid of 99% of safety errors. 1% less safe makes the goal an order of magnitude easier to reach.
snej: This post seems to epitomize the common engineer trait of seeing any problem you haven’t personally worked on as trivial. Sure bro, you’ll add a few patches to Clang and GCC and with those new attributes our C code will be safe. It’ll only take a few weeks and then no one will need Rust anymore. But I’ve spent decades working on this. The comment epitomizes the common trait of not realizing how much thought and expertise is behind the post. I few patches to clang and GCC will make make C safer. The solution is far less safe than Rust. In fact, my proposal makes code more interoperable and translatable into Rust. Right now, translating C into Rust creates just a bunch of ‘unsafe’ code that needs to be cleaned up. With such annotations, in a refactoring step using existing testing frameworks, results in code that can no be auto-translated safely in to Rust.
As for existing clang/gcc attributes, there are only a couple that match the macros I propose. They dod show how trivial it would be to actually go further.
danso: In addition to the criticisms I share with everyone else, I found this to be one of the most “talk is cheap, show me the code” posts I’ve ever read. The reason I wrote the post is because learning clang/gcc internals is a long process, and when asking for help, I needed something to point to “this is what I’m trying to achieve”. I’m not trying to communicate what other people should do, I’m communicating what I’m trying to do. I still don’t know clang/gcc internals enough to even get started … any pointers would be helpful.
In January, we experienced three incidents that resulted in degraded performance across GitHub services.
January 09 12:20 UTC (lasting 140 minutes)
On January 9 between 12:20 and 14:40 UTC, services in one of our three sites experienced elevated latency for connections. This led to a sustained period of timed-out requests across a number of services, including but not limited to our Git backend. An average of 5% and max of 10% of requests failed with a 5xx response or timed out during this period.
This was caused by an upgrade of hosts, which led to temporarily reduced capacity as the upgrade rolled through the fleet. While these hosts had plenty of capacity to handle the increased load, we found that the configured connection limit was lower than it should have been. We have increased that limit to prevent this from recurring. We have also identified improvements to our monitoring of connection limits and behavior and changes to reduce the risk of host upgrades leading to reduced capacity.
January 21 02:01 UTC (lasting 7 hours 3 minutes)
On January 21 at 2:01 UTC, we experienced an incident that affected customers using GitHub Codespaces. Customers encountered issues creating and resuming Codespaces in multiple regions due to operational issues with compute and storage resources.
Around 25% of customers were impacted, primarily in East US and West Europe. We re-routed traffic for Codespace creations to less impacted regions, but existing Codespaces in these regions may have been unable to resume during the incident.
By 7:30 UTC, we had recovered connectivity to all regions except West Europe, which had an extended recovery time due to increased load in that particular region. The incident was resolved on January 21 at 9:34 UTC once Codespace creations and resumes were working normally in all regions.
We are working to improve our alerting and resiliency to reduce the duration and impact of region-specific outages.
January 31 12:30 UTC (lasting 147 minutes)
On January 31, we deployed an infrastructure change to our load balancers in preparation towards our longer term goal of IPv6 enablement at GitHub.com. This change was deployed to a subset of our global edge sites. The change had the unintended consequence of causing IPv4 addresses to start being passed as an IPv4-mapped IPv6-compatible address (for example, 10.1.2.3 became ::ffff:10.1.2.3) to our IP Allow List functionality. While our IP Allow List functionality was developed with IPv6 in mind, it wasn’t developed to handle these mapped addresses, and hence, started blocking requests as it deemed these to be not in the defined list of allowed addresses. Request error rates peaked at 0.23% of all requests.
In addition to changes deployed to remediate the issues, we have taken steps to improve testing and monitoring to better catch these issues in the future.
Please follow our status page for real-time updates on status changes and post-incident recaps. To learn more about what we’re working on, check out the GitHub Engineering Blog.
Gunnar has been a steadfast contributor to Ubuntu and Debian for well over a decade. His work around translation and localization efforts has helped enable people from around the world to use and enjoy the software that we all love. It goes without saying that people like Gunnar are the foundation of our community, and his passing is a tremendous loss.
The Fedora Project is working toward the release
of Fedora Linux 40, and (as with each release) that means changes
to the way the project works and the software included in its repositories. Most
of the changes
set for Fedora 40 are uncontroversial, but one change is causing quite
a stir. The KDE Special Interest Group’s (SIG) proposal to adopt KDE Plasma 6 with only Wayland session support, which it interpreted as a mandate to block any X11 packages for Plasma. Others saw it as overreach by the SIG, and an attempt to block users and contributors from maintaining software they needed.
The Common Vulnerabilities and
Exposures (CVE) system was set up in 1999 as a way to refer
unambiguously to known vulnerabilities in software. That system has found
itself under increasing strain over the years, and numerous projects have
responded by trying to assert greater control over how CVE numbers are
assigned for their code. On February 13, though, a big shoe dropped when
the Linux kernel project announced
that it, too, was taking control of CVE-number assignments. As is often
the case, though, the kernel developers are taking a different approach to
vulnerabilities, with possible implications for the CVE system as a whole.
I’m giving a keynote on “AI and Trust” at Generative AI, Free Speech, & Public Discourse. The symposium will be held at Columbia University in New York City and online, at 3 PM ET on Tuesday, February 20, 2024.
I’m speaking (remotely) on “AI, Trust and Democracy” at Indiana University in Bloomington, Indiana, USA, at noon ET on February 20, 2024. The talk is part of the 2023-2024 Beyond the Web Speaker Series, presented by The Ostrom Workshop and Hamilton Lugar School.
In November 2023, we announced the launch of code scanning autofix, leveraging AI to suggest fixes for security vulnerabilities in users’ codebases. This post describes how autofix works under the hood, as well as the evaluation framework we use for testing and iteration.
What is code scanning autofix?
GitHub code scanning analyzes the code in a repository to find security vulnerabilities and other errors. Scans can be triggered on a schedule or upon specified events, such as pushing to a branch or opening a pull request. When a problem is identified, an alert is presented to the user. Code scanning can be used with first- or third-party alerting tools, including open source and private tools. GitHub provides a first party alerting tool powered by CodeQL, our semantic code analysis engine, which allows querying of a codebase as though it were data. Our in-house security experts have developed a rich set of queries to detect security vulnerabilities across a host of popular languages and frameworks. Building on top of this detection capability, code scanning autofix takes security a step further, by suggesting AI-generated fixes for alerts. In its first iteration, autofix is enabled for CodeQL alerts detected in a pull request, beginning with JavaScript and TypeScript alerts. It explains the problem and its fix strategy in natural language, displays the suggested fix directly in the pull request page, and allows the developer to commit, dismiss, or edit the suggestion.
The basic idea behind autofix is simple: when a code analysis tool such as CodeQL detects a problem, we send the affected code and a description of the problem to a large language model (LLM), asking it to suggest code edits that will fix the problem without changing the functionality of the code. The following sections delve into some of the details and subtleties of constructing the LLM prompt, processing the model’s response, evaluating the quality of the feature, and serving it to our users.
The autofix prompt
At the core of our technology lies a request to an LLM, expressed through an LLM prompt. CodeQL static analysis detects a vulnerability, generating an alert that references the problematic code location as well as any other relevant locations. For example, for a SQL-injection vulnerability, the alert flags the location where tainted data is used to build a database query, and also includes one or more flow paths showing how untrusted data may reach this location without sanitization. We extract information from the alert to construct an LLM prompt consisting of:
General information about this type of vulnerability, typically including a general example of the vulnerability and how to fix it, extracted from the CodeQL query help.
The source-code location and content of the alert message.
Relevant code snippets from the locations all along the flow path and any code locations referenced in the alert message.
Specification of the response we expect.
We then ask the model to show us how to edit the code to fix the vulnerability.
We describe a strict format for the model output, to allow for automated processing. The model outputs Markdown consisting of the following sections:
Detailed natural language instructions for fixing the vulnerability.
A full specification of the needed code edits, following the format defined in the prompt.
A list of dependencies that should be added to the project, if applicable. This is needed, for example, if the fix makes use of a third-party sanitization library on which the project does not already depend.
We surface the natural language explanation to users together with the code scanning alert, followed by a diff patch constructed from the code edits and added dependencies. Users can review the suggested fix, edit and adjust it if necessary, and apply it as a commit in their pull request.
Pre- and post-processing
If our goal were to produce a nice demo, this simple setup would suffice. Supporting real-world complexity and overcoming LLM limitations, however, requires a combination of careful prompt crafting and post-processing heuristics. A full description of our approach is beyond the scope of this post, but we outline some of the more impactful aspects below.
Selecting code to show the model
CodeQL alerts include location information for the alert and sometimes steps along the data flow path from the source to the sink. Sometimes additional source-code locations are referenced in the alert message. Any of these locations may require edits to fix the vulnerability. Further parts of the codebase, such as the test suite, may also need edits, but we focus on the most likely candidates due to prompt length constraints.
For each of these code locations, we use a set of heuristics to select a surrounding region that provides the needed context while minimizing lines of code, eliding less relevant parts as needed to achieve the target length. The region is designed to include the imports and definitions at the top of the file, as these often need to be augmented in the fix suggestion. When multiple locations from the CodeQL alert reside in the same file, we structure a combined code snippet that gives the needed context for all of them.
The result is a set of one or more code snippets, potentially from multiple source-code files, showing the model the parts of the project where edits are most likely to be needed, with line numbers added so as to allow reference to specific lines both in the model prompt and in the model response. To prevent fabrications, we explicitly constrain the model to make edits only to the code included in the prompt.
Adding dependencies
Some fixes require adding a new project dependency, such as a data sanitation library. To do so, we need to find the configuration file(s) that list project dependencies, determine whether the needed packages are already included, and if not make the needed additions. We could use an LLM for all these steps, but this would require showing the LLM the list of files in the codebase as well as the contents of the relevant ones. This would increase both the number of model calls and the number of prompt tokens. Instead, we simply ask the model to list external dependencies used in its fix. We implement language-specific heuristics to locate the relevant configuration file, parse it to determine whether the needed dependencies already exist, and if not add the needed edits to the diff patch we produce.
Specifying a format for code edits
We need a compact format for the model to specify code edits. The most obvious choice would be asking the model to output a standard diff patch directly. Unfortunately, experimentation shows that this approach exacerbates the model’s known difficulties with arithmetic, often yielding incorrect line number computations without enough code context to make heuristic corrections. We experimented with several alternatives, including defining a fixed set of line edit commands the model can use. The approach that yielded the best results in practice involves allowing the model to provide “before” and “after” code blocks, demonstrating the snippets that require changes (including some surrounding context lines) and the edits to be made.
Overcoming model errors
We employ a variety of post-processing heuristics to detect and correct small errors in the model output. For example, “before” code blocks might not exactly match the original source-code, and line numbers may be slightly off. We implement a fuzzy search to match the original code, overcoming and correcting errors in indentation, semicolons, code comments, and the like. We use a parser to check for syntax errors in the edited code. We also implement semantic checks such as name-resolution checks and type checks. If we detect errors we are unable to fix heuristically, we flag the suggested edit as (partially) incorrect. In cases where the model suggests new dependencies to add to the project, we verify that these packages exist in the ecosystem’s package registry and check for known security vulnerabilities or malicious packages.
Evaluation and iteration
To make iterative improvements to our prompts and heuristics while at the same time minimizing LLM compute costs, we need to evaluate fix suggestions at scale. In taking autofix from demo quality to production quality, we relied on an extensive automated test harness to enable fast evaluation and iteration.
The first component of the test harness is a data collection pipeline that processes open source repositories with code scanning alerts, collecting alerts that have test coverage for the alert location. For JavaScript / TypeScript, the first supported languages, we collected over 1,400 alerts with test coverage from 63 CodeQL queries.
The second component of the test harness is a GitHub Actions workflow that runs autofix on each alert in the evaluation set. After committing the generated fix in a fork, the workflow runs both CodeQL and the repository’s test suite to evaluate the validity of the fix. In particular, a fix is considered successful only if:
It removes the CodeQL alert.
It introduces no new CodeQL alerts.
It produces no syntax errors.
It does not change the outcome of any of the repository tests.
As we iterated on the prompt, the code edit format, and various post-processing heuristics, we made use of this test harness to ensure that our changes were improving our success rate. We coupled the automated evaluations with periodic manual triage, to focus our efforts on the most prevalent problems, as well as to validate the accuracy of the automated framework. This rigorous approach to data-driven development allowed us to triple our success rate while at the same time reducing LLM compute requirements by a factor of six.
Architecture, infrastructure, and user experience
Generating useful fixes is a first step, but surfacing them to our users requires further front- and back-end modifications. Designing for simplicity, we’ve built autofix on top of existing functionality wherever possible. The user experience enhances the code scanning pull request experience. Along with a code scanning alert, users can now see a suggested fix, which may include suggested changes in multiple files, optionally outside the scope of the pull request diff. A natural language explanation of the fix is also displayed. Users can commit the suggested fixes directly to the pull request, or edit the suggestions in their local IDE or in a GitHub Codespace.
The backend, too, is built on top of existing code scanning infrastructure, making it seamless for our users. Customers do not need to make any changes to their code scanning workflows to see fix suggestions for supported CodeQL queries.
The user opens a pull request or pushes a commit. Code scanning runs as usual, as part of an actions workflow or workflow in a third-party CI system, uploading the results in the SARIF format to the code scanning API. The code scanning backend service checks whether the results are for a supported language. If so, it runs the fix generator as a CLI tool. The fix generator leverages the SARIF alert data, augmented with relevant pieces of source-code from the repository, to craft a prompt for the LLM. It calls the LLM via an authenticated API call to an internally-deployed API running LLMs on Azure. The LLM response is run through a filtering system which helps prevent certain classes of harmful responses. The fix generator then post-processes the LLM response to produce a fix suggestion. The code scanning backend stores the resulting suggestion, making it available for rendering alongside the alert in pull request views. Suggestions are cached for reuse where possible, reducing LLM compute requirements.
As with all GitHub products, we followed standard and internal security procedures, and put our architectural design through a rigorous security and privacy review process to safeguard our users. We also took precautions against AI-specific risks such as prompt injection attacks. While software security can never be fully guaranteed, we conducted red team testing to stress-test our model response filters and other safety mechanisms, assessing risks related to security, harmful content, and model bias.
Telemetry and monitoring
Before launching autofix, we wanted to ensure that we could monitor performance and measure its impact in the wild. We don’t collect the prompt or the model responses because these may contain private user code. Instead, we collect anonymized, aggregated telemetry on user interactions with suggested fixes, such as the percentage of alerts for which a fix suggestion was generated, the percentage of suggestions that were committed as-is to the branch, the percentage of suggestions that were applied through the GitHub CLI or Codespace, the percentage of suggestions that were dismissed, and the fix rate for alerts with suggestions versus alerts without. As we onboard more users onto the beta program, we’ll look at this telemetry to understand the usefulness of our suggestions.
Additionally, we’re monitoring the service for errors, such as overloading of the Azure model API or triggering of the filters that block harmful content. Before expanding autofix to unlimited public beta and eventually general availability, we want to ensure a consistent, stable user experience.
What’s next?
As we roll out the code scanning autofix beta to an increasing number of users, we’re collecting feedback, fixing papercuts, and monitoring metrics to ensure that our suggestions are in fact useful for security vulnerabilities in the wild. In parallel, we’re expanding autofix to more languages and use cases, and improving the user experience. If you want to join the public beta, sign up here. Keep an eye out for more updates soon!
Security updates have been issued by Debian (bind9 and unbound), Fedora (clamav, firecracker, libkrun, rust-event-manager, rust-kvm-bindings, rust-kvm-ioctls, rust-linux-loader, rust-userfaultfd, rust-versionize, rust-vhost, rust-vhost-user-backend, rust-virtio-queue, rust-vm-memory, rust-vm-superio, rust-vmm-sys-util, and virtiofsd), Red Hat (.NET 6.0, dotnet6.0, and dotnet7.0), Slackware (bind and dnsmasq), and Ubuntu (dotnet6, dotnet7, dotnet8, linux-lowlatency, linux-raspi, linux-nvidia-6.2, and ujson).
Cloudflare’s global network spans over 310 cities in more than 120 countries, and interconnects with 13,000 networks globally, including major ISPs, cloud services, and enterprises. This network serves as a globally distributed foundation from which Cloudflare offers a broad product portfolio spanning everything from core Internet services like security, performance, and reliability — to web development, AI, corporate access management, creative products, and more.
The diversity of our products is reflected in our millions of customers, who span a dizzying array of industries and institutions in nearly every country around the world. This incredible diversity has meant a lot of specialisation, as Cloudflare’s adaptable product suite is fitted for each use case. Many customers are keen to have a partner to help them ensure they are getting everything they can out of Cloudflare. And they’d like to do it in the language of their choice, with partners who are familiar with the industries and regions they operate in.
This is why Cloudflare has for many years invested in our Partner Services programs, and has made a concerted effort to scout and partner with the world’s leading service providers who can deliver Cloudflare solutions to the highest standard. These firms and consultancies combine technical expertise using Cloudflare’s platform with fluency in an array of different specialities.
The launch of the Authorized Service Delivery Partner (ASDP) program stands as a testament to this initiative. Through this program, we have successfully onboarded a select number of partners, each an expert in their respective fields, ensuring a diverse and robust service delivery landscape. As a result of these efforts, we are proud to showcase our current roster of ASDP partners. These organizations have been specifically authorized by Cloudflare to operate in distinct domains, reflecting our commitment to diversity and excellence in service delivery:
We also place significant emphasis on our strategic alliances with Global System Integrators (GSIs) like Accenture, NTT, and Kyndryl. GSIs are key players in the tech industry, offering extensive technology and business solutions across various sectors worldwide. The value of these partnerships have not only broadened our reach but have also enriched our ecosystem with a range of bespoke service offerings tailored to the nuanced needs of our clients. You can read in this blog post how Kydnryl partnered with Cloudflare to deliver managed network transformation services.
Alongside our collaborations with Global System Integrators, we place equal importance on the role of Managed Service Providers (MSPs). Managed Service Providers (MSPs) are vital in guiding customers through every step of their digital journey, working hand-in-hand with them from initial onboarding and integration to managing day-to-day operations and optimizing performance. Recognizing this critical role that Managed Service Providers (MSPs) play in the customer lifecycle, we have streamlined our MSP specialization under the partner program. This refinement was carried out with the clear objective of making it more straightforward for MSPs to integrate and innovate within the Cloudflare ecosystem. By doing so, we have empowered them to deliver comprehensive, end-to-end solutions that drive customer success and operational excellence.
The Cloudflare Global Partner Services Team is dedicated to supporting a diverse set of service partners, including Value Added Resellers (VARs), boutique consultancies, regional Systems Integrators (SIs), Global Systems Integrators (GSIs), and Managed Service Providers (MSPs), each playing a unique role in our collective success.
Our vision and strategy
We envision a future where our partners go beyond traditional roles to become pivotal in shaping the digital ecosystem. Our strategic intent is to empower these partners to be at the heart of innovation and digital transformation, ensuring they are equipped to meet the challenges and opportunities of tomorrow.
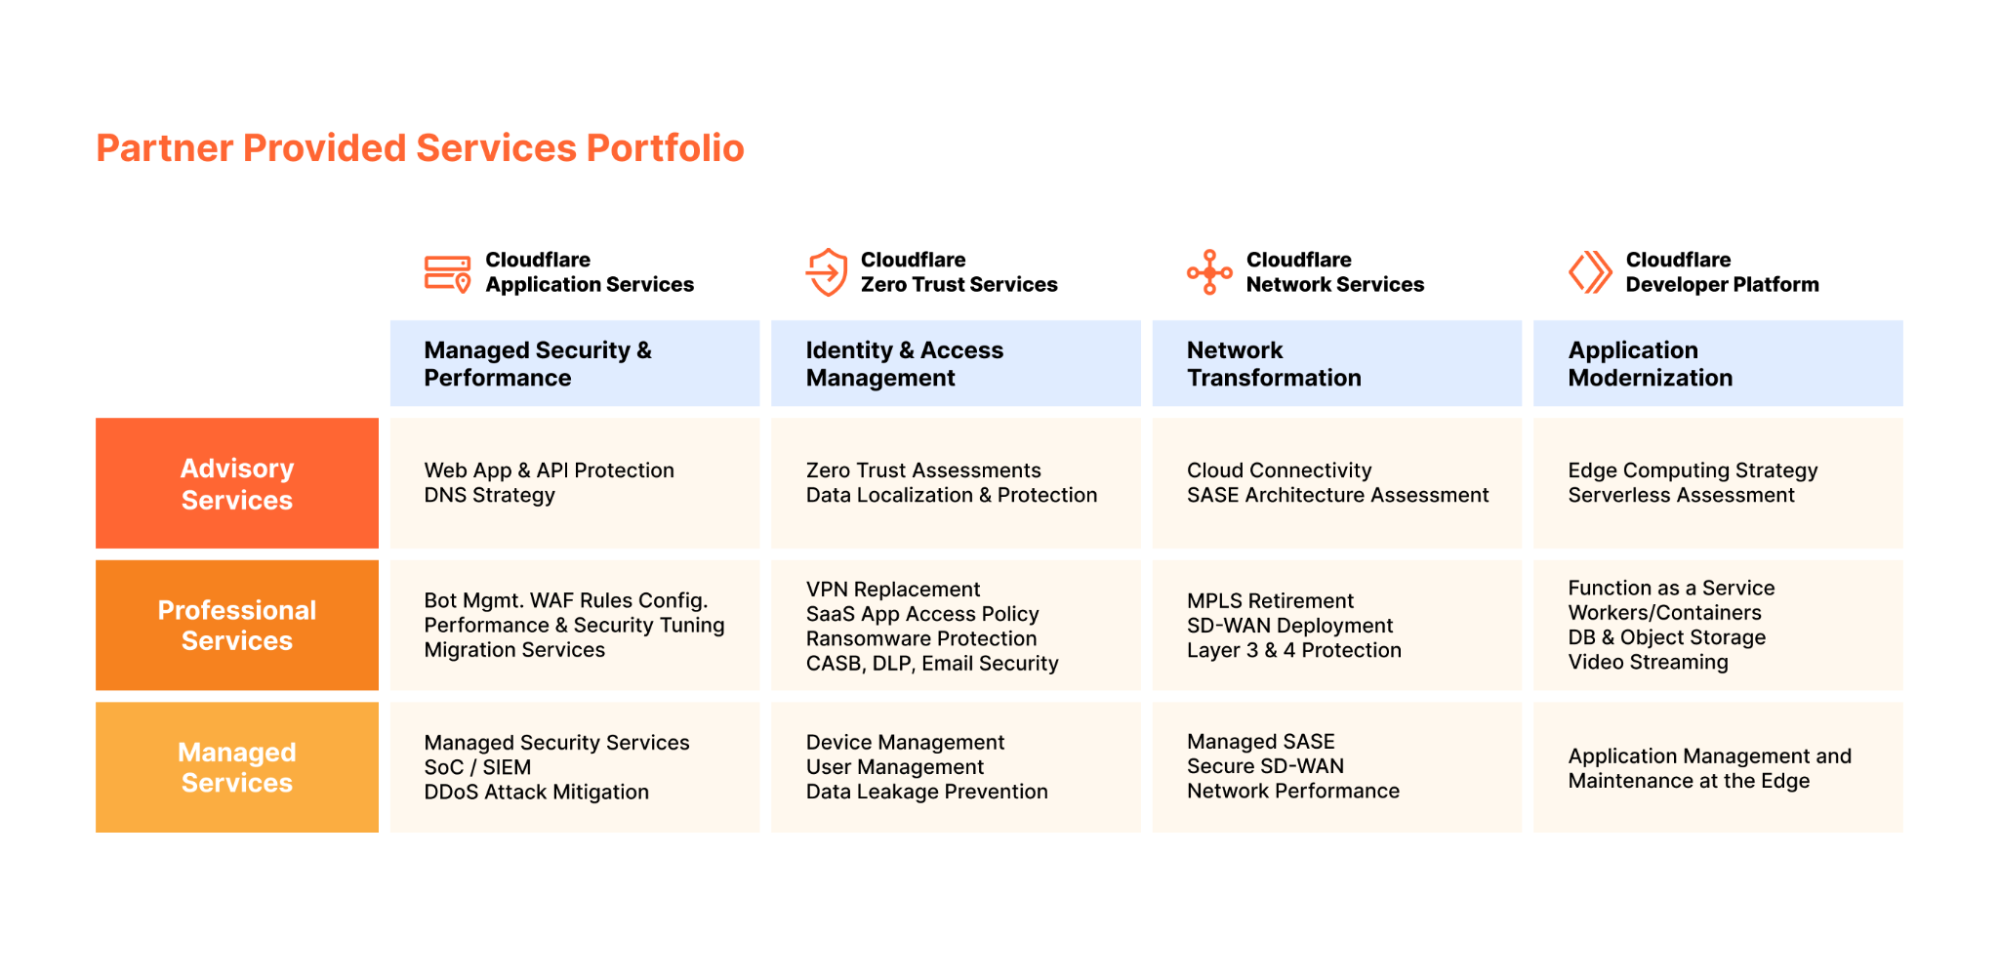
In alignment with this vision, our ongoing strategy includes a continuous evolution of our services partner programs. We are committed to expanding our portfolio of partners, carefully curating a network that not only grows in number but also in the diversity of expertise and services offered. This expansion is coupled with a focus on service delivery quality. To provide a clearer insight, here’s a comprehensive overview of the key services offered by our authorized partners globally:
Supporting our partners: the role of partner service delivery managers & technical services manager
In Cloudflare’s partner ecosystem, our internal teams of Partner Service Delivery Managers (SDMs) and Partner Technical Services Managers (TSMs) play crucial roles in supporting our partners. SDMs concentrate on growing our services partner network through active engagement and onboarding processes. They ensure that each partner is in alignment with Cloudflare’s strategic direction and maintains our high standards. Meanwhile, TSMs are pivotal in securing the technical success of these partnerships, offering specialized technical guidance and support.
Cloudflare Partner SDMs are the architects behind the expansion of our services partner network, working tirelessly to identify, engage, and onboard potential partners. They collaborate to ensure that each partnership meets Cloudflare’s high standards and strategic direction, aiming for mutual success. Post onboarding, the SDM becomes a partner’s compass, guiding them through the different stages of their journey. They are committed to improving these relationships by providing continuous support and access to growth opportunities, they play a crucial role in offering development, aiding partners in refining and enhancing their service offerings to stay in lockstep with Cloudflare’s solutions and evolving market demands.
To illustrate the impact of a Partner Service Delivery Manager (SDM), consider a prospective partner with ambition to establish a network transformation practice, with managed service offerings built upon Cloudflare technology. The Partner SDM would embark with them on this journey with a systematic and strategic approach. Initially, they would work closely with the new partner to grasp the market needs, identifying areas where Cloudflare’s technology can fill gaps and create value. They would then assist in pinpointing the necessary skills and expertise needed to deliver these services effectively. Following this, the SDM would guide the packaging and bundling of these offerings, ensuring they not only align with Cloudflare’s suite of solutions but also resonate with customer demands and market trends.
Partner Technical Services Managers (TSM) are critical to ensure a partner’s technical service delivery success, by ensuring they have the in-depth technical support they need. They provide insights into the best practices for service delivery, from initial deployment to ongoing management. This end-to-end guidance ensures that the journey from concept to successful service delivery is coherent, strategic, and aligned with both your and Cloudflare’s business objectives.
Engagement models: harmonizing Cloudflare services with partner expertise
At Cloudflare, we understand that nothing is more important than the success of our customers. We pride ourselves in being flexible and engaging customers in the manner they prefer. While we have cultivated a robust internal Professional Services (PS) organization, we recognize the invaluable role our partners play in multiplying our reach and capabilities.
Cloudflare Service Partners, with their deep customer relationships, local presence and regional expertise, are instrumental in tailoring our offerings to the nuanced needs of customers worldwide. These external partners supplement our internal PS team with a large pool of experts who combine a deep technical understanding of Cloudflare’s solutions with direct experience spanning a multitude of customers and industries. Their integration expertise is particularly crucial when it comes to blending Cloudflare solutions with an array of third-party tools such as Okta, Crowdstrike, Intune, and Microsoft Active directory, ensuring a seamless technological symphony.
Our partners are also adept at providing Managed Services and Strategic Transformation Experience, which extends beyond the technical deployment. We realize that change management, ongoing support and proactive services are critical to our customers’ success. This is where Global System Integrators (GSIs) become a cornerstone of our strategy, complementing Cloudflare’s offerings with their specialized, transformative expertise.
In addition to our established engagement models, Cloudflare embraces a Hybrid Model approach, catering to customers who prefer a blend of Cloudflare’s expertise and the specialized skills of our authorized service partners. This model ensures seamless integration of expertise, providing tailored solutions that leverage the best of both Cloudflare’s and our partners’ capabilities.
Opportunities for partners:
In a recent market survey, McKinsey and company survey reveals a $2 trillion market opportunity for cybersecurity technology and service providers which is mainly driven by these factors:
A proliferation of cyber attacks targeting SMBs and midmarket companies, who must adopt a strong security posture
Regulatory requirements
More visibility into security logs, detection, and analysis
Shortage of talent and service offerings
Demand for higher level of customer engagements
According to Forbes.com, MSPs’ proactive managed service model allows Service Providers to provide relevant services on a subscription basis. With the global cybersecurity market set to rise 13% annually up to 2025, driven by regulatory frameworks such as GDPR and increasing privacy concerns, there is currently an even more lucrative opportunity for MSPs to enter the cybersecurity space. Some key areas where MSPs can contribute include:
Security Assessments and overall cyber security Strategy
Managed Security Services
Incident response and remediation
Compliance and regulatory support
With a $2 trillion market opportunity in cybersecurity, it presents a significant growth potential for services partners to grow and expand their business to include Cloudflare portfolio of technology. We are looking for partners to expand our Services Partner Network globally. If you are keen to join, please use the ASDP form, Partner Portal or reach out to your Cloudflare Channel Account Manager.
The road ahead:
As we move into 2024, we’ll ensure the enhancement of our service partner program with several key expansions:
Expanding our ASDP Partner Portfolio: Initially launched with a focus on application and Zero Trust (ZT) categories, in 2024, we’re excited to expand into networking and edge service categories. We’re actively seeking partners with deep expertise in network transformation and serverless edge development.
New Specialization for MSPs: In 2024, Cloudflare is launching a new specialization for Managed Service Providers (MSPs) as part of our enhanced partner program. This initiative, aligning with industry standards, is designed to integrate Cloudflare seamlessly into MSPs’ managed security services.
Solution Factory featuring Service Blueprints: To develop innovation among our partners, we’re establishing a solution factory. This initiative aims to share Cloudflare’s best practices, offering specific service offering blueprints to aid partners in launching new services built on top of the Cloudflare portfolio.
Partner SkillBoost Program: Enhancing our hybrid model, the SkillBoost program aims to create more opportunities for partners to learn directly from Cloudflare’s service delivery experts, promoting on-the-job learning and expertise development.
Elevating Service Quality: We’ll continue to develop new training modules for our services partners. These modules are aimed at enhancing their capabilities and ensuring they are well-equipped to deliver top-tier service quality in a rapidly evolving digital landscape.
As Cloudflare’s physical network of data centers grows, our strategic network of channel partners mirrors this expansion, whom we trust to deliver critical services that customers may require as part of their Cloudflare deployments. We are committed to providing required support and ensuring our partners are equipped with all necessary resources to deliver exceptional customer experiences.
Prior to becoming a Systems Administrator at Rapid7, Naeem Jones entered his career in cybersecurity through the Hack. Diversity program. Hack.Diversity is a program that connects talented Black and Latin/x students and early-career professionals with organizations that are looking to build inclusive and equitable working environments. Rapid7 is a founding member of “Hack” and has worked with the organization since 2017.
Jones remembers he and others in his cohort were looking for opportunities to grow and gain valuable experience at an organization, prioritizing the expansion of their expertise while also having ownership of tasks and projects. To Jones, one of the things that stood out the most about Rapid7 was the ability to be himself while having the opportunity to grow.
“One of my favorite core values at Rapid7 is ‘Bring You.’ I love having the ability to bring your authentic self every day – and that looks different for everyone. For myself, I am an avid gamer and even play competitively. I am part of multiple groups at Rapid7 where we discuss all the video games and media we love and are able to bond over our shared interests,” he said. Jones enjoys challenging those around him: “If you think you can beat me in a game, I am here, and I accept the challenge!”
Alongside the promise of a robust culture, there was room for Jones to challenge himself to create impact and grow. “Rapid7 emphasized that, once you join, you are part of the team. Even if you are an intern, you are a Moose and will be working alongside others with the same opportunities.” Employees call themselves “Moose” because it can refer to a single moose or an entire herd, demonstrating how every employee is working both individually and collaboratively to implement solutions. This references one of Rapid7’s five core values: “Impact Together.”
“I started by doing whatever I could to understand and take advantage of learning opportunities. A few months into my internship, I was put in charge of handling the onboarding process, which I continued as I came to Rapid7 full-time,” Jones said. “I had ownership of a critical part of the business, which was to be the face of IT and the first person at Rapid7 to give new employees information on their devices and where they can go when they need help or have issues.”
Every role at Rapid7 is integral to delivering for our customers, and Jones’ ability to demonstrate how to efficiently use devices is a great example. The faster our Moose are acclimated to their laptops and are equipped with the tools they need, the faster they can solve the challenges our customers are facing. This means they can more rapidly build products that will keep our customers ahead of attackers and safe in the midst of a complex digital environment.
As Jones has progressed through his career over the course of five years at Rapid7, he has taken advantage of opportunities to shadow those whose roles he has found fascinating. Through open communication with his managers, Jones was able to have a hand in mapping his progression into a Systems Administrator role. This has created opportunities for Jones to impart helpful information and wisdom of his own.
“Mentorship and cross-collaborationship never goes away. Of course, workload takes precedence but there is still so much for me to learn from my peers regardless of whether they are in a more junior or senior role. I have the opportunity now to also pass my knowledge along to others on processes I am well-versed in,” he said.
“I am able to offer wisdom, tips and tricks, and where to look when things aren’t right. I love being able to empower my team – or any partner – to learn from my experiences and be a teacher,” he said. “It is a privilege to be able to show others how I navigate processes to help them learn and to improve and become better. It is a continuous cycle.” This cycle is critical to the impact made at Rapid7 as Moose are able to work together on projects which foster expanded knowledge and fluid collaboration.
For those looking for their next opportunity, Jones acknowledges a difficult obstacle to overcome that many face: imposter syndrome. Although he recognizes that it may never truly go away, Jones suggests how to push through it: “Always try to partner, learn new skills, and shadow people in roles that interest you. No matter if it is a little thing or a big thing, just try,” he said.
Overall, Jones wants others to know that there is power in taking control in the face of adversity. “There have been points in my career where I felt paralyzed by imposter syndrome,” he said. “But, you can’t let that stop you from giving it a shot. Never let those feelings block you from learning and growing. Even if you ‘fail,’ you will still learn something and can carry that experience with you.”
The winner of the Best Paper Award at Crypto this year was a significant improvement to lattice-based cryptanalysis.
This is important, because a bunch of NIST’s post-quantumoptions base their security on lattice problems.
I worry about standardizing on post-quantum algorithms too quickly. We are still learning a lot about the security of these systems, and this paper is an example of that learning.
Being the world’s most trusted open-source monitoring solution means that businesses of every size and description turn to us for their network monitoring needs. This gives us an inside look at how easy it is for them to suffer disruptive network failures, which usually happen thanks to relatively simple miscalculations.
Network monitoring mistakes are easy to make but often challenging and time-consuming to fix, so we’ve put together a list of five of the most common mistakes that we see users make. We’ve also shown how Zabbix’s built-in features can help prevent them when combined with our experience and expertise.
Table of Contents
Network monitoring mistake 1: Playing defense with security threats
As technology evolves, security threats grow and mutate much faster than before. A cybersecurity team that takes a purely reactive approach to the latest round of digital threats will constantly be playing catch-up, unable to challenge network vulnerabilities and putting their entire network at risk.
Zabbix is designed to help enterprises go beyond the traditional network monitoring strategy of reacting to performance and security problems as they occur. Zabbix can, for example, trace failed logins (which are often possible hacking attempts) as well as unexpected successful logins.
If an anomaly is discovered, Zabbix uses multiple messaging channels to notify the responsible individuals in your organization about the different kinds of events occurring in your environment This allows you to discover potential threats before they happen and react to them before they become a problem.
Network monitoring mistake 2: Getting left behind when technology evolves
Networking technologies continually evolve, so monitoring technologies need to evolve with them, offering even better visibility. By failing to make use of new monitoring technologies as they’re released, companies leave themselves wide open to network problems. Employees get comfortable with tools and solutions and are often reluctant to change or upgrade, but not doing so puts your network at risk.
At Zabbix, we offer our users a quality product and a variety of support options. Every six months we release a new stable version, and each new Zabbix software release is subject to a standard life cycle and expiry date. Our life cycle specifics also help make content for all new version releases more predictable and manageable.
If you’re already using Zabbix (and we hope that you are), taking advantage of our upgrade solution is the perfect way to make sure you don’t fall behind the curve when it comes to monitoring technology. We work side by side with your team and adapt to your environment so that your upgrade gets taken care of with no disruption and in line with our best practices.
Network monitoring mistake 3: Not having the right performance data and insights
Every enterprise or business will have different network performance requirements, which in turn will require examining different performance metrics and having different performance expectations and baselines. The key is being able to separate the signal (useful performance data and insights) from the noise (everything else) so that you can properly judge your network’s behavior and take appropriate action.
Zabbix’s web UI provides multiple ways of presenting a visual overview of your IT environment. Widget-based multi-page dashboards display information in an easy-to-digest format, so even laymen can see what’s happening with the network at a glance.
Flexible graphs can display regular and aggregate data, and all display options allow you to filter and display only the data you need, at any level of granularity you may require. The goal is to make it as easy as possible for you to prioritize useful insights over all others.
Modern networking devices generate logs that contain vital information. Network management teams can use this information to provide higher security, improved efficiency, and less downtime. Not collecting and using these logs is ignoring free information that you could use to run your network better.
Zabbix makes log monitoring easy by allowing you to collect, filter, and analyze log entries. Monitoring firewall logs with Zabbix, for example, allows you to identify things like unusual traffic patterns, blocked connections, and denied access logs. With more advanced or “smart” firewalls, you can read logs and create intrusion alerts in Zabbix.
When it comes to Windows logs, you can track the success or failure of user logins and monitor IP addresses to see whether login attempts are coming from a trusted network or not. VPN connections (source IP, multiple failed connection attempts, etc.) are also a snap to monitor with Zabbix. It’s all part of our “single pane of glass” philosophy that allows SNMP traps, logs, and other sources to all be monitored with a single tool.
Network monitoring mistake 5: Failing to plan for network growth
Simply focusing on how your network is performing now doesn’t cut it – you also need to prepare yourself for what your network might become. Any planned changes to your network need to be considered when planning out your monitoring strategies. That means projecting what the state of your network will be and considering how additions to your network might affect performance.
Zabbix is designed to be scalable to any infrastructure – our customers use it to monitor anything from smart homes to multi-tenant global business environments. And when it’s time to expand your network, you can gain an extra layer of scalability by deploying Zabbix Proxies, which allow you to collect millions of metrics from hundreds of thousands of devices, services, and applications.
Conclusion
Monitoring a modern network is a challenging task, and Murphy’s Law (anything that can go wrong will go wrong, and at the worst possible time) is never far from the mind of any network management professional. However, in our experience, network management teams can avoid the most common network monitoring mistakes by following the advice we’ve outlined in this post.
If you want to see for yourself how Zabbix can help you monitor your network as efficiently as possible and avoid common network monitoring mistakes, get in touch with us.
Big news for young coders and everyone who supports them: project registration is now open for Coolest Projects 2024! Coolest Projects is our global technology showcase for young people aged up to 18. It gives young creators the incredible opportunity to share the cool stuff they’ve made with digital technology with a global audience, and receive certificates and rewards to celebrate their achievements.
What you need to know about Coolest Projects
The Coolest Projects online showcase is open to young people worldwide. Young creators can register their projects to share them with the world in our online project gallery, and join our exciting livestream event to celebrate what they have made with the global Coolest Projects community.
By taking part in Coolest Projects, young people can join an international community of young makers, represent their country, receive personalised feedback on their projects, and get certificates and more to recognise their achievements.
Here’s how it works:
Coolest Projects is completely free to take part in!
All digital technology projects are welcome, from very first projects to advanced builds, and the projects don’t have to be complete
Projects can be registered in one of six categories: Scratch, games, web, mobile apps, hardware, and advanced programming
Young creators up to age 18 can take part individually or in teams of up to five friends
Any young person anywhere in the world can take part in the online showcase, and there are in-person events in some countries for local creators too (find out more below)
Registration for the online showcase is now open and closes on 22 May 2024
All creators, mentors, volunteers, teachers, parents, and supporters are invited to the special celebration livestream on 26 June 2024
Young people think of an idea for their project, or choose something they’ve already made and are proud of
Young people work with friends to create their project, or make it on their own
Creators (with the help of mentors if needed) register projects via the Coolest Projects website by 22 May
Creators’ projects are shared with the world in the online showcase gallery
Creators, mentors, and supporters explore the amazing projects in the online gallery, and join the livestream on 26 June to celebrate young creators’ achievements with the Coolest Projects community worldwide
Coolest Projects in-person events in 2024
As well as the global online showcase, Coolest Projects in-person events are held for young people locally in certain countries too, and we encourage creators to take part in both the online showcase and their local in-person event.
In 2024, creators can look forward to the following in-person events, run by us and partner organisations around the world:
More events are coming soon, so sign up to the Coolest Projects newsletter to be sure to hear about any in-person events in your country. And if there isn’t an event near you, don’t worry. The online showcase is open to any young person anywhere in the world.
Help for you is at hand
Coolest Projects welcomes all digital tech projects, from beginner to advanced, and there are loads of great resources available to help you support the young people in your community to take part.
We are running a series of online calls and webinars for mentors and young people to share practical tips and help participants develop their ideas and build their creations. Sign up for the sessions here. All sessions will be recorded, so you can watch them back if you can’t join live.
You can also check out the Coolest Projects guidance page for resources to help you support young people throughout their Coolest Projects journey, including a mentor guide and session plans.
To inspire your coders, encourage them to take a look at the 2023 showcase gallery, where they can explore the incredible projects submitted by participants last year.
Our projects site is also a great place for participants to begin — there are hundreds of free step-by-step project guides to help young people create their own projects, whether they’re experienced tech creators or they’re just getting started.
Sign up for Coolest Projects updates
There’s lots more exciting news to come, from the announcement of our VIP judges to details about this year’s swag, so sign up for email updates to be the first to know. And whether your coders have already made something fun, innovative, or amazing that they want to share, or they’re inspired to make something new, Coolest Projects is the place for them. We can’t wait to see what they create!
Напоследък някои си спомниха, а други тепърва разбраха, че Българската национална телевизия има вечерно шоу. За него се чу покрай информацията, че то ще се води от жена, което е прецедент за вечерно шоу в България. Всъщност шоуто съществува от есента на 2020 г., като първоначално се излъчва в събота, а след това се мести в четвъртък, вероятно защото вече бившият му водещ Георги Любенов си има и „Денят започва с Георги Любенов“ в събота и неделя сутринта. Андреа Банда Банда е петото лице на шоуто – след Митко Павлов, Ники Станоев, Орлин Павлов и споменатия Любенов. Първото предаване с нея отприщи мощна вълна от хейт в социалните мрежи, охотно ретранслирана от медии и сайтове в целия диапазон между жълтото и кафявото.
Коя е Андреа Банда Банда?
Новата водеща на „Вечерното шоу“ по БНТ става популярна с клипчетата си в социалните мрежи, в които говори предимно за кино. Псевдонима Банда Банда избира в чест на общността от кинолюбители, заформила се покрай нея. Тя не се възприема като влогърка, а нарича себе си инфлуенсър. Първият ѝ опит във влогърстването е още в ученическите ѝ години – през далечната 2007-ма. Днес профилът ѝ в Instagram има над 85 000 последователи, а каналът ѝ в YouTube (макар в него да няма ново съдържание от две години) – 13 200. Да не забравяме и над 29 000 последователи и над 312 000 лайка в TikTok.
Новото поприще не е дебют за Андреа Банда Банда на малкия екран – тя вече е работила и за трите национални телевизии. Поддържала е своя рубрика в специалните студиа на БНТ по време на Световното първенство по футбол в Катар, била е коментаторка в „На кафе“ по Нова телевизия, а след това и в сутрешното шоу на bTV.
„Мост между поколенията“ и вкусовете
Андреа Банда Банда влиза във „Вечерното шоу“ със заявката да предлага своеобразен „мост между поколенията“. Или както се самоиронизира в първото си предаване – „аз съм нещо като съвременния Колю Фичето“. Вероятно и това е била идеята на БНТ, когато са я избрали за водеща – да привлече млада аудитория към обичайните не толкова млади зрители на телевизията и да предлага съдържание, което да е интересно и на едните, и на другите.
Пилотното ѝ предаване може да се разглежда тъкмо като опит да предложи по нещо на всички. Първият ѝ гост е Николаос Цитиридис – доскорошен водещ на вечерно шоу по bTV, което носеше неговото име. Следват рапърът Боро Първи и оперната певица Мила Михова. Така има нещо и за младежите с хаплив език (пък и за аудиторията на конкуренцията), и за по-сериозните почитатели на оперното изкуство. Водещата подхожда към темата за операта като типичен представител на поколение, за което „сериозното изкуство“ поначало е нещо чуждо, но би могло да стане интересно и любимо.
Облеклото на Андреа Банда Банда беше решено в стил „за всекиго по нещо“. То беше с горна част, разкриваща доста плът – за радост на онези, според които жената пред камера трябва да е по-секси. Но пък не с минижуп, а с дълъг панталон, за да е доволна и по-консервативната аудитория. И със странични джобове на крачолите, каквито се харесват на по-алтернативните зрители. Но пък в розово – като реверанс към стереотипа за жена (а може би и към Барби модата).
Хейтът
Негативните реакции след първото издание на „Вечерното шоу“ с новата водеща не закъсняха. А позитивни е трудно да се открият сред многократно препубликуваните унищожителни коментари (към които не слагам линкове, за да не засилвам допълнително популярността им).
На първо място, много критики и даже обиди отнесе външният вид на Андреа Банда Банда. Облеклото „за всекиго по нещо“ като че имаше обратния ефект – коментиращите се концентрираха върху това, което не харесват. Широко обсъждано беше и тялото ѝ. За сравнение, мъжете – водещи на токшоута, по правило са облечени в костюми, които им придават сериозен вид и скриват недостатъците и „спорните“ детайли от тялото им (например татуировките на Цитиридис).
Имаше недоволства и от начина на говорене на водещата, който беше определен като неясен и дори с дефекти (в случай че има такива, човек трудно би могъл да ги забележи, ако не е логопед например). Всъщност Андреа Банда Банда говори по начин, който е типичен за пред млада аудитория в интернет, докато телевизионните зрители очакват друг тип дикция и артикулация. Нещата не опират до дефект, а до стил – актьорите например говорят по различен начин в театъра и киното. Същото се отнася и за поведението пред телевизионната камера – интервютата на инфлуенсърката със събеседниците ѝ по-скоро напомняха на подкаст, отколкото на вечерно токшоу.
Много от нещата, които новата водеща каза, също бяха обект на остри критики. Това ставаше предимно по един и същи модел – думите ѝ се изваждаха от контекста и не се отчиташе самоиронията, характерна за Андреа Банда Банда. Много е лесно едно твърдение да се извади от контекст и да му се придаде смисъл, различен от вложения (мога да потвърдя това от личен опит).
Проблемът всъщност е в БНТ
Като водеща на „Вечерното шоу“ по БНТ Андреа Банда Банда е „върхът на айсберга“ – зад нея има екип от сценаристи, продуценти, сценографи и пр. Има го и ръководството на телевизията, на върха на което продължава да стои Емил Кошлуков, въпреки че мандатът му отдавна е изтекъл. По време на властването му на този пост бяха затрити предавания като „Денят започва с култура“ (което стана „Култура.бг“, но вече не е същото). Една от малкото читави продукции по времето на Кошлуков е „Моят плейлист“ с Васил Върбанов.
За да смени „Вечерното шоу“ петима водещи, нещо в концепцията му изначално не е наред и то не привлича аудитория. Началото му през 2020 г. е по време на пандемията, но три години и половина по-късно инвестициите в него са незабележими с просто око. То все така няма бенд. Ако поканените музиканти изпеят нещо в студиото, съпроводът или е на плейбек (понякога май и самото пеене), или някои си носят я китара, я клавир.
Андреа Банда Банда наследява старите декори и мебели на шоуто, вероятно и стария екип. Но БНТ, изглежда, е с нереалистични очаквания, че почитателите на инфлуенсърката механично ще се пренесат пред телевизора. А представителите на по-младите интернет поколения не само не изпитват потребност от класическа телевизия, а дори не са склонни лесно да преминат от една социална мрежа към друга.
Е, когато влогърът Емил Конрад напише книга, стотици фенове се редят на опашка да си я купят. Но едно е да си вземеш книга (и евентуално да я прочетеш), друго – да се закотвиш в точно определен ден и час пред телевизионния екран.
По-възрастните поколения, които гледат телевизия (и в частност – БНТ), вероятно в по-голяма степен биха предпочели шоу в стилистиката на Хачо Бояджиев и новогодишните му програми. На тях плейбекът не им пречи. Представата за шоу на други пък се свежда до Слави Трифонов, когото са гледали 20 години на екран. Андреа Банда Банда по никакъв начин не отговаря на представите и на едните, и на другите за вечерно телевизионно забавление. Колкото и да търси мостове към сърцата им.
Жена във вечерно шоу?
БНТ заслужава поздравление за смелото решение да избере жена за водеща на вечерното си токшоу. Трудно можем да се сетим за такива водещи в световен план. Може би най-известните жени, оглавили токшоута, макар и в двата случая не вечерни, са Опра Уинфри и Елън Дедженеръс. Проблемът обаче е в липсата на концепция каква да е ролята на тази жена в предаването. И в резултат се постига обратният ефект – присъствието ѝ отприщва множество сексистки коментари.
Ако в качеството си на обществена телевизия БНТ искаше да привлече жена с остър език и социална чувствителност, можеше да покани някоя с опит в стендъп комедията, като Красимира Хаджииванова. Но тя не би могла да вирее в атмосфера на цензура и очакване да говори това, което е удобно на силните на деня и което „хората искат да чуят“.
Опра Уинфри, задържала се на малкия екран повече и от Слави – цели 25 години, е от афроамерикански произход. Би ли поканила БНТ ромка за водеща – да кажем, актрисата Наталия Цекова? Едва ли ще рискува да скандализира и без това немногобройната си аудитория.
Елън Дедженеръс пък, чието токшоу спря след 19 години, е открита лесбийка. Идеята обществената ни телевизия да покани за водеща хомосексуална жена с ораторски талант и убийствено чувство за хумор като Галя Петкова е по-невероятна и от тази за ромска водеща.
Николаос Цитиридис като поука
За свой първи гост Андреа Банда Банда покани Николаос Цитиридис, чието шоу в bTVзапочна с високи очаквания, защото беше на мястото на Слави Трифонов, но слезе от екрана след четири години. Един от въпросите на водещата към Цитиридис беше: „Как да се държа, когато интервюирам хора, които не ми харесват?“ След малко реши да се поправи: „Аз като цяло се шегувах, надявам се да не каня хора, които не харесвам“, а Цитиридис репликира: „Аз се опитвам да те извадя в момента от ситуацията.“
А „ситуацията“ е, че с въпроса си инфлуенсърката неволно разкри един проблем, за който телевизионните водещи обикновено не говорят в прав текст. А именно, че те нямат пълната свобода да избират кого да канят, нерядко и по какви теми да говорят или да не говорят, а това се решава (в най-добрия случай – одобрява) от продуценти, в някои случаи – и от ръководството на телевизията.
Проблемът с Николаос Цитиридис е, че той беше по-добър от шоуто си. bTV не само полира цветистия му език, който си е на мястото в стендъпа, но не и на малкия екран. В ситуацията на медийна цензура, особено в националните телевизии, Цитиридис рядко можеше да си позволява остри политически коментари, в каквито е силен, и които са сърцевината на много добри токшоута по света. Вместо това предаването му се превърна основно в промотиране на други продукции на bTV, например в канене на актьори от сериали на телевизията. Плюс популярни лица за цвят.
Така опитите „да предложим на аудиторията това, което тя иска да види“, и да не обидим онези, които са на власт, доведоха до обезличаване на шоуто.
Андреа Банда Банда не изглежда да има намерение да прави остро политическо шоу – тя само спомена интервюто си с Васил Терзиев и безобидно се пошегува за цигарите на Андрей Слабаков. В пилотното предаване пиперливите политически коментари (по адрес на Антон Хекимян и Слави Трифонов) бяха на Цитиридис.
Но поуката за инфлуенсърката е, че медийната стратегия да се харесваш на всички е обречена на неуспех. Макар други да стоят зад неуспеха, накрая загубата ще се припише на теб. И можеш да се върнеш там, откъдето си тръгнал. Което не е лесно, ако междувременно си станал друг.
Водещо изображение: Николаос Цитиридис, Андреа Банда Банда и Боро Първи в студиото на „Вечерното шоу“. Снимка: БНТ
Избухне ли война, на хората не им е до игри на думи, изследвания и размисли, не им е до многословие. Първите страшни часове и дни са по-скоро време за кратки възгласи и вопли, призиви и команди, изплашени молби и шепоти, откъслечни слухове. А по-нататък става едно малко странно чудо: лека-полека военната реалност се превръща в норма. Свикваме. И правим наивното откритие, че животът продължава. Сиреч продължава да диша и да се променя и словото.
Украйна до голяма степен не беше готова за жестоката руска агресия на 24 февруари 2022-ра. Това се усети и в езиковата материя. Много от нас отначало просто не разполагаха с нужните за подобни обстоятелства думи и препратки. Ето защо в края на онзи злополучен февруари украинците често цитираха една наглед не съвсем уместна за контекста съветска песен от Втората световна:
Ровно в четыре часа Киев бомбили, нам объявили, что началася война…
(„Точно в четири часа бомбардираха Киев – съобщиха ни, че е започнала война…“). Днес, две години по-късно, рядко някой се сеща за нея – междувременно бяха измислени какви ли не нови неща, а съветските творения започнаха да въздействат все по-отблъскващо.
2.
Новите реалии изискваха нови думи. Първо шумно „избухнаха“ названията на активно използваните оръжия. Най-напред – американските преносими противотанкови ракетни комплекси „Джавелин“ и турските бойни дронове „Байрактар“. Те бяха особено забележими през пролетта на 2022 г., когато украинците отбиваха стремителното настъпление на руските военни колони в огромни части от севера, юга и изтока на страната. Затова с техните имена започнаха да се кръщават коктейли, кафенета и радиостанции. И то се знае – песни. С течение на времето, когато тази мода излезе от пределите на здравия смисъл, се появи думата байрактарщина – осезаемо „предобряне“ с военни или околовоенни образи, знаци и термини.
Друга важна дума, особено през 2022 г., е тероборона („теротбрана“ – от „териториална отбрана“). Говорим за род украински войски, „прикрепени“ към определен регион. В началото на руското нахлуване обаче, когато съществена роля в съпротивата срещу нашествениците играеха все още слабо организираните групи от доброволци, добре познаващи родния си град, квартал или село, а в определени моменти и места, оръжието се раздаваше едва ли не на всички желаещи, всичко това също се наричаше „тероборона“.
В град Буча недалеч от Киев, където живея от седем години, през февруари 2022 г. активисти (кой с боеви опит, кой без) сформираха няколко такива лековъоръжени отряда, които докъм 3 март оказваха дейна съпротива на руските войски. На 27 февруари те първи пресрещнаха руската колона, разбита по-късно на „Вокзальна вулиця“ (Гаровата улица) – фотографии от разгрома ѝ обиколиха света и станаха един от символите на Буча. До началото на окупацията тези отряди бяха практически единствените силови структури, които донякъде контролираха града, а в някои квартали продължиха да действат и докато трая окупацията. Разбира се, става дума за спонтанни формации от граждани, а не за род войски – по-уместно би било да се говори за „самоотбрана“, но „теротбрана“ се наложи.
Или да вземем ироничното бавовна. Игра на думи, стъпила на руската мода (официалният и неофициален новговор в днешна Русия е отделна интересна тема) взривовете в окупираните територии или в самата Русия да се наричат просто „хлопо̀к“ („трясък“). По същия начин обаче се пише и „хло̀пок“, „памук“, което на украински е „бавовна“. Затова сега „памук“ наричаме всеки по-зрелищен и успешен украински удар по руските позиции, кораби, летища, мостове и градове.
„Кримски памук“, един от поредицата уж пантонски цветове на Слав Кривонос. Източник: @slav.kryvonos / Instagram
По-специфични и по-слабо известни на широката общественост са думите от строго армейския бит. Арта например е „артилерия“, покемон – модернизиран „Калашников“, нуль („нула“) – линията, в която се засрещат враждебните армии…
3.
Но бива ли език на войната без образ на врага? Нападналите Украйна наши „братя“, много ясно, предизвикаха грамадна вълна̀ от народна омраза (захранена и от „по-скромната“ агресия от 2014–2021 г.). Жестоките ракетни удари, изтребването на мирни жители в окупираните територии, разстрелите на пленници, фашистката реторика – всичко това не потуши страстите, само ги разпали.
Най-популярните наименования на руските войници в днешна Украйна са рашисти и орки. Първото е хибрид от Russia и „фашисти“ (парадокс: дискурсът на една война от ХХІ в. все още се върти около „фашисти“, „нацисти“ и „неонацисти“, както се именуват взаимно и двете страни). Второто е заемка от „Властелинът на пръстените“ на Толкин, където орките са отвратителните, безжалостни бойци на Мрачния владетел. Случвало се е в отговор на „орки“ руснаците подигравателно да наричат украинските военни „елфи“, но тази практика не стана масова.
За обозначаване на Русия се използва вехтото Московия или изразът в блатата. В употреба са и неуважителното русня¹, и традиционният етнофолизъмкацапи². А обидата йобана русня, ако човек иска да избегне цензурата в социалните мрежи или просто да намекне, се дава съкратено (йбнрсн и йбн блд³ рсн) или отзад напред (янсур анабой). Военните от многобройните „субекти в състава на Руската федерация“, като Тува или Татарстан, обобщено се наричат буряти (след 2022-ра мирното население край Киев никак не ги помни с добро). Заради любовта си към качването на клипчета в TikTok (често разиграващи мними епични сражения) подчинените на Кадиров чеченски отряди се славят като тиктокъри.
Немалък дял от лексикалната агресия се насочи към северния ни съсед – Беларус. Не всички украинци днес имат време, сили и желание да анализират кой е пожелал или е бил принуден да услужва на руските агресори с територия, летища, полигони, а вероятно и с оръжие, техника и униформи – дали диктаторският апарат на Лукашенко, или белоруското общество (и каква част от него). Затова се появиха откровени гаври с името на страната: Блядорусь, Беломосковия. Нещо сходно стана и с крайграничния руски Белгород, който – поради факта, че оттам редовно обстрелват Харков – за много украинци е вече Блядьгород.
Впрочем повечето украинци в тила все пак имат вземане-даване не с руски войници (уж нищо и никакво, а колко приятно!), а с руски ракети и ирански дронове. И ето че ракетите се превърнаха в блядіни/блєдіни (и се появи песента „Летить блєдіна“), а „шахидите“ заради формата си на „триъгълник с дръжка“ (на мен лично тя ми напомня на древен клинопис) станаха балалайки, което не значи, че не могат да бъдат и мопеди, шлюхеди и деренчалки („дрънчила“, „тракала“).
Образът на войната е обикновено образът на сплотения пред външната заплаха народ. Да, в подобни времена действително не може без масова взаимна поддръжка, всеобщо доброволчество, песни, от които на човек му притреперва в гърдите и прочее родолюбиви прояви. Милиони хора събират пари за консумативи за войниците. Непременно се намира кой да „хвърли“ с колата си безплатно родителите с деца, които напускат опасен район. На помощ в разчистването на отломките от пострадалия при ракетен удар блок задължително се стичат доброволци. Заникъде сме без тези неща.
Но националното единство не е цялата военна реалност. И колкото повече продължава ужасът на бойните действия, толкова по-чести и видими стават някои не толкова въодушевяващи явления. Вътрешни дрязги и конфликти; грешки на гражданските и военните власти и на политиците; разминавания в понятията за тактика и стратегия; болка и гняв от загубите; умора и травми. Всичко това също е война и то влияе на начина, по който говорим. Горчивата самоирония, внезапните счепквания (често ей така, от нищо), редуването на отчаяние и еуфория в зависимост от новините или имитациите на новини…
Трагикомичен на този фон стана изразът две-три седмици. Уж толкова щеше да продължи активната фаза на бойните действия според прогнозата от март 2022-ра на Олексий Арестович, скандален и противоречив политик, тогава съветник на президента Зеленски. Днес такова „пророчество“ разсмива и поражда всякакви пародии, но на онзи етап мнозина повярваха на Арестович. Едни – като на човек, който „няма как да не е наясно“, други – просто защото искаха да вярват. Изобщо, в първите дни и седмици на войната имаше много слухове и разговори за скорошния мир.
„Политиците ще се оправят помежду си“, „Сега като тръгнат труповете, ще им се отще да воюват“, „Никой не иска война насред Европа в ХХI век“ – под път и над път се чуваха тези и подобни фрази. Една моя позната разказва, че всяка вечер си лягала да спи и се надявала на сутринта да се окаже, че е сънувала кошмар. Лесно е да си представим какъв е мащабът на разочарованието, което очакваше хората, поддали се на такива настроения, повярвали на подобни предвиждания.
Когато намаля първоначалният мощен поток от доброволци, които постъпваха в украинската армия и паравоенните структури, се оказа, че далеч не всички са готови да се вдигнат на оръжие. И не всички поддържат политиката на границите, затворени за мъже в наборна възраст. Това е сериозен, макар и невинаги забележим отстрани вътрешен конфликт, върху който се наслагва и все по-голямата разлика в опита и вижданията на тези, които са на фронта, и тези, които са в тила; на избягалите от Украйна и останалите в страната. Едните призовават всички цивилни да отидат на фронта; другите изнамират начини да не получат призовка…
И езиковата реалност, разбира се, ярко отрази този феномен. Огромно разпространение получи терминът ухилянт (от „ухилятися“, „да изклинчиш“), тоест човек, който се скатава от военна служба. Негов аналог е мамина череша (заемка от стара сантиментална песен). Мъжете, които успяха да заминат в чужбина и не възнамеряват да се връщат и да се бият с руснаците, попадат групово в саркастичното название батальон Полша или батальон Монако (за по-заможните). Някои фронтоваци казват за гражданите в тила, че са в киевския котел („котел“ тук е преводимо на военен жаргон с „чува̀л“ – затворени в обкръжение военни части, които продължават да се съпротивляват), в диванния батальон.
На свой ред и „черешите“ разработиха своя терминология. Като съобщават в социалките за хайки или блокпостове, където се връчват призовки, те могат да нарекат военните маслини и зелени, а полицаите – сини. Получават се доста образни конструкции: „две краставици и един патладжан“ за „двама военни и един полицай“ например. Правят се и иносказателни „прогнози за времето“: „Биківня, дуже сонячно, вдягнула окуляри, загоріли ніжки“ („Биковня, много слънчево, сложих си очилата, опекох си крачетата“). Тоест в киевския квартал „Биковня“ засега не се връчват призовки…
5.
Епохата поражда своите обобщения и събирателни символи. Така името Мариупол стана символ на трагедията на морския град, на варварския щурм на руснаците, на печално известния обстрел на театъра, където се криеха мирни жители (надписът „ДЕЦА“ не трогна особено агресорите), на дългата отбрана и плена на защитниците.
А Буча вече е знак за поразителната жестокост на окупаторите, стоварила се върху мирните жители, за разстрелите по улиците и в мазетата. За разлика от Мариупол, през пролетта на 2022 г. Буча беше освободена. Как се живее сега в градчето край Киев, което се превърна в черна точка върху картата на общоприетите представи? Избиването на над 400 граждани, както и гибелта на много военни от Буча на фронта си остава отворена рана, за която напомнят посветените на загиналите информационни табла по централната пешеходна улица.
От друга страна, градът се оказа не чак толкова съсипан, колкото можеше да се очаква. Повечето щети върху инфраструктурата и сградите са вече отстранени; много от жителите се върнаха по домовете си. Животът в Буча днес не може да се нарече точно „мирен“, но е относително спокоен, тилови и доста активен. На хората от други градове и държави това им се струва странно. Удивяват се, че войната продължава, а ти можеш да се къпеш в езерото на прекрасния местен парк. И питат ли, питат:
Ама езерото разминираха ли го??? Нима в Буча има езеро, а на езерото – плаж??? Това наистина ли е онази Буча???
Войната на фронта и войната в тила са твърде различни неща. Същото може да се каже и за пълномащабната (като започналата през 2022-ра) и локалната война (като в Донбас в периода 2014–2022). И хората чрез начина си на изразяване се мъчат да нацелят разликата. Затова докато активистите ни убеждават да не говорим за 24 февруари 2022 г. като за начало на войната (та пряката агресия на Русия започна още през 2014-та!), в Буча от обикновените хора на улицата на всяка крачка може да се чуе парадоксалната формулировка еди-какво си стана през войната, отнесена към февруарските боеве за града и окупацията му през март 2022-ра. А за сегашното време се използва след войната…
Изобщо, войната загадъчно изкривява времето в човешкото възприятие. Часовете и минутите, дните и месеците се сливат и нерядко стават абстрактни (участниците и непосредствените свидетели на военните събития бъркат датите най-лесно от всички). Сякаш отново заживяваме в някакво архаично циклично време, където видимото движение на небесните светила и усещането за атмосферните явления по кожата значат много повече, отколкото буквите и цифрите в календарите, часовниците и телефоните.
Превод от руски Нева Мичева
1 „Русня“ обобщава презрително всички руснаци (по същия модел са образувани и нашите „псувня“, „сплетня“, „шитня“ и под.). – Б.пр.
2 „Кацапи“ идва или от арабския корен, от който е и българското „касапи“, или от украинската дума „цап“, „козел“ – употребява се от векове за обидно сборно название на руснаците и техните привърженици. – Б.пр.
3 „Блд“ е от „блядь“ – една от най-често употребяваните украински и руски ругатни, проникнала рехаво и неофициално и на български. Според речниците означава „лека жена“, корени се в думи като „дрънкам“, „плещя“, но и „блея“, „блуден“ и в днешно време се използва най-вече като междуметие от сорта на „ебаси“ или съществително в смисъла на „гадина“, „изрод“ и подобни. Поради огромната си популярност има най-разнообразни трансформации от „бля“ до „блядина“. – Б.пр.
4 Още в началото на март 2022 г. украинските пощи обявиха допитване до народа за дизайна на пощенска марка „Руски военен кораб, върви на майната си“ в чест на събитията от Змийския остров (спечели Борис Грох), през април я пуснаха в продажба, а през юли заслужиха с нея световна награда за филателно изкуство. – Б.пр.
To provide the best experiences, we use technologies like cookies to store and/or access device information. Consenting to these technologies will allow us to process data such as browsing behavior or unique IDs on this site. Not consenting or withdrawing consent, may adversely affect certain features and functions.
Functional
Always active
The technical storage or access is strictly necessary for the legitimate purpose of enabling the use of a specific service explicitly requested by the subscriber or user, or for the sole purpose of carrying out the transmission of a communication over an electronic communications network.
Preferences
The technical storage or access is necessary for the legitimate purpose of storing preferences that are not requested by the subscriber or user.
Statistics
The technical storage or access that is used exclusively for statistical purposes.The technical storage or access that is used exclusively for anonymous statistical purposes. Without a subpoena, voluntary compliance on the part of your Internet Service Provider, or additional records from a third party, information stored or retrieved for this purpose alone cannot usually be used to identify you.
Marketing
The technical storage or access is required to create user profiles to send advertising, or to track the user on a website or across several websites for similar marketing purposes.


.jpg?uselang=ru)