Version
1.90.0 of the Rust language has been released. Changes include
switching to the LLD linker by default,
the addition of support for workspace publishing to cargo, and the
usual set of stabilized APIs.
The Universal Blue project has announced the release of Bluefin LTS,
an image-based distribution similar to Bluefin that uses
CentOS Stream 10 and EPEL instead of Fedora as its base:
Bluefin LTS ships with Linux 6.12.0, which is the kernel for the
lifetime of release. An optional hwe branch with new kernels is
available, offering the same modern kernel you’ll find in Bluefin and
Bluefin GTS. Both vanilla and HWE ISOs are available, and you can
always choose to switch back and forth after installation. […]
Bluefin LTS provides a backported GNOME desktop so that you are not
left behind. This is an important thing for us. James has been
diligently working on GNOME backports with the upstream CentOS
community, and we feel bringing modern GNOME desktops to an LTS makes
sense.
Connecting to an application should be as simple as knowing its name. Yet, many security models still force us to rely on brittle, ever-changing IP addresses. And we heard from many of you that managing those ever-changing IP lists was a constant struggle.
Today, we’re taking a major step toward making that a relic of the past.
We’re excited to announce that you can now route traffic to Cloudflare Tunnel based on a hostname or a domain. This allows you to use Cloudflare Tunnel to build simple zero-trust and egress policies for your private and public web applications without ever needing to know their underlying IP. This is one more step on our mission to strengthen platform-wide support for hostname- and domain-based policies in the Cloudflare One SASE platform, simplifying complexity and improving security for our customers and end users.
Now, instead of granting broad network permissions, you grant specific access to individual resources. This concept, known as per-resource authorization, is a cornerstone of the Zero Trust framework, and it presents a huge change to how organizations have traditionally run networks. Per-resource authorization requires that access policies be configured on a per-resource basis. By applying the principle of least privilege, you give users access only to the resources they absolutely need to do their job. This tightens security and shrinks the potential attack surface for any given resource.
Instead of allowing your users to access an entire network segment, like 10.131.0.0/24, your security policies become much more precise. For example:
Only employees in the “SRE” group running a managed device can access admin.core-router3-sjc.acme.local.
Only employees in the “finance” group located in Canada can access canada-payroll-server.acme.local.
All employees located in New York can accessprinter1.nyc.acme.local.
Notice what these powerful, granular rules have in common? They’re all based on the resource’s private hostname, not its IP address. That’s exactly what our new hostname routing enables. We’ve made it dramatically easier to write effective zero trust policies using stable hostnames, without ever needing to know the underlying IP address.
Why IP-based rules break
Let’s imagine you need to secure an internal server, canada-payroll-server.acme.local. It’s hosted on internal IP 10.4.4.4 and its hostname is available in internal private DNS, but not in public DNS. In a modern cloud environment, its IP address is often the least stable thing about it. If your security policy is tied to that IP, it’s built on a shaky foundation.
This happens for a few common reasons:
Cloud instances: When you launch a compute instance in a cloud environment like AWS, you’re responsible for its hostname, but not always its IP address. As a result, you might only be tracking the hostname and may not even know the server’s IP.
Load Balancers: If the server is behind a load balancer in a cloud environment (like AWS ELB), its IP address could be changing dynamically in response to changes in traffic.
Ephemeral infrastructure: This is the “cattle, not pets” world of modern infrastructure. Resources like servers in an autoscaling group, containers in a Kubernetes cluster, or applications that spin down overnight are created and destroyed as needed. They keep a persistent hostname so users can find them, but their IP is ephemeral and changes every time they spin up.
To cope with this, we’ve seen customers build complex scripts to maintain dynamic “IP Lists” — mappings from a hostname to its IPs that are updated every time the address changes. While this approach is clever, maintaining IP Lists is a chore. They are brittle, and a single error could cause employees to lose access to vital resources.
Fortunately, hostname-based routing makes this IP List workaround obsolete.
How it works: secure a private server by hostname using Cloudflare One SASE platform
To see this in action, let’s create a policy from our earlier example: we want to grant employees in the “finance” group located in Canada access to canada-payroll-server.acme.local. Here’s how you do it, without ever touching an IP address.
Step 1: Connect your private network
First, the server’s network needs a secure connection to Cloudflare’s global network. You do this by installing our lightweight agent, cloudflared, in the same local area network as the server, which creates a secure Cloudflare Tunnel. You can create a new tunnel directly from cloudflared by running cloudflared tunnel create <TUNNEL-NAME> or using your Zero Trust dashboard.
Step 2: Route the hostname to the tunnel
This is where the new capability comes into play. In your Zero Trust dashboard, you now establish a route that binds the hostnamecanada-payroll-server.acme.local directly to that tunnel. In the past, you could only route an IP address (10.4.4.4) or its subnet (10.4.4.0/24). That old method required you to create and manage those brittle IP Lists we talked about. Now, you can even route entire domains, like *.acme.local, directly to the tunnel, simply by creating a hostname route to acme.local.
For this to work, you must delete your private network’s subnet (in this case 10.0.0.0/8) and 100.64.0.0/10 from the Split Tunnels Exclude list. You also need to remove .local from the Local Domain Fallback.
(As an aside, we note that this feature also works with domains. For example, you could bind *.acme.local to a single tunnel, if desired.)
Step 3: Write your zero trust policy
Now that Cloudflare knows how to reach your server by its name, you can write a policy to control who can access it. You have a couple of options:
In Cloudflare Access (for HTTPS applications): Write an Access policy that grants employees in the “finance” group access to the private hostname canada-payroll-server.acme.local. This is ideal for applications accessible over HTTPS on port 443.
In Cloudflare Gateway (for HTTPS applications): Alternatively, write a Gateway policy that grants employees in the “finance” group access to the SNIcanada-payroll-server.acme.local. This works for services accessible over HTTPS on any port.
In Cloudflare Gateway (for non-HTTP applications): You can also write a Gateway policy that blocks DNS resolution canada-payroll-server.acme.local for all employees except the “finance” group.
The principle of “trust nothing” means your security posture should start by denying traffic by default. For this setup to work in a true Zero Trust model, it should be paired with a default Gateway policy that blocks all access to your internal IP ranges. Think of this as ensuring all doors to your private network are locked by default. The specific allow policies you create for hostnames then act as the keycard, unlocking one specific door only for authorized users.
Without that foundational “deny” policy, creating a route to a private resource would make it accessible to everyone in your organization, defeating the purpose of a least-privilege model and creating significant security risks. This step ensures that only the traffic you explicitly permit can ever reach your corporate resources.
And there you have it. We’ve walked through the entire process of writing a per-resource policy using only the server’s private hostname. No IP Lists to be seen anywhere, simplifying life for your administrators.
Secure egress traffic to third-party applications
Here’s another powerful use case for hostname routing: controlling outbound connections from your users to the public Internet. Some third-party services, such as banking portals or partner APIs, use an IP allowlist for security. They will only accept connections that originate from a specific, dedicated public source IP address that belongs to your company.
This common practice creates a challenge. Let’s say your banking portal at bank.example.com requires all traffic to come from a dedicated source IP 203.0.113.9 owned by your company. At the same time, you want to enforce a zero trust policy that only allows your finance team to access that portal. You can’t build your policy based on the bank’s destination IP — you don’t control it, and it could change at any moment. You have to use its hostname.
There are two ways to solve this problem. First, if your dedicated source IP is purchased from Cloudflare, you can use the “egress policy by hostname” feature that we announced previously. By contrast, if your dedicated source IP belongs to your organization, or is leased from cloud provider, then we can solve this problem with hostname-based routing, as shown in the figure below:
Here’s how this works:
Force traffic through your dedicated IP. First, you deploy a Cloudflare Tunnel in the network that owns your dedicated IP (for example, your primary VPC in a cloud provider). All traffic you send through this tunnel will exit to the Internet with 203.0.113.9 as its source IP.
Route the banking app to that tunnel. Next, you create a hostname route in your Zero Trust dashboard. This rule tells Cloudflare: “Any traffic destined for bank.example.com must be sent through this specific tunnel.”
Apply your user policies. Finally, in Cloudflare Gateway, you create your granular access rules. A low-priority network policy blocks access to the SNIbank.example.com for everyone. Then, a second, higher-priority policy explicitly allows users in the “finance” group to access the SNIbank.example.com.
Now, when a finance team member accesses the portal, their traffic is correctly routed through the tunnel and arrives with the source IP the bank expects. An employee from any other department is blocked by Gateway before their traffic even enters the tunnel. You’ve enforced a precise, user-based zero trust policy for a third-party service, all by using its public hostname.
Under the hood: how hostname routing works
To build this feature, we needed to solve a classic networking challenge. The routing mechanism for Cloudflare Tunnel is a core part of Cloudflare Gateway, which operates at both Layer 4 (TCP/UDP) and Layer 7 (HTTP/S) of the network stack.
Cloudflare Gateway must make a decision about which Cloudflare Tunnel to send traffic upon receipt of the very first IP packet in the connection. This means the decision must necessarily be made at Layer 4, where Gateway only sees the IP and TCP/UDP headers of a packet. IP and TCP/UDP headers contain the destination IP address, but do not contain destination hostname. The hostname is only found in Layer 7 data (like a TLS SNI field or an HTTP Host header), which isn’t even available until after the Layer 4 connection is already established.
This creates a dilemma: how can we route traffic based on a hostname before we’ve even seen the hostname?
Synthetic IPs to the rescue
The solution lies in the fact that Cloudflare Gateway also acts as a DNS resolver. This means we see the user’s intent — the DNS query for a hostname — before we see the actual application traffic. We use this foresight to “tag” the traffic using a synthetic IP address.
Let’s walk through the flow:
DNS Query. A user’s device sends a DNS query for canada-payroll-server.acme.local to the Gateway resolver.
Private Resolution. Gateway asks the cloudflared agent running in your private network to resolve the real IP for that hostname. Since cloudflared has access to your internal DNS, it finds the real private IP 10.4.4.4, and sends it back to the Gateway resolver.
Synthetic Response. Here’s the key step. Gateway resolver does not send the real IP (10.4.4.4) back to the user. Instead, it temporarily assigns an initial resolved IP from a reserved Carrier-Grade NAT (CGNAT) address space (e.g., 100.80.10.10) and sends the initial resolved IP back to the user’s device. The initial resolved IP acts as a tag that allows Gateway to identify network traffic destined to canada-payroll-server.acme.local. The initial resolved IP is randomly selected and temporarily assigned from one of the two IP address ranges:
IPv4: 100.80.0.0/16
IPv6: 2606:4700:0cf1:4000::/64
Traffic Arrives. The user’s device sends its application traffic (e.g., an HTTPS request) to the destination IP it received from Gateway resolver: the initial resolved IP 100.80.10.10.
Routing and Rewriting. When Gateway sees an incoming packet destined for 100.80.10.10, it knows this traffic is for canada-payroll-server.acme.local and must be sent through a specific Cloudflare Tunnel. It then rewrites the destination IP on the packet back to the real private destination IP (10.4.4.4) and sends it down the correct tunnel.
The traffic goes down the tunnel and arrives at canada-payroll-server.acme.local at IP (10.4.4.4) and the user is connected to the server without noticing any of these mechanisms. By intercepting the DNS query, we effectively tag the network traffic stream, allowing our Layer 4 router to make the right decision without needing to see Layer 7 data.
Using Gateway Resolver Policies for fine grained control
The routing capabilities we’ve discussed provide simple, powerful ways to connect to private resources. But what happens when your network architecture is more complex? For example, what if your private DNS servers are in one part of your network, but the application itself is in another?
With Cloudflare One, you can solve this by creating policies that separate the path for DNS resolution from the path for application traffic for the very same hostname using Gateway Resolver Policies. This gives you fine-grained control to match complex network topologies.
Let’s walk through a scenario:
Your private DNS resolvers, which can resolve acme.local, are located in your core datacenter, accessible only via tunnel-1.
The webserver for canada-payroll-server.acme.localis hosted in a specific cloud VPC, accessible only via tunnel-2.
Here’s how to configure this split-path routing.
Step 1: Route DNS Queries via tunnel-1
First, we need to tell Cloudflare Gateway how to reach your private DNS server
Create an IP Route: In the Networks > Tunnels area of your Zero Trust dashboard, create a route for the IP address of your private DNS server (e.g., 10.131.0.5/32) and point it to tunnel-1. This ensures any traffic destined for that specific IP goes through the correct tunnel to your datacenter.
Create a Resolver Policy: Go to Gateway -> Resolver Policies and create a new policy with the following logic:
If the query is for the domain acme.local …
Then… resolve it using a designated DNS server with the IP 10.131.0.5.
With these two rules, any DNS lookup for acme.local from a user’s device will be sent through tunnel-1 to your private DNS server for resolution.
Step 2: Route Application Traffic via tunnel-2
Next, we’ll tell Gateway where to send the actual traffic (for example, HTTP/S) for the application.
Create a Hostname Route: In your Zero Trust dashboard, create a hostname route that binds canada-payroll-server.acme.local to tunnel-2.
This rule instructs Gateway that any application traffic (like HTTP, SSH, or any TCP/UDP traffic) for canada-payroll-server.acme.local must be sent through tunnel-2leading to your cloud VPC.
Similarly to a setup without Gateway Resolver Policy, for this to work, you must delete your private network’s subnet (in this case 10.0.0.0/8) and 100.64.0.0/10 from the Split Tunnels Exclude list. You also need to remove .local from the Local Domain Fallback.
Putting It All Together
With these two sets of policies, the “synthetic IP” mechanism handles the complex flow:
A user tries to access canada-payroll-server.acme.local. Their device sends a DNS query to Cloudflare Gateway Resolver.
This DNS query matches a Gateway Resolver Policy, causing Gateway Resolver to forward the DNS query through tunnel-1 to your private DNS server (10.131.0.5).
Your DNS server responds with the server’s actual private destination IP (10.4.4.4).
Gateway receives this IP and generates a “synthetic” initial resolved IP (100.80.10.10) which it sends back to the user’s device.
The user’s device now sends the HTTP/S request to the initial resolved IP (100.80.10.10).
Gateway sees the network traffic destined for the initial resolved IP (100.80.10.10) and, using the mapping, knows it’s for canada-payroll-server.acme.local.
The Hostname Route now matches. Gateway sends the application traffic through tunnel-2 and rewrites its destination IP to the webserver’s actual private IP (10.4.4.4).
The cloudflared agent at the end of tunnel-2 forwards the traffic to the application’s destination IP (10.4.4.4), which is on the same local network.
The user is connected, without noticing that DNS and application traffic have been routed over totally separate private network paths. This approach allows you to support sophisticated split-horizon DNS environments and other advanced network architectures with simple, declarative policies.
What onramps does this support?
Our hostname routing capability is built on the “synthetic IP” (also known as initially resolved IP) mechanism detailed earlier, which requires specific Cloudflare One products to correctly handle both the DNS resolution and the subsequent application traffic. Here’s a breakdown of what’s currently supported for connecting your users (on-ramps) and your private applications (off-ramps).
Connectivity is also possible when users are behind Magic WAN (in active-passive mode) or WARP Connector, but it requires some additional configuration. To ensure traffic is routed correctly, you must update the routing table on your device or router to send traffic for the following destinations through Gateway:
The initially resolved IP ranges: 100.80.0.0/16 (IPv4) and 2606:4700:0cf1:4000::/64 (IPv6).
The private network CIDR where your application is located (e.g., 10.0.0.0/8).
The IP address of your internal DNS resolver.
The Gateway DNS resolver IPs: 172.64.36.1 and 172.64.36.2.
Magic WAN customers will also need to point their DNS resolver to these Gateway resolver IPs and ensure they are running Magic WAN tunnels in active-passive mode: for hostname routing to work, DNS queries and the resulting network traffic must reach Cloudflare over the same Magic WAN tunnel. Currently, hostname routing will not work if your end users are at a site that has more than one Magic WAN tunnel actively transiting traffic at the same time.
Connecting Your Private Network (Off-Ramps)
On the other side of the connection, hostname-based routing is designed specifically for applications connected via Cloudflare Tunnel (cloudflared). This is currently the only supported off-ramp for routing by hostname.
Other traffic off-ramps, while fully supported for IP-based routing, are not yet compatible with this specific hostname-based feature. This includes using Magic WAN, WARP Connector, or WARP-to-WARP connections as the off-ramp to your private network. We are actively working to expand support for more on-ramps and off-ramps in the future, so stay tuned for more updates.
Conclusion
By enabling routing by hostname directly within Cloudflare Tunnel, we’re making security policies simpler, more resilient, and more aligned with how modern applications are built. You no longer need to track ever-changing IP addresses. You can now build precise, per-resource authorization policies for HTTPS applications based on the one thing that should matter: the name of the service you want to connect to. This is a fundamental step in making a zero trust architecture intuitive and achievable for everyone.
This powerful capability is available today, built directly into Cloudflare Tunnel and free for all Cloudflare One customers.
Ready to leave IP Lists behind for good? Get started by exploring our developer documentation to configure your first hostname route. If you’re new to Cloudflare One, you can sign up today and begin securing your applications and networks in minutes.
Version
7.0 of the Tails portable
operating system has been released. This is the first version of Tails
based on Linux 6.12.43, Debian 13
(“trixie”) and GNOME 48. It uses ztsd instead of xz to compress the USB and ISO images to deliver a
faster start time on most computers. The release is dedicated to the memory of Lunar, “a
traveling companion for Tails, a Tor volunteer, Free Software hacker,
and community organizer“:
Lunar has always been by our side throughout Tails’ history. From
the first baby steps of the project that eventually became Tails, to
the merge with Tor, he’s provided sensible technical suggestions,
out-of-the-box product design ideas, outreach support, and caring
organizational advice.
Outside of Tor, Lunar worked on highly successful Free Software
projects such as the Debian project, the Linux distribution on which
Tails is based, and the Reproducible Builds
project, which helps us verify the integrity of Tails releases.
See the changelog
for a full list of fixes, upgraded applications, and removals. LWN covered Tails
Project team leader intrigeri’s DebConf25 talk in July.
Abstract: Large Language Model (LLM)-enabled agents are rapidly emerging across a wide range of applications, but their deployment introduces vulnerabilities with security implications. While prior work has examined prompt-based attacks (e.g., prompt injection) and data-oriented threats (e.g., data exfiltration), time-of-check to time-of-use (TOCTOU) remain largely unexplored in this context. TOCTOU arises when an agent validates external state (e.g., a file or API response) that is later modified before use, enabling practical attacks such as malicious configuration swaps or payload injection. In this work, we present the first study of TOCTOU vulnerabilities in LLM-enabled agents. We introduce TOCTOU-Bench, a benchmark with 66 realistic user tasks designed to evaluate this class of vulnerabilities. As countermeasures, we adapt detection and mitigation techniques from systems security to this setting and propose prompt rewriting, state integrity monitoring, and tool-fusing. Our study highlights challenges unique to agentic workflows, where we achieve up to 25% detection accuracy using automated detection methods, a 3% decrease in vulnerable plan generation, and a 95% reduction in the attack window. When combining all three approaches, we reduce the TOCTOU vulnerabilities from an executed trajectory from 12% to 8%. Our findings open a new research direction at the intersection of AI safety and systems security.
Amazon SageMaker Unified Studio is a single data and AI development environment that brings together data preparation, analytics, machine learning (ML), and generative AI development in one place. By unifying these workflows, it saves teams from managing multiple tools and makes it straightforward for data scientists, analysts, and developers to build, train, and deploy ML models and AI applications while collaborating seamlessly.
In SageMaker Unified Studio, a project is a boundary where you can collaborate with other users to work on a business use case. A blueprint defines what AWS tools and services members of a project can use as they work with their data. Blueprints are defined by an administrator and are powered by AWS CloudFormation. Instead of manually piecing together project structures or workflow configurations, teams can rapidly spin up secure, compliant, and consistent analytics and AI environments. This streamlined approach significantly reduces setup time and provides standardized workspaces across the organization. Out of the box, SageMaker Unified Studio comes with several default blueprints.
We recently launched the custom blueprints feature in SageMaker Unified Studio. Organizations can now incorporate their specific dependencies, security controls using their own managed AWS Identity and Access Management (IAM) policies, and best practices, making it straightforward for them to align with internal standards. Because they’re defined through infrastructure as code (IaC), blueprints are straightforward to version control, share across teams, and evolve over time. This speeds up onboarding and keeps projects consistent and governed, no matter how big or distributed your data organization becomes.
For enterprises, this means more time focusing on insights, models, and innovation. The custom blueprints feature is designed to help teams move faster and stay consistent while maintaining their organization’s security controls and best practices. In this post, we show how to get started with custom blueprints in SageMaker Unified Studio.
Solution overview
We provide a CloudFormation template to implement a custom blueprint in SageMaker Unified Studio. The template deploys the following resources in the project environment:
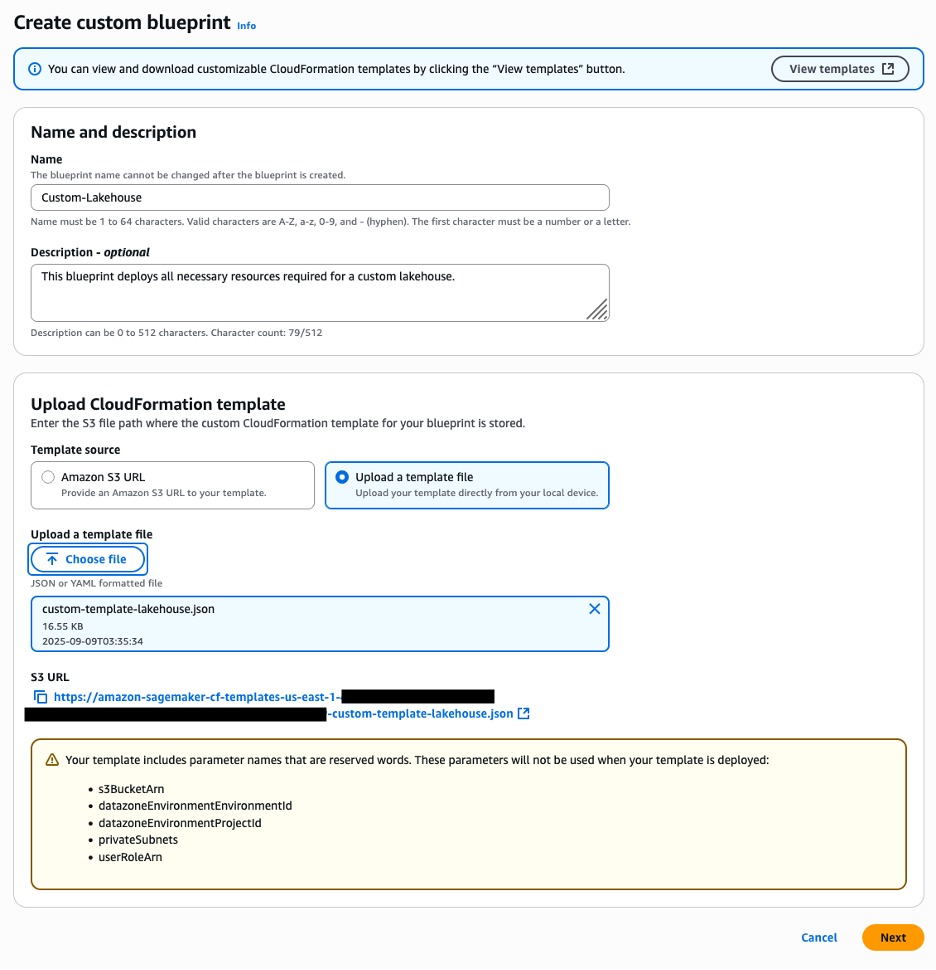
The CloudFormation template uses parameters that are reserved to your SageMaker environment, such as datazoneEnvironmentEnvironmentId, datazoneEnvironmentProjectId, s3BucketArn, and privateSubnets. These parameters are automatically populated by SageMaker when creating the project. The parameters also help in retrieving other environment variables, such as SecurityGroupIds, as shown in the following snippets.
The following code illustrates defining reserved environment parameters:
"Parameters": {
        "datazoneEnvironmentEnvironmentId": {
            "Type": "String",
            "Description": "EnvironmentId for which the resource will be created for."
        },
        "datazoneEnvironmentProjectId": {
            "Type": "String",
            "Description": "DZ projectId for which project the resource will be created for."
        },
        "s3BucketArn": {
            "Type": "String",
            "Description": "Project S3 Bucket ARN"
        },
        "privateSubnets": {
            "Type": "String",
            "Description": "Project Private Subnets"
        }
}
The following code illustrates using reserved environment parameters to import other necessary values:
By default, SageMaker Unified Studio creates a project role and attaches several managed policies to the role. These managed policies are defined in the tooling blueprint. With custom blueprints, you can configure and attach your own IAM policies, in addition to the default policies, to the project role. To do this, include the IAM policies in your CloudFormation template and use the Export feature in the Outputs section, as shown in the following code. SageMaker Unified Studio gathers the policy information and adds it to the project role.
"GlueAccessManagedPolicy": {
            "Description": "ARN of the created managed policy",
            "Value": {
                "Ref": "GlueAccessManagedPolicy"
            },
            "Export": {
                "Name": {
                    "Fn::Sub": "datazone-managed-policy-glue-${glueDbName}-${datazoneEnvironmentEnvironmentId}"
                }
            }
        },
"RedshiftAccessManagedPolicy": {
            "Description": "ARN of the created Redshift managed policy",
            "Value": {
                "Ref": "RedshiftAccessManagedPolicy"
            },
            "Export": {
                "Name": {
                    "Fn::Sub": "datazone-managed-policy-redshift-${redshiftWorkgroupName}-${datazoneEnvironmentEnvironmentId}"
                }
            }
        }
Create custom blueprint
Complete the following steps to create a custom blueprint using the CloudFormation template:
On the Amazon SageMaker console, open the domain where you want to create a custom blueprint.
On the Blueprints tab, choose Create.
Under Name and description, enter a name and optional description.
Under Upload CloudFormation template, select Upload a template file and upload the provided template.
Choose Next. SageMaker will automatically detect the reserved parameters defined in the template, as shown in the following screenshot.
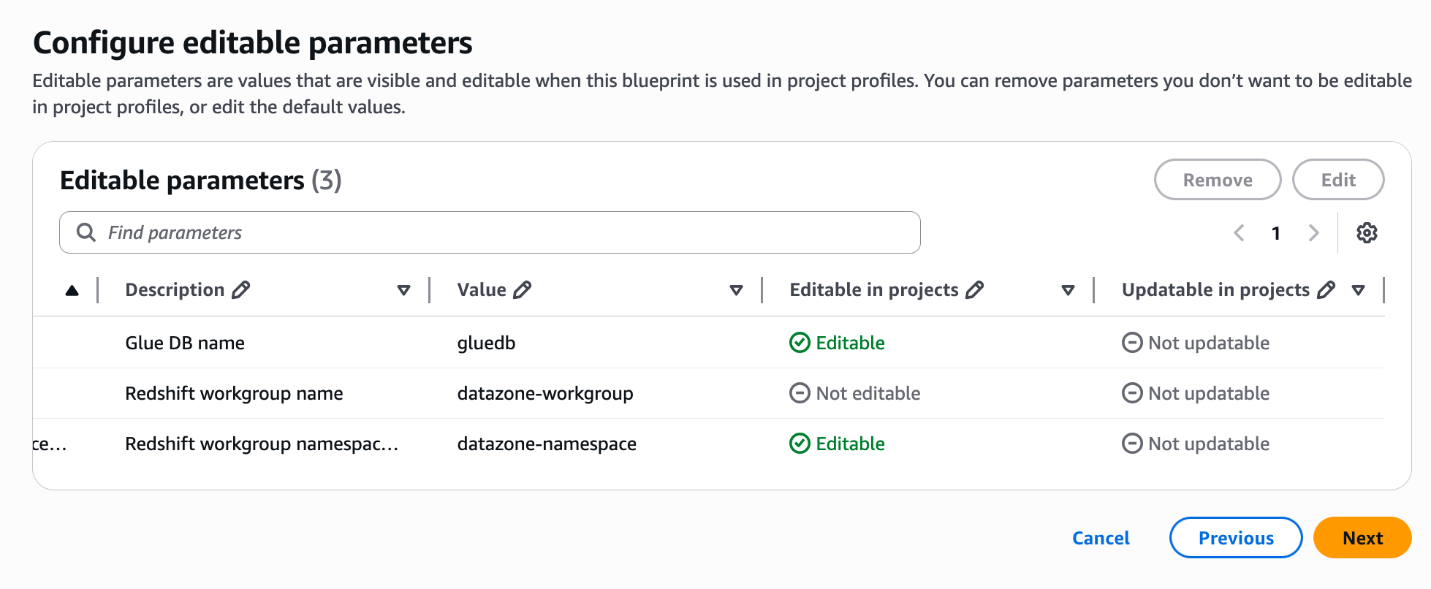
For Editable parameters, edit the Value column if necessary, and specify whether the values can be editable at the time of project creation.
Choose Next. As shown in the following screenshot, the reserved parameters described earlier are not shown on this page.
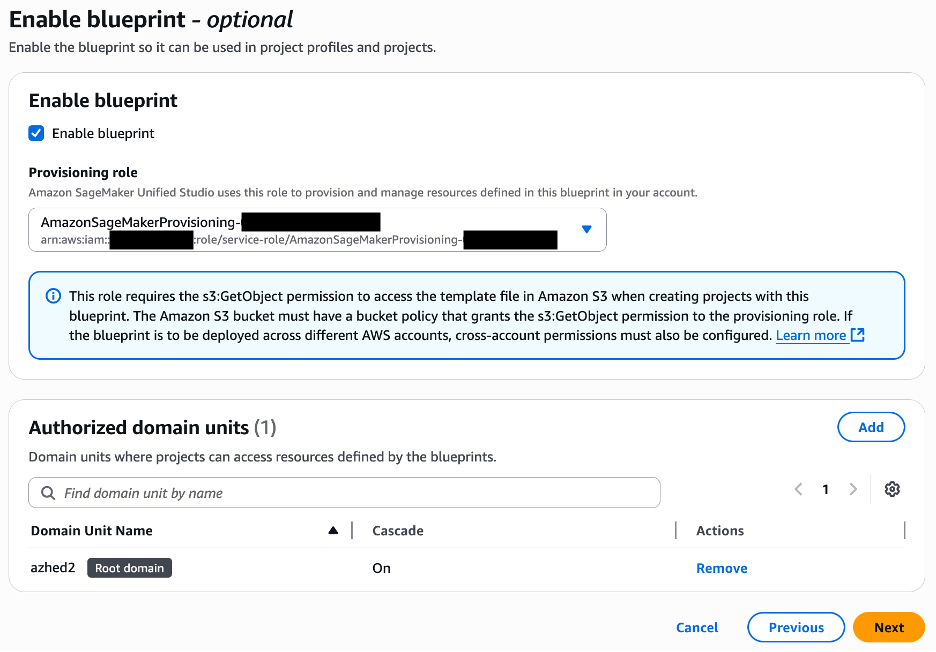
Select Enable blueprint.
Choose the provisioning role to be used by SageMaker to provision the environment resources.
Choose the domain units authorized to use the blueprint.
Choose Next.
Review the blueprint information and choose Create blueprint.
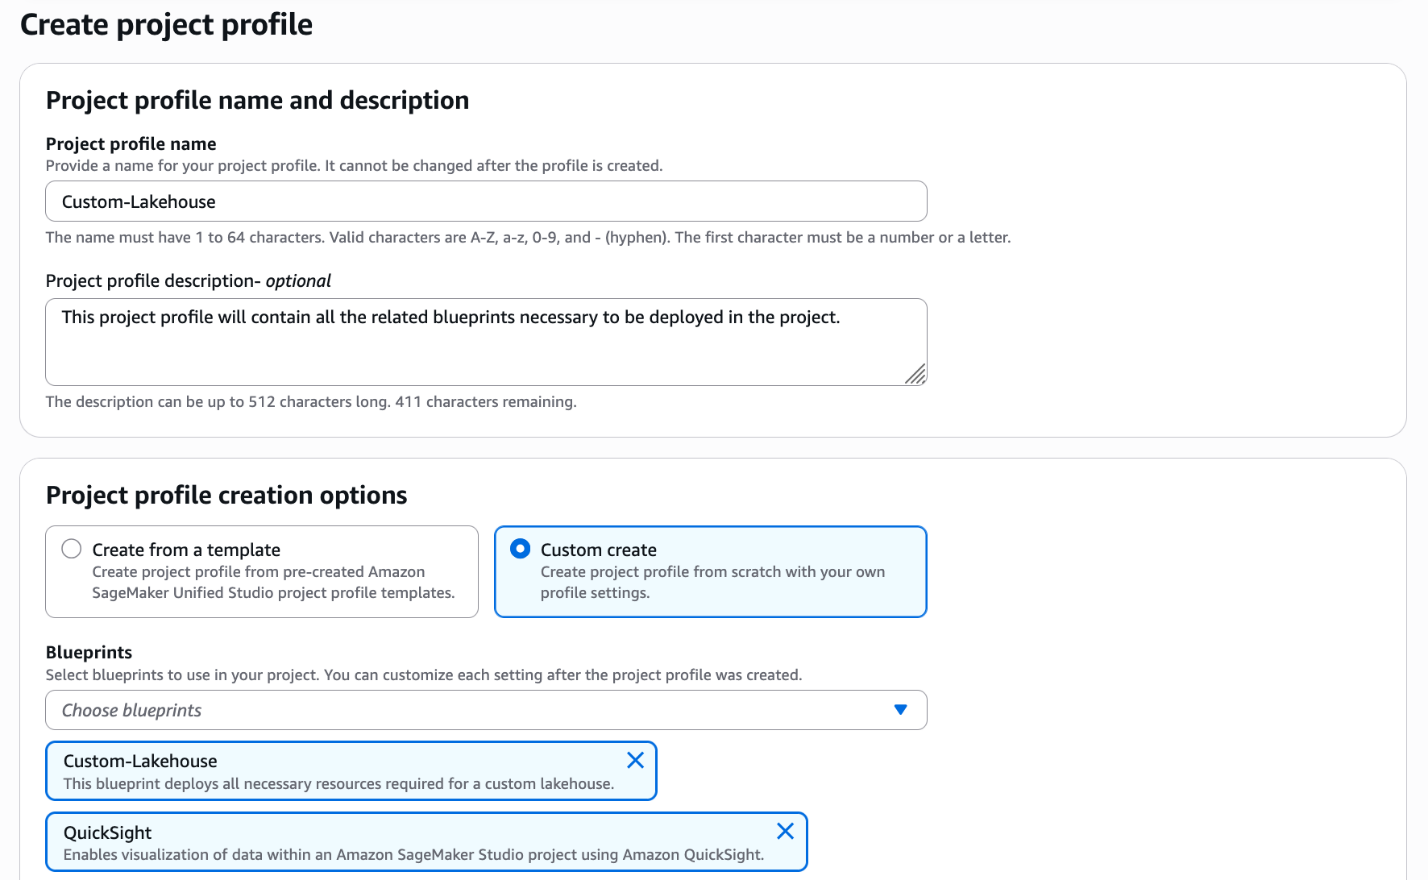
Create project profile
Complete the following steps to create a custom project profile that includes the custom blueprint created in the previous section:
On the SageMaker console, open your domain.
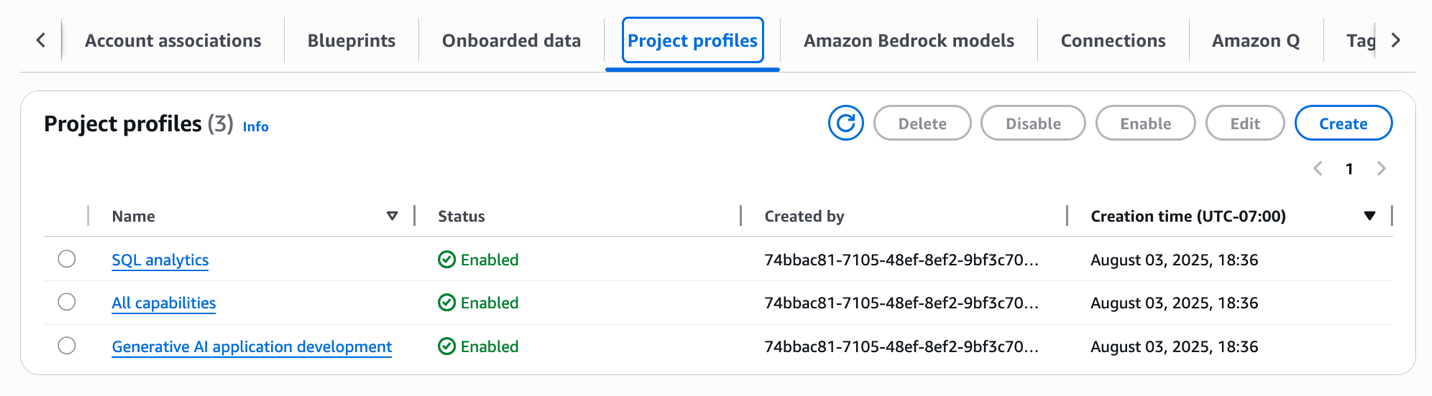
On the Project profiles tab, choose Create.
Enter the project profile name and optional description.
Select Custom create.
Choose the blueprints to be included in the project profile, including the custom blueprint you created in the previous section.
Choose the account and AWS Region to be used.
Choose the authorized users.
Select Enable project profile on creation.
Choose Create project profile.
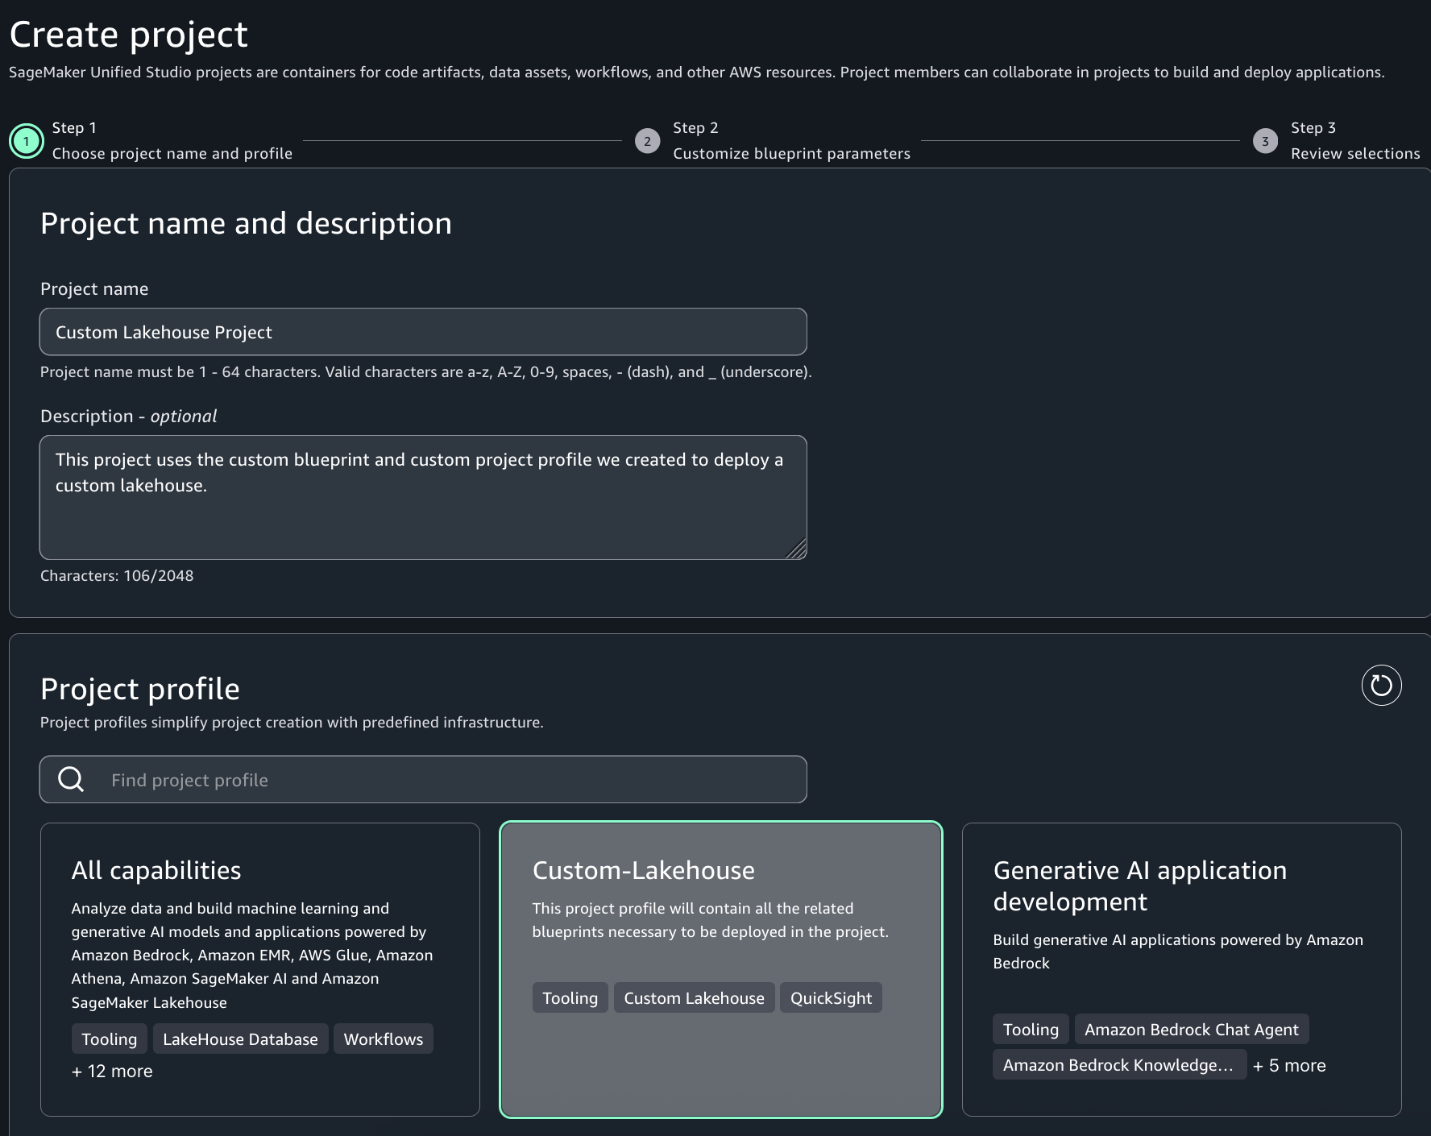
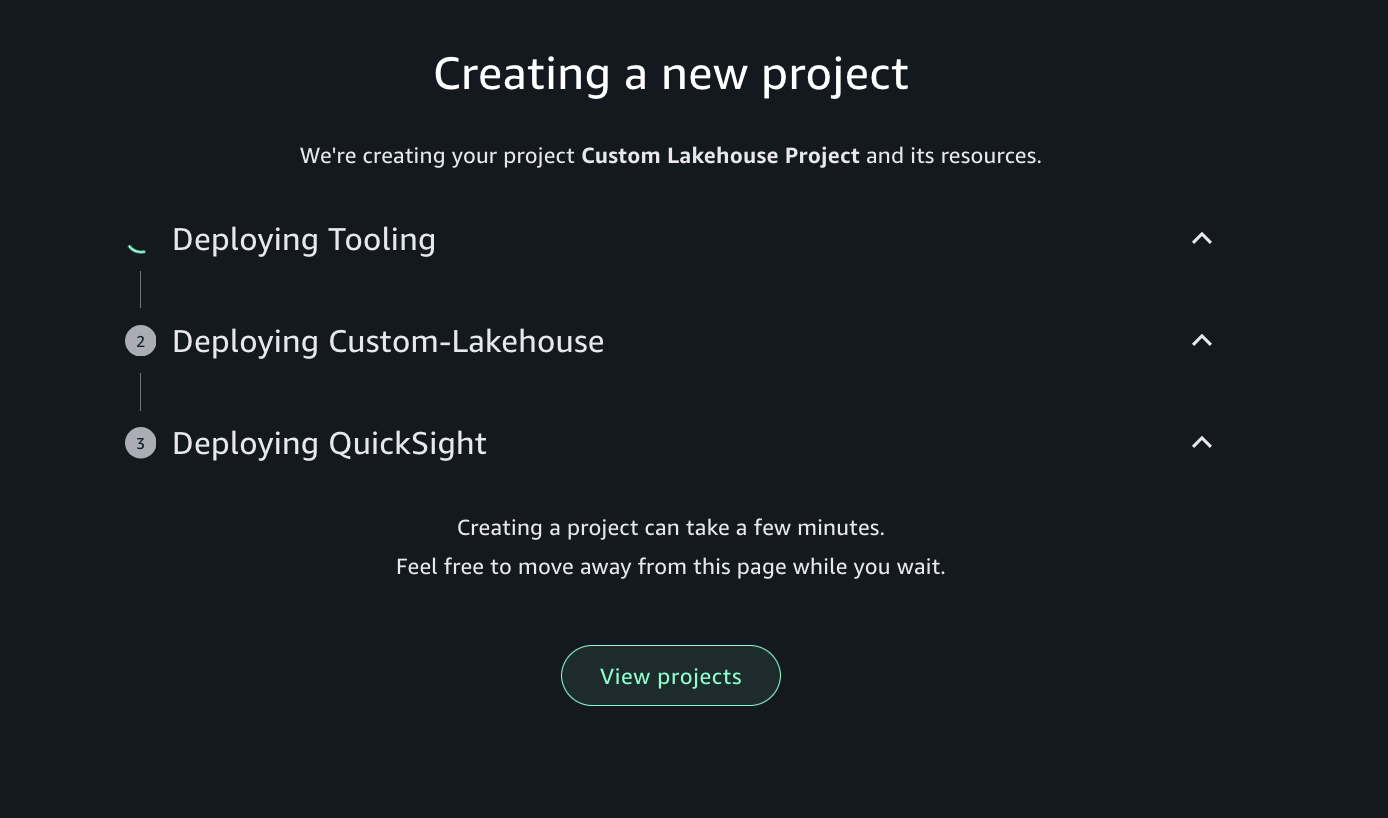
Create project
Complete the following steps to create a new project that is based on the custom project profile and custom blueprint created in the previous sections:
In the SageMaker Unified Studio environment, choose Create project.
Enter a project name and optional description.
For Project profile, choose the profile created in the previous section.
Choose Continue.
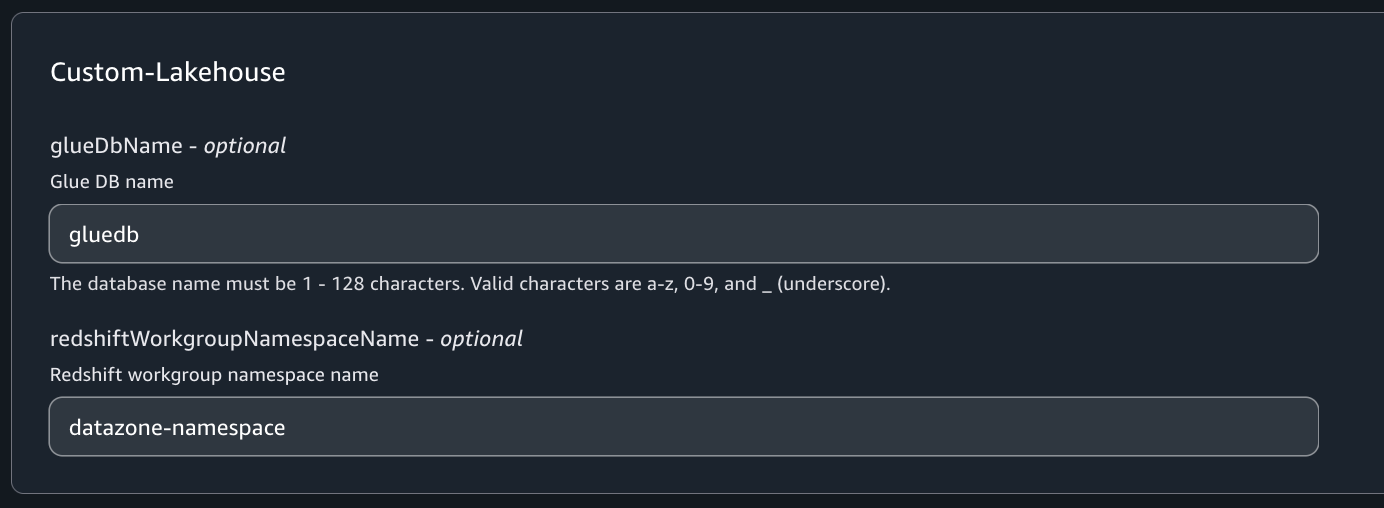
On the Customize blueprint parameters page, review the parameters, modify as necessary, and choose Continue.
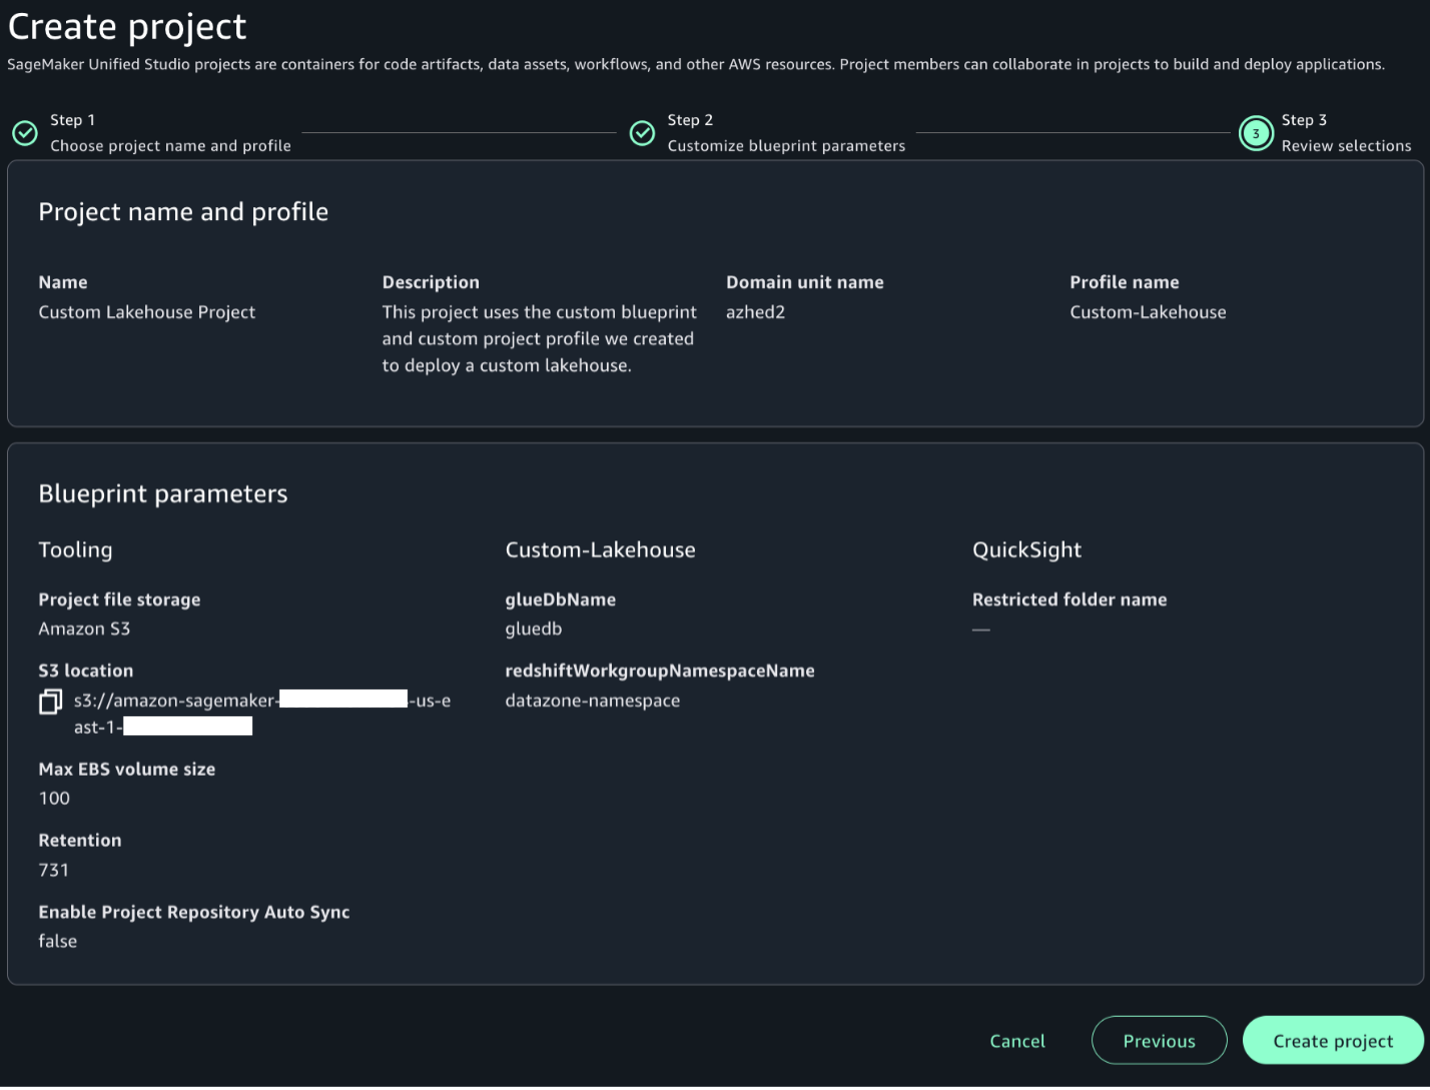
Review your selections and choose Create project.
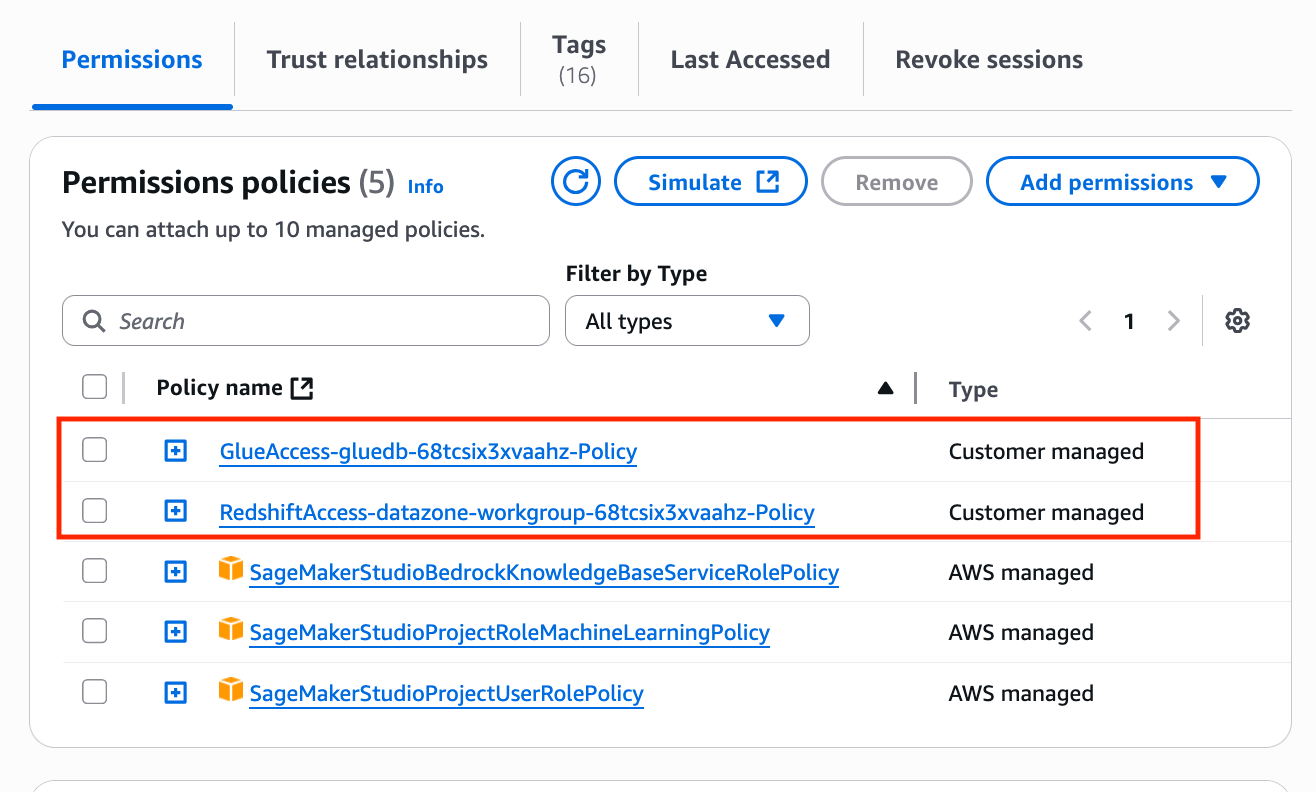
SageMaker Unified Studio will create the project environments with the resources defined in your custom blueprint.
It will also attach the custom IAM policies defined and add them to the project role, as shown in the following screenshot.
Clean up
To avoid incurring additional costs, complete the following steps:
In this post, we discussed custom blueprints, a new option during administrator setup in SageMaker Unified Studio. We showed how to create new custom blueprints and create custom project profiles that include the newly created custom blueprints. We also demonstrated how to create projects that implement custom blueprints.
Custom blueprints in SageMaker Unified Studio are intended to streamline and standardize data, analytics and AI workflows. By helping organizations create templated environments with preconfigured resources, security controls, and best practices, custom blueprints can reduce setup time while providing consistency and compliance across projects.
Organizations can now enforce their specific security standards and access controls at the project level using the ability to incorporate custom IAM policies directly into these blueprints. This granular control over permissions helps organizations create projects that adhere to corporate security policies right from inception. Custom blueprints can help you scale analytics and AI/ML operations securely, by including tooling designed to version control these templates, share them across teams, and automatically apply custom IAM policies.
To learn more about custom blueprints in SageMaker Unified Studio, refer to Custom blueprints.
AWS Network Firewall is a managed firewall service that filters and controls network traffic in Amazon Virtual Private Cloud (Amazon VPC). Unlike traditional network controls such as security groups or network access control lists (NACLs), Network Firewall can inspect and make decisions based on information from higher layers of the OSI model, including the Transport through Application layers. Furthermore, you can use the TLS inspection capability of Network Firewall to create firewall rules that match the content of encrypted TLS traffic. Network Firewall decrypts the traffic using your configured certificate and matches the decrypted payload against the rules in the firewall policy.
This post introduces Server Name Indication (SNI) session holding, which enhances TLS inspection by stopping TCP or TLS establishment packets from reaching the destination server until TLS inspection rules for SNI have been applied. When SNI is enabled, Network Firewall will not initiate an outbound TCP connection to the target until it has received the client hello and matched its domain information sent through SNI against firewall rules. The TCP session between the firewall and the upstream server is only initiated after the firewall validates traffic to that domain. This offers you additional security controls on outbound traffic with minimal latency and performance overheads, helping protect against malicious targets.
Network Firewall TLS inspection prior to SNI session holding
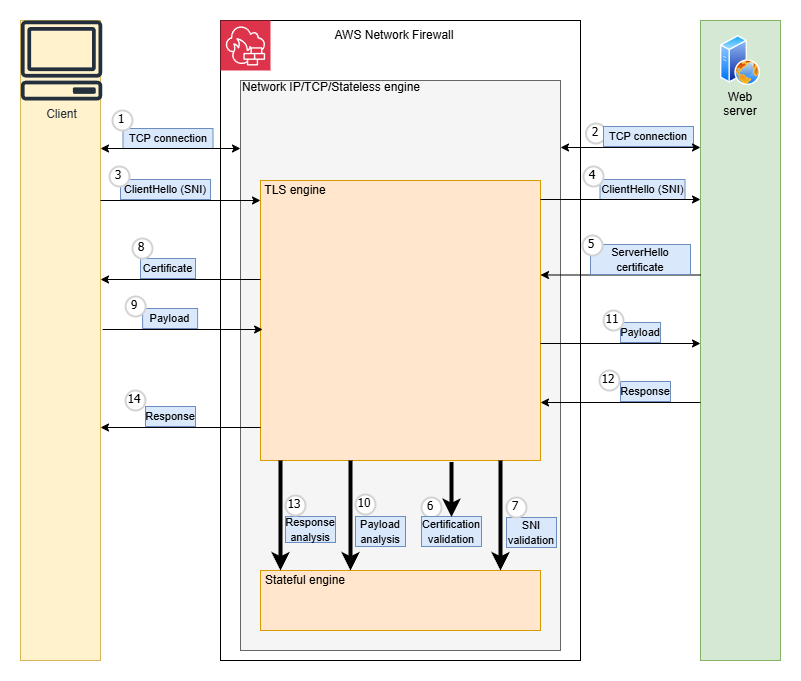
When TLS inspection is enabled, Network Firewall acts as an intermediary between the client and server, maintaining separate connections with each endpoint. Throughout this process, Network Firewall evaluates outbound traffic against configured rules to determine whether the traffic should be allowed to exit the firewall.As shown in Figure 1, the steps prior to availability of SNI session holding were:
The client creates a TCP connection, and Network Firewall evaluates the stateless rules to determine if the traffic is allowed. If not, the connection is terminated.
Network Firewall creates a TCP Connection to the destination server.
The client sends a ClientHello message, including SNI information, to Network Firewall. The firewall validates that the SNI is valid, otherwise the connection is terminated.
Network Firewall forwards the ClientHello message to the destination server.
The destination server responds with a ServerHello message and its certificate.
Network Firewall validates the certificates downloaded from the destination server.
At this point, the server name indication is validated against the certificate subject name.
Network Firewall forwards the server’s certificate to the client and completes the TLS connection with the client.
The client encrypts the application payload using the session keys it negotiated during TLS handshake and sends it to Network Firewall.
Network Firewall decrypts the traffic, uses its stateful engine to evaluate rules against the traffic, and determines if it is allowed.
If traffic is allowed, Network Firewall re-encrypts the application layer payload with the destination server’s session keys and forwards it to the destination server.
The destination server sends back response data to Network Firewall.
The Network Firewall stateful engine analyzes the destination server’s response.
Network Firewall forwards the server response to the client. The communication continues until the client or destination server terminates the connection.
Figure 1: Steps prior to availability of SNI session holding
With the current sequence of traffic inspection, the TCP connection is established before the TLS SNI field is evaluated, which could lead to a server learning about a connection before the firewall inspects the SNI.
For example, when customers configure rules to reject traffic based on TLS SNI fields (such as example.com), they expect these connections to be blocked before opening a connection to the destination server and before data transmission occurs. However, because of the inherent protocol sequence, TCP connections are briefly established before SNI rule validation takes place. This processing order creates a narrow window where sophisticated threat actors could potentially attempt to circumvent data exfiltration prevention controls, even with properly configured SNI-based blocking rules.
Session holding addresses this concern so that the traffic originating from within VPCs cannot connect to destination servers until Network Firewall verifies the TLS SNI.
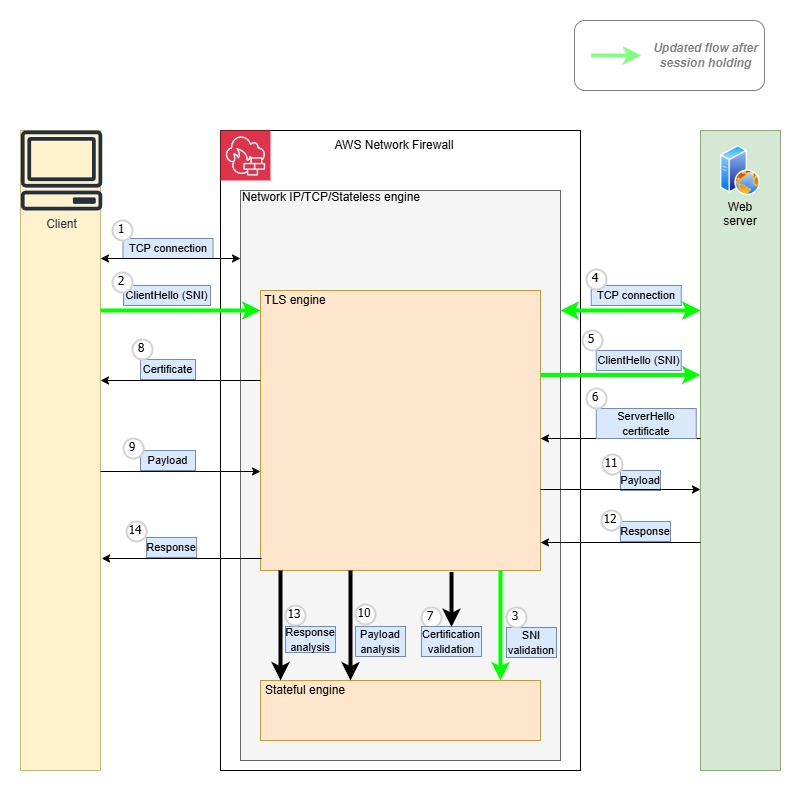
How TLS inspection works with session holding
SNI session holding implements a two-step validation process. First, the firewall examines the TLS layer and validates the SNI when the client sends the TLS client hello message. After the message is approved, Network Firewall allows the connection to the destination server, permitting encrypted upper-layer protocols like HTTP or SMTP to initiate their negotiations. This approach creates a distinct separation between TLS validation and protocol inspection, where protocol examination only occurs after successful TLS handshake authorization.As shown in Figure 2, the steps in this scenario with SNI session holding are:
Note: Steps 2–5 are part of SNI session holding.
The client creates a TCP connection, and Network Firewall evaluates the stateless rules to determine if the traffic is allowed. If not, the connection is terminated.
The Client sends a ClientHello message including SNI information to Network Firewall. Network Firewall performs validation of the SNI.
The firewall evaluates the TLS inspection rules, including the SNI rules, to determine if the traffic is allowed. If not, the connection is terminated.
Network Firewall creates a TCP connection to the destination server.
Network Firewall forwards the ClientHello message to the destination server.
The destination server responds with a ServerHello message and its certificate.
Network Firewall validates the certificates downloaded from the destination server.
Network Firewall forwards the server’s certificate to the client and completes the TLS connection with the client.
The client encrypts the application payload using the session keys it negotiated during TLS handshake and sends it to Network Firewall.
Network Firewall decrypts the traffic, uses its stateful engine to evaluate rules against the traffic, and determines if it is allowed.
If traffic is allowed, Network Firewall re-encrypts the application layer payload with the destination server’s session keys and forwards it to destination server.
The destination server sends back response data to Network Firewall.
Network Firewall stateful engine analyzes the destination server response.
Network Firewall forwards the server response to the client. The communication continues until the client, or the destination server terminates the connection.
To get started setting up a Network Firewall policy with session holding, visit the Network Firewall console or see the AWS Network Firewall Developers Guide. Session holding is supported in AWS Regions where Network Firewall is available today, including the AWS GovCloud (US) Regions and China Regions.
If this is your first time using Network Firewall, make sure to complete the following prerequisites. If you already have a firewall and TLS inspection configuration, you can skip this section.
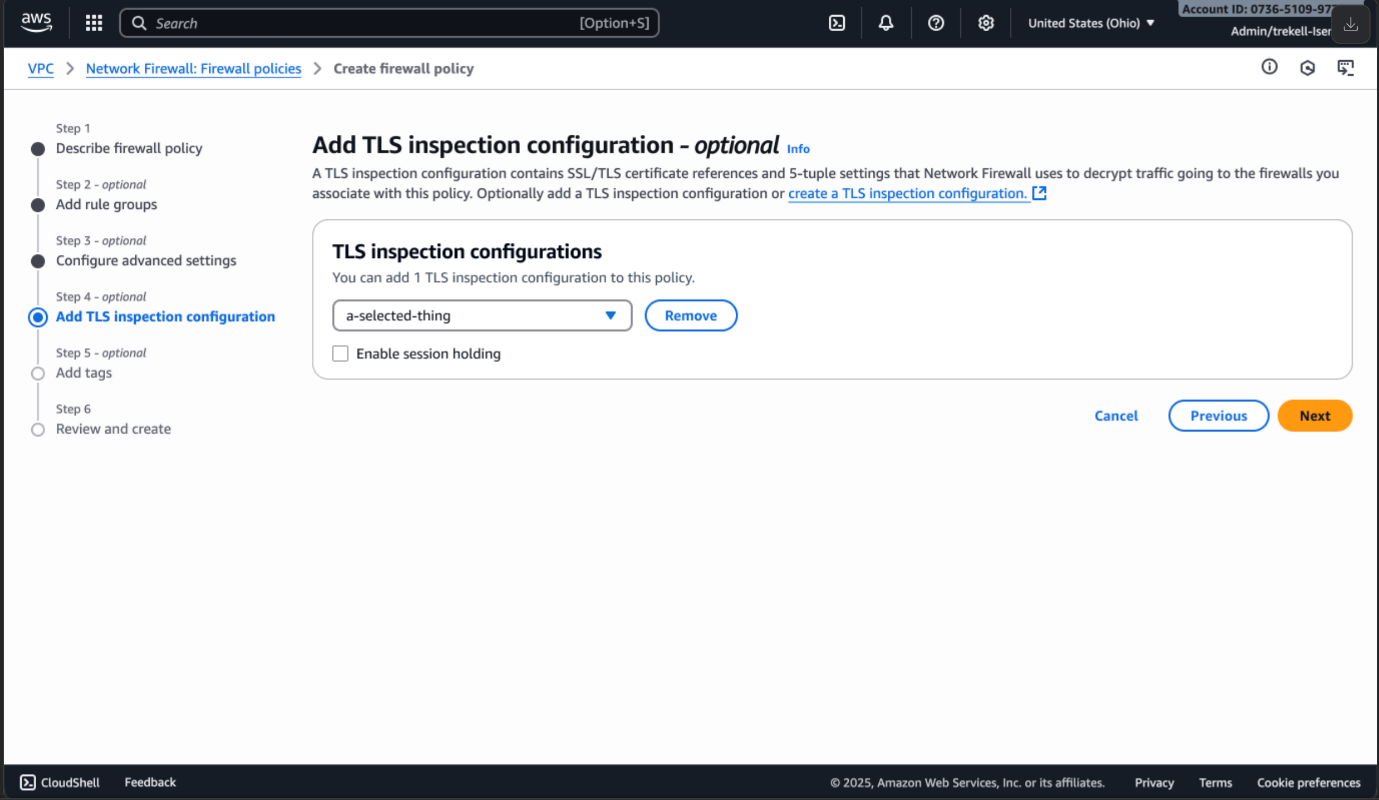
To enable session holding, follow the steps to create a firewall policy. On the step to Add TLS Inspection configuration, you will have an option to enable session holding by selecting the box as shown in Figure 3.
Figure 3: Enable session holding
After adding the TLS inspection configuration and selecting the box to enable session holding, continue to create the new firewall policy and then associate this policy to your firewall.
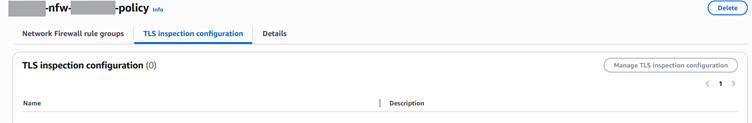
If you have an existing policy that is attached to a TLS inspection configuration, choose Manage TLS Inspection Configuration on your firewall policy.
Figure 4: TLS inspection configuration
This will provide the option to enable session holding as shown in figure 3.
Pricing
SNI session holding is included in the cost of TLS advanced inspection. For TLS advanced inspection pricing, see AWS Network Firewall pricing.
Considerations
When enabling the session holding, note the following considerations:
Keywords: Session holding is only applicable to Suricata rules using the TLS.SNI keyword. It does not apply to rules using other TLS application keywords, such as TLS.CERT or TLS.VERSION.
Performance: Because TCP connection establishment packets are held until the SNI validation is complete, session holding might introduce latency in the TCP connection establishment. You’ll notice the impact only when there is a surge in new TCP connections being inspected by Network Firewall with TLS inspection enabled.
Compatibility: TLS.SNI takes priority over http.host rules when session holding is enabled. When disabled, the traffic can match rules based on the http.host keyword and tls.sni keyword simultaneously, resulting in an outcome defined by the combination of the actions in these two types of rules. However, when this session holding is enabled, this traffic can only match the rule with TLS.SNI keyword and the rule with http.host keyword is applied only when the decrypted traffic has not matched other TLS.SNI-based pass rules.
Conclusion
As a preventive measure, this session holding helps make sure that SNI validation happens before a connection is established with the destination server, avoiding even initial contact with potentially malicious endpoints. For more information, see What is AWS Network Firewall?
If you have feedback about this post, submit comments in the Comments section below.
As modern data architectures expand, Apache Iceberg has become a widely popular open table format, providing ACID transactions, time travel, and schema evolution. In table format v2, Iceberg introduced merge-on-read, improving delete and update handling through positional delete files. These files improve write performance but can slow down reads when not compacted, since Iceberg must merge them during query execution to return the latest snapshot. Iceberg v3 enhances merge performance during reads by replacing positional delete files with deletion vectors for handling row-level deletes in Merge-on-Read (MoR) tables. This change deprecates the use of positional delete files in v3, which marked specific row positions as deleted, in favor of the more efficient deletion vectors.
In this post, we compare and evaluate the performance of the new binary deletion vectors in Iceberg v3 with respect to traditional position delete files of Iceberg v2 using Amazon EMR version 7.10.0 with Apache Spark 3.5.5. We provide insights into the practical impacts of these advanced row-level delete mechanisms on data management efficiency and performance.
Understanding binary deletion vectors and Puffin files
Binary deletion vectors stored in Puffin files use compressed bitmaps to efficiently represent which rows have been deleted within a data file. In contrast, previous Iceberg versions (v2) relied on positional delete files—Parquet files that enumerated rows to delete by file and position. This older approach resulted in many small delete files, which placed a heavy burden on query engines due to numerous file reads and costly in-memory conversions. Puffin files reduce this overhead by compactly encoding deletions, improving query performance and resource utilization.
Iceberg v3 improves this in the following aspects:
Reduced I/O – Fewer small delete files lower metadata overhead by introducing deletion vectors—compressed bitmaps that efficiently represent deleted rows. These vectors are stored persistently in Puffin files, a compact binary format optimized for low-latency access.
Query performance – Bitmap-based deletion vectors enable faster scan filtering by allowing multiple vectors to be stored in a single Puffin file. This reduces metadata and file count overhead while preserving file-level granularity for efficient reads. The design supports continuous merging of deletion vectors, promoting ongoing compaction that maintains stable query performance and reduces fragmentation over time. It removes the trade-off between partition-level and file-level delete granularity seen in v2, enabling consistently fast reads even in heavy-update scenarios.
Storage efficiency – Iceberg v3 uses a compressed binary format instead of verbose Parquet positioning. Engines maintain a single deletion vector per data file at write time, enabling better compaction and consistent query performance.
Solution overview
To explore the performance characteristics of delete operations in Iceberg v2 and v3, we use PySpark to run our comparison tests focusing on delete operation runtime and delete file size. This implementation helps us effectively benchmark and compare the deletion mechanisms between Iceberg v2’s position-delete files using Parquet and v3’s newer Puffin-based deletion vectors.
Our solution demonstrates how to configure Spark with the AWS Glue Data Catalog and Iceberg, create tables, and run delete operations programmatically. We first create Iceberg tables with format versions 2 and 3, insert 10,000 rows, then perform delete operations on a range of record IDs. We also perform table compaction and then measure delete operation runtime and size and count of associated delete files.
In Iceberg v3, deleting rows introduces binary deletion vectors stored in Puffin files (compact binary sidecar files). These allow more efficient query planning and faster read performance by consolidating deletes and avoiding large numbers of small files.
For this test, the Spark job was submitted by SSH’ing into the EMR cluster and using spark-submit directly from the shell, with the required Iceberg JAR file being referenced directly from the Amazon Simple Storage Service (Amazon S3) bucket in the submission command. When running the job, make sure you provide your S3 bucket name. See the following code:
The upcoming Amazon EMR 7.11 will ship with Iceberg 1.9.1-amzn-1, which includes deletion vector improvements such as v2 to v3 rewrites and dangling deletion vector detection. This means you no longer need to manually download or upload the Iceberg JAR file, because it will be included and managed natively by Amazon EMR.
Code walkthrough
The following PySpark script demonstrates how to create, write, compact, and delete records in Iceberg tables with two different format versions (v2 and v3) using the Glue Data Catalog as the metastore. The main goal is to compare both write and read performance, along with storage characteristics (delete file format and size) between Iceberg format versions 2 and 3.
The code performs the following functions:
Creates a SparkSession configured to use Iceberg with Glue Data Catalog integration.
Creates a synthetic dataset simulating user records:
Uses a fixed random seed (42) to provide consistent data generation
Creates identical datasets for both v2 and v3 tables for fair comparison
Defines the function test_read_performance(table_name) to perform the following actions:
Measure full table scan performance
Measure filtered read performance (with WHERE clause)
Track record counts for both operations
Defines the function test_iceberg_table(version, test_df) to perform the following actions:
Create or use an Iceberg table for the specified format version
Append data to the Iceberg table
Trigger Iceberg’s data compaction using a system procedure
Delete rows with IDs between 1000–1099
Collect statistics about inserted data files and delete-related files
Measure and record read performance metrics
Track operation timing for inserts, deletes, and reads
Defines a function to print a comprehensive comparative report including the following information:
Create a single dataset to ensure identical data for both versions
Clean up existing tables for fresh testing
Run tests for Iceberg format version 2 and version 3
Output a detailed comparison report
Handle exceptions and shut down the Spark session
See the following code:
from pyspark.sql import SparkSession
from pyspark.sql.types import StructType, StructField, IntegerType, StringType
from pyspark.sql import functions as F
import time
import random
import logging
from pyspark.sql.utils import AnalysisException
# Logging
logging.basicConfig(level=logging.INFO, format='%(message)s')
logger = logging.getLogger(__name__)
# Constants
ROWS_COUNT = 10000
DELETE_RANGE_START = 1000
DELETE_RANGE_END = 1099
SAMPLE_NAMES = ["Alice", "Bob", "Charlie", "Diana",
                "Eve", "Frank", "Grace", "Henry", "Ivy", "Jack"]
# Spark Session
spark = (
    SparkSession.builder
    .appName("IcebergWithGlueCatalog")
    .config("spark.sql.extensions", "org.apache.iceberg.spark.extensions.IcebergSparkSessionExtensions")
    .config("spark.sql.catalog.glue_catalog", "org.apache.iceberg.spark.SparkCatalog")
    .config("spark.sql.catalog.glue_catalog.catalog-impl", "org.apache.iceberg.aws.glue.GlueCatalog")
    .config("spark.sql.catalog.glue_catalog.warehouse", "s3://<S3-BUCKET-NAME>/blog/glue/")
    .config("spark.sql.catalog.glue_catalog.io-impl", "org.apache.iceberg.aws.s3.S3FileIO")
    .getOrCreate()
)
spark.sql("CREATE DATABASE IF NOT EXISTS glue_catalog.blog")
def create_dataset(num_rows=ROWS_COUNT):
    # Set a fixed seed for reproducibility
    random.seed(42)

    data = [(i,
             random.choice(SAMPLE_NAMES) + str(i),
             random.randint(18, 80))
            for i in range(1, num_rows + 1)]
    schema = StructType([
        StructField("id", IntegerType(), False),
        StructField("name", StringType(), True),
        StructField("age", IntegerType(), True)
    ])
    df = spark.createDataFrame(data, schema)
    df = df.withColumn("created_at", F.current_timestamp())
    return df
def test_read_performance(table_name):
    """Test read performance of the table"""
    start_time = time.time()
    count = spark.sql(f"SELECT COUNT(*) FROM glue_catalog.blog.{table_name}").collect()[0][0]
    read_time = time.time() - start_time

    # Test filtered read performance
    start_time = time.time()
    filtered_count = spark.sql(f"""
        SELECT COUNT(*)
        FROM glue_catalog.blog.{table_name}
        WHERE age > 30
    """).collect()[0][0]
    filtered_read_time = time.time() - start_time

    return read_time, filtered_read_time, count, filtered_count
def test_iceberg_table(version, test_df):
    try:
        table_name = f"iceberg_table_v{version}"
        logger.info(f"\n=== TESTING ICEBERG V{version} ===")
        spark.sql(f"""
            CREATE TABLE IF NOT EXISTS glue_catalog.blog.{table_name} (
                id int,
                name string,
                age int,
                created_at timestamp
            ) USING iceberg
            TBLPROPERTIES (
                'format-version'='{version}',
                'write.delete.mode'='merge-on-read'
            )
        """)
        start_time = time.time()
        test_df.writeTo(f"glue_catalog.blog.{table_name}").append()
        insert_time = time.time() - start_time
        logger.info("Compaction...")
        spark.sql(
            f"CALL glue_catalog.system.rewrite_data_files('glue_catalog.blog.{table_name}')")
        start_time = time.time()
        spark.sql(f"""
            DELETE FROM glue_catalog.blog.{table_name}
            WHERE id BETWEEN {DELETE_RANGE_START} AND {DELETE_RANGE_END}
        """)
        delete_time = time.time() - start_time
        files_df = spark.sql(
            f"SELECT COUNT(*) as data_files FROM glue_catalog.blog.{table_name}.files")
        delete_files_df = spark.sql(f"""
            SELECT COUNT(*) as delete_files,
                   file_format,
                   SUM(file_size_in_bytes) as total_size
            FROM glue_catalog.blog.{table_name}.delete_files
            GROUP BY file_format
        """)
        data_files = files_df.collect()[0]['data_files']
        delete_stats = delete_files_df.collect()
        # Add read performance testing
        logger.info("\nTesting read performance...")
        read_time, filtered_read_time, total_count, filtered_count = test_read_performance(table_name)

        logger.info(f"Insert time: {insert_time:.3f}s")
        logger.info(f"Delete time: {delete_time:.3f}s")
        logger.info(f"Full table read time: {read_time:.3f}s")
        logger.info(f"Filtered read time: {filtered_read_time:.3f}s")
        logger.info(f"Data files: {data_files}")
        logger.info(f"Total records: {total_count}")
        logger.info(f"Filtered records: {filtered_count}")
        if len(delete_stats) > 0:
            stats = delete_stats[0]
            logger.info(f"Delete files: {stats.delete_files}")
            logger.info(f"Delete format: {stats.file_format}")
            logger.info(f"Delete files size: {stats.total_size} bytes")
            return delete_time, stats.total_size, stats.file_format, read_time, filtered_read_time
        else:
            logger.info("No delete files found")
            return delete_time, 0, "N/A", read_time, filtered_read_time
    except AnalysisException as e:
        logger.error(f"SQL Error: {str(e)}")
        raise
    except Exception as e:
        logger.error(f"Error: {str(e)}")
        raise
def print_comparison_results(v2_results, v3_results):
    v2_delete_time, v2_size, v2_format, v2_read_time, v2_filtered_read_time = v2_results
    v3_delete_time, v3_size, v3_format, v3_read_time, v3_filtered_read_time = v3_results
    logger.info("\n=== PERFORMANCE COMPARISON ===")
    logger.info(f"v2 delete time: {v2_delete_time:.3f}s")
    logger.info(f"v3 delete time: {v3_delete_time:.3f}s")
    if v2_delete_time > 0:
        improvement = ((v2_delete_time - v3_delete_time) / v2_delete_time) * 100
        logger.info(f"v3 Delete performance improvement: {improvement:.1f}%")
    logger.info("\n=== READ PERFORMANCE COMPARISON ===")
    logger.info(f"v2 full table read time: {v2_read_time:.3f}s")
    logger.info(f"v3 full table read time: {v3_read_time:.3f}s")
    logger.info(f"v2 filtered read time: {v2_filtered_read_time:.3f}s")
    logger.info(f"v3 filtered read time: {v3_filtered_read_time:.3f}s")

    if v2_read_time > 0:
        read_improvement = ((v2_read_time - v3_read_time) / v2_read_time) * 100
        logger.info(f"v3 Read performance improvement: {read_improvement:.1f}%")

    if v2_filtered_read_time > 0:
        filtered_improvement = ((v2_filtered_read_time - v3_filtered_read_time) / v2_filtered_read_time) * 100
        logger.info(f"v3 Filtered read performance improvement: {filtered_improvement:.1f}%")
    logger.info("\n=== DELETE FILE COMPARISON ===")
    logger.info(f"v2 delete format: {v2_format}")
    logger.info(f"v2 delete size: {v2_size} bytes")
    logger.info(f"v3 delete format: {v3_format}")
    logger.info(f"v3 delete size: {v3_size} bytes")
    if v2_size > 0:
        size_reduction = ((v2_size - v3_size) / v2_size) * 100
        logger.info(f"v3 size reduction: {size_reduction:.1f}%")
# Main
try:
    # Create dataset once and reuse for both versions
    test_dataset = create_dataset()

    # Drop existing tables if they exist
    spark.sql("DROP TABLE IF EXISTS glue_catalog.blog.iceberg_table_v2")
    spark.sql("DROP TABLE IF EXISTS glue_catalog.blog.iceberg_table_v3")

    # Test both versions with the same dataset
    v2_results = test_iceberg_table(2, test_dataset)
    v3_results = test_iceberg_table(3, test_dataset)
    print_comparison_results(v2_results, v3_results)
finally:
    spark.stop()
Results summary
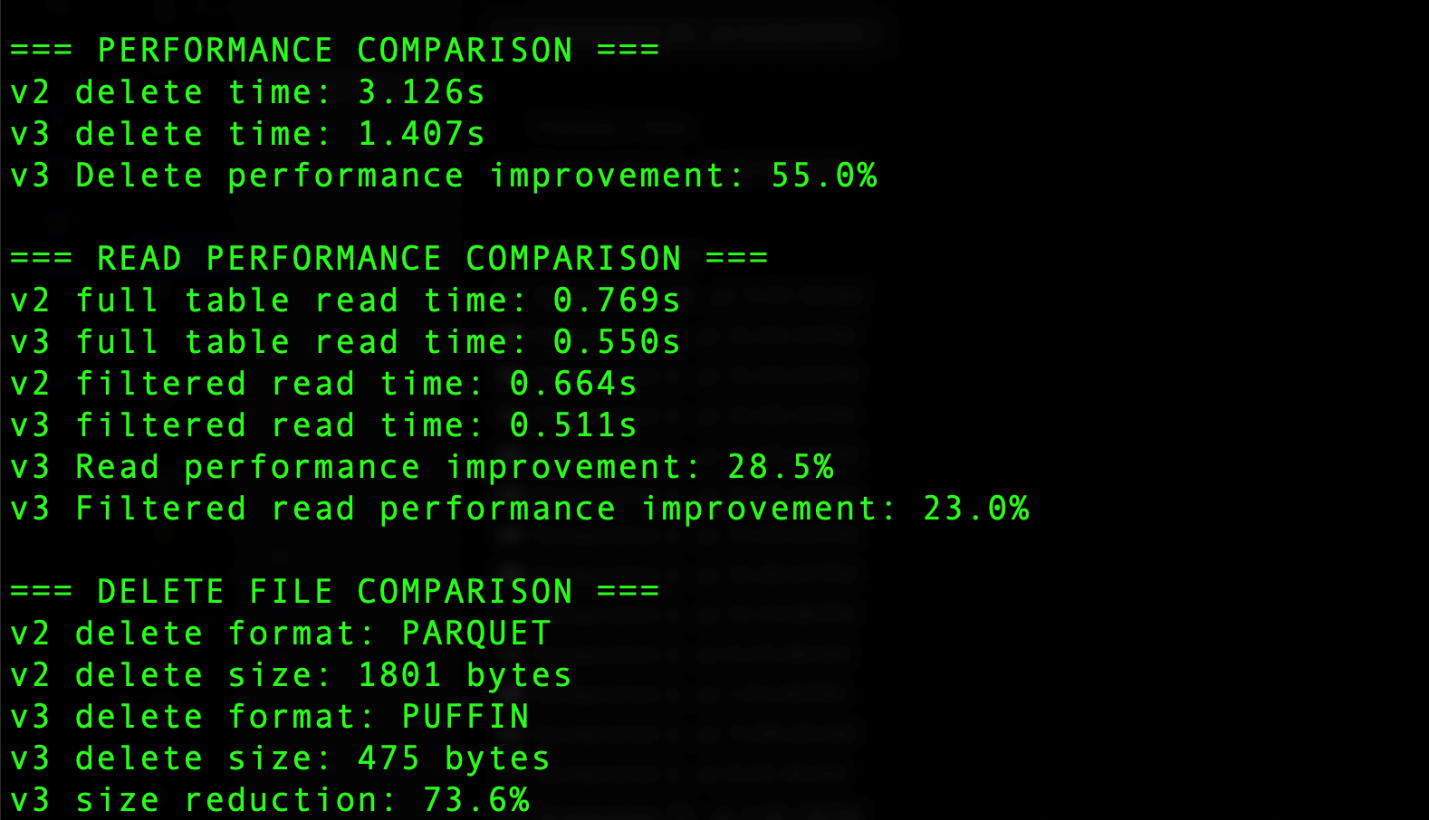
The output generated by the code includes the results summary section that shows several key comparisons, as shown in the following screenshot. For delete operations, Iceberg v3 uses the Puffin file format compared to Parquet in v2, resulting in significant improvements. The delete operation time decreased from 3.126 seconds in v2 to 1.407 seconds in v3, achieving a 55.0% performance improvement. Additionally, the delete file size was reduced from 1801 bytes using Parquet in v2 to 475 bytes using Puffin in v3, representing a 73.6% reduction in storage overhead. Read operations also saw notable improvements, with full table reads 28.5% faster and filtered reads 23% faster in v3. These improvements demonstrate the efficiency gains from v3’s implementation of binary deletion vectors through the Puffin format.
The actual measured performance and storage improvements depend on workload and environment and might differ from the preceding example.
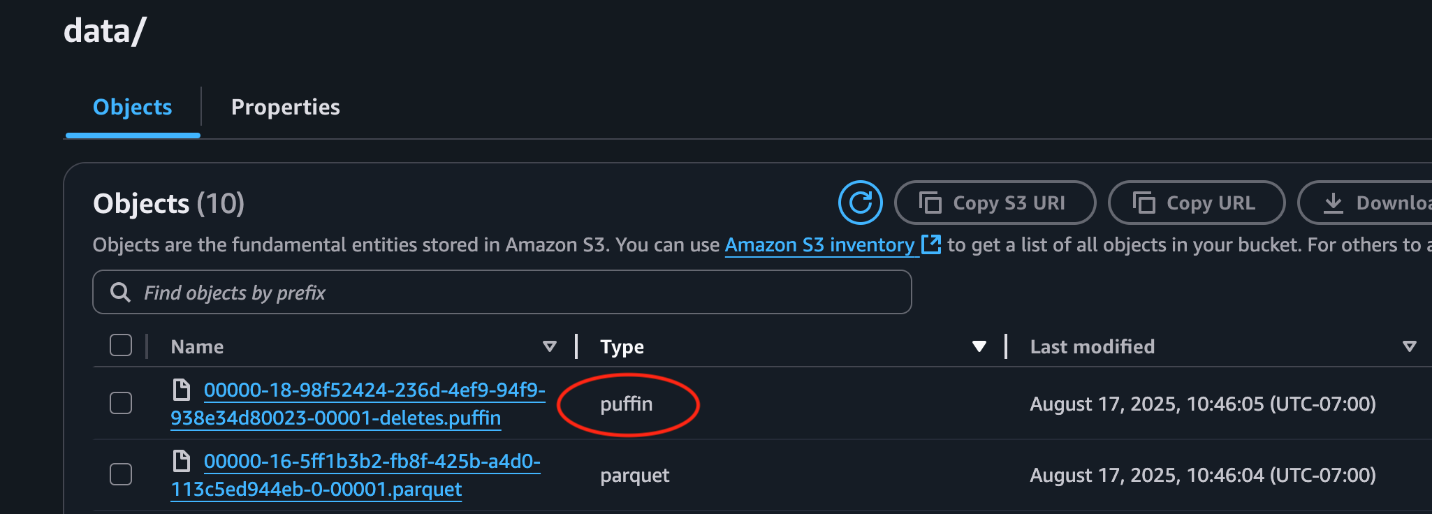
This following screenshot from the S3 bucket demonstrates a Puffin delete file stored alongside data files.
Clean up
After you finish your tests, it’s important to clean up your environment to avoid unnecessary costs:
Drop the test tables you created to remove associated data from your S3 bucket and prevent ongoing storage charges.
Delete any temporary data left in the S3 bucket used for Iceberg data.
Delete the EMR cluster to stop billing for running compute resources.
Cleaning up resources promptly helps maintain cost-efficiency and resource hygiene in your AWS environment.
Considerations
Iceberg features are introduced through a phased process: first in the specification, then in the core library, and finally in engine implementations. Deletion vector support is currently available in the specification and core library, with Spark being the only supported engine. We validated this capability on Amazon EMR 7.10 with Spark 3.5.5.
Conclusion
Iceberg v3 introduces a significant advancement in managing row-level deletes for merge-on-read operations through binary deletion vectors stored in compact Puffin files. Our performance tests, conducted with Iceberg 1.9.2 on Amazon EMR 7.10.0 and EMR Spark 3.5.5, show clear improvements in both delete operation speed and read performance, along with a considerable reduction in delete file storage compared to Iceberg v2’s positional delete Parquet files. For more information about deletion vectors, refer to Iceberg v3 deletion vectors.
Measuring and improving performance on the Internet can be a daunting task because it spans multiple layers: from the user’s device and browser, to DNS lookups and the network routes, to edge configurations and origin server location. Each layer introduces its own variability such as last-mile bandwidth constraints, third-party scripts, or limited CPU resources, that are often invisible unless you have robust observability tooling in place. Even if you gather data from most of these Internet hops, performance engineers still need to correlate different metrics like front-end events, network processing times, and server-side logs in order to pinpoint where and why elusive “latency” occurs to understand how to fix it.
We want to solve this problem by providing a powerful, in-depth monitoring solution that helps you debug and optimize applications, so you can understand and trace performance issues across the Internet, end to end.
That’s why we’re excited to announce the start of a major upgrade to Cloudflare’s performance analytics suite: Web Analytics as part of our real user monitoring (RUM) tools will soon be combined with network-level insights to help you pinpoint performance issues anywhere on a packet’s journey — from a visitor’s browser, through Cloudflare’s network, to your origin.
Some popular web performance monitoring tools have also sacrificed user privacy in order to achieve depth of visibility. We’re also going to remove that tradeoff. By correlating client-side metrics (like Core Web Vitals) with detailed network and origin data, developers can see where slowdowns occur — and why — all while preserving end user privacy (by dropping client-specific information and aggregating data by visits as explained in greater detail below).
Over the next several months we’ll share:
How Web Analytics work
Real-world debugging examples from across the Internet
Tips to get the most value from Cloudflare’s analytics tools
The journey starts on October 15, 2025, when Cloudflare will enable Web Analyticsfor all free domains by default — helping you see how your site actually performs for visitors around the world in real time, without ever collecting any personal data (not applicable to traffic originating from the EU or UK, see below). By the middle of 2026, we’ll deliver something nobody has ever had before: a comprehensive, privacy-first platform for performance monitoring and debugging. Unlike many other tools, this platform won’t just show you where latency lives, it will help you fix it, all in one place. From untangling the trickiest bottlenecks, to getting a crystal-clear view of global performance, this new tool will change how you see your web application and experiment with new performance features. And we’re not building it behind closed doors, we want to bring you along as we launch it in public. Follow along in this series, The RUM Diaries, as we share the journey.
Why this matters
Performance monitoring is only as good as the detail you can see — and the trust your users have that while you’re watching traffic performance, you aren’t watching them. As we explain below, by combining real user metrics with deep, in-network instrumentation, we’ll give developers the visibility to debug any layer of the stack while maintaining Cloudflare’s zero-compromise stance on privacy.
What problem are we solving?
Many performance monitoring solutions provide only a narrow slice of the performance layer cake, focusing on either the client or the origin while lumping everything in between under a vague “processing time” due to lack of visibility. But as web applications get more complex and user expectations continue to rise, traditional analytics alone don’t cut it. Knowing what happened is just the tip of the iceberg; modern teams need to understand why a bottleneck occurred and how network conditions, code changes, or even a single external script can degrade load times. Moreover, often the tools available can only observe performance rather than helping to optimize it, which leaves teams unable to understand what to try to move the needle on latency.
We want to pull back the curtain so you can understand performance implications of the services you use on our platform and how you can make sure you’re getting the best performance possible.
Consider Shannon in Detroit, Michigan. She operates an e-commerce site selling hard-to-find watches to horology enthusiasts around the globe. Shannon knows that her customers are impatient (she pictures them frequently checking their wrists). If her site loads slowly, she loses sales, her SEO drops, and her customers go to a different store where they have a better online shopping experience.
As a result, Shannon continually monitors her site performance, but she frequently runs into problems trying to understand how her site is experienced by customers in different parts of the world. After updating her site, she frequently spot checks its performance using her browser on her office wifi in Detroit, but she continually hears complaints about slow load from her customers in Germany. So Shannon shops around for a solution that monitors performance around the globe.
This off-the-shelf performance monitoring solution offers her the ability to run similar tests from virtual machines situated around the world across various desktops, mobile devices, and even ISPs, close to her customers. Shannon receives data from these tests, ranging from how fast these synthetic clients’ DNS resolved, how quickly they connected to a particular server, and even when a response was on its way back to a client. Thankfully for Shannon, the off-the-shelf performance monitoring solution identified “server processing time” as the latency culprit in Germany. However, she can’t help but wonder, is it my server that is slow or the transit connection of my users in Germany? Can I make my site faster by adding another server in Germany, or updating my CDN configuration? It’s a three option head-scratcher: is it a networking problem, a server problem, or something else?
Cloudflare can help Shannon (and others!) because we sit in a unique place to provide richer performance analytics. As a reverse proxy positioned between the client and the origin, we are often the first web server a user connects to when requesting content. In addition to moving what’s important closer to your customers, our product suite can generate responses at our edge (e.g. Workers), steer traffic through our dedicated backbone (e.g. cloudflared and more), and route around Internet traffic jams (e.g. Argo). By tailoring a solution that brings together:
client performance data,
real-time network metrics,
customer configuration settings, and
origin performance measurements
we can provide more insightful information about what’s happening in the vague “processing time.” This will allow developers like Shannon to understand what they should tweak to make their site more performant, build her business and her customers happier.
What is Web Analytics?
Turning back to what’s happening on October 15, 2025: We’re enabling Web Analytics so teams can track down performance bottlenecks. Web Analytics works by adding a lightweight JavaScript snippet to your website, which helps monitor performance metrics from visitors to your site. In the Web Analytics dashboard you can see aggregate performance data related to: how a browser has painted the page (via LCP, INP, and CLS), general load time metrics associated with server processing, as well as aggregate counts of visitors.
If you’ve ever popped open DevTools in your browser and stared at the waterfall chart of a slow-loading page, you’ve had a taste of what Web Analytics is doing, except instead of measuring your load times from your laptop, it’s measuring it directly from the browsers of real visitors.
Here’s the high-level architecture:
A lightweight beacon in the browser Every page that you track with Cloudflare’s Web Analytics includes a tiny JavaScript snippet, optimized to load asynchronously so it won’t block rendering.
This snippet hooks into modern browser APIs like the Performance API, Resource Timing, etc
This is how Cloudflare collects Core Web Vital metrics like Largest Contentful Paint and Interaction to Next Paint, plus data about resource load times, TLS handshake duration from the perspective of the client.
Aggregation at the edge When the browser sends performance data, it goes to the nearest Cloudflare data center. Instead of pushing raw events straight to a database, we pre-process at the edge. This reduces storage needs, minimizes latency, and removes personal information like IP addresses. After this pre-processing, it is sent to a core datacenter to be processed and queried by users.
Web Analytics sits under the Analytics & Logs section of the dashboard (at both the account and domain level of the dashboard). Starting on October 15, 2025, free domains will begin to see Web Analytics enabled by default and will be able to view the performance of their visitors in their dashboard. Pro, Biz and ENT accounts can enable Web Analytics by selecting the hostname of the website to add the snippet to and selecting Automatic Setup. Alternatively, you can manually paste the JavaScript beacon before the closing </body> tag on any HTML page you’d like to track from your origin. Just select “manage site” from the Web Analytics tab in the dashboard.
Once enabled, the JS snippet works with visitors’ browsers to measure how the user experienced page load times and reports on critical client-side metrics. Below these metrics are resource attribution tables that help users understand which assets are taking the most time per metrics to load so that users can better optimize their site performance.
What does privacy-first mean?
From the beginning, our Web Analytics tools have centered on providing insights without compromising privacy. Being privacy-first means we don’t track individual users for analytics. We don’t use any client-side state (like cookies or localStorage) for analytics purposes, and we don’t track users over time by IP address, User Agent, or any other fingerprinting technique.
Moreover, when enabling Web Analytics, you can choose to drop requests from European and UK visitors if you so desire (listed here specifically), meaning we will not collect any RUM metrics from traffic that passes through our European and UK data centers. The version of Web Analytics that will be enabled by default excludes data from EU visitors (this can be changed in the dashboard if you want).
The concept of a visit is key to our privacy approach. Rather than count unique IP addresses (requiring storing state about each visitor), we simply count page views that originate from a distinct referral or navigation event, avoiding the need to store information that might be considered personal data. We believe this same concept that we’ve used for years in providing our privacy-first Web Analytics can be logically extended to network and origin metrics. This will allow customers to gain the insights they need to debug and solve performance issues while ensuring they are not collecting unneeded data on visitors.
Opting-out
We built our Web Analytics service to give you the insights you need to run your website, all while maintaining a privacy-first approach. However, if you do want to opt-out, here are the steps to do so.
Via Dashboard
If you have a free domain and do not want Web Analytics automatically enabled for your zone you should do the following before October 15, 2025:
Navigate to the zone in the Cloudflare dashboard
In the list on the left of the screen, navigate to Web Analytics
On the next page, select either `Enable Globally` or `Exclude EU` to activate the feature
Once Web Analytics has been activated, navigate to `Manage RUM Settings` in the Web Analytics dashboard
Then, on the next page, select `Disable` to disable Web Analytics for the zone
OR, to remove Web Analytics from the zone entirely, delete the configs by clicking Advanced Options and then Delete
Once you have disabled the product once, we will not re-enable it again. You can choose to enable it whenever you want, however.
Via API
Create a Web Analytics configuration with the following API call:
Today, Web Analytics gives you visibility into how people experience your site in the browser. Next, we’re expanding that lens to show what’s happening across the entire request path, from the click in a user’s browser, through Cloudflare’s global network, to your origin servers, and back.
Here’s what’s coming:
Correlating Across Layers We’ll match RUM data from the client with network timing, Cloudflare edge processing, and origin response latency, allowing you to pinpoint whether a spike in TTFB comes from a slow script, a cache miss, or an origin bottleneck.
Proactive Alerting Configurable alerts will tell you when performance regresses in specific geographies, when a data center underperforms, or when origin latency spikes.
Actionable Insights We’ll go beyond “processing time” as a single number, breaking it into the real-world steps that make up the journey: proxy routing, security checks, cache lookups, origin fetches, and more.
Unified View All of this will live in one place (your Cloudflare dashboard) alongside your analytics, logs, firewall events, and configuration settings, so you can see cause and effect in one workflow.
Conclusion
Stay tuned as we work alongside you, in public, to build the most comprehensive, privacy-focused performance analytics platform. Together, we will illuminate every corner of the request journey so you can optimize, innovate, and deliver the best experiences to your users, every time.
The next chapters of this journey will unlock proactive alerts, cross-layer correlation, and actionable insights you can’t get anywhere else. Follow along as the RUM Diaries are just getting started.
I joined Amazon Web Services (AWS) as a principal security engineer 3 years ago and my first project was leading security for PL/Rust on Amazon Relational Database Service (Amazon RDS). This is an extension that lets you write custom functions for PostgreSQL in Rust, which are then compiled to native machine code. These functions can be quite performant and offer a lot of advantages to customers.
From my perspective as a security engineer, “compiled to native machine code” was a flashing neon sign that said, “Start work here” with a big arrow pointing to the Rust toolchain and that’s exactly where I dove in.
The pieces of the system
postgrestd is the Rust standard library at the heart of PL/Rust. The design of this library includes prevention for database escapes. However, at the time, it was fairly new and hadn’t yet been hardened to the realities of production environments at scale. Adding to the challenge, PL/Rust compiles extensions on the database instance itself. This requires a full toolchain to be available locally.
If the extension has a full toolchain available, the potential risk increases. Poorly constructed extensions can cause issues for the database or the host instances. Attackers can use a variety of techniques to try to get around the security controls put in place or break the write xor execute (W^X) model for the container.To support PL/Rust and provide this functionality to customers safely, we needed to add a series of mitigations to address these new risks.
Challenging our approach
Behind the scenes in AWS, we obsess over how we operate our systems. We focus on automation and resilience to help make sure that we meet our commitment to our customers. We’ve learned time and time again that simpler is often a better choice. Operating at scale is complicated enough, don’t add to the problem!
SELinux was—and continues to be—a long debated option for a number of solutions. For those unfamiliar, SELinux is a set of kernel features and tools that enforce mandatory access control on Linux subsystems. Using SELinux policies, you can be extremely specific about what is allowed on a system. You can mandate that a process cannot write to a specific file, even if the ownership of that process permits that actor.
In simpler terms, SELinux mandatory access control is another layer of protection that can be added to the existing authorization system. If a process has permissions to a file, SELinux can block those permissions if a policy is configured for that action. It’s a deterministic way of making sure that specific actions don’t happen.
This approach can greatly increase the security of the operating system. The trade off? Reduced flexibility when it comes to operating that system and the effort required to configure mandatory access control to meet your security requirements. Like any security control, you need to understand the benefit and compare it to the potential downside.
When it came to the PL/Rust case, the benefits of SELinux outweighed the downside. This functionality would allow us to provide the ability to enable PL/Rust to customers in a safe and secure manner.
As simple as it is to write that out, the reality was representative of the culture at AWS. As a brand new team member, I brought the idea up and our senior leaders took the time to listen. The discussions were tough as we all deeply questioned the idea and its implementation. One aspect of our culture is that we try to peek around corners and try to anticipate issues before they occur.
This type of discussion and push back on ideas helps make sure that we’re making the right call for our customers. It’s not always easy, but it is worth it. As a result of these discussions, we agreed to try the SELinux approach for this feature.
Building a complete solution
Our builders and operators built the SELinux environment, and we created appropriate policies for enforcement. This was an important first step, but not the most interesting part of the story.
We configured the mandatory access control policies to send denial messages to our telemetry systems. AWS systems generate a lot of telemetry and we regularly use this information to learn about the state of our systems and improve how we operate and design them.
Using this infrastructure, we started to build a process that would allow us to respond and investigate the denial messages generated. Working with our blue team, we developed playbooks for incident response specifically for our Amazon RDS team. We started running game days every quarter, where we have our red team stage exploits on the system and we would respond.
Afterwards, all our teams came together to measure and analyze the responses. We worked to identify bottlenecks or areas where we could improve. This regular effort helped to mature our response quickly.
At this point, we had a strong solution to reduce the risks of enabling PL/Rust, deep monitoring of our systems, and a well-tested incident response process that helped improve the entire setup.
In action
With the feature in production, we use our monitoring system to automatically cut a high severity ticket to our service team for every SELinux denial message. This level of follow-up helps us make sure that the controls are working as expected and it provides valuable insights in the reality of potential risks to the system.
This process for tracking and investigating possible issues helps our team make sure that we’re providing the level of service our customers expect. As PostgreSQL or Rust releases new features, or when customers have a new data analysis need, we want our security controls to support that work, not block it needlessly.
The feedback loop we’ve created with the investigation of the mandatory access control log messages helps our team to stay aware of what activities are being attempted in the environment. This not only helps catch issues that could affect intended uses, but also acts as an intrusion detection system.
An example of this use recently became public. In October, our team was assigned a high severity ticket that was automatically generated based on an SELinux denial message.
After a quick check to make sure that we hadn’t failed to update our monitoring criteria after recent changes to PL/Rust, our red team, blue team, and AWS security sprang into action. Remember, this activity was kicked off in response to unsuccessful access attempts! It was initiated by a message from the system letting us know it had stopped an activity, but—as is our practice—we wanted to understand what had been attempted.
We verified that the SELinux policy was correctly enforced and had blocked the activity in question. That taken care of, we continued to chase down this issue. As an aside, you might be asking yourself why we would continue to work on this case. That’s a valid question, and the answer is straightforward: we’re constantly looking to see if we can improve our systems to be more effective or more efficient.
Finding the root cause of the signal and learning more about it helps to tune our approach. Depending on the situation, we might be able to avoid a potential risk entirely and reduce the volume of alerts. Or we might see an opportunity to roll out a new feature that helps customers achieve their goals without reducing the security of the system.
In this case, our investigation determined that the detected activity was initiated by the research team at Varonis Threat Labs. We reached out to them and let them know that we had detected their activity, offering to work with them because collaboration with the research community often leads to security improvements that benefit our customers.
In this situation, the initial block and detection validated our security approach. Our policies worked as expected and prevented the activity the researchers were attempting to complete.
The research team, Tal Peleg and Coby Abrams at Varonis Threat Labs, recently spoke about this case at BlackHat 2025. They’ve published the details of their work on the Varonis blog.
As a security engineer, this is quite validating. While we test and validate the controls we put in place, to see a concrete example of how that work can benefit our customers is deeply rewarding.
If you have feedback about this post, submit comments in the Comments section below.
Serverless applications often comprise multiple AWS services, such as AWS Lambda, Amazon Simple Queue Service (Amazon SQS), Amazon EventBridge, and Amazon DynamoDB. Although serverless architectures make it easy to build applications that are generally simple to operate and scale, testing them requires extra steps for developers. Recently, AWS brought you the capability to help developers remotely debug Lambda functions to accelerate the development process. Today, we’re excited to announce new capabilities that further simplify the local testing experience for Lambda functions and serverless applications through integration with LocalStack, an AWS Partner, in the AWS Toolkit for Visual Studio Code.
In this post, we will show you how you can enhance your local testing experience for serverless applications with LocalStack using AWS Toolkit.
Challenges with local serverless development
When building serverless applications with infrastructure as code (IaC) tools like the AWS Serverless Application Model (AWS SAM), developers often face challenges during local integration testing of applications that depend on interactions across multiple AWS services. These friction points slow down the critical code-test-debug cycle. Developers might encounter the following common roadblocks:
Cloud-based validation slows iteration – Developers previously needed to deploy AWS SAM templates to the cloud to test changes, introducing delays in feedback loops. AWS research shows that developers spend considerable time on deployment and testing, rather than writing code.
Tool context switching adds friction – Developers routinely shift between integrated development environments (IDEs), command line interfaces (CLIs), and resource emulators like LocalStack, leading to fragmented workflows.
Manual setup increases configuration complexity – Port mapping and code edits for local service integration tests can introduce inconsistencies between local and cloud environments.
Service integration debugging is limited – Troubleshooting Lambda functions in the context of AWS service integrations, such as DynamoDB, Amazon Simple Storage Service (Amazon S3), or Amazon SQS, requires manual configuration, extending the duration of troubleshooting efforts.
These challenges directly impact developer productivity and make local testing of integrated serverless applications complex.
Solution overview
Starting today, AWS helps simplify local serverless development by integrating LocalStack directly into the AWS Toolkit for VS Code. This integration helps developers test and debug serverless applications—defined using IaC tools like AWS SAM—entirely within their IDE. The enhanced local testing experience delivers four major improvements:
Integrated LocalStack experience – Connect to LocalStack directly within VS Code and manage local resources alongside cloud resources through a unified interface.
Emulated service interactions – Test Lambda functions with their interactions with other AWS services like Amazon SQS, DynamoDB, and EventBridge locally.
Simplified debugging – Start debugging sessions with LocalStack emulated environment, with a single click – no manual port configurations or code changes required, streamlining the debugging workflow.
Streamlined workflow – Deploy, test, and debug serverless applications without leaving the IDE, avoiding context switching between tools.
To set up LocalStack in VS Code (either the free version supporting over 30 core services like Lambda, Amazon S3, DynamoDB, Amazon SQS, and Amazon API Gateway, or the Ultimate version with over 110 services and advanced debugging features) you need essential development tools, including Docker, the AWS Command Line Interface (AWS CLI), AWS SAM CLI, and your preferred IDE such as VS Code. This combination enables full local integration testing of AWS services, including Lambda functions, messaging queues, databases, event-driven architectures, and serverless workflows, so you can develop and test your entire AWS application stack locally before deploying to the cloud.
Automated setup process
LocalStack is a cloud service emulator that you can use to run AWS applications locally for testing and development. To enhance your local testing capabilities, you can install the LocalStack VSCode Extension directly from AWS Walkthrough in AWS Toolkit, which offers a streamlined setup process through an intelligent wizard. After installation, the extension automatically detects whether LocalStack is configured on your system and prompts you to run the setup wizard through a notification. The entire process is quick and requires no manual configuration.
LocalStack extension has an integrated authentication wizard, that simplifies the process of connecting your development environment to LocalStack. During setup, the wizard opens a browser-based authentication flow and maintains an active connection until authentication completes. After it’s verified, it securely stores the authentication token in the ~/.localstack/auth.json file, enabling communication between your local environment and LocalStack services.
The wizard also checks if LocalStack AWS CLI profiles exist, and if not found, automatically creates them by updating the ~/.aws/config and ~/.aws/credentials files with LocalStack-specific endpoints and credentials. This seamless integration of AWS profiles enhances the development workflow by allowing developers to easily switch between different AWS environments, including the local LocalStack setup. By leveraging these profiles, developers can effortlessly point their AWS CLI or SDK to the appropriate endpoint, whether it’s a real AWS account or the LocalStack instance running on their machine. This configuration not only ensures a clear separation between local and cloud environments but also minimizes the risk of cross-environment interference. The automatic creation of these profiles streamlines the setup process, reducing manual configuration errors and saving valuable development time. Visual Studio Code (VS Code) provides real-time feedback throughout the setup. The status bar initially displays an error or warning indicator when LocalStack is not configured and then transitions to a normal or connected state once a successful connection is established. After setup completes, you’re ready to deploy, test, and debug serverless applications locally—without additional configuration. These settings persist across VS Code sessions, so the setup process is a one-time task.The following figure illustrates the process to start and verify LocalStack from VS Code.
To learn more, including installation steps, configuration examples, and troubleshooting guidance, visit the LocalStack Docs.
Test a serverless application
To demonstrate the enhanced local testing capabilities, let’s explore a practical serverless pattern: building and testing an event-driven order processing system that integrates Lambda with Amazon SQS, API Gateway, and Amazon Simple Notification Service (Amazon SNS). The application processes orders through an event-driven workflow: orders are submitted through API Gateway to an SQS queue and processed by a Lambda function, and the status is published to Amazon SNS to trigger customer email notifications.
After you set up LocalStack in VS Code, you can test your entire serverless workflow without deploying to the cloud:
Deploy locally – Use the LocalStack AWS profile to deploy your AWS SAM application. The process mirrors cloud deployment but targets local endpoints. You can use the Application builder pane to initiate the deployment to LocalStack environment. The following figure illustrates the process of deploying a sample serverless application.
Debug Lambda function deployed in LocalStack – Set breakpoints in your Lambda function and step through execution using VS Code’s integrated debugger. With the AWS Toolkit extension, you can invoke your Lambda with one click and inspect live interactions across services, all while running against a LocalStack container on your machine. This setup makes it possible to debug your AWS applications in a controlled, local environment that mimics the cloud infrastructure, without the need for deploying actual AWS services.
Validate end-to-end Flows – Test complete workflows from message ingestion through processing and notification, confirming all service integrations work correctly before cloud deployment.
For an in-depth technical demonstration of this LocalStack integration, refer to this youtube video.
Best practices for local Lambda function testing
In this section, we discuss various strategies and best practices for local Lambda function testing.
Optimizing your development workflow
Consider the following strategies to optimize your development workflow:
Start with a strong testing foundation – Use the AWS SAM CLI to perform unit tests that validate the core programmatic and business logic of your Lambda functions. Isolating function behavior early helps identify logic errors before introducing external dependencies.
Establish environment parity early in the development process – Many production issues stem from discrepancies between local and cloud environments. Use consistent service versions, configurations, and data structures across environments to confirm that what works locally behaves the same in production.
Adopt IaC from day one – Whether you choose AWS SAM, AWS CloudFormation, or another IaC framework, defining your application infrastructure as code reduces configuration drift and makes your deployments reproducible across teams and environments.
Apply a progressive testing strategy – Follow a structured testing pyramid that starts with fast, isolated unit tests and builds up to broader integration and system-level validation. This layered approach helps you catch issues earlier—when they’re easier and less expensive to fix—while still providing full application coverage.
A strategic approach to testing
Testing should be an integrated part of your serverless development workflow—not an afterthought. Successful teams implement layered testing strategies that use both local and cloud environments to strike a balance between speed and accuracy:
Begin with unit tests that focus on isolated function logic. Use tools like the AWS SAM CLI, AWS Toolkit for VS Code and LocalStack extensions to run and debug functions locally.
After validation, proceed to local integration testing using LocalStack to confirm how your Lambda functions interact with services such as Amazon SQS, DynamoDB, and Amazon SNS. These tests typically complete within minutes and catch most service integration issues before they reach production.
After local testing, validate your application in the actual AWS environment. Cloud testing helps surface issues not present in local emulation, such as AWS Identity and Access Management (IAM) permission mismatches, Amazon Virtual Private Cloud (Amazon VPC) networking challenges, or service-specific nuances such as Lambda concurrency. For troubleshooting issues in the cloud environment, you can also remotely debug your Lambda functions using AWS Toolkit for VS Code.
Lastly, conduct performance testing in AWS to assess how your application handles real-world traffic. These longer-running tests help validate scaling behavior and system resilience under load.
The result is higher-quality applications delivered faster, with fewer production surprises and more confident deployments.
Security considerations
When using LocalStack for local development, follow these security best practices:
Isolate the local environment – Use Docker networking to restrict LocalStack access and bind services to localhost to prevent external connections.
Use placeholder credentials – Use test credentials (for example, test/test) instead of real AWS credentials.
Protect your data – Use synthetic or anonymized datasets instead of production data and regularly purge local data stores to reduce risk.
When to use local versus cloud testing
Although local testing offers significant advantages, it’s important to understand when to use it versus testing in the cloud. The following table lists the potential use cases for each strategy.
Testing Scenario
Local Testing
Cloud Testing
Reason
Function logic validation
✓
Fast feedback for core business logic
Service integration testing
✓
Quick validation of AWS service interactions
Rapid iteration during development
✓
Immediate feedback without deployment overhead
Cost-sensitive development environments
✓
Minimizes cloud resource costs during development
Offline development scenarios
✓
No internet connectivity required
Performance and scalability testing
✓
Requires actual AWS infrastructure for accurate results
IAM permission validation
✓
LocalStack doesn’t fully replicate IAM behavior
VPC networking scenarios
✓
Network configurations can’t be accurately emulated
Production-like load testing
✓
Real performance metrics only available in AWS
Final validation before deployment
✓
Supports compatibility with actual AWS environment
Conclusion
In this post, we discussed how to streamline local testing for AWS Serverless applications using LocalStack and the AWS Toolkit for VS Code. By running and debugging serverless applications directly in your IDE, you can reduce context switching, test complex integrations locally, and catch issues earlier—without deploying to the cloud.
We also showed how to apply progressive testing strategies that combine local emulation with cloud validation, optimize development costs, and build event-driven workflows with confidence.These enhancements lead to faster test cycles, lower development costs, and higher-quality deployments—all while staying fully in control of your development environment.
Have questions or feedback about this post? Connect with us on the AWS Compute Blog or join the AWS Developer community.
Version 49 of the GNOME desktop
environment has been released. Changes include new default video
(Showtime) and PDF-viewing (Papers) applications, a number of calendar
improvements, and updates to the Web, Maps, and Software applications.
We announced tag2upload’s open beta in mid-July. That was in the
middle of the the freeze for trixie, so usage was fairly light until
the forky floodgates opened.
Since then the service has successfully performed 637 uploads, of
which 420 were in the last 32 days. That’s an average of about 13 per
day. For comparison, during the first half of September up to today
there have been 2475 uploads to unstable. That’s about 176/day.
So, tag2upload is already handling around 7.5% of uploads. This is
very gratifying for a service which is advertised as still being in
beta!
Amazon Web Services (AWS) successfully completed an onboarding audit with no findings for ISO 9001:2015, 27001:2022, 27017:2015, 27018:2019, 27701:2019, 20000-1:2018, and 22301:2019, and Cloud Security Alliance (CSA) STAR Cloud Controls Matrix (CCM) v4.0. EY CertifyPoint auditors conducted the audit and reissued the certificates on August 13, 2025. The objective of the audit was to enable AWS to expand their ISO and CSA STAR certifications to include AWS Resource Explorer and AWS Incident Response to their scope. The ISO standards cover areas including quality management, information security, cloud security, privacy protection, service management, and business continuity. The certifications demonstrate AWS’s commitment to maintaining robust security controls and protecting customer data across our services.
During this onboarding audit, we added two additional AWS services to the scope since the last certification issued on May 26, 2025. The following are the two additional services:
For a full list of AWS services that are certified under ISO and CSA Star, see the AWS ISO and CSA STAR Certified page. Customers can also access the certifications in the AWS Management Console through AWS Artifact.
If you have feedback about this post, submit comments in the Comments section below.
The collective thoughts of the interwebz
Manage Consent
To provide the best experiences, we use technologies like cookies to store and/or access device information. Consenting to these technologies will allow us to process data such as browsing behavior or unique IDs on this site. Not consenting or withdrawing consent, may adversely affect certain features and functions.
Functional
Always active
The technical storage or access is strictly necessary for the legitimate purpose of enabling the use of a specific service explicitly requested by the subscriber or user, or for the sole purpose of carrying out the transmission of a communication over an electronic communications network.
Preferences
The technical storage or access is necessary for the legitimate purpose of storing preferences that are not requested by the subscriber or user.
Statistics
The technical storage or access that is used exclusively for statistical purposes.The technical storage or access that is used exclusively for anonymous statistical purposes. Without a subpoena, voluntary compliance on the part of your Internet Service Provider, or additional records from a third party, information stored or retrieved for this purpose alone cannot usually be used to identify you.
Marketing
The technical storage or access is required to create user profiles to send advertising, or to track the user on a website or across several websites for similar marketing purposes.