Zurich Spain: Managing millions of documents with AWS

Post Syndicated from Miguel Guillot original https://aws.amazon.com/blogs/architecture/zurich-spain-managing-millions-of-documents-with-aws/

This post was cowritten with Oscar Gali, Head of Technology and Architecture for GI in Zurich, Spain

About Zurich Spain

Zurich Spain is part of Zurich Insurance Group (Zurich), known for its financial soundness and solvency. With more than 135 years of history and over 2,000 employees, it is a leading company in the Spanish insurance market.

Introduction

Enterprise Content Management (ECM) is a key capability for business operations in Insurance, due to the number of documents that must be managed every day. In our digital world, managing and storing business documents and images (such as policies or claims) in a secure, available, scalable, and performant platform is critical.

Zurich Spain decided to use AWS to streamline management of their underlying infrastructure, in addition to the pay-as-you-go pricing model and advanced analytics services. All of these service features create a huge advantage for the company.

The challenge

Zurich Spain was managing all documents for non-life insurance on an on-premises proprietary solution. This was based on an ECM market standard product and specific storage infrastructure. That solution over time had several pain points: cost, scalability, and flexibility. This platform has become obsolete and was an obstacle for covering future analytical needs.

After considering different alternatives, Zurich Spain decided to base their new ECM platform on AWS, leveraging many of the managed services. AWS Managed Services helps to reduce your operational overhead and risk. AWS Managed Services automates common activities, such as change requests, monitoring, patch management, security, and backup services. It provides full lifecycle services to provision, run, and support your infrastructure.

Although the architecture design was clear, the challenge was huge. Zurich Spain had to integrate all the existing business applications with the new ECM platform. Concurrently, the company needed to migrate up to 150 million documents including metadata, in less than 6 months.

The Platform

Functionally, features provided by ECM are:

ECM Features

ECM Features

  • Authentication: every request must come from an authenticated user (OpenID Connect JWT).
  • Authorization: on every request, appropriate user permissions are validated.
  • Documentation Services: exposed API that allows interaction with documents (CRUD). For example:
    • The ability to Ingest a document either synchronously (attaching the document to the request) or asynchronously (providing a link to the requester that can be used to attach a document when required).
    • Upload operation stores documents onto Amazon Simple Storage Service (S3) and its metadata, which is saved using Amazon DocumentDB.
    • Documents Retrieve, similarly to the upload operation, can be obtained either synchronously or asynchronously. The latter provides a link to be used to download the document within a time range.
    • ECM has been developed to give the users the ability to search among all the documents uploaded into it.
  • Metadata: every document has technical and business metadata. This gives Zurich Spain the ability to enrich every single document with all the information that is relevant for their business, for example: Customers, Author, Date of creation.
  • Record Management: policies to manage documents lifecycle.
  • Audit: every transaction is logged into the system.
  • Observability: capabilities to monitor and operate all services involved: logging, performance metrics and transactions traceability.

The Architecture

The ECM platform uses AWS services such as Amazon S3 to store documents. In addition, it uses Amazon DocumentDB to store document metadata and audit trail.

The rationale for choosing these services was:

  • Amazon S3 delivers strong read-after-write consistency automatically for all applications, without changes to performance or availability. With strong consistency, Amazon S3 simplifies the migration of on-premises analytics workloads by removing the need to update applications. This reduces costs by removing the need for extra infrastructure to provide strong consistency.
  • Amazon DocumentDB is a NoSQL document-oriented database where its schema flexibility accommodates the different metadata needs. It was key to design the index strategy in advance to ensure the right query performance, considering the volume of data.

A microservices layer has been built on top to provide the right services for the business applications. These include access control, storing or retrieving documents, metadata, and more.

These microservices are built using Thunder, the internal framework and technology stack for digital applications of Zurich Spain. Thunder leverages AWS and provides a K8s environment based on Amazon Elastic Kubernetes Service (Amazon EKS) for microservice deployment.

Zurich Spain Architecture

Figure 2 – Zurich Spain Architecture

Zurich Spain uses AWS Direct Connect to connect from their data center to AWS. With AWS Direct Connect, Zurich Spain can connect to all their AWS resources in an AWS Region. They can transfer their business-critical data directly from their data center into and from AWS. This enables them to bypass their internet service provider and remove network congestion.

Amazon EKS gives Zurich Spain the flexibility to start, run, and scale Kubernetes applications in the AWS Cloud or on-premises. Amazon EKS is helping Zurich Spain to provide highly available and secure clusters while automating key tasks such as patching, node provisioning, and updates. Zurich Spain is also using Amazon Elastic Container Registry (Amazon ECR) to store, manage, share, and deploy container images and artifacts across their environment.

Some interesting metrics of the migration and platform:

  • Volume: 150+ millions (25 TB) of documents migrated
  • Duration: migration took 4 months due to the limited extraction throughput of the old platform
  • Activity: 50,000+ documents are ingested and 25,000+ retrieved daily
  • Average response time:
    • 550 ms to upload a document
    • 300 ms for retrieving a document hosted in the platform

Conclusion

Zurich Spain successfully replaced a market standard ECM product with a new flexible, highly available, and scalable ECM. This resulted in a 65% run cost reduction, improved performance, and enablement of AWS analytical services.

In addition, Zurich Spain has taken advantage of many benefits that AWS brings to their customers. They’ve demonstrated that Thunder, the new internal framework developed using AWS technology, provides fast application development with secure and frequent deployments.

How EMX reduced data pipeline costs by 85% with Amazon Athena

Post Syndicated from Gary Bouton original https://aws.amazon.com/blogs/big-data/how-emx-reduced-data-pipeline-costs-by-85-with-amazon-athena/

This is a guest blog post by Gary Bouton and Louis Ashner from EMX. In their own words, “ENGINE Media Exchange (EMX) is a leading marketing technology company, leveraging a patented, end-to-end tech stack purpose-built to meet the demands of today’s digital marketplace. The company creates both open- and closed-loop solutions designed to unify advertisers, platforms, and publishers across digital media channels—including advanced TV, video, display, search, and social.”

While recognized as an independent solutions provider for the digital media landscape, EMX also serves as the technology and programmatic division for its parent, ENGINE—a global data-driven marketing company serving advertising’s most recognized brands.

In the past, we used typical legacy data warehouse solutions for our data pipeline. We needed massive clusters to house all our raw data as well as advanced pipelines to import that data into the final database. We then needed to query the raw data clusters to aggregate and move it into a separate cluster for more frequent querying. This process was not only time consuming, but also quite expensive, because these legacy database clusters weren’t cheap in order to house that much data.

Then came Amazon Athena, which allowed us to not only simplify our pipeline, but also save on costs significantly. We were able to simply route the raw data straight to Amazon Simple Storage Service (Amazon S3) at minimal storage costs, then query the data with Athena to move aggregate data into small Amazon Redshift clusters for querying more frequently. Athena’s querying is not only quick, but the query costs are mere pennies when the table is set up correctly with partitions and the query utilizes them properly. Additionally, we can increase our data retention time, because the cost of storing data in Amazon S3 is significantly cheaper than an ever-growing legacy data warehousing solution.

In short, Athena allowed us to simplify our data pipeline while saving 85% on data storage costs at the same time.

This post discusses the following:

  • Why EMX digital chose Athena for its backend ETL workflow
  • How EMX manages Athena performance and run time
  • How EMX continues to scale Athena with new products and create coherent workflows
  • The benefits of this solution for EMX

Advantages of a robust backend ETL workflow when dealing with fast and furious big data

For most companies, data is an ever-growing problem. The volume, velocity, variety, and veracity of its availability can be performance limiting and a financial burden.

Data is very important to us at EMX; we process over 450,000 requests per second, which we clean, audit, and deliver for reporting and optimizations to keep our clients informed and current in an ever-changing ad space.

To do this, we have to have a backend system that is robust, on time, available, and cost effective in order to meet the demands of our split-second decision-making.

Why Athena is the right tool for EMX

As detailed below, Athena’s pay-per-query pricing model, performance and reliability at scale, and ease of use made it the right tool for us.

  • Scale – EMX processes over 2 TB of raw and sometimes unstructured data every hour for reporting and optimizations. The ability to run these jobs without managing the cluster optimizations directly allows the team to focus on more research and product goals. Using Athena allows us to focus more on research, product development ideas, and ad hoc tasks, and alleviates us from having to take time to estimate the process and computational power needed to complete jobs in time.
  • Cost – Cost per query is at least four times cheaper than other backend ETL tools, and its on-demand nature means we only pay for what we use. We’re no longer losing increasing costs by keeping up a system that isn’t being used. The feedback of cost per query through Athena also allows us to tune and optimize our logic, to not only reduce that cost further but test new ways to split into and run our production ETL jobs.
  • Resilience – We have thrown everything but the kitchen sink problems at Athena while building out our production pipeline, and were impressed at the lack of failure from the service. Even though we don’t directly own the resources to the cloud solution of Athena, it has always had high availability. In instances where availability was hampered, Athena has made it easy and straightforward to add in workflow hooks to retry failed jobs when a queue becomes available.
  • Ease of use – Unlike most competitor offerings, Athena works out of the box. It’s very easily customized using the Athena GUI, or you can build your own roles, rules, database structures, and projections. The documentation for tuning AWS performance with Presto is very easy and straightforward, making it a small learning curve for any new user.
  • Data transformations – Athena’s robust Presto query language allows us to perform regex, quartile, and percentile statistics without resorting to an outside transformation step in Python or other languages. Going further, using window functions inside those same queries allows us to do some of the heavy mathematical lifting we would have needed to do outside of the backend process, thus saving cost and time. With Athena, these extra vital steps see no difference in cost or performance to our backend pipeline and allow us to condense complicated parts into one step.

Why we continue to grow with Athena

We continue to grow with Athena for the following reasons:

  • Future scale – Athena and its team keep improving and adding resources that support our ever-growing data needs, which have increased by 200% since Athena’s implementation. This has served as the bedrock to our backend solutions.
  • Improvements – The Sales and Engineering team at AWS has always been open to feedback and has turned that into better error reporting, work groups for Athena, changes in policy, and workload management through roles. This has allowed us to split Athena resources with workgroups from production-level work to running ad hoc jobs in future updates.
  • Cost is king – Every dollar we have saved through Athena has been put into products to make Athena better for us. Using Athena has allowed us to improve our front-end delivery products—from building our own workflows right into Athena, to taking time to work with the right compression for Athena ingestion, and even offloading more work that would have gone to a traditional ETL box. Cost for us is not just dollars but the time it takes to manage; that time saved is allowing us to be on the bleeding edge in development of new tools to deliver the data Athena helps us serve.

The following sections detail how EMX uses Athena to build, manage, and orchestrate its backend ELT work with minimal coding and maintenance.

Solution architecture

The following diagram shows the architecture EMX uses.

The following diagram shows the architecture EMX uses.

How we use Athena

Our custom scripts stream batched data each minute from auction servers directly to raw S3 buckets. The data is dropped in a .gzip format to datetime-partitioned S3 buckets. This partition structure helps us limit our Athena query scan. For example, the partitioned buckets look like the following screenshot.

For example, the partitioned buckets look like the following screenshot.

When the data has reached these partitioned buckets, EMX uses Apache Airflow to schedule various jobs across Athena. The following screenshot shows our DAG for our most-used pipeline.

The following screenshot shows our DAG for our most-used pipeline.

Before beginning to run Athena queries, we run two checks on our data in Amazon S3:

  • Check if all the expected data has arrived and is in the bucket.
  • Check logic match rules and clean illegal fields in the data.

On the success of both tasks, we start adding the latest partition to an Athena table.

When the partition is added to the table, we start running the query. The query status is polled every 10 seconds to get the latest status on the query performance until completion. The query returns the status as success, failed, or canceled. Depending on what query status is returned, further tasks are then forked.

At times, we have noticed queries fail with the error Query resource exhausted at this scale, which usually goes away on triggered retries. For the same reason, we have a retry mechanism in place on the execute_athena_sql task. If the retry fails, it alerts the team and data is copied over to a debug bucket for further investigation. If it succeeds, it moves ahead with further transformation.

For further transformation, we get the output of the Athena query back in Amazon S3, and then we add the business rules to enrich the data in Amazon S3.

Based on the pipeline logic, the data is then copied from Amazon S3 to different data stores, one of them being Amazon Redshift.

The last step is to clean up the metadata that was generated by the Athena query.

The following is an example from one of our pipelines. This Athena table is projected on top of the partitioned buckets, and the table is also partitioned by datetime so that the table can be read off the data directly when it’s ready. The following screenshot is what the sample table campaigns_stream looks like, which reads the data from the aforementioned bucket.

The following screenshot is what the sample table campaigns_stream looks like, which reads the data from the aforementioned bucket.

As soon as our scheduled jobs are triggered, the job runs data checks, data matches, and complex SQL queries on this table using the latest date partition, which was loaded in the last DAG task, which limits the data scan and reduces costs. The results are generated and pushed to the S3 reporting bucket to be picked up by other processes. The results can be generated in different formats like CSV, Apache Avro, and Apache Parquet using the CTAS or INSERT INTO command.

For example, running the following simple count query for each domain scans approximately 1.65 TB of data and gives back the results in less than 600 seconds, without needing us to set up or manage any infrastructure.

For example, running the following simple count query for each domain scans approximately.

When the query is complete and the output files in the S3 reporting bucket are ready, they’re picked up by our DAG and pushed into data storage like Amazon Redshift.

Optimization on Athena

By default, Athena has a soft limit of 20 DML active queries (CTAS). When we have multiple jobs running in parallel, we may hit that limit, delaying our time-sensitive pipelines and jobs. To overcome this, we allocated a fixed time window in each hour for our most critical pipelines, and other jobs with lower priority are run later.

For example, our production pipelines get priority 1 – with window minute 0 to minute 15 of every hour. We’re aware that we can request a limit increase from AWS, but we instead decided to use this opportunity to improve the resilience and robustness of our system.

Conclusion

“Build, don’t buy” has been EMX’s motto. It drives our innovation forward, much like Athena continues to be able to solve all the questions we ask of it. We build boutique and large-scale solutions for our advertising clients, which require a malleable and robust ETL backend that takes the work and cost to a manageable level. We built an ever-scaling, cost-effective, and highly available ETL backend with Athena.

Our successes with Athena are shown through both time and cost savings, including:

  • 30% of the time used on maintenance of a traditional ETL structure is now moved into Athena improvement, which sees improved feedback in reduced costs that we can pass on to our clients
  • Four times less cost per query than competitors has allowed us to put money into different tools for storage and modeling, giving even more entropy to driving more revenue for our clients and less cost
  • 10 times less technical debt in Athena setup, research, staging, and production, which goes back into other future-thinking projects

What we can do with data is only limited by the time we need in herding, cleaning, and delivering this data for insights and development. Since throwing 100% of our ETL backend systems into Athena, we have increased product delivery and systems optimization four-fold in only a quick short year. Athena and the Athena team continue to grow with us even as our data needs begin to soar exponentially, adding more tools that reduce workflows, management, and job distribution in the AWS ecosystem itself. This entropy between EMX and Athena has resulted in increased cooperation and more business with us and our growing lists of clients.

Our “Why” is building the tools for the future, and Athena personifies our “Why” in delivering what EMX is about: scale, on time, and delivery of data optimized for the modern era.


About the Authors

Gary Bouton is VP of Data Engineering at ENGINE Media Exchange and leads their Data Engineering and Data Science Product teams. Pipeline implementation is led by Director of Data Pipeline Rahul Gupta, Senior Engineer Nader S. Gharawi, Data Science Engineer Raghav Gupta. Data model implementation is led by Senior Data Scientist Gabrielle Agrocostea , and Data Scientist Heena Otia.


Louis Ashner is EVP of Technology at ENGINE Media Exchange. He has a passion for making the Internet faster, and is an ad-tech pioneer with more than 10 years of experience working with digital advertising, including real-time bidding and programmatic advertising. His 9 patents in networking optimization and data caching are used to power EMX’s proprietary ad exchange.

Over 40 services require TLS 1.2 minimum for AWS FIPS endpoints

Post Syndicated from Janelle Hopper original https://aws.amazon.com/blogs/security/over-40-services-require-tls-1-2-minimum-for-aws-fips-endpoints/

In a March 2020 blog post, we told you about work Amazon Web Services (AWS) was undertaking to update all of our AWS Federal Information Processing Standard (FIPS) endpoints to a minimum of Transport Layer Security (TLS) 1.2 across all AWS Regions. Today, we’re happy to announce that over 40 services have been updated and now require TLS 1.2:

These services no longer support using TLS 1.0 or TLS 1.1 on their FIPS endpoints. To help you meet your compliance needs, we are updating all AWS FIPS endpoints to a minimum of TLS 1.2 across all Regions. We will continue to update our services to support only TLS 1.2 or later on AWS FIPS endpoints, which you can check on the AWS FIPS webpage. This change doesn’t affect non-FIPS AWS endpoints.

When you make a connection from your client application to an AWS service endpoint, the client provides its TLS minimum and TLS maximum versions. The AWS service endpoint will always select the maximum version offered.

What is TLS?

TLS is a cryptographic protocol designed to provide secure communication across a computer network. API calls to AWS services are secured using TLS.

What is FIPS 140-2?

The FIPS 140-2 is a US and Canadian government standard that specifies the security requirements for cryptographic modules that protect sensitive information.

What are AWS FIPS endpoints?

All AWS services offer TLS 1.2 encrypted endpoints that can be used for all API calls. Some AWS services also offer FIPS 140-2 endpoints for customers who need to use FIPS validated cryptographic libraries to connect to AWS services.

Why are we upgrading to TLS 1.2?

Our upgrade to TLS 1.2 across all Regions reflects our ongoing commitment to help customers meet their compliance needs.

Is there more assistance available to help verify or update client applications?

If you’re using an AWS software development kit (AWS SDK), you can find information about how to properly configure the minimum and maximum TLS versions for your clients in the following AWS SDK topics:

You can also visit Tools to Build on AWS and browse by programming language to find the relevant SDK. AWS Support tiers cover development and production issues for AWS products and services, along with other key stack components. AWS Support doesn’t include code development for client applications.

If you have any questions or issues, you can start a new thread on one of the AWS forums, or contact AWS Support or your technical account manager (TAM).

If you have feedback about this post, submit comments in the Comments section below.

Want more AWS Security how-to content, news, and feature announcements? Follow us on Twitter.

Author

Janelle Hopper

Janelle Hopper is a Senior Technical Program Manager in AWS Security with over 15 years of experience in the IT security field. She works with AWS services, infrastructure, and administrative teams to identify and drive innovative solutions that improve AWS’ security posture.

Author

Marta Taggart

Marta is a Seattle-native and Senior Program Manager in AWS Security, where she focuses on privacy, content development, and educational programs. Her interest in education stems from two years she spent in the education sector while serving in the Peace Corps in Romania. In her free time, she’s on a global hunt for the perfect cup of coffee.

Security updates for Tuesday

Post Syndicated from original https://lwn.net/Articles/844865/rss

Security updates have been issued by Debian (firefox-esr, libdatetime-timezone-perl, python-django, thunderbird, and tzdata), Fedora (kf5-messagelib and qt5-qtwebengine), Mageia (kernel-linus), openSUSE (firefox, jackson-databind, and messagelib), Oracle (flatpak), Red Hat (glibc, kernel, kernel-alt, kernel-rt, linux-firmware, net-snmp, perl, qemu-kvm, and qemu-kvm-ma), SUSE (firefox, java-11-openjdk, openvswitch, terraform, and thunderbird), and Ubuntu (fastd, firefox, python-django, and qemu).

How to add a reset button to your Raspberry Pi Pico

Post Syndicated from Alasdair Allan original https://www.raspberrypi.org/blog/how-to-add-a-reset-button-to-your-raspberry-pi-pico/

We’ve tried to make it as easy as possible for you to load your code onto your new Raspberry Pi Pico: press and hold the BOOTSEL button, plug your Pico into your computer, and it’ll mount as a mass storage volume. Then just drag and drop a UF2 file onto the board.

However, not everybody is keen to keep unplugging their micro USB cable every time they want to upload a UF2 onto the board. Don’t worry — there’s more than one way around that problem.

Raspberry Pi Pico with a reset button wired to the GND and RUN pins

Firstly, if you’re developing in MicroPython there isn’t any real need to unplug and replug Pico to write code. The only time you’ll need to do it is the initial upload of the MicroPython firmware, which comes as a UF2. From there on in, you’re talking to the board via the REPL and a serial connection, either in Thonny or some other editor.

However, if you’re developing using our C SDK, then to upload new code to your Pico you have to upload a new UF2. This means you’ll need to unplug and replug the board to put Pico into BOOTSEL mode each time you make a change in your code and want to test it.

No more unplugging with SWD?

The best way around this is to use SWD mode (see Chapter 5 of our C/C++ Getting Started book) to upload code using the debug port, instead of using mass storage (BOOTSEL) mode.

A Raspberry Pi 4 and Raspberry Pi Pico with UART and SWD ports connected together

This gets you debugger support, which is invaluable while developing, and involves adding just three more wires. Afterwards, you’ll never have to unplug your Pico again.

Keep on dragging and dropping

But if you want to stick with uploading by drag-and-drop, adding a reset button to your Raspberry Pi Pico is pretty easy.

Raspberry Pi Pico with a reset button wired to the GND and RUN pins

All you need to do is to wire the GND and RUN pins together and add an extra momentary contact button to your breadboard. Pushing the button will reset the board.

Then, instead of unplugging and replugging the USB cable when you want to load code onto Pico, you push and hold the RESET button, push the BOOTSEL button, release the RESET button, then release the BOOTSEL button.

Entering BOOTSEL mode without unplugging your Pico

If your board is in BOOTSEL mode and you want to start code you’ve already loaded running again, all you have to do now is briefly push the RESET button.

Leaving BOOTSEL mode without unplugging your Pico.

We’ve see some people use the 3V3_EN pin instead of the RUN pin. While it’ll work in a pinch, the problem with disabling 3.3V is that GPIOs that are driven from powered external devices will leak like crazy while 3.3V is disabled. There is even the possibility of damage to the chip. So it’s much better to use the RUN pin to make a reset button than the 3V3_EN pin.

What about the other button?

As an aside, if you want to break out the BOOTSEL button as well — perhaps you’re intending to bury your Pico inside an enclosure — you can use TP6 (that is, Test Point 6) on the rear of the board to do so. See Chapter 2 of the Pico Datasheet for details.

Where to find more help and information

Support for developing for Pico can be found on the Raspberry Pi forums. There is also an (unofficial) Discord server where a lot of people active in the new community seem to be hanging out. Feedback on the documentation should be posted as an issue to the pico-feedback repository on GitHub, or directly to the relevant repository it concerns.

All of the documentation, along with lots of other help and links, can be found on the same Getting Started page from which we grabbed our original UF2 file.

If you lose track of where that is in the future, you can always find it from your Pico: to access the page, just press and hold the BOOTSEL button on your Pico, plug it into your laptop or Raspberry Pi, then release the button. Go ahead and open the RPI-RP2 volume, and then click on the INDEX.HTM file.

That will always take you to the Getting Started page.

The post How to add a reset button to your Raspberry Pi Pico appeared first on Raspberry Pi.

User roles for the enterprise

Post Syndicated from Arturs Lontons original https://blog.zabbix.com/user-roles-for-the-enterprise/12887/

In this post, we’ll talk about granular user roles introduced in Zabbix 5.2 and some scenarios where user roles should be used and where they give a great benefit to these specific environments.

Contents

I. Permissions granularity (0:40)
II. User Roles in 5.2 (5:16)
III. Example use cases (16:16)
IV. Questions & Answers (h2)

Permissions granularity

Permissions granularity

Let’s consider two roles: the NOC Team role and the Network Administrator role. These are quite different roles requiring different permission levels. Let’s not also forget that the people working in these roles usually have different skill sets, therefore the user experience is quite important for both of these roles: NOC Team probably wants to see only the most important, the most vital data, while the Network Administrators usually require permissions to view data in more detail and have access to more detailed and granular information overviews of what’s going on in your environment.

For our example, let’s first define the requirements for these roles.

NOC Team role:

  • They will definitely require access to dashboards and maps.
  • We will want to restrict unnecessary UI elements for them just to improve the UX. In this case – less is more. Removing the unused UI elements will make the day-to-day workflow easier for the NOC team members who aren’t as proficient with Zabbix as our Monitoring team members.
  • For security reasons we need to restrict API access because NOC team members will either use API very rarely or not at all. With roles we can restrict the API access either partially or completely.
  • The ability to modify the existing  configuration will be restricted, as the NOC team will not be responsible for changing  the Zabbix configuration.
  • The ability to close problems manually will be restricted, since the network admin team will be responsible for that.

Network Administrator role:

  • Similar to the NOC team, the Network Administrators also require access to dashboards and maps. what’s going on in your environment, the health of the environment.
  • They need to have access to configuration, since members of this team are responsible for making configuration changes.
  • Most likely, instead of disabling the API access for our network administrator role, we would want to restrict API access in some way. They might still need access to get or create methods, while access to everything else should be restricted.
  • For each of our roles we will be implementing a UI cleanup by restricting UI elements – we will hide the functionality that we have opted out of using.

Roles and multi-tenancy

Granular permissions are one of the key factors in multi-tenant environments. We could use permissions to segregate our environment per tenant, but in 5.2 that’s not the end of it:

  • Imagine multiple tenants where each has different monitoring requirements. Some want to use the services function for SLA calculation, others want to use inventory, or need the maps and the dashboards.
  • Restricting access to elements and actions per tenant is important. So, for example, some tenants wish to be able to close problems manually, others need to have restrictions on map or dashboard creations for a specific user group..
  • Permissions are still used to enable isolation between tenants on host group level

User Roles in 5.2

With Zabbix 5.2 these use cases, which require additional permission granularity, are now fully supported.

So, let’s take a look at how the User Role feature looks in a real environment.

User role

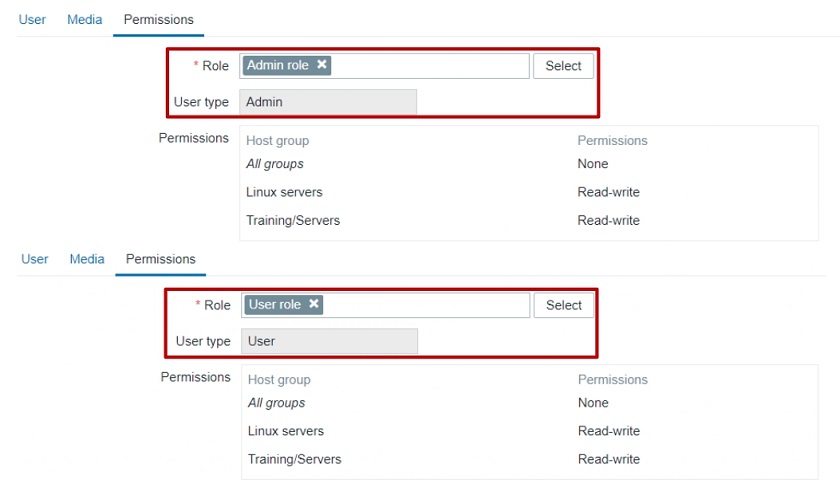
User roles in Zabbix 5.2 are something completely new. Each user will have a role assigned to them on top of their User Type:

User permissions

We end up having our User types being  linked to User roles, and User roles linked to Users. This means that User types are linked to Users indirectly through the User roles.

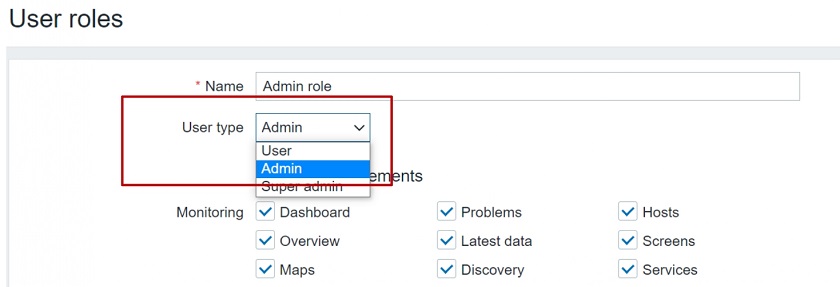
User types

The User, Admin, and Super admin types are still in use. The role will be linked to one of these 3 user types.

User roles

Note that User type restrictions still apply.

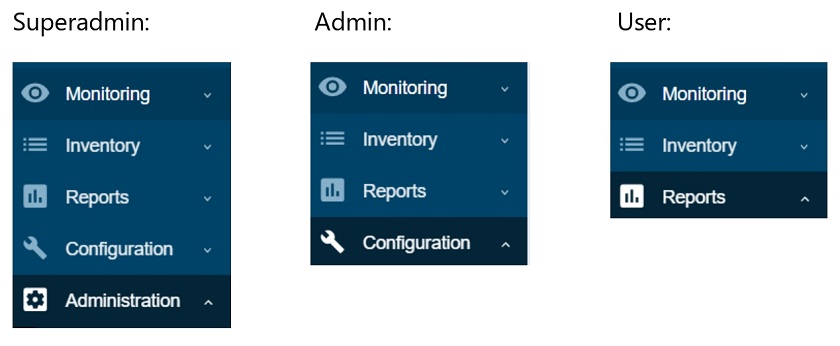
  • Super admin has access to every section: Administration, Configuration, Reports, Inventory, and Monitoring.
  • Admin has access to Configuration, Reports, Inventory, and Monitoring.
  • User has access to Reports, Inventory, and Monitoring.

Frontend sections restricted by User type

Default User roles

Once we upgrade to 5.2 or install a fresh 5.2 instance, we will have a set of default user roles. The 4 pre-configured user roles are available under Administration > User roles:

  • Super admin,
  • Admin,
  • User, and
  • Guest.

Super admin role

  • The default Super admin role is static. It is set up by default once you upgrade or install a fresh instance. Users cannot modify this role.

All of the other default roles can be modified. In the Zabbix environment, we must have at least a single user with this Super admin role that has access to all of Zabbix functionality. This is similar to the root user in the Linux OS.

Newly created roles of either  Super admin, Admin, or User types can be modified. For example, we can create another Super admin role, change the permissions. For instance, we can have a Super admin that doesn’t have access to Administration > General, but has access to everything else.

User role section

Once we open the User roles section, we will see a list of features and functions that we can restrict per user role.

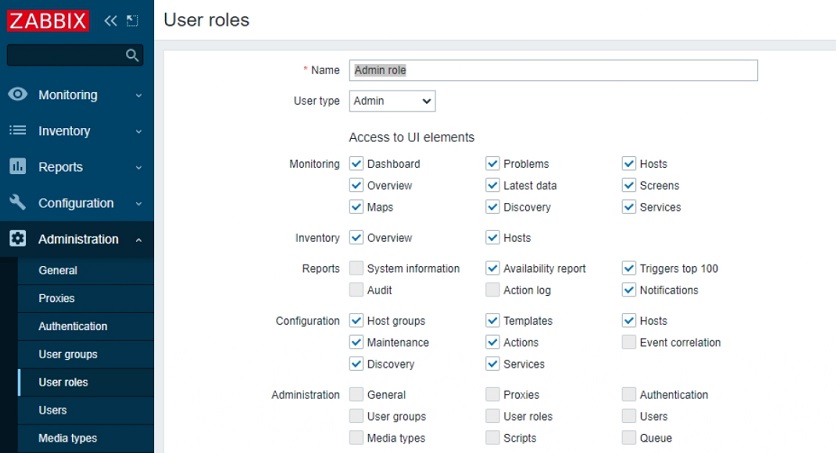
When we create a new role or open a pre-created role they will have the maximum allowed permissions depending on the User type that is used for the role.

Each of the default roles contains the maximum allowed permissions per user type

UI element restriction

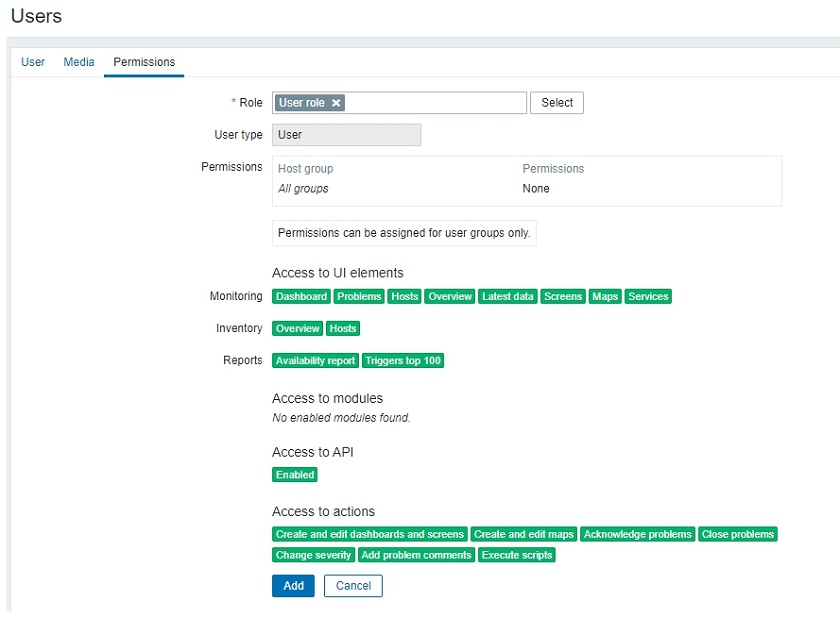
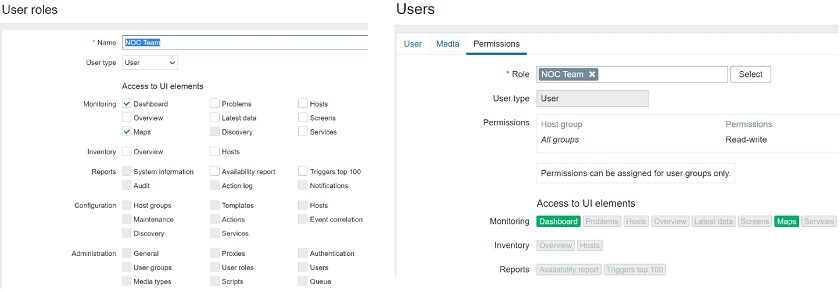
We can restrict access to UI elements for each role. If we wish to create a NOC role we can restrict them to have access only to Dashboards and maps. When we open the User up and go to Permissions we will see the available sections highlighted in green.

NOC user role that has access only to Dashboards and maps

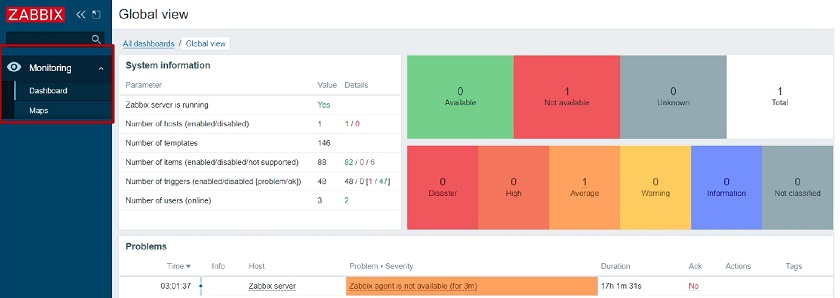
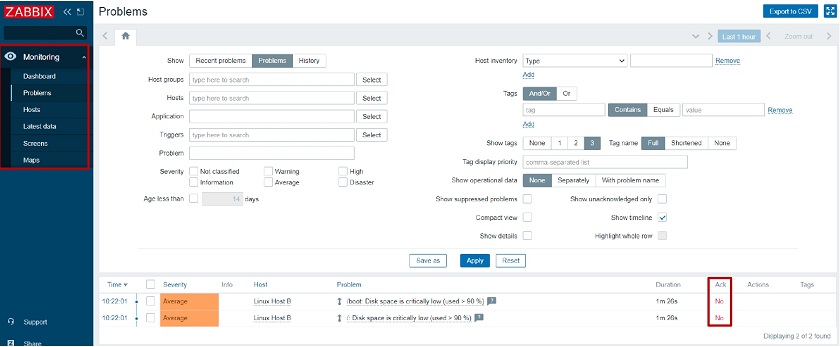
Once we open up the Dashboards or the Monitoring section, we will  see only the UI sections in our navigation menu that have been permitted for this specific user.

Global view: NOC user role that has access only to Dashboards and maps

Host group permissions

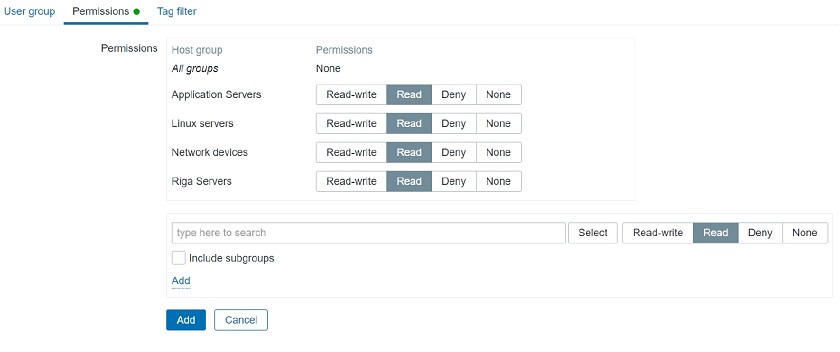
Note, that User Group access to Host Groups still has to be properly assigned. For instance, when we open the Dashboard, we still have to check if this user belongs to a user group, which has access to a specific host group. Then we will either display or hide the corresponding data.

User Group access to Host Group

Access to API

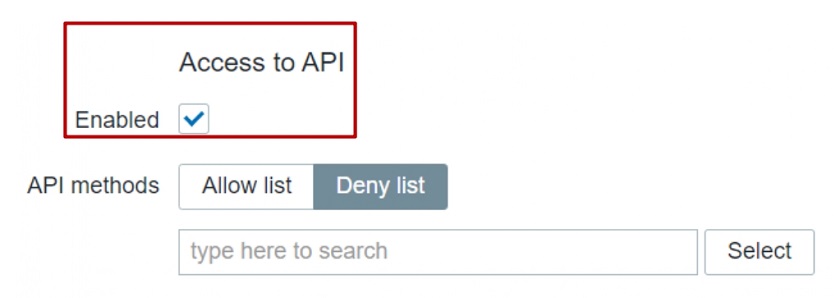
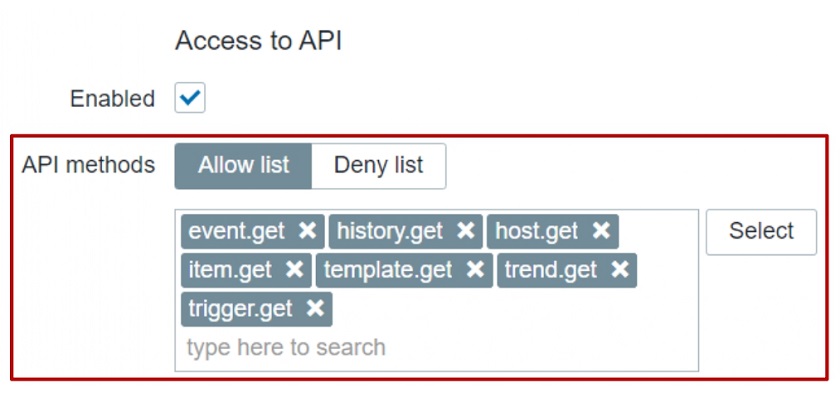
API access can also be restricted for each role. Depending on the Access to API “Enabled” checkbox the corresponding user of this specific role will be permitted or denied to access the API.

Used when creating API specific user roles

In addition to that, we can allow or restrict the execution of specific API methods. For this we can use an Allow or Deny list. For instance, we could create a user that has access only to get methods: they can read the data, but they cannot modify the data.

Restricting API method

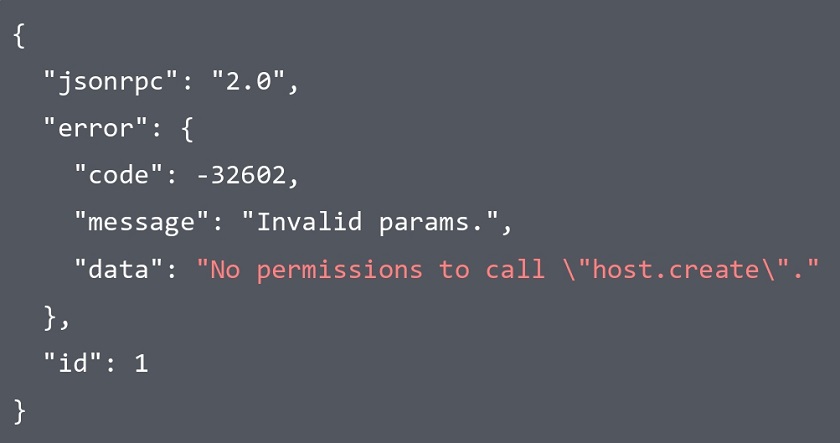
Let’s use host.create method as an example. If I don’t have permission to do so, I will see an error message ‘no permissions to call’ and then the name of the call — host.create in this case.

Access to actions

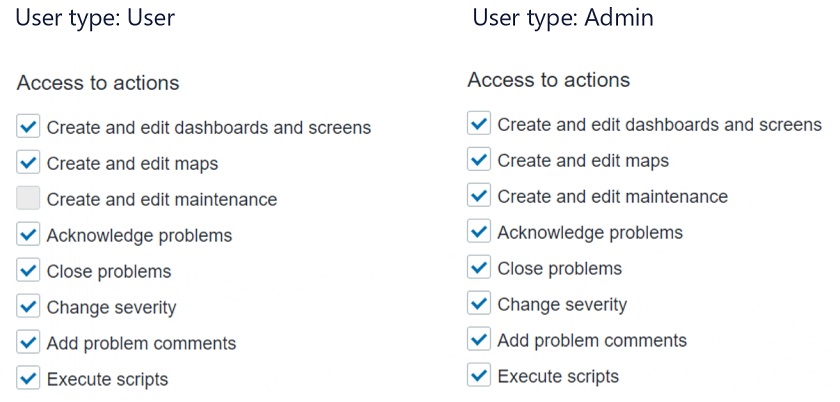
Each role can have a specific list of actions that it can perform with respect to the role User type.

In this context, ‘Actions’ mean what this user can do within the UI: Do we wish for the user to be able to close problems, acknowledge them, create or edit maps.

Defining access to actions

NOTE. For the role of type ‘User’, the ‘Create and edit maintenance’ will be grayed out because the User type by default doesn’t have access to the Maintenance section. You cannot enable it for the role of User type, but you can enable or disable it for the Admin type role.

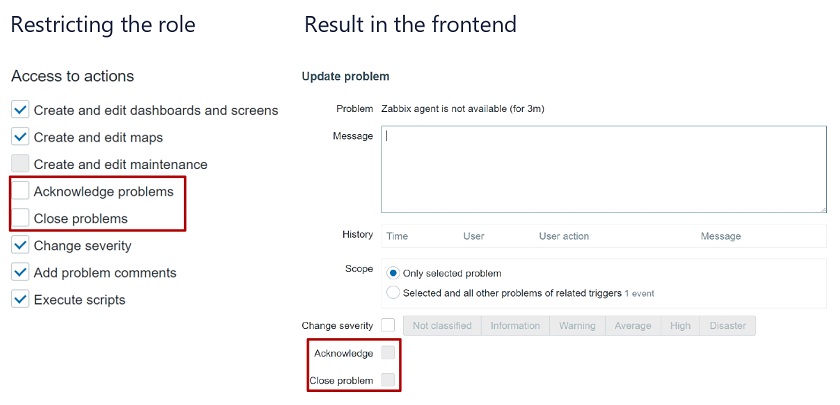
Restricting Actions example

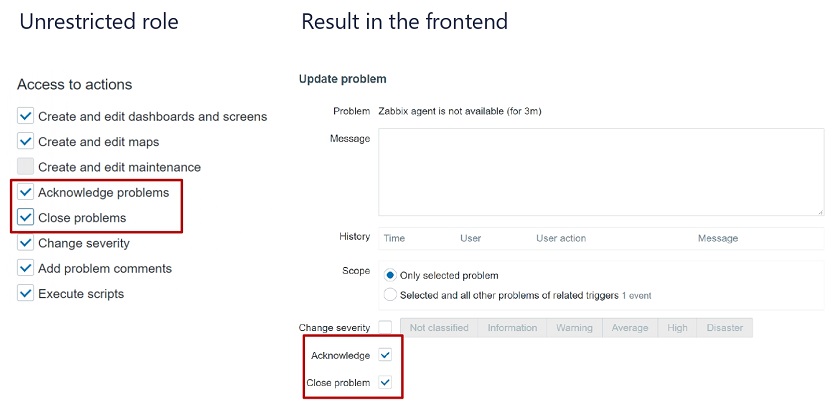
Let’s restrict the role for acknowledging and closing problems. Once we define the restriction the acknowledgment and closing of problems will be grayed out in the frontend.

If we enable it (the checkboxes are editable), we can acknowledge and close problems.

Restricted role

Unrestricted role

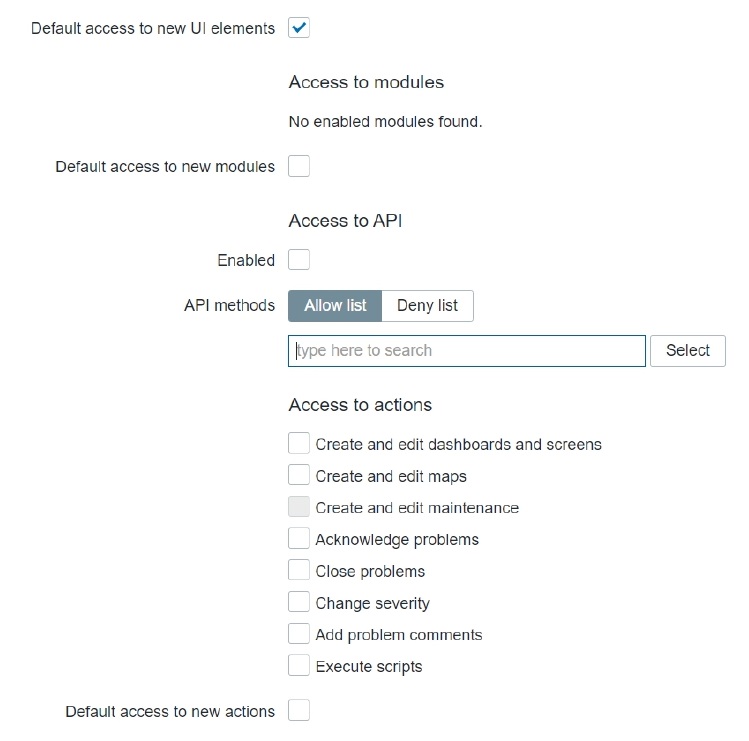
Default access

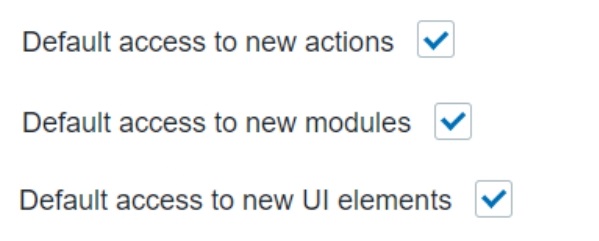
We can also modify the Default access section. We can define that a role has default access to new actions, modules, and UI elements. For instance, if we are importing a new frontend module or upgrading our version 5.2 to version 6.0 in the future –  if any new UI elements, modules or action types appear, do we want for this specific role to have access to it by default once it is created or should this role by default have restricted access to all of these new elements that we are creating?

This allows to give access to any new UI elements for our Super Admin users while disabling the for any other User roles.

Default access for new elements of different types can be enabled or disabled for user roles

If Default access is enabled, whenever a new element is added, the user belonging to this role will automatically have access to it.

Role assignment post-upgrade

How are these roles going to be assigned after migration to 5.2? I have my users of a specific User type, but what’s going to happen with roles? Will I have to assign them manually?

When you upgrade to 5.2 from, for example, 5.0, the users will have the pre-created default roles for Admin, User, and Super admin assigned for them based on their types.

Pre-created roles after migration

This allows us to keep things as they were before 5.2 or go ahead with creating new User roles.

Example use cases

The following example use cases will give you an idea of how you can implement this in your environment.

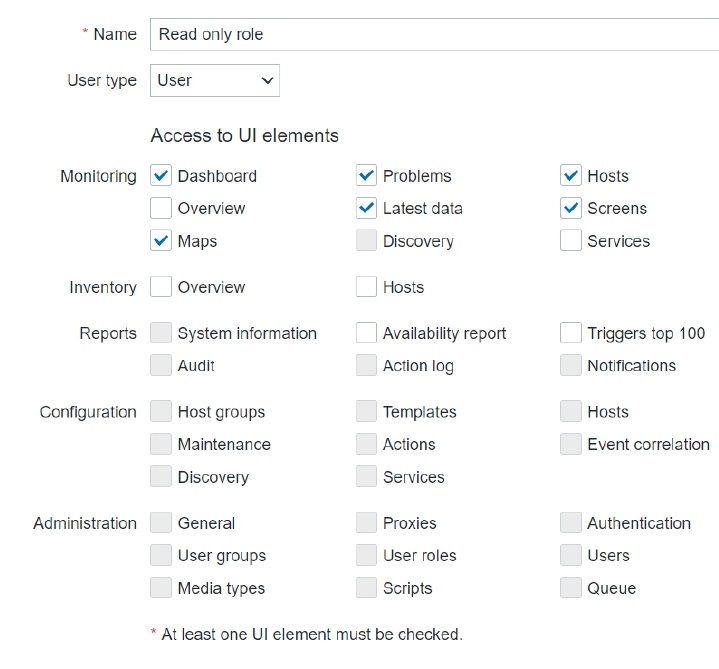
Read-only role

ANOC Team User role, with no ability to create or modify any elements:

  • read-only access to dashboards,
  • no access to problems,
  • no access to API, and
  • no permissions to execute frontend scripts.

When we are defining this new role, we will mark the corresponding checkboxes in the Monitoring section. The User type for this role is going to be ‘User’ because they don’t need to have access to Administration or Configuration.

User type and sections the role has access to

We will also restrict access to actions, the API, and decide on the new UI element and module permission logic. Default access to new actions and modules will be restricted. Read up on Zabbix release notes to see if any new UI elements have been added in future releases!

Read-only role

When we log in with this user and go to Dashboards, we will see that this user has no option to create or edit a dashboard because we have restricted such an action. The access is still granted based on the Dashboard permissions — depending on whether it is a public or a private dashboard. When they open it up, the data that they will see will depend on the User group to Host group relationship.

When this user opens up the frontend, he will see that access to the unnecessary UI elements is restricted (the restricted UI elements are hidden). Even though he has access to the Problem widget on the dashboard, they are unable to acknowledge or close the problem as we have restricted those actions.

Restricted UI elements hidden and ‘Acknowledge’ button unclickable for this Role

Restrict access to Administration section

Another very interesting use case — restricting access to Administration sections. Administration sections are available only for our Super admins, but, in this case, we want to have a separate role of type Super admin that has some restrictions.

Our Super admin type role that has no access to User сonfiguration and General Zabbix settings will need to be able to:

  • create and manage proxies,
  • define media types and frontend scripts, and
  • access the queue to check the health of our Zabbix instance.

But they won’t be able to create new User groups, Users, and so on.

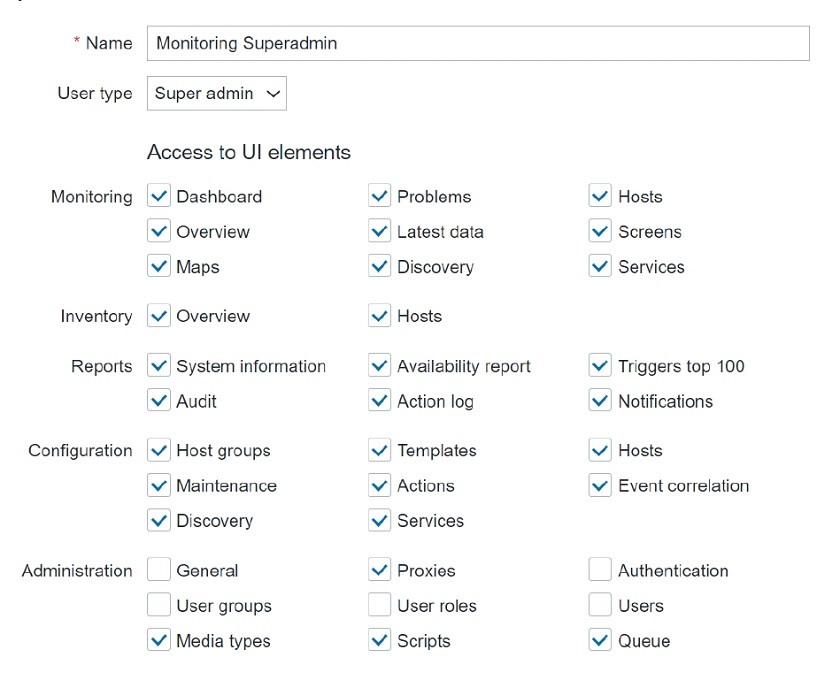
So, we are opening our Administration > User roles section, creating a new role of type Super admin, and restricting all of the user-related sections, and also restricting access to Administration > General.

User type – Super admin. General and User sections are restricted for this role

When we log in, we can see that there is no access to Administration > General section because we have restricted the ability to change housekeeper settings,  trigger severities, and other settings that are available in Administration > General.

But the Monitoring Super admin user still has the ability to create new Proxies, Media Types, Scripts and has access to the Queue section. This is a nice way to create different types of Super admins which was not possible before 5.2.

Access to Administration section elements

Roles for multi-tenant environment

Zabbix Dashboards and maps are used by multiple tenants to provide monitoring data.

In our example, we will imagine a customer portal that different tenants can access. They log in to Zabbix and based on their roles and permissions can access different elements. One of our Tenant requires a NOC role :

  • read-only access to dashboards,
  • read-only access to maps,
  • no access to API,
  • no access to configuration,
  • isolation per tenant so we won’t be able to see the host status of other tenants.

We will create a new role in Administration > User roles — new role of type User. We will restrict access only to the UI elements that need to be visible for the users belonging to this role.

User type role with very limited access to UI

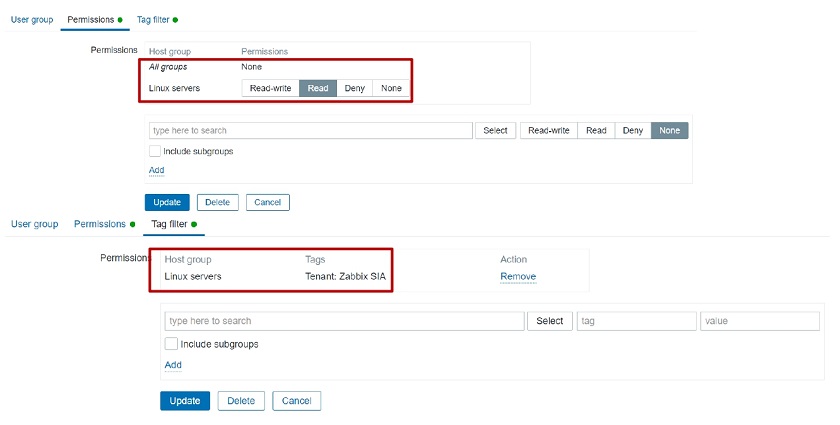
Since we need to have isolation, we will also be using tag-based permissions to isolate our Hosts per tenant. We’ll go to Permissions section, add read-only or write permissions on a User group to a specific Host group. Then we will also define the tag-based permissions so that these users have access only to problems that are tagged with a specific tag.

Tag-based permissions to isolate our Hosts per tenant

Don’t forget to actually tag those problems and define these tags either on the trigger level or on the host level.

Tagging on the host level

Once we have implemented this, if we open up the UI, we go to Monitoring > Dashboards. We can see that:

  • The UI is restricted only to the required monitoring sections.
  • Tag-based permission ensure that we are seeing problems related to our specific tenant.

Isolation and role restriction have been implemented, and we can successfully have our multi-tenant environment.

Roles for multi-tenant environments

What’s next?

How would you proceed with upgrading to Zabbix 5.2 and implementing this? At the design stage, you need to understand that User roles can help you with a couple of things and you need to estimate and assign value to these things if you want to implement them in your environment.

  1. User roles can improve auditing. Since you have restricted roles per each user it’s easier to audit who did what in your environment.
  2. Restricting API access. We can not only enable or disable API access, but we can also restrict our users to specific methods. From the security and auditing perspective, this adds a lot of flexibility.
  3. Restricting configuration. We can restrict users to specific actions or limit their access to specific Configuration sections as in the example with the custom Super admin role. This allows us to have multiple tiers of admins in our environment
  4. Removing unwanted UI elements. By restricting access to only the necessary UI elements we can give Zabbix a much cleaner look and improve the UX of your users.

Thank you! I hope I gave you some insight into how roles can be used and how they will be implemented in Zabbix 5.2. I hope you aren’t too afraid to play around with this new set of features and implement them in your environment.

Questions & Answers

Question. Can we have a limited read-only user that will have access to all the hosts that are already in Zabbix and will be added in the future?

Answer. Yes, we can have access to all of the existing Host groups. But when you add a new Host Group, you will have to go to your Permissions section and assign User Group to Host Group permissions for the newly added group.

Question. So that means that now we can have a fully customizable multi-tenant environment?

Answer. Definitely. Fully customizable based both on our User group to Host group permissions and roles to make the actions and different UI sections available as per the requirements of our tenants.

Question. I want to create a user with only API access. Is that possible in 5.0 or 5.2?

Answer. It’s been possible for a while now.  You can just disable the frontend access and leave the user with the respective permissions on specific Host groups. But with 5.2 you can make the API limitations more granular. So, you can say that this API-only user has access only to specific API methods

Question. Can we make a user who can see but cannot edit the configuration?

Answer. Partially. For read-only users, read-only access still works for the Monitoring section. But if we go to Configuration, if we want to see anything in the Configuration section, we need write access.You can use Monitoring > Hosts section, where you can see partial configuration. Configuration section unfortunately still is not available for read-only access.


Detecting anomalous values by invoking the Amazon Athena machine learning inference function

Post Syndicated from Amir Basirat original https://aws.amazon.com/blogs/big-data/detecting-anomalous-values-by-invoking-the-amazon-athena-machine-learning-inference-function/

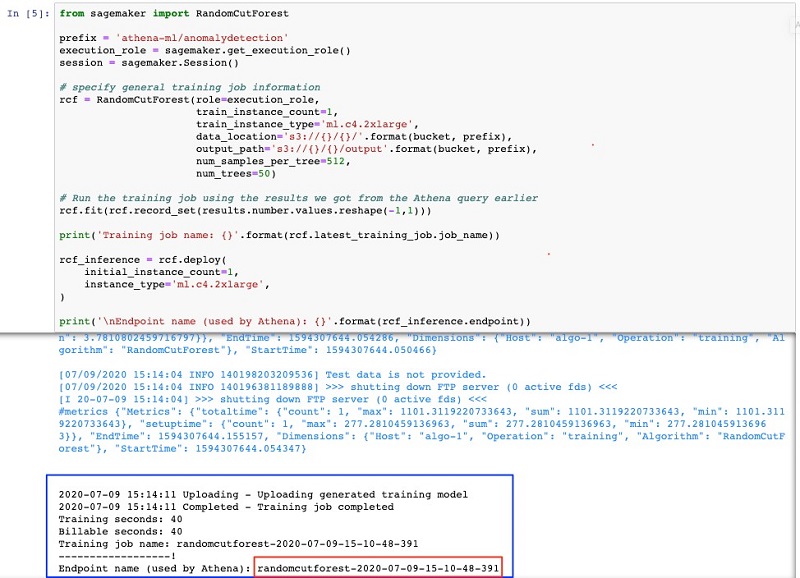
Amazon Athena has released a new feature that allows you to easily invoke machine learning (ML) models for inference directly from your SQL queries. Inference is the stage in which a trained model is used to infer and predict the testing samples and comprises a similar forward pass as training to predict the values. Unlike training, it doesn’t include a backward pass to compute the error and update weights. It’s usually the production phase where you deploy your model to predict real-world data. Using ML models in SQL queries makes complex tasks such as anomaly detection, customer cohort analysis, and sales predictions as simple as invoking a function in a SQL query.

In this post, we show you how to use Athena ML to run a federated query that uses Amazon SageMaker inference to detect an anomalous value in your result set.

Solution overview

To use ML with Athena (Preview), you define an ML with Athena function with the USING FUNCTION clause. The function points to the Amazon SageMaker model endpoint that you want to use and specifies the variable names and data types to pass to the model. Subsequent clauses in the query reference the function to pass values to the model. The model runs inference based on the values that the query passes and returns inference results.

You can use more than a dozen built-in ML algorithms provided by Amazon SageMaker, train your own models, or find and subscribe to model packages from AWS Marketplace and deploy on Amazon SageMaker hosting services. No additional setup is required. You can invoke these ML models in your SQL queries from the Athena console, Athena APIs, and through the Athena JDBC driver.

To detect anomalous values, we use the Random Cut Forest (RCF) algorithm, which is an unsupervised algorithm for detecting anomalous data points within a dataset.

Prerequisites

This post continues the work done in this blog. You need to follow steps in that post to run the AWS CloudFormation template before proceeding with this post. No additional setup is required.

As part of the CloudFormation stack that you run to build the environment, we create a new AWS Identity and Access Management (IAM) role that Amazon SageMaker uses to run an Athena query to generate our training dataset, train a new model, and deploy that model to an Amazon SageMaker endpoint. To perform these tasks, our IAM role should have AmazonSageMakerFullAccess, AmazonAthenaFullAccess, and AmazonS3FullAccess managed policies. In a production setting, you should scope down the AmazonS3FullAccess policy to include only the Amazon Simple Storage Service (Amazon S3) buckets that you require for training your model.

Additionally, we create a new Amazon SageMaker notebook instance using an ml.m4.xlarge instance type. We use the ARN of the IAM role for Amazon SageMaker as the IAM role that this notebook uses when interacting with other AWS services.

Uploading and launching the Jupyter notebook

To upload and launch your Jupyter notebook, complete the following steps:

  1. On the Amazon SageMaker console, choose Notebook Instances.

You can see a workshop notebook instance of size ml.m4.xlarge, which you created when you deployed the CloudFormation stack.

  1. Select the instance and choose Open Jupyter.
  2. Download the Jupyter notebook file that we provide as part of this post.
  3. Upload the file to Jupyter.
  4. Choose the file and open the Python code so you can go through it step by step.

Running the Python code

You now run the Jupyter notebook Python code on the console, starting from the first cell.

Make sure to update the S3 bucket defined in the second cell of the notebook by replacing the bucket name with your S3 athena-federation-workshop-******** bucket, which you created when deploying the CloudFormation template. This bucket name in your account is globally unique, and we use this bucket to store our training data and model.

In the third cell, we call a federated query against the orders table on the Aurora MySQL database using the lambda:mysql connector that we defined and used in the previous post. This query generates a training dataset for number of orders per day.

After running the fourth cell and waiting for a few seconds, you should see the training dataset.

When you build, train, and deploy your ML model on Amazon SageMaker, you normally have a model training phase and a deployment phase. At the end of your deployment, Amazon SageMaker provides you with an endpoint that your client application can interact with to input data and get the inference response back. This endpoint is what we use in our SQL query to call the ML function for inference.

In the fifth cell, we train an RCF model to detect anomalies and we deploy the model to an Amazon SageMaker endpoint that our application or Athena query can call. This part can take up to 10 minutes before the training job is complete, after which you get a generated Amazon SageMaker endpoint. Record this endpoint name; we need this in our Athena federated query.

Running an Athena ML query

On the Athena console, check your workgroup and make sure that you’re switched to the AmazonAthenaPreviewFunctionality workgroup. This workgroup enables Athena ML capabilities for your query while this functionality is in preview.

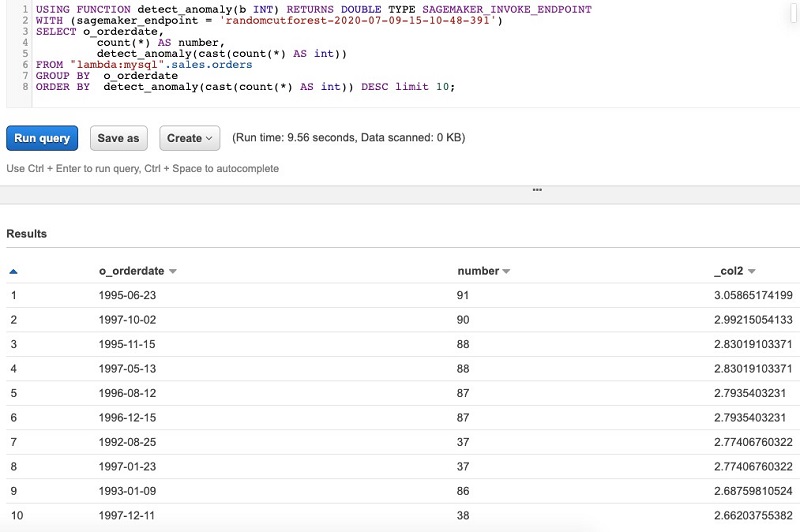
Run the saved query DetectAnamolyInOrdersData after replacing the endpoint name with the one that you generated from your Amazon SageMaker notebook run.

Amazon SageMaker RCF is an unsupervised algorithm for detecting anomalous data points within a dataset. These are observations that are distinguishable from well-structured or patterned data. In the preceding results, the RCF algorithm associates each data point an anomaly score. Low score values indicate that the data point is considered normal. High values indicate the presence of an anomaly in the data. The definitions of low and high depend on the application, but common practice suggests that scores beyond three standard deviations from the mean score are considered anomalous.

Cleaning up

When you finish experimenting with the features as part of this post, remember to clean up all the AWS resources that you created using AWS CloudFormation and during the setup.

  1. On the Amazon S3 console, empty the S3 bucket the CloudFormation template created. AWS CloudFormation can only delete the bucket if it’s empty.
  2. On the AWS CloudFormation console, delete all the connectors so they’re no longer attached to the elastic network interface (ENI) of the VPC. Alternatively, you can go to each connector and deselect the VPC so it’s no longer attached to the VPC that AWS CloudFormation created.
  3. On the Amazon SageMaker console, delete any endpoints you created as part of this post.
  4. On the Athena console, delete the AmazonAthenaPreviewFunctionality workgroup.

Conclusion

In this post, you learned about Athena support for invoking ML inference model for detecting anomalous values using the RCF algorithm that was developed on Amazon SageMaker. We demonstrated how to deploy your ML model one time on Amazon SageMaker to enable anyone in your organization to run your models any number of times for inference. Additionally, if you run Athena federated queries with this feature, then you can run inference on data in any data source.


About the Authors

Amir Basirat is a Big Data specialist solutions architect at Amazon Web Services, focused on Amazon EMR, Amazon Athena, AWS Glue and AWS Lake Formation, where he helps customers craft distributed analytics applications on the AWS platform. Prior to his AWS Cloud journey, he worked as a Big Data specialist for different technology companies. He also has a PhD in computer science, where his research was focused on large-scale distributed computing and neural networks.


Saurabh Bhutyani is a Senior Big Data specialist solutions architect at Amazon Web Services. He is an early adopter of open source Big Data technologies. At AWS, he works with customers to provide architectural guidance for running analytics solutions on Amazon EMR, Amazon Athena, AWS Glue, and AWS Lake Formation.
[$] Finding real-world kernel subsystems

Post Syndicated from original https://lwn.net/Articles/844539/rss

The kernel development community talks often about subsystems and subsystem
maintainers, but it is less than entirely clear about what a “subsystem” is in
the first place. People wanting to understand how kernel development works
could benefit from a clearer idea of what actually comprises a subsystem
within the kernel. In an attempt to better understand how kernel
development works, Pia Eichinger and her colleagues spent a lot of time looking
for the actual boundaries; Eichinger presented that work at the 2021
linux.conf.au online gathering.

Georgia’s Ballot-Marking Devices

Post Syndicated from Bruce Schneier original https://www.schneier.com/blog/archives/2021/02/georgias-ballot-marking-devices.html

Andrew Appel discusses Georgia’s voting machines, how the paper ballots facilitated a recount, and the problem with automatic ballot-marking devices:

Suppose the polling-place optical scanners had been hacked (enough to change the outcome). Then this would have been detected in the audit, and (in principle) Georgia would have been able to recover by doing a full recount. That’s what we mean when we say optical-scan voting machines have “strong software independence”­you can obtain a trustworthy result even if you’re not sure about the software in the machine on election day.

If Georgia had still been using the paperless touchscreen DRE voting machines that they used from 2003 to 2019, then there would have been no paper ballots to recount, and no way to disprove the allegations that the election was hacked. That would have been a nightmare scenario. I’ll bet that Secretary of State Raffensperger now appreciates why the Federal Court forced him to stop using those DRE machines (Curling v. Raffensperger, Case 1:17-cv-02989-AT Document 579).

I have long advocated voter-verifiable paper ballots, and this is an example of why.

Addressing the OT-IT Risk and Asset Inventory Gap

Post Syndicated from Ben Garber original https://blog.rapid7.com/2021/02/01/addressing-the-ot-it-risk-and-asset-inventory-gap/

Addressing the OT-IT Risk and Asset Inventory Gap

Cyber-espionage and exploitation from nation-state-sanctioned actors have only become more prevalent in recent years, with recent examples including the SolarWinds attack, which was attributed to nation-state actors with alleged Russian ties.

There are suspicions that sensitive information has been stolen from victims of the SolarWinds attack, such as Black Start, the Federal Energy Regulatory Commission’s plan to restore power after a grid blackout.

Attacks on critical infrastructure have grown in popularity since 2010, with the first nation-state cyber-physical attack on the Natanz Nuclear Enrichment Facility (aka Stuxnet). The attack changed critical process parameters such as the RPM of the centrifuges and hid these changes from the system operators, causing random centrifuge failures and significantly delaying the uranium enrichment process by the Iranians. This was followed by the blackouts that were caused as a result of the attacks on the Ukrainian Grid in 2015 and 2016.

Critical infrastructure is now a prime target in the context of global cyber warfare. Operational technology (OT), the backbone of industrial automation, has become less segmented due to equipment being addressable from the internet or by receiving services from the internet, such as software updates.

With the introduction of remote access and remote vendor support comes a much larger attack surface for the OT group, which traditionally didn’t handle IT security and advanced threats. While the Stuxnet attack destroyed centrifuges and may have delayed Iran’s nuclear program, other compromises can cause serious environmental impacts, injuries, and even loss of life. While no ICS cyberattack to date has caused bodily injury, the Trisis attack campaign has the potential to do so by compromising SIS safety systems that are used to prevent fires and explosions.

Challenges facing security teams

Securing this space is no easy task. With the growth of IP-based communications into OT, the lines between OT and IT have become more and more blurred over who is in charge of securing these systems. Additionally, networks that were once disconnected (such as gas-fired power plants) are now connected for smart grid management.

As industrial control systems (ICS) are increasingly digitized, their attack surface grows, becoming more significant targets for malicious attacks. While the IT environment has foundationally evolved to have security as a cornerstone of management, OT has only recently started down that path. Much like the early days of internet protocols, developers of industrial protocols did not create protocol standards with security in mind, and many vendors developed proprietary protocols.

Fast forward to today, and we have a plethora of protocols with varying degrees of robustness and security in modern production environments. Many asset owners are hampered in their security efforts by not having the ability to effectively monitor or have the appropriate security tools to respond to incidents. The OT equipment itself can also be sensitive to active queries, causing it to fail when sent unexpected data, more data than it can handle at once, or using more active connections than allowed, making active monitoring somewhat risky.

Adding in the ever-growing PC servers and workstations to ICS networks, and you have a complex attack surface that encompasses traditional enterprise services and cyber-physical systems. The solutions often require an approach that can address security across both environments and can distinguish which systems are sensitive to active monitoring.

Bridging the gap with Rapid7 and SCADAFence

We can overcome these challenges by providing a unified system that monitors and assesses both environments. Security analysts need to understand what is happening within OT systems and how attackers breached those systems through the traditional IT infrastructure. Operators also need to be conscious of all the equipment within their production environments, including both OT assets and IT assets. With the integration of the SCADAfence product suite into Rapid7’s InsightVM, customers can get in-depth information around their OT assets and single out those devices that are sensitive to traditional layer-3 scanning techniques.

Through establishing a risk profile of all devices across the IT and OT infrastructure, operators and analysts can optimize risk prioritization and remediation efforts. Not only can IT and OT assets be enumerated and assessed, but Internet of Things (IoT) devices can as well.
With the integration of SCADAfence, automation customers can achieve full coverage across both the IT and OT environments by leveraging the Rapid7 Insight product portfolio, leading to risk reduction for the entire organization.

See how Rapid7 and SCADAfence deliver full OT & IoT visibility to SecOps teams

Learn More

Operating Lambda: Application design and Service Quotas – Part 1

Post Syndicated from James Beswick original https://aws.amazon.com/blogs/compute/operating-lambda-application-design-and-service-quotas-part-1/

In the Operating Lambda series, I cover important topics for developers, architects, and systems administrators who are managing AWS Lambda-based applications. This three-part series discusses application design for Lambda-based applications.

A well-architected event-driven application uses a combination of AWS services and custom code to process and manage requests and data. This series on Lambda-specific topics in application design, and how Lambda interacts with other services. There are many important considerations for serverless architects when designing applications for busy production systems.

Part 1 shows how to work with Service Quotas, when to request increases, and architecting with quotas in mind. It also explains how to control traffic for downstream server-based resources.

Understanding quotas

The Lambda service is designed for short-lived compute tasks that do not retain or rely upon state between invocations. The Lambda service invokes your custom code on demand in response to events from other AWS services, or requests via the AWS CLI or AWS SDKs. Code can run for up to 15 minutes in a single invocation and a single function can use up to 10,240 MB of memory.

Lambda is designed to scale rapidly to meet demand, allowing your functions to scale up to serve traffic in your application. Other AWS services frequently used in serverless applications, such as Amazon API Gateway, Amazon SNS, and AWS Step Functions, also scale up in response to increased load. This has enabled our largest customers to build applications that scale to millions of requests quickly without having to manage underlying infrastructure.

However, before you scale an application to these levels, it’s important to understand the guardrails that are put in place to protect your account and the workloads of other customers. Service Quotas exist in all AWS services and consist of hard limits, which you cannot change, and soft limits, which you can request increases for.

By default, all new accounts are assigned a quota profile that allows exploration of the services. However, the values may need to be raised to support medium-to-large application workloads. Typically, customers request increases for their accounts as they start to expand usage of their applications. This allows the quotas to grow with usage, and help protect the account from unexpected costs caused by unintended usage.

Different AWS services have different quotas. These quotas may apply at the Region level, or account level, and may also include time-interval restrictions, such as requests per second. For example, the maximum number of IAM roles is an account-based quota, whereas the maximum number of concurrent Lambda executions is a per-Region quota.

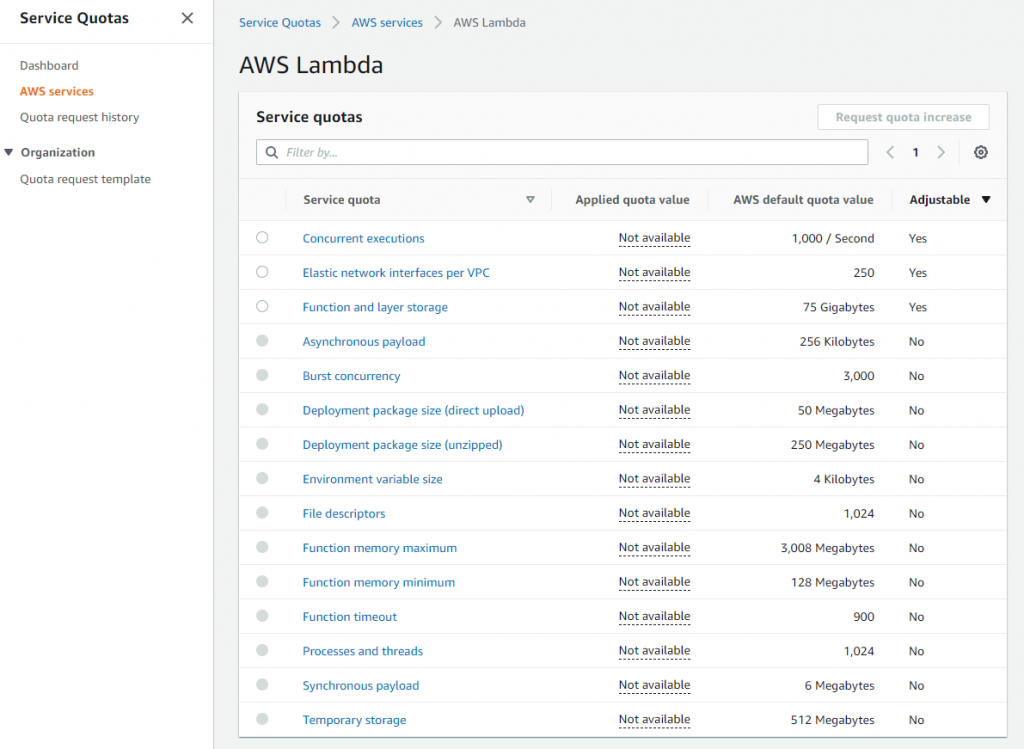
To see the quotas that apply to your account, navigate to the Service Quotas dashboard. This allows you to view your Service Quotas, request a service quota increase, and view current utilization. From here, you can drill down to a specific AWS service, such as Lambda:

Service Quotas for AWS Lambda

In this example, sorted by the Adjustable column, this shows that Concurrent executions, Elastic network interfaces per VPC, and Function and layer storage are all adjustable limits. You could request a quota increase for any of these via the AWS Support Center. The other items provide a useful reference for other limits applying to the service.

Architecting with Service Quotas

Most serverless applications use multiple AWS services, and different services have different quotas for different features. Once you have a serverless architecture designed and know which services your application uses, you can compare the different quotas across services and find any potential issues.

Example serverless application architecture

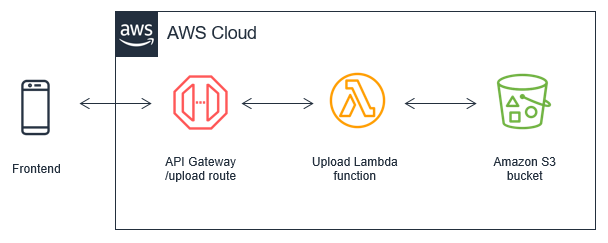
In this example, API Gateway has a default throttle limit of 10,000 requests per second. Many applications use API Gateway endpoints to invoke Lambda functions. Lambda has a default concurrency limit of 1,000. Since API Gateway to Lambda is a synchronous invocation, it’s possible to have more incoming requests than could be handled simultaneously by a Lambda function, when using the default limits. This can be resolved by requesting to have the Lambda concurrency limit raised for this account to match the expected level of traffic.

Another common challenge is handling payload sizes in different services. Consider an application moving a payload from API Gateway to Lambda to Amazon SQS. API Gateway supports payloads up to 10 Mb, while Lambda’s payload limit is 6 Mb and the SQS message size limit is 256 Kb. In this example, you could instead store the payload in an Amazon S3 bucket instead of uploading to API Gateway, and pass a reference token across the services. The token size is much smaller than any payload limit and may provide a more efficient design for your workload, depending upon the use-case.

Load testing your serverless application also allows you to monitor the performance of an application before it is deployed to production. Serverless applications can be relatively simple to load test, thanks to the automatic scaling built into many of the services. During a load test, you can identify any quotas that may act as a limiting factor for the traffic levels you expect and take action accordingly.

There are several tools available for serverless developers to perform this task. One of the most popular is Artillery Community Edition, which is an open-source tool for testing serverless APIs. You configure the number of requests per second and overall test duration and it uses a headless Chromium browser to run tests. Other popular tools include Nordstrom’s Serverless-Artillery and Gatling.

Using multiple AWS accounts for managing quotas

Many customers have multiple workloads running in the AWS Cloud but many quotas are set at the account level. This means that as you add more serverless workloads, some quotas are shared across more workloads, reducing the quotas available for each workload. Additionally, if you have development resources in the same account as production workloads, quotas are shared across both. It’s possible for development activity to exhaust resources unintentionally that you may want to reserve only for production.

An effective way to solve this issue is to use multiple AWS accounts, dedicating workloads to their own specific account. This prevents quotas from being shared with other workloads or non-production resources. Using AWS Organizations, you can centrally manage the billing, compliance, and security of these accounts. You can attach policies to groups of accounts to avoid custom scripts and manual processes.

One common approach is to provide each developer with an AWS account, and then use separate accounts for a beta deployment stage and production:

Multiple AWS account by environment

The developer accounts can contain copies of production resources and provide the developer with admin-level permissions to these resources. Each developer has their own set of limits for the account, so their usage does not impact your production environment. Individual developers can deploy AWS CloudFormation stacks and AWS Serverless Application Model (AWS SAM) templates into these accounts with minimal risk to production assets.

This approach allows developers to test Lambda functions locally on their development machines against live cloud resources in their individual accounts. It can help create a robust unit testing process, and developers can then push code to a repository like AWS CodeCommit when ready.

By integrating with AWS Secrets Manager, you can store different sets of secrets in each environment and replace any need for credentials stored in code. As code is promoted from developer account through to the beta and production accounts, the correct set of credentials is automatically used. You do not need to share environment-level credentials with individual developers.

To learn more, read “Best practices for organizing larger serverless applications”.

Controlling traffic flow for server-based resources

While Lambda can scale up quickly in response to traffic, many non-serverless services cannot. If your Lambda functions interact with those services downstream, it’s possible to overwhelm those services with data or connection requests.

Amazon RDS is one of the most common Lambda integrations that relies on a server-based resource. However, relational databases are connection-based, so they are intended to work with a few long-lived clients, such as web servers. By contrast, Lambda functions are ephemeral and short-lived, so their database connections are numerous and brief. If Lambda scales up to hundreds or thousands of instances, you may overwhelm downstream relational databases with connection requests. This is typically only an issue for moderately busy applications. If you are using a Lambda function for low-volume tasks, such as running daily SQL reports, you do not experience this behavior.

The Amazon RDS Proxy service is built to solve the high-volume use-case. It pools the connections between the Lambda service and the downstream Amazon RDS database. This means that a scaling Lambda function is able to reuse connections via the proxy. As a result, the relational database is not overwhelmed with connections requests from individual Lambda functions. This does not require code changes in many cases. You only need to replace the database endpoint with the proxy endpoint in your Lambda function.

For other downstream server-based resources, APIs, or third-party services, it’s important to know the limits around connections, transactions, and data transfer. If your serverless workload has the capacity to overwhelm those resources, use an SQS queue to decouple the Lambda function from the target. This allows the server-based resource to process messages from the queue at a steady rate. The queue also durably stores the requests if the downstream resource becomes unavailable.

Conclusion

Lambda works with other AWS services to process and manage requests and data. This post explains how to understand and manage Service Quotas, when to request increases, and architecting with quotas in mind. It also explains how to control traffic for downstream server-based resources.

Part 2 of this series will discuss scaling and concurrency in Lambda and the different behaviors of on-demand and Provisioned Concurrency.

For more guidance, see the Operating Lambda: Understanding event-driven architectures series.

For more serverless learning resources, visit Serverless Land.

Security updates for Monday

Post Syndicated from original https://lwn.net/Articles/844749/rss

Security updates have been issued by Arch Linux (home-assistant, libgcrypt, libvirt, and mutt), Debian (ffmpeg, kernel, libonig, libsdl2, mariadb-10.1, and thunderbird), Fedora (chromium, firefox, jasper, libebml, mingw-python3, netpbm, opensmtpd, thunderbird, and xen), Gentoo (firefox and thunderbird), Mageia (db53, dnsmasq, kernel, kernel-linus, and php-pear), openSUSE (go1.14, go1.15, messagelib, nodejs8, segv_handler, and thunderbird), Oracle (firefox, kernel, and thunderbird), Red Hat (flatpak), SUSE (firefox and rubygem-nokogiri), and Ubuntu (mysql-5.7, mysql-8.0 and python-django).

Rapid7 Acquires Leading Kubernetes Security Provider, Alcide

Post Syndicated from Brian Johnson original https://blog.rapid7.com/2021/02/01/rapid7-acquires-leading-kubernetes-security-provider-alcide/

Rapid7 Acquires Leading Kubernetes Security Provider, Alcide

Organizations around the globe continue to embrace the flexibility, speed, and agility of the cloud. Those that have adopted it are able to accelerate innovation and deliver real value to their customers faster than ever before. However, while the cloud can bring a tremendous amount of benefits to a company, it is not without its risks. Organizations need comprehensive visibility into their cloud and container environments to help mitigate risk, potential threats, and misconfigurations.

At Rapid7, we strive to help our customers establish and implement strategies that enable them to rapidly adopt and secure cloud environments. Looking only at cloud infrastructure or containers in a silo provides limited ability to understand the impact of a possible vulnerability or breach.

To help our customers gain a more comprehensive view of their cloud environments, I am happy to announce that we have acquired Alcide, a leader in Kubernetes security based in Tel Aviv, Israel. Alcide provides seamless Kubernetes security fully integrated into the DevOps lifecycle and processes so that business applications can be rapidly deployed while also protecting cloud environments from malicious attacks.

Alcide’s industry-leading cloud workload protection platform (CWPP) provides broad, real-time visibility and governance, container runtime and network monitoring, as well as the ability to detect, audit, and investigate known and unknown security threats. By bringing together Alcide’s CWPP capabilities with our existing posture management (CSPM) and infrastructure entitlements (CIEM) capabilities, we will be able to provide our customers with a cloud-native security platform that enables them to manage risk and compliance across their entire cloud environment.

This is an exciting time in cloud security, as we’re witnessing a shift in perception. Cloud security teams are no longer viewed as a cost center or operational roadblock and have earned their seat at the table as a critical investment essential to driving business forward. With Alcide, we’re excited to further increase that competitive advantage for our customers.

We look forward to joining forces with Alcide’s talented team as we work together to provide our customers comprehensive, unified visibility across their entire cloud infrastructure and cloud-native applications.

Welcome to the herd, Alcide!

The collective thoughts of the interwebz

By continuing to use the site, you agree to the use of cookies. more information

The cookie settings on this website are set to "allow cookies" to give you the best browsing experience possible. If you continue to use this website without changing your cookie settings or you click "Accept" below then you are consenting to this.

Close