LibreQoS 1.4 released

Post Syndicated from corbet original https://lwn.net/Articles/953286/

The LibreQoS project
describes itself as:

LibreQoS is a Quality of Experience (QoE) Smart Queue Management
(SQM) system designed for Internet Service Providers to optimize
the flow of their network traffic and thus reduce bufferbloat, keep
the network responsive, and improve the end-user experience.

Version
1.4
of LibreQoS was released on November 17. “Version 1.4 is a
huge milestone. A whole new back-end, new GUI, 30%+ performance
improvements, support for single-interface mode.
”

[$] An overview of kernel samepage merging (KSM)

Post Syndicated from jake original https://lwn.net/Articles/953141/

In the Kernel Summit
track
at the 2023 Linux
Plumbers Conference
(LPC), Stefan Roesch led a session on kernel
samepage merging
(KSM). He gave an overview of the feature and described
some recent changes to KSM. He showed how
an application can enable KSM to deduplicate its memory and how the feature
can be evaluated to determine whether it is a good fit for new workloads.
In addition, he provided some real-world data of the benefits from his
workplace at Meta.

All of Netflix’s HDR video streaming is now dynamically optimized

Post Syndicated from Netflix Technology Blog original https://netflixtechblog.com/all-of-netflixs-hdr-video-streaming-is-now-dynamically-optimized-e9e0cb15f2ba

by Aditya Mavlankar, Zhi Li, Lukáš Krasula and Christos Bampis

High dynamic range (HDR) video brings a wider range of luminance and a wider gamut of colors, paving the way for a stunning viewing experience. Separately, our invention of Dynamically Optimized (DO) encoding helps achieve optimized bitrate-quality tradeoffs depending on the complexity of the content.

HDR was launched at Netflix in 2016 and the number of titles available in HDR has been growing ever since. We were, however, missing the systematic ability to measure perceptual quality (VMAF) of HDR streams since VMAF was limited to standard dynamic range (SDR) video signals.

As noted in an earlier blog post, we began developing an HDR variant of VMAF; let’s call it HDR-VMAF. A vital aspect of such development is subjective testing with HDR encodes in order to generate training data. The pandemic, however, posed unique challenges in conducting a conventional in-lab subjective test with HDR encodes. We improvised as part of a collaborative effort with Dolby Laboratories and conducted subjective tests with 4K-HDR content using high-end OLED panels in calibrated conditions created in participants’ homes [1],[2]. Details pertaining to HDR-VMAF exceed the scope of this article and will be covered in a future blog post; for now, suffice it to say that the first version of HDR-VMAF landed internally in 2021 and we have been improving the metric ever since.

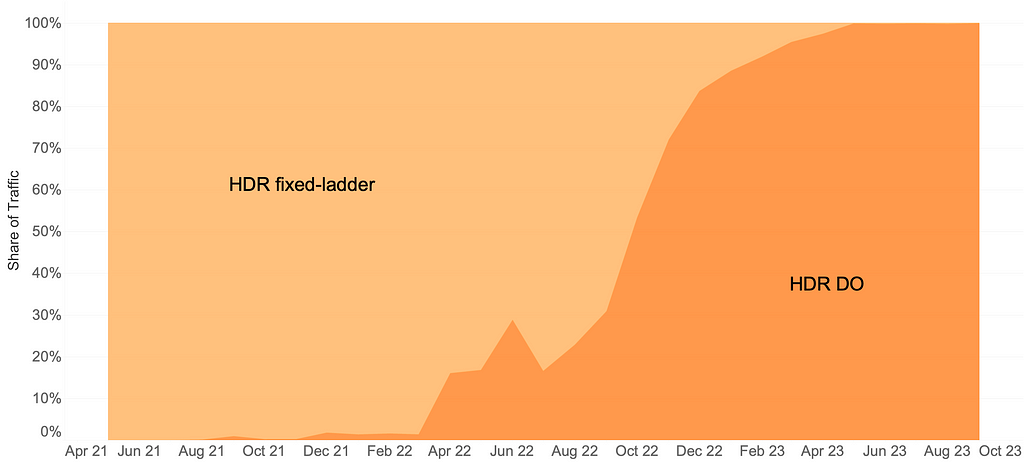
The arrival of HDR-VMAF allowed us to create HDR streams with DO applied, i.e., HDR-DO encodes. Prior to that, we were using a fixed ladder with predetermined bitrates — regardless of content characteristics — for HDR video streaming. We A/B tested HDR-DO encodes in production in Q3-Q4 2021, followed by improving the ladder generation algorithm further in early 2022. We started backfilling HDR-DO encodes for existing titles from Q2 2022. By June 2023 the entire HDR catalog was optimized. The graphic below (Fig. 1) depicts the migration of traffic from fixed bitrates to DO encodes.

Fig. 1: Migration of traffic from fixed-ladder encodes to DO encodes.

Bitrate versus quality comparison

HDR-VMAF is designed to be format-agnostic — it measures the perceptual quality of HDR video signal regardless of its container format, for example, Dolby Vision or HDR10. HDR-VMAF focuses on the signal characteristics (as a result of lossy encoding) instead of display characteristics, and thus it does not include display mapping in its pipeline. Display mapping is the specific tone mapping applied by the display based on its own characteristics — peak luminance, black level, color gamut, etc. — and based on content characteristics and/or metadata signaled in the bitstream.

Two ways that HDR10 and Dolby Vision differ are: 1) the preprocessing applied to the signal before encoding 2) the metadata informing the display mapping on different displays. So, HDR-VMAF will capture the effect of 1) but ignore the effect of 2). Display capabilities vary a lot among the heterogeneous population of devices that stream HDR content — this aspect is similar to other factors that vary session to session such as ambient lighting, viewing distance, upscaling algorithm on the device, etc. “VMAF not incorporating display mapping” implies the scores are computed for an “ideal display” that’s capable of representing the entire luminance range and the entire color gamut spanned by the video signal — thus not requiring display mapping. This background is useful to have before looking at rate vs quality curves pertaining to these two formats.

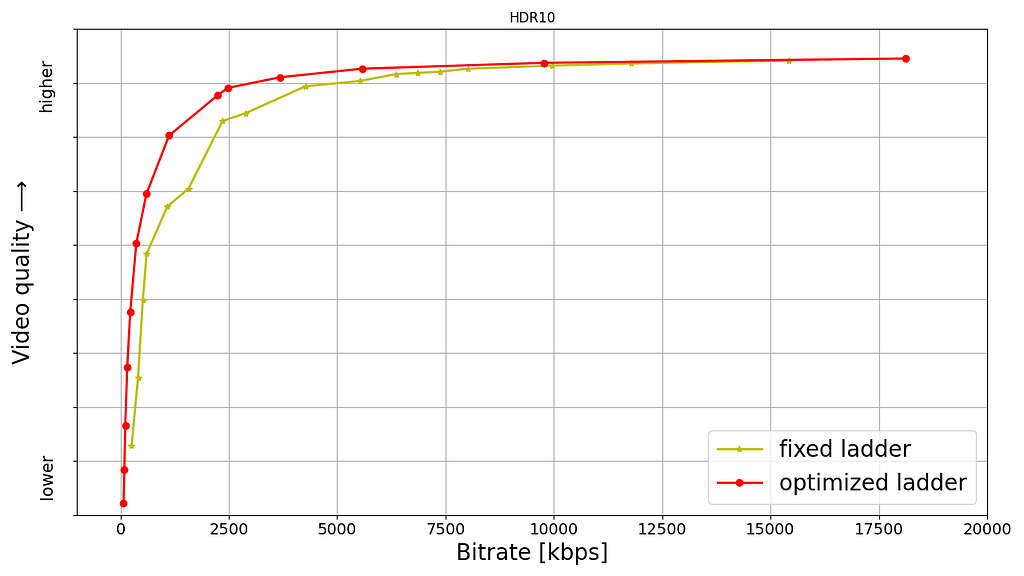
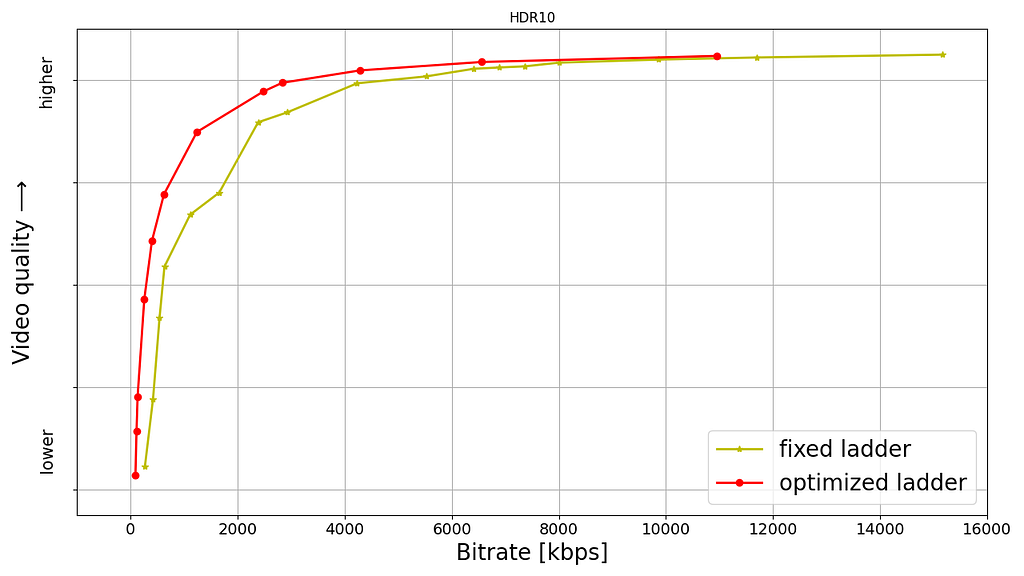
Shown below are rate versus quality examples for a couple of titles from our HDR catalog. We present two sets. Within each set we show curves for both Dolby Vision and HDR10. The first set (Fig. 2) corresponds to an episode from a gourmet cooking show incorporating fast-paced scenes from around the world. The second set (Fig. 3) corresponds to an episode from a relatively slower drama series; slower in terms of camera action. The optimized encodes are chosen from the convex hull formed by various rate-quality points corresponding to different bitrates, spatial resolutions and encoding recipes.

For brevity we skipped annotating ladder points with their spatial resolutions but the overall observations from our previous article on SDR-4K encode optimization apply here as well. The fixed ladder is slow in ramping up spatial resolution, so the quality stays almost flat among two successive 1080p points or two successive 4K points. On the other hand, the optimized ladder presents a sharper increase in quality with increasing bitrate.

The fixed ladder has predetermined 4K bitrates — 8, 10, 12 and 16 Mbps — it deterministically maxes out at 16 Mbps. On the other hand, the optimized ladder targets very high levels of quality on the top rung of the bitrate ladder, even at the cost of higher bitrates if the content is complex, thereby satisfying the most discerning viewers. In spite of reaching higher qualities than the fixed ladder, the HDR-DO ladder, on average, occupies only 58% of the storage space compared to fixed-bitrate ladder. This is achieved by more efficiently spacing the ladder points, especially in the high-bitrate region. After all, there is little to no benefit in packing multiple high-bitrate points so close to each other — for example, 3 QHD (2560×1440) points placed in the 6 to 7.5 Mbps range followed by the four 4K points at 8, 10, 12 and 16 Mbps, as was done on the fixed ladder.

Fig. 2: Rate-quality curves comparing fixed and optimized ladders corresponding to an episode from a gourmet cooking show incorporating fast-paced scenes from around the world.
Fig. 3: Rate-quality curves comparing fixed and optimized ladders corresponding to an episode from a drama series, which is slower in terms of camera action.

It is important to note that the fixed-ladder encodes had constant duration group-of-pictures (GoPs) and suffered from some inefficiency due to shot boundaries not aligning with Instantaneous Decoder Refresh (IDR) frames. The DO encodes are shot-based and so the IDR frames align with shot boundaries. For a given rate-quality operating point, the DO process helps allocate bits among the various shots while maximizing an overall objective function. Also thanks to the DO framework, within a given rate-quality operating point, challenging shots can and do burst in bitrate up to the codec level limit associated with that point.

Member benefits

We A/B tested the fixed and optimized ladders; first and foremost to make sure that devices in the field can handle the new streams and serving new streams doesn’t cause unintended playback issues. A/B testing also allows us to get a read on the improvement in quality of experience (QoE). Overall, the improvements can be summarized as:

  • 40% fewer rebuffers
  • Higher video quality for both bandwidth-constrained as well as unconstrained sessions
  • Lower initial bitrate
  • Higher initial quality
  • Lower play delay
  • Less variation in delivered video quality
  • Lower Internet data usage, especially on mobiles and tablets

Will HDR-VMAF be open-source?

Yes, we are committed to supporting the open-source community. The current implementation, however, is largely tailored to our internal pipelines. We are working to ensure it is versatile, stable, and easy-to-use for the community. Additionally, the current version has some algorithmic limitations that we are in the process of improving before the official release. When we do release it, HDR-VMAF will have higher accuracy in perceptual quality prediction, and be easier to use “out of the box”.

Summary

Thanks to the arrival of HDR-VMAF, we were able to optimize our HDR encodes. Fixed-ladder HDR encodes have been fully replaced by optimized ones, reducing storage footprint and Internet data usage — and most importantly, improving the video quality for our members. Improvements have been seen across all device categories ranging from TVs to mobiles and tablets.

Acknowledgments

We thank all the volunteers who participated in the subjective experiments. We also want to acknowledge the contributions of our colleagues from Dolby, namely Anustup Kumar Choudhury, Scott Daly, Robin Atkins, Ludovic Malfait, and Suzanne Farrell, who helped with preparations and conducting of the subjective tests.

We thank Matthew Donato, Adithya Prakash, Rich Gerber, Joe Drago, Benbuck Nason and Joseph McCormick for all the interesting discussions on HDR video.

We thank various internal teams at Netflix for the crucial roles they play:

  • The various client device and UI engineering teams at Netflix that manage the Netflix experience on various device platforms
  • The data science and engineering teams at Netflix that help us run and analyze A/B tests; we thank Chris Pham in particular for generating various data insights for the encoding team
  • The Playback Systems team that steers the Netflix experience for every client device including the experience served in various encoding A/B tests
  • The Open Connect team that manages Netflix’s own content delivery network
  • The Content Infrastructure and Solutions team that manages the compute platform that enables us to execute video encoding at scale
  • The Streaming Encoding Pipeline team that helps us orchestrate the generation of various streaming assets

Find our work interesting? Join us and be a part of the amazing team that brought you this tech-blog; open positions:

References

[1] L. Krasula, A. Choudhury, S. Daly, Z. Li, R. Atkins, L. Malfait, A. Mavlankar, “Subjective video quality for 4K HDR-WCG content using a browser-based approach for “at-home” testing,” Electronic Imaging, vol. 35, pp. 263–1–8 (2023) [online]
[2] A. Choudhury, L. Krasula, S. Daly, Z. Li, R. Atkins, L. Malfait, “Testing 4K HDR-WCG professional video content for subjective quality using a remote testing approach,” SMPTE Media Technology Summit 2023


All of Netflix’s HDR video streaming is now dynamically optimized was originally published in Netflix TechBlog on Medium, where people are continuing the conversation by highlighting and responding to this story.

Optimize AWS administration with IAM paths

Post Syndicated from David Rowe original https://aws.amazon.com/blogs/security/optimize-aws-administration-with-iam-paths/

As organizations expand their Amazon Web Services (AWS) environment and migrate workloads to the cloud, they find themselves dealing with many AWS Identity and Access Management (IAM) roles and policies. These roles and policies multiply because IAM fills a crucial role in securing and controlling access to AWS resources. Imagine you have a team creating an application. You create an IAM role to grant them access to the necessary AWS resources, such as Amazon Simple Storage Service (Amazon S3) buckets, Amazon Key Management Service (Amazon KMS) keys, and Amazon Elastic File Service (Amazon EFS) shares. With additional workloads and new data access patterns, the number of IAM roles and policies naturally increases. With the growing complexity of resources and data access patterns, it becomes crucial to streamline access and simplify the management of IAM policies and roles

In this blog post, we illustrate how you can use IAM paths to organize IAM policies and roles and provide examples you can use as a foundation for your own use cases.

How to use paths with your IAM roles and policies

When you create a role or policy, you create it with a default path. In IAM, the default path for resources is “/”. Instead of using a default path, you can create and use paths and nested paths as a structure to manage IAM resources. The following example shows an IAM role named S3Access in the path developer:

arn:aws:iam::111122223333:role/developer/S3Access

Service-linked roles are created in a reserved path /aws-service-role/. The following is an example of a service-linked role path.

arn:aws:iam::*:role/aws-service-role/SERVICE-NAME.amazonaws.com/SERVICE-LINKED-ROLE-NAME

The following example is of an IAM policy named S3ReadOnlyAccess in the path security:

arn:aws:iam::111122223333:policy/security/S3ReadOnlyAccess

Why use IAM paths with roles and policies?

By using IAM paths with roles and policies, you can create groupings and design a logical separation to simplify management. You can use these groupings to grant access to teams, delegate permissions, and control what roles can be passed to AWS services. In the following sections, we illustrate how to use IAM paths to create groupings of roles and policies by referencing a fictional company and its expansion of AWS resources.

First, to create roles and policies with a path, you use the IAM API or AWS Command Line Interface (AWS CLI) to run aws cli create-role.

The following is an example of an AWS CLI command that creates a role in an IAM path.

aws iam create-role --role-name <ROLE-NAME> --assume-role-policy-document file://assume-role-doc.json --path <PATH>

Replace <ROLE-NAME> and <PATH> in the command with your role name and role path respectively. Use a trust policy for the trust document that matches your use case. An example trust policy that allows Amazon Elastic Compute Cloud (Amazon EC2) instances to assume this role on your behalf is below:

{
    "Version": "2012-10-17",
    "Statement": [
        {
            "Effect": "Allow",
            "Action": [
                "sts:AssumeRole"
            ],
            "Principal": {
                "Service": [
                    "ec2.amazonaws.com"
                ]
            }
        }
    ]
}

The following is an example of an AWS CLI command that creates a policy in an IAM path.

aws iam create-policy --policy-name <POLICY-NAME> --path <PATH> --policy-document file://policy.json

IAM paths sample implementation

Let’s assume you’re a cloud platform architect at AnyCompany, a startup that’s planning to expand its AWS environment. By the end of the year, AnyCompany is going to expand from one team of developers to multiple teams, all of which require access to AWS. You want to design a scalable way to manage IAM roles and policies to simplify the administrative process to give permissions to each team’s roles. To do that, you create groupings of roles and policies based on teams.

Organize IAM roles with paths

AnyCompany decided to create the following roles based on teams.

Team name Role name IAM path Has access to
Security universal-security-readonly /security/ All resources
Team A database administrators DBA-role-A /teamA/ TeamA’s databases
Team B database administrators DBA-role-B /teamB/ TeamB’s databases

The following are example Amazon Resource Names (ARNs) for the roles listed above. In this example, you define IAM paths to create a grouping based on team names.

  1. arn:aws:iam::444455556666:role/security/universal-security-readonly-role
  2. arn:aws:iam::444455556666:role/teamA/DBA-role-A
  3. arn:aws:iam::444455556666:role/teamB/DBA-role-B

Note: Role names must be unique within your AWS account regardless of their IAM paths. You cannot have two roles named DBA-role, even if they’re in separate paths.

Organize IAM policies with paths

After you’ve created roles in IAM paths, you will create policies to provide permissions to these roles. The same path structure that was defined in the IAM roles is used for the IAM policies. The following is an example of how to create a policy with an IAM path. After you create the policy, you can attach the policy to a role using the attach-role-policy command.

aws iam create-policy --policy-name <POLICY-NAME> --policy-document file://policy-doc.json --path <PATH>
  1. arn:aws:iam::444455556666:policy/security/universal-security-readonly-policy
  2. arn:aws:iam::444455556666:policy/teamA/DBA-policy-A
  3. arn:aws:iam::444455556666:policy/teamB/DBA-policy-B

Grant access to groupings of IAM roles with resource-based policies

Now that you’ve created roles and policies in paths, you can more readily define which groups of principals can access a resource. In this deny statement example, you allow only the roles in the IAM path /teamA/ to act on your bucket, and you deny access to all other IAM principals. Rather than use individual roles to deny access to the bucket, which would require you to list every role, you can deny access to an entire group of principals by path. If you create a new role in your AWS account in the specified path, you don’t need to modify the policy to include them. The path-based deny statement will apply automatically.

{
  "Version": "2012-10-17",
  "Statement": [
    {
      "Action": "s3:*",
      "Effect": "Deny",
      "Resource": [
		"arn:aws:s3:::EXAMPLE-BUCKET",
		"arn:aws:s3:::EXAMPLE-BUCKET/*"
		],
      "Principal": "*",
"Condition": {
        "ArnNotLike": {
          "aws:PrincipalArn": "arn:aws:iam::*:role/teamA/*"
        }
      }
}
  ]
}

Delegate access with IAM paths

IAM paths can also enable teams to more safely create IAM roles and policies and allow teams to only use the roles and policies contained by the paths. Paths can help prevent teams from privilege escalation by denying the use of roles that don’t belong to their team.

Continuing the example above, AnyCompany established a process that allows each team to create their own IAM roles and policies, providing they’re in a specified IAM path. For example, AnyCompany allows team A to create IAM roles and policies for team A in the path /teamA/:

  1. arn:aws:iam::444455556666:role/teamA/<role-name>
  2. arn:aws:iam::444455556666:policy/teamA/<policy-name>

Using IAM paths, AnyCompany can allow team A to more safely create and manage their own IAM roles and policies and safely pass those roles to AWS services using the iam:PassRole permission.

At AnyCompany, four IAM policies using IAM paths allow teams to more safely create and manage their own IAM roles and policies. Following recommended best practices, AnyCompany uses infrastructure as code (IaC) for all IAM role and policy creation. The four path-based policies that follow will be attached to each team’s CI/CD pipeline role, which has permissions to create roles. The following example focuses on team A, and how these policies enable them to self-manage their IAM credentials.

  1. Create a role in the path and modify inline policies on the role: This policy allows three actions: iam:CreateRole, iam:PutRolePolicy, and iam:DeleteRolePolicy. When this policy is attached to a principal, that principal is allowed to create roles in the IAM path /teamA/ and add and delete inline policies on roles in that IAM path.
    {
      "Version": "2012-10-17",
      "Statement": [
    {
            "Effect": "Allow",
            "Action": [
                "iam:CreateRole",
                "iam:PutRolePolicy",
                "iam:DeleteRolePolicy"
            ],
            "Resource": "arn:aws:iam::444455556666:role/teamA/*"
        }
    ]
    }

  2. Add and remove managed policies: The second policy example allows two actions: iam:AttachRolePolicy and iam:DetachRolePolicy. This policy allows a principal to attach and detach managed policies in the /teamA/ path to roles that are created in the /teamA/ path.
    {
      "Version": "2012-10-17",
      "Statement": [
    
    {
            "Effect": "Allow",
            "Action": [
                "iam:AttachRolePolicy",
                "iam:DetachRolePolicy"
            ],
            "Resource": "arn:aws:iam::444455556666:role/teamA/*",
            "Condition": {
                "ArnLike": {
                    "iam:PolicyARN": "arn:aws:iam::444455556666:policy/teamA/*"
                }          
            }
        }
    ]}

  3. Delete roles, tag and untag roles, read roles: The third policy allows a principal to delete roles, tag and untag roles, and retrieve information about roles that are created in the /teamA/ path.
    {
      "Version": "2012-10-17",
      "Statement": [
    
    
    {
            "Effect": "Allow",
            "Action": [
                "iam:DeleteRole",
                "iam:TagRole",
                "iam:UntagRole",
                "iam:GetRole",
                "iam:GetRolePolicy"
            ],
            "Resource": "arn:aws:iam::444455556666:role/teamA/*"
        }]}

  4. Policy management in IAM path: The final policy example allows access to create, modify, get, and delete policies that are created in the /teamA/ path. This includes creating, deleting, and tagging policies.
    {
      "Version": "2012-10-17",
      "Statement": [
    
    {
            "Effect": "Allow",
            "Action": [
                "iam:CreatePolicy",
                "iam:DeletePolicy",
                "iam:CreatePolicyVersion",            
                "iam:DeletePolicyVersion",
                "iam:GetPolicy",
                "iam:TagPolicy",
                "iam:UntagPolicy",
                "iam:SetDefaultPolicyVersion",
                "iam:ListPolicyVersions"
             ],
            "Resource": "arn:aws:iam::444455556666:policy/teamA/*"
        }]}

Safely pass roles with IAM paths and iam:PassRole

To pass a role to an AWS service, a principal must have the iam:PassRole permission. IAM paths are the recommended option to restrict which roles a principal can pass when granted the iam:PassRole permission. IAM paths help verify principals can only pass specific roles or groupings of roles to an AWS service.

At AnyCompany, the security team wants to allow team A to add IAM roles to an instance profile and attach it to Amazon EC2 instances, but only if the roles are in the /teamA/ path. The IAM action that allows team A to provide the role to the instance is iam:PassRole. The security team doesn’t want team A to be able to pass other roles in the account, such as an administrator role.

The policy that follows allows passing of a role that was created in the /teamA/ path and does not allow the passing of other roles such as an administrator role.

{
    "Version": "2012-10-17",
    "Statement": [{
        "Effect": "Allow",
        "Action": "iam:PassRole",
        "Resource": "arn:aws:iam::444455556666:role/teamA/*"
    }]
}

How to create preventative guardrails for sensitive IAM paths

You can use service control policies (SCP) to restrict access to sensitive roles and policies within specific IAM paths. You can use an SCP to prevent the modification of sensitive roles and policies that are created in a defined path.

You will see the IAM path under the resource and condition portion of the statement. Only the role named IAMAdministrator created in the /security/ path can create or modify roles in the security path. This SCP allows you to delegate IAM role and policy management to developers with confidence that they won’t be able to create, modify, or delete any roles or policies in the security path.

{
    "Version": "2012-10-17",
    "Statement": [
        {
	    "Sid": "RestrictIAMWithPathManagement",
            "Effect": "Deny",
            "Action": [
                "iam:AttachRolePolicy",
                "iam:CreateRole",
                "iam:DeleteRole",
                "iam:DeleteRolePermissionsBoundary",
                "iam:DeleteRolePolicy",
                "iam:DetachRolePolicy",
                "iam:PutRolePermissionsBoundary",
                "iam:PutRolePolicy",
                "iam:UpdateRole",
                "iam:UpdateAssumeRolePolicy",
                "iam:UpdateRoleDescription",
                "sts:AssumeRole",
                "iam:TagRole",
                "iam:UntagRole"
            ],
            "Resource": [
                "arn:aws:iam::*:role/security/* "
            ],
            "Condition": {
                "ArnNotLike": {
                    "aws:PrincipalARN": "arn:aws:iam::444455556666:role/security/IAMAdministrator"
                }
            }
        }
    ]
}

This next example shows you how you can safely exempt IAM roles created in the security path from specific controls in your organization. The policy denies all roles except the roles created in the /security/ IAM path to close member accounts.

{
  "Version": "2012-10-17",
  "Statement": [
    {
      "Sid": "PreventCloseAccount",
      "Effect": "Deny",
      "Action": "organizations:CloseAccount",
      "Resource": "*",
      "Condition": {
        "ArnNotLikeIfExists": {
          "aws:PrincipalArn": [
            "arn:aws:iam::*:role/security/*"
          ]
        }
      }
    }
  ]
}

Additional considerations when using IAM paths

You should be aware of some additional considerations when you start using IAM paths.

  1. Paths are immutable for IAM roles and policies. To change a path, you must delete the IAM resource and recreate the IAM resource in the alternative path. Deleting roles or instance profiles has step-by-step instructions to delete an IAM resource.
  2. You can only create IAM paths using AWS API or command line tools. You cannot create IAM paths with the AWS console.
  3. IAM paths aren’t added to the uniqueness of the role name. Role names must be unique within your account without the path taken into consideration.
  4. AWS reserves several paths including /aws-service-role/ and you cannot create roles in this path.

Conclusion

IAM paths provide a powerful mechanism for effectively grouping IAM resources. Path-based groupings can streamline access management across AWS services. In this post, you learned how to use paths with IAM principals to create structured access with IAM roles, how to delegate and segregate access within an account, and safely pass roles using iam:PassRole. These techniques can empower you to fine-tune your AWS access management and help improve security while streamlining operational workflows.

You can use the following references to help extend your knowledge of IAM paths. This post references the processes outlined in the user guides and blog post, and sources the IAM policies from the GitHub repositories.

  1. AWS Organizations User Guide, SCP General Examples
  2. AWS-Samples Service-control-policy-examples GitHub Repository
  3. AWS Security Blog: IAM Policy types: How and when to use them
  4. AWS-Samples how-and-when-to-use-aws-iam-policy-blog-samples GitHub Repository

 
If you have feedback about this post, submit comments in the Comments section below. If you have questions about this post, contact AWS Support.

Want more AWS Security news? Follow us on Twitter.

David Rowe

David Rowe

As a Senior Solutions Architect, David unites diverse global teams to drive cloud transformation through strategies and intuitive identity solutions. He creates consensus, guiding teams to adopt emerging technologies. He thrives on bringing together cross-functional perspectives to transform vision into reality in dynamic industries.

Build and manage your modern data stack using dbt and AWS Glue through dbt-glue, the new “trusted” dbt adapter

Post Syndicated from Noritaka Sekiyama original https://aws.amazon.com/blogs/big-data/build-and-manage-your-modern-data-stack-using-dbt-and-aws-glue-through-dbt-glue-the-new-trusted-dbt-adapter/

dbt is an open source, SQL-first templating engine that allows you to write repeatable and extensible data transforms in Python and SQL. dbt focuses on the transform layer of extract, load, transform (ELT) or extract, transform, load (ETL) processes across data warehouses and databases through specific engine adapters to achieve extract and load functionality. It enables data engineers, data scientists, and analytics engineers to define the business logic with SQL select statements and eliminates the need to write boilerplate data manipulation language (DML) and data definition language (DDL) expressions. dbt lets data engineers quickly and collaboratively deploy analytics code following software engineering best practices like modularity, portability, continuous integration and continuous delivery (CI/CD), and documentation.

dbt is predominantly used by data warehouses (such as Amazon Redshift) customers who are looking to keep their data transform logic separate from storage and engine. We have seen a strong customer demand to expand its scope to cloud-based data lakes because data lakes are increasingly the enterprise solution for large-scale data initiatives due to their power and capabilities.

In 2022, AWS published a dbt adapter called dbt-glue—the open source, battle-tested dbt AWS Glue adapter that allows data engineers to use dbt for cloud-based data lakes along with data warehouses and databases, paying for just the compute they need. The dbt-glue adapter democratized access for dbt users to data lakes, and enabled many users to effortlessly run their transformation workloads on the cloud with the serverless data integration capability of AWS Glue. From the launch of the adapter, AWS has continued investing into dbt-glue to cover more requirements.

Today, we are pleased to announce that the dbt-glue adapter is now a trusted adapter based on our strategic collaboration with dbt Labs. Trusted adapters are adapters not maintained by dbt Labs, but adaptors that that dbt Lab is comfortable recommending to users for use in production.

The key capabilities of the dbt-glue adapter are as follows:

  • Runs SQL as Spark SQL on AWS Glue interactive sessions
  • Manages table definitions on the AWS Glue Data Catalog
  • Supports open table formats such as Apache Hudi, Delta Lake, and Apache Iceberg
  • Supports AWS Lake Formation permissions for fine-grained access control

In addition to those capabilities, the dbt-glue adapter is designed to optimize resource utilization with several techniques on top of AWS Glue interactive sessions.

This post demonstrates how the dbt-glue adapter helps your workload, and how you can build a modern data stack using dbt and AWS Glue using the dbt-glue adapter.

Common use cases

One common use case for using dbt-glue is if a central analytics team at a large corporation is responsible for monitoring operational efficiency. They ingest application logs into raw Parquet tables in an Amazon Simple Storage Service (Amazon S3) data lake. Additionally, they extract organized data from operational systems capturing the company’s organizational structure and costs of diverse operational components that they stored in the raw zone using Iceberg tables to maintain the original schema, facilitating easy access to the data. The team uses dbt-glue to build a transformed gold model optimized for business intelligence (BI). The gold model joins the technical logs with billing data and organizes the metrics per business unit. The gold model uses Iceberg’s ability to support data warehouse-style modeling needed for performant BI analytics in a data lake. The combination of Iceberg and dbt-glue allows the team to efficiently build a data model that’s ready to be consumed.

Another common use case is when an analytics team in a company that has an S3 data lake creates a new data product in order to enrich its existing data from its data lake with medical data. Let’s say that this company is located in Europe and the data product must comply with the GDPR. For this, the company uses Iceberg to meet needs such as the right to be forgotten and the deletion of data. The company uses dbt to model its data product on its existing data lake due to its compatibility with AWS Glue and Iceberg and the simplicity that the dbt-glue adapter brings to the use of this storage format.

How dbt and dbt-glue work

The following are key dbt features:

  • Project – A dbt project enforces a top-level structure on the staging, models, permissions, and adapters. A project can be checked into a GitHub repo for version control.
  • SQL – dbt relies on SQL select statements for defining data transformation logic. Instead of raw SQL, dbt offers templatized SQL (using Jinja) that allows code modularity. Instead of having to copy/paste SQL in multiple places, data engineers can define modular transforms and call those from other places within the project. Having a modular pipeline helps data engineers collaborate on the same project.
  • Models – dbt models are primarily written as a SELECT statement and saved as a .sql file. Data engineers define dbt models for their data representations. To learn more, refer to About dbt models.
  • Materializations – Materializations are strategies for persisting dbt models in a warehouse. There are five types of materializations built into dbt: table, view, incremental, ephemeral, and materialized view. To learn more, refer to Materializations and Incremental models.
  • Data lineage – dbt tracks data lineage, allowing you to understand the origin of data and how it flows through different transformations. dbt also supports impact analysis, which helps identify the downstream effects of changes.

The high-level data flow is as follows:

  1. Data engineers ingest data from data sources to raw tables and define table definitions for the raw tables.
  2. Data engineers write dbt models with templatized SQL.
  3. The dbt adapter converts dbt models to SQL statements compatible in a data warehouse.
  4. The data warehouse runs the SQL statements to create intermediate tables or final tables, views, or materialized views.

The following diagram illustrates the architecture.

dbt-glue works with the following steps:

  1. The dbt-glue adapter converts dbt models to SQL statements compatible in Spark SQL.
  2. AWS Glue interactive sessions run the SQL statements to create intermediate tables or final tables, views, or materialized views.
  3. dbt-glue supports csv, parquet, hudi, delta, and iceberg as fileformat.
  4. On the dbt-glue adapter, table or incremental are commonly used for materializations at the destination. There are three strategies for incremental materialization. The merge strategy requires hudi, delta, or iceberg. With the other two strategies, append and insert_overwrite, you can use csv, parquet, hudi, delta, or iceberg.

The following diagram illustrates this architecture.

Example use case

In this post, we use the data from the New York City Taxi Records dataset. This dataset is available in the Registry of Open Data on AWS (RODA), which is a repository containing public datasets from AWS resources. The raw Parquet table records in this dataset stores trip records.

The objective is to create the following three tables, which contain metrics based on the raw table:

  • silver_avg_metrics – Basic metrics based on NYC Taxi Open Data for the year 2016
  • gold_passengers_metrics – Metrics per passenger based on the silver metrics table
  • gold_cost_metrics – Metrics per cost based on the silver metrics table

The final goal is to create two well-designed gold tables that store already aggregated results in Iceberg format for ad hoc queries through Amazon Athena.

Prerequisites

The instruction requires following prerequisites:

  • An AWS Identity and Access Management (IAM) role with all the mandatory permissions to run an AWS Glue interactive session and the dbt-glue adapter
  • An AWS Glue database and table to store the metadata related to the NYC taxi records dataset
  • An S3 bucket to use as output and store the processed data
  • An Athena configuration (a workgroup and S3 bucket to store the output) to explore the dataset
  • An AWS Lambda function (created as an AWS CloudFormation custom resource) that updates all the partitions in the AWS Glue table

With these prerequisites, we simulate the situation that data engineers have already ingested data from data sources to raw tables, and defined table definitions for the raw tables.

For ease of use, we prepared a CloudFormation template. This template deploys all the required infrastructure. To create these resources, choose Launch Stack in the us-east-1 Region, and follow the instructions:

Install dbt, the dbt CLI, and the dbt adaptor

The dbt CLI is a command line interface for running dbt projects. It’s free to use and available as an open source project. Install dbt and the dbt CLI with the following code:

$ pip3 install --no-cache-dir dbt-core

For more information, refer to How to install dbt, What is dbt?, and Viewpoint.

Install the dbt adapter with the following code:

$ pip3 install --no-cache-dir dbt-glue

Create a dbt project

Complete the following steps to create a dbt project:

  1. Run the dbt init command to create and initialize a new empty dbt project:
    $ dbt init

  2. For the project name, enter dbt_glue_demo.
  3. For the database, choose glue.

Now the empty project has been created. The directory structure is shown as follows:

$ cd dbt_glue_demo 
$ tree .
.
├── README.md
├── analyses
├── dbt_project.yml
├── macros
├── models
│   └── example
│       ├── my_first_dbt_model.sql
│       ├── my_second_dbt_model.sql
│       └── schema.yml
├── seeds
├── snapshots
└── tests

Create a source

The next step is to create a source table definition. We add models/source_tables.yml with the following contents:

version: 2

sources:
  - name: data_source
    schema: nyctaxi

    tables:
      - name: records

This source definition corresponds to the AWS Glue table nyctaxi.records, which we created in the CloudFormation stack.

Create models

In this step, we create a dbt model that represents the average values for trip duration, passenger count, trip distance, and total amount of charges. Complete the following steps:

  1. Create the models/silver/ directory.
  2. Create the file models/silver/silver_avg_metrics.sql with the following contents:
    WITH source_avg as ( 
        SELECT avg((CAST(dropoff_datetime as LONG) - CAST(pickup_datetime as LONG))/60) as avg_duration 
        , avg(passenger_count) as avg_passenger_count 
        , avg(trip_distance) as avg_trip_distance 
        , avg(total_amount) as avg_total_amount
        , year
        , month 
        , type
        FROM {{ source('data_source', 'records') }} 
        WHERE year = "2016"
        AND dropoff_datetime is not null 
        GROUP BY year, month, type
    ) 
    SELECT *
    FROM source_avg

  3. Create the file models/silver/schema.yml with the following contents:
    version: 2
    
    models:
      - name: silver_avg_metrics
        description: This table has basic metrics based on NYC Taxi Open Data for the year 2016
    
        columns:
          - name: avg_duration
            description: The average duration of a NYC Taxi trip
    
          - name: avg_passenger_count
            description: The average number of passenger per NYC Taxi trip
    
          - name: avg_trip_distance
            description: The average NYC Taxi trip distance
    
          - name: avg_total_amount
            description: The avarage amount of a NYC Taxi trip
    
          - name: year
            description: The year of the NYC Taxi trip
    
          - name: month
            description: The month of the NYC Taxi trip 
    
          - name: type
            description: The type of the NYC Taxi 

  4. Create the models/gold/ directory.
  5. Create the file models/gold/gold_cost_metrics.sql with the following contents:
    {{ config(
        materialized='incremental',
        incremental_strategy='merge',
        unique_key=["year", "month", "type"],
        file_format='iceberg',
        iceberg_expire_snapshots='False',
        table_properties={'format-version': '2'}
    ) }}
    SELECT (avg_total_amount/avg_trip_distance) as avg_cost_per_distance
    , (avg_total_amount/avg_duration) as avg_cost_per_minute
    , year
    , month 
    , type 
    FROM {{ ref('silver_avg_metrics') }}

  6. Create the file models/gold/gold_passengers_metrics.sql with the following contents:
    {{ config(
        materialized='incremental',
        incremental_strategy='merge',
        unique_key=["year", "month", "type"],
        file_format='iceberg',
        iceberg_expire_snapshots='False',
        table_properties={'format-version': '2'}
    ) }}
    SELECT (avg_total_amount/avg_passenger_count) as avg_cost_per_passenger
    , (avg_duration/avg_passenger_count) as avg_duration_per_passenger
    , (avg_trip_distance/avg_passenger_count) as avg_trip_distance_per_passenger
    , year
    , month 
    , type 
    FROM {{ ref('silver_avg_metrics') }}

  7. Create the file models/gold/schema.yml with the following contents:
    version: 2
    
    models:
      - name: gold_cost_metrics
        description: This table has metrics per cost based on NYC Taxi Open Data
    
        columns:
          - name: avg_cost_per_distance
            description: The average cost per distance of a NYC Taxi trip
    
          - name: avg_cost_per_minute
            description: The average cost per minute of a NYC Taxi trip
    
          - name: year
            description: The year of the NYC Taxi trip
    
          - name: month
            description: The month of the NYC Taxi trip
    
          - name: type
            description: The type of the NYC Taxi
    
      - name: gold_passengers_metrics
        description: This table has metrics per passenger based on NYC Taxi Open Data
    
        columns:
          - name: avg_cost_per_passenger
            description: The average cost per passenger for a NYC Taxi trip
    
          - name: avg_duration_per_passenger
            description: The average number of passenger per NYC Taxi trip
    
          - name: avg_trip_distance_per_passenger
            description: The average NYC Taxi trip distance
    
          - name: year
            description: The year of the NYC Taxi trip
    
          - name: month
            description: The month of the NYC Taxi trip 
    
          - name: type
            description: The type of the NYC Taxi

  8. Remove the models/example/ folder, because it’s just an example created in the dbt init command.

Configure the dbt project

dbt_project.yml is a key configuration file for dbt projects. It contains the following code:

models:
  dbt_glue_demo:
    # Config indicated by + and applies to all files under models/example/
    example:
      +materialized: view

We configure dbt_project.yml to replace the preceding code with the following:

models:
  dbt_glue_demo:
    silver:
      +materialized: table

This is because that we want to materialize the models under silver as Parquet tables.

Configure a dbt profile

A dbt profile is a configuration that specifies how to connect to a particular database. The profiles are defined in the profiles.yml file within a dbt project.

Complete the following steps to configure a dbt profile:

  1. Create the profiles directory.
  2. Create the file profiles/profiles.yml with the following contents:
    dbt_glue_demo:
      target: dev
      outputs:
        dev:
          type: glue
          query-comment: demo-nyctaxi
          role_arn: "{{ env_var('DBT_ROLE_ARN') }}"
          region: us-east-1
          workers: 5
          worker_type: G.1X
          schema: "dbt_glue_demo_nyc_metrics"
          database: "dbt_glue_demo_nyc_metrics"
          session_provisioning_timeout_in_seconds: 120
          location: "{{ env_var('DBT_S3_LOCATION') }}"

  3. Create the profiles/iceberg/ directory.
  4. Create the file profiles/iceberg/profiles.yml with the following contents:
    dbt_glue_demo:
      target: dev
      outputs:
        dev:
          type: glue
          query-comment: demo-nyctaxi
          role_arn: "{{ env_var('DBT_ROLE_ARN') }}"
          region: us-east-1
          workers: 5
          worker_type: G.1X
          schema: "dbt_glue_demo_nyc_metrics"
          database: "dbt_glue_demo_nyc_metrics"
          session_provisioning_timeout_in_seconds: 120
          location: "{{ env_var('DBT_S3_LOCATION') }}"
          datalake_formats: "iceberg"
          conf: --conf spark.sql.catalog.glue_catalog=org.apache.iceberg.spark.SparkCatalog --conf spark.sql.catalog.glue_catalog.warehouse="{{ env_var('DBT_S3_LOCATION') }}"warehouse/ --conf spark.sql.catalog.glue_catalog.catalog-impl=org.apache.iceberg.aws.glue.GlueCatalog --conf spark.sql.catalog.glue_catalog.io-impl=org.apache.iceberg.aws.s3.S3FileIO --conf spark.sql.extensions=org.apache.iceberg.spark.extensions.IcebergSparkSessionExtensions"

The last two lines are added for setting Iceberg configurations on AWS Glue interactive sessions.

Run the dbt project

Now it’s time to run the dbt project. Complete the following steps:

  1. To run the project dbt, you should be in the project folder:
    $ cd dbt_glue_demo

  2. The project requires you to set environment variables in order to run on the AWS account:
    $ export DBT_ROLE_ARN="arn:aws:iam::$(aws sts get-caller-identity --query "Account" --output text):role/GlueInteractiveSessionRole"
    $ export DBT_S3_LOCATION="s3://aws-dbt-glue-datalake-$(aws sts get-caller-identity --query "Account" --output text)-us-east-1"

  3. Make sure the profile is set up correctly from the command line:
    $ dbt debug --profiles-dir profiles
    ...
    05:34:22 Connection test: [OK connection ok]
    05:34:22 All checks passed!

If you see any failures, check if you provided the correct IAM role ARN and S3 location in Step 2.

  1. Run the models with the following code:
    $ dbt run -m silver --profiles-dir profiles
    $ dbt run -m gold --profiles-dir profiles/iceberg/

Now the tables are successfully created in the AWS Glue Data Catalog, and the data is materialized in the Amazon S3 location.

You can verify those tables by opening the AWS Glue console, choosing Databases in the navigation pane, and opening dbt_glue_demo_nyc_metrics.

Query materialized tables through Athena

Let’s query the target table using Athena to verify the materialized tables. Complete the following steps:

  1. On the Athena console, switch the workgroup to athena-dbt-glue-aws-blog.
  2. If the workgroup athena-dbt-glue-aws-blog settings dialog box appears, choose Acknowledge.
  3. Use the following query to explore the metrics created by the dbt project:
    SELECT cm.avg_cost_per_minute
        , cm.avg_cost_per_distance
        , pm.avg_cost_per_passenger
        , cm.year
        , cm.month
        , cm.type
    FROM "dbt_glue_demo_nyc_metrics"."gold_passengers_metrics" pm
    LEFT JOIN "dbt_glue_demo_nyc_metrics"."gold_cost_metrics" cm
        ON cm.type = pm.type
        AND cm.year = pm.year
        AND cm.month = pm.month
    WHERE cm.type = 'yellow'
        AND cm.year = '2016'
        AND cm.month = '6'

The following screenshot shows the results of this query.

Review dbt documentation

Complete the following steps to review your documentation:

  1. Generate the following documentation for the project:
    $ dbt docs generate --profiles-dir profiles/iceberg
    11:41:51  Running with dbt=1.7.1
    11:41:51  Registered adapter: glue=1.7.1
    11:41:51  Unable to do partial parsing because profile has changed
    11:41:52  Found 3 models, 1 source, 0 exposures, 0 metrics, 478 macros, 0 groups, 0 semantic models
    11:41:52  
    11:41:53  Concurrency: 1 threads (target='dev')
    11:41:53  
    11:41:53  Building catalog
    11:43:32  Catalog written to /Users/username/Documents/workspace/dbt_glue_demo/target/catalog.json

  2. Run the following command to open the documentation on your browser:
    $ dbt docs serve --profiles-dir profiles/iceberg

  3. In the navigation pane, choose gold_cost_metrics under dbt_glue_demo/models/gold.

You can see the detailed view of the model gold_cost_metrics, as shown in the following screenshot.

  1. To see the lineage graph, choose the circle icon at the bottom right.

Clean up

To clean up your environment, complete the following steps:

  1. Delete the database created by dbt:
    $ aws glue delete-database —name dbt_glue_demo_nyc_metrics

  2. Delete all generated data:
    $ aws s3 rm s3://aws-dbt-glue-datalake-$(aws sts get-caller-identity —query "Account" —output text)-us-east-1/ —recursive
    $ aws s3 rm s3://aws-athena-dbt-glue-query-results-$(aws sts get-caller-identity —query "Account" —output text)-us-east-1/ —recursive

  3. Delete the CloudFormation stack:
    $ aws cloudformation delete-stack —stack-name dbt-demo

Conclusion

This post demonstrated how the dbt-glue adapter helps your workload, and how you can build a modern data stack using dbt and AWS Glue using the dbt-glue adapter. You learned the end-to-end operations and data flow for data engineers to build and manage a data stack using dbt and the dbt-glue adapter. To report issues or request a feature enhancement, feel free to open an issue on GitHub.


About the authors

Noritaka Sekiyama is a Principal Big Data Architect on the AWS Glue team at Amazon Web Services. He works based in Tokyo, Japan. He is responsible for building software artifacts to help customers. In his spare time, he enjoys cycling with his road bike.

Benjamin Menuet is a Senior Data Architect on the AWS Professional Services team at Amazon Web Services. He helps customers develop data and analytics solutions to accelerate their business outcomes. Outside of work, Benjamin is a trail runner and has finished some iconic races like the UTMB.

Akira Ajisaka is a Senior Software Development Engineer on the AWS Glue team. He likes open source software and distributed systems. In his spare time, he enjoys playing arcade games.

Kinshuk Pahare is a Principal Product Manager on the AWS Glue team at Amazon Web Services.

Jason Ganz is the manager of the Developer Experience (DX) team at dbt Labs
Package and deploy models faster with new tools and guided workflows in Amazon SageMaker

Post Syndicated from Antje Barth original https://aws.amazon.com/blogs/aws/package-and-deploy-models-faster-with-new-tools-and-guided-workflows-in-amazon-sagemaker/

I’m happy to share that Amazon SageMaker now comes with an improved model deployment experience to help you deploy traditional machine learning (ML) models and foundation models (FMs) faster.

As a data scientist or ML practitioner, you can now use the new ModelBuilder class in the SageMaker Python SDK to package models, perform local inference to validate runtime errors, and deploy to SageMaker from your local IDE or SageMaker Studio notebooks.

In SageMaker Studio, new interactive model deployment workflows give you step-by-step guidance on which instance type to choose to find the most optimal endpoint configuration. SageMaker Studio also provides additional interfaces to add models, test inference, and enable auto scaling policies on the deployed endpoints.

New tools in SageMaker Python SDK
The SageMaker Python SDK has been updated with new tools, including ModelBuilder and SchemaBuilder classes that unify the experience of converting models into SageMaker deployable models across ML frameworks and model servers. Model builder automates the model deployment by selecting a compatible SageMaker container and capturing dependencies from your development environment. Schema builder helps to manage serialization and deserialization tasks of model inputs and outputs. You can use the tools to deploy the model in your local development environment to experiment with it, fix any runtime errors, and when ready, transition from local testing to deploy the model on SageMaker with a single line of code.

Amazon SageMaker ModelBuilder

Let me show you how this works. In the following example, I choose the Falcon-7B model from the Hugging Face model hub. I first deploy the model locally, run a sample inference, perform local benchmarking to find the optimal configuration, and finally deploy the model with the suggested configuration to SageMaker.

First, import the updated SageMaker Python SDK and define a sample model input and output that matches the prompt format for the selected model.

import sagemaker
from sagemaker.serve.builder.model_builder import ModelBuilder
from sagemaker.serve.builder.schema_builder import SchemaBuilder
from sagemaker.serve import Mode

prompt = "Falcons are"
response = "Falcons are small to medium-sized birds of prey related to hawks and eagles."

sample_input = {
    "inputs": prompt,
    "parameters": {"max_new_tokens": 32}
}

sample_output = [{"generated_text": response}]

Then, create a ModelBuilder instance with the Hugging Face model ID, a SchemaBuilder instance with the sample model input and output, define a local model path, and set the mode to LOCAL_CONTAINER to deploy the model locally. The schema builder generates the required functions for serializing and deserializing the model inputs and outputs.

model_builder = ModelBuilder(
    model="tiiuae/falcon-7b",
    schema_builder=SchemaBuilder(sample_input, sample_output),
    model_path="/path/to/falcon-7b",
    mode=Mode.LOCAL_CONTAINER,
	env_vars={"HF_TRUST_REMOTE_CODE": "True"}
)

Next, call build() to convert the PyTorch model into a SageMaker deployable model. The build function generates the required artifacts for the model server, including the inferency.py and serving.properties files.

local_mode_model = model_builder.build()

For FMs, such as Falcon, you can optionally run tune() in local container mode that performs local benchmarking to find the optimal model serving configuration. This includes the tensor parallel degree that specifies the number of GPUs to use if your environment has multiple GPUs available. Once ready, call deploy() to deploy the model in your local development environment.

tuned_model = local_mode_model.tune()
tuned_model.deploy()

Let’s test the model.

updated_sample_input = model_builder.schema_builder.sample_input
print(updated_sample_input)

{'inputs': 'Falcons are',
 'parameters': {'max_new_tokens': 32}}
 
local_tuned_predictor.predict(updated_sample_input)[0]["generated_text"]

In my demo, the model returns the following response:

a type of bird that are known for their sharp talons and powerful beaks. They are also known for their ability to fly at high speeds […]

When you’re ready to deploy the model on SageMaker, call deploy() again, set the mode to SAGEMAKLER_ENDPOINT, and provide an AWS Identity and Access Management (IAM) role with appropriate permissions.

sm_predictor = tuned_model.deploy(
    mode=Mode.SAGEMAKER_ENDPOINT, 
	role="arn:aws:iam::012345678910:role/role_name"
)

This starts deploying your model on a SageMaker endpoint. Once the endpoint is ready, you can run predictions.

new_input = {'inputs': 'Eagles are','parameters': {'max_new_tokens': 32}}
sm_predictor.predict(new_input)[0]["generated_text"])

New SageMaker Studio model deployment experience
You can start the new interactive model deployment workflows by selecting one or more models to deploy from the models landing page or SageMaker JumpStart model details page or by creating a new endpoint from the endpoints details page.

Amazon SageMaker - New Model Deployment Experience

The new workflows help you quickly deploy the selected model(s) with minimal inputs. If you used SageMaker Inference Recommender to benchmark your model, the dropdown will show instance recommendations from that benchmarking.

Model deployment experience in SageMaker Studio

Without benchmarking your model, the dropdown will display prospective instances that SageMaker predicts could be a good fit based on its own heuristics. For some of the most popular SageMaker JumpStart models, you’ll see an AWS pretested optimal instance type. For other models, you’ll see generally recommended instance types. For example, if I select the Falcon 40B Instruct model in SageMaker JumpStart, I can see the recommended instance types.

Model deployment experience in SageMaker Studio

Model deployment experience in SageMaker Studio

However, if I want to optimize the deployment for cost or performance to meet my specific use cases, I could open the Alternate configurations panel to view more options based on data from before benchmarking.

Model deployment experience in SageMaker Studio

Once deployed, you can test inference or manage auto scaling policies.

Model deployment experience in SageMaker Studio

Things to know
Here are a couple of important things to know:

Supported ML models and frameworks – At launch, the new SageMaker Python SDK tools support model deployment for XGBoost and PyTorch models. You can deploy FMs by specifying the Hugging Face model ID or SageMaker JumpStart model ID using the SageMaker LMI container or Hugging Face TGI-based container. You can also bring your own container (BYOC) or deploy models using the Triton model server in ONNX format.

Now available
The new set of tools is available today in all AWS Regions where Amazon SageMaker real-time inference is available. There is no cost to use the new set of tools; you pay only for any underlying SageMaker resources that get created.

Learn more

Get started
Explore the new SageMaker model deployment experience in the AWS Management Console today!

— Antje

Use natural language to explore and prepare data with a new capability of Amazon SageMaker Canvas

Post Syndicated from Irshad Buchh original https://aws.amazon.com/blogs/aws/use-natural-language-to-explore-and-prepare-data-with-a-new-capability-of-amazon-sagemaker-canvas/

Today, I’m happy to introduce the ability to use natural language instructions in Amazon SageMaker Canvas to explore, visualize, and transform data for machine learning (ML).

SageMaker Canvas now supports using foundation model- (FM) powered natural language instructions to complement its comprehensive data preparation capabilities for data exploration, analysis, visualization, and transformation. Using natural language instructions, you can now explore and transform your data to build highly accurate ML models. This new capability is powered by Amazon Bedrock.

Data is the foundation for effective machine learning, and transforming raw data to make it suitable for ML model building and generating predictions is key to better insights. Analyzing, transforming, and preparing data to build ML models is often the most time-consuming part of the ML workflow. With SageMaker Canvas, data preparation for ML is seamless and fast with 300+ built-in transforms, analyses, and an in-depth data quality insights report without writing any code. Starting today, the process of data exploration and preparation is faster and simpler in SageMaker Canvas using natural language instructions for exploring, visualizing, and transforming data.

Data preparation tasks are now accelerated through a natural language experience using queries and responses. You can quickly get started with contextual, guided prompts to understand and explore your data.

Say I want to build an ML model to predict house prices Using SageMaker Canvas. First, I need to prepare my housing dataset to build an accurate model. To get started with the new natural language instructions, I open the SageMaker Canvas application, and in the left navigation pane, I choose Data Wrangler. Under the Data tab and from the list of available datasets, I select the canvas-housing-sample.csv as the dataset, then select Create a data flow and choose Create. I see the tabular view of my dataset and an introduction to the new Chat for data prep capability.

data-flow

I select Chat for data prep, and it displays the chat interface with a set of guided prompts relevant to my dataset. I can use any of these prompts or query the data for something else.

chat-interface

First, I want to understand the quality of my dataset to identify any outliers or anomalies. I ask SageMaker Canvas to generate a data quality report to accomplish this task.

data-quality

I see there are no major issues with my data. I would now like to visualize the distribution of a couple of features in the data. I ask SageMaker Canvas to plot a chart.

query

I now want to filter certain rows to transform my data. I ask SageMaker Canvas to remove rows where the population is less than 1,000. Canvas removes those rows, shows me a preview of the transformed data, and also gives me the option to view and update the code that generated the transform.

code-view

I am happy with the preview and add the transformed data to my list of data transform steps on the right. SageMaker Canvas adds the step along with the code.

transform

Now that my data is transformed, I can go on to build my ML model to predict house prices and even deploy the model into production using the same visual interface of SageMaker Canvas, without writing a single line of code.

Data preparation has never been easier for ML!

Availability
The new capability in Amazon SageMaker Canvas to explore and transform data using natural language queries is available in all AWS Regions where Amazon SageMaker Canvas and Amazon Bedrock are supported.

Learn more
Amazon SageMaker Canvas product page

Go build!

— Irshad

Amazon SageMaker adds new inference capabilities to help reduce foundation model deployment costs and latency

Post Syndicated from Antje Barth original https://aws.amazon.com/blogs/aws/amazon-sagemaker-adds-new-inference-capabilities-to-help-reduce-foundation-model-deployment-costs-and-latency/

Today, we are announcing new Amazon SageMaker inference capabilities that can help you optimize deployment costs and reduce latency. With the new inference capabilities, you can deploy one or more foundation models (FMs) on the same SageMaker endpoint and control how many accelerators and how much memory is reserved for each FM. This helps to improve resource utilization, reduce model deployment costs on average by 50 percent, and lets you scale endpoints together with your use cases.

For each FM, you can define separate scaling policies to adapt to model usage patterns while further optimizing infrastructure costs. In addition, SageMaker actively monitors the instances that are processing inference requests and intelligently routes requests based on which instances are available, helping to achieve on average 20 percent lower inference latency.

Key components
The new inference capabilities build upon SageMaker real-time inference endpoints. As before, you create the SageMaker endpoint with an endpoint configuration that defines the instance type and initial instance count for the endpoint. The model is configured in a new construct, an inference component. Here, you specify the number of accelerators and amount of memory you want to allocate to each copy of a model, together with the model artifacts, container image, and number of model copies to deploy.

Amazon SageMaker - MME

Let me show you how this works.

New inference capabilities in action
You can start using the new inference capabilities from SageMaker Studio, the SageMaker Python SDK, and the AWS SDKs and AWS Command Line Interface (AWS CLI). They are also supported by AWS CloudFormation.

For this demo, I use the AWS SDK for Python (Boto3) to deploy a copy of the Dolly v2 7B model and a copy of the FLAN-T5 XXL model from the Hugging Face model hub on a SageMaker real-time endpoint using the new inference capabilities.

Create a SageMaker endpoint configuration

import boto3
import sagemaker

role = sagemaker.get_execution_role()
sm_client = boto3.client(service_name="sagemaker")

sm_client.create_endpoint_config(
    EndpointConfigName=endpoint_config_name,
    ExecutionRoleArn=role,
    ProductionVariants=[{
        "VariantName": "AllTraffic",
        "InstanceType": "ml.g5.12xlarge",
        "InitialInstanceCount": 1,
		"RoutingConfig": {
            "RoutingStrategy": "LEAST_OUTSTANDING_REQUESTS"
        }
    }]
)

Create the SageMaker endpoint

sm_client.create_endpoint(
    EndpointName=endpoint_name,
    EndpointConfigName=endpoint_config_name,
)

Before you can create the inference component, you need to create a SageMaker-compatible model and specify a container image to use. For both models, I use the Hugging Face LLM Inference Container for Amazon SageMaker. These deep learning containers (DLCs) include the necessary components, libraries, and drivers to host large models on SageMaker.

Prepare the Dolly v2 model

from sagemaker.huggingface import get_huggingface_llm_image_uri

# Retrieve the container image URI
hf_inference_dlc = get_huggingface_llm_image_uri(
  "huggingface",
  version="0.9.3"
)

# Configure model container
dolly7b = {
    'Image': hf_inference_dlc,
    'Environment': {
        'HF_MODEL_ID':'databricks/dolly-v2-7b',
        'HF_TASK':'text-generation',
    }
}

# Create SageMaker Model
sagemaker_client.create_model(
    ModelName        = "dolly-v2-7b",
    ExecutionRoleArn = role,
    Containers       = [dolly7b]
)

Prepare the FLAN-T5 XXL model

# Configure model container
flant5xxlmodel = {
    'Image': hf_inference_dlc,
    'Environment': {
        'HF_MODEL_ID':'google/flan-t5-xxl',
        'HF_TASK':'text-generation',
    }
}

# Create SageMaker Model
sagemaker_client.create_model(
    ModelName        = "flan-t5-xxl",
    ExecutionRoleArn = role,
    Containers       = [flant5xxlmodel]
)

Now, you’re ready to create the inference component.

Create an inference component for each model
Specify an inference component for each model you want to deploy on the endpoint. Inference components let you specify the SageMaker-compatible model and the compute and memory resources you want to allocate. For CPU workloads, define the number of cores to allocate. For accelerator workloads, define the number of accelerators. RuntimeConfig defines the number of model copies you want to deploy.

# Inference compoonent for Dolly v2 7B
sm_client.create_inference_component(
    InferenceComponentName="IC-dolly-v2-7b",
    EndpointName=endpoint_name,
    VariantName=variant_name,
    Specification={
        "ModelName": "dolly-v2-7b",
        "ComputeResourceRequirements": {
		    "NumberOfAcceleratorDevicesRequired": 2, 
			"NumberOfCpuCoresRequired": 2, 
			"MinMemoryRequiredInMb": 1024
	    }
    },
    RuntimeConfig={"CopyCount": 1},
)

# Inference component for FLAN-T5 XXL
sm_client.create_inference_component(
    InferenceComponentName="IC-flan-t5-xxl",
    EndpointName=endpoint_name,
    VariantName=variant_name,
    Specification={
        "ModelName": "flan-t5-xxl",
        "ComputeResourceRequirements": {
		    "NumberOfAcceleratorDevicesRequired": 2, 
			"NumberOfCpuCoresRequired": 1, 
			"MinMemoryRequiredInMb": 1024
	    }
    },
    RuntimeConfig={"CopyCount": 1},
)

Once the inference components have successfully deployed, you can invoke the models.

Run inference
To invoke a model on the endpoint, specify the corresponding inference component.

import json
sm_runtime_client = boto3.client(service_name="sagemaker-runtime")
payload = {"inputs": "Why is California a great place to live?"}

response_dolly = sm_runtime_client.invoke_endpoint(
    EndpointName=endpoint_name,
    InferenceComponentName = "IC-dolly-v2-7b",
    ContentType="application/json",
    Accept="application/json",
    Body=json.dumps(payload),
)

response_flant5 = sm_runtime_client.invoke_endpoint(
    EndpointName=endpoint_name,
    InferenceComponentName = "IC-flan-t5-xxl",
    ContentType="application/json",
    Accept="application/json",
    Body=json.dumps(payload),
)

result_dolly = json.loads(response_dolly['Body'].read().decode())
result_flant5 = json.loads(response_flant5['Body'].read().decode())

Next, you can define separate scaling policies for each model by registering the scaling target and applying the scaling policy to the inference component. Check out the SageMaker Developer Guide for detailed instructions.

The new inference capabilities provide per-model CloudWatch metrics and CloudWatch Logs and can be used with any SageMaker-compatible container image across SageMaker CPU- and GPU-based compute instances. Given support by the container image, you can also use response streaming.

Now available
The new Amazon SageMaker inference capabilities are available today in AWS Regions US East (Ohio, N. Virginia), US West (Oregon), Asia Pacific (Jakarta, Mumbai, Seoul, Singapore, Sydney, Tokyo), Canada (Central), Europe (Frankfurt, Ireland, London, Stockholm), Middle East (UAE), and South America (São Paulo). For pricing details, visit Amazon SageMaker Pricing. To learn more, visit Amazon SageMaker.

Get started
Log in to the AWS Management Console and deploy your FMs using the new SageMaker inference capabilities today!

— Antje

Leverage foundation models for business analysis at scale with Amazon SageMaker Canvas

Post Syndicated from Irshad Buchh original https://aws.amazon.com/blogs/aws/leverage-foundation-models-for-business-analysis-at-scale-with-amazon-sagemaker-canvas/

Today, I’m excited to introduce a new capability in Amazon SageMaker Canvas to use foundation models (FMs) from Amazon Bedrock and Amazon SageMaker Jumpstart through a no-code experience. This new capability makes it easier for you to evaluate and generate responses from FMs for your specific use case with high accuracy.

Every business has its own set of unique domain-specific vocabulary that generic models are not trained to understand or respond to. The new capability in Amazon SageMaker Canvas bridges this gap effectively. SageMaker Canvas trains the models for you so you don’t need to write any code using our company data so that the model output reflects your business domain and use case such as completing a marketing analysis. For the fine-tuning process, SageMaker Canvas creates a new custom model in your account, and the data used for fine-tuning is not used to train the original FM, ensuring the privacy of your data.

Earlier this year, we expanded support for ready-to-use models in Amazon SageMaker Canvas to include foundation models (FMs). This allows you to access, evaluate, and query FMs such as Claude 2, Amazon Titan, and Jurassic-2 (powered by Amazon Bedrock), as well as publicly available models such as Falcon and MPT (powered by Amazon SageMaker JumpStart) through a no-code interface. Extending this experience, we enabled the ability to query the FMs to generate insights from a set of documents in your own enterprise document index, such as Amazon Kendra. While it is valuable to query FMs, customers want to build FMs that generate responses and insights for their use cases. Starting today, a new capability to build FMs addresses this need to generate custom responses.

To get started, I open the SageMaker Canvas application and in the left navigation pane, I choose My models. I select the New model button, select Fine-tune foundation model, and select Create.

CreateModel

I select the training dataset and can choose up to three models to tune. I choose the input column with the prompt text and the output column with the desired output text. Then, I initiate the fine-tuning process by selecting Fine-tune.

ModelBuild

Once the fine-tuning process is completed, SageMaker Canvas gives me an analysis of the fine-tuned model with different metrics such as perplexity and loss curves, training loss, validation loss, and more. Additionally, SageMaker Canvas provides a model leaderboard that gives me the ability to measure and compare metrics around model quality for the generated models.

Analyze

Now, I am ready to test the model and compare responses with the original base model. To test, I select Test in Ready-to-use models from the Analyze page. The fine-tuned model is automatically deployed and is now available for me to chat and compare responses.

Compare

Now, I am ready to generate and evaluate insights specific to my use case. The icing on the cake was to achieve this without writing a single line of code.

Learn more

Go build!

— Irshad

PS: Writing a blog post at AWS is always a team effort, even when you see only one name under the post title. In this case, I want to thank Shyam Srinivasan for his technical assistance.

Amazon Redshift announcements at AWS re:Invent 2023 to enable analytics on all your data

Post Syndicated from Neeraja Rentachintala original https://aws.amazon.com/blogs/big-data/amazon-redshift-announcements-at-aws-reinvent-2023-to-enable-analytics-on-all-your-data/

In 2013, Amazon Web Services revolutionized the data warehousing industry by launching Amazon Redshift, the first fully-managed, petabyte-scale, enterprise-grade cloud data warehouse. Amazon Redshift made it simple and cost-effective to efficiently analyze large volumes of data using existing business intelligence tools. This cloud service was a significant leap from the traditional data warehousing solutions, which were expensive, not elastic, and required significant expertise to tune and operate. Since then, customer demands for better scale, higher throughput, and agility in handling a wide variety of changing, but increasingly business critical analytics and machine learning use cases has exploded, and we have been keeping pace. Today, tens of thousands of customers use Amazon Redshift in AWS global infrastructure to collectively process exabytes of data daily and employs Amazon Redshift as a key component of their data architecture to drive use cases from typical dashboarding to self-service analytics, real-time analytics, machine learning, data sharing and monetization, and more

The advancements to Amazon Redshift announced at AWS re:Invent 2023 further accelerates modernization of your cloud analytics environments, keeping our core tenet to help you achieve the best price-performance at any scale. These announcements drive forward the AWS Zero-ETL vision to unify all your data, enabling you to better maximize the value of your data with comprehensive analytics and ML capabilities, and innovate faster with secure data collaboration within and across organizations. From price-performance improvements to zero-ETL, to generative AI capabilities, we have something for everyone. Let’s dive into the highlights.

Modernizing analytics for scale, performance, and reliability

“Our migration from legacy on-premises platform to Amazon Redshift allows us to ingest data 88% faster, query data 3x faster, and load daily data to the cloud 6x faster. Amazon Redshift enabled us to optimize performance, availability, and reliability—significantly easing operational complexity, while increasing the velocity of our end-users’ decision-making experience on the Fab floor.”

– Sunil Narayan, Sr Dir, Analytics at GlobalFoundries

Diligently driving the best price-performance at scale with new improvements

Since day 1, Amazon Redshift has been building innovative capabilities to help you get to optimum performance, while keeping costs lower. Amazon Redshift continues to lead on the price-performance front with up to 6x better price-performance than alternative cloud data warehouse and for dash boarding applications with high concurrency and low latency. We closely analyze query patterns in the fleet and look for opportunities to drive customer-focused innovation. For example, earlier in the year, we announced speed ups for string-based data processing up to 63x compared to alternative compression encodings such as LZO (Lempel-Ziv-Oberhumer) or ZStandard. At AWS re:Invent 2023, we introduced more performance enhancements in query planning and execution such as enhanced bloom filters , query rewrites, and support for write operations in auto scaling . For more information about performance improvement capabilities, refer to the list of announcements below.

Amazon Redshift Serverless is more intelligent than ever with new AI-driven scaling and optimizations

Speaking of price-performance, new next generation AI-driven scaling and optimizations capabilities in Amazon Redshift Serverless can deliver up to 10x better price-performance for variable workloads (based on internal testing), without manual intervention. Amazon Redshift Serverless, generally available since 2021, allows you to run and scale analytics without having to provision and manage the data warehouse. Since GA, Redshift Serverless executed over a billion queries to power data insights for thousands of customers. With these new AI optimizations, Amazon Redshift Serverless scales proactively and automatically with workload changes across all key dimensions —such as data volume, concurrent users, and query complexity. You just specify your desired price-performance targets to either optimize for cost or optimize for performance or balanced and serverless does the rest. Learn more about additional improvements in Redshift Serverless, under the list of announcements below.

Multi-data warehouse writes through data sharing

Data sharing is a widely adopted feature in Amazon Redshift with customers running tens of millions of queries on shared data daily. Customers share live transactionally consistent data within and across organizations and regions for read purposes without data copies or data movement. Customers are using data sharing to modernize their analytics architectures from monolithic architectures to multi-cluster, data mesh deployments that enable seamless and secure access across organizations to drive data collaboration and powerful insights. At AWS re:Invent 2023, we extended data sharing capabilities to launch multi-data warehouse writes in preview. You can now start writing to Redshift databases from other Redshift data warehouses in just a few clicks, further enabling data collaboration, flexible scaling of compute for ETL/data processing workloads by adding warehouses of different types and sizes based on price-performance needs. Experience greater transparency of compute usage as each warehouse is billed for its own compute and consequently keep your costs under control.

Multidimensional data layouts

Amazon Redshift offers industry leading predictive optimizations that continuously monitor your workloads and seamlessly accelerate performance and maximize concurrency by adjusting data layout and compute management as you use the data warehouse more. In addition to the powerful optimizations Redshift already offers, such as Automatic Table Sort, Automatic sort and distribution keys, we are introducing Multidimensional Data Layouts, a new powerful table sorting mechanism that improves performance of repetitive queries by automatically sorting data based on the incoming query filters (for example: Sales in a specific region). This method significantly accelerates the performance of table scans compared to traditional methods.

Unifying all your data with zero-ETL approaches

“Using the Aurora MySQL zero-ETL integration, we experience near real-time data synchronization between Aurora MySQL databases and Amazon Redshift, making it possible to build an analysis environment in just three hours instead of the month of developer time it used to take before”

– MoneyForward

JOYME uses Amazon Redshift’s streaming ingestion and other Amazon services for risk control over users’ financial activity such as recharge, refund, and rewards.

“With Redshift, we are able to view risk counterparts and data in near real time—
instead of on an hourly basis. Redshift significantly improved our business ROI efficiency.”

– PengBo Yang, CTO, JOYME

Data pipelines can be challenging and costly to build and manage and can create hours-long delays to obtain transactional data for analytics. These delays can lead to missed business opportunities, especially when the insights derived from analytics on transactional data are relevant for only a limited amount of time. Amazon Redshift employs AWS’s zero-ETL approach that enables interoperability and integration between the data warehouse and operational databases and even your streaming data services, so that the data is easily and automatically ingested into the warehouse for you, or you can access the data in place, where it lives.

Zero-ETL integrations with operational databases

We delivered zero-ETL integration between Amazon Aurora MySQL Amazon Redshift (general availability) this year, to enable near real-time analytics and machine learning (ML) using Amazon Redshift on petabytes of transactional data from Amazon Aurora. Within seconds of transactional data being written into Aurora, the data is available in Amazon Redshift, so you don’t have to build and maintain complex data pipelines to perform extract, transform, and load (ETL) operations. At AWS re:Invent, we extended zero-ETL integration to additional sources specifically Aurora PostgreSQL, Dynamo DB, and Amazon RDS MySQL. Zero-ETL integration also enables you to load and analyze data from multiple operational database clusters in a new or existing Amazon Redshift instance to derive holistic insights across many applications.

Data lake querying with support for Apache Iceberg tables

Amazon Redshift allows customers to run a wide range of workloads on data warehouse and data lakes using its support for various open file and table formats. At AWS re:Invent, we announced the general availability of support for Apache Iceberg tables, so you can easily access your Apache Iceberg tables on your data lake from Amazon Redshift and join it with the data in your data warehouse when needed. Use one click to access your data lake tables using auto-mounted AWS Glue data catalogs on Amazon Redshift for a simplified experience. We have improved data lake query performance by integrating with AWS Glue statistics and introduce preview of incremental refresh for materialized views on data lake data to accelerate repeated queries.

Learn more about the zero-ETL integrations, data lake performance enhancements, and other announcements below.

Maximize value with comprehensive analytics and ML capabilities

“Amazon Redshift is one of the most important tools we had in growing Jobcase as a company.”

– Ajay Joshi, Distinguished Engineer, Jobcase

With all your data integrated and available, you can easily build and run near real-time analytics to AI/ML/Generative AI applications. Here’s a couple of highlights from this week and for the full list, see below.

Amazon Q Generative SQL capability

Query Editor, an out-of-the-box web-based SQL experience in Amazon Redshift is a popular tool for data exploration, visual analysis, and data collaboration. At AWS re:Invent, we introduced Amazon Q Generative SQL capabilities in Amazon Redshift Query Editor (preview), to simplify query authoring and increase your productivity by allowing you to express queries in natural language and receive SQL code recommendations. Generative SQL uses AI to analyze user intent, query patterns, and schema metadata to identify common SQL query patterns directly allowing you to get insights faster in a conversational format without extensive knowledge of your organization’s complex database metadata.

Amazon Redshift ML large language model (LLM) integration

Amazon Redshift ML enables customers to create, train, and deploy machine learning models using familiar SQL commands. Customers use Redshift ML to run an average of over 10 billion predictions a day within their data warehouses. At AWS re:Invent, we announced support for LLMs as preview. Now, you can use pre-trained open source LLMs in Amazon SageMaker JumpStart as part of Redshift ML, allowing you to bring the power of LLMs to analytics. For example, you can make inferences on your product feedback data in Amazon Redshift, use LLMs to summarize feedback, perform entity extraction, sentiment analysis and product feedback classification.

Innovate faster with secure data collaboration within and across the organizations

“Millions of companies use Stripe’s software and APIs to accept payments, send payouts, and manage their businesses online.  Access to their Stripe data via leading data warehouses like Amazon Redshift has been a top request from our customers. Our customers needed secure, fast, and integrated analytics at scale without building complex data pipelines or moving and copying data around. With Stripe Data Pipeline for Amazon Redshift, we’re helping our customers set up a direct and reliable data pipeline in a few clicks. Stripe Data Pipeline enables our customers to automatically share their complete, up-to-date Stripe data with their Amazon Redshift data warehouse, and take their business analytics and reporting to the next level.”

– Tony Petrossian, Head of Engineering, Revenue & Financial Management at Stripe

With Amazon Redshift, you can easily and securely share data and collaborate no matter where your teams or data is located. And have the confidence that your data is secure no matter where you operate or how highly regulated your industries are. We have enabled fine grained permissions, an easy authentication experience with single sign-on for your organizational identity—all provided at no additional cost to you.

Unified identity with IAM identity center integration

We announced Amazon Redshift integration with AWS IAM Identity Center to enable organizations to support trusted identity propagation between Amazon QuickSight,, Amazon Redshift Query Editor, and Amazon Redshift,  . Customers can use their organization identities to access Amazon Redshift in a single sign-on experience using third party identity providers (IdP), such as Microsoft Entra ID, Okta, Ping, OneLogin, etc. from Amazon QuickSight and Amazon Redshift Query Editor. Administrators can use third-party identity provider users and groups to manage fine grained access to data across services and audit user level access in AWS CloudTrail. With trusted identity propagation, a user’s identity is passed seamlessly between Amazon QuickSight, Amazon Redshift reducing time to insights and enabling a friction free analytics experience.

For the full set of announcements, see the following:

Learn more: https://aws.amazon.com/redshift


About the authors

Neeraja Rentachintala is a Principal Product Manager with Amazon Redshift. Neeraja is a seasoned Product Management and GTM leader, bringing over 20 years of experience in product vision, strategy and leadership roles in data products and platforms. Neeraja delivered products in analytics, databases, data Integration, application integration, AI/Machine Learning, large scale distributed systems across On-Premise and Cloud, serving Fortune 500 companies as part of ventures including MapR (acquired by HPE), Microsoft SQL Server, Oracle, Informatica and Expedia.com.

Sunaina AbdulSalah leads product marketing for Amazon Redshift. She focuses on educating customers about the impact of data warehousing and analytics and sharing AWS customer stories. She has a deep background in marketing and GTM functions in the B2B technology and cloud computing domains. Outside of work, she spends time with her family and friends and enjoys traveling.

Introducing highly durable Amazon OpenSearch Service clusters with 30% price/performance improvement

Post Syndicated from Jeff Barr original https://aws.amazon.com/blogs/aws/introducing-highly-durable-amazon-opensearch-service-clusters-with-30-price-performance-improvement/

You can use the new OR1 instances to create Amazon OpenSearch Service clusters that use Amazon Simple Storage Service (Amazon S3) for primary storage. You can ingest, store, index, and access just about any imaginable amount of data, while also enjoying a 30% price/performance improvement over existing instance types, eleven nines of data durability, and a zero-time Recovery Point Objective (RPO). You can use this to perform interactive log analytics, monitor application in real time, and more.

New OR1 Instances
These benefits are all made possible by the new OR1 instances, which are available in eight sizes and used for the data nodes of the cluster:

Instance Name vCPUs
Memory
EBS Storage Max (gp3)
or1.medium.search 1 8 GiB 400 GiB
or1.large.search 2 16 GiB 800 GiB
or1.xlarge.search 4 32 GiB 1.5 TiB
or1.2xlarge.search 8 64 GiB 3 TiB
or1.4xlarge.search 16 128 GiB 6 TiB
or1.8xlarge.search 32 256 GiB 12 TiB
or1.12xlarge.search 48 384 GiB 18 TiB
or1.16xlarge.search 64 512 GiB 24 TiB

To choose a suitable instance size, read Sizing Amazon OpenSearch Service domains.

The Amazon Elastic Block Store (Amazon EBS) volumes are used for primary storage, with data copied synchronously to S3 as it arrives. The data in S3 is used to create replicas and to rehydrate EBS after shards are moved between instances as a result of a node failure or a routine rebalancing operation. This is made possible by the remote-backed storage and segment replication features that were recently released for OpenSearch.

Creating a Domain
To create a domain I open the Amazon OpenSearch Service Console, select Managed clusters, and click Create domain:

I enter a name for my domain (my-domain), select Standard create, and use the Production template:

Then I choose the Domain with standby deployment option. This option will create active data nodes in two Availability Zones and a standby one in a third. I also choose the latest engine version:

Then I select the OR1 instance family and (for my use case) configure 500 GiB of EBS storage per data node:

I set the other settings as needed, and click Create to proceed:

I take a quick lunch break and when i come back my domain is ready:

Things to Know
Here are a couple of things to know about this new storage option:

Engine Versions – Amazon OpenSearch Service engines version 2.11 and above support OR1 instances.

Regions – The OR1 instance family is available for use with OpenSearch in the US East (Ohio, N. Virginia), US West (N. California, Oregon), Asia Pacific (Mumbai, Singapore, Sydney, Tokyo), and Europe (Frankfurt, Ireland, Spain, Stockholm) AWS Regions.

Pricing – You pay On-Demand or Reserved prices for data nodes, and you also pay for EBS storage. See the Amazon OpenSearch Service Pricing page for more information.

— Jeff;

Unlocking the value of data as your differentiator

Post Syndicated from G2 Krishnamoorthy original https://aws.amazon.com/blogs/big-data/unlocking-the-value-of-data-as-your-differentiator/

Today on the AWS re:Invent keynote stage, Swami Sivasubramanian, VP of Data and AI, AWS, spoke about the beneficial relationship among data, generative AI, and humans—all working together to unleash new possibilities in efficiency and creativity. There has never been a more exciting time in modern technology. Innovation is accelerating everywhere, and the future is rife with possibility. While Swami explored many facets of this beneficial relationship in the keynote today, one area that is especially critical for our customers to get right if they want to see success in generative AI is data. When you want to build generative AI applications that are unique to your business needs, data is the differentiator. This week, we launched many new tools to help you turn your data into your differentiator. This includes tools to help you customize your foundation models, and new services and features to build a strong data foundation to fuel your generative AI applications.

Customizing foundation models

The need for data is quite obvious if you are building your own foundation models (FMs). These models need vast amounts of data. But data is necessary even when you are building on top of FMs. If you think about it, everyone has access to the same models for building generative AI applications. It’s data that is the key to moving from generic applications to generative AI applications that create real value for your customers and your business. For instance, Intuit’s new generative AI-powered assistant, Intuit Assist, uses relevant contextual datasets spanning small business, consumer finance, and tax information to deliver personalized financial insights to their customers. With Amazon Bedrock, you can privately customize FMs for your specific use case using a small set of your own labeled data through a visual interface without writing any code. Today, we announced the ability to fine-tune Cohere Command and Meta Llama 2 in addition to Amazon Titan. In addition to fine-tuning, we’re also making it easier for you to provide models with up-to-date and contextually relevant information from your data sources using Retrieval Augmented Generation (RAG). Amazon Bedrock’s Knowledge Bases feature, which went to general availability today, supports the entire RAG workflow, from ingestion, to retrieval, and prompt augmentation. Knowledge Bases works with popular vector databases and engines including Amazon OpenSearch Serverless, Redis Enterprise Cloud, and Pinecone, with support for Amazon Aurora and MongoDB coming soon.

Building a strong data foundation

To produce the high-quality data that you need to build or customize FMs for generative AI, you need a strong data foundation. Of course, the value of a strong data foundation is not new and the need for one spans well beyond generative AI. Across all types of use cases, from generative AI to business intelligence (BI), we’ve found that a strong data foundation includes a comprehensive set of services to meet all your use case needs, integrations across those services to break down data silos, and tools to govern data across the end-to-end data workflow so you can innovate more quickly. These tools also need to be intelligent to remove the heavy lifting from data management.

Comprehensive

First, you need a comprehensive set of data services so you can get the price/performance, speed, flexibility, and capabilities for any use case. AWS offers a broad set of tools that enable you to store, organize, access, and act upon various types of data. We have the broadest selection of database services, including relational databases like Aurora and Amazon Relational Database Service (Amazon RDS)—and on Monday, we introduced the newest addition to the RDS family: Amazon RDS for Db2. Now Db2 customers can easily set up, operate, and scale highly available Db2 databases in the cloud. We also offer non-relational databases like Amazon DynamoDB, used by over 1 million customers for its serverless, single-digit millisecond performance at any scale. You also need services to store data for analysis and machine learning (ML) like Amazon Simple Storage Service (Amazon S3). Customers have created hundreds of thousands of data lakes on Amazon S3. It also includes our data warehouse, Amazon Redshift, which delivers more than 6 times better price/performance than other cloud data warehouses. We also have tools that enable you to act on your data, including Amazon QuickSight for BI, Amazon SageMaker for ML, and of course, Amazon Bedrock for generative AI.

Serverless enhancements

The dynamic nature of data makes it perfectly suited to serverless technologies, which is why AWS offers a broad range of serverless database and analytics offerings that help support our customers’ most demanding workloads. This week, we made even more improvements to our serverless options in this area, including a new Aurora capability that automatically scales to millions of write transactions per second and manages petabytes of data while maintaining the simplicity of operating a single database. We also released a new serverless option for Amazon ElastiCache, which makes it faster and easier to create highly available caches and instantly scales to meet application demand. Finally, we announced new AI-driven scaling and optimizations for Amazon Redshift Serverless that enable the service to learn from your patterns and proactively scale on multiple dimensions, including concurrent users, data variability, and query complexity. It does all of this while factoring in your price/performance targets so you can optimize between cost and performance.

Vector capabilities across more databases

Your data foundation also needs to include services to store, index, retrieve, and search vector data. As our customers need vector embeddings as part as part of their generative AI application workflows, they told us they want to use vector capabilities in their existing databases to eliminate the steep learning curve for new programming tools, APIs, and SDKs. They also feel more confident knowing their existing databases are proven in production and meet requirements for scalability, availability, and storage and compute. And when your vectors and business data are stored in the same place, your applications will run faster—and there’s no data sync or data movement to worry about.

For all of these reasons, we’ve invested in adding vector capabilities to some of our most popular data services, including Amazon OpenSearch Service and OpenSearch Serverless, Aurora, and Amazon RDS. Today, we added four more to that list, with the addition of vector support in Amazon MemoryDB for Redis, Amazon DocumentDB (with MongoDB compatibility), DynamoDB, and Amazon Neptune. Now you can use vectors and generative AI with your database of choice.

Integrated

Another key to your data foundation is integrating data across your data sources for a more complete view of your business. Typically, connecting data across different data sources requires complex extract, transform, and load (ETL) pipelines, which can take hours—if not days—to build. These pipelines also have to be continuously maintained and can be brittle. AWS is investing in a zero-ETL future so you can quickly and easily connect and act on all your data, no matter where it lives. We’re delivering on this vision in a number of ways, including zero-ETL integrations between our most popular data stores. Earlier this year, we brought you our fully managed zero-ETL integration between Amazon Aurora MySQL-Compatible Edition and Amazon Redshift. Within seconds of data being written into Aurora, you can use Amazon Redshift to do near-real-time analytics and ML on petabytes of data. Woolworths, a pioneer in retail who helped build the retail model of today, was able to reduce development time for analysis of promotions and other events from 2 months to 1 day using the Aurora zero-ETL integration with Amazon Redshift.

More zero-ETL options

At re:Invent, we announced three more zero-ETL integrations with Amazon Redshift, including Amazon Aurora PostgreSQL-Compatible Edition, Amazon RDS for MySQL, and DynamoDB, to make it easier for you to take advantage of near-real-time analytics to improve your business outcomes. In addition to Amazon Redshift, we’ve also expanded our zero ETL support to OpenSearch Service, which tens of thousands of customers use for real-time search, monitoring, and analysis of business and operational data. This includes zero-ETL integrations with DynamoDB and Amazon S3. With all of these zero-ETL integrations, we’re making it even easier to leverage relevant data for your applications, including generative AI.

Governed

Finally, your data foundation needs to be secure and governed to ensure the data that’s used throughout the development cycle of your generative AI applications is high quality and compliant. To help with this, we launched Amazon DataZone last year. Amazon DataZone is being used by companies like Guardant Health and Bristol Meyers Squibb to catalog, discover, share, and govern data across their organization. Amazon DataZone uses ML to automatically add metadata to your data catalog, making all of your data more discoverable. This week, we added a new feature to Amazon DataZone that uses generative AI to automatically create business descriptions and context for your datasets with just a few clicks, making data even easier to understand and apply. While Amazon DataZone helps you share data in a governed way within your organization, many customers also want to securely share data with their partners.

Infusing intelligence across the data foundation

Not only have we added generative AI to Amazon DataZone, but we’re leveraging intelligent technology across our data services to make data easier to use, more intuitive to work with, and more accessible. Amazon Q, our new generative AI assistant, helps you in QuickSight to author dashboards and create compelling visual stories from your dashboard data using natural language. We also announced that Amazon Q can help you create data integration pipelines using natural language. For example, you can ask Q to “read JSON files from S3, join on ‘accountid’, and load into DynamoDB,” and Q will return an end-to-end data integration job to perform this action. Amazon Q is also making it easier to query data in your data warehouse with generative AI SQL in Amazon Redshift Query Editor (in preview). Now data analysts, scientists, and engineers can be more productive using generative AI text-to-code functionality. You can also improve accuracy by enabling query history access to specific users—without compromising data privacy.

These new innovations are going to make it easy for you to leverage data to differentiate your generative AI applications and create new value for your customers and your business. We look forward to seeing what you create!


About the authors

G2 Krishnamoorthy is VP of Analytics, leading AWS data lake services, data integration, Amazon OpenSearch Service, and Amazon QuickSight. Prior to his current role, G2 built and ran the Analytics and ML Platform at Facebook/Meta, and built various parts of the SQL Server database, Azure Analytics, and Azure ML at Microsoft.

Rahul Pathak is VP of Relational Database Engines, leading Amazon Aurora, Amazon Redshift, and Amazon QLDB. Prior to his current role, he was VP of Analytics at AWS, where he worked across the entire AWS database portfolio. He has co-founded two companies, one focused on digital media analytics and the other on IP-geolocation.

Amazon SageMaker Clarify makes it easier to evaluate and select foundation models (preview)

Post Syndicated from Antje Barth original https://aws.amazon.com/blogs/aws/amazon-sagemaker-clarify-makes-it-easier-to-evaluate-and-select-foundation-models-preview/

I’m happy to share that Amazon SageMaker Clarify now supports foundation model (FM) evaluation (preview). As a data scientist or machine learning (ML) engineer, you can now use SageMaker Clarify to evaluate, compare, and select FMs in minutes based on metrics such as accuracy, robustness, creativity, factual knowledge, bias, and toxicity. This new capability adds to SageMaker Clarify’s existing ability to detect bias in ML data and models and explain model predictions.

The new capability provides both automatic and human-in-the-loop evaluations for large language models (LLMs) anywhere, including LLMs available in SageMaker JumpStart, as well as models trained and hosted outside of AWS. This removes the heavy lifting of finding the right model evaluation tools and integrating them into your development environment. It also simplifies the complexity of trying to adopt academic benchmarks to your generative artificial intelligence (AI) use case.

Evaluate FMs with SageMaker Clarify
With SageMaker Clarify, you now have a single place to evaluate and compare any LLM based on predefined criteria during model selection and throughout the model customization workflow. In addition to automatic evaluation, you can also use the human-in-the-loop capabilities to set up human reviews for more subjective criteria, such as helpfulness, creative intent, and style, by using your own workforce or managed workforce from SageMaker Ground Truth.

To get started with model evaluations, you can use curated prompt datasets that are purpose-built for common LLM tasks, including open-ended text generation, text summarization, question answering (Q&A), and classification. You can also extend the model evaluation with your own custom prompt datasets and metrics for your specific use case. Human-in-the-loop evaluations can be used for any task and evaluation metric. After each evaluation job, you receive an evaluation report that summarizes the results in natural language and includes visualizations and examples. You can download all metrics and reports and also integrate model evaluations into SageMaker MLOps workflows.

In SageMaker Studio, you can find Model evaluation under Jobs in the left menu. You can also select Evaluate directly from the model details page of any LLM in SageMaker JumpStart.

Evaluate foundation models with Amazon SageMaker Clarify

Select Evaluate a model to set up the evaluation job. The UI wizard will guide you through the selection of automatic or human evaluation, model(s), relevant tasks, metrics, prompt datasets, and review teams.

Evaluate foundation models with Amazon SageMaker Clarify

Once the model evaluation job is complete, you can view the results in the evaluation report.

Evaluate foundation models with Amazon SageMaker Clarify

In addition to the UI, you can also start with example Jupyter notebooks that walk you through step-by-step instructions on how to programmatically run model evaluation in SageMaker.

Evaluate models anywhere with the FMEval open source library
To run model evaluation anywhere, including models trained and hosted outside of AWS, use the FMEval open source library. The following example demonstrates how to use the library to evaluate a custom model by extending the ModelRunner class.

For this demo, I choose GPT-2 from the Hugging Face model hub and define a custom HFModelConfig and HuggingFaceCausalLLMModelRunner class that works with causal decoder-only models from the Hugging Face model hub such as GPT-2. The example is also available in the FMEval GitHub repo.

!pip install fmeval

# ModelRunners invoke FMs
from amazon_fmeval.model_runners.model_runner import ModelRunner

# Additional imports for custom model
import warnings
from dataclasses import dataclass
from typing import Tuple, Optional
import torch
from transformers import AutoModelForCausalLM, AutoTokenizer

@dataclass
class HFModelConfig:
    model_name: str
    max_new_tokens: int
    normalize_probabilities: bool = False
    seed: int = 0
    remove_prompt_from_generated_text: bool = True

class HuggingFaceCausalLLMModelRunner(ModelRunner):
    def __init__(self, model_config: HFModelConfig):
        self.config = model_config
        self.model = AutoModelForCausalLM.from_pretrained(self.config.model_name)
        self.tokenizer = AutoTokenizer.from_pretrained(self.config.model_name)

    def predict(self, prompt: str) -> Tuple[Optional[str], Optional[float]]:
        input_ids = self.tokenizer(prompt, return_tensors="pt").to(self.model.device)
        generations = self.model.generate(
            **input_ids,
            max_new_tokens=self.config.max_new_tokens,
            pad_token_id=self.tokenizer.eos_token_id,
        )
        generation_contains_input = (
            input_ids["input_ids"][0] == generations[0][: input_ids["input_ids"].shape[1]]
        ).all()
        if self.config.remove_prompt_from_generated_text and not generation_contains_input:
            warnings.warn(
                "Your model does not return the prompt as part of its generations. "
                "`remove_prompt_from_generated_text` does nothing."
            )
        if self.config.remove_prompt_from_generated_text and generation_contains_input:
            output = self.tokenizer.batch_decode(generations[:, input_ids["input_ids"].shape[1] :])[0]
        else:
            output = self.tokenizer.batch_decode(generations, skip_special_tokens=True)[0]

        with torch.inference_mode():
            input_ids = self.tokenizer(self.tokenizer.bos_token + prompt, return_tensors="pt")["input_ids"]
            model_output = self.model(input_ids, labels=input_ids)
            probability = -model_output[0].item()

        return output, probability

Next, create an instance of HFModelConfig and HuggingFaceCausalLLMModelRunner with the model information.

hf_config = HFModelConfig(model_name="gpt2", max_new_tokens=32)
model = HuggingFaceCausalLLMModelRunner(model_config=hf_config)

Then, select and configure the evaluation algorithm.

# Let's evaluate the FM for FactualKnowledge
from amazon_fmeval.fmeval import get_eval_algorithm
from amazon_fmeval.eval_algorithms.factual_knowledge import FactualKnowledgeConfig

eval_algorithm_config = FactualKnowledgeConfig("<OR>")
eval_algorithm = get_eval_algorithm("factual_knowledge", eval_algorithm_config)

Let’s first test with one sample. The evaluation score is the percentage of factually correct responses.

model_output = model.predict("London is the capital of")[0]
print(model_output)

eval_algo.evaluate_sample(
    target_output="UK<OR>England<OR>United Kingdom", 
	model_output=model_output
)
the UK, and the UK is the largest producer of food in the world.

The UK is the world's largest producer of food in the world.
[EvalScore(name='factual_knowledge', value=1)]

Although it’s not a perfect response, it includes “UK.”

Next, you can evaluate the FM using built-in datasets or define your custom dataset. If you want to use a custom evaluation dataset, create an instance of DataConfig:

config = DataConfig(
    dataset_name="my_custom_dataset",
    dataset_uri="dataset.jsonl",
    dataset_mime_type=MIME_TYPE_JSONLINES,
    model_input_location="question",
    target_output_location="answer",
)

eval_output = eval_algorithm.evaluate(
    model=model, 
    dataset_config=config, 
    prompt_template="$feature", #$feature is replaced by the input value in the dataset 
    save=True
)

The evaluation results will return a combined evaluation score across the dataset and detailed results for each model input stored in a local output path.

Join the preview
FM evaluation with Amazon SageMaker Clarify is available today in public preview in AWS Regions US East (Ohio), US East (N. Virginia), US West (Oregon), Asia Pacific (Singapore), Asia Pacific (Tokyo), Europe (Frankfurt), and Europe (Ireland). The FMEval open source library] is available on GitHub. To learn more, visit Amazon SageMaker Clarify.

Get started
Log in to the AWS Management Console and start evaluating your FMs with SageMaker Clarify today!

— Antje

Evaluate, compare, and select the best foundation models for your use case in Amazon Bedrock (preview)

Post Syndicated from Antje Barth original https://aws.amazon.com/blogs/aws/evaluate-compare-and-select-the-best-foundation-models-for-your-use-case-in-amazon-bedrock-preview/

I’m happy to share that you can now evaluate, compare, and select the best foundation models (FMs) for your use case in Amazon Bedrock. Model Evaluation on Amazon Bedrock is available today in preview.

Amazon Bedrock offers a choice of automatic evaluation and human evaluation. You can use automatic evaluation with predefined metrics such as accuracy, robustness, and toxicity. For subjective or custom metrics, such as friendliness, style, and alignment to brand voice, you can set up human evaluation workflows with just a few clicks.

Model evaluations are critical at all stages of development. As a developer, you now have evaluation tools available for building generative artificial intelligence (AI) applications. You can start by experimenting with different models in the playground environment. To iterate faster, add automatic evaluations of the models. Then, when you prepare for an initial launch or limited release, you can incorporate human reviews to help ensure quality.

Let me give you a quick tour of Model Evaluation on Amazon Bedrock.

Automatic model evaluation
With automatic model evaluation, you can bring your own data or use built-in, curated datasets and pre-defined metrics for specific tasks such as content summarization, question and answering, text classification, and text generation. This takes away the heavy lifting of designing and running your own model evaluation benchmarks.

To get started, navigate to the Amazon Bedrock console, then select Model evaluation under Assessment & deployment in the left menu. Create a new model evaluation and choose Automatic.

Amazon Bedrock Model Evaluation

Next, follow the setup dialog to choose the FM you want to evaluate and the type of task, for example, text summarization. Select the evaluation metrics and specify a dataset—either built-in or your own.

If you bring your own dataset, make sure it’s in JSON Lines format, and each line contains all of the key-value pairs that you want to evaluate your model with for the model dimension that you want to evaluate. For example, if you want to evaluate the model on a question-answer task, you would format your data as follows (with category being optional):

{"referenceResponse":"Cantal","category":"Capitals","prompt":"Aurillac is the capital of"}
{"referenceResponse":"Bamiyan Province","category":"Capitals","prompt":"Bamiyan city is the capital of"}
{"referenceResponse":"Abkhazia","category":"Capitals","prompt":"Sokhumi is the capital of"}
...

Then, create and run the evaluation job to understand the model’s task-specific performance. Once the evaluation job is complete, you can review the results in the model evaluation report.

Amazon Bedrock Model Evaluations

Human model evaluation
For human evaluation, you can have Amazon Bedrock set up human review workflows with a few clicks. You can bring your own datasets and define custom evaluation metrics, such as relevance, style, or alignment to brand voice. You also have the choice to either leverage your own internal teams as reviewers or engage an AWS managed team. This takes away the tedious effort of building and operating human evaluation workflows.

To get started, create a new model evaluation and select Human: Bring your own team or Human: AWS managed team.

If you choose an AWS managed team for human evaluation, describe your model evaluation needs, including task type, expertise of the work team, and the approximate number of prompts, along with your contact information. In the next step, an AWS expert will reach out to discuss your model evaluation project requirements in more detail. Upon review, the team will share a custom quote and project timeline.

If you choose to bring your own team, follow the setup dialog to choose the FMs you want to evaluate and the type of task, for example, text summarization. Then, select the evaluation metrics, upload your test dataset, and set up the work team.

For human evaluation, you would format the example data shown before again in JSON Lines format like this (with category and referenceResponse being optional):

{"prompt":"Aurillac is the capital of","referenceResponse":"Cantal","category":"Capitals"}
{"prompt":"Bamiyan city is the capital of","referenceResponse":"Bamiyan Province","category":"Capitals"}
{"prompt":"Senftenberg is the capital of","referenceResponse":"Oberspreewald-Lausitz","category":"Capitals"}

Once the human evaluation is completed, Amazon Bedrock generates an evaluation report with the model’s performance against your selected metrics.

Amazon Bedrock Model Evaluation

Things to know
Here are a couple of important things to know:

Model support – During preview, you can evaluate and compare text-based large language models (LLMs) available on Amazon Bedrock. During preview, you can select one model for each automatic evaluation job and up to two models for each human evaluation job using your own team. For human evaluation using an AWS managed team, you can specify custom project requirements.

Pricing – During preview, AWS only charges for the model inference needed to perform the evaluation (processed input and output tokens for on-demand pricing). There will be no separate charges for human evaluation or automatic evaluation. Amazon Bedrock Pricing has all the details.

Join the preview
Automatic evaluation and human evaluation using your own work team are available today in public preview in AWS Regions US East (N. Virginia) and US West (Oregon). Human evaluation using an AWS managed team is available in public preview in AWS Region US East (N. Virginia). To learn more, visit the Amazon Bedrock Developer Experience web page and check out the User Guide.

Get started
Log in to the AWS Management Console and start exploring model evaluation in Amazon Bedrock today!

— Antje

Amazon Redshift adds new AI capabilities, including Amazon Q, to boost efficiency and productivity

Post Syndicated from Sébastien Stormacq original https://aws.amazon.com/blogs/aws/amazon-redshift-adds-new-ai-capabilities-to-boost-efficiency-and-productivity/

Amazon Redshift puts artificial intelligence (AI) at your service to optimize efficiencies and make you more productive with two new capabilities that we are launching in preview today.

First, Amazon Redshift Serverless becomes smarter. It scales capacity proactively and automatically along dimensions such as the complexity of your queries, their frequency, the size of the dataset, and so on to deliver tailored performance optimizations. This allows you to spend less time tuning your data warehouse instances and more time getting value from your data.

Second, Amazon Q generative SQL in Amazon Redshift Query Editor generates SQL recommendations from natural language prompts. This helps you to be more productive in extracting insights from your data.

Let’s start with Amazon Redshift Serverless
When you use Amazon Redshift Serverless, you can now opt in for a preview of AI-driven scaling and optimizations. When enabled, the system observes and learns from your usage patterns, such as the concurrent number of queries, their complexity, and the time it takes to run them. Then, it automatically optimizes your serverless endpoint to meet your price performance target. Based on AWS internal testing, this new capability may give you up to ten times better price performance for variable workloads without any manual intervention.

AI-driven scaling and optimizations eliminate the time and effort to manually resize your workgroup and plan background optimizations based on workload needs. It continually runs automatic optimizations when they are most valuable for better performance, avoiding performance cliffs and time-outs.

This new capability goes beyond the existing self-tuning capabilities of Amazon Redshift Serverless, such as machine learning (ML)-enhanced techniques to adjust your compute, modify the physical schema of the database, create or drop materialized views as needed (the one we manage automatically, not yours), and vacuum tables. This new capability brings more intelligence to decide how to adjust the compute, what background optimizations are required, and when to apply them, and it makes its decisions based on more dimensions. We also orchestrate ML-based optimizations for materialized views, table optimizations, and workload management when your queries need it.

During the preview, you must opt in to enable these AI-driven scaling and optimizations on your workgroups. You configure the system to balance the optimization for price or performance. There is only one slider to adjust in the console.

Redshift serverless - AI driven workgoups

As usual, you can track resource usage and associated changes through the console, Amazon CloudWatch metrics, and the system table SYS_SERVERLESS_USAGE.

Now, let’s look at Amazon Q generative SQL in Amazon Redshift Query Editor
What if you could use generative AI to help analysts write effective SQL queries more rapidly? This is the new experience we introduce today in Amazon Redshift Query Editor, our web-based SQL editor.

You can now describe the information you want to extract from your data in natural language, and we generate the SQL query recommendations for you. Behind the scenes, Amazon Q generative SQL uses a large language model (LLM) and Amazon Bedrock to generate the SQL query. We use different techniques, such as prompt engineering and Retrieval Augmented Generation (RAG), to query the model based on your context: the database you’re connected to, the schema you’re working on, your query history, and optionally the query history of other users connected to the same endpoint. The system also remembers previous questions. You can ask it to refine a previously generated query.

The SQL generation model uses metadata specific to your data schema to generate relevant queries. For example, it uses the table and column names and the relationship between the tables in your database. In addition, your database administrator can authorize the model to use the query history of all users in your AWS account to generate even more relevant SQL statements. We don’t share your query history with other AWS accounts and we don’t train our generation models with any data coming from your AWS account. We maintain the high level of privacy and security that you expect from us.

Using generated SQL queries helps you to get started when discovering new schemas. It does the heavy lifting of discovering the column names and relationships between tables for you. Senior analysts also benefit from asking what they want in natural language and having the SQL statement automatically generated. They can review the queries and run them directly from their notebook.

Let’s explore a schema and extract information
For this demo, let’s pretend I am a data analyst at a company that sells concert tickets. The database schema and data are available for you to download. My manager asks me to analyze the ticket sales data to send a thank you note with discount coupons to the highest-spending customers in Seattle.

I connect to Amazon Redshift Query Editor and connect the analytic endpoint. I create a new tab for a Notebook (SQL generation is available from notebooks only).

Instead of writing a SQL statement, I open the chat panel and type, “Find the top five users from Seattle who bought the most number of tickets in 2022.” I take the time to verify the generated SQL statement. It seems correct, so I decide to run it. I select Add to notebook and then Run. The query returns the list of the top five buyers in Seattle.

sql generation - top 5 users

I had no previous knowledge of the data schema, and I did not type a single line of SQL to find the information I needed.

But generative SQL is not limited to a single interaction. I can chat with it to dynamically refine the queries. Here is another example.

I ask “Which state has the most venues?” Generative SQL proposes the following query. The answer is New York, with 49 venues, if you’re curious.

generative sql chat 01

I changed my mind, and I want to know the top three cities with the most venues. I simply rephrase my question: “What about the top three venues?”

generative sql chat 02

I add the query to the notebook and run it. It returns the expected result.

generative sql chat 03

Best practices for prompting
Here are a couple of tips and tricks to get the best results out of your prompts.

Be specific – When asking questions in natural language, be as specific as possible to help the system understand exactly what you need. For example, instead of writing “find the top venues that sold the most tickets,” provide more details like “find the names of the top three venues that sold the most tickets in 2022.” Use consistent entity names like venue, ticket, and location instead of referring to the same entity in different ways, which can confuse the system.

Iterate – Break your complex requests into multiple simple statements that are easier for the system to interpret. Iteratively ask follow-up questions to get more detailed analysis from the system. For example, start by asking, “Which state has the most venues?” Then, based on the response, ask a follow-up question like “Which is the most popular venue from this state?”

Verify – Review the generated SQL before running it to ensure accuracy. If the generated SQL query has errors or does not match your intent, provide instructions to the system on how to correct it instead of rephrasing the entire request. For example, if the query is missing a filter clause on year, write “provide venues from year 2022.”

Availability and pricing
AI-driven scaling and optimizations are in preview in six AWS Regions: US East (Ohio, N. Virginia), US West (Oregon), Asia Pacific (Tokyo), and Europe (Ireland, Stockholm). They come at no additional cost. You pay only for the compute capacity your data warehouse consumes when it is active. Pricing is per Redshift Processing Unit (RPU) per hour. The billing is per second of used capacity. The pricing page for Amazon Redshift has the details.

Amazon Q generative SQL for Amazon Redshift Query Editor is in preview in two AWS Regions today: US East (N. Virginia) and US West (Oregon). There is no charge during the preview period.

These are two examples of how AI helps to optimize performance and increase your productivity, either by automatically adjusting the price-performance ratio of your Amazon Redshift Serverless endpoints or by generating correct SQL statements from natural language prompts.

Previews are essential for us to capture your feedback before we make these capabilities available for all. Experiment with these today and let us know what you think on the re:Post forums or using the feedback button on the bottom left side of the console.

— seb

AWS Clean Rooms Differential Privacy enhances privacy protection of your users data (preview)

Post Syndicated from Donnie Prakoso original https://aws.amazon.com/blogs/aws/aws-clean-rooms-differential-privacy-enhances-privacy-protection-of-your-users-data-preview/

Starting today, you can use AWS Clean Rooms Differential Privacy (preview) to help protect the privacy of your users with mathematically backed and intuitive controls in a few steps. As a fully managed capability of AWS Clean Rooms, no prior differential privacy experience is needed to help you prevent the reidentification of your users.

AWS Clean Rooms Differential Privacy obfuscates the contribution of any individual’s data in generating aggregate insights in collaborations so that you can run a broad range of SQL queries to generate insights about advertising campaigns, investment decisions, clinical research, and more.

Quick overview on differential privacy
Differential privacy is not new. It is a strong, mathematical definition of privacy compatible with statistical and machine learning based analysis, and has been used by the United States Census Bureau as well as companies with vast amounts of data.

Differential privacy helps with a wide variety of use cases involving large datasets, where adding or removing a few individuals has a small impact on the overall result, such as population analyses using count queries, histograms, benchmarking, A/B testing, and machine learning.

The following illustration shows how differential privacy works when it is applied to SQL queries.

When an analyst runs a query, differential privacy adds a carefully calibrated amount of error (also referred to as noise) to query results at run-time, masking the contribution of individuals while still keeping the query results accurate enough to provide meaningful insights. The noise is carefully fine-tuned to mask the presence or absence of any possible individual in the dataset.

Differential privacy also has another component called privacy budget. The privacy budget is a finite resource consumed each time a query is run and thus controls the number of queries that can be run on your datasets, helping ensure that the noise cannot be averaged out to reveal any private information about an individual. When the privacy budget is fully exhausted, no more queries can be run on your tables until it is increased or refreshed.

However, differential privacy is not easy to implement because this technique requires an in-depth understanding of mathematically rigorous formulas and theories to apply it effectively. Configuring differential privacy is also a complex task because customers need to calculate the right level of noise in order to preserve the privacy of their users without negatively impacting the utility of query results.

Customers also want to enable their partners to conduct a wide variety of analyses including highly complex and customized queries on their data. This requirement is hard to support with differential privacy because of the intricate nature of the calculations involved in calibrating the noise while processing various query components such as aggregations, joins, and transformations.

We created AWS Clean Rooms Differential Privacy to help you protect the privacy of your users with mathematically backed controls in a few clicks.

How differential privacy works in AWS Clean Rooms
While differential privacy is quite a sophisticated technique, AWS Clean Rooms Differential Privacy makes it easy for you to apply it and protect the privacy of your users with mathematically backed, flexible, and intuitive controls. You can begin using it with just a few steps after starting or joining an AWS Clean Rooms collaboration as a member with abilities to contribute data.

You create a configured table, which is a reference to your table in the AWS Glue Data Catalog, and choose to turn on differential privacy while adding a custom analysis rule to the configured table.

Next, you associate the configured table to your AWS Clean Rooms collaboration and configure a differential privacy policy in the collaboration to make your table available for querying. You can use a default policy to quickly complete the setup or customize it to meet your specific requirements. As part of this step, you will configure the following:

Privacy budget
Quantified as a value that we call epsilon, the privacy budget controls the level of privacy protection. It is a common, finite resource that is applied for all of your tables protected with differential privacy in the collaboration because the goal is to preserve the privacy of your users whose information can be present in multiple tables. The privacy budget is consumed every time a query is run on your tables. You have the flexibility to increase the privacy budget value any time during the collaboration and automatically refresh it each calendar month.

Noise added per query
Measured in terms of the number of users whose contributions you want to obscure, this input parameter governs the rate at which the privacy budget is depleted.

In general, you need to balance your privacy needs against the number of queries you want to permit and the accuracy of those queries. AWS Clean Rooms makes it easy for you to complete this step by helping you understand the resulting utility you are providing to your collaboration partner. You can also use the interactive examples to understand how your chosen settings would impact the results for different types of SQL queries.

Now that you have successfully enabled differential privacy protection for your data, let’s see AWS Clean Rooms Differential Privacy in action. For this demo, let’s assume I am your partner in the AWS Clean Rooms collaboration.

Here, I’m running a query to count the number of overlapping customers and the result shows there are 3,227,643 values for tv.customer_id.

Now, if I run the same query again after removing records about an individual from coffee_customers table, it shows a different result, 3,227,604 tv.customer_id. This variability in the query results prevents me from identifying the individuals from observing the difference in query results.

I can also see the impact of differential privacy, including the remaining queries I can run.

Available for preview
Join this preview and start protecting the privacy of your users with AWS Clean Rooms Differential Privacy. During this preview period, you can use AWS Clean Rooms Differential Privacy wherever AWS Clean Rooms is available. To learn more on how to get started, visit the AWS Clean Rooms Differential Privacy page.

Happy collaborating!
— Donnie

AWS Clean Rooms ML helps customers and partners apply ML models without sharing raw data (preview)

Post Syndicated from Donnie Prakoso original https://aws.amazon.com/blogs/aws/aws-clean-rooms-ml-helps-customers-and-partners-apply-ml-models-without-sharing-raw-data-preview/

Today, we’re introducing AWS Clean Rooms ML (preview), a new capability of AWS Clean Rooms that helps you and your partners apply machine learning (ML) models on your collective data without copying or sharing raw data with each other. With this new capability, you can generate predictive insights using ML models while continuing to protect your sensitive data.

During this preview, AWS Clean Rooms ML introduces its first model specialized to help companies create lookalike segments for marketing use cases. With AWS Clean Rooms ML lookalike, you can train your own custom model, and you can invite partners to bring a small sample of their records to collaborate and generate an expanded set of similar records while protecting everyone’s underlying data.

In the coming months, AWS Clean Rooms ML will release a healthcare model. This will be the first of many models that AWS Clean Rooms ML will support next year.

AWS Clean Rooms ML helps you to unlock various opportunities for you to generate insights. For example:

  • Airlines can take signals about loyal customers, collaborate with online booking services, and offer promotions to users with similar characteristics.
  • Auto lenders and car insurers can identify prospective auto insurance customers who share characteristics with a set of existing lease owners.
  • Brands and publishers can model lookalike segments of in-market customers and deliver highly relevant advertising experiences.
  • Research institutions and hospital networks can find candidates similar to existing clinical trial participants to accelerate clinical studies (coming soon).

AWS Clean Rooms ML lookalike modeling helps you apply an AWS managed, ready-to-use model that is trained in each collaboration to generate lookalike datasets in a few clicks, saving months of development work to build, train, tune, and deploy your own model.

How to use AWS Clean Rooms ML to generate predictive insights
Today I will show you how to use lookalike modeling in AWS Clean Rooms ML and assume you have already set up a data collaboration with your partner. If you want to learn how to do that, check out the AWS Clean Rooms Now Generally Available — Collaborate with Your Partners without Sharing Raw Data post.

With your collective data in the AWS Clean Rooms collaboration, you can work with your partners to apply ML lookalike modeling to generate a lookalike segment. It works by taking a small sample of representative records from your data, creating a machine learning (ML) model, then applying the particular model to identify an expanded set of similar records from your business partner’s data.

The following screenshot shows the overall workflow for using AWS Clean Rooms ML.

By using AWS Clean Rooms ML, you don’t need to build complex and time-consuming ML models on your own. AWS Clean Rooms ML trains a custom, private ML model, which saves months of your time while still protecting your data.

Eliminating the need to share data
As ML models are natively built within the service, AWS Clean Rooms ML helps you protect your dataset and customer’s information because you don’t need to share your data to build your ML model.

You can specify the training dataset using the AWS Glue Data Catalog table, which contains user-item interactions.

Under Additional columns to train, you can define numerical and categorical data. This is useful if you need to add more features to your dataset, such as the number of seconds spent watching a video, the topic of an article, or the product category of an e-commerce item.

Applying custom-trained AWS-built models
Once you have defined your training dataset, you can now create a lookalike model. A lookalike model is a machine learning model used to find similar profiles in your partner’s dataset without either party having to share their underlying data with each other.

When creating a lookalike model, you need to specify the training dataset. From a single training dataset, you can create many lookalike models. You also have the flexibility to define the date window in your training dataset using Relative range or Absolute range. This is useful when you have data that is constantly updated within AWS Glue, such as articles read by users.

Easy-to-tune ML models
After you create a lookalike model, you need to configure it to use in AWS Clean Rooms collaboration. AWS Clean Rooms ML provides flexible controls that enable you and your partners to tune the results of the applied ML model to garner predictive insights.

On the Configure lookalike model page, you can choose which Lookalike model you want to use and define the Minimum matching seed size you need. This seed size defines the minimum number of profiles in your seed data that overlap with profiles in the training data.

You also have the flexibility to choose whether the partner in your collaboration receives metrics in Metrics to share with other members.

With your lookalike models properly configured, you can now make the ML models available for your partners by associating the configured lookalike model with a collaboration.

Creating lookalike segments
Once the lookalike models have been associated, your partners can now start generating insights by selecting Create lookalike segment and choosing the associated lookalike model for your collaboration.

Here on the Create lookalike segment page, your partners need to provide the Seed profiles. Examples of seed profiles include your top customers or all customers who purchased a specific product. The resulting lookalike segment will contain profiles from the training data that are most similar to the profiles from the seed.

Lastly, your partner will get the Relevance metrics as the result of the lookalike segment using the ML models. At this stage, you can use the Score to make a decision.

Export data and use programmatic API
You also have the option to export the lookalike segment data. Once it’s exported, the data is available in JSON format and you can process this output by integrating with AWS Clean Rooms API and your applications.

Join the preview
AWS Clean Rooms ML is now in preview and available via AWS Clean Rooms in US East (Ohio, N. Virginia), US West (Oregon), Asia Pacific (Seoul, Singapore, Sydney, Tokyo), and Europe (Frankfurt, Ireland, London). Support for additional models is in the works.

Learn how to apply machine learning with your partners without sharing underlying data on the AWS Clean Rooms ML page.

Happy collaborating!
— Donnie

Announcing Amazon OpenSearch Service zero-ETL integration with Amazon S3 (preview)

Post Syndicated from Channy Yun original https://aws.amazon.com/blogs/aws/amazon-opensearch-service-zero-etl-integration-with-amazon-s3-preview/

Today we are announcing a preview of Amazon OpenSearch Service zero-ETL integration with Amazon S3, a new way to query operational logs in Amazon S3 and S3-based data lakes without needing to switch between services. You can now analyze infrequently queried data in cloud object stores and simultaneously use the operational analytics and visualization capabilities of OpenSearch Service.

Amazon OpenSearch Service direct queries with Amazon S3 provides a zero-ETL integration to reduce the operational complexity of duplicating data or managing multiple analytics tools by enabling customers to directly query their operational data, reducing costs and time to action. This zero-ETL integration will be configurable within OpenSearch Service, where you can take advantage of various log type templates, including predefined dashboards, and configure data accelerations tailored to that log type. Templates include VPC Flow Logs, Elastic Load Balancing logs, and NGINX logs, and accelerations include skipping indexes, materialized views, and covered indexes.

With direct queries with Amazon S3, you can perform complex queries critical to security forensic and threat analysis that correlate data across multiple data sources, which aids teams in investigating service downtime and security events. After creating an integration, you can start querying their data directly from the OpenSearch Dashboards or OpenSearch API. You can easily audit connections to ensure that they are set up in a scalable, cost-efficient, and secure way.

Getting started with direct queries with Amazon S3
You can easily get started by creating a new Amazon S3 direct query data source for OpenSearch Service through the AWS Management Console or the API. Each new data source uses AWS Glue Data Catalog to manage tables that represent S3 buckets. Once you create a data source, you can configure Amazon S3 tables and data indexing and query data in OpenSearch Dashboards.

1. Create a data source in OpenSearch Service
Before you create a data source, you should have an OpenSearch Service domain with version 2.11 or later and a target Amazon S3 table in AWS Glue Data Catalog with the appropriate IAM permissions. IAM will need access to the desired S3 bucket(s) and read and write access to AWS Glue Data Catalog. To learn more about IAM prerequisites, see Creating a data source in the AWS documentation.

Go to the OpenSearch Service console and choose the domain you want to set up a new data source for. In the domain details page, choose the Connections tab below the general information and see the Direct Query section.

To create a new data source, choose Create, input the name of your new data source, select the data source type as Amazon S3 with AWS Glue Data Catalog, and choose the IAM role for your data source.

Once you create a data source, you can go to the OpenSearch Dashboards of the domain, which you use to configure access control, define tables, set up log type–based dashboards for popular log types, and query your data.

2. Configuring your data source in OpenSearch Dashboards
To configure data source in OpenSearch Dashboards, choose Configure in the console and go to OpenSearch Dashboards. In the left-hand navigation of OpenSearch Dashboards, under Management, choose Data sources. Under Manage data sources, choose the name of the data source you created in the console.

Direct queries from OpenSearch Service to Amazon S3 use Spark tables within AWS Glue Data Catalog. To create a new table you want to direct query, go to the Query Workbench in the Open Search Plugins menu.

Now run as in the following SQL statement to create http_logs table and run MSCK REPAIR TABLE mys3.default.http_logs command to update the metadata in the catalog

CREATE EXTERNAL TABLE IF NOT EXISTS mys3.default.http_logs (
   `@timestamp` TIMESTAMP,
    clientip STRING,
    request STRING, 
    status INT, 
    size INT, 
    year INT, 
    month INT, 
    day INT) 
USING json PARTITIONED BY(year, month, day) OPTIONS (path 's3://mys3/data/http_log/http_logs_partitioned_json_bz2/', compression 'bzip2')

To ensure a fast experience with your data in Amazon S3, you can set up any of three different types of accelerations to index data into OpenSearch Service, such as skipping indexes, materialized views, and covering indexes. To create OpenSearch indexes from external data connections for better performance, choose the Accelerate Table.

  • Skipping indexes allow you to index only the metadata of the data stored in Amazon S3. Skipping indexes help quickly identify data stored by narrowing down a specific location of where the data is stored.
  • Materialized views enable you to use complex queries such as aggregations, which can be used for querying or powering dashboard visualizations. Materialized views ingest data into OpenSearch Service for anomaly detection or geospatial capabilities.
  • Covering indexes will ingest all the data from the specified table column. Covering indexes are the most performant of the three indexing types.

3. Query your data source in OpenSearch Dashboards
After you set up your tables, you can query your data using Discover. You can run a sample SQL query for the http_logs table you created in AWS Glue Data Catalog tables.

To learn more, see Working with Amazon OpenSearch Service direct queries with Amazon S3 in the AWS documentation.

Join the preview
Amazon OpenSearch Service zero-ETL integration with Amazon S3 is now previewed in the AWS US East (Ohio), US East (N. Virginia), US West (Oregon), Asia Pacific (Tokyo), Europe (Frankfurt), and Europe (Ireland) Regions.

OpenSearch Service separately charges for only the compute needed as OpenSearch Compute Units to query your external data as well as maintain indexes in OpenSearch Service. For more information, see Amazon OpenSearch Service Pricing.

Give it a try and send feedback to the AWS re:Post for Amazon OpenSearch Service or through your usual AWS Support contacts.

— Channy

Analyze large amounts of graph data to get insights and find trends with Amazon Neptune Analytics

Post Syndicated from Sébastien Stormacq original https://aws.amazon.com/blogs/aws/introducing-amazon-neptune-analytics-a-high-performance-graph-analytics/

I am happy to announce the general availability of Amazon Neptune Analytics, a new analytics database engine that makes it faster for data scientists and application developers to quickly analyze large amounts of graph data. With Neptune Analytics, you can now quickly load your dataset from Amazon Neptune or your data lake on Amazon Simple Storage Service (Amazon S3), run your analysis tasks in near real time, and optionally terminate your graph afterward.

Graph data enables the representation and analysis of intricate relationships and connections within diverse data domains. Common applications include social networks, where it aids in identifying communities, recommending connections, and analyzing information diffusion. In supply chain management, graphs facilitate efficient route optimization and bottleneck identification. In cybersecurity, they reveal network vulnerabilities and identify patterns of malicious activity. Graph data finds application in knowledge management, financial services, digital advertising, and network security, performing tasks such as identifying money laundering networks in banking transactions and predicting network vulnerabilities.

Since the launch of Neptune in May 2018, thousands of customers have embraced the service for storing their graph data and performing updates and deletion on specific subsets of the graph. However, analyzing data for insights often involves loading the entire graph into memory. For instance, a financial services company aiming to detect fraud may need to load and correlate all historical account transactions.

Performing analyses on extensive graph datasets, such as running common graph algorithms, requires specialized tools. Utilizing separate analytics solutions demands the creation of intricate pipelines to transfer data for processing, which is challenging to operate, time-consuming, and prone to errors. Furthermore, loading large datasets from existing databases or data lakes to a graph analytic solution can take hours or even days.

Neptune Analytics offers a fully managed graph analytics experience. It takes care of the infrastructure heavy lifting, enabling you to concentrate on problem-solving through queries and workflows. Neptune Analytics automatically allocates compute resources according to the graph’s size and quickly loads all the data in memory to run your queries in seconds. Our initial benchmarking shows that Neptune Analytics loads data from Amazon S3 up to 80x faster than existing AWS solutions.

Neptune Analytics supports 5 families of algorithms covering 15 different algorithms, each with multiple variants. For example, we provide algorithms for path-finding, detecting communities (clustering), identifying important data (centrality), and quantifying similarity. Path-finding algorithms are used for use cases such as route planning for supply chain optimization. Centrality algorithms like page rank identify the most influential sellers in a graph. Algorithms like connected components, clustering, and similarity algorithms can be used for fraud-detection use cases to determine whether the connected network is a group of friends or a fraud ring formed by a set of coordinated fraudsters.

Neptune Analytics facilitates the creation of graph applications using openCypher, presently one of the widely adopted graph query languages. Developers, business analysts, and data scientists appreciate openCypher’s SQL-inspired syntax, finding it familiar and structured for composing graph queries.

Let’s see it at work
As we usually do on the AWS News blog, let’s show how it works. For this demo, I first navigate to Neptune in the AWS Management Console. There is a new Analytics section on the left navigation pane. I select Graphs and then Create graph.

Neptune Analytics - create graph 1

On the Create graph page, I enter the details of my graph analytics database engine. I won’t detail each parameter here; their names are self-explanatory.

Neptune Analytics - Create graph 1

Pay attention to Allow from public because, the vast majority of the time, you want to keep your graph only available from the boundaries of your VPC. I also create a Private endpoint to allow private access from machines and services inside my account VPC network.

Neptune Analytics - Create graph 2

In addition to network access control, users will need proper IAM permissions to access the graph.

Finally, I enable Vector search to perform similarity search using embeddings in the dataset. The dimension of the vector depends on the large language model (LLM) that you use to generate the embedding.

Neptune Analytics - Create graph 3

When I am ready, I select Create graph (not shown here).

After a few minutes, my graph is available. Under Connectivity & security, I take note of the Endpoint. This is the DNS name I will use later to access my graph from my applications.

I can also create Replicas. A replica is a warm standby copy of the graph in another Availability Zone. You might decide to create one or more replicas for high availability. By default, we create one replica, and depending on your availability requirements, you can choose not to create replicas.

Neptune Analytics - create graph 3

Business queries on graph data
Now that the Neptune Analytics graph is available, let’s load and analyze data. For the rest of this demo, imagine I’m working in the finance industry.

I have a dataset obtained from the US Securities and Exchange Commission (SEC). This dataset contains the list of positions held by investors that have more than $100 million in assets. Here is a diagram to illustrate the structure of the dataset I use in this demo.

Nuptune graph analytics - dataset structure

I want to get a better understanding of the positions held by one investment firm (let’s name it “Seb’s Investments LLC”). I wonder what its top five holdings are and who else holds more than $1 billion in the same companies. I am also curious to know what are other investment companies that have a similar portfolio as Seb’s Investments LLC.

To start my analysis, I create a Jupyter notebook in the Neptune section of the AWS Management Console. In the notebook, I first define my analytics endpoint and load the data set from an S3 bucket. It takes only 18 seconds to load 17 million records.

Neptune Analytics - load data

Then, I start to explore the dataset using openCypher queries. I start by defining my parameters:

params = {'name': "Seb's Investments LLC", 'quarter': '2023Q4'}

First, I want to know what the top five holdings are for Seb’s Investments LLC in this quarter and who else holds more than $1 billion in the same companies. In openCypher, it translates to the query hereafter. The $name parameter’s value is “Seb’s Investment LLC” and the $quarter parameter’s value is 2023Q4.

MATCH p=(h:Holder)-->(hq1)-[o:owns]->(holding)
WHERE h.name = $name AND hq1.name = $quarter
WITH DISTINCT holding as holding, o ORDER BY o.value DESC LIMIT 5
MATCH (holding)<-[o2:owns]-(hq2)<--(coholder:Holder)
WHERE hq2.name = '2023Q4'
WITH sum(o2.value) AS totalValue, coholder, holding
WHERE totalValue > 1000000000
RETURN coholder.name, collect(holding.name)

Neptune Analytics - query 1

Then, I want to know what the other top five companies are that have similar holdings as “Seb’s Investments LLC.” I use the topKByNode() function to perform a vector search.

MATCH (n:Holder)
WHERE n.name = $name
CALL neptune.algo.vectors.topKByNode(n)
YIELD node, score
WHERE score >0
RETURN node.name LIMIT 5

This query identifies a specific Holder node with the name “Seb’s Investments LLC.” Then, it utilizes the Neptune Analytics custom vector similarity search algorithm on the embedding property of the Holder node to find other nodes in the graph that are similar. The results are filtered to include only those with a positive similarity score, and the query finally returns the names of up to five related nodes.

Neptune Analytics - query 2

Pricing and availability
Neptune Analytics is available today in seven AWS Regions: US East (Ohio, N. Virginia), US West (Oregon), Asia Pacific (Singapore, Tokyo), and Europe (Frankfurt, Ireland).

AWS charges for the usage on a pay-as-you-go basis, with no recurring subscriptions or one-time setup fees.

Pricing is based on configurations of memory-optimized Neptune capacity units (m-NCU). Each m-NCU corresponds to one hour of compute and networking capacity and 1 GiB of memory. You can choose configurations starting with 128 m-NCUs and up to 4096 m-NCUs. In addition to m-NCU, storage charges apply for graph snapshots.

I invite you to read the Neptune pricing page for more details

Neptune Analytics is a new analytics database engine to analyze large graph datasets. It helps you discover insights faster for use cases such as fraud detection and prevention, digital advertising, cybersecurity, transportation logistics, and bioinformatics.

Get started
Log in to the AWS Management Console to give Neptune Analytics a try.

— seb

Vector search for Amazon DocumentDB (with MongoDB compatibility) is now generally available

Post Syndicated from Channy Yun original https://aws.amazon.com/blogs/aws/vector-search-for-amazon-documentdb-with-mongodb-compatibility-is-now-generally-available/

Today, we are announcing the general availability of vector search for Amazon DocumentDB (with MongoDB compatibility), a new built-in capability that lets you store, index, and search millions of vectors with millisecond response times within your document database.

Vector search is an emerging technique used in machine learning (ML) to find similar data points to given data by comparing their vector representations using distance or similarity metrics. Vectors are numerical representation of unstructured data created from large language models (LLM) hosted in Amazon Bedrock, Amazon SageMaker, and other open source or proprietary ML services. This approach is useful in creating generative artificial intelligence (AI) applications, such as intuitive search, product recommendation, personalization, and chatbots using Retrieval Augmented Generation (RAG) model approach. For example, if your data set contained individual documents for movies, you could semantically search for movies similar to Titanic based on shared context such as “boats”, “tragedy”, or “movies based on true stories” instead of simply matching keywords.

With vector search for Amazon DocumentDB, you can effectively search the database based on nuanced meaning and context without spending time and cost to manage a separate vector database infrastructure. You also benefit from the fully managed, scalable, secure, and highly available JSON-based document database that Amazon DocumentDB provides.

Getting started with vector search on Amazon DocumentDB
The vector search feature is available on your Amazon DocumentDB 5.0 instance-based clusters. To implement a vector search application, you generate vectors using embedding models for fields inside your document and store vectors side by side your source data inside Amazon DocumentDB.

Next, you create a vector index on a vector field that will help retrieve similar vectors and can search the Amazon DocumentDB database using semantic search. Finally, user-submitted queries are converted to vectors using the same embedding model to get semantically similar documents and return them to the client.

Let’s look at how to implement a simple semantic search application using vector search on Amazon DocumentDB.

Step 1. Create vector embeddings using the Amazon Titan Embeddings model
Let’s use the Amazon Titan Embeddings model to create an embedding vector. Amazon Titan Embeddings model is available in Amazon Bedrock, a serverless generative AI service. You can easily access it using a single API and without managing any infrastructure.

prompt = "I love dog and cat."
response = bedrock_runtime.invoke_model(
    body= json.dumps({"inputText": prompt}), 
    modelId='amazon.titan-embed-text-v1', 
    accept='application/json', 
    contentType='application/json'
)
response_body = json.loads(response['body'].read())
embedding = response_body.get('embedding')

The returned vector embedding will look similar to this:

[0.82421875, -0.6953125, -0.115722656, 0.87890625, 0.05883789, -0.020385742, 0.32421875, -0.00078201294, -0.40234375, 0.44140625, ...]

Step 2. Insert vector embeddings and create a vector index
You can add generated vector embeddings using the insertMany( [{},...,{}] ) operation with a list of the documents that you want added to your collection in Amazon DocumentDB.

db.collection.insertMany([
    {sentence: "I love a dog and cat.", vectorField: [0.82421875, -0.6953125,...]},
    {sentence: "My dog is very cute.", vectorField: [0.05883789, -0.020385742,...]},
    {sentence: "I write with a pen.", vectorField: [-0.020385742, 0.32421875,...]},
  ...
]);

You can create a vector index using the createIndex command. Amazon DocumentDB performs an approximate nearest neighbor (ANN) search using the inverted file with flat compression (IVFFLAT) vector index. The feature supports three distance metrics: euclidean, cosine, and inner product. We will use the euclidean distance, a measure of the straight-line distance between two points in space. The smaller the euclidean distance, the closer the vectors are to each other.

db.collection.createIndex (
   { vectorField: "vector" },
   { "name": "index name",
     "vectorOptions": {
        "dimensions": 100, // the number of vector data dimensions
        "similarity": "euclidean", // Or cosine and dotProduct
        "lists": 100 
      }
   }
);

Step 3.  Search vector embeddings from Amazon DocumentDB
You can now search for similar vectors within your documents using a new aggregation pipeline operator within $search. The example code to search “I like pets” is as follows:

db.collection.aggregate ({
  $search: {
    "vectorSearch": {
      "vector": [0.82421875, -0.6953125,...], // Search for ‘I like pets’
      "path": vectorField,
      "k": 5,
      "similarity": "euclidean", // Or cosine and dotProduct
      "probes": 1 // the number of clusters for vector search
      }
     }
   });

This returns search results such as “I love a dog and cat.” which is semantically similar.

To learn more, see Amazon DocumentDB documentation. To see a more practical example—a semantic movie search with Amazon DocumentDB—find the Python source codes and data-sets in the GitHub repository.

Now available
Vector search for Amazon DocumentDB is now available at no additional cost to all customers using Amazon DocumentDB 5.0 instance-based clusters in all AWS Regions where Amazon DocumentDB is available. Standard compute, I/O, storage, and backup charges will apply as you store, index, and search vector embeddings on Amazon DocumentDB.

To learn more, see the Amazon DocumentDB documentation and send feedback to AWS re:Post for Amazon DocumentDB or through your usual AWS Support contacts.

— Channy

The collective thoughts of the interwebz