Post Syndicated from Eric Johnson original https://aws.amazon.com/blogs/compute/troubleshooting-amazon-api-gateway-with-enhanced-observability-variables/
Amazon API Gateway is often used for managing access to serverless applications. Additionally, it can help developers reduce code and increase security with features like AWS WAF integration and authorizers at the API level.
Because more is handled by API Gateway, developers tell us they would like to see more data points on the individual parts of the request. This data helps developers understand each phase of the API request and how it affects the request as a whole. In response to this request, the API Gateway team has added new enhanced observability variables to the API Gateway access logs. With these new variables, developers can troubleshoot on a more granular level to quickly isolate and resolve request errors and latency issues.
The phases of an API request
API Gateway divides requests into phases, reflected by the variables that have been added. Depending upon the features configured for the application, an API request goes through multiple phases. The phases appear in a specific order as follows:

Phases of an API request
- WAF: the WAF phase only appears when an AWS WAF web access control list (ACL) is configured for enhanced security. During this phase, WAF rules are evaluated and a decision is made on whether to continue or cancel the request.
- Authenticate: the authenticate phase is only present when AWS Identity and Access Management (IAM) authorizers are used. During this phase, the credentials of the signed request are verified. Access is granted or denied based on the client’s right to assume the access role.
- Authorizer: the authorizer phase is only present when a Lambda, JWT, or Amazon Cognito authorizer is used. During this phase, the authorizer logic is processed to verify the user’s right to access the resource.
- Authorize: the authorize phase is only present when a Lambda or IAM authorizer is used. During this phase, the results from the authenticate and authorizer phase are evaluated and applied.
- Integration: during this phase, the backend integration processes the request.
Each phrase can add latency to the request, return a status, or raise an error. To capture this data, API Gateway now provides enhanced observability variables based on each phase. The variables are named according to the phase they occur in and follow the naming structure, $context.phase.property. Therefore, you can get data about WAF latency by using $context.waf.latency.
Some existing variables have also been given aliases to match this naming schema. For example, $context.integrationErrorMessage has a new alias of $context.integration.error. The resulting list of variables is as follows:

Phases and variables for API Gateway requests
API Gateway provides status, latency, and error data for each phase. In the authorizer and integration phases, there are additional variables you can use in logs. The $context.phase.requestId provides the request ID from that service and the $context.phase.integrationStatus provide the status code.
For example, when using an AWS Lambda function as the integration, API Gateway receives two status codes. The first, $context.integration.integrationStatus, is the status of the Lambda service itself. This is usually 200, unless there is a service or permissions error. The second, $context.integration.status, is the status of the Lambda function and reports on the success or failure of the code.
A full list of access log variables is in the documentation for REST APIs, WebSocket APIs, and HTTP APIs.
A troubleshooting example
In this example, an application is built using an API Gateway REST API with a Lambda function for the backend integration. The application uses an IAM authorizer to require AWS account credentials for application access. The application also uses an AWS WAF ACL to rate limit requests to 100 requests per IP, per five minutes. The demo application and deployment instructions can be found in the Sessions With SAM repository.
Because the application involves an AWS WAF and IAM authorizer for security, the request passes through four phases: waf, authenticate, authorize, and integration. The access log format is configured to capture all the data regarding these phases:
{
  "requestId":"$context.requestId",
  "waf-error":"$context.waf.error",
  "waf-status":"$context.waf.status",
  "waf-latency":"$context.waf.latency",
  "waf-response":"$context.wafResponseCode",
  "authenticate-error":"$context.authenticate.error",
  "authenticate-status":"$context.authenticate.status",
  "authenticate-latency":"$context.authenticate.latency",
  "authorize-error":"$context.authorize.error",
  "authorize-status":"$context.authorize.status",
  "authorize-latency":"$context.authorize.latency",
  "integration-error":"$context.integration.error",
  "integration-status":"$context.integration.status",
  "integration-latency":"$context.integration.latency",
  "integration-requestId":"$context.integration.requestId",
  "integration-integrationStatus":"$context.integration.integrationStatus",
  "response-latency":"$context.responseLatency",
  "status":"$context.status"
}
Once the application is deployed, use Postman to test the API with a sigV4 request.

Configuring Postman authorization
To show troubleshooting with the new enhanced observability variables, the first request sent through contains invalid credentials. The user receives a 403 Forbidden error.

Client response view with invalid tokens
The access log for this request is:
{
    "requestId": "70aa9606-26be-4396-991c-405a3671fd9a",
    "waf-error": "-",
    "waf-status": "200",
    "waf-latency": "8",
    "waf-response": "WAF_ALLOW",
    "authenticate-error": "-",
    "authenticate-status": "403",
    "authenticate-latency": "17",
    "authorize-error": "-",
    "authorize-status": "-",
    "authorize-latency": "-",
    "integration-error": "-",
    "integration-status": "-",
    "integration-latency": "-",
    "integration-requestId": "-",
    "integration-integrationStatus": "-",
    "response-latency": "48",
    "status": "403"
}
The request passed through the waf phase first. Since this is the first request and the rate limit has not been exceeded, the request is passed on to the next phase, authenticate. During the authenticate phase, the user’s credentials are verified. In this case, the credentials are invalid and the request is rejected with a 403 response before invoking the downstream phases.
To correct this, the next request uses valid credentials, but those credentials do not have access to invoke the API. Again, the user receives a 403 Forbidden error.

Client response view with unauthorized tokens
The access log for this request is:
{
  "requestId": "c16d9edc-037d-4f42-adf3-eaadf358db2d",
  "waf-error": "-",
  "waf-status": "200",
  "waf-latency": "7",
  "waf-response": "WAF_ALLOW",
  "authenticate-error": "-",
  "authenticate-status": "200",
  "authenticate-latency": "8",
  "authorize-error": "The client is not authorized to perform this operation.",
  "authorize-status": "403",
  "authorize-latency": "0",
  "integration-error": "-",
  "integration-status": "-",
  "integration-latency": "-",
  "integration-requestId": "-",
  "integration-integrationStatus": "-",
  "response-latency": "52",
  "status": "403"
}
This time, the access logs show that the authenticate phase returns a 200. This indicates that the user credentials are valid for this account. However, the authorize phase returns a 403 and states, “The client is not authorized to perform this operation”. Again, the request is rejected with a 403 response before invoking downstream phases.
The last request for the API contains valid credentials for a user that has rights to invoke this API. This time the user receives a 200 OK response and the requested data.

Client response view with valid request
The log for this request is:
{
  "requestId": "ac726ce5-91dd-4f1d-8f34-fcc4ae0bd622",
  "waf-error": "-",
  "waf-status": "200",
  "waf-latency": "7",
  "waf-response": "WAF_ALLOW",
  "authenticate-error": "-",
  "authenticate-status": "200",
  "authenticate-latency": "1",
  "authorize-error": "-",
  "authorize-status": "200",
  "authorize-latency": "0",
  "integration-error": "-",
  "integration-status": "200",
  "integration-latency": "16",
  "integration-requestId": "8dc58335-fa13-4d48-8f99-2b1c97f41a3e",
  "integration-integrationStatus": "200",
  "response-latency": "48",
  "status": "200"
}
This log contains a 200 status code from each of the phases and returns a 200 response to the user. Additionally, each of the phases reports latency. This request had a total of 48 ms of latency. The latency breaks down according to the following:

Request latency breakdown
Developers can use this information to identify the cause of latency within the API request and adjust accordingly. While some phases like authenticate or authorize are immutable, optimizing the integration phase of this request could remove a large chunk of the latency involved.
Conclusion
This post covers the enhanced observability variables, the phases they occur in, and the order of those phases. With these new variables, developers can quickly isolate the problem and focus on resolving issues.
When configured with the proper access logging variables, API Gateway access logs can provide a detailed story of API performance. They can help developers to continually optimize that performance. To learn how to configure logging in API Gateway with AWS SAM, see the demonstration app for this blog.
#ServerlessForEveryone



 Karthi Thyagarajan is a Principal Solutions Architect on the Amazon Kinesis team.
 Deepthi Mohan is a Sr. TPM on the Amazon Kinesis Data Analytics team.


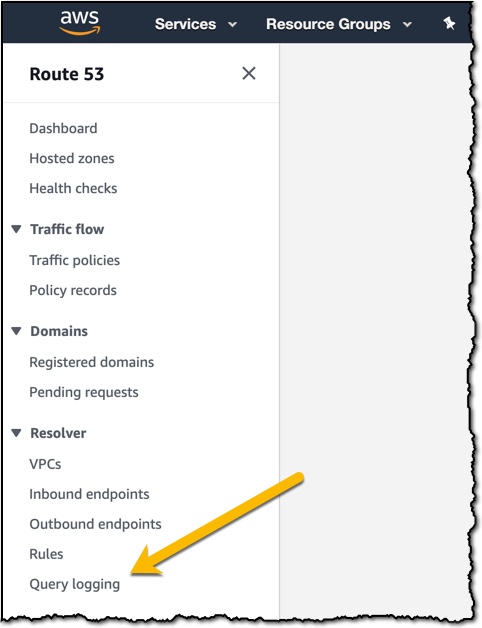
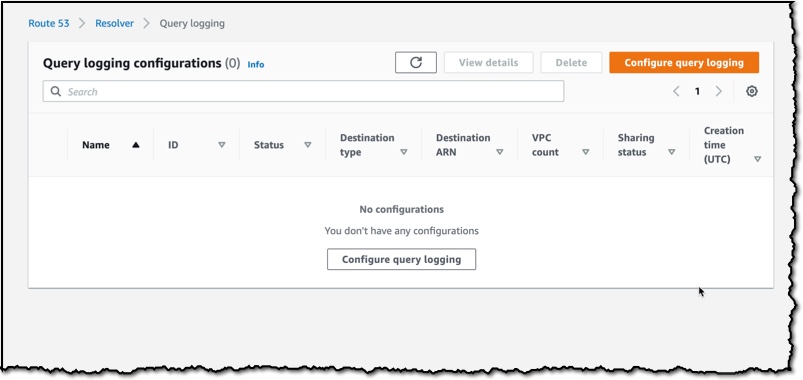

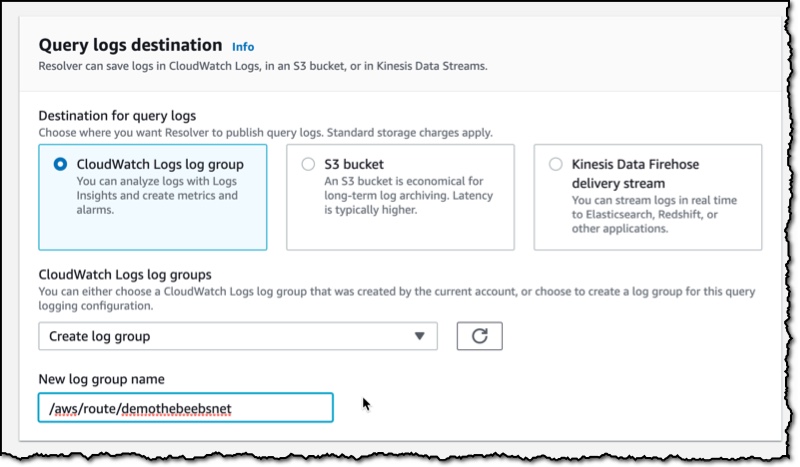
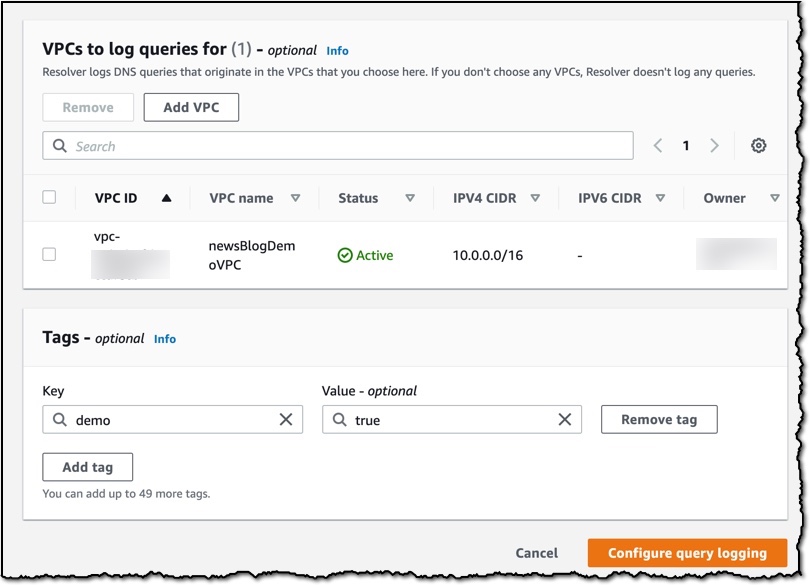

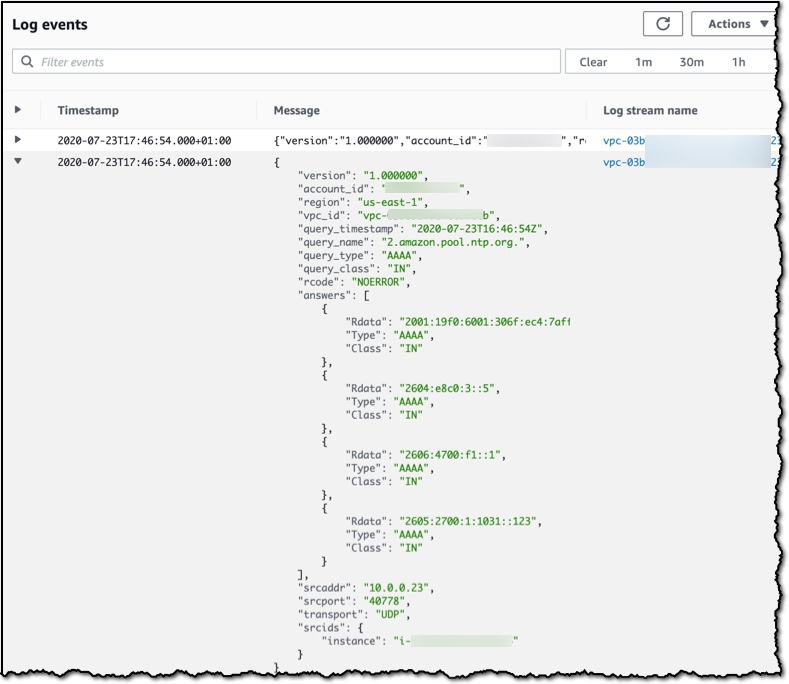
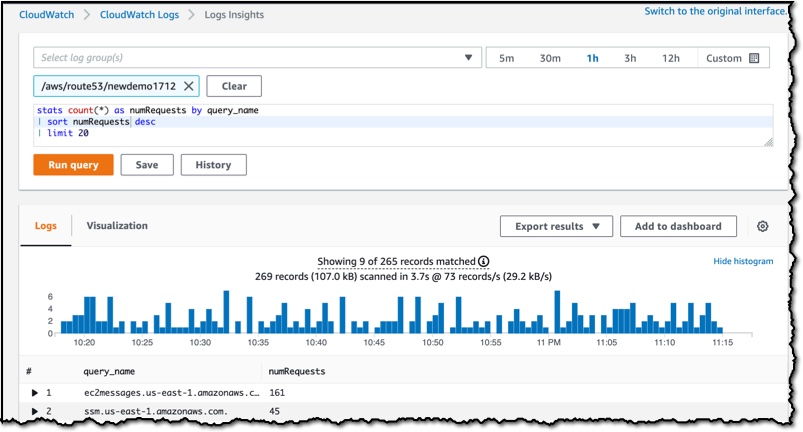
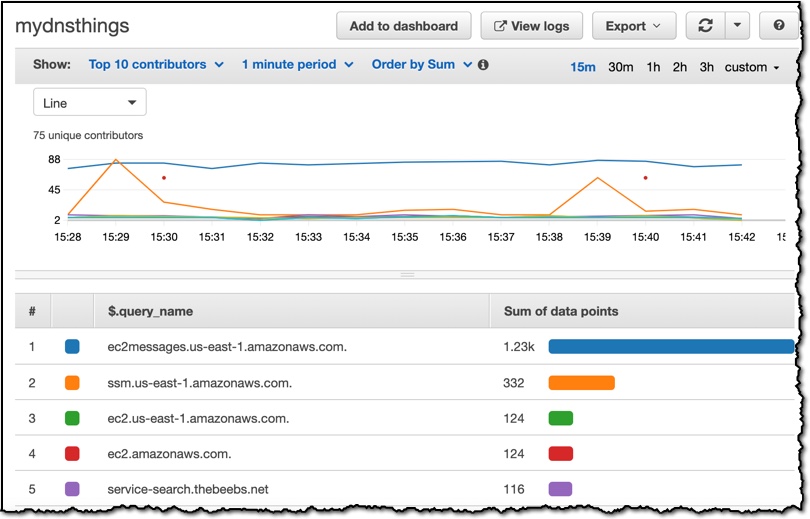 Route 53 Resolver Query Logs is available in all AWS Commercial Regions that support Route 53 Resolver Endpoints, and you can get started using either the API or the AWS Console. You do not pay for the Route 53 Resolver Query Logs, but you will pay for handling the logs in the destination service that you choose. So, for example, if you decided to use