Post Syndicated from Pascal Vogel original https://aws.amazon.com/blogs/compute/implementing-idempotent-aws-lambda-functions-with-powertools-for-aws-lambda-typescript/
This post is written by Alexander Schüren, Sr Specialist SA, Powertools.
One of the design principles of AWS Lambda is to “develop for retries and failures”. If your function fails, the Lambda service will retry and invoke your function again with the same event payload. Therefore, when your function performs tasks such as processing orders or making reservations, it is necessary for your Lambda function to handle requests idempotently to avoid duplicate payment or order processing, which can result in a poor customer experience.
This article explains what idempotency is and how to make your Lambda functions idempotent using the idempotency utility for Powertools for AWS Lambda (TypeScript). The Powertools idempotency utility for TypeScript was co-developed with Vanguard and is now generally available.
Understanding idempotency
Idempotency is the property of an operation that can be applied multiple times without changing the result beyond the initial execution. You can safely run an idempotent operation multiple times without side effects, such as duplicate records or data inconsistencies. This is especially relevant for payment and order processing or third-party API integrations.
There are key concepts to consider when implementing idempotency in AWS Lambda. For each invocation, you specify which subset of the event payload you want to use to identify an idempotent request. This is called the idempotency key. This key can be a single field such as transactionId, a combination of multiple fields such as customerId and requestId, or the entire event payload.
Because timestamps, dates, and other generated values within the payload affect the idempotency key, we recommend that you define specific fields rather than using the entire event payload.
By evaluating the idempotency key, you can then decide if the function needs to run again or send an existing response to the client. To do this, you need to store the following information for each request in a persistence layer (i.e., Amazon DynamoDB):
- Status:
IN_PROGRESS,EXPIRED,COMPLETE - Response data: the response to send back to the client instead of executing the function again
- Expiration timestamp: when the idempotency record becomes invalid for reuse
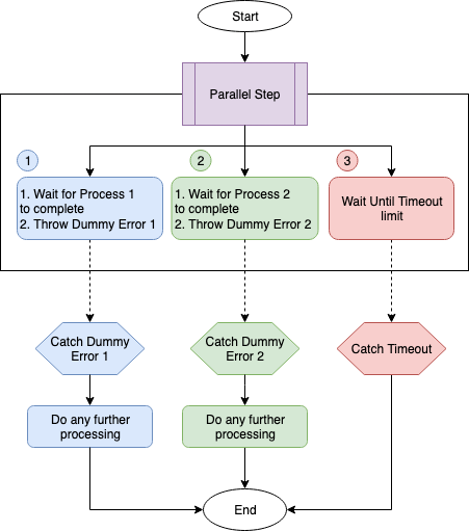
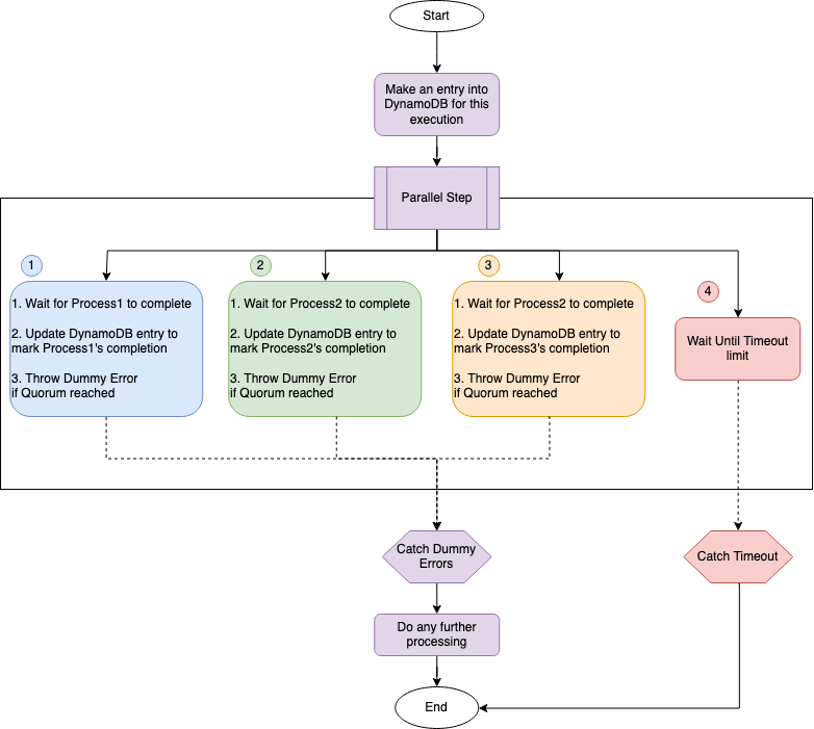
The following diagram shows a successful request flow for this idempotency scenario:

When you invoke a Lambda function with a particular event for the first time, it stores a record with a unique idempotency key tied to an event payload in the persistence layer.
The function then executes its code and updates the record in the persistence layer with the function response. For subsequent invocations with the same payload, you must check if the idempotency key exists in the persistence layer. If it exists, the function returns the same response to the client. This prevents multiple invocations of the function, making it idempotent.
There are more edge cases to be mindful of, such as when the idempotency record has expired, or handling of failures between the client, the Lambda function, and the persistence layer. The Powertools for AWS Lambda (TypeScript) documentation covers all request flows in detail.
Idempotency with Powertools for AWS Lambda (TypeScript)
Powertools for AWS Lambda, available in Python, Java, .NET, and TypeScript, provides utilities for Lambda functions to ease the adoption of best practices and to reduce the amount of code needed to perform recurring tasks. In particular, it provides a module to handle idempotency.
This post shows examples using the TypeScript version of Powertools. To get started with the Powertools idempotency module, you must install the library and configure it within your build process. For more details, follow the Powertools for AWS Lambda documentation.
Getting started
Powertools for AWS Lambda (TypeScript) is modular, meaning you can install the idempotency utility independently from the Logger, Tracing, Metrics, or other packages. Install the idempotency utility library and the AWS SDK v3 client for DynamoDB in your project using npm:
npm i @aws-lambda-powertools/idempotency @aws-sdk/client-dynamodb @aws-sdk/lib-dynamodbBefore getting started, you need to create a persistent storage layer where the idempotency utility can store its state. Your Lambda function AWS Identity and Access Management (IAM) role must have dynamodb:GetItem, dynamodb:PutItem, dynamodb:UpdateItem and dynamodb:DeleteItem permissions.
Currently, DynamoDB is the only supported persistent storage layer, so you’ll need to create a table first. Use the AWS Cloud Development Kit (CDK), AWS CloudFormation, AWS Serverless Application Model (SAM) or any Infrastructure as Code tool of your choice that supports DynamoDB resources.
The following sections illustrate how to instrument your Lambda function code to make it idempotent using a wrapper function or using middy middleware.
Using the function wrapper
Assuming you have created a DynamoDB table with the name IdempotencyTable, create a persistence layer in your Lambda function code:
import { makeIdempotent } from "@aws-lambda-powertools/idempotency";
import { DynamoDBPersistenceLayer } from "@aws-lambda-powertools/idempotency/dynamodb";

const persistenceStore = new DynamoDBPersistenceLayer({
  tableName: "IdempotencyTable",
});
Now, apply the makeIdempotent function wrapper to your Lambda function handler to make it idempotent and use the previously configured persistence store.
import { makeIdempotent } from '@aws-lambda-powertools/idempotency';
import { DynamoDBPersistenceLayer } from '@aws-lambda-powertools/idempotency/dynamodb';
import type { Context } from 'aws-lambda';
import type { Request, Response, SubscriptionResult } from './types';

export const handler = makeIdempotent(
  async (event: Request, _context: Context): Promise<Response> => {
    try {
      const payment = … // create payment

      return {
        paymentId: payment.id,
        message: 'success',
        statusCode: 200,
      };

    } catch (error) {
      throw new Error('Error creating payment');
    }
  },
  {
    persistenceStore,
  }
);
The function processes the incoming event to create a payment and return the paymentId, message, and status back to the client. Making the Lambda function handler idempotent ensures that payments are only processed once, despite multiple Lambda invocations with the same event payload. You can also apply the makeIdempotent function wrapper to any other function outside of your handler.
Use the following type definitions for this example by adding a types.ts file to your source folder:
type Request = {
  user: string;
  productId: string;
};

type Response = {
  [key: string]: unknown;
};

type SubscriptionResult = {
  id: string;
  productId: string;
};
Using middy middleware
If you are using middy middleware, Powertools provides makeHandlerIdempotent middleware to make your Lambda function handler idempotent:
import { makeHandlerIdempotent } from '@aws-lambda-powertools/idempotency/middleware';
import { DynamoDBPersistenceLayer } from '@aws-lambda-powertools/idempotency/dynamodb';
import middy from '@middy/core';
import type { Context } from 'aws-lambda';
import type { Request, Response, SubscriptionResult } from './types';

const persistenceStore = new DynamoDBPersistenceLayer({
  tableName: 'IdempotencyTable',
});

export const handler = middy(
  async (event: Request, _context: Context): Promise<Response> => {
    try {
      const payment = … // create payment object

      return {
        paymentId: payment.id,
        message: 'success',
        statusCode: 200,
      };
    } catch (error) {
      throw new Error('Error creating payment');
    }
  }
).use(
    makeHandlerIdempotent({
      persistenceStore,
  })
);
Configuration options
The Powertools idempotency utility comes with several configuration options to change the idempotency behavior that will fit your use case scenario. This section highlights the most common configurations. You can find all available customization options in the AWS Powertools for Lambda (TypeScript) documentation.
Persistence layer options
When you create a DynamoDBPersistenceLayer object, only the tableName attribute is required. Powertools will expect the table with a partition key id and will create other attributes with default values.
You can change these default values if needed by passing the options parameter:
import { DynamoDBPersistenceLayer } from '@aws-lambda-powertools/idempotency/dynamodb';

const persistenceStore = new DynamoDBPersistenceLayer({
  tableName: 'idempotencyTableName',
  keyAttr: 'idempotencyKey', // default: id
  expiryAttr: 'expiresAt', // default: expiration
  inProgressExpiryAttr: 'inProgressExpiresAt', // default: in_progress_expiration
  statusAttr: 'currentStatus', // default: status
  dataAttr: 'resultData', // default: data
  validationKeyAttr: 'validationKey', .// default validation
});
Using a subset of the event payload
When you configure idempotency for your Lambda function handler, Powertools will use the entire event payload for idempotency handling by hashing the object.
However, events from AWS services such as Amazon API Gateway or Amazon Simple Queue Service (Amazon SQS) often have generated fields, such as timestamp or requestId. This results in Powertools treating each event payload as unique.
To prevent that, create an IdempotencyConfig and configure which part of the payload should be hashed for the idempotency logic.
Create the IdempotencyConfig and set eventKeyJmespath to a key within your event payload:
import { IdempotencyConfig } from '@aws-lambda-powertools/idempotency';

// Extract the idempotency key from the request headers
const config = new IdempotencyConfig({
  eventKeyJmesPath: 'headers."X-Idempotency-Key"',
});
Use the X-Idempotency-Key header for your idempotency key. Subsequent invocations with the same header value will be idempotent.
You can then add the configuration to the makeIdempotent function wrapper from the previous example:
export const handler = makeIdempotent(
  async (event: Request, _context: Context): Promise<Response> => {
    try {
      const payment = … // create payment

	  return {
        paymentId: payment.id,
        message: 'success',
        statusCode: 200,
      };
    } catch (error) {
      throw new Error('Error creating payment');
    }
  },
  {
    persistenceStore,
    config
  }
);
The event payload should contain X-Idempotency-Key in the headers, so Powertools can use this field to handle idempotency:
{
  "version": "2.0",
  "routeKey": "ANY /createpayment",
  "rawPath": "/createpayment",
  "rawQueryString": "",
  "headers": {
    "Header1": "value1",
    "X-Idempotency-Key": "abcdefg"
  },
  "requestContext": {
    "accountId": "123456789012",
    "apiId": "api-id",
    "domainName": "id.execute-api.us-east-1.amazonaws.com",
    "domainPrefix": "id",
    "http": {
      "method": "POST",
      "path": "/createpayment",
      "protocol": "HTTP/1.1",
      "sourceIp": "ip",
      "userAgent": "agent"
    },
    "requestId": "id",
    "routeKey": "ANY /createpayment",
    "stage": "$default",
    "time": "10/Feb/2021:13:40:43 +0000",
    "timeEpoch": 1612964443723
  },
  "body": "{\"user\":\"xyz\",\"productId\":\"123456789\"}",
  "isBase64Encoded": false
}
There are other configuration options you can apply, such as payload validation, expiration duration, local caching, and others. See the Powertools for AWS Lambda (TypeScript) documentation for more information.
Customizing the AWS SDK configuration
The DynamoDBPersistenceLayer is built-in and allows you to store the idempotency data for all your requests. Under the hood, Powertools uses the AWS SDK for JavaScript v3. Change the SDK configuration by passing a clientConfig object.
The following sample sets the region to eu-west-1:
import { DynamoDBPersistenceLayer } from '@aws-lambda-powertools/idempotency/dynamodb';

const persistenceStore = new DynamoDBPersistenceLayer({
  tableName: 'IdempotencyTable',
  clientConfig: {
    region: 'eu-west-1',
  },
});
If you are using your own client, you can pass it the persistence layer:
import { DynamoDBPersistenceLayer } from '@aws-lambda-powertools/idempotency/dynamodb';
import { DynamoDBClient } from '@aws-sdk/client-dynamodb';

const ddbClient = new DynamoDBClient({ region: 'eu-west-1' });

const dynamoDBPersistenceLayer = new DynamoDBPersistenceLayer({
  tableName: 'IdempotencyTable',
  awsSdkV3Client: ddbClient,
});
Conclusion
Making your Lambda functions idempotent can be a challenge and, if not done correctly, can lead to duplicate data, inconsistencies, and a bad customer experience. This post shows how to use Powertools for AWS Lambda (TypeScript) to process your critical transactions only once when using AWS Lambda.
For more details on the Powertools idempotency feature and its configuration options, see the full documentation.
For more serverless learning resources, visit Serverless Land.


