Tag Archives: DevSecOps

Building an end-to-end Kubernetes-based DevSecOps software factory on AWS

Post Syndicated from Srinivas Manepalli original https://aws.amazon.com/blogs/devops/building-an-end-to-end-kubernetes-based-devsecops-software-factory-on-aws/

DevSecOps software factory implementation can significantly vary depending on the application, infrastructure, architecture, and the services and tools used. In a previous post, I provided an end-to-end DevSecOps pipeline for a three-tier web application deployed with AWS Elastic Beanstalk. The pipeline used cloud-native services along with a few open-source security tools. This solution is similar, but instead uses a containers-based approach with additional security analysis stages. It defines a software factory using Kubernetes along with necessary AWS Cloud-native services and open-source third-party tools. Code is provided in the GitHub repo to build this DevSecOps software factory, including the integration code for third-party scanning tools.

DevOps is a combination of cultural philosophies, practices, and tools that combine software development with information technology operations. These combined practices enable companies to deliver new application features and improved services to customers at a higher velocity. DevSecOps takes this a step further by integrating and automating the enforcement of preventive, detective, and responsive security controls into the pipeline.

In a DevSecOps factory, security needs to be addressed from two aspects: security of the software factory, and security in the software factory. In this architecture, we use AWS services to address the security of the software factory, and use third-party tools along with AWS services to address the security in the software factory. This AWS DevSecOps reference architecture covers DevSecOps practices and security vulnerability scanning stages including secret analysis, SCA (Software Composite Analysis), SAST (Static Application Security Testing), DAST (Dynamic Application Security Testing), RASP (Runtime Application Self Protection), and aggregation of vulnerability findings into a single pane of glass.

The focus of this post is on application vulnerability scanning. Vulnerability scanning of underlying infrastructure such as the Amazon Elastic Kubernetes Service (Amazon EKS) cluster and network is outside the scope of this post. For information about infrastructure-level security planning, refer to Amazon Guard Duty, Amazon Inspector, and AWS Shield.

You can deploy this pipeline in either the AWS GovCloud (US) Region or standard AWS Regions. All listed AWS services are authorized for FedRamp High and DoD SRG IL4/IL5.

Security and compliance

Thoroughly implementing security and compliance in the public sector and other highly regulated workloads is very important for achieving an ATO (Authority to Operate) and continuously maintain an ATO (c-ATO). DevSecOps shifts security left in the process, integrating it at each stage of the software factory, which can make ATO a continuous and faster process. With DevSecOps, an organization can deliver secure and compliant application changes rapidly while running operations consistently with automation.

Security and compliance are shared responsibilities between AWS and the customer. Depending on the compliance requirements (such as FedRamp or DoD SRG), a DevSecOps software factory needs to implement certain security controls. AWS provides tools and services to implement most of these controls. For example, to address NIST 800-53 security controls families such as access control, you can use AWS Identity Access and Management (IAM) roles and Amazon Simple Storage Service (Amazon S3) bucket policies. To address auditing and accountability, you can use AWS CloudTrail and Amazon CloudWatch. To address configuration management, you can use AWS Config rules and AWS Systems Manager. Similarly, to address risk assessment, you can use vulnerability scanning tools from AWS.

The following table is the high-level mapping of the NIST 800-53 security control families and AWS services that are used in this DevSecOps reference architecture. This list only includes the services that are defined in the AWS CloudFormation template, which provides pipeline as code in this solution. You can use additional AWS services and tools or other environmental specific services and tools to address these and the remaining security control families on a more granular level.

# NIST 800-53 Security Control Family – Rev 5 AWS Services Used (In this DevSecOps Pipeline)
1 AC – Access Control

AWS IAM, Amazon S3, and Amazon CloudWatch are used.

AWS::IAM::ManagedPolicy
AWS::IAM::Role
AWS::S3::BucketPolicy
AWS::CloudWatch::Alarm

2 AU – Audit and Accountability

AWS CloudTrail, Amazon S3, Amazon SNS, and Amazon CloudWatch are used.

AWS::CloudTrail::Trail
AWS::Events::Rule
AWS::CloudWatch::LogGroup
AWS::CloudWatch::Alarm
AWS::SNS::Topic

3 CM – Configuration Management

AWS Systems Manager, Amazon S3, and AWS Config are used.

AWS::SSM::Parameter
AWS::S3::Bucket
AWS::Config::ConfigRule

4 CP – Contingency Planning

AWS CodeCommit and Amazon S3 are used.

AWS::CodeCommit::Repository
AWS::S3::Bucket

5 IA – Identification and Authentication

AWS IAM is used.

AWS:IAM:User
AWS::IAM::Role

6 RA – Risk Assessment

AWS Config, AWS CloudTrail, AWS Security Hub, and third party scanning tools are used.

AWS::Config::ConfigRule
AWS::CloudTrail::Trail
AWS::SecurityHub::Hub
Vulnerability Scanning Tools (AWS/AWS Partner/3rd party)

7 CA – Assessment, Authorization, and Monitoring

AWS CloudTrail, Amazon CloudWatch, and AWS Config are used.

AWS::CloudTrail::Trail
AWS::CloudWatch::LogGroup
AWS::CloudWatch::Alarm
AWS::Config::ConfigRule

8 SC – System and Communications Protection

AWS KMS and AWS Systems Manager are used.

AWS::KMS::Key
AWS::SSM::Parameter
SSL/TLS communication

9 SI – System and Information Integrity

AWS Security Hub, and third party scanning tools are used.

AWS::SecurityHub::Hub
Vulnerability Scanning Tools (AWS/AWS Partner/3rd party)

10 AT – Awareness and Training N/A
11 SA – System and Services Acquisition N/A
12 IR – Incident Response Not implemented, but services like AWS Lambda, and Amazon CloudWatch Events can be used.
13 MA – Maintenance N/A
14 MP – Media Protection N/A
15 PS – Personnel Security N/A
16 PE – Physical and Environmental Protection N/A
17 PL – Planning N/A
18 PM – Program Management N/A
19 PT – PII Processing and Transparency N/A
20 SR – SupplyChain Risk Management N/A

Services and tools

In this section, we discuss the various AWS services and third-party tools used in this solution.

CI/CD services

For continuous integration and continuous delivery (CI/CD) in this reference architecture, we use the following AWS services:

  • AWS CodeBuild – A fully managed continuous integration service that compiles source code, runs tests, and produces software packages that are ready to deploy.
  • AWS CodeCommit – A fully managed source control service that hosts secure Git-based repositories.
  • AWS CodeDeploy – A fully managed deployment service that automates software deployments to a variety of compute services such as Amazon Elastic Compute Cloud (Amazon EC2), AWS Fargate, AWS Lambda, and your on-premises servers.
  • AWS CodePipeline – A fully managed continuous delivery service that helps you automate your release pipelines for fast and reliable application and infrastructure updates.
  • AWS Lambda – A service that lets you run code without provisioning or managing servers. You pay only for the compute time you consume.
  • Amazon Simple Notification Service – Amazon SNS is a fully managed messaging service for both application-to-application (A2A) and application-to-person (A2P) communication.
  • Amazon S3 – Amazon S3 is storage for the internet. You can use Amazon S3 to store and retrieve any amount of data at any time, from anywhere on the web.
  • AWS Systems Manager Parameter Store – Parameter Store provides secure, hierarchical storage for configuration data management and secrets management.

Continuous testing tools

The following are open-source scanning tools that are integrated in the pipeline for the purpose of this post, but you could integrate other tools that meet your specific requirements. You can use the static code review tool Amazon CodeGuru for static analysis, but at the time of this writing, it’s not yet available in AWS GovCloud and currently supports Java and Python.

  • Anchore (SCA and SAST) – Anchore Engine is an open-source software system that provides a centralized service for analyzing container images, scanning for security vulnerabilities, and enforcing deployment policies.
  • Amazon Elastic Container Registry image scanning – Amazon ECR image scanning helps in identifying software vulnerabilities in your container images. Amazon ECR uses the Common Vulnerabilities and Exposures (CVEs) database from the open-source Clair project and provides a list of scan findings.
  • Git-Secrets (Secrets Scanning) – Prevents you from committing sensitive information to Git repositories. It is an open-source tool from AWS Labs.
  • OWASP ZAP (DAST) – Helps you automatically find security vulnerabilities in your web applications while you’re developing and testing your applications.
  • Snyk (SCA and SAST) – Snyk is an open-source security platform designed to help software-driven businesses enhance developer security.
  • Sysdig Falco (RASP) – Falco is an open source cloud-native runtime security project that detects unexpected application behavior and alerts on threats at runtime. It is the first runtime security project to join CNCF as an incubation-level project.

You can integrate additional security stages like IAST (Interactive Application Security Testing) into the pipeline to get code insights while the application is running. You can use AWS partner tools like Contrast Security, Synopsys, and WhiteSource to integrate IAST scanning into the pipeline. Malware scanning tools, and image signing tools can also be integrated into the pipeline for additional security.

Continuous logging and monitoring services

The following are AWS services for continuous logging and monitoring used in this reference architecture:

Auditing and governance services

The following are AWS auditing and governance services used in this reference architecture:

  • AWS CloudTrail – Enables governance, compliance, operational auditing, and risk auditing of your AWS account.
  • AWS Config – Allows you to assess, audit, and evaluate the configurations of your AWS resources.
  • AWS Identity and Access Management – Enables you to manage access to AWS services and resources securely. With IAM, you can create and manage AWS users and groups, and use permissions to allow and deny their access to AWS resources.

Operations services

The following are the AWS operations services used in this reference architecture:

  • AWS CloudFormation – Gives you an easy way to model a collection of related AWS and third-party resources, provision them quickly and consistently, and manage them throughout their lifecycles, by treating infrastructure as code.
  • Amazon ECR – A fully managed container registry that makes it easy to store, manage, share, and deploy your container images and artifacts anywhere.
  • Amazon EKS – A managed service that you can use to run Kubernetes on AWS without needing to install, operate, and maintain your own Kubernetes control plane or nodes. Amazon EKS runs up-to-date versions of the open-source Kubernetes software, so you can use all of the existing plugins and tooling from the Kubernetes community.
  • AWS Security Hub – Gives you a comprehensive view of your security alerts and security posture across your AWS accounts. This post uses Security Hub to aggregate all the vulnerability findings as a single pane of glass.
  • AWS Systems Manager Parameter Store – Provides secure, hierarchical storage for configuration data management and secrets management. You can store data such as passwords, database strings, Amazon Machine Image (AMI) IDs, and license codes as parameter values.

Pipeline architecture

The following diagram shows the architecture of the solution. We use AWS CloudFormation to describe the pipeline as code.

Containers devsecops pipeline architecture

Kubernetes DevSecOps Pipeline Architecture

The main steps are as follows:

    1. When a user commits the code to CodeCommit repository, a CloudWatch event is generated, which triggers CodePipeline to orchestrate the events.
    2. CodeBuild packages the build and uploads the artifacts to an S3 bucket.
    3. CodeBuild scans the code with git-secrets. If there is any sensitive information in the code such as AWS access keys or secrets keys, CodeBuild fails the build.
    4. CodeBuild creates the container image and perform SCA and SAST by scanning the image with Snyk or Anchore. In the provided CloudFormation template, you can pick one of these tools during the deployment. Please note, CodeBuild is fully enabled for a “bring your own tool” approach.
      • (4a) If there are any vulnerabilities, CodeBuild invokes the Lambda function. The function parses the results into AWS Security Finding Format (ASFF) and posts them to Security Hub. Security Hub helps aggregate and view all the vulnerability findings in one place as a single pane of glass. The Lambda function also uploads the scanning results to an S3 bucket.
      • (4b) If there are no vulnerabilities, CodeBuild pushes the container image to Amazon ECR and triggers another scan using built-in Amazon ECR scanning.
    5. CodeBuild retrieves the scanning results.
      • (5a) If there are any vulnerabilities, CodeBuild invokes the Lambda function again and posts the findings to Security Hub. The Lambda function also uploads the scan results to an S3 bucket.
      • (5b) If there are no vulnerabilities, CodeBuild deploys the container image to an Amazon EKS staging environment.
    6. After the deployment succeeds, CodeBuild triggers the DAST scanning with the OWASP ZAP tool (again, this is fully enabled for a “bring your own tool” approach).
      • (6a) If there are any vulnerabilities, CodeBuild invokes the Lambda function, which parses the results into ASFF and posts it to Security Hub. The function also uploads the scan results to an S3 bucket (similar to step 4a).
    7. If there are no vulnerabilities, the approval stage is triggered, and an email is sent to the approver for action via Amazon SNS.
    8. After approval, CodeBuild deploys the code to the production Amazon EKS environment.
    9. During the pipeline run, CloudWatch Events captures the build state changes and sends email notifications to subscribed users through Amazon SNS.
    10. CloudTrail tracks the API calls and sends notifications on critical events on the pipeline and CodeBuild projects, such as UpdatePipeline, DeletePipeline, CreateProject, and DeleteProject, for auditing purposes.
    11. AWS Config tracks all the configuration changes of AWS services. The following AWS Config rules are added in this pipeline as security best practices:
      1. CODEBUILD_PROJECT_ENVVAR_AWSCRED_CHECK – Checks whether the project contains environment variables AWS_ACCESS_KEY_ID and AWS_SECRET_ACCESS_KEY. The rule is NON_COMPLIANT when the project environment variables contain plaintext credentials. This rule ensures that sensitive information isn’t stored in the CodeBuild project environment variables.
      2. CLOUD_TRAIL_LOG_FILE_VALIDATION_ENABLED – Checks whether CloudTrail creates a signed digest file with logs. AWS recommends that the file validation be enabled on all trails. The rule is noncompliant if the validation is not enabled. This rule ensures that pipeline resources such as the CodeBuild project aren’t altered to bypass critical vulnerability checks.

Security of the pipeline is implemented using IAM roles and S3 bucket policies to restrict access to pipeline resources. Pipeline data at rest and in transit is protected using encryption and SSL secure transport. We use Parameter Store to store sensitive information such as API tokens and passwords. To be fully compliant with frameworks such as FedRAMP, other things may be required, such as MFA.

Security in the pipeline is implemented by performing the Secret Analysis, SCA, SAST, DAST, and RASP security checks. Applicable AWS services provide encryption at rest and in transit by default. You can enable additional controls on top of these wherever required.

In the next section, I explain how to deploy and run the pipeline CloudFormation template used for this example. As a best practice, we recommend using linting tools like cfn-nag and cfn-guard to scan CloudFormation templates for security vulnerabilities. Refer to the provided service links to learn more about each of the services in the pipeline.

Prerequisites

Before getting started, make sure you have the following prerequisites:

  • An EKS cluster environment with your application deployed. In this post, we use PHP WordPress as a sample application, but you can use any other application.
  • Sysdig Falco installed on an EKS cluster. Sysdig Falco captures events on the EKS cluster and sends those events to CloudWatch using AWS FireLens. For implementation instructions, see Implementing Runtime security in Amazon EKS using CNCF Falco. This step is required only if you need to implement RASP in the software factory.
  • A CodeCommit repo with your application code and a Dockerfile. For more information, see Create an AWS CodeCommit repository.
  • An Amazon ECR repo to store container images and scan for vulnerabilities. Enable vulnerability scanning on image push in Amazon ECR. You can enable or disable the automatic scanning on image push via the Amazon ECR
  • The provided buildspec-*.yml files for git-secrets, Anchore, Snyk, Amazon ECR, OWASP ZAP, and your Kubernetes deployment .yml files uploaded to the root of the application code repository. Please update the Kubernetes (kubectl) commands in the buildspec files as needed.
  • A Snyk API key if you use Snyk as a SAST tool.
  • The Lambda function uploaded to an S3 bucket. We use this function to parse the scan reports and post the results to Security Hub.
  • An OWASP ZAP URL and generated API key for dynamic web scanning.
  • An application web URL to run the DAST testing.
  • An email address to receive approval notifications for deployment, pipeline change notifications, and CloudTrail events.
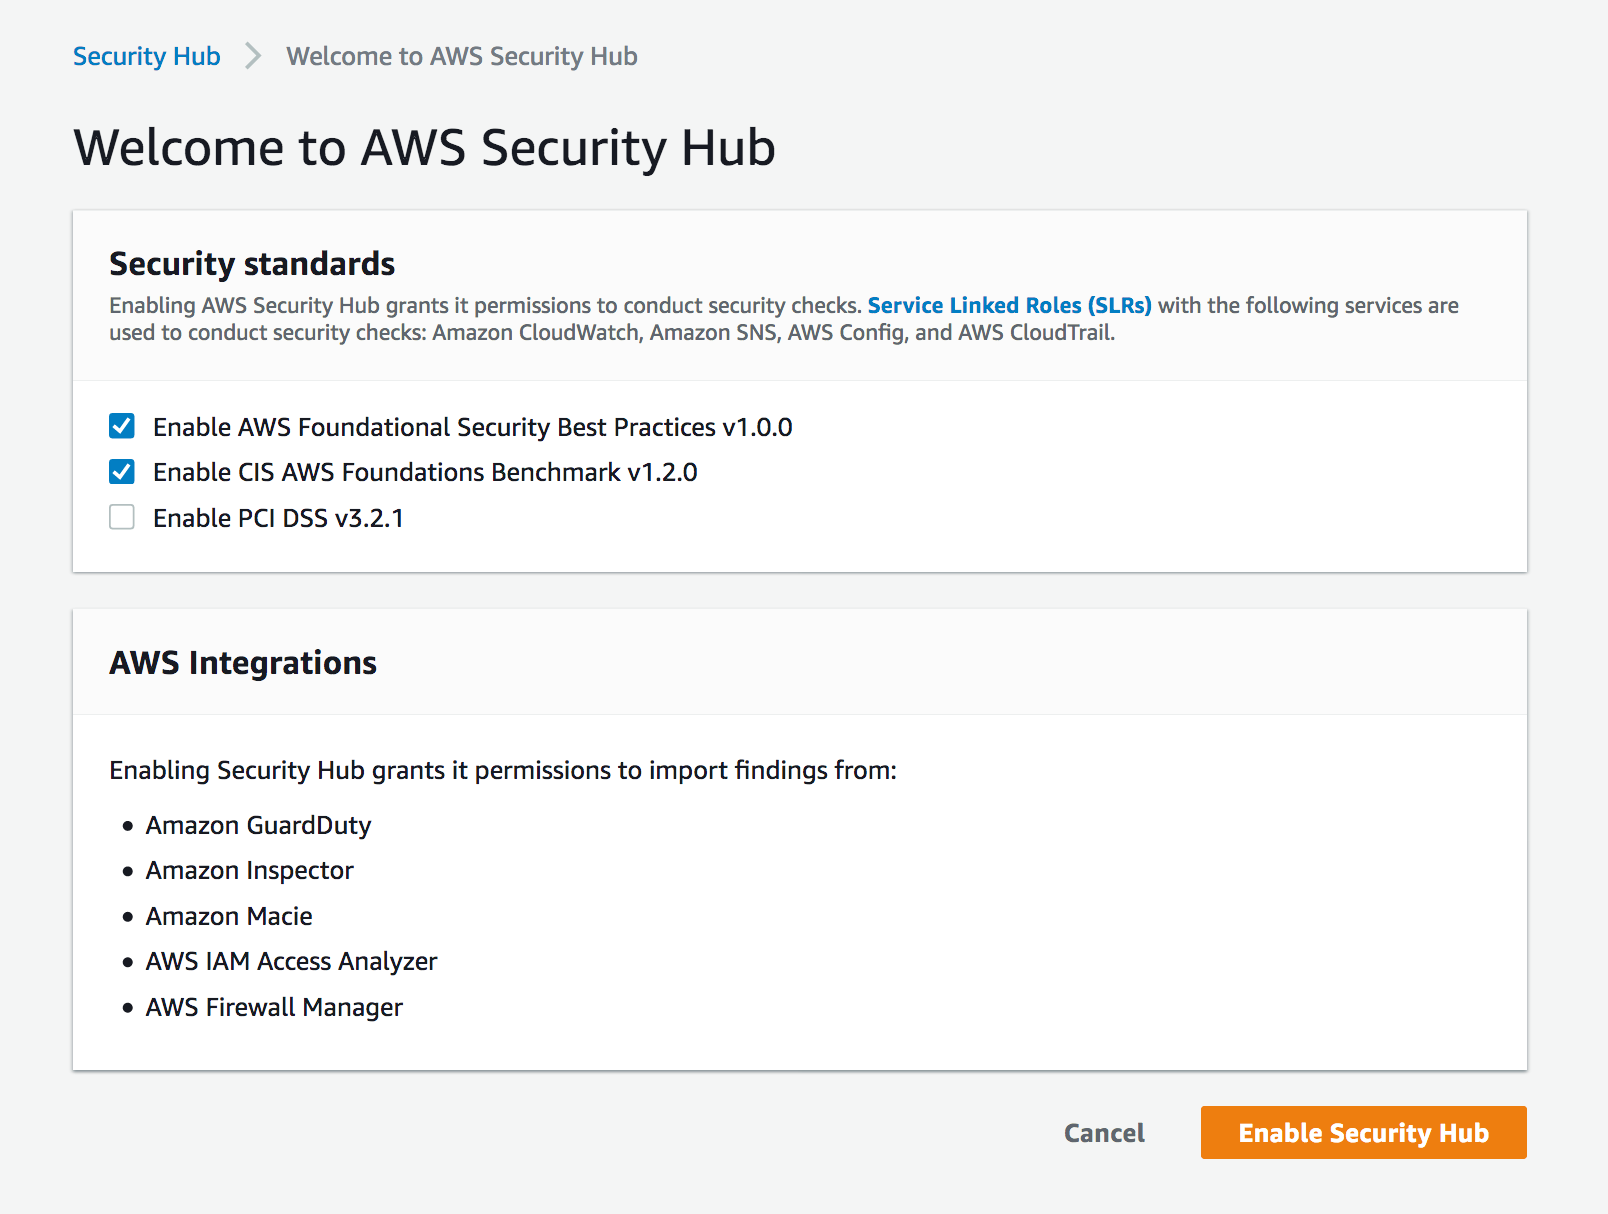
  • AWS Config and Security Hub services enabled. For instructions, see Managing the Configuration Recorder and Enabling Security Hub manually, respectively.

Deploying the pipeline

To deploy the pipeline, complete the following steps:

  1. Download the CloudFormation template and pipeline code from the GitHub repo.
  2. Sign in to your AWS account if you have not done so already.
  3. On the CloudFormation console, choose Create Stack.
  4. Choose the CloudFormation pipeline template.
  5. Choose Next.
  6. Under Code, provide the following information:
    1. Code details, such as repository name and the branch to trigger the pipeline.
    2. The Amazon ECR container image repository name.
  7. Under SAST, provide the following information:
    1. Choose the SAST tool (Anchore or Snyk) for code analysis.
    2. If you select Snyk, provide an API key for Snyk.
  8. Under DAST, choose the DAST tool (OWASP ZAP) for dynamic testing and enter the API token, DAST tool URL, and the application URL to run the scan.
  9. Under Lambda functions, enter the Lambda function S3 bucket name, filename, and the handler name.
  10. For STG EKS cluster, enter the staging EKS cluster name.
  11. For PRD EKS cluster, enter the production EKS cluster name to which this pipeline deploys the container image.
  12. Under General, enter the email addresses to receive notifications for approvals and pipeline status changes.
  13. Choose Next.
  14. Complete the stack.
  15. After the pipeline is deployed, confirm the subscription by choosing the provided link in the email to receive notifications.
Pipeline-CF-Parameters.png

Pipeline CloudFormation Parameters

The provided CloudFormation template in this post is formatted for AWS GovCloud. If you’re setting this up in a standard Region, you have to adjust the partition name in the CloudFormation template. For example, change ARN values from arn:aws-us-gov to arn:aws.

Running the pipeline

To trigger the pipeline, commit changes to your application repository files. That generates a CloudWatch event and triggers the pipeline. CodeBuild scans the code and if there are any vulnerabilities, it invokes the Lambda function to parse and post the results to Security Hub.

When posting the vulnerability finding information to Security Hub, we need to provide a vulnerability severity level. Based on the provided severity value, Security Hub assigns the label as follows. Adjust the severity levels in your code based on your organization’s requirements.

  • 0 – INFORMATIONAL
  • 1–39 – LOW
  • 40– 69 – MEDIUM
  • 70–89 – HIGH
  • 90–100 – CRITICAL

The following screenshot shows the progression of your pipeline.

DevSecOps-Pipeline.png

DevSecOps Kubernetes CI/CD Pipeline


Secrets analysis scanning

In this architecture, after the pipeline is initiated, CodeBuild triggers the Secret Analysis stage using git-secrets and the buildspec-gitsecrets.yml file. Git-Secrets looks for any sensitive information such as AWS access keys and secret access keys. Git-Secrets allows you to add custom strings to look for in your analysis. CodeBuild uses the provided buildspec-gitsecrets.yml file during the build stage.

SCA and SAST scanning

In this architecture, CodeBuild triggers the SCA and SAST scanning using Anchore, Snyk, and Amazon ECR. In this solution, we use the open-source versions of Anchore and Snyk. Amazon ECR uses open-source Clair under the hood, which comes with Amazon ECR for no additional cost. As mentioned earlier, you can choose Anchore or Snyk to do the initial image scanning.

Scanning with Anchore

If you choose Anchore as a SAST tool during the deployment, the build stage uses the buildspec-anchore.yml file to scan the container image. If there are any vulnerabilities, it fails the build and triggers the Lambda function to post those findings to Security Hub. If there are no vulnerabilities, it proceeds to next stage.

Anchore-lambda-codesnippet.png

Anchore Lambda Code Snippet

Scanning with Snyk

If you choose Snyk as a SAST tool during the deployment, the build stage uses the buildspec-snyk.yml file to scan the container image. If there are any vulnerabilities, it fails the build and triggers the Lambda function to post those findings to Security Hub. If there are no vulnerabilities, it proceeds to next stage.

Snyk-lambda-codesnippet.png

Snyk Lambda Code Snippet

Scanning with Amazon ECR

If there are no vulnerabilities from Anchore or Snyk scanning, the image is pushed to Amazon ECR, and the Amazon ECR scan is triggered automatically. Amazon ECR lists the vulnerability findings on the Amazon ECR console. To provide a single pane of glass view of all the vulnerability findings and for easy administration, we retrieve those findings and post them to Security Hub. If there are no vulnerabilities, the image is deployed to the EKS staging cluster and next stage (DAST scanning) is triggered.

ECR-lambda-codesnippet.png

ECR Lambda Code Snippet


DAST scanning with OWASP ZAP

In this architecture, CodeBuild triggers DAST scanning using the DAST tool OWASP ZAP.

After deployment is successful, CodeBuild initiates the DAST scanning. When scanning is complete, if there are any vulnerabilities, it invokes the Lambda function, similar to SAST analysis. The function parses and posts the results to Security Hub. The following is the code snippet of the Lambda function.

Zap-lambda-codesnippet.png

Zap Lambda Code Snippet

The following screenshot shows the results in Security Hub. The highlighted section shows the vulnerability findings from various scanning stages.

SecurityHub-vulnerabilities.png

Vulnerability Findings in Security Hub

We can drill down to individual resource IDs to get the list of vulnerability findings. For example, if we drill down to the resource ID of SASTBuildProject*, we can review all the findings from that resource ID.

Anchore-Vulnerability.png

SAST Vulnerabilities in Security Hub


If there are no vulnerabilities in the DAST scan, the pipeline proceeds to the manual approval stage and an email is sent to the approver. The approver can review and approve or reject the deployment. If approved, the pipeline moves to next stage and deploys the application to the production EKS cluster.

Aggregation of vulnerability findings in Security Hub provides opportunities to automate the remediation. For example, based on the vulnerability finding, you can trigger a Lambda function to take the needed remediation action. This also reduces the burden on operations and security teams because they can now address the vulnerabilities from a single pane of glass instead of logging into multiple tool dashboards.

Along with Security Hub, you can send vulnerability findings to your issue tracking systems such as JIRA, Systems Manager SysOps, or can automatically create an incident management ticket. This is outside the scope of this post, but is one of the possibilities you can consider when implementing DevSecOps software factories.

RASP scanning

Sysdig Falco is an open-source runtime security tool. Based on the configured rules, Falco can detect suspicious activity and alert on any behavior that involves making Linux system calls. You can use Falco rules to address security controls like NIST SP 800-53. Falco agents on each EKS node continuously scan the containers running in pods and send the events as STDOUT. These events can be then sent to CloudWatch or any third-party log aggregator to send alerts and respond. For more information, see Implementing Runtime security in Amazon EKS using CNCF Falco. You can also use Lambda to trigger and automatically remediate certain security events.

The following screenshot shows Falco events on the CloudWatch console. The highlighted text describes the Falco event that was triggered based on the default Falco rules on the EKS cluster. You can add additional custom rules to meet your security control requirements. You can also trigger responsive actions from these CloudWatch events using services like Lambda.

Falco alerts in CloudWatch

Falco alerts in CloudWatch

Cleanup

This section provides instructions to clean up the DevSecOps pipeline setup:

  1. Delete the EKS cluster.
  2. Delete the S3 bucket.
  3. Delete the CodeCommit repo.
  4. Delete the Amazon ECR repo.
  5. Disable Security Hub.
  6. Disable AWS Config.
  7. Delete the pipeline CloudFormation stack.

Conclusion

In this post, I presented an end-to-end Kubernetes-based DevSecOps software factory on AWS with continuous testing, continuous logging and monitoring, auditing and governance, and operations. I demonstrated how to integrate various open-source scanning tools, such as Git-Secrets, Anchore, Snyk, OWASP ZAP, and Sysdig Falco for Secret Analysis, SCA, SAST, DAST, and RASP analysis, respectively. To reduce operations overhead, I explained how to aggregate and manage vulnerability findings in Security Hub as a single pane of glass. This post also talked about how to implement security of the pipeline and in the pipeline using AWS Cloud-native services. Finally, I provided the DevSecOps software factory as code using AWS CloudFormation.

To get started with DevSecOps on AWS, see AWS DevOps and the DevOps blog.

Srinivas Manepalli is a DevSecOps Solutions Architect in the U.S. Fed SI SA team at Amazon Web Services (AWS). He is passionate about helping customers, building and architecting DevSecOps and highly available software systems. Outside of work, he enjoys spending time with family, nature and good food.


GitLab Watchman – Audit Gitlab For Sensitive Data & Credentials

Post Syndicated from original https://www.darknet.org.uk/2021/02/gitlab-watchman-audit-gitlab-for-sensitive-data-credentials/?utm_source=rss&utm_medium=social&utm_campaign=darknetfeed

GitLab Watchman – Audit Gitlab For Sensitive Data & Credentials

GitLab Watchman is an application that uses the GitLab API to audit GitLab for sensitive data and credentials exposed internally – this includes code, commits, wiki pages and more.

GitLab Watchman searches GitLab for internally shared projects and looks at:

  • Code
  • Commits
  • Wiki pages
  • Issues
  • Merge requests
  • Milestones

For the following data:

  • GCP keys and service account files
  • AWS keys
  • Azure keys and service account files
  • Google API keys
  • Slack API tokens & webhooks
  • Private keys (SSH, PGP, any other misc private key)
  • Exposed tokens (Bearer tokens, access tokens, client_secret etc.)
  • S3 config files
  • Passwords in plaintext
  • CICD variables exposed publicly
  • and more

Using GitLab Watchman to Audit Gitlab For Sensitive Data

GitLab Watchman will be installed as a global command, use as follows:

usage: gitlab-watchman [-h] –timeframe {d,w,m,a} –output
{file,stdout,stream} [–version] [–all] [–blobs]
[–commits] [–wiki-blobs] [–issues] [–merge-requests]
[–milestones] [–comments]

Monitoring GitLab for sensitive data shared publicly

optional arguments:
-h, –help show this help message and exit
–version show program’s version number and exit
–all Find everything
–blobs Search code blobs
–commits Search commits
–wiki-blobs Search wiki blobs
–issues Search issues
–merge-requests Search merge requests
–milestones Search milestones
–comments Search comments

required arguments:
–timeframe {d,w,m,a}
How far back to search: d = 24 hours w = 7 days, m =
30 days, a = all time
–output {file,stdout,stream}
Where to send results

You can run GitLab Watchman to look for everything, and output to default Stdout:

gitlab-watchman –timeframe a –all

Or arguments can be grouped together to search more granularly.

Read the rest of GitLab Watchman – Audit Gitlab For Sensitive Data & Credentials now! Only available at Darknet.

Finding Results at the Intersection of Security and Engineering

Post Syndicated from Chaim Mazal original https://blog.rapid7.com/2021/01/25/finding-results-at-the-intersection-of-security-and-engineering/

Finding Results at the Intersection of Security and Engineering

As vice president and head of global security at ActiveCampaign, I’m fortunate to be able to draw on a multitude of experiences and successes in my career. I started in general network security, where I was involved in pen testing and security research. I worked at several multibillion-dollar SaaS organizations—including three of the largest startups in Chicago—building out end-to-end application security programs, secure software-development lifecycles, and comprehensive security platforms.

From a solution-focused standpoint, I’ve learned that collaborating with teams to build a security culture is way more effective than simply identifying and assigning tasks.

Our “team up” approach

At ActiveCampaign, security is a full-fledged member of the technology organization. We adopt an engineering-first approach, eschewing traditional “just-throw-it-over-the-wall” actions. So, we certainly consider ourselves to be more than simply an advisory or compliance team. I’m proud of the fact that we roll up our sleeves and are right there with other parts of the tech organization, leading innovation and helping maintain compliance and deployment. The earlier you can build security into the process, the better (and the more money you’ll eventually save). We never want DevOps to feel like they need to complete tasks in a vacuum—instead, we’re partners.  

This extends to how we secure and deploy our cloud-based fleet. We don’t feel that we need to constantly maintain assets—rather, we look at them holistically and integrate solutions across the quarter. To achieve this view, we rely on Rapid7 solutions like InsightIDR dashboards. They help us to see whether anything has gone outside of our established parameters, serving as a continuous validation that procedures within our cloud-based policies are working without variance. They act as a last line of defense, if you will. So, when alerts for cloud-based tools do come in, security teams can draft project plans to help alleviate risk, create guardrails to deploy assets across environments, and then partner up to get it all done. This is an untraditional approach, but one where we’ve seen a ton of success in strengthening partnerships across the organization.

What we’ve achieved

During my time at ActiveCampaign, our approach has yielded what I believe are strong results and achievements. In this industry, we all have similar challenges, so it demands tailored solutions. There’s risk in convincing stakeholders to continually integrate new processes in the hope that it will all pay off at some future date. But this team believed in that work. So, here are just a few of our successes:

  • The security team has ramped up to a hands-on role in the development of templates, solutions, and real-time cloud-based policy. This has helped to enable our DevOps and engineering orgs to take a more efficient, security-first approach.
  • We now have the ability to execute one-click deployments across 90% of our fleet through automations and managed instances.
  • You can’t fix what you don’t have visibility into, so we put in the effort to get to a place where we have full uniform deployments of logging and security tooling across our fleet.
  • For greater transparency, we created parity across different asset types. This meant developing multiple classifications as well as asset-based safeguards and controls. From there, we had a clearer understanding of organizational limitations that enabled us to collaborate efficiently across teams to resolve issues.
  • We can take steps to get to a future state, even if something doesn’t work today. As such, we’ve become extremely flexible at developing stop-gap measures while simultaneously working on long-term paths to upgrade or resolve issues.

Some key tips and takeaways

I don’t believe there is any one perfect path, and no doubt your path will be different than ours here at ActiveCampaign. In my view, it’s about leveraging teamwork and partnerships to achieve your DevSecOps goals. That being said, let’s discuss a few learnings that might be helpful.  

  • If you have to do something more than once, see if there is a way to automate that process going forward. Being more efficient doesn’t cost a thing.
  • Convincing stakeholders and potential partners that the security org is more than, well, a security org, can go a long way in gaining support from decision-makers beyond or above your teams. Security can be an engineering partner that helps to power profit and value.
  • Get to your future state by proactively creating project plans that add insight into or address current investment limitations on your security team(s).
  • When it comes to partnering, there is also the other side of the proverbial coin. And that is not to assume everyone will have the same enthusiasm to work together across orgs. So, the takeaway here would be to communicate that DevSecOps is a shared responsibility, and not meant to be an inefficient detractor from a mission statement. In this way, everyone’s path to that shared responsibility will be different, but always remember that partnering—especially earlier in the process—is meant to create efficiencies.

The future state

Security, in its ideal form, is something for which we’ll always strive. At ActiveCampaign, we try to continuously make strides toward that “engineering org” situation. Time and again with efforts to align security to the customer value, I’m happy to see stakeholders—from the C-suite to board members—ultimately start to see how customers benefit. Then, it gets easier to obtain additional support so that we can get to that future state of protection, production, and value.    

I love highlighting efforts like those of our security product-engineering team. They’re building authentication features like SSO and MFA into our platform, on behalf of customers. When we can translate more security initiatives into operational and customer value, I get excited about the future of our industry and what we can do to protect and accelerate the pace of business.

Building end-to-end AWS DevSecOps CI/CD pipeline with open source SCA, SAST and DAST tools

Post Syndicated from Srinivas Manepalli original https://aws.amazon.com/blogs/devops/building-end-to-end-aws-devsecops-ci-cd-pipeline-with-open-source-sca-sast-and-dast-tools/

DevOps is a combination of cultural philosophies, practices, and tools that combine software development with information technology operations. These combined practices enable companies to deliver new application features and improved services to customers at a higher velocity. DevSecOps takes this a step further, integrating security into DevOps. With DevSecOps, you can deliver secure and compliant application changes rapidly while running operations consistently with automation.

Having a complete DevSecOps pipeline is critical to building a successful software factory, which includes continuous integration (CI), continuous delivery and deployment (CD), continuous testing, continuous logging and monitoring, auditing and governance, and operations. Identifying the vulnerabilities during the initial stages of the software development process can significantly help reduce the overall cost of developing application changes, but doing it in an automated fashion can accelerate the delivery of these changes as well.

To identify security vulnerabilities at various stages, organizations can integrate various tools and services (cloud and third-party) into their DevSecOps pipelines. Integrating various tools and aggregating the vulnerability findings can be a challenge to do from scratch. AWS has the services and tools necessary to accelerate this objective and provides the flexibility to build DevSecOps pipelines with easy integrations of AWS cloud native and third-party tools. AWS also provides services to aggregate security findings.

In this post, we provide a DevSecOps pipeline reference architecture on AWS that covers the afore-mentioned practices, including SCA (Software Composite Analysis), SAST (Static Application Security Testing), DAST (Dynamic Application Security Testing), and aggregation of vulnerability findings into a single pane of glass. Additionally, this post addresses the concepts of security of the pipeline and security in the pipeline.

You can deploy this pipeline in either the AWS GovCloud Region (US) or standard AWS Regions. As of this writing, all listed AWS services are available in AWS GovCloud (US) and authorized for FedRAMP High workloads within the Region, with the exception of AWS CodePipeline and AWS Security Hub, which are in the Region and currently under the JAB Review to be authorized shortly for FedRAMP High as well.

Services and tools

In this section, we discuss the various AWS services and third-party tools used in this solution.

CI/CD services

For CI/CD, we use the following AWS services:

  • AWS CodeBuild – A fully managed continuous integration service that compiles source code, runs tests, and produces software packages that are ready to deploy.
  • AWS CodeCommit – A fully managed source control service that hosts secure Git-based repositories.
  • AWS CodeDeploy – A fully managed deployment service that automates software deployments to a variety of compute services such as Amazon Elastic Compute Cloud (Amazon EC2), AWS Fargate, AWS Lambda, and your on-premises servers.
  • AWS CodePipeline – A fully managed continuous delivery service that helps you automate your release pipelines for fast and reliable application and infrastructure updates.
  • AWS Lambda – A service that lets you run code without provisioning or managing servers. You pay only for the compute time you consume.
  • Amazon Simple Notification Service – Amazon SNS is a fully managed messaging service for both application-to-application (A2A) and application-to-person (A2P) communication.
  • Amazon Simple Storage Service – Amazon S3 is storage for the internet. You can use Amazon S3 to store and retrieve any amount of data at any time, from anywhere on the web.
  • AWS Systems Manager Parameter Store – Parameter Store gives you visibility and control of your infrastructure on AWS.

Continuous testing tools

The following are open-source scanning tools that are integrated in the pipeline for the purposes of this post, but you could integrate other tools that meet your specific requirements. You can use the static code review tool Amazon CodeGuru for static analysis, but at the time of this writing, it’s not yet available in GovCloud and currently supports Java and Python (available in preview).

  • OWASP Dependency-Check – A Software Composition Analysis (SCA) tool that attempts to detect publicly disclosed vulnerabilities contained within a project’s dependencies.
  • SonarQube (SAST) – Catches bugs and vulnerabilities in your app, with thousands of automated Static Code Analysis rules.
  • PHPStan (SAST) – Focuses on finding errors in your code without actually running it. It catches whole classes of bugs even before you write tests for the code.
  • OWASP Zap (DAST) – Helps you automatically find security vulnerabilities in your web applications while you’re developing and testing your applications.

Continuous logging and monitoring services

The following are AWS services for continuous logging and monitoring:

Auditing and governance services

The following are AWS auditing and governance services:

  • AWS CloudTrail – Enables governance, compliance, operational auditing, and risk auditing of your AWS account.
  • AWS Identity and Access Management – Enables you to manage access to AWS services and resources securely. With IAM, you can create and manage AWS users and groups, and use permissions to allow and deny their access to AWS resources.
  • AWS Config – Allows you to assess, audit, and evaluate the configurations of your AWS resources.

Operations services

The following are AWS operations services:

  • AWS Security Hub – Gives you a comprehensive view of your security alerts and security posture across your AWS accounts. This post uses Security Hub to aggregate all the vulnerability findings as a single pane of glass.
  • AWS CloudFormation – Gives you an easy way to model a collection of related AWS and third-party resources, provision them quickly and consistently, and manage them throughout their lifecycles, by treating infrastructure as code.
  • AWS Systems Manager Parameter Store – Provides secure, hierarchical storage for configuration data management and secrets management. You can store data such as passwords, database strings, Amazon Machine Image (AMI) IDs, and license codes as parameter values.
  • AWS Elastic Beanstalk – An easy-to-use service for deploying and scaling web applications and services developed with Java, .NET, PHP, Node.js, Python, Ruby, Go, and Docker on familiar servers such as Apache, Nginx, Passenger, and IIS. This post uses Elastic Beanstalk to deploy LAMP stack with WordPress and Amazon Aurora MySQL. Although we use Elastic Beanstalk for this post, you could configure the pipeline to deploy to various other environments on AWS or elsewhere as needed.

Pipeline architecture

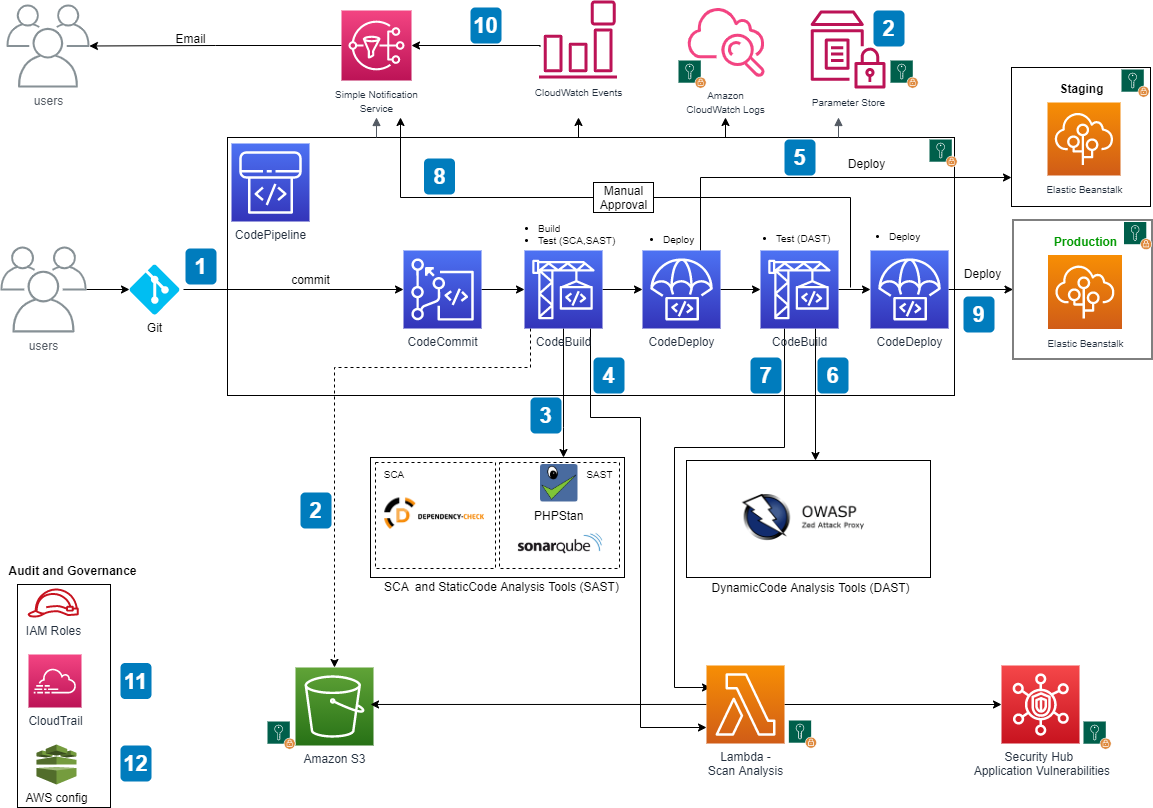
The following diagram shows the architecture of the solution.

AWS DevSecOps CICD pipeline architecture

AWS DevSecOps CICD pipeline architecture


The main steps are as follows:

  1. When a user commits the code to a CodeCommit repository, a CloudWatch event is generated which, triggers CodePipeline.
  2. CodeBuild packages the build and uploads the artifacts to an S3 bucket. CodeBuild retrieves the authentication information (for example, scanning tool tokens) from Parameter Store to initiate the scanning. As a best practice, it is recommended to utilize Artifact repositories like AWS CodeArtifact to store the artifacts, instead of S3. For simplicity of the workshop, we will continue to use S3.
  3. CodeBuild scans the code with an SCA tool (OWASP Dependency-Check) and SAST tool (SonarQube or PHPStan; in the provided CloudFormation template, you can pick one of these tools during the deployment, but CodeBuild is fully enabled for a bring your own tool approach).
  4. If there are any vulnerabilities either from SCA analysis or SAST analysis, CodeBuild invokes the Lambda function. The function parses the results into AWS Security Finding Format (ASFF) and posts it to Security Hub. Security Hub helps aggregate and view all the vulnerability findings in one place as a single pane of glass. The Lambda function also uploads the scanning results to an S3 bucket.
  5. If there are no vulnerabilities, CodeDeploy deploys the code to the staging Elastic Beanstalk environment.
  6. After the deployment succeeds, CodeBuild triggers the DAST scanning with the OWASP ZAP tool (again, this is fully enabled for a bring your own tool approach).
  7. If there are any vulnerabilities, CodeBuild invokes the Lambda function, which parses the results into ASFF and posts it to Security Hub. The function also uploads the scanning results to an S3 bucket (similar to step 4).
  8. If there are no vulnerabilities, the approval stage is triggered, and an email is sent to the approver for action.
  9. After approval, CodeDeploy deploys the code to the production Elastic Beanstalk environment.
  10. During the pipeline run, CloudWatch Events captures the build state changes and sends email notifications to subscribed users through SNS notifications.
  11. CloudTrail tracks the API calls and send notifications on critical events on the pipeline and CodeBuild projects, such as UpdatePipeline, DeletePipeline, CreateProject, and DeleteProject, for auditing purposes.
  12. AWS Config tracks all the configuration changes of AWS services. The following AWS Config rules are added in this pipeline as security best practices:
  13. CODEBUILD_PROJECT_ENVVAR_AWSCRED_CHECK – Checks whether the project contains environment variables AWS_ACCESS_KEY_ID and AWS_SECRET_ACCESS_KEY. The rule is NON_COMPLIANT when the project environment variables contains plaintext credentials.
  14. CLOUD_TRAIL_LOG_FILE_VALIDATION_ENABLED – Checks whether CloudTrail creates a signed digest file with logs. AWS recommends that the file validation be enabled on all trails. The rule is noncompliant if the validation is not enabled.

Security of the pipeline is implemented by using IAM roles and S3 bucket policies to restrict access to pipeline resources. Pipeline data at rest and in transit is protected using encryption and SSL secure transport. We use Parameter Store to store sensitive information such as API tokens and passwords. To be fully compliant with frameworks such as FedRAMP, other things may be required, such as MFA.

Security in the pipeline is implemented by performing the SCA, SAST and DAST security checks. Alternatively, the pipeline can utilize IAST (Interactive Application Security Testing) techniques that would combine SAST and DAST stages.

As a best practice, encryption should be enabled for the code and artifacts, whether at rest or transit.

In the next section, we explain how to deploy and run the pipeline CloudFormation template used for this example. Refer to the provided service links to learn more about each of the services in the pipeline. If utilizing CloudFormation templates to deploy infrastructure using pipelines, we recommend using linting tools like cfn-nag to scan CloudFormation templates for security vulnerabilities.

Prerequisites

Before getting started, make sure you have the following prerequisites:

Deploying the pipeline

To deploy the pipeline, complete the following steps: Download the CloudFormation template and pipeline code from GitHub repo.

  1. Log in to your AWS account if you have not done so already.
  2. On the CloudFormation console, choose Create Stack.
  3. Choose the CloudFormation pipeline template.
  4. Choose Next.
  5. Provide the stack parameters:
    • Under Code, provide code details, such as repository name and the branch to trigger the pipeline.
    • Under SAST, choose the SAST tool (SonarQube or PHPStan) for code analysis, enter the API token and the SAST tool URL. You can skip SonarQube details if using PHPStan as the SAST tool.
    • Under DAST, choose the DAST tool (OWASP Zap) for dynamic testing and enter the API token, DAST tool URL, and the application URL to run the scan.
    • Under Lambda functions, enter the Lambda function S3 bucket name, filename, and the handler name.
    • Under STG Elastic Beanstalk Environment and PRD Elastic Beanstalk Environment, enter the Elastic Beanstalk environment and application details for staging and production to which this pipeline deploys the application code.
    • Under General, enter the email addresses to receive notifications for approvals and pipeline status changes.

CF Deploymenet - Passing parameter values

CloudFormation deployment - Passing parameter values

CloudFormation template deployment

After the pipeline is deployed, confirm the subscription by choosing the provided link in the email to receive the notifications.

The provided CloudFormation template in this post is formatted for AWS GovCloud. If you’re setting this up in a standard Region, you have to adjust the partition name in the CloudFormation template. For example, change ARN values from arn:aws-us-gov to arn:aws.

Running the pipeline

To trigger the pipeline, commit changes to your application repository files. That generates a CloudWatch event and triggers the pipeline. CodeBuild scans the code and if there are any vulnerabilities, it invokes the Lambda function to parse and post the results to Security Hub.

When posting the vulnerability finding information to Security Hub, we need to provide a vulnerability severity level. Based on the provided severity value, Security Hub assigns the label as follows. Adjust the severity levels in your code based on your organization’s requirements.

  • 0 – INFORMATIONAL
  • 1–39 – LOW
  • 40– 69 – MEDIUM
  • 70–89 – HIGH
  • 90–100 – CRITICAL

The following screenshot shows the progression of your pipeline.

CodePipeline stages

CodePipeline stages

SCA and SAST scanning

In our architecture, CodeBuild trigger the SCA and SAST scanning in parallel. In this section, we discuss scanning with OWASP Dependency-Check, SonarQube, and PHPStan. 

Scanning with OWASP Dependency-Check (SCA)

The following is the code snippet from the Lambda function, where the SCA analysis results are parsed and posted to Security Hub. Based on the results, the equivalent Security Hub severity level (normalized_severity) is assigned.

Lambda code snippet for OWASP Dependency-check

Lambda code snippet for OWASP Dependency-check

You can see the results in Security Hub, as in the following screenshot.

SecurityHub report from OWASP Dependency-check scanning

SecurityHub report from OWASP Dependency-check scanning

Scanning with SonarQube (SAST)

The following is the code snippet from the Lambda function, where the SonarQube code analysis results are parsed and posted to Security Hub. Based on SonarQube results, the equivalent Security Hub severity level (normalized_severity) is assigned.

Lambda code snippet for SonarQube

Lambda code snippet for SonarQube

The following screenshot shows the results in Security Hub.

SecurityHub report from SonarQube scanning

SecurityHub report from SonarQube scanning

Scanning with PHPStan (SAST)

The following is the code snippet from the Lambda function, where the PHPStan code analysis results are parsed and posted to Security Hub.

Lambda code snippet for PHPStan

Lambda code snippet for PHPStan

The following screenshot shows the results in Security Hub.

SecurityHub report from PHPStan scanning

SecurityHub report from PHPStan scanning

DAST scanning

In our architecture, CodeBuild triggers DAST scanning and the DAST tool.

If there are no vulnerabilities in the SAST scan, the pipeline proceeds to the manual approval stage and an email is sent to the approver. The approver can review and approve or reject the deployment. If approved, the pipeline moves to next stage and deploys the application to the provided Elastic Beanstalk environment.

Scanning with OWASP Zap

After deployment is successful, CodeBuild initiates the DAST scanning. When scanning is complete, if there are any vulnerabilities, it invokes the Lambda function similar to SAST analysis. The function parses and posts the results to Security Hub. The following is the code snippet of the Lambda function.

Lambda code snippet for OWASP-Zap

Lambda code snippet for OWASP-Zap

The following screenshot shows the results in Security Hub.

SecurityHub report from OWASP-Zap scanning

SecurityHub report from OWASP-Zap scanning

Aggregation of vulnerability findings in Security Hub provides opportunities to automate the remediation. For example, based on the vulnerability finding, you can trigger a Lambda function to take the needed remediation action. This also reduces the burden on operations and security teams because they can now address the vulnerabilities from a single pane of glass instead of logging into multiple tool dashboards.

Conclusion

In this post, I presented a DevSecOps pipeline that includes CI/CD, continuous testing, continuous logging and monitoring, auditing and governance, and operations. I demonstrated how to integrate various open-source scanning tools, such as SonarQube, PHPStan, and OWASP Zap for SAST and DAST analysis. I explained how to aggregate vulnerability findings in Security Hub as a single pane of glass. This post also talked about how to implement security of the pipeline and in the pipeline using AWS cloud native services. Finally, I provided the DevSecOps pipeline as code using AWS CloudFormation. For additional information on AWS DevOps services and to get started, see AWS DevOps and DevOps Blog.


Srinivas Manepalli is a DevSecOps Solutions Architect in the U.S. Fed SI SA team at Amazon Web Services (AWS). He is passionate about helping customers, building and architecting DevSecOps and highly available software systems. Outside of work, he enjoys spending time with family, nature and good food.
Shifting Security Right: How Cloud-Based SecOps Can Speed Processes While Maintaining Integrity

Post Syndicated from Aaron Wells original https://blog.rapid7.com/2021/01/04/shifting-security-right-how-cloud-based-secops-can-speed-processes-while-maintaining-integrity/

Shifting Security Right: How Cloud-Based SecOps Can Speed Processes While Maintaining Integrity

When it comes to offloading security controls to the cloud, it may seem counterintuitive to the notion of “securing” things. But, when we consider the efficiency to be gained by shifting right with some security controls, it makes sense to send more granular, ground-up responsibilities to a trusted managed services cloud partner. This could help to increase development-and-deployment velocity, without compromising the integrity of your bespoke process.  

Building a true DevSecOps ecosystem is probably a common goal for most teams. However, uncommonality most often enters the picture in the forms of both technical and organizational roadblocks. Let’s take a look at some key insights from a 2020 SANS Institute survey on current industry efforts to more closely integrate DevOps and SecOps—and how you can plot your best path forward.
NEVER MISS A BLOG

Get the latest stories, expertise, and news about security today.

The security landscape

In more traditional environments, security teams often feel they’ve been left behind by the pace of DevOps. Vulnerabilities are introduced faster than SecOps can likely find them. The shift is with teams that are building continuous delivery frameworks, with compliance checks at every stage of the game. It becomes a matter of defending the environment as it’s being built.

Currently, about 74% of organizations are deploying changes more than once per month, according to SANS. Often, these are weekly or daily instances. So, velocity is increasing, primarily out of a need to get customers what they need, faster. Traditional change approvals and security controls are becoming more guardrail-style checks. The challenge, however, lies in optimizing the process and keeping it as secure as possible.

Increasing cloud adoption

From a security perspective, transitioning to a cloud provider’s responsibility model can better match the pace of DevOps and increase delivery speed. When both of these velocities are increasing, albeit responsibly, that’s better for business.

  • Cloud-hosted VM platforms allow teams to spin up processes more quickly compared to a traditional setup.
  • Adoption is accelerating for cloud-hosted container services and serverless platforms because providers are doing more provisioning, patching, and upgrading for many existing execution environments.
  • More organizations are running on cloud-hosted VMs versus container services and serverless platforms, but that could change because the latter two options allow you to further reduce your responsibility model.

Multi-cloud motivations

About 92% of organizations run on at least one public cloud provider. But for about 60% of those companies, the main motivations behind spreading services out between multiple providers are not quite as technical as one might imagine.

Mergers and acquisitions can cause obvious complexity, as companies link up and potentially run similar processes in different cloud environments like AWS, Azure, or GCP. There are also decision-makers and teams that prioritize a task-based approach and pick the best environment to get a particular job done. The benefits of a multi-cloud environment could then become drawbacks, as security becomes more difficult to plan for and understand. And no one wants complexity in an approach that is essentially supposed to offload responsibilities and make things easier.

Risk doesn’t translate for SecOps

As more DevOps teams increase their use of JavaScript, traditional security controls don’t support the popular format as well as other legacy languages. In this situation, there is greater risk. However, an older web app that hasn’t been updated in a while could be the tip of the iceberg in terms of the technical debt sitting out there.

Apps built on older languages like Java, .NET, and C++ could leave exposures open as teams roll over to newer languages. So, this situation also presents risk. Security teams may not even be aware they’re in the dark about vulnerabilities those legacy apps present, as they try to keep pace with DevOps.

The future of shifting left

When it comes to security testing phases, there’s still a heavy tendency toward QA. More is being done to integrate those protocols in the process, but the sea change of baking testing into earlier phases largely has yet to occur.  

  • Over the next decade, teams will likely adopt more cloud-based integration tools like AWS CodePipeline, Microsoft Azure DevOps, GitHub Actions, and GitLab CI. In these instances, the cloud provider is managing more for you, minimizing attack surfaces and providing more built-in security. GitHub and GitLab, in particular, are trending toward greater baked-in security.
  • Jenkins has been the continuous integration tool of choice for about the last decade. However, the 24/7 nature of running on-premises or in the cloud to manage builds, releases, and patches can increase the attack surface.
  • When it comes to container orchestration tools, cloud-managed services like AWS Fargate and Azure Container are beginning to pull even with cloud-hosted services like Docker and Kubernetes. It’s becoming more attractive to outsource control-point and hardening responsibilities, so that security can shift further left into containers; it simplifies testing and helps ease deployment.

The future of shifting right

Security-testing responsibility lies with actual security teams about 65% of the time. Yet, managing corrective actions lies with development teams about 63% of the time, according to SANS. These numbers indicate largely siloed actions blocking the path to a true DevSecOps approach.

The biggest success measurement of DevSecOps is the time it takes to fix an issue. Aligning teams to tackle an issue in a speedy manner can make or break. Additionally, identifying post-deployment issues can help to improve shift-left controls to prevent those issues from ever escaping into production.

A 100% cross-functional effort most likely will not be achieved by every organization. However, moving closer to this goal could help strengthen teams, boost morale, and feed back key learnings to ultimately increase the speed of success.

In conclusion

Ironically, the biggest challenge of all isn’t technical in nature. Red tape within organizations can present challenges like lack of buy-in from management, insufficient budget (open-source tools can help here!), and siloed efforts. Additionally, a shortage of skilled workers could reinforce the same old  decision-making patterns at those management levels.  

When it comes to closely aligning teams and getting more time back to innovate, it’s often a cyclical dance of shifting right to improve your efforts in shifting left. For example, can you move further right into the cloud rather than building do-it-yourself, comprehensive solutions to security? Offloading could help to create more controls for enforcing security in tandem with DevOps.

No one wants to compromise the integrity of deploying on time, particularly as it relates to customers and your company’s bottom line. Co-sponsored by Rapid7, this recent SANS webinar presents an in-depth look at key statistics from a recent survey of companies and their advancements—or lack thereof—in DevSecOps.

For more insights, access the full 2020 SANS Institute survey on Extending DevSecOps Security Controls into the Cloud.

Use Macie to discover sensitive data as part of automated data pipelines

Post Syndicated from Brandon Wu original https://aws.amazon.com/blogs/security/use-macie-to-discover-sensitive-data-as-part-of-automated-data-pipelines/

Data is a crucial part of every business and is used for strategic decision making at all levels of an organization. To extract value from their data more quickly, Amazon Web Services (AWS) customers are building automated data pipelines—from data ingestion to transformation and analytics. As part of this process, my customers often ask how to prevent sensitive data, such as personally identifiable information, from being ingested into data lakes when it’s not needed. They highlight that this challenge is compounded when ingesting unstructured data—such as files from process reporting, text files from chat transcripts, and emails. They also mention that identifying sensitive data inadvertently stored in structured data fields—such as in a comment field stored in a database—is also a challenge.

In this post, I show you how to integrate Amazon Macie as part of the data ingestion step in your data pipeline. This solution provides an additional checkpoint that sensitive data has been appropriately redacted or tokenized prior to ingestion. Macie is a fully managed data security and privacy service that uses machine learning and pattern matching to discover sensitive data in AWS.

When Macie discovers sensitive data, the solution notifies an administrator to review the data and decide whether to allow the data pipeline to continue ingesting the objects. If allowed, the objects will be tagged with an Amazon Simple Storage Service (Amazon S3) object tag to identify that sensitive data was found in the object before progressing to the next stage of the pipeline.

This combination of automation and manual review helps reduce the risk that sensitive data—such as personally identifiable information—will be ingested into a data lake. This solution can be extended to fit your use case and workflows. For example, you can define custom data identifiers as part of your scans, add additional validation steps, create Macie suppression rules to archive findings automatically, or only request manual approvals for findings that meet certain criteria (such as high severity findings).

Solution overview

Many of my customers are building serverless data lakes with Amazon S3 as the primary data store. Their data pipelines commonly use different S3 buckets at each stage of the pipeline. I refer to the S3 bucket for the first stage of ingestion as the raw data bucket. A typical pipeline might have separate buckets for raw, curated, and processed data representing different stages as part of their data analytics pipeline.

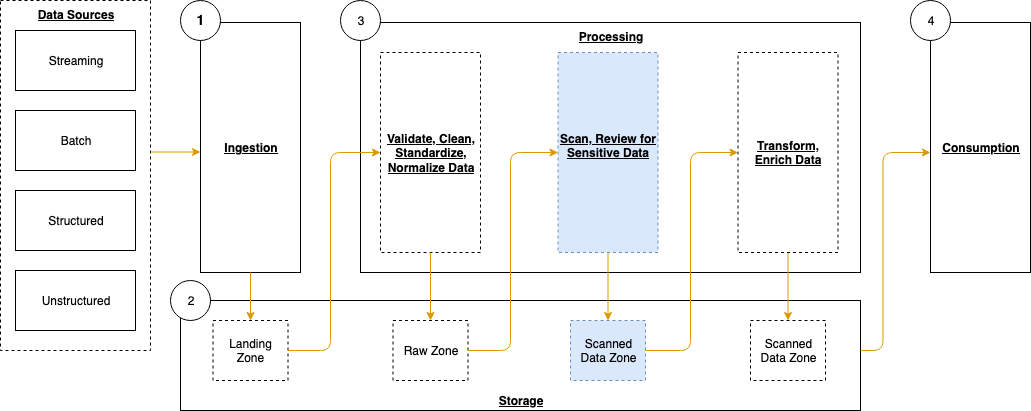
Typically, customers will perform validation and clean their data before moving it to a raw data zone. This solution adds validation steps to that pipeline after preliminary quality checks and data cleaning is performed, noted in blue (in layer 3) of Figure 1. The layers outlined in the pipeline are:

  1. Ingestion – Brings data into the data lake.
  2. Storage – Provides durable, scalable, and secure components to store the data—typically using S3 buckets.
  3. Processing – Transforms data into a consumable state through data validation, cleanup, normalization, transformation, and enrichment. This processing layer is where the additional validation steps are added to identify instances of sensitive data that haven’t been appropriately redacted or tokenized prior to consumption.
  4. Consumption – Provides tools to gain insights from the data in the data lake.


Figure 1: Data pipeline with sensitive data scan

Figure 1: Data pipeline with sensitive data scan

The application runs on a scheduled basis (four times a day, every 6 hours by default) to process data that is added to the raw data S3 bucket. You can customize the application to perform a sensitive data discovery scan during any stage of the pipeline. Because most customers do their extract, transform, and load (ETL) daily, the application scans for sensitive data on a scheduled basis before any crawler jobs run to catalog the data and after typical validation and data redaction or tokenization processes complete.

You can expect that this additional validation will add 5–10 minutes to your pipeline execution at a minimum. The validation processing time will scale linearly based on object size, but there is a start-up time per job that is constant.

If sensitive data is found in the objects, an email is sent to the designated administrator requesting an approval decision, which they indicate by selecting the link corresponding to their decision to approve or deny the next step. In most cases, the reviewer will choose to adjust the sensitive data cleanup processes to remove the sensitive data, deny the progression of the files, and re-ingest the files in the pipeline.

Additional considerations for deploying this application for regular use are discussed at the end of the blog post.

Application components

The following resources are created as part of the application:

Note: the application uses various AWS services, and there are costs associated with these resources after the Free Tier usage. See AWS Pricing for details. The primary drivers of the solution cost will be the amount of data ingested through the pipeline, both for Amazon S3 storage and data processed for sensitive data discovery with Macie.

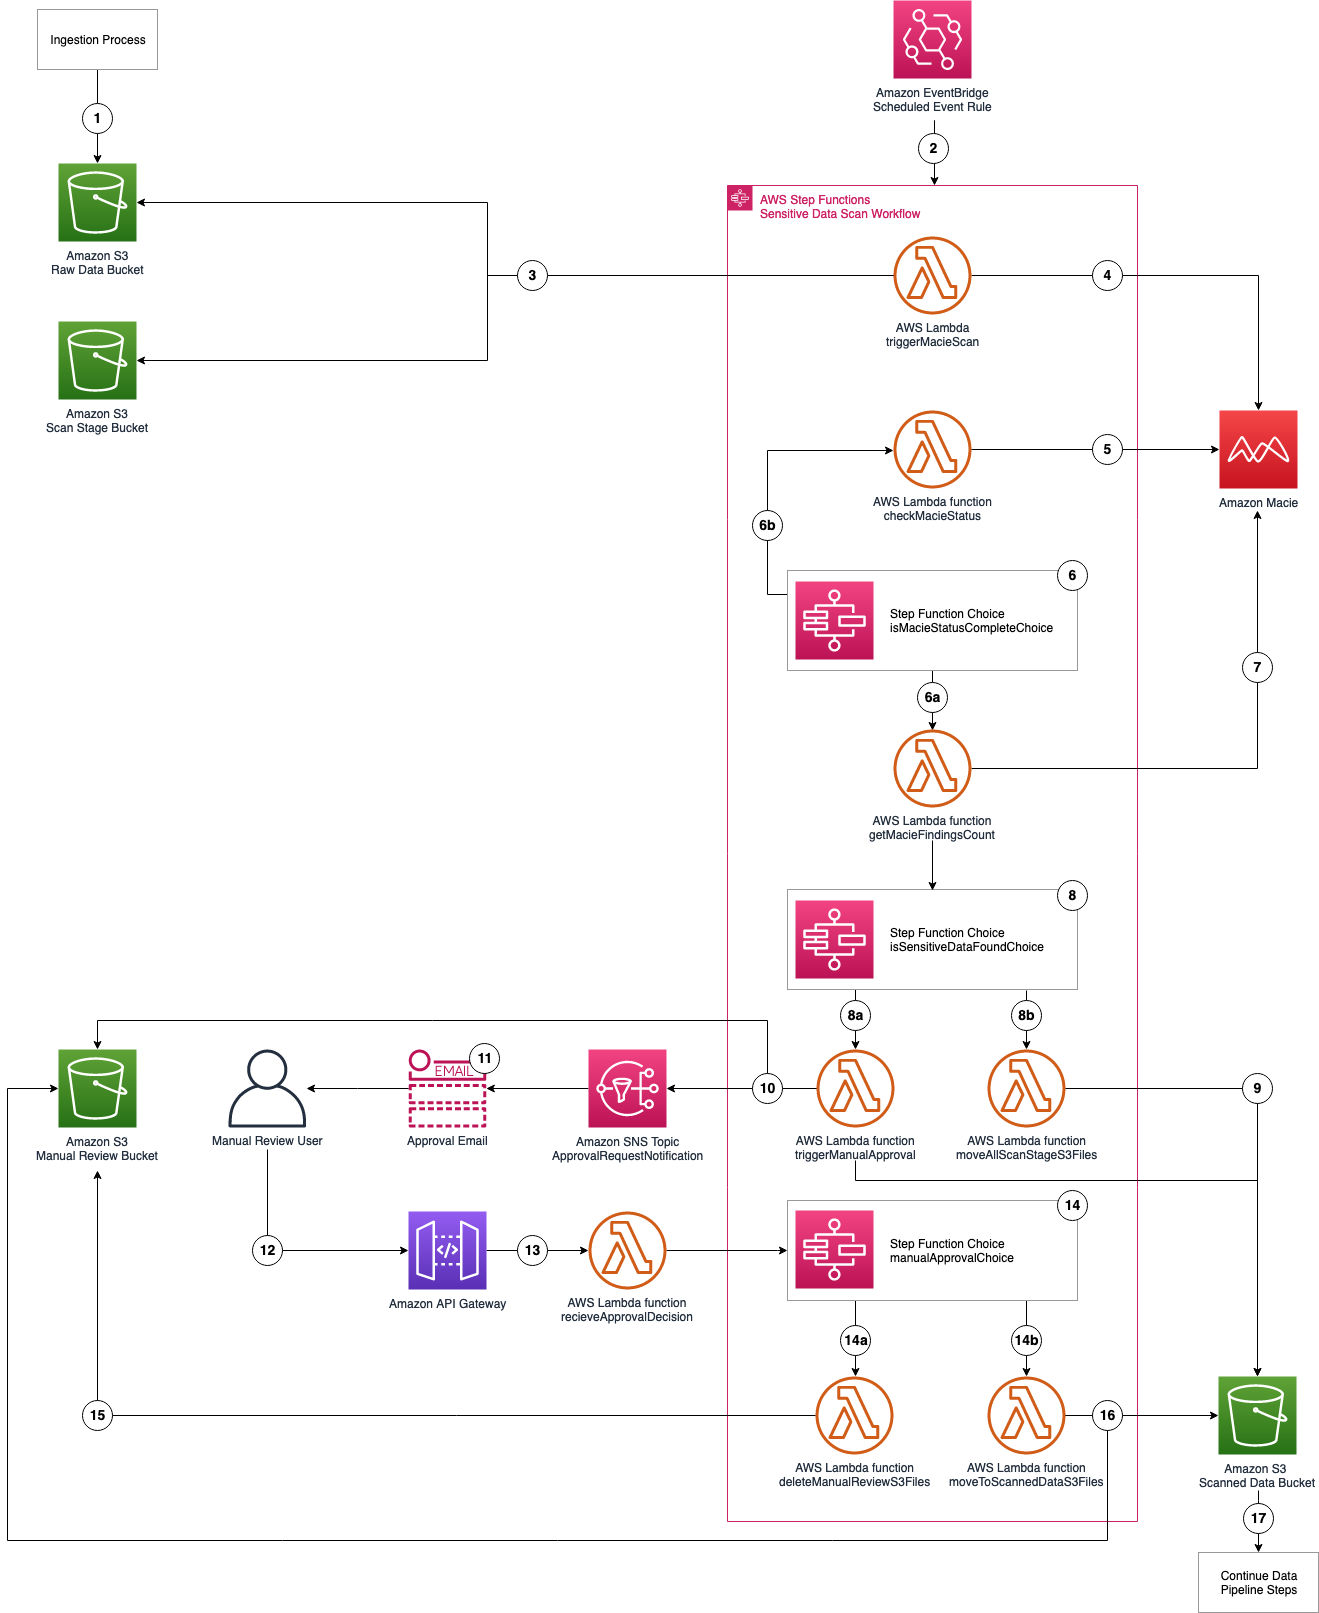
The architecture of the application is shown in Figure 2 and described in the text that follows.
 

Figure 2: Application architecture and logic

Figure 2: Application architecture and logic

Application logic

  1. Objects are uploaded to the raw data S3 bucket as part of the data ingestion process.
  2. A scheduled EventBridge rule runs the sensitive data scan Step Functions workflow.
  3. triggerMacieScan Lambda function moves objects from the raw data S3 bucket to the scan stage S3 bucket.
  4. triggerMacieScan Lambda function creates a Macie sensitive data discovery job on the scan stage S3 bucket.
  5. checkMacieStatus Lambda function checks the status of the Macie sensitive data discovery job.
  6. isMacieStatusCompleteChoice Step Functions Choice state checks whether the Macie sensitive data discovery job is complete.
    1. If yes, the getMacieFindingsCount Lambda function runs.
    2. If no, the Step Functions Wait state waits 60 seconds and then restarts Step 5.
  7. getMacieFindingsCount Lambda function counts all of the findings from the Macie sensitive data discovery job.
  8. isSensitiveDataFound Step Functions Choice state checks whether sensitive data was found in the Macie sensitive data discovery job.
    1. If there was sensitive data discovered, run the triggerManualApproval Lambda function.
    2. If there was no sensitive data discovered, run the moveAllScanStageS3Files Lambda function.
  9. moveAllScanStageS3Files Lambda function moves all of the objects from the scan stage S3 bucket to the scanned data S3 bucket.
  10. triggerManualApproval Lambda function tags and moves objects with sensitive data discovered to the manual review S3 bucket, and moves objects with no sensitive data discovered to the scanned data S3 bucket. The function then sends a notification to the ApprovalRequestNotification Amazon SNS topic as a notification that manual review is required.
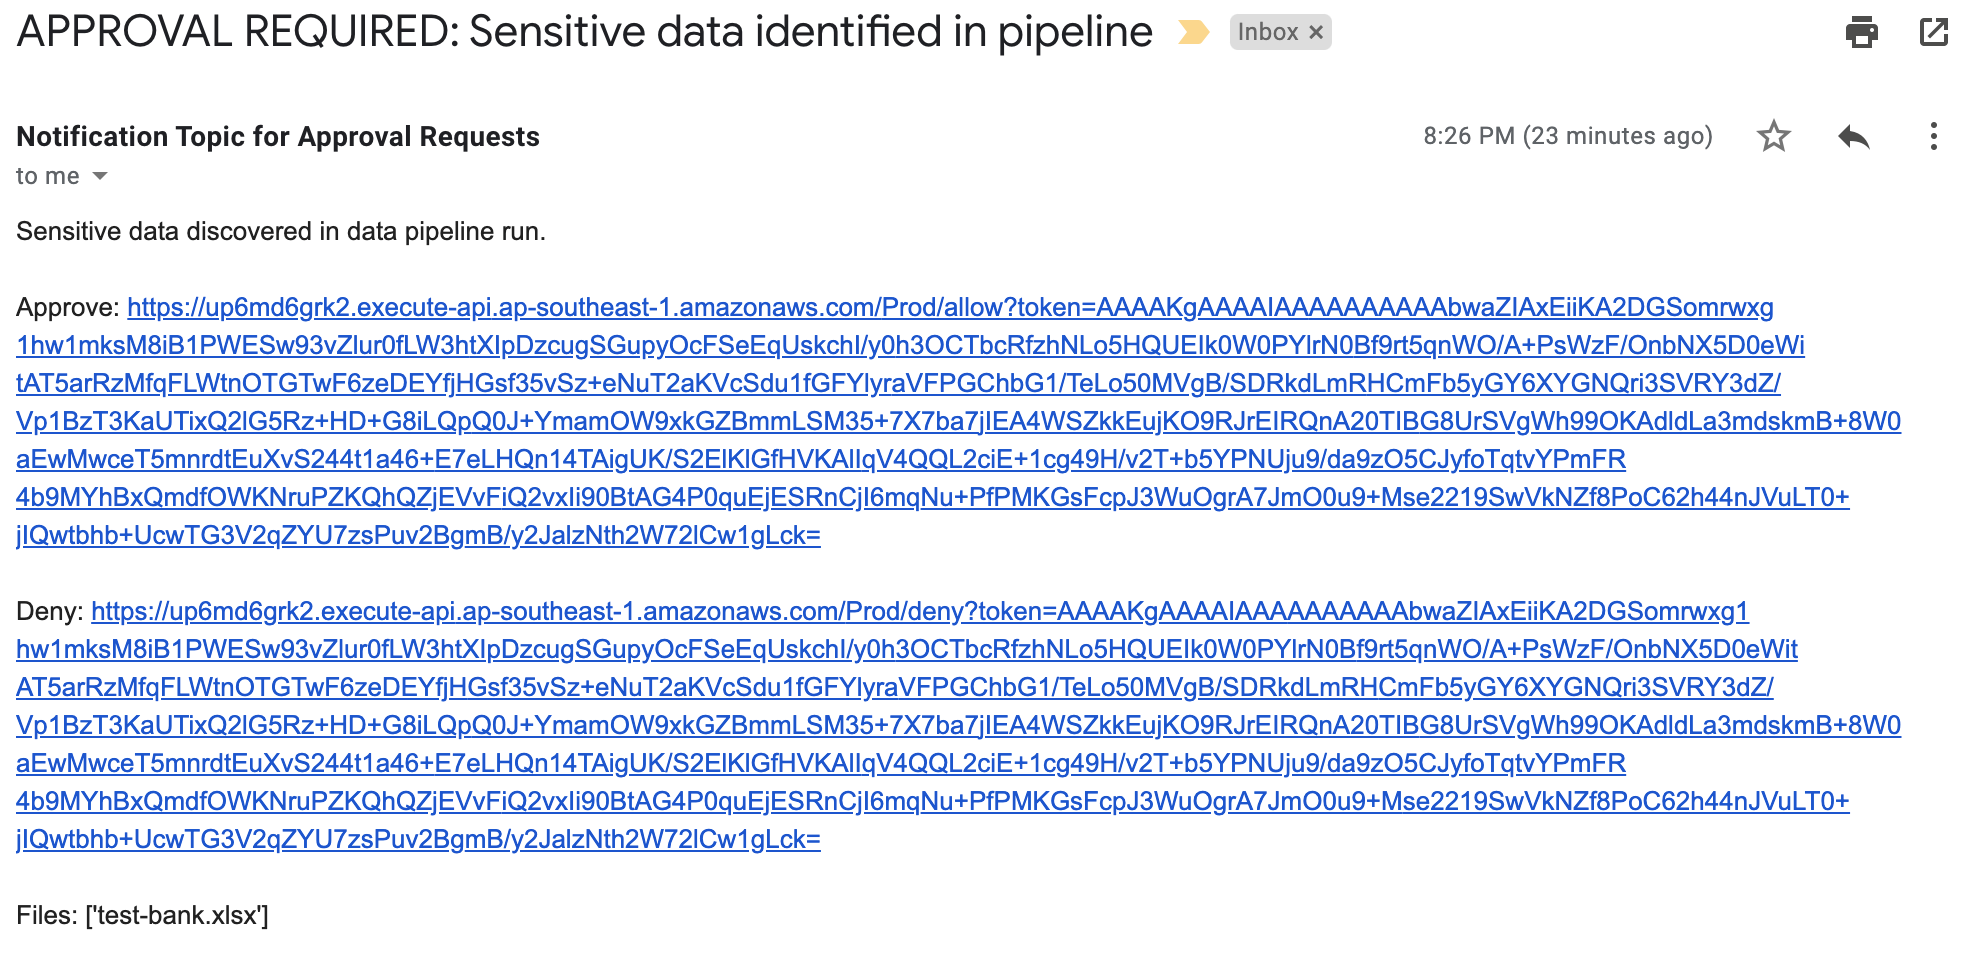
  11. Email is sent to the email address that’s subscribed to the ApprovalRequestNotification Amazon SNS topic (from the application deployment template) for the manual review user with the option to Approve or Deny pipeline ingestion for these objects.
  12. Manual review user assesses the objects with sensitive data in the manual review S3 bucket and selects the Approve or Deny links in the email.
  13. The decision request is sent from the Amazon API Gateway to the receiveApprovalDecision Lambda function.
  14. manualApprovalChoice Step Functions Choice state checks the decision from the manual review user.
    1. If denied, run the deleteManualReviewS3Files Lambda function.
    2. If approved, run the moveToScannedDataS3Files Lambda function.
  15. deleteManualReviewS3Files Lambda function deletes the objects from the manual review S3 bucket.
  16. moveToScannedDataS3Files Lambda function moves the objects from the manual review S3 bucket to the scanned data S3 bucket.
  17. The next step of the automated data pipeline will begin with the objects in the scanned data S3 bucket.

Prerequisites

For this application, you need the following prerequisites:

You can use AWS Cloud9 to deploy the application. AWS Cloud9 includes the AWS CLI and AWS SAM CLI to simplify setting up your development environment.

Deploy the application with AWS SAM CLI

You can deploy this application using the AWS SAM CLI. AWS SAM uses AWS CloudFormation as the underlying deployment mechanism. AWS SAM is an open-source framework that you can use to build serverless applications on AWS.

To deploy the application

  1. Initialize the serverless application using the AWS SAM CLI from the GitHub project in the aws-samples repository. This will clone the project locally which includes the source code for the Lambda functions, Step Functions state machine definition file, and the AWS SAM template. On the command line, run the following:
    sam init --location gh: aws-samples/amazonmacie-datapipeline-scan
    

    Alternatively, you can clone the Github project directly.

  2. Deploy your application to your AWS account. On the command line, run the following:
    sam deploy --guided
    

    Complete the prompts during the guided interactive deployment. The first deployment prompt is shown in the following example.

    Configuring SAM deploy
    ======================
    
            Looking for config file [samconfig.toml] :  Found
            Reading default arguments  :  Success
    
            Setting default arguments for 'sam deploy'
            =========================================
            Stack Name [maciepipelinescan]:
    

  3. Settings:
    • Stack Name – Name of the CloudFormation stack to be created.
    • AWS RegionRegion—for example, us-west-2, eu-west-1, ap-southeast-1—to deploy the application to. This application was tested in the us-west-2 and ap-southeast-1 Regions. Before selecting a Region, verify that the services you need are available in those Regions (for example, Macie and Step Functions).
    • Parameter StepFunctionName – Name of the Step Functions state machine to be created—for example, maciepipelinescanstatemachine).
    • Parameter BucketNamePrefix – Prefix to apply to the S3 buckets to be created (S3 bucket names are globally unique, so choosing a random prefix helps ensure uniqueness).
    • Parameter ApprovalEmailDestination – Email address to receive the manual review notification.
    • Parameter EnableMacie – Whether you need Macie enabled in your account or Region. You can select yes or no; select yes if you need Macie to be enabled for you as part of this template, select no, if you already have Macie enabled.
  4. Confirm changes and provide approval for AWS SAM CLI to deploy the resources to your AWS account by responding y to prompts, as shown in the following example. You can accept the defaults for the SAM configuration file and SAM configuration environment prompts.
    #Shows you resources changes to be deployed and require a 'Y' to initiate deploy
    Confirm changes before deploy [y/N]: y
    #SAM needs permission to be able to create roles to connect to the resources in your template
    Allow SAM CLI IAM role creation [Y/n]: y
    ReceiveApprovalDecisionAPI may not have authorization defined, Is this okay? [y/N]: y
    ReceiveApprovalDecisionAPI may not have authorization defined, Is this okay? [y/N]: y
    Save arguments to configuration file [Y/n]: y
    SAM configuration file [samconfig.toml]: 
    SAM configuration environment [default]:
    

    Note: This application deploys an Amazon API Gateway with two REST API resources without authorization defined to receive the decision from the manual review step. You will be prompted to accept each resource without authorization. A token (Step Functions taskToken) is used to authenticate the requests.

  5. This creates an AWS CloudFormation changeset. Once the changeset creation is complete, you must provide a final confirmation of y to Deploy the changeset? [y/N] when prompted as shown in the following example.
    Changeset created successfully. arn:aws:cloudformation:ap-southeast-1:XXXXXXXXXXXX:changeSet/samcli-deploy1605213119/db681961-3635-4305-b1c7-dcc754c7XXXX
    
    
    Previewing CloudFormation changeset before deployment
    ======================================================
    Deploy this changeset? [y/N]:
    

Your application is deployed to your account using AWS CloudFormation. You can track the deployment events in the command prompt or via the AWS CloudFormation console.

After the application deployment is complete, you must confirm the subscription to the Amazon SNS topic. An email will be sent to the email address entered in Step 3 with a link that you need to select to confirm the subscription. This confirmation provides opt-in consent for AWS to send emails to you via the specified Amazon SNS topic. The emails will be notifications of potentially sensitive data that need to be approved. If you don’t see the verification email, be sure to check your spam folder.

Test the application

The application uses an EventBridge scheduled rule to start the sensitive data scan workflow, which runs every 6 hours. You can manually start an execution of the workflow to verify that it’s working. To test the function, you will need a file that contains data that matches your rules for sensitive data. For example, it is easy to create a spreadsheet, document, or text file that contains names, addresses, and numbers formatted like credit card numbers. You can also use this generated sample data to test Macie.

We will test by uploading a file to our S3 bucket via the AWS web console. If you know how to copy objects from the command line, that also works.

Upload test objects to the S3 bucket

  1. Navigate to the Amazon S3 console and upload one or more test objects to the <BucketNamePrefix>-data-pipeline-raw bucket. <BucketNamePrefix> is the prefix you entered when deploying the application in the AWS SAM CLI prompts. You can use any objects as long as they’re a supported file type for Amazon Macie. I suggest uploading multiple objects, some with and some without sensitive data, in order to see how the workflow processes each.

Start the Scan State Machine

  1. Navigate to the Step Functions state machines console. If you don’t see your state machine, make sure you’re connected to the same region that you deployed your application to.
  2. Choose the state machine you created using the AWS SAM CLI as seen in Figure 3. The example state machine is maciepipelinescanstatemachine, but you might have used a different name in your deployment.
     
    Figure 3: AWS Step Functions state machines console

    Figure 3: AWS Step Functions state machines console

  3. Select the Start execution button and copy the value from the Enter an execution name – optional box. Change the Input – optional value replacing <execution id> with the value just copied as follows:
    {
        “id”: “<execution id>”
    }
    

    In my example, the <execution id> is fa985a4f-866b-b58b-d91b-8a47d068aa0c from the Enter an execution name – optional box as shown in Figure 4. You can choose a different ID value if you prefer. This ID is used by the workflow to tag the objects being processed to ensure that only objects that are scanned continue through the pipeline. When the EventBridge scheduled event starts the workflow as scheduled, an ID is included in the input to the Step Functions workflow. Then select Start execution again.
     

    Figure 4: New execution dialog box

    Figure 4: New execution dialog box

  4. You can see the status of your workflow execution in the Graph inspector as shown in Figure 5. In the figure, the workflow is at the pollForCompletionWait step.
     
    Figure 5: AWS Step Functions graph inspector

    Figure 5: AWS Step Functions graph inspector

The sensitive discovery job should run for about five to ten minutes. The jobs scale linearly based on object size, but there is a start-up time per job that is constant. If sensitive data is found in the objects uploaded to the <BucketNamePrefix>-data-pipeline-upload S3 bucket, an email is sent to the address provided during the AWS SAM deployment step, notifying the recipient requesting of the need for an approval decision, which they indicate by selecting the link corresponding to their decision to approve or deny the next step as shown in Figure 6.
 

Figure 6: Sensitive data identified email

Figure 6: Sensitive data identified email

When you receive this notification, you can investigate the findings by reviewing the objects in the <BucketNamePrefix>-data-pipeline-manual-review S3 bucket. Based on your review, you can either apply remediation steps to remove any sensitive data or allow the data to proceed to the next step of the data ingestion pipeline. You should define a standard response process to address discovery of sensitive data in the data pipeline. Common remediation steps include review of the files for sensitive data, deleting the files that you do not want to progress, and updating the ETL process to redact or tokenize sensitive data when re-ingesting into the pipeline. When you re-ingest the files into the pipeline without sensitive data, the files will not be flagged by Macie.

The workflow performs the following:

  • If you select Approve, the files are moved to the <BucketNamePrefix>-data-pipeline-scanned-data S3 bucket with an Amazon S3 SensitiveDataFound object tag with a value of true.
  • If you select Deny, the files are deleted from the <BucketNamePrefix>-data-pipeline-manual-review S3 bucket.
  • If no action is taken, the Step Functions workflow execution times out after five days and the file will automatically be deleted from the <BucketNamePrefix>-data-pipeline-manual-review S3 bucket after 10 days.

Clean up the application

You’ve successfully deployed and tested the sensitive data pipeline scan workflow. To avoid ongoing charges for resources you created, you should delete all associated resources by deleting the CloudFormation stack. In order to delete the CloudFormation stack, you must first delete all objects that are stored in the S3 buckets that you created for the application.

To delete the application

  1. Empty the S3 buckets created in this application (<BucketNamePrefix>-data-pipeline-raw S3 bucket, <BucketNamePrefix>-data-pipeline-scan-stage, <BucketNamePrefix>-data-pipeline-manual-review, and <BucketNamePrefix>-data-pipeline-scanned-data).
  2. Delete the CloudFormation stack used to deploy the application.

Considerations for regular use

Before using this application in a production data pipeline, you will need to stop and consider some practical matters. First, the notification mechanism used when sensitive data is identified in the objects is email. Email doesn’t scale: you should expand this solution to integrate with your ticketing or workflow management system. If you choose to use email, subscribe a mailing list so that the work of reviewing and responding to alerts is shared across a team.

Second, the application is run on a scheduled basis (every 6 hours by default). You should consider starting the application when your preliminary validations have completed and are ready to perform a sensitive data scan on the data as part of your pipeline. You can modify the EventBridge Event Rule to run in response to an Amazon EventBridge event instead of a scheduled basis.

Third, the application currently uses a 60 second Step Functions Wait state when polling for the Macie discovery job completion. In real world scenarios, the discovery scan will take 10 minutes at a minimum, likely several orders of magnitude longer. You should evaluate the typical execution times for your application execution and tune the polling period accordingly. This will help reduce costs related to running Lambda functions and log storage within CloudWatch Logs. The polling period is defined in the Step Functions state machine definition file (macie_pipeline_scan.asl.json) under the pollForCompletionWait state.

Fourth, the application currently doesn’t account for false positives in the sensitive data discovery job results. Also, the application will progress or delete all objects identified based on the decision by the reviewer. You should consider expanding the application to handle false positives through automation rather than manual review / intervention (such as deleting the files from the manual review bucket or removing the sensitive data tags applied).

Last, the solution will stop the ingestion of a subset of objects into your pipeline. This behavior is similar to other validation and data quality checks that most customers perform as part of the data pipeline. However, you should test to ensure that this will not cause unexpected outcomes and address them in your downstream application logic accordingly.

Conclusion

In this post, I showed you how to integrate sensitive data discovery using Macie as an additional validation step in an automated data pipeline. You’ve reviewed the components of the application, deployed it using the AWS SAM CLI, tested to validate that the application functions as expected, and cleaned up by removing deployed resources.

You now know how to integrate sensitive data scanning into your ETL pipeline. You can use automation and—where required—manual review to help reduce the risk of sensitive data, such as personally identifiable information, being inadvertently ingested into a data lake. You can take this application and customize it to fit your use case and workflows, such as using custom data identifiers as part of your scans, adding additional validation steps, creating Macie suppression rules to define cases to archive findings automatically, or only request manual approvals for findings that meet certain criteria (such as high severity findings).

If you have feedback about this post, submit comments in the Comments section below. If you have questions about this post, start a new thread on the Amazon Macie forum.

Want more AWS Security how-to content, news, and feature announcements? Follow us on Twitter.

Author

Brandon Wu

Brandon is a security solutions architect helping financial services organizations secure their critical workloads on AWS. In his spare time, he enjoys exploring outdoors and experimenting in the kitchen.

How to deploy the AWS Solution for Security Hub Automated Response and Remediation

Post Syndicated from Ramesh Venkataraman original https://aws.amazon.com/blogs/security/how-to-deploy-the-aws-solution-for-security-hub-automated-response-and-remediation/

In this blog post I show you how to deploy the Amazon Web Services (AWS) Solution for Security Hub Automated Response and Remediation. The first installment of this series was about how to create playbooks using Amazon CloudWatch Events, AWS Lambda functions, and AWS Security Hub custom actions that you can run manually based on triggers from Security Hub in a specific account. That solution requires an analyst to directly trigger an action using Security Hub custom actions and doesn’t work for customers who want to set up fully automated remediation based on findings across one or more accounts from their Security Hub master account.

The solution described in this post automates the cross-account response and remediation lifecycle from executing the remediation action to resolving the findings in Security Hub and notifying users of the remediation via Amazon Simple Notification Service (Amazon SNS). You can also deploy these automated playbooks as custom actions in Security Hub, which allows analysts to run them on-demand against specific findings. You can deploy these remediations as custom actions or as fully automated remediations.

Currently, the solution includes 10 playbooks aligned to the controls in the Center for Internet Security (CIS) AWS Foundations Benchmark standard in Security Hub, but playbooks for other standards such as AWS Foundational Security Best Practices (FSBP) will be added in the future.

Solution overview

Figure 1 shows the flow of events in the solution described in the following text.

Figure 1: Flow of events

Figure 1: Flow of events

Detect

Security Hub gives you a comprehensive view of your security alerts and security posture across your AWS accounts and automatically detects deviations from defined security standards and best practices.

Security Hub also collects findings from various AWS services and supported third-party partner products to consolidate security detection data across your accounts.

Ingest

All of the findings from Security Hub are automatically sent to CloudWatch Events and Amazon EventBridge and you can set up CloudWatch Events and EventBridge rules to be invoked on specific findings. You can also send findings to CloudWatch Events and EventBridge on demand via Security Hub custom actions.

Remediate

The CloudWatch Event and EventBridge rules can have AWS Lambda functions, AWS Systems Manager automation documents, or AWS Step Functions workflows as the targets of the rules. This solution uses automation documents and Lambda functions as response and remediation playbooks. Using cross-account AWS Identity and Access Management (IAM) roles, the playbook performs the tasks to remediate the findings using the AWS API when a rule is invoked.

Log

The playbook logs the results to the Amazon CloudWatch log group for the solution, sends a notification to an Amazon Simple Notification Service (Amazon SNS) topic, and updates the Security Hub finding. An audit trail of actions taken is maintained in the finding notes. The finding is updated as RESOLVED after the remediation is run. The security finding notes are updated to reflect the remediation performed.

Here are the steps to deploy the solution from this GitHub project.

  • In the Security Hub master account, you deploy the AWS CloudFormation template, which creates an AWS Service Catalog product along with some other resources. For a full set of what resources are deployed as part of an AWS CloudFormation stack deployment, you can find the full set of deployed resources in the Resources section of the deployed AWS CloudFormation stack. The solution uses the AWS Service Catalog to have the remediations available as a product that can be deployed after granting the users the required permissions to launch the product.
  • Add an IAM role that has administrator access to the AWS Service Catalog portfolio.
  • Deploy the CIS playbook from the AWS Service Catalog product list using the IAM role you added in the previous step.
  • Deploy the AWS Security Hub Automated Response and Remediation template in the master account in addition to the member accounts. This template establishes AssumeRole permissions to allow the playbook Lambda functions to perform remediations. Use AWS CloudFormation StackSets in the master account to have a centralized deployment approach across the master account and multiple member accounts.

Deployment steps for automated response and remediation

This section reviews the steps to implement the solution, including screenshots of the solution launched from an AWS account.

Launch AWS CloudFormation stack on the master account

As part of this AWS CloudFormation stack deployment, you create custom actions to configure Security Hub to send findings to CloudWatch Events. Lambda functions are used to provide remediation in response to actions sent to CloudWatch Events.

Note: In this solution, you create custom actions for the CIS standards. There will be more custom actions added for other security standards in the future.

To launch the AWS CloudFormation stack

  1. Deploy the AWS CloudFormation template in the Security Hub master account. In your AWS console, select CloudFormation and choose Create new stack and enter the S3 URL.
  2. Select Next to move to the Specify stack details tab, and then enter a Stack name as shown in Figure 2. In this example, I named the stack SO0111-SHARR, but you can use any name you want.
     
    Figure 2: Creating a CloudFormation stack

    Figure 2: Creating a CloudFormation stack

  3. Creating the stack automatically launches it, creating 21 new resources using AWS CloudFormation, as shown in Figure 3.
     
    Figure 3: Resources launched with AWS CloudFormation

    Figure 3: Resources launched with AWS CloudFormation

  4. An Amazon SNS topic is automatically created from the AWS CloudFormation stack.
  5. When you create a subscription, you’re prompted to enter an endpoint for receiving email notifications from Amazon SNS as shown in Figure 4. To subscribe to that topic that was created using CloudFormation, you must confirm the subscription from the email address you used to receive notifications.
     
    Figure 4: Subscribing to Amazon SNS topic

    Figure 4: Subscribing to Amazon SNS topic

Enable Security Hub

You should already have enabled Security Hub and AWS Config services on your master account and the associated member accounts. If you haven’t, you can refer to the documentation for setting up Security Hub on your master and member accounts. Figure 5 shows an AWS account that doesn’t have Security Hub enabled.
 

Figure 5: Enabling Security Hub for first time

Figure 5: Enabling Security Hub for first time

AWS Service Catalog product deployment

In this section, you use the AWS Service Catalog to deploy Service Catalog products.

To use the AWS Service Catalog for product deployment

  1. In the same master account, add roles that have administrator access and can deploy AWS Service Catalog products. To do this, from Services in the AWS Management Console, choose AWS Service Catalog. In AWS Service Catalog, select Administration, and then navigate to Portfolio details and select Groups, roles, and users as shown in Figure 6.
     
    Figure 6: AWS Service Catalog product

    Figure 6: AWS Service Catalog product

  2. After adding the role, you can see the products available for that role. You can switch roles on the console to assume the role that you granted access to for the product you added from the AWS Service Catalog. Select the three dots near the product name, and then select Launch product to launch the product, as shown in Figure 7.
     
    Figure 7: Launch the product

    Figure 7: Launch the product

  3. While launching the product, you can choose from the parameters to either enable or disable the automated remediation. Even if you do not enable fully automated remediation, you can still invoke a remediation action in the Security Hub console using a custom action. By default, it’s disabled, as highlighted in Figure 8.
     
    Figure 8: Enable or disable automated remediation

    Figure 8: Enable or disable automated remediation

  4. After launching the product, it can take from 3 to 5 minutes to deploy. When the product is deployed, it creates a new CloudFormation stack with a status of CREATE_COMPLETE as part of the provisioned product in the AWS CloudFormation console.

AssumeRole Lambda functions

Deploy the template that establishes AssumeRole permissions to allow the playbook Lambda functions to perform remediations. You must deploy this template in the master account in addition to any member accounts. Choose CloudFormation and create a new stack. In Specify stack details, go to Parameters and specify the Master account number as shown in Figure 9.
 

Figure 9: Deploy AssumeRole Lambda function

Figure 9: Deploy AssumeRole Lambda function

Test the automated remediation

Now that you’ve completed the steps to deploy the solution, you can test it to be sure that it works as expected.

To test the automated remediation

  1. To test the solution, verify that there are 10 actions listed in Custom actions tab in the Security Hub master account. From the Security Hub master account, open the Security Hub console and select Settings and then Custom actions. You should see 10 actions, as shown in Figure 10.
     
    Figure 10: Custom actions deployed

    Figure 10: Custom actions deployed

  2. Make sure you have member accounts available for testing the solution. If not, you can add member accounts to the master account as described in Adding and inviting member accounts.
  3. For testing purposes, you can use CIS 1.5 standard, which is to require that the IAM password policy requires at least one uppercase letter. Check the existing settings by navigating to IAM, and then to Account Settings. Under Password policy, you should see that there is no password policy set, as shown in Figure 11.
     
    Figure 11: Password policy not set

    Figure 11: Password policy not set

  4. To check the security settings, go to the Security Hub console and select Security standards. Choose CIS AWS Foundations Benchmark v1.2.0. Select CIS 1.5 from the list to see the Findings. You will see the Status as Failed. This means that the password policy to require at least one uppercase letter hasn’t been applied to either the master or the member account, as shown in Figure 12.
     
    Figure 12: CIS 1.5 finding

    Figure 12: CIS 1.5 finding

  5. Select CIS 1.5 – 1.11 from Actions on the top right dropdown of the Findings section from the previous step. You should see a notification with the heading Successfully sent findings to Amazon CloudWatch Events as shown in Figure 13.
     
    Figure 13: Sending findings to CloudWatch Events

    Figure 13: Sending findings to CloudWatch Events

  6. Return to Findings by selecting Security standards and then choosing CIS AWS Foundations Benchmark v1.2.0. Select CIS 1.5 to review Findings and verify that the Workflow status of CIS 1.5 is RESOLVED, as shown in Figure 14.
     
    Figure 14: Resolved findings

    Figure 14: Resolved findings

  7. After the remediation runs, you can verify that the Password policy is set on the master and the member accounts. To verify that the password policy is set, navigate to IAM, and then to Account Settings. Under Password policy, you should see that the account uses a password policy, as shown in Figure 15.
     
    Figure 15: Password policy set

    Figure 15: Password policy set

  8. To check the CloudWatch logs for the Lambda function, in the console, go to Services, and then select Lambda and choose the Lambda function and within the Lambda function, select View logs in CloudWatch. You can see the details of the function being run, including updating the password policy on both the master account and the member account, as shown in Figure 16.
     
    Figure 15: Lambda function log

    Figure 16: Lambda function log

Conclusion

In this post, you deployed the AWS Solution for Security Hub Automated Response and Remediation using Lambda and CloudWatch Events rules to remediate non-compliant CIS-related controls. With this solution, you can ensure that users in member accounts stay compliant with the CIS AWS Foundations Benchmark by automatically invoking guardrails whenever services move out of compliance. New or updated playbooks will be added to the existing AWS Service Catalog portfolio as they’re developed. You can choose when to take advantage of these new or updated playbooks.

If you have feedback about this post, submit comments in the Comments section below. If you have questions about this post, start a new thread on the AWS Security Hub forum or contact AWS Support.

Want more AWS Security how-to content, news, and feature announcements? Follow us on Twitter.

Author

Ramesh Venkataraman

Ramesh is a Solutions Architect who enjoys working with customers to solve their technical challenges using AWS services. Outside of work, Ramesh enjoys following stack overflow questions and answers them in any way he can.

How to automate incident response in the AWS Cloud for EC2 instances

Post Syndicated from Ben Eichorst original https://aws.amazon.com/blogs/security/how-to-automate-incident-response-in-aws-cloud-for-ec2-instances/

One of the security epics core to the AWS Cloud Adoption Framework (AWS CAF) is a focus on incident response and preparedness to address unauthorized activity. Multiple methods exist in Amazon Web Services (AWS) for automating classic incident response techniques, and the AWS Security Incident Response Guide outlines many of these methods. This post demonstrates one specific method for instantaneous response and acquisition of infrastructure data from Amazon Elastic Compute Cloud (Amazon EC2) instances.

Incident response starts with detection, progresses to investigation, and then follows with remediation. This process is no different in AWS. AWS services such as Amazon GuardDuty, Amazon Macie, and Amazon Inspector provide detection capabilities. Amazon Detective assists with investigation, including tracking and gathering information. Then, after your security organization decides to take action, pre-planned and pre-provisioned runbooks enable faster action towards a resolution. One principle outlined in the incident response whitepaper and the AWS Well-Architected Framework is the notion of pre-provisioning systems and policies to allow you to react quickly to an incident response event. The solution I present here provides a pre-provisioned architecture for an incident response system that you can use to respond to a suspect EC2 instance.

Infrastructure overview

The architecture that I outline in this blog post automates these standard actions on a suspect compute instance:

  1. Capture all the persistent disks.
  2. Capture the instance state at the time the incident response mechanism is started.
  3. Isolate the instance and protect against accidental instance termination.
  4. Perform operating system–level information gathering, such as memory captures and other parameters.
  5. Notify the administrator of these actions.

The solution in this blog post accomplishes these tasks through the following logical flow of AWS services, illustrated in Figure 1.
 

Figure 1: Infrastructure deployed by the accompanying AWS CloudFormation template and associated task flow when invoking the main API

Figure 1: Infrastructure deployed by the accompanying AWS CloudFormation template and associated task flow when invoking the main API

  1. A user or application calls an API with an EC2 instance ID to start data collection.
  2. Amazon API Gateway initiates the core logic of the process by instantiating an AWS Lambda function.
  3. The Lambda function performs the following data gathering steps before making any changes to the infrastructure:
    1. Save instance metadata to the SecResponse Amazon Simple Storage Service (Amazon S3) bucket.
    2. Save a snapshot of the instance console to the SecResponse S3 bucket.
    3. Initiate an Amazon Elastic Block Store (Amazon EBS) snapshot of all persistent block storage volumes.
  4. The Lambda function then modifies the infrastructure to continue gathering information, by doing the following steps:
    1. Set the Amazon EC2 termination protection flag on the instance.
    2. Remove any existing EC2 instance profile from the instance.
    3. If the instance is managed by AWS Systems Manager:
      1. Attach an EC2 instance profile with minimal privileges for operating system–level information gathering.
      2. Perform operating system–level information gathering actions through Systems Manager on the EC2 instance.
      3. Remove the instance profile after Systems Manager has completed its actions.
    4. Create a quarantine security group that lacks both ingress and egress rules.
    5. Move the instance into the created quarantine security group for isolation.
  5. Send an administrative notification through the configured Amazon Simple Notification Service (Amazon SNS) topic.

Solution features

By using the mechanisms outlined in this post to codify your incident response runbooks, you can see the following benefits to your incident response plan.

Preparation for incident response before an incident occurs

Both the AWS CAF and Well-Architected Framework recommend that customers formulate known procedures for incident response, and test those runbooks before an incident. Testing these processes before an event occurs decreases the time it takes you to respond in a production environment. The sample infrastructure shown in this post demonstrates how you can standardize those procedures.

Consistent incident response artifact gathering

Codifying your processes into set code and infrastructure prepares you for the need to collect data, but also standardizes the collection process into a repeatable and auditable sequence of What information was collected when and how. This reduces the likelihood of missing data for future investigations.

Walkthrough: Deploying infrastructure and starting the process

To implement the solution outlined in this post, you first need to deploy the infrastructure, and then start the data collection process by issuing an API call.

The code example in this blog post requires that you provision an AWS CloudFormation stack, which creates an S3 bucket for storing your event artifacts and a serverless API that uses API Gateway and Lambda. You then execute a query against this API to take action on a target EC2 instance.

The infrastructure deployed by the AWS CloudFormation stack is a set of AWS components as depicted previously in Figure 1. The stack includes all the services and configurations to deploy the demo. It doesn’t include a target EC2 instance that you can use to test the mechanism used in this post.

Cost

The cost for this demo is minimal because the base infrastructure is completely serverless. With AWS, you only pay for the infrastructure that you use, so the single API call issued in this demo costs fractions of a cent. Artifact storage costs will incur S3 storage prices, and Amazon EC2 snapshots will be stored at their respective prices.

Deploy the AWS CloudFormation stack

In future posts and updates, we will show how to set up this security response mechanism inside a separate account designated for security, but for the purposes of this post, your demo stack must reside in the same AWS account as the target instance that you set up in the next section.

First, start by deploying the AWS CloudFormation template to provision the infrastructure.

To deploy this template in the us-east-1 region

  1. Choose the Launch Stack button to open the AWS CloudFormation console pre-loaded with the template:
     
    Select the Launch Stack button to launch the template
  2. (Optional) In the AWS CloudFormation console, on the Specify Details page, customize the stack name.
  3. For the LambdaS3BucketLocation and LambdaZipFileName fields, leave the default values for the purposes of this blog. Customizing this field allows you to customize this code example for your own purposes and store it in an S3 bucket of your choosing.
  4. Customize the S3BucketName field. This needs to be a globally unique S3 bucket name. This bucket is where gathered artifacts are stored for the demo in this blog. You must customize it beyond the default value for the template to instantiate properly.
  5. (Optional) Customize the SNSTopicName field. This name provides a meaningful label for the SNS topic that notifies the administrator of the actions that were performed.
  6. Choose Next to configure the stack options and leave all default settings in place.
  7. Choose Next to review and scroll to the bottom of the page. Select all three check boxes under the Capabilities and Transforms section, next to each of the three acknowledgements:
    • I acknowledge that AWS CloudFormation might create IAM resources.
    • I acknowledge that AWS CloudFormation might create IAM resources with custom names.
    • I acknowledge that AWS CloudFormation might require the following capability: CAPABILITY_AUTO_EXPAND.
  8. Choose Create Stack.

Set up a target EC2 instance

In order to demonstrate the functionality of this mechanism, you need a target host. Provision any EC2 instance in your account to act as a target for the security response mechanism to act upon for information collection and quarantine. To optimize affordability and demonstrate full functionality, I recommend choosing a small instance size (for example, t2.nano) and optionally joining the instance into Systems Manager for the ability to later execute Run Command API queries. For more details on configuring Systems Manager, refer to the AWS Systems Manager User Guide.

Retrieve required information for system initiation

The entire security response mechanism triggers through an API call. To successfully initiate this call, you first need to gather the API URI and key information.

To find the API URI and key information

  1. Navigate to the AWS CloudFormation console and choose the stack that you’ve instantiated.
  2. Choose the Outputs tab and save the value for the key APIBaseURI. This is the base URI for the API Gateway. It will resemble https://abcdefgh12.execute-api.us-east-1.amazonaws.com.
  3. Next, navigate to the API Gateway console and choose the API with the name SecurityResponse.
  4. Choose API Keys, and then choose the only key present.
  5. Next to the API key field, choose Show to reveal the key, and then save this value to a notepad for later use.

(Optional) Configure administrative notification through the created SNS topic

One aspect of this mechanism is that it sends notifications through SNS topics. You can optionally subscribe your email or another notification pipeline mechanism to the created SNS topic in order to receive notifications on actions taken by the system.

Initiate the security response mechanism

Note that, in this demo code, you’re using a simple API key for limiting access to API Gateway. In production applications, you would use an authentication mechanism such as Amazon Cognito to control access to your API.

To kick off the security response mechanism, initiate a REST API query against the API that was created in the AWS CloudFormation template. You first create this API call by using a curl command to be run from a Linux system.

To create the API initiation curl command

  1. Copy the following example curl command.
    curl -v -X POST -i -H "x-api-key: 012345ABCDefGHIjkLMS20tGRJ7othuyag" https://abcdefghi.execute-api.us-east-1.amazonaws.com/DEMO/secresponse -d '{
      "instance_id":"i-123457890"
    }'
    

  2. Replace the placeholder API key specified in the x-api-key HTTP header with your API key.
  3. Replace the example URI path with your API’s specific URI. To create the full URI, concatenate the base URI listed in the AWS CloudFormation output you gathered previously with the API call path, which is /DEMO/secresponse. This full URI for your specific API call should closely resemble this sample URI path: https://abcdefghi.execute-api.us-east-1.amazonaws.com/DEMO/secresponse
  4. Replace the value associated with the key instance_id with the instance ID of the target EC2 instance you created.

Because this mechanism initiates through a simple API call, you can easily integrate it with existing workflow management systems. This allows for complex data collection and forensic procedures to be integrated with existing incident response workflows.

Review the gathered data

Note that the following items were uploaded as objects in the security response S3 bucket:

  1. A console screenshot, as shown in Figure 2.
  2. (If Systems Manager is configured) stdout information from the commands that were run on the host operating system.
  3. Instance metadata in JSON form.


Figure 2: Example outputs from a successful completion of this blog post's mechanism

Figure 2: Example outputs from a successful completion of this blog post’s mechanism

Additionally, if you load the Amazon EC2 console and scroll down to Elastic Block Store, you can see that EBS snapshots are present for all persistent disks as shown in Figure 3.
 

Figure 3: Evidence of an EBS snapshot from a successful run

Figure 3: Evidence of an EBS snapshot from a successful run

You can also verify that the previously outlined security controls are in place by viewing the instance in the Amazon EC2 console. You should see the removal of AWS Identity and Access Management (IAM) roles from the target EC2 instances and that the instance has been placed into network isolation through a newly created quarantine security group.

Note that for the purposes of this demo, all information that you gathered is stored in the same AWS account as the workload. As a best practice, many AWS customers choose instead to store this information in an AWS account that’s specifically designated for incident response and analysis. A dedicated account provides clear isolation of function and restriction of access. Using AWS Organizations service control policies (SCPs) and IAM permissions, your security team can limit access to adhere to security policy, legal guidance, and compliance regulations.

Clean up and delete artifacts

To clean up the artifacts from the solution in this post, first delete all information in your security response S3 bucket. Then delete the CloudFormation stack that was provisioned at the start of this process in order to clean up all remaining infrastructure.

Conclusion

Placing workloads in the AWS Cloud allows for pre-provisioned and explicitly defined incident response runbooks to be codified and quickly executed on suspect EC2 instances. This enables you to gather data in minutes that previously took hours or even days using manual processes.

If you have feedback about this post, submit comments in the Comments section below. If you have questions about this post, start a new thread on the Amazon EC2 forum or contact AWS Support.

Want more AWS Security how-to content, news, and feature announcements? Follow us on Twitter.

Author

Ben Eichorst

Ben is a Senior Solutions Architect, Security, Cryptography, and Identity Specialist for AWS. He works with AWS customers to efficiently implement globally scalable security programs while empowering development teams and reducing risk. He holds a BA from Northwestern University and an MBA from University of Colorado.

OWASP APICheck – HTTP API DevSecOps Toolset

Post Syndicated from original https://www.darknet.org.uk/2020/10/owasp-apicheck-http-api-devsecops-toolset/?utm_source=rss&utm_medium=social&utm_campaign=darknetfeed

OWASP APICheck – HTTP API DevSecOps Toolset

APICheck is an HTTP API DevSecOps toolset, it integrates existing HTTP APIs tools, creates execution chains easily and is designed for integration with third-party tools in mind.

APICheck is comprised of a set of tools that can be connected to each other to achieve different functionalities, depending on how they are connected. It allows you to create execution chains and it can not only integrate self-developed tools but also can leverage existing tools in order to take advantage of them to provide new functionality.

Read the rest of OWASP APICheck – HTTP API DevSecOps Toolset now! Only available at Darknet.