Tag Archives: Uncategorized

What Will It Take?

Post Syndicated from Bruce Schneier original https://www.schneier.com/blog/archives/2023/02/what-will-it-take.html

What will it take for policy makers to take cybersecurity seriously? Not minimal-change seriously. Not here-and-there seriously. But really seriously. What will it take for policy makers to take cybersecurity seriously enough to enact substantive legislative changes that would address the problems? It’s not enough for the average person to be afraid of cyberattacks. They need to know that there are engineering fixes—and that’s something we can provide.

For decades, I have been waiting for the “big enough” incident that would finally do it. In 2015, Chinese military hackers hacked the Office of Personal Management and made off with the highly personal information of about 22 million Americans who had security clearances. In 2016, the Mirai botnet leveraged millions of Internet-of-Things devices with default admin passwords to launch a denial-of-service attack that disabled major Internet platforms and services in both North America and Europe. In 2017, hackers—years later we learned that it was the Chinese military—hacked the credit bureau Equifax and stole the personal information of 147 million Americans. In recent years, ransomware attacks have knocked hospitals offline, and many articles have been written about Russia inside the U.S. power grid. And last year, the Russian SVR hacked thousands of sensitive networks inside civilian critical infrastructure worldwide in what we’re now calling Sunburst (and used to call SolarWinds).

Those are all major incidents to security people, but think about them from the perspective of the average person. Even the most spectacular failures don’t affect 99.9% of the country. Why should anyone care if the Chinese have his or her credit records? Or if the Russians are stealing data from some government network? Few of us have been directly affected by ransomware, and a temporary Internet outage is just temporary.

Cybersecurity has never been a campaign issue. It isn’t a topic that shows up in political debates. (There was one question in a 2016 Clinton–Trump debate, but the response was predictably unsubstantive.) This just isn’t an issue that most people prioritize, or even have an opinion on.

So, what will it take? Many of my colleagues believe that it will have to be something with extreme emotional intensity—sensational, vivid, salient—that results in large-scale loss of life or property damage. A successful attack that actually poisons a water supply, as someone tried to do in January by raising the levels of lye at a Florida water-treatment plant. (That one was caught early.) Or an attack that disables Internet-connected cars at speed, something that was demonstrated by researchers in 2014. Or an attack on the power grid, similar to what Russia did to the Ukraine in 2015 and 2016. Will it take gas tanks exploding and planes falling out of the sky for the average person to read about the casualties and think “that could have been me”?

Here’s the real problem. For the average nonexpert—and in this category I include every lawmaker—to push for change, they not only need to believe that the present situation is intolerable, they also need to believe that an alternative is possible. Real legislative change requires a belief that the never-ending stream of hacks and attacks is not inevitable, that we can do better. And that will require creating working examples of secure, dependable, resilient systems.

Providing alternatives is how engineers help facilitate social change. We could never have eliminated sales of tungsten-filament household light bulbs if fluorescent and LED replacements hadn’t become available. Reducing the use of fossil fuel for electricity generation requires working wind turbines and cost-effective solar cells.

We need to demonstrate that it’s possible to build systems that can defend themselves against hackers, criminals, and national intelligence agencies; secure Internet-of-Things systems; and systems that can reestablish security after a breach. We need to prove that hacks aren’t inevitable, and that our vulnerability is a choice. Only then can someone decide to choose differently. When people die in a cyberattack and everyone asks “What can be done?” we need to have something to tell them.

We don’t yet have the technology to build a truly safe, secure, and resilient Internet and the computers that connect to it. Yes, we have lots of security technologies. We have older secure systems—anyone still remember Apollo’s DomainOS and MULTICS?—that lost out in a market that didn’t reward security. We have newer research ideas and products that aren’t successful because the market still doesn’t reward security. We have even newer research ideas that won’t be deployed, again, because the market still prefers convenience over security.

What I am proposing is something more holistic, an engineering research task on a par with the Internet itself. The Internet was designed and built to answer this question: Can we build a reliable network out of unreliable parts in an unreliable world? It turned out the answer was yes, and the Internet was the result. I am asking a similar research question: Can we build a secure network out of insecure parts in an insecure world? The answer isn’t obviously yes, but it isn’t obviously no, either.

While any successful demonstration will include many of the security technologies we know and wish would see wider use, it’s much more than that. Creating a secure Internet ecosystem goes beyond old-school engineering to encompass the social sciences. It will include significant economic, institutional, and psychological considerations that just weren’t present in the first few decades of Internet research.

Cybersecurity isn’t going to get better until the economic incentives change, and that’s not going to change until the political incentives change. The political incentives won’t change until there is political liability that comes from voter demands. Those demands aren’t going to be solely the results of insecurity. They will also be the result of believing that there’s a better alternative. It is our task to research, design, build, test, and field that better alternative—even though the market couldn’t care less right now.

This essay originally appeared in the May/June 2021 issue of IEEE Security & Privacy. I forgot to publish it here.

How to create custom health checks for your Amazon EC2 Auto Scaling Fleet

Post Syndicated from Sheila Busser original https://aws.amazon.com/blogs/compute/how-to-create-custom-health-checks-for-your-amazon-ec2-auto-scaling-fleet/

This blog post is written by Gaurav Verma, Cloud Infrastructure Architect, Professional Services AWS.

Amazon EC2 Auto Scaling helps you maintain application availability and lets you automatically add or remove Amazon Elastic Compute Cloud (Amazon EC2) instances according to the conditions that you define. You can use dynamic and predictive scaling to scale-out and scale-in EC2 instances. Auto Scaling helps to maintain the self-healing Amazon EC2 environment for an application where Auto Scaling can use the status of Amazon EC2 health checks to determine if an instance is faulty and needs replacement. Amazon EC2 Auto Scaling provides three types of health checks, which are discussed below.

EC2 Status check: AWS provides two types of health checks for EC2 instances: System status check and instance status check. System status checks monitor the AWS system on which an instance is running. If the problem is with underlying system, AWS will fix the problem. Instance status check monitors the software and network configuration of an instance. If the instance status check fails, then you can fix the problem by following the steps in the troubleshoot instances with failed status checks documentation.

Elastic Load Balancer Health Check: Auto Scaling groups are generally connected to Elastic Load Balancers (ELB). ELB provides the application-level health check by monitoring the endpoint (a webpage, or a health page in a web application) of an application. ELB health check monitors the application and marks the instance unhealthy if there is no response from an instance in the configured time.

Custom Health Check: You can use custom health checks to mark any instance as unhealthy if the instance fails for the check you define. Custom health checks can be used to implement various user requirements, such as the presence of instance tags added upon completion of a required workflow. The user data script is executed at instance boot time, and it can perform additional investigation into whether or not the user requirements are met before confirming that the instance is ready to accept load. For example, this approach could be used to confirm that the instance was successfully integrated with other parts of a complex application stack.

In some cases, a customer may add multiple checks either in the Amazon EC2 AMI or in the boot sequence to keep the instance secure and compliant. These checks can increase the boot time for the EC2 instance, and they can reboot the EC2 instance multiple times before an instance can be marked as compliant. Therefore, in some cases, an EC2 instance boot period can take forty to fifty minutes or longer.

If an EC2 instance isn’t marked as healthy within a defined time, Auto Scaling will mark an instance unhealthy, even though the instance wasn’t yet ready for evaluation. Custom health checks can help manage these situations. You can write the Amazon EC2 user data script to perform the custom health check and force Auto Scaling to wait until the instance is truly healthy (i.e., functional, secure, and compliant).

This blog describes a method to write a custom health check. We write an Amazon EC2 user data script to perform the custom health check and automate it for future EC2 instances in the Auto Scaling group. This script can wait for an instance to successfully complete the boot process and then mark the instance as healthy.

Prerequisites

You must have an AWS Identity and Access Management (IAM) role for Amazon EC2 with an Auto Scaling policy, which has these two actions allowed for the Auto Scaling group:

autoscaling:CompleteLifecycleAction

autoscaling:RecordLifecycleActionHeartbeat

Furthermore, we use the Amazon EC2 Auto Scaling lifecycle hooks. Lifecycle hooks let you create a solutions that are aware of events in Auto Scaling instance lifecycle, and then perform a custom action on instances when the lifecycle event occurs. As mentioned previously, typically a custom health check is needed when determining the workload readiness of an instance would be longer than the usual boot time for an EC2 instance that Auto Scaling assumes. Therefore, we utilize lifecycle hooks to keep the checks running until the instance is marked healthy.

Create custom health check

Let’s look at an example where an instance can only be marked as healthy if the instance has a tag with the key “Compliance-Check” and value “Successful”. Until this tag is both (a) present and (b) carries the value “Successful”, the instance shouldn’t be marked as “InService”.

  1. Create the Auto Scaling launch template for Amazon EC2 Auto Scaling. Name your Launch template “test”. In the additional configuration for user data, use this shell script as text.

The Following script will install the AWS Command Line Interface (AWS CLI) to interact with the AWS tagging and Auto Scaling APIs. Then, the script will run the while loop until the instance has a tag with the key “Compliance-Check” and value “Successful”. Once the instance has a tag, it will mark the instance as healthy and the instance will move into the “InService” state.

#!/bin/bash
curl "https://awscli.amazonaws.com/awscli-exe-linux-x86_64.zip" -o "awscliv2.zip"
unzip awscliv2.zip
sudo ./aws/install
#get instance id
instance=$(curl http://169.254.169.254/latest/meta-data/instance-id)

#Checking instance status
while true
do
readystatus=$(aws ec2 describe-instances --instance-ids $instance --filters "Name=tag: Compliance-Check,Values= Successful" |grep -i $instance)
if [[ $readystatus = *"InstanceId"* ]]; then
        echo $readystatus >> /home/ec2-user/user-script-output.txt
        aws autoscaling set-instance-health --instance-id $instance --health-status Healthy
        aws autoscaling complete-lifecycle-action --lifecycle-action-result CONTINUE --instance-id $instance --lifecycle-hook-name test --auto-scaling-group-name my-asg
        break 
else
	aws autoscaling set-instance-health --instance-id $instance --health-status Unhealthy
	sleep 5  
fi

done
  1. Create an Amazon EC2 Auto Scaling group using the AWS CLI with the “test” launch template that you just created and a predefined lifecycle hook. First, create a JSON file “config.json” in a system where you will run the AWS command to create the Auto Scaling group.
{
    "AutoScalingGroupName": "my-asg",
    "LaunchTemplate": {"LaunchTemplateId": "lt-1234567890abcde12"} ,
    "MinSize": 2,
    "MaxSize": 4,
    "DesiredCapacity": 2,
    "VPCZoneIdentifier": "subnet-12345678, subnet-90123456",
    "NewInstancesProtectedFromScaleIn": true,
    "LifecycleHookSpecificationList": [
        {
            "LifecycleHookName": "test",
            "LifecycleTransition": "autoscaling:EC2_INSTANCE_LAUNCHING",
            "HeartbeatTimeout": 300,
            "DefaultResult": "ABANDON"
        }
    ],
    "Tags": [
        {
            "ResourceId": "my-asg",
            "ResourceType": "auto-scaling-group",
            "Key": "Compliance-Check",
            "Value": "UnSuccessful",
            "PropagateAtLaunch": true
        }
    ]
}

To create the Auto Scaling group with the AWS CLI, you must run the following command at the same location where you saved the preceding JSON file. Make sure to replace the relevant subnets that you intend to use in the VPCZoneIdentifier.

>> aws autoscaling create-auto-scaling-group –cli-input-json file://config.json

This command will create the Auto Scaling group with a configuration defined in the JSON file. This Auto Scaling group should have two instances and a lifecycle hook called “test” with a 300 second wait period at the time of launch of an instance.

Tests

Now is the time to test the newly-created instances with a custom health check. Instances in Auto Scaling should be in the “Pending:Wait” stage, not the “InService” stage. Instances will be in this stage for approximately five minutes because we have a lifecycle hook time of 300 seconds in the config.json file.

If the workload readiness evaluation takes more than 300 seconds in your environment, then you can increase the lifecycle hook period to as long as 7200 seconds.

Change the tag value for one instance from “UnSuccessful” to “Successful”. If you’ve changed the tag within the five minutes of instances creation, then the instance should be in the “InService” state and marked as healthy.

Change Compliance-Check value from "UnSuccessful" to "Successful".

This test is a simulation of the situation where the health check of an instance depends on the tag values, and the tag values are only updated if the instance passes all of the checks as per the organization standards. Here we change the tag value manually, but in a real use case scenario, this value would be changed by the booting process when instances are marked as compliant.

Another test case could be that an instance should be marked as healthy if it’s added to the configuration management database, but not before that. For these checks, you can use the API with the curl command and look for the desired result. An example to call an API is in the above script, where it calls the AWS API to get the instance ID.

In case your custom health check script needs more than 7200 seconds, you can use this command to increase the lifecycle hook time:

>> aws autoscaling record-lifecycle-action-heartbeat –lifecycle-hook-name <lh_
name> –auto-scaling-group-name <asg_name> –instance-id <instance_id>

This command will give you the extra time equal to the time that you have configured in the life cycle hook.

Cleanup

Once you successfully test the solution, to avoid ongoing charges for resources you created, you should delete the resources.

To delete the Amazon EC2 Auto Scaling group, run the following command:

aws autoscaling delete-auto-scaling-group --auto-scaling-group-name my-asg

To delete the launch template, run the following command:

aws ec2 delete-launch-template --launch-template-id lt-1234567890abcde12

Delete the role and policy as well if you no longer need it.

Conclusion

EC2 Auto Scaling custom health checks are useful when system or instance health is insufficient, and you want instances to be marked as healthy only after additional checks. Typically, because of these different checks, the Amazon EC2 boot period can be longer than usual, and this may impact the scale-out process when an application needs more resources.

You can start by exploring EC2 Auto Scaling warm pools for these environments. You can keep the healthy marked instances in the warm pool in the Stopped stage. Then, these instances can be brought into the main pool at the time of scale-out without spending time on the boot process and lengthy health check. If you enable scale-in protection, then these healthy instances can move back to the warm pool at the time of scale-in rather than being terminated altogether.

Friday Squid Blogging: Squid Is a Blockchain Thingy

Post Syndicated from Bruce Schneier original https://www.schneier.com/blog/archives/2023/02/friday-squid-blogging-squid-is-a-blockchain-thingy.html

I had no idea—until I read this incredibly jargon-filled article:

Squid is a cross-chain liquidity and messaging router that swaps across multiple chains and their native DEXs via axlUSDC.

So there.

As usual, you can also use this squid post to talk about the security stories in the news that I haven’t covered.

Read my blog posting guidelines here.

A Hacker’s Mind Is Now Published

Post Syndicated from Bruce Schneier original https://www.schneier.com/blog/archives/2023/02/a-hackers-mind-is-now-published.html

Tuesday was the official publication date of A Hacker’s Mind: How the Powerful Bend Society’s Rules, and How to Bend them Back. It broke into the 2000s on the Amazon best-seller list.

Reviews in the New York Times, Cory Doctorow’s blog, Science, and the Associated Press.

I wrote essays related to the book for CNN and John Scalzi’s blog.

Two podcast interviews: Keen On and Lawfare. And a written interview for the Ash Center at the Harvard Kennedy School.

Lots more coming, I believe. Get your copy here.

And—last request—right now there’s one Amazon review, and it’s not a good one. If people here could leave reviews, I would appreciate it.

Scaling an ASG using target tracking with a dynamic SQS target

Post Syndicated from Sheila Busser original https://aws.amazon.com/blogs/compute/scaling-an-asg-using-target-tracking-with-a-dynamic-sqs-target/

This blog post is written by Wassim Benhallam, Sr Cloud Application Architect AWS WWCO ProServe, and Rajesh Kesaraju, Sr. Specialist Solution Architect, EC2 Flexible Compute.

Scaling an Amazon EC2 Auto Scaling group based on Amazon Simple Queue Service (Amazon SQS) is a commonly used design pattern in decoupled applications. For example, an EC2 Auto Scaling Group can be used as a worker tier to offload the processing of audio files, images, or other files sent to the queue from an upstream tier (e.g., web tier). For latency-sensitive applications, AWS guidance describes a common pattern that allows an Auto Scaling group to scale in response to the backlog of an Amazon SQS queue while accounting for the average message processing duration (MPD) and the application’s desired latency.

This post builds on that guidance to focus on latency-sensitive applications where the MPD varies over time. Specifically, we demonstrate how to dynamically update the target value of the Auto Scaling group’s target tracking policy based on observed changes in the MPD. We also cover the utilization of Amazon EC2 Spot instances, mixed instance policies, and attribute-based instance selection in the Auto Scaling Groups as well as best practice implementation to achieve greater cost savings.

The challenge

The key challenge that this post addresses is applications that fail to honor their acceptable/target latency in situations where the MPD varies over time. Latency refers here to the time required for any queue message to be consumed and fully processed.

Consider the example of a customer using a worker tier to process image files (e.g., resizing, rescaling, or transformation) uploaded by users within a target latency of 100 seconds. The worker tier consists of an Auto Scaling group configured with a target tracking policy. To achieve the target latency mentioned previously, the customer assumes that each image can be processed in one second, and configures the target value of the scaling policy so that the average image backlog per instance is maintained at approximately 100 images.

In the first week, the customer submits 1000 images to the Amazon SQS queue for processing, each of which takes one second of processing time. Therefore, the Auto Scaling group scales to 10 instances, each of which processes 100 images in 100s, thereby honoring the target latency of 100s.

In the second week, the customer submits 1000 slightly larger images for processing. Since an image’s processing duration scales with its size, each image takes two seconds to process. As in the first week, the Auto Scaling group scales to 10 instances, but this time each instance processes 100 images in 200s, which is twice as long as was needed in the first round. As a result, the application fails to process the latter images within its acceptable latency.

Therefore, the challenge is common to any latency-sensitive application where the MPD is subject to change. Applications where the processing duration scales with input data size are particularly vulnerable to this problem. This includes image processing, document processing, computational jobs, and others.

Solution overview

Before we dive into the solution, let’s briefly review the target tracking policy’s scaling metric and its corresponding target value. A target tracking scaling policy works by adjusting the capacity to keep a scaling metric at, or close to, the specified target value. When scaling in response to an Amazon SQS backlog, it’s good practice to use a scaling metric known as the Backlog Per Instance (BPI) and a target value based on the acceptable BPI. These are computed as follows:

BPI equation, Saling metric and target value.

Given the acceptable BPI equation, a longer MPD requires us to use a smaller target value if we are to process these messages in the same acceptable latency, and vice versa. Therefore, the solution we propose here works by monitoring the average MPD over time and dynamically adjusting the target value of the Auto Scaling group’s target tracking policy (acceptable BPI) based on the observed changes in the MPD. This allows the scaling policy to adapt to variations in the average MPD over time, and thus enables the application to honor its acceptable latency.

Solution architecture

To demonstrate how the approach above can be implemented in practice, we put together an example architecture highlighting the services involved (see the following figure). We also provide an automated deployment solution for this architecture using an AWS Serverless Application Model (AWS SAM) template and some Python code (repository link). The repository also includes a README file with detailed instructions that you can follow to deploy the solution. The AWS SAM template deploys several resources, including an autoscaling group, launch template, target tracking scaling policy, an Amazon SQS queue, and a few AWS Lambda functions that serve various functions described as follows.

The Amazon SQS queue is used to accumulate messages intended for processing, while the Auto Scaling group instances are responsible for polling the queue and processing any messages received. To do this, a launch template defines a bootstrap script that allows the group’s instances to download and execute a Python code when first launched. The Python code consumes messages from the Amazon SQS queue and simulates their processing by sleeping for the MPD duration specified in the message body. After processing each message, the instance publishes the MPD as an Amazon CloudWatch metric (see the following figure).

Figure 1: Architecture diagram showing the components deployed by the AWS SAM template. These include an SQS queue, an Auto Scaling group responsible for polling and processing queue messages, a Lambda function that regularly updates the BPI CloudWatch metric, and a “Target Setter” Lambda function that regularly updates the Auto Scaling group’s target tracking scaling policy.

Figure 1: Architecture diagram showing the components deployed by the AWS SAM template.

To enable scaling, the Auto Scaling group is configured with a target tracking scaling policy that specifies BPI as the scaling metric and with an initial target value provided by the user.

The BPI CloudWatch metric is calculated and published by the “Metric-Publisher” Lambda function which is invoked every one minute using an Amazon EventBridge rate expression. To calculate BPI, the Lambda function simply takes the ratio of the number of messages visible in the Amazon SQS queue by the total number of in-service instances in the Auto Scaling group, as shown in equation (2) above.

On the other hand, the scaling policy’s target value is updated by the “Target-Setter” Lambda function, which is invoked every 30 minutes using another EventBridge rate expression. To calculate the new target value, the Lambda function simply takes the ratio of the user-defined acceptable latency value by the current average MPD queried from the corresponding CloudWatch metric, as shown in the previous equation (1).

Finally, to help you quickly test this solution, a Lambda function “Testing Lambda” is also provided and can be used to send messages to the Amazon SQS queue with a processing duration of your choice. This is specified within each message’s body. You can invoke this Lambda function with different MPDs (by modifying the corresponding environment variable) to verify how the Auto Scaling group scales in response. A CloudWatch dashboard is also deployed to enable you to track key scaling metrics through time. These include the number of messages visible in the queue, the number of in-service instances in the Auto Scaling group, the MPD, and BPI vs acceptable BPI.

Solution testing

To demonstrate the solution in action and its impact on application latency, we conducted two tests that you can reproduce by following the instructions described in the “Testing” section of the repository’s README file (repository link). In both tests, we assume a hypothetical application with a target latency of 300s. We also modified the invocation frequency of the “Target Setter” Lambda function to one minute to quickly assess the impact of target value changes. In both tests, we submit 50 messages to the Amazon SQS queue through the provided helper lambda. An MPD of 25s and 50s was used for the first and second test, respectively. The provided CloudWatch dashboard shows that the ASG scales to a total of four instances in the first test, and eight instances in the second (see the following figure). See README file for a detailed description of how various metrics evolve over time.

Comparison of Tests 1 and 2

Since Test 2 messages take twice as long to process, the Auto Scaling group launched twice as many instances to attempt to process all of the messages in the same amount of time as Test 1 (latency). The following figure shows that the total time to process all 50 messages in Test 1 was 9 mins vs 10 mins in Test 2. In contrast, if we were to use a static/fixed acceptable BPI of 12, then a total of four instances would have been operational in Test 2, thereby requiring double the time of Test 1 (~20 minutes) to process all of the messages. This demonstrates the value of using a dynamic scaling target when processing messages from Amazon SQS queues, especially in circumstances where the MPD is prone to vary with time.

Figure 2: CloudWatch dashboard showing Auto Scaling group scaling test results (Test 1 and 2). Although Test 2 messages require double the MPD of Test 1 messages, the Auto Scaling group processed Test 2 messages in the same amount of time as Test 1 by launching twice as many instances.

Figure 2: CloudWatch dashboard showing Auto Scaling group scaling test results (Test 1 and 2).

Recommended best practices for Auto Scaling groups

This section highlights a few key best practices that we recommend adopting when deploying and working with Auto Scaling groups.

Reducing cost using EC2 Spot instances

Amazon SQS helps build loosely coupled application architectures, while providing reliable asynchronous communication between the various layers/components of an application. If a worker node fails to process a message within the Amazon SQS message visibility time-out, then the message is returned to the queue and another worker node can pick up and process that message. This makes Amazon SQS-backed applications fault-tolerant by design and thus a great fit for EC2 Spot instances. EC2 spot instances are spare compute capacity in the AWS cloud that is available to you at steep discounts as compared to On-Demand prices.

Maximizing capacity using attribute-based instance selection

With the recently released attribute-based instance selection feature, you can define infrastructure requirements based on application needs such as vCPU, RAM, and processor family (e.g., x86, ARM). This removes the need to define specific instances in your Auto Scaling group configuration, and it eliminates the burden of identifying the correct instance families and sizes. In addition, newly released instance types will be automatically considered if they fit your requirements. Attribute-based instance selection lets you tap into hundreds of different EC2 instance pools, which increases the chance of getting EC2 (Spot/On-demand) instances. When using attribute-based instance selection with the capacity optimized allocation strategy, Amazon EC2 allocates instances from deeper Spot capacity pools, thereby further reducing the chance of Spot interruption.

The following sample configuration creates an Auto Scaling group with attribute-based instance selection:

AutoScalingGroupName: 'my-asg' # [REQUIRED] 
MixedInstancesPolicy:
  LaunchTemplate:
    LaunchTemplateSpecification:
      LaunchTemplateId: 'lt-0537239d9aef10a77'
    Overrides:
    - InstanceRequirements:
        VCpuCount: # [REQUIRED] 
          Min: 2
          Max: 4
        MemoryMiB: # [REQUIRED] 
          Min: 2048
  InstancesDistribution:
    SpotAllocationStrategy: 'capacity-optimized'
MinSize: 0 # [REQUIRED] 
MaxSize: 100 # [REQUIRED] 
DesiredCapacity: 4
VPCZoneIdentifier: 'subnet-e76a128a,subnet-e66a128b,subnet-e16a128c'

Conclusion

As can be seen from the test results, this approach demonstrates how an Auto Scaling group can honor a user-provided acceptable latency constraint while accomodating variations in the MPD over time. This is possible because the average MPD is monitored and regularly updated as a CloudWatch metric. In turn, this is continously used to update the target value of the group’s target tracking policy. Moreover, we have covered additional Auto Scaling group best practices suitable for this use case, including the use of Spot instances to reduce costs and attribute-based instance selection to simplify the selection of relevant instance types.

For more information on scaling options for Auto Scaling groups, visit the Amazon EC2 Auto Scaling documentation page and the SQS-based scaling guide.

How to choose between CoIP and Direct VPC routing modes on AWS Outposts rack

Post Syndicated from Sheila Busser original https://aws.amazon.com/blogs/compute/how-to-choose-between-coip-and-direct-vpc-routing-modes-on-aws-outposts-rack/

This blog post is written by Sumit Menaria, Senior Hybrid Solutions Architect AWS WWSO Core Services.

AWS Outposts Rack is a fully-managed service that extends AWS infrastructure, services, APIs, and tools to customer premises. By providing local access to AWS managed infrastructure and services, Outposts rack enables customers to build and run applications on premises using the same programming interfaces as in AWS Regions, while using local compute and storage resources for low latency, local data processing, and data residency needs.

There are various data sources on premises that you might want to connect from your Outpost. These sources can include field devices, on-premises databases, mainframes, storage arrays, or end users. Each Outpost supports a single Local Gateway (LGW) construct, which enables connectivity from your Outpost subnets to an on-premises network. Note that this post is specific to Outposts racks and a different method of local communication is used for AWS Outposts servers.

Two different options for facilitating communication between your Outpost based resources and on-premises network: Direct VPC routing and customer-owned IP pool. Both of these are mutually exclusive options, and routing works differently based on your choice of the mode. The two modes are the attributes of the LGW route table that your Outpost subnets’ VPC is associated with, which specifies the communication mode for the Outpost subnets.

Direct VPC routing mode

Direct VPC routing uses the private IP address of the instances in the VPC CIDR block to facilitate communication with your on-premises network. These addresses are advertised to your on-premises network with Border Gateway Protocol (BGP). Advertisement via BGP is only for the private IP addresses that belong to the subnets on your Outpost and have a route pointing to the LGW via the subnet’s route table. This type of routing is the default mode for Outposts Rack. In this mode, the LGW doesn’t perform Network Address Translation (NAT) for instances. Furthermore, you don’t have to assign an Elastic IP address to your Amazon Elastic Compute Cloud (Amazon EC2) instance from a (CoIP) to enable communication with your on-premises resources.

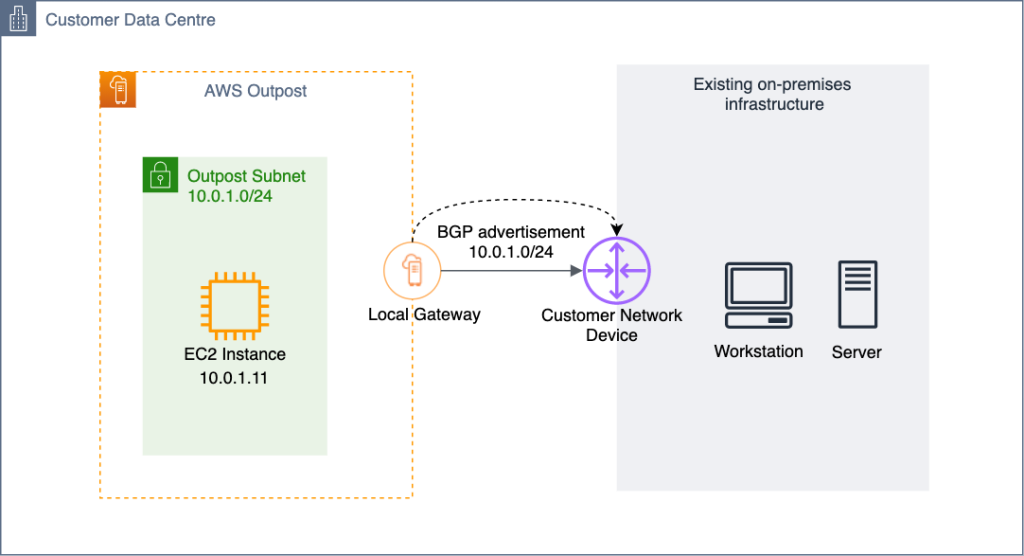
A diagram showing how an EC2 instance on an Outpost communicates with on-premises network using direct VPC routing mode

In this diagram, when the instance Y wants to communicate with an on-premises server, it traverses the LGW and can talk to the on-premises server using its source address (10.0.1.11) in the Subnet CIDR range (10.0.1.0/24) that is advertised over BGP from the LGW to the Customer Network Device. Similarly when the on-premises server wants to initiate communication with the Outpost based EC2 instance, it uses the instance’s private IP address (10.0.1.11) as the destination IP address to set up the connection.

CoIP mode

Utilizing CoIP mode means that you must provide a separate IP address range from your on-premises IP space for AWS to create an address pool, known as a CoIP. With CoIP, when an Outpost based resources, such as EC2 instances, Application Load Balancer (ALB), or Amazon Relational Database Service (Amazon RDS) instances, need to communicate to your on-premises network, the Local Gateway will perform 1:1 NAT from the resource’s private IP address from the Outpost subnet range to an IP address from the CoIP pool. The subnet-to-CoIP address mapping is done by assigning an Elastic IP (EIP) from the CoIP address range allocated for resources such as EC2 instances. To enable the communication with the CoIP pool from the on-premises network, and then the LGW advertises the CoIP pool through BGP over its peering with the Customer Network Device.

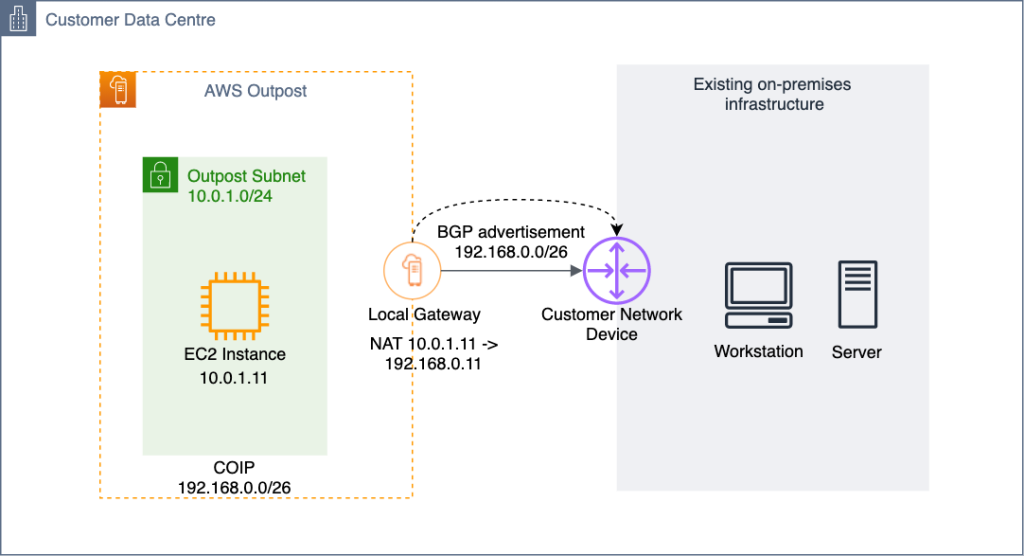
A diagram showing how an EC2 instance on an Outpost communicates with on-premises network using CoIP mode

In this diagram, when the instance Y wants to talk to an on-premises server, the traffic traverses the LGW and the source IP address (10.0.1.11) of the instance gets translated to an IP address (192.168.0.11) in the CoIP range that is associated with the instance. Similarly, when the on-premises server initiates the communication, the request will be sent with the CoIP address (192.168.0.11) of the instance as the destination IP address. This will be changed to the instance’s private IP address (10.0.1.11) via NAT at the LGW. The CoIP pool (192.168.0.0/26) is advertised via BGP to the Customer Network Device to provide the route to the on-premises environment for reaching the Outpost based resources.

When to choose CoIP routing mode

CoIP is particularly useful when you want to isolate your Outpost based workloads from the on-premises infrastructure and only need specific resources on the Outpost to be able to communicate to the on-premises infrastructure. This is useful in situations where large enterprise networks have hundreds of IP pools allocated and there is a high chance of overlap between IP addresses allocated to Outpost based VPCs/Subnets and those allocated to on-premises infrastructure. Furthermore, CoIP can act as another layer of security, as you may choose to allocate the CoIP addresses to only the resources which must communicate with the on-premises network. Then you can allocate for the rest of them using the subnet private IP address range for communication within the Outpost or Region based resources.

This means that you don’t need to have the number of IPs in the CoIP pool be equal to the number of resources on your Outpost. For example, you may choose to configure a /26 CoIP range and a /22 pool for subnets to meet your workload requirements.

CoIP mode can also be useful when using an external ALB on Outpost and you want to make it routable through the local internet connectivity. By using a smaller internet routable CoIP address range assignment for your external ALB, you can route traffic to the ALB on the Outpost without needing to traverse through the internet gateway (IGW) in the parent Region.

When to choose Direct VPC routing mode

You can choose Direct VPC routing if you don’t want the operational overhead of managing the additional IP pools for NAT between your Outpost based resources and on-premises network. There are also few applications which may not work well if there is an NAT of IPs between the two endpoints communicating with each other. Some examples you may see are Active Directory communication with on-premises based servers, or iSCSI mount of your instances as an additional storage to on-premises Storage Area Network (SAN). These applications may not work or may need additional tuning if they encounter NATed IP addresses between an Outpost based client on an EC2 instance and on-premises based server for a two-way communication.

When Direct VPC routing mode is used, multiple VPCs can be associated to an Outpost LGW route table, and the Outpost subnets with the LGW as the route target, are automatically advertised to the on-premises network through BGP. Therefore, you must make sure that appropriate IP planning is in place to avoid any overlap of the Outpost VPC/Subnet IP range with the on-premises IP range, as they are directly advertised from LGW toward the Customer Network Device. Having overlapping IP subnets in your network can lead to undesired effects on your application connectivity and you must pay special attention when allocating IP pools for your on-premises and Outpost based VPC address space. You can use Amazon VPC IP Address Manager (IPAM) to plan the IP space of your VPCs and CoIP pools, as well as add on-premises based IP Pools using manual allocation.

Conclusion

You can select either Direct VPC routing or CoIP mode for routing through an Outpost Local Gateway. Since this selection affects the routing for all of the subnets on your Outpost associated with the LGW route table, it should be selected based on your workload requirements and existing IP infrastructure planning. You can also change the LGW route table mode at a later stage. However, that involves network disruption and the creation of a new LGW route table. To learn more about Outposts Racks routing, visit the LGW Route table documentation.

Hacking the Tax Code

Post Syndicated from Bruce Schneier original https://www.schneier.com/blog/archives/2023/02/hacking-the-tax-code.html

The tax code isn’t software. It doesn’t run on a computer. But it’s still code. It’s a series of algorithms that takes an input—financial information for the year—and produces an output: the amount of tax owed. It’s incredibly complex code; there are a bazillion details and exceptions and special cases. It consists of government laws, rulings from the tax authorities, judicial decisions, and legal opinions.

Like computer code, the tax code has bugs. They might be mistakes in how the tax laws were written. They might be mistakes in how the tax code is interpreted, oversights in how parts of the law were conceived, or unintended omissions of some sort or another. They might arise from the exponentially huge number of ways different parts of the tax code interact.

A recent example comes from the 2017 Tax Cuts and Jobs Act. That law was drafted in both haste and secret, and quickly passed without any time for review—or even proofreading. One of the things in it was a typo that accidentally categorized military death benefits as earned income. The practical effect of that mistake is that surviving family members were hit with surprise tax bills of US$10,000 or more.

That’s a bug, but not a vulnerability. An example of a vulnerability is the “Double Irish with a Dutch Sandwich.” It arises from the interactions of tax laws in multiple countries, and it’s how companies like Google and Apple have avoided paying U.S. taxes despite being U.S. companies. Estimates are that U.S. companies avoided paying nearly US$200 billion in taxes in 2017 alone.

In the tax world, vulnerabilities are called loopholes. Exploits are called tax avoidance strategies. And there are thousands of black-hat researchers who examine every line of the tax code looking for exploitable vulnerabilities—tax attorneys and tax accountants.

Some vulnerabilities are deliberately created. Lobbyists are constantly trying to insert this or that provision into the tax code that benefits their clients financially. That same 2017 U.S. tax law included a special tax break for oil and gas investment partnerships, a special exemption that ensures that fewer than 1 in 1,000 estates will have to pay estate tax, and language specifically expanding a pass-through loophole that industry uses to incorporate companies offshore and avoid U.S. taxes. That’s not hacking the tax code. It’s hacking the processes that create them: the legislative process that creates tax law.

We know the processes to use to fix vulnerabilities in computer code. Before the code is finished, we can employ some sort of secure development processes, with automatic bug-finding tools and maybe source code audits. After the code is deployed, we might rely on vulnerability finding by the security community, perhaps bug bounties—and most of all, quick patching when vulnerabilities are discovered.

What does it mean to “patch” the tax code? Passing any tax legislation is a big deal, especially in the United States where the issue is so partisan and contentious. (That 2017 earned income tax bug for military families hasn’t yet been fixed. And that’s an easy one; everyone acknowledges it was a mistake.) We don’t have the ability to patch tax code with anywhere near the same agility that we have to patch software.

We can patch some vulnerabilities, though. The other way tax code is modified is by IRS and judicial rulings. The 2017 tax law capped income tax deductions for property taxes. This provision didn’t come into force in 2018, so someone came up with the clever hack to prepay 2018 property taxes in 2017. Just before the end of the year, the IRS ruled about when that was legal and when it wasn’t. Short answer: most of the time, it wasn’t.

There’s another option: that the vulnerability isn’t patched and isn’t explicitly approved, and slowly becomes part of the normal way of doing things. Lots of tax loopholes end up like this. Sometimes they’re even given retroactive legality by the IRS or Congress after a constituency and lobbying effort gets behind them. This process is how systems evolve. A hack subverts the intent of a system. Whatever governing system has jurisdiction either blocks the hack or allows it—or does nothing and the hack becomes the new normal.

Here’s my question: what happens when artificial intelligence and machine learning (ML) gets hold of this problem? We already have ML systems that find software vulnerabilities. What happens when you feed a ML system the entire U.S. tax code and tell it to figure out all of the ways to minimize the amount of tax owed? Or, in the case of a multinational corporation, to feed it the entire planet’s tax codes? What sort of vulnerabilities would it find? And how many? Dozens or millions?

In 2015, Volkswagen was caught cheating on emissions control tests. It didn’t forge test results; it got the cars’ computers to cheat for them. Engineers programmed the software in the car’s onboard computer to detect when the car was undergoing an emissions test. The computer then activated the car’s emissions-curbing systems, but only for the duration of the test. The result was that the cars had much better performance on the road at the cost of producing more pollution.

ML will result in lots of hacks like this. They’ll be more subtle. They’ll be even harder to discover. It’s because of the way ML systems optimize themselves, and because their specific optimizations can be impossible for us humans to understand. Their human programmers won’t even know what’s going on.

Any good ML system will naturally find and exploit hacks. This is because their only constraints are the rules of the system. If there are problems, inconsistencies, or loopholes in the rules, and if those properties lead to a “better” solution as defined by the program, then those systems will find them. The challenge is that you have to define the system’s goals completely and precisely, and that that’s impossible.

The tax code can be hacked. Financial markets regulations can be hacked. The market economy, democracy itself, and our cognitive systems can all be hacked. Tasking a ML system to find new hacks against any of these is still science fiction, but it’s not stupid science fiction. And ML will drastically change how we need to think about policy, law, and government. Now’s the time to figure out how.

This essay originally appeared in the September/October 2020 issue of IEEE Security & Privacy. I wrote it when I started writing my latest book, but never published it here.

Mary Queen of Scots Letters Decrypted

Post Syndicated from Bruce Schneier original https://www.schneier.com/blog/archives/2023/02/mary-queen-of-scots-letters-decrypted.html

This is a neat piece of historical research.

The team of computer scientist George Lasry, pianist Norbert Biermann and astrophysicist Satoshi Tomokiyo—all keen cryptographers—initially thought the batch of encoded documents related to Italy, because that was how they were filed at the Bibliothèque Nationale de France.

However, they quickly realised the letters were in French. Many verb and adjectival forms being feminine, regular mention of captivity, and recurring names—such as Walsingham—all put them on the trail of Mary. Sir Francis Walsingham was Queen Elizabeth’s spymaster.

The code was a simple replacement system in which symbols stand either for letters, or for common words and names. But it would still have taken centuries to crunch all the possibilities, so the team used an algorithm that homed in on likely solutions.

Academic paper.

EDITED TO ADD (2/13): More news.

Implementing architectural patterns with Amazon EventBridge Pipes

Post Syndicated from David Boyne original https://aws.amazon.com/blogs/compute/implementing-architectural-patterns-with-amazon-eventbridge-pipes/

This post is written by Dominik Richter (Solutions Architect)

Architectural patterns help you solve recurring challenges in software design. They are blueprints that have been used and tested many times. When you design distributed applications, enterprise integration patterns (EIP) help you integrate distributed components. For example, they describe how to integrate third-party services into your existing applications. But patterns are technology agnostic. They do not provide any guidance on how to implement them.

This post shows you how to use Amazon EventBridge Pipes to implement four common enterprise integration patterns (EIP) on AWS. This helps you to simplify your architectures. Pipes is a feature of Amazon EventBridge to connect your AWS resources. Using Pipes can reduce the complexity of your integrations. It can also reduce the amount of code you have to write and maintain.

Content filter pattern

The content filter pattern removes unwanted content from a message before forwarding it to a downstream system. Use cases for this pattern include reducing storage costs by removing unnecessary data or removing personally identifiable information (PII) for compliance purposes.

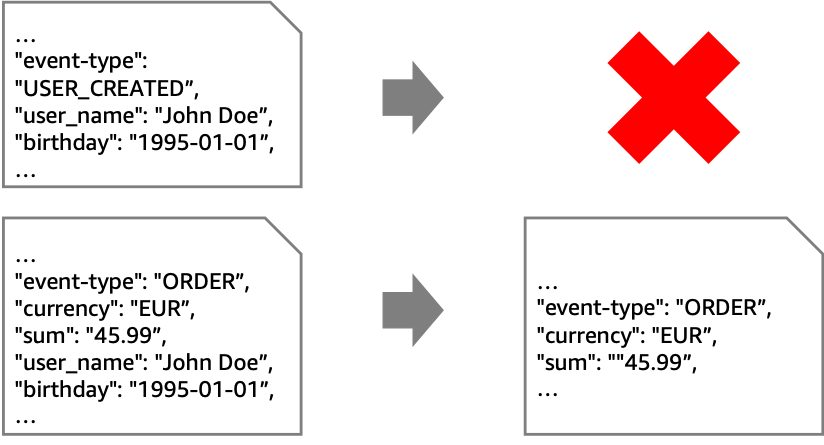
In the following example, the goal is to retain only non-PII data from “ORDER”-events. To achieve this, you must remove all events that aren’t “ORDER” events. In addition, you must remove any field in the “ORDER” events that contain PII.

While you can use this pattern with various sources and targets, the following architecture shows this pattern with Amazon Kinesis. EventBridge Pipes filtering discards unwanted events. EventBridge Pipes input transformers remove PII data from events that are forwarded to the second stream with longer retention.

Instead of using Pipes, you could connect the streams using an AWS Lambda function. This requires you to write and maintain code to read from and write to Kinesis. However, Pipes may be more cost effective than using a Lambda function.

Some situations require an enrichment function. For example, if your goal is to mask an attribute without removing it entirely. For example, you could replace the attribute “birthday” with an “age_group”-attribute.

In this case, if you use Pipes for integration, the Lambda function contains only your business logic. On the other hand, if you use Lambda for both integration and business logic, you do not pay for Pipes. At the same time, you add complexity to your Lambda function, which now contains integration code. This can increase its execution time and cost. Therefore, your priorities determine the best option and you should compare both approaches to make a decision.

To implement Pipes using the AWS Cloud Development Kit (AWS CDK), use the following source code. The full source code for all of the patterns that are described in this blog post can be found in the AWS samples GitHub repo.

const filterPipe = new pipes.CfnPipe(this, 'FilterPipe', {
  roleArn: pipeRole.roleArn,
  source: sourceStream.streamArn,
  target: targetStream.streamArn,
  sourceParameters: { filterCriteria: { filters: [{ pattern: '{"data" : {"event_type" : ["ORDER"] }}' }] }, kinesisStreamParameters: { startingPosition: 'LATEST' } },
  targetParameters: { inputTemplate: '{"event_type": <$.data.event_type>, "currency": <$.data.currency>, "sum": <$.data.sum>}', kinesisStreamParameters: { partitionKey: 'event_type' } },
});

To allow access to source and target, you must assign the correct permissions:

const pipeRole = new iam.Role(this, 'FilterPipeRole', { assumedBy: new iam.ServicePrincipal('pipes.amazonaws.com') });

sourceStream.grantRead(pipeRole);
targetStream.grantWrite(pipeRole);

Message translator pattern

In an event-driven architecture, event producers and consumers are independent of each other. Therefore, they may exchange events of different formats. To enable communication, the events must be translated. This is known as the message translator pattern. For example, an event may contain an address, but the consumer expects coordinates.

If a computation is required to translate messages, use the enrichment step. The following architecture diagram shows how to accomplish this enrichment via API destinations. In the example, you can call an existing geocoding service to resolve addresses to coordinates.

There may be cases where the translation is purely syntactical. For example, a field may have a different name or structure.

You can achieve these translations without enrichment by using input transformers.

Here is the source code for the pipe, including the role with the correct permissions:

const pipeRole = new iam.Role(this, 'MessageTranslatorRole', { assumedBy: new iam.ServicePrincipal('pipes.amazonaws.com'), inlinePolicies: { invokeApiDestinationPolicy } });

sourceQueue.grantConsumeMessages(pipeRole);
targetStepFunctionsWorkflow.grantStartExecution(pipeRole);

const messageTranslatorPipe = new pipes.CfnPipe(this, 'MessageTranslatorPipe', {
  roleArn: pipeRole.roleArn,
  source: sourceQueue.queueArn,
  target: targetStepFunctionsWorkflow.stateMachineArn,
  enrichment: enrichmentDestination.apiDestinationArn,
  sourceParameters: { sqsQueueParameters: { batchSize: 1 } },
});

Normalizer pattern

The normalizer pattern is similar to the message translator but there are different source components with different formats for events. The normalizer pattern routes each event type through its specific message translator so that downstream systems process messages with a consistent structure.

The example shows a system where different source systems store the name property differently. To process the messages differently based on their source, use an AWS Step Functions workflow. You can separate by event type and then have individual paths perform the unifying process. This diagram visualizes that you can call a Lambda function if needed. However, in basic cases like the preceding “name” example, you can modify the events using Amazon States Language (ASL).

In the example, you unify the events using Step Functions before putting them on your event bus. As is often the case with architectural choices, there are alternatives. Another approach is to introduce separate queues for each source system, connected by its own pipe containing only its unification actions.

This is the source code for the normalizer pattern using a Step Functions workflow as enrichment:

const pipeRole = new iam.Role(this, 'NormalizerRole', { assumedBy: new iam.ServicePrincipal('pipes.amazonaws.com') });

sourceQueue.grantConsumeMessages(pipeRole);
enrichmentWorkflow.grantStartSyncExecution(pipeRole);
normalizerTargetBus.grantPutEventsTo(pipeRole);

const normalizerPipe = new pipes.CfnPipe(this, 'NormalizerPipe', {
  roleArn: pipeRole.roleArn,
  source: sourceQueue.queueArn,
  target: normalizerTargetBus.eventBusArn,
  enrichment: enrichmentWorkflow.stateMachineArn,
  sourceParameters: { sqsQueueParameters: { batchSize: 1 } },
});

Claim check pattern

To reduce the size of the events in your event-driven application, you can temporarily remove attributes. This approach is known as the claim check pattern. You split a message into a reference (“claim check”) and the associated payload. Then, you store the payload in external storage and add only the claim check to events. When you process events, you retrieve relevant parts of the payload using the claim check. For example, you can retrieve a user’s name and birthday based on their userID.

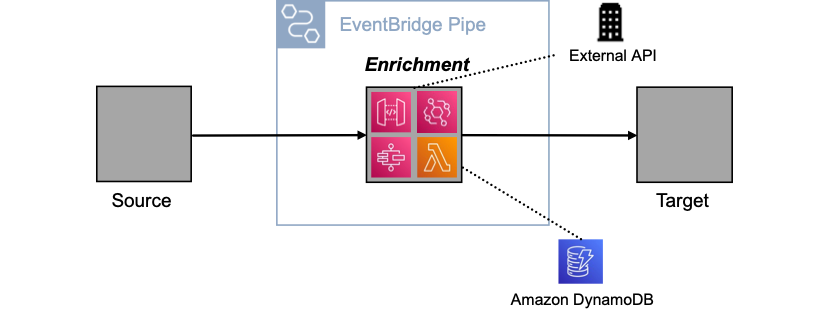
The claim check pattern has two parts. First, when an event is received, you split it and store the payload elsewhere. Second, when the event is processed, you retrieve the relevant information. You can implement both aspects with a pipe.

In the first pipe, you use the enrichment to split the event, in the second to retrieve the payload. Below are several enrichment options, such as using an external API via API Destinations, or using Amazon DynamoDB via Lambda. Other enrichment options are Amazon API Gateway and Step Functions.

Using a pipe to split and retrieve messages has three advantages. First, you keep events concise as they move through the system. Second, you ensure that the event contains all relevant information when it is processed. Third, you encapsulate the complexity of splitting and retrieving within the pipe.

The following code implements a pipe for the claim check pattern using the CDK:

const pipeRole = new iam.Role(this, 'ClaimCheckRole', { assumedBy: new iam.ServicePrincipal('pipes.amazonaws.com') });

claimCheckLambda.grantInvoke(pipeRole);
sourceQueue.grantConsumeMessages(pipeRole);
targetWorkflow.grantStartExecution(pipeRole);

const claimCheckPipe = new pipes.CfnPipe(this, 'ClaimCheckPipe', {
  roleArn: pipeRole.roleArn,
  source: sourceQueue.queueArn,
  target: targetWorkflow.stateMachineArn,
  enrichment: claimCheckLambda.functionArn,
  sourceParameters: { sqsQueueParameters: { batchSize: 1 } },
  targetParameters: { stepFunctionStateMachineParameters: { invocationType: 'FIRE_AND_FORGET' } },
});

Conclusion

This blog post shows how you can implement four enterprise integration patterns with Amazon EventBridge Pipes. In many cases, this reduces the amount of code you have to write and maintain. It can also simplify your architectures and, in some scenarios, reduce costs.

You can find the source code for all the patterns on the AWS samples GitHub repo.

For more serverless learning resources, visit Serverless Land. To find more patterns, go directly to the Serverless Patterns Collection.

SolarWinds and Market Incentives

Post Syndicated from Bruce Schneier original https://www.schneier.com/blog/archives/2023/02/solarwinds-and-market-incentives.html

In early 2021, IEEE Security and Privacy asked a number of board members for brief perspectives on the SolarWinds incident while it was still breaking news. This was my response.

The penetration of government and corporate networks worldwide is the result of inadequate cyberdefenses across the board. The lessons are many, but I want to focus on one important one we’ve learned: the software that’s managing our critical networks isn’t secure, and that’s because the market doesn’t reward that security.

SolarWinds is a perfect example. The company was the initial infection vector for much of the operation. Its trusted position inside so many critical networks made it a perfect target for a supply-chain attack, and its shoddy security practices made it an easy target.

Why did SolarWinds have such bad security? The answer is because it was more profitable. The company is owned by Thoma Bravo partners, a private-equity firm known for radical cost-cutting in the name of short-term profit. Under CEO Kevin Thompson, the company underspent on security even as it outsourced software development. The New York Times reports that the company’s cybersecurity advisor quit after his “basic recommendations were ignored.” In a very real sense, SolarWinds profited because it secretly shifted a whole bunch of risk to its customers: the US government, IT companies, and others.

This problem isn’t new, and, while it’s exacerbated by the private-equity funding model, it’s not unique to it. In general, the market doesn’t reward safety and security—especially when the effects of ignoring those things are long term and diffuse. The market rewards short-term profits at the expense of safety and security. (Watch and see whether SolarWinds suffers any long-term effects from this hack, or whether Thoma Bravo’s bet that it could profit by selling an insecure product was a good one.)

The solution here is twofold. The first is to improve government software procurement. Software is now critical to national security. Any system of procuring that software needs to evaluate the security of the software and the security practices of the company, in detail, to ensure that they are sufficient to meet the security needs of the network they’re being installed in. If these evaluations are made public, along with the list of companies that meet them, all network buyers can benefit from them. It’s a win for everybody.

But that isn’t enough; we need a second part. The only way to force companies to provide safety and security features for customers is through regulation. This is true whether we want seat belts in our cars, basic food safety at our restaurants, pajamas that don’t catch on fire, or home routers that aren’t vulnerable to cyberattack. The government needs to set minimum security standards for software that’s used in critical network applications, just as it sets software standards for avionics.

Without these two measures, it’s just too easy for companies to act like SolarWinds: save money by skimping on safety and security and hope for the best in the long term. That’s the rational thing for companies to do in an unregulated market, and the only way to change that is to change the economic incentives.

This essay originally appeared in the March/April 2021 issue of IEEE Security & Privacy.” I forgot to publish it here.

Malware Delivered through Google Search

Post Syndicated from Bruce Schneier original https://www.schneier.com/blog/archives/2023/02/malware-delivered-through-google-search.html

Criminals using Google search ads to deliver malware isn’t new, but Ars Technica declared that the problem has become much worse recently.

The surge is coming from numerous malware families, including AuroraStealer, IcedID, Meta Stealer, RedLine Stealer, Vidar, Formbook, and XLoader. In the past, these families typically relied on phishing and malicious spam that attached Microsoft Word documents with booby-trapped macros. Over the past month, Google Ads has become the go-to place for criminals to spread their malicious wares that are disguised as legitimate downloads by impersonating brands such as Adobe Reader, Gimp, Microsoft Teams, OBS, Slack, Tor, and Thunderbird.

[…]

It’s clear that despite all the progress Google has made filtering malicious sites out of returned ads and search results over the past couple decades, criminals have found ways to strike back. These criminals excel at finding the latest techniques to counter the filtering. As soon as Google devises a way to block them, the criminals figure out new ways to circumvent those protections.

Attacking Machine Learning Systems

Post Syndicated from Bruce Schneier original https://www.schneier.com/blog/archives/2023/02/attacking-machine-learning-systems.html

The field of machine learning (ML) security—and corresponding adversarial ML—is rapidly advancing as researchers develop sophisticated techniques to perturb, disrupt, or steal the ML model or data. It’s a heady time; because we know so little about the security of these systems, there are many opportunities for new researchers to publish in this field. In many ways, this circumstance reminds me of the cryptanalysis field in the 1990. And there is a lesson in that similarity: the complex mathematical attacks make for good academic papers, but we mustn’t lose sight of the fact that insecure software will be the likely attack vector for most ML systems.

We are amazed by real-world demonstrations of adversarial attacks on ML systems, such as a 3D-printed object that looks like a turtle but is recognized (from any orientation) by the ML system as a gun. Or adding a few stickers that look like smudges to a stop sign so that it is recognized by a state-of-the-art system as a 45 mi/h speed limit sign. But what if, instead, somebody hacked into the system and just switched the labels for “gun” and “turtle” or swapped “stop” and “45 mi/h”? Systems can only match images with human-provided labels, so the software would never notice the switch. That is far easier and will remain a problem even if systems are developed that are robust to those adversarial attacks.

At their core, modern ML systems have complex mathematical models that use training data to become competent at a task. And while there are new risks inherent in the ML model, all of that complexity still runs in software. Training data are still stored in memory somewhere. And all of that is on a computer, on a network, and attached to the Internet. Like everything else, these systems will be hacked through vulnerabilities in those more conventional parts of the system.

This shouldn’t come as a surprise to anyone who has been working with Internet security. Cryptography has similar vulnerabilities. There is a robust field of cryptanalysis: the mathematics of code breaking. Over the last few decades, we in the academic world have developed a variety of cryptanalytic techniques. We have broken ciphers we previously thought secure. This research has, in turn, informed the design of cryptographic algorithms. The classified world of the NSA and its foreign counterparts have been doing the same thing for far longer. But aside from some special cases and unique circumstances, that’s not how encryption systems are exploited in practice. Outside of academic papers, cryptosystems are largely bypassed because everything around the cryptography is much less secure.

I wrote this in my book, Data and Goliath:

The problem is that encryption is just a bunch of math, and math has no agency. To turn that encryption math into something that can actually provide some security for you, it has to be written in computer code. And that code needs to run on a computer: one with hardware, an operating system, and other software. And that computer needs to be operated by a person and be on a network. All of those things will invariably introduce vulnerabilities that undermine the perfection of the mathematics…

This remains true even for pretty weak cryptography. It is much easier to find an exploitable software vulnerability than it is to find a cryptographic weakness. Even cryptographic algorithms that we in the academic community regard as “broken”—meaning there are attacks that are more efficient than brute force—are usable in the real world because the difficulty of breaking the mathematics repeatedly and at scale is much greater than the difficulty of breaking the computer system that the math is running on.

ML systems are similar. Systems that are vulnerable to model stealing through the careful construction of queries are more vulnerable to model stealing by hacking into the computers they’re stored in. Systems that are vulnerable to model inversion—this is where attackers recover the training data through carefully constructed queries—are much more vulnerable to attacks that take advantage of unpatched vulnerabilities.

But while security is only as strong as the weakest link, this doesn’t mean we can ignore either cryptography or ML security. Here, our experience with cryptography can serve as a guide. Cryptographic attacks have different characteristics than software and network attacks, something largely shared with ML attacks. Cryptographic attacks can be passive. That is, attackers who can recover the plaintext from nothing other than the ciphertext can eavesdrop on the communications channel, collect all of the encrypted traffic, and decrypt it on their own systems at their own pace, perhaps in a giant server farm in Utah. This is bulk surveillance and can easily operate on this massive scale.

On the other hand, computer hacking has to be conducted one target computer at a time. Sure, you can develop tools that can be used again and again. But you still need the time and expertise to deploy those tools against your targets, and you have to do so individually. This means that any attacker has to prioritize. So while the NSA has the expertise necessary to hack into everyone’s computer, it doesn’t have the budget to do so. Most of us are simply too low on its priorities list to ever get hacked. And that’s the real point of strong cryptography: it forces attackers like the NSA to prioritize.

This analogy only goes so far. ML is not anywhere near as mathematically sound as cryptography. Right now, it is a sloppy misunderstood mess: hack after hack, kludge after kludge, built on top of each other with some data dependency thrown in. Directly attacking an ML system with a model inversion attack or a perturbation attack isn’t as passive as eavesdropping on an encrypted communications channel, but it’s using the ML system as intended, albeit for unintended purposes. It’s much safer than actively hacking the network and the computer that the ML system is running on. And while it doesn’t scale as well as cryptanalytic attacks can—and there likely will be a far greater variety of ML systems than encryption algorithms—it has the potential to scale better than one-at-a-time computer hacking does. So here again, good ML security denies attackers all of those attack vectors.

We’re still in the early days of studying ML security, and we don’t yet know the contours of ML security techniques. There are really smart people working on this and making impressive progress, and it’ll be years before we fully understand it. Attacks come easy, and defensive techniques are regularly broken soon after they’re made public. It was the same with cryptography in the 1990s, but eventually the science settled down as people better understood the interplay between attack and defense. So while Google, Amazon, Microsoft, and Tesla have all faced adversarial ML attacks on their production systems in the last three years, that’s not going to be the norm going forward.

All of this also means that our security for ML systems depends largely on the same conventional computer security techniques we’ve been using for decades. This includes writing vulnerability-free software, designing user interfaces that help resist social engineering, and building computer networks that aren’t full of holes. It’s the same risk-mitigation techniques that we’ve been living with for decades. That we’re still mediocre at it is cause for concern, with regard to both ML systems and computing in general.

I love cryptography and cryptanalysis. I love the elegance of the mathematics and the thrill of discovering a flaw—or even of reading and understanding a flaw that someone else discovered—in the mathematics. It feels like security in its purest form. Similarly, I am starting to love adversarial ML and ML security, and its tricks and techniques, for the same reasons.

I am not advocating that we stop developing new adversarial ML attacks. It teaches us about the systems being attacked and how they actually work. They are, in a sense, mechanisms for algorithmic understandability. Building secure ML systems is important research and something we in the security community should continue to do.

There is no such thing as a pure ML system. Every ML system is a hybrid of ML software and traditional software. And while ML systems bring new risks that we haven’t previously encountered, we need to recognize that the majority of attacks against these systems aren’t going to target the ML part. Security is only as strong as the weakest link. As bad as ML security is right now, it will improve as the science improves. And from then on, as in cryptography, the weakest link will be in the software surrounding the ML system.

This essay originally appeared in the May 2020 issue of IEEE Computer. I forgot to reprint it here.

A Hacker’s Mind News

Post Syndicated from Bruce Schneier original https://www.schneier.com/blog/archives/2023/02/a-hackers-mind-news.html

A Hacker’s Mind will be published on Tuesday.

I have done a written interview and a podcast interview about the book. It’s been chosen as a “February 2023 Must-Read Book” by the Next Big Idea Club. And an “Editor’s Pick”—whatever that means—on Amazon.

There have been three reviews so far. I am hoping for more. And maybe even a published excerpt or two.

Amazon and others will start shipping the book on Tuesday. If you ordered a signed copy from me, it is already in the mail.

If you can leave a review somewhere, I would appreciate it.

Manipulating Weights in Face-Recognition AI Systems

Post Syndicated from Bruce Schneier original https://www.schneier.com/blog/archives/2023/02/manipulating-weights-in-face-recognition-ai-systems.html

Interesting research: “Facial Misrecognition Systems: Simple Weight Manipulations Force DNNs to Err Only on Specific Persons“:

Abstract: In this paper we describe how to plant novel types of backdoors in any facial recognition model based on the popular architecture of deep Siamese neural networks, by mathematically changing a small fraction of its weights (i.e., without using any additional training or optimization). These backdoors force the system to err only on specific persons which are preselected by the attacker. For example, we show how such a backdoored system can take any two images of a particular person and decide that they represent different persons (an anonymity attack), or take any two images of a particular pair of persons and decide that they represent the same person (a confusion attack), with almost no effect on the correctness of its decisions for other persons. Uniquely, we show that multiple backdoors can be independently installed by multiple attackers who may not be aware of each other’s existence with almost no interference.

We have experimentally verified the attacks on a FaceNet-based facial recognition system, which achieves SOTA accuracy on the standard LFW dataset of 99.35%. When we tried to individually anonymize ten celebrities, the network failed to recognize two of their images as being the same person in 96.97% to 98.29% of the time. When we tried to confuse between the extremely different looking Morgan Freeman and Scarlett Johansson, for example, their images were declared to be the same person in 91.51% of the time. For each type of backdoor, we sequentially installed multiple backdoors with minimal effect on the performance of each one (for example, anonymizing all ten celebrities on the same model reduced the success rate for each celebrity by no more than 0.91%). In all of our experiments, the benign accuracy of the network on other persons was degraded by no more than 0.48% (and in most cases, it remained above 99.30%).

It’s a weird attack. On the one hand, the attacker has access to the internals of the facial recognition system. On the other hand, this is a novel attack in that it manipulates internal weights to achieve a specific outcome. Given that we have no idea how those weights work, it’s an important result.

Analyze Amazon S3 storage costs using AWS Cost and Usage Reports, Amazon S3 Inventory, and Amazon Athena

Post Syndicated from Dagar Katyal original https://aws.amazon.com/blogs/big-data/analyze-amazon-s3-storage-costs-using-aws-cost-and-usage-reports-amazon-s3-inventory-and-amazon-athena/

Since its launch in 2006, Amazon Simple Storage Service (Amazon S3) has experienced major growth, supporting multiple use cases such as hosting websites, creating data lakes, serving as object storage for consumer applications, storing logs, and archiving data. As the application portfolio grows, customers tend to store data from multiple application and different business functions in a single S3 bucket, which can grow the storage in S3 buckets to hundreds of TBs. The AWS Billing console provides a way to look at the total storage cost of data stored in Amazon S3, but sometimes IT organizations need to understand the breakdown of costs of a particular S3 bucket by various prefixes or objects corresponding to a particular user or application. There are various reasons to analyze the costs of S3 buckets, such as to identify the spend breakdown, do internal chargebacks, understand the cost breakdown by business unit and application, and many more. As of this writing, there is no easy way to do a cost breakdown of S3 buckets by objects and prefixes.

In this post, we discuss a solution using Amazon Athena to query AWS Cost and Usage Reports and Amazon S3 Inventory reports to analyze the cost by prefixes and objects in an S3 bucket.

Overview of solution

The following figure shows the architecture for this solution. First, we enable the AWS Cost and Usage Reports (AWS CUR) and Amazon S3 Inventory features, which save the output into two separate pre-created S3 buckets. We then use Athena to query these S3 buckets for AWS CUR data and S3 object inventory data to correlate and allocate the cost breakdown at the object or prefix level.

architecture diagram

To implement the solution, we complete the following steps:

  1. Create S3 buckets for AWS CUR, S3 object inventory, and Athena results. Alternatively, you can create these respective buckets when enabling the respective individual features, but for the purpose of this post, we create all of them at the beginning.
  2. Enable the Cost and Usage Reports.
  3. Enable Amazon S3 Inventory configuration.
  4. Create AWS Glue Data Catalog tables for the CUR and S3 object inventory to query using Athena.
  5. Run queries in Athena.

Prerequisites

For this walkthrough, you should have the following prerequisites:

Create S3 buckets

Amazon S3 is an object storage service offering industry-leading scalability, data availability, security, and performance. Customers of all sizes and industries can store and protect any amount of data for virtually any use case, such as data lakes, cloud-native applications, and mobile apps. With cost-effective storage classes and easy-to-use management features, you can optimize costs, organize data, and configure fine-tuned access controls to meet specific business, organizational, and compliance requirements.

For this post, we use the S3 bucket s3-object-cost-allocation as the primary bucket for cost allocation. This S3 bucket is conveniently modeled to contain several prefixes and objects of different sizes for which cost allocation needs to be done based on the overall cost of the bucket. In a real-world scenario, you should use a bucket that has data for multiple teams and for which you need to allocate costs by prefix or object. Going forward, we refer to this bucket as the primary object bucket.

The following screenshot shows our S3 bucket and folders.

example Folders created

Now let’s create the three additional operational S3 buckets to store the datasets generated to calculate costs for the objects. You can create the following buckets or any existing buckets as needed:

  • cur-cost-usage-reports-<account_number> – This bucket is used to save the Cost and Usage Reports for the account.
  • S3-inventory-configurations-<account_number> – This bucket is used to save the inventory configurations of our primary object bucket.
  • athena-query-bucket-<account_number> – This bucket is used to save the query results from Athena.

Complete the following steps to create your S3 buckets:

  • On the Amazon S3 console, choose Buckets in the navigation pane.
  • Choose Create bucket.
  • For Bucket name, enter the name of your bucket (cur-cost-usage-reports-<account_number>).
  • For AWS Region, choose your preferred Region.
  • Leave all other settings at default (or according to your organization’s standards).
  • Choose Create bucket.
    create s3 bucket
  • Repeat these steps to create s3-inventory-configurations-<account_number> and athena-query-bucket-<account_number>.

Enable the Cost and Usage Reports

The AWS Cost and Usage Reports (AWS CUR) contains the most comprehensive set of cost and usage data available. You can use Cost and Usage Reports to publish your AWS billing reports to an S3 bucket that you own. You can receive reports that break down your costs by the hour, day, or month; by product or product resource; or by tags that you define yourself.

Complete the following steps to enable Cost and Usage Reports for your account:

  • On the AWS Billing console, in the navigation pane, choose Cost & Usage Reports.
  • Choose Create report.
  • For Report name, enter a name for your report, such as account-cur-s3.
  • For Additional report details, select Include resource IDs to include the IDs of each individual resource in the report.Including resource IDs will create individual line items for each of your resources. This can increase the size of your Cost and Usage Reports files significantly, which can affect the S3 storage costs for your CUR, based on your AWS usage. We need this feature enabled for this post.
  • For Data refresh settings, select whether you want the Cost and Usage Reports to refresh if AWS applies refunds, credits, or support fees to your account after finalizing your bill.When a report refreshes, a new report is uploaded to Amazon S3.
  • Choose Next.
  • For S3 bucket, choose Configure.
  • For Configure S3 Bucket, select an existing bucket created in the previous section (cur-cost-usage-reports-<account_number>) and choose Next.
  • Review the bucket policy, select I have confirmed that this policy is correct, and choose Save. This default bucket policy provides Cost and Usage Reports access to write data to Amazon S3.
  • For Report path prefix, enter cur-data/account-cur-daily.
  • For Time granularity, choose Daily.
  • For Report versioning, choose Overwrite existing report.
  • For Enable report data integration for, select Amazon Athena.
  • Choose Next.
  • After you have reviewed the settings for your report, choose Review and Complete.
    create cost and usage report

The Cost and Usage reports will be delivered to the S3 buckets within 24 hours.

The following sample CUR in CSV format shows different columns of the Cost and Usage Report, including bill_invoice_id, bill_invoicing_entity, bill_payer_account_id, and line_item_product_code, to name a few.

sample cost and usage report

Enable Amazon S3 Inventory configuration

Amazon S3 Inventory is one of the tools Amazon S3 provides to help manage your storage. You can use it to audit and report on the replication and encryption status of your objects for business, compliance, and regulatory needs. Amazon S3 Inventory provides comma-separated values (CSV), Apache Optimized Row Columnar (ORC), or Apache Parquet output files that list your objects and their corresponding metadata on a daily or weekly basis for an S3 bucket or a shared prefix (objects that have names that begin with a common string).

Complete the following steps to enable Amazon S3 Inventory on the primary object bucket:

  • On the Amazon S3 console, choose Buckets in the navigation pane.
  • Choose the bucket for which you want to configure Amazon S3 Inventory.
    This will be the existing bucket in your account that has data that needs to be analyzed. This could be your data lake or application S3 bucket. We created the bucket s3-object-cost-allocation with some sample data and folder structure.
  • Choose Management.
  • Under Inventory configurations, choose Create inventory configuration.
  • For Inventory configuration name, enter s3-object-cost-allocation.
  • For Inventory scope, leave Prefix blank.
    This is to ensure that all objects are covered for the report.
  • For Object Versions, select Current version only.
  • For Report details, choose This account.
  • For Destination, choose the destination bucket we created (s3-inventory-configurations-<account_number>).
  • For Frequency, choose Daily.
  • For Output format, choose as Apache Parquet.
  • For Status, choose Enable.
  • Keep server-side encryption disabled. To use server-side encryption, choose Enable and specify the encryption key.
  • For Additional fields, select the following to add to the inventory report:
    • Size – The object size in bytes.
    • Last modified date – The object creation date or the last modified date, whichever is the latest.
    • Multipart upload – Specifies that the object was uploaded as a multipart upload. For more information, see Uploading and copying objects using multipart upload.
    • Replication status – The replication status of the object. For more information, see Using the S3 console.
    • Encryption status – The server-side encryption used to encrypt the object. For more information, see Protecting data using server-side encryption.
    • Bucket key status – Indicates whether a bucket-level key generated by AWS KMS applies to the object.
    • Storage class – The storage class used for storing the object.
    • Intelligent-Tiering: Access tier – Indicates the access tier of the object if it was stored in Intelligent-Tie
      create s3 inventory
  • Choose Create.
    s3 inventory configuration

It may take up to 48 hours to deliver the first report.

Create AWS Glue Data Catalog tables for CUR and Amazon S3 Inventory reports

Wait for up to 48 hours for the previous step to generate the reports. In this section, we use Athena to create and define AWS Glue Data Catalog tables for the data that has been created using Cost and Usage Reports and Amazon S3 Inventory reports.

Athena is a serverless, interactive analytics service built on open-source frameworks, supporting open-table and file formats. Athena provides a simplified, flexible way to analyze petabytes of data where it lives.

Complete the following steps to create the tables using Athena:

  • Navigate to the Athena console.
  • If you’re using Athena for the first time, you need to set up a query result location in Amazon S3. If you preconfigured this in Athena , you can skip this step.
    • Choose View settings.
      athena setup query bucket
    • Choose Manage.
    • In the section Query result location and encryption, choose Browse S3 and choose the bucket that we created (athena-query-bucket-<account_number>).
    • Choose Save.
      Athena Config
    • Navigate back to the Athena query editor.
  • Run the following query in Athena to create a table for Cost and Usage Reports. Verify and update the section for <<LOCATION>> at the end of the query and point it to the correct S3 bucket and location. Note that the new table name should be account_cur.
    CREATE EXTERNAL TABLE `account_cur`(
    `identity_line_item_id` string,
    `identity_time_interval` string,
    `bill_invoice_id` string,
    `bill_billing_entity` string,
    `bill_bill_type` string,
    `bill_payer_account_id` string,
    `bill_billing_period_start_date` timestamp,
    `bill_billing_period_end_date` timestamp,
    `line_item_usage_account_id` string,
    `line_item_line_item_type` string,
    `line_item_usage_start_date` timestamp,
    `line_item_usage_end_date` timestamp,
    `line_item_product_code` string,
    `line_item_usage_type` string,
    `line_item_operation` string,
    `line_item_availability_zone` string,
    `line_item_resource_id` string,
    `line_item_usage_amount` double,
    `line_item_normalization_factor` double,
    `line_item_normalized_usage_amount` double,
    `line_item_currency_code` string,
    `line_item_unblended_rate` string,
    `line_item_unblended_cost` double,
    `line_item_blended_rate` string,
    `line_item_blended_cost` double,
    `line_item_line_item_description` string,
    `line_item_tax_type` string,
    `line_item_legal_entity` string,
    `product_product_name` string,
    `product_availability` string,
    `product_description` string,
    `product_durability` string,
    `product_event_type` string,
    `product_fee_code` string,
    `product_fee_description` string,
    `product_free_query_types` string,
    `product_from_location` string,
    `product_from_location_type` string,
    `product_from_region_code` string,
    `product_group` string,
    `product_group_description` string,
    `product_location` string,
    `product_location_type` string,
    `product_message_delivery_frequency` string,
    `product_message_delivery_order` string,
    `product_operation` string,
    `product_platopricingtype` string,
    `product_product_family` string,
    `product_queue_type` string,
    `product_region` string,
    `product_region_code` string,
    `product_servicecode` string,
    `product_servicename` string,
    `product_sku` string,
    `product_storage_class` string,
    `product_storage_media` string,
    `product_to_location` string,
    `product_to_location_type` string,
    `product_to_region_code` string,
    `product_transfer_type` string,
    `product_usagetype` string,
    `product_version` string,
    `product_volume_type` string,
    `pricing_rate_code` string,
    `pricing_rate_id` string,
    `pricing_currency` string,
    `pricing_public_on_demand_cost` double,
    `pricing_public_on_demand_rate` string,
    `pricing_term` string,
    `pricing_unit` string,
    `reservation_amortized_upfront_cost_for_usage` double,
    `reservation_amortized_upfront_fee_for_billing_period` double,
    `reservation_effective_cost` double,
    `reservation_end_time` string,
    `reservation_modification_status` string,
    `reservation_normalized_units_per_reservation` string,
    `reservation_number_of_reservations` string,
    `reservation_recurring_fee_for_usage` double,
    `reservation_start_time` string,
    `reservation_subscription_id` string,
    `reservation_total_reserved_normalized_units` string,
    `reservation_total_reserved_units` string,
    `reservation_units_per_reservation` string,
    `reservation_unused_amortized_upfront_fee_for_billing_period` double,
    `reservation_unused_normalized_unit_quantity` double,
    `reservation_unused_quantity` double,
    `reservation_unused_recurring_fee` double,
    `reservation_upfront_value` double,
    `savings_plan_total_commitment_to_date` double,
    `savings_plan_savings_plan_a_r_n` string,
    `savings_plan_savings_plan_rate` double,
    `savings_plan_used_commitment` double,
    `savings_plan_savings_plan_effective_cost` double,
    `savings_plan_amortized_upfront_commitment_for_billing_period` double,
    `savings_plan_recurring_commitment_for_billing_period` double,
    `resource_tags_user_bucket_name` string,
    `resource_tags_user_cost_tracking` string)
    PARTITIONED BY (
    `year` string,
    `month` string)
    ROW FORMAT SERDE
    'org.apache.hadoop.hive.ql.io.parquet.serde.ParquetHiveSerDe'
    STORED AS INPUTFORMAT
    'org.apache.hadoop.mapred.TextInputFormat'
    OUTPUTFORMAT
    'org.apache.hadoop.hive.ql.io.HiveIgnoreKeyTextOutputFormat'
    LOCATION
    '<<LOCATION>>'
  • Run the following query in Athena to create the table for Amazon S3 Inventory. Verify and update the section for <<LOCATION>> at the end of the query and point it to the correct S3 bucket and location.
    • To get the exact value of the location, navigate to the bucket where inventory configurations are stored and navigate to the folder path Hive . Use the S3 URI to replace <<LOCATION>> in the query.query path location
      CREATE EXTERNAL TABLE s3_object_inventory(
               bucket string,
               key string,
               version_id string,
               is_latest boolean,
               is_delete_marker boolean,
               size bigint,
               last_modified_date bigint,
               storage_class string,
               is_multipart_uploaded boolean,
               replication_status string,
               encryption_status string,
               intelligent_tiering_access_tier string,
               bucket_key_status string
      ) PARTITIONED BY (
              dt string
      )
      ROW FORMAT SERDE 'org.apache.hadoop.hive.ql.io.parquet.serde.ParquetHiveSerDe'
        STORED AS INPUTFORMAT 'org.apache.hadoop.hive.ql.io.SymlinkTextInputFormat'
        OUTPUTFORMAT 'org.apache.hadoop.hive.ql.io.IgnoreKeyTextOutputFormat'
        LOCATION '<<LOCATION>>';
      
  • We need to refresh the partitions and add new inventory lists to the table. Use the following commands to add data to the CUR table and Amazon S3 Inventory table:
    MSCK REPAIR TABLE `account_cur`;
    
    MSCK REPAIR TABLE s3_object_inventory;

Run queries in Athena to allocate the cost of objects in an S3 bucket

Now we can query the data we have available to get a cost allocation breakdown at the prefix level.

We need to provide some information in the following queries:

  • Update <<YYYY-MM-DD>> with the date for which you want to analyze the data
  • Update <<prefix>> with the prefix values for your bucket that needs to be analyzed
  • Update <<bucket_name>> with the name of the bucket that needs to be analyzed

We use the following part of the query to calculate the size of storage being used by the target prefix that we want to calculate the cost for:

select date_parse(dt,'%Y-%m-%d-%H-%i') dt, cast (sum(size) as double) targetPrefixBytes
from s3_object_inventory
where date_parse(dt,'%Y-%m-%d-%H-%i') = cast('<<YYYY-MM-DD>>' as timestamp)
and key like '<<prefix>>/%'
group by dt

Next, we calculate the total size of the bucket on that particular date:

select date_parse(dt,'%Y-%m-%d-%H-%i') dt, cast (sum(size) as double) totalBytes
from s3_object_inventory
where date_parse(dt,'%Y-%m-%d-%H-%i') = cast('<<YYYY-MM-DD>>' as timestamp)
group by dt

We query the CUR table to get the cost of a particular bucket on a particular date:

select line_item_usage_start_date as dt, sum(line_item_blended_cost) as line_item_blended_cost
from "account_cur"
where line_item_product_code = 'AmazonS3'
and product_servicecode = 'AmazonS3'
and line_item_operation = 'StandardStorage'
and line_item_resource_id = '<<bucket_name>>'
and line_item_usage_start_date = cast('<<YYYY-MM-DD>>' as timestamp)
group by line_item_usage_start_date

Putting all of this together, we can calculate the cost of a particular prefix (folder or a file) on a specific date. The complete query is as follows:

with
cost as (select line_item_usage_start_date as dt, sum(line_item_blended_cost) as line_item_blended_cost
from "account_cur"
where line_item_product_code = 'AmazonS3'
and product_servicecode = 'AmazonS3'
and line_item_operation = 'StandardStorage'
and line_item_resource_id = '<<bucket_name>>'
and line_item_usage_start_date = cast('<<YYYY-MM-DD>>' as timestamp)
group by line_item_usage_start_date),
total as (select date_parse(dt,'%Y-%m-%d-%H-%i') dt, cast (sum(size) as double) totalBytes
from s3_object_inventory
where date_parse(dt,'%Y-%m-%d-%H-%i') = cast('<<YYYY-MM-DD>>' as timestamp)
group by dt),
target as (select date_parse(dt,'%Y-%m-%d-%H-%i') dt, cast (sum(size) as double) targetPrefixBytes
from s3_object_inventory
where date_parse(dt,'%Y-%m-%d-%H-%i') = cast('<<YYYY-MM-DD>>' as timestamp)
and key like '<<prefix>>/%'
group by dt)
select target.dt,
(target.targetPrefixBytes/ total.totalBytes * 100) percentUsed,
cost.line_item_blended_cost totalCost,
cost.line_item_blended_cost*(target.targetPrefixBytes/ total.totalBytes) as prefixCost
from target, total, cost
where target.dt = total.dt
and target.dt = cost.dt

The following screenshot shows the results table for the sample data we used in this post. We get the following information:

  • dt – Date
  • percentUsed – The percentage of prefix space compared to overall bucket space
  • totalCost – The total cost of the bucket
  • prefixCost – The cost of the space used by the prefix

final result percetage

Clean up

To stop incurring costs, be sure to disable Amazon S3 Inventory and Cost and Usage Reports when you’re done.

Delete the S3 buckets created for the Amazon S3 Inventory reports and Cost and Usage Reports to avoid storage charges.

Other methods for Amazon S3 storage analysis

Amazon S3 Storage Lens can provide a single view of object storage usage and activity across your entire Amazon S3 storage. With S3 Storage Lens, you can understand, analyze, and optimize storage with over 29 usage and activity metrics and interactive dashboards to aggregate data for your entire organization, specific accounts, Regions, buckets, or prefixes. All of this data is accessible on the Amazon S3 console or as raw data in an S3 bucket.

S3 Storage Lens doesn’t provide cost analysis based on an object or prefix in a single bucket. If you want visibility of storage usage and trends across the entire storage footprint along with recommendations on cost efficiency and data protection best practices, S3 Storage Lens is the right option. But if you want a cost analysis of specific S3 buckets and looking for ways to get cost allocation of S3 objects at the object or prefix level, the solution in this post would be the best fit.

Conclusion

In this post, we detailed how to create a cost breakdown model at the object or prefix level for S3 buckets that contains data for multiple business units and applications. We used Athena to query the reports and datasets produced by the AWS CUR and Amazon S3 Inventory features that, when correlated, give us the cost allocation at the object and prefix level. This solution gives you an easy way to calculate costs for independent objects and prefixes, which can be used for internal chargebacks or just to know the per-object or per-prefix spending in a shared S3 bucket.


About the Authors


Dagar Katyal
is a Senior Solutions Architect at AWS, based in Chicago, Illinois. He works with customers and provides guidance for key strategic initiatives important for their business. Dagar has an MBA and has spent years over 15 years working with customers on projects on analytics strategy, roadmap, and using data as a key differentiator. When not working with customers, Dagar spends time with his family and doing home improvement projects.


Saiteja Pudi
is a Solutions Architect at AWS, based in Dallas, Tx. He has been with AWS for more than 3 years now, helping customers derive the true potential of AWS by being their trusted advisor. He comes from an application development background, interested in Data Science and Machine Learning.

Automating your workload deployments in AWS Local Zones

Post Syndicated from Sheila Busser original https://aws.amazon.com/blogs/compute/automating-your-workload-deployments-in-aws-local-zones/

This blog post is written by Enrico Liguori, SA – Solutions Builder , WWPS Solution Architecture.

AWS Local Zones are a type of infrastructure deployment that places compute, storage,and other select AWS services close to large population and industry centers.

We now have a total of 32 Local Zones; 15 outside of the US (Bangkok, Buenos Aires, Copenhagen, Delhi, Hamburg, Helsinki, Kolkata, Lagos, Lima, Muscat, Perth, Querétaro, Santiago, Taipei, and Warsaw) and 17 in the US. We will continue to launch Local Zones in 21 metro areas in 18 countries, including Australia, Austria, Belgium, Brazil, Canada, Colombia, Czech Republic, Germany, Greece, India, Kenya, Netherlands, New Zealand, Norway, Philippines, Portugal, South Africa, and Vietnam.

Customers using AWS Local Zones can provision the infrastructure and services needed to host their workloads with the same APIs and tools for automation that they use in the AWS Region, included the AWS Cloud Development Kit (AWS CDK).

The AWS CDK is an open source software development framework to model and provision your cloud application resources using familiar programming languages, including TypeScript, JavaScript, Python, C#, and Java. For the solution in this post, we use Python.

Overview

In this post we demonstrate how to:

  1. Programmatically enable the Local Zone of your interest.
  2. Explore the supported APIs to check the types of Amazon Elastic Compute Cloud (Amazon EC2) instances available in a specific Local Zone and get their associated price per hour;
  3. Deploy a simple WordPress application in the Local Zone through AWS CDK.

Prerequisites

To be able to try the examples provided in this post, you must configure:

  1. AWS Command Line Interface (AWS CLI)
  2. Python version 3.8 or above
  3. AWS CDK

Enabling a Local Zone programmatically

To get started with Local Zones, you must first enable the Local Zone that you plan to use in your AWS account. In this tutorial, you can learn how to select the Local Zone that provides the lowest latency to your site and understand how to opt into the Local Zone from the AWS Management Console.

If you prefer to interact with AWS APIs programmatically, then you can enable the Local Zone of your interest by calling the ModifyAvailabilityZoneGroup API through the AWS CLI or one of the supported AWS SDKs.

The following examples show how to opt into the Atlanta Local Zone through the AWS CLI and through the Python SDK:

AWS CLI:

aws ec2 modify-availability-zone-group \
  --region us-east-1 \
  --group-name us-east-1-atl-1 \
  --opt-in-status opted-in

Python SDK:

ec2 = boto3.client('ec2', config=Config(region_name='us-east-1'))
response = ec2.modify_availability_zone_group(
                  GroupName='us-east-1-atl-1',
                  OptInStatus='opted-in'
           )

The opt in process takes approximately five minutes to complete. After this time, you can confirm the opt in status using the DescribeAvailabilityZones API.

From the AWS CLI, you can check the enabled Local Zones with:

aws ec2 describe-availability-zones --region us-east-1

Or, once again, we can use one of the supported SDKs. Here is an example using Phyton:

ec2 = boto3.client('ec2', config=Config(region_name='us-east-1'))
response = ec2.describe_availability_zones()

In both cases, a JSON object similar to the following, will be returned:

{
"State": "available",
"OptInStatus": "opted-in",
"Messages": [],
"RegionName": "us-east-1",
"ZoneName": "us-east-1-atl-1a",
"ZoneId": "use1-atl1-az1",
"GroupName": "us-east-1-atl-1",
"NetworkBorderGroup": "us-east-1-atl-1",
"ZoneType": "local-zone",
"ParentZoneName": "us-east-1d",
"ParentZoneId": "use1-az4"
}

The OptInStatus confirms that we successful enabled the Atlanta Local Zone and that we can now deploy resources in it.

How to check available EC2 instances in Local Zones

The set of instance types available in a Local Zone might change from one Local Zone to another. This means that before starting deploying resources, it’s a good practice to check which instance types are supported in the Local Zone.

After enabling the Local Zone, we can programmatically check the instance types that are available by using DescribeInstanceTypeOfferings. To use the API with Local Zones, we must pass availability-zone as the value of the LocationType parameter and use a Filter object to select the correct Local Zone that we want to check. The resulting AWS CLI command will look like the following example:

aws ec2 describe-instance-type-offerings --location-type "availability-zone" --filters 
Name=location,Values=us-east-1-atl-1a --region us-east-1

Using Python SDK:

ec2 = boto3.client('ec2', config=Config(region_name='us-east-1'))
response = ec2.describe_instance_type_offerings(
      LocationType='availability-zone',
      Filters=[
            {
            'Name': 'location',
            'Values': ['us-east-1-atl-1a']
            }
            ]
      )

How to check prices of EC2 instances in Local Zones

EC2 instances and other AWS resources in Local Zones will have different prices than in the parent Region. Check the pricing page for the complete list of pricing options and associated price-per-hour.

To access the pricing list programmatically, we can use the GetProducts API. The API returns the list of pricing options available for the AWS service specified in the ServiceCode parameter. We also recommend defining Filters to restrict the number of results returned. For example, to retrieve the On-Demand pricing list of a T3 Medium instance in Atlanta from the AWS CLI, we can use the following:

aws pricing get-products --format-version aws_v1 --service-code AmazonEC2 --region us-east-1 \
--filters 'Type=TERM_MATCH,Field=instanceType,Value=t3.medium' \
--filters 'Type=TERM_MATCH,Field=location,Value=US East (Atlanta)'

Similarly, with Python SDK we can use the following:

pricing = boto3.client('pricing',config=Config(region_name="us-east-1")) response = pricing.get_products(
         ServiceCode='AmazonEC2',
         Filters= [
          {
          "Type": "TERM_MATCH",
          "Field": "instanceType",
          "Value": "t3.medium"
          },
          {
          "Type": "TERM_MATCH",
          "Field": "regionCode",
          "Value": "us-east-1-atl-1"
          }
        ],
         FormatVersion='aws_v1',
)

Note that the Region specified in the CLI command and in Boto3, is the location of the AWS Price List service API endpoint. This API is available only in us-east-1 and ap-south-1 Regions.

Deploying WordPress in Local Zones using AWS CDK

In this section, we see how to use the AWS CDK and Python to deploy a simple non-production WordPress installation in a Local Zone.

Architecture overview

architecture overview

The AWS CDK stack will deploy a new standard Amazon Virtual Private Cloud (Amazon VPC) in the parent Region (us-east-1) that will be extended to the Local Zone. This creates two subnets associated with the Atlanta Local Zone: a public subnet to expose resources on the Internet, and a private subnet to host the application and database layers. Review the AWS public documentation for a definition of public and private subnets in a VPC.

The application architecture is made of the following:

  • A front-end in the private subnet where a WordPress application is installed, through a User Data script, in a type T3 medium EC2 instance.
  • A back-end in the private subnet where MySQL database is installed, through a User Data script, in a type T3 medium EC2 instance.
  • An Application Load Balancer (ALB) in the public subnet that will act as the entry point for the application.
  • A NAT instance to allow resources in the private subnet to initiate traffic to the Internet.

Clone the sample code from the AWS CDK examples repository

We can clone the AWS CDK code hosted on GitHub with:

$ git clone https://github.com/aws-samples/aws-cdk-examples.git

Then navigate to the directory aws-cdk-examples/python/vpc-ec2-local-zones using the following:

$ cd aws-cdk-examples/python/vpc-ec2-local-zones

Before starting the provisioning, let’s look at the code in the following sections.

Networking infrastructure

The networking infrastructure is usually the first building block that we must define. In AWS CDK, this can be done using the VPC construct:

import aws_cdk.aws_ec2 as ec2
vpc = ec2.Vpc(
            self,
            "Vpc",
            cidr=”172.31.100.0/24”,
            subnet_configuration=[
                ec2.SubnetConfiguration(
                    name = 'Public-Subnet',
                    subnet_type = ec2.SubnetType.PUBLIC,
                    cidr_mask = 26,
                ),
                ec2.SubnetConfiguration(
                    name = 'Private-Subnet',
                    subnet_type = ec2.SubnetType.PRIVATE_ISOLATED,
                    cidr_mask = 26,
                ),
            ]      
        )

Together with the VPC CIDR (i.e. 172.31.100.0/24), we define also the subnets configuration through the subnet_configuration parameter.

Note that in the subnet definitions above there is no specification of the Availability Zone or Local Zone that we want to associate them with. We can define this setting at the VPC level, overwriting the availability_zones method as shown here:

@property
def availability_zones(self):
   return [“us-east-1-atl-1a”]

As an alternative, you can use a Local Zone Name as the value of the availability_zones parameter in each Subnet definition. For a complete list of Local Zone Names, check out the Zone Names on the Local Zones Locations page.

Specifying ec2.SubnetType.PUBLIC  in the subnet_type parameter, AWS CDK  automatically creates an Internet Gateway (IGW) associated with our VPC and a default route in its routing table pointing to the IGW. With this setup, the Internet traffic will go directly to the IGW in the Local Zone without going through the parent AWS Region. For other connectivity options, check the AWS Local Zone User Guide.

The last piece of our networking infrastructure is a self-managed NAT instance. This will allow instances in the private subnet to communicate with services outside of the VPC and simultaneously prevent them from receiving unsolicited connection requests.

We can implement the best practices for NAT instances included in the AWS public documentation using a combination of parameters of the Instance construct, as shown here:

nat = ec2.Instance(self, "NATInstanceInLZ",
                 vpc=vpc,
                 security_group=self.create_nat_SG(vpc),
                 instance_type=ec2.InstanceType.of(ec2.InstanceClass.T3, ec2.InstanceSize.MEDIUM),
                 machine_image=ec2.MachineImage.latest_amazon_linux(),
                 user_data=ec2.UserData.custom(user_data),
                 vpc_subnets=ec2.SubnetSelection(availability_zones=[“us-east-1-atl-1a”], subnet_type=ec2.SubnetType.PUBLIC),
                 source_dest_check=False
                )

In the previous code example, we specify the following as parameters:

The final required step is to update the route table of the private subnet with the following:

priv_subnet.add_route("DefRouteToNAT",
            router_id=nat_instance.instance_id,
            router_type=ec2.RouterType.INSTANCE,
            destination_cidr_block="0.0.0.0/0",
            enables_internet_connectivity=True)

The application stack

The other resources, including the front-end instance managed by AutoScaling, the back-end instance, and ALB are deployed using the standard AWS CDK constructs. Note that the ALB service is only available in some Local Zones. If you plan to use a Local Zone where ALB isn’t supported, then you must deploy a load balancer on a self-managed EC2 instance, or use a load balancer available in AWS Marketplace.

Stack deployment

Next, let’s go through the AWS CDK bootstrapping process. This is required only for the first time that we use AWS CDK in a specific AWS environment (an AWS environment is a combination of an AWS account and Region).

$ cdk bootstrap

Now we can deploy the stack with the following:

$ cdk deploy

After the deployment is completed, we can connect to the application with a browser using the URL returned in the output of the cdk deploy command:

terminal screenshot

The WordPress install wizard will be displayed in the browser, thereby confirming that the deployment worked as expected:

The WordPress install wizard

Note that in this post we use the Local Zone in Atlanta. Therefore, we must deploy the stack in its parent Region, US East (N. Virginia). To select the Region used by the stack, configure the AWS CLI default profile.

Cleanup

To terminate the resources that we created in this post, you can simply run the following:

$ cdk destroy

Conclusion

In this post, we demonstrated how to interact programmatically with the different AWS APIs available for Local Zones. Furthermore, we deployed a simple WordPress application in the Atlanta Local Zone after analyzing the AWS CDK code used for the deployment.

We encourage you to try the examples provided in this post and get familiar with the programmatic configuration and deployment of resources in a Local Zone.

AIs as Computer Hackers

Post Syndicated from Bruce Schneier original https://www.schneier.com/blog/archives/2023/02/ais-as-computer-hackers.html

Hacker “Capture the Flag” has been a mainstay at hacker gatherings since the mid-1990s. It’s like the outdoor game, but played on computer networks. Teams of hackers defend their own computers while attacking other teams’. It’s a controlled setting for what computer hackers do in real life: finding and fixing vulnerabilities in their own systems and exploiting them in others’. It’s the software vulnerability lifecycle.

These days, dozens of teams from around the world compete in weekend-long marathon events held all over the world. People train for months. Winning is a big deal. If you’re into this sort of thing, it’s pretty much the most fun you can possibly have on the Internet without committing multiple felonies.

In 2016, DARPA ran a similarly styled event for artificial intelligence (AI). One hundred teams entered their systems into the Cyber Grand Challenge. After completing qualifying rounds, seven finalists competed at the DEFCON hacker convention in Las Vegas. The competition occurred in a specially designed test environment filled with custom software that had never been analyzed or tested. The AIs were given 10 hours to find vulnerabilities to exploit against the other AIs in the competition and to patch themselves against exploitation. A system called Mayhem, created by a team of Carnegie-Mellon computer security researchers, won. The researchers have since commercialized the technology, which is now busily defending networks for customers like the U.S. Department of Defense.

There was a traditional human–team capture-the-flag event at DEFCON that same year. Mayhem was invited to participate. It came in last overall, but it didn’t come in last in every category all of the time.

I figured it was only a matter of time. It would be the same story we’ve seen in so many other areas of AI: the games of chess and go, X-ray and disease diagnostics, writing fake news. AIs would improve every year because all of the core technologies are continually improving. Humans would largely stay the same because we remain humans even as our tools improve. Eventually, the AIs would routinely beat the humans. I guessed that it would take about a decade.

But now, five years later, I have no idea if that prediction is still on track. Inexplicably, DARPA never repeated the event. Research on the individual components of the software vulnerability lifecycle does continue. There’s an enormous amount of work being done on automatic vulnerability finding. Going through software code line by line is exactly the sort of tedious problem at which machine learning systems excel, if they can only be taught how to recognize a vulnerability. There is also work on automatic vulnerability exploitation and lots on automatic update and patching. Still, there is something uniquely powerful about a competition that puts all of the components together and tests them against others.

To see that in action, you have to go to China. Since 2017, China has held at least seven of these competitions—called Robot Hacking Games—many with multiple qualifying rounds. The first included one team each from the United States, Russia, and Ukraine. The rest have been Chinese only: teams from Chinese universities, teams from companies like Baidu and Tencent, teams from the military. Rules seem to vary. Sometimes human–AI hybrid teams compete.

Details of these events are few. They’re Chinese language only, which naturally limits what the West knows about them. I didn’t even know they existed until Dakota Cary, a research analyst at the Center for Security and Emerging Technology and a Chinese speaker, wrote a report about them a few months ago. And they’re increasingly hosted by the People’s Liberation Army, which presumably controls how much detail becomes public.

Some things we can infer. In 2016, none of the Cyber Grand Challenge teams used modern machine learning techniques. Certainly most of the Robot Hacking Games entrants are using them today. And the competitions encourage collaboration as well as competition between the teams. Presumably that accelerates advances in the field.

None of this is to say that real robot hackers are poised to attack us today, but I wish I could predict with some certainty when that day will come. In 2018, I wrote about how AI could change the attack/defense balance in cybersecurity. I said that it is impossible to know which side would benefit more but predicted that the technologies would benefit the defense more, at least in the short term. I wrote: “Defense is currently in a worse position than offense precisely because of the human components. Present-day attacks pit the relative advantages of computers and humans against the relative weaknesses of computers and humans. Computers moving into what are traditionally human areas will rebalance that equation.”

Unfortunately, it’s the People’s Liberation Army and not DARPA that will be the first to learn if I am right or wrong and how soon it matters.

This essay originally appeared in the January/February 2022 issue of IEEE Security & Privacy.

Passwords Are Terrible (Surprising No One)

Post Syndicated from Bruce Schneier original https://www.schneier.com/blog/archives/2023/02/passwords-are-terrible-surprising-no-one.html

This is the result of a security audit:

More than a fifth of the passwords protecting network accounts at the US Department of the Interior—including Password1234, Password1234!, and ChangeItN0w!—were weak enough to be cracked using standard methods, a recently published security audit of the agency found.

[…]

The results weren’t encouraging. In all, the auditors cracked 18,174—or 21 percent—­of the 85,944 cryptographic hashes they tested; 288 of the affected accounts had elevated privileges, and 362 of them belonged to senior government employees. In the first 90 minutes of testing, auditors cracked the hashes for 16 percent of the department’s user accounts.

The audit uncovered another security weakness—the failure to consistently implement multi-factor authentication (MFA). The failure extended to 25—­or 89 percent—­of 28 high-value assets (HVAs), which, when breached, have the potential to severely impact agency operations.

Original story:

To make their point, the watchdog spent less than $15,000 on building a password-cracking rig—a setup of a high-performance computer or several chained together ­- with the computing power designed to take on complex mathematical tasks, like recovering hashed passwords. Within the first 90 minutes, the watchdog was able to recover nearly 14,000 employee passwords, or about 16% of all department accounts, including passwords like ‘Polar_bear65’ and ‘Nationalparks2014!’.