All posts by Danilo Poccia

AWS Weekly Roundup: C7i Instances, Knowledge Base for Amazon Bedrock, and More (Sept. 18, 2023)

Post Syndicated from Danilo Poccia original https://aws.amazon.com/blogs/aws/aws-weekly-roundup-c7i-instances-knowledge-base-for-amazon-bedrock-and-more-sept-18-2023/

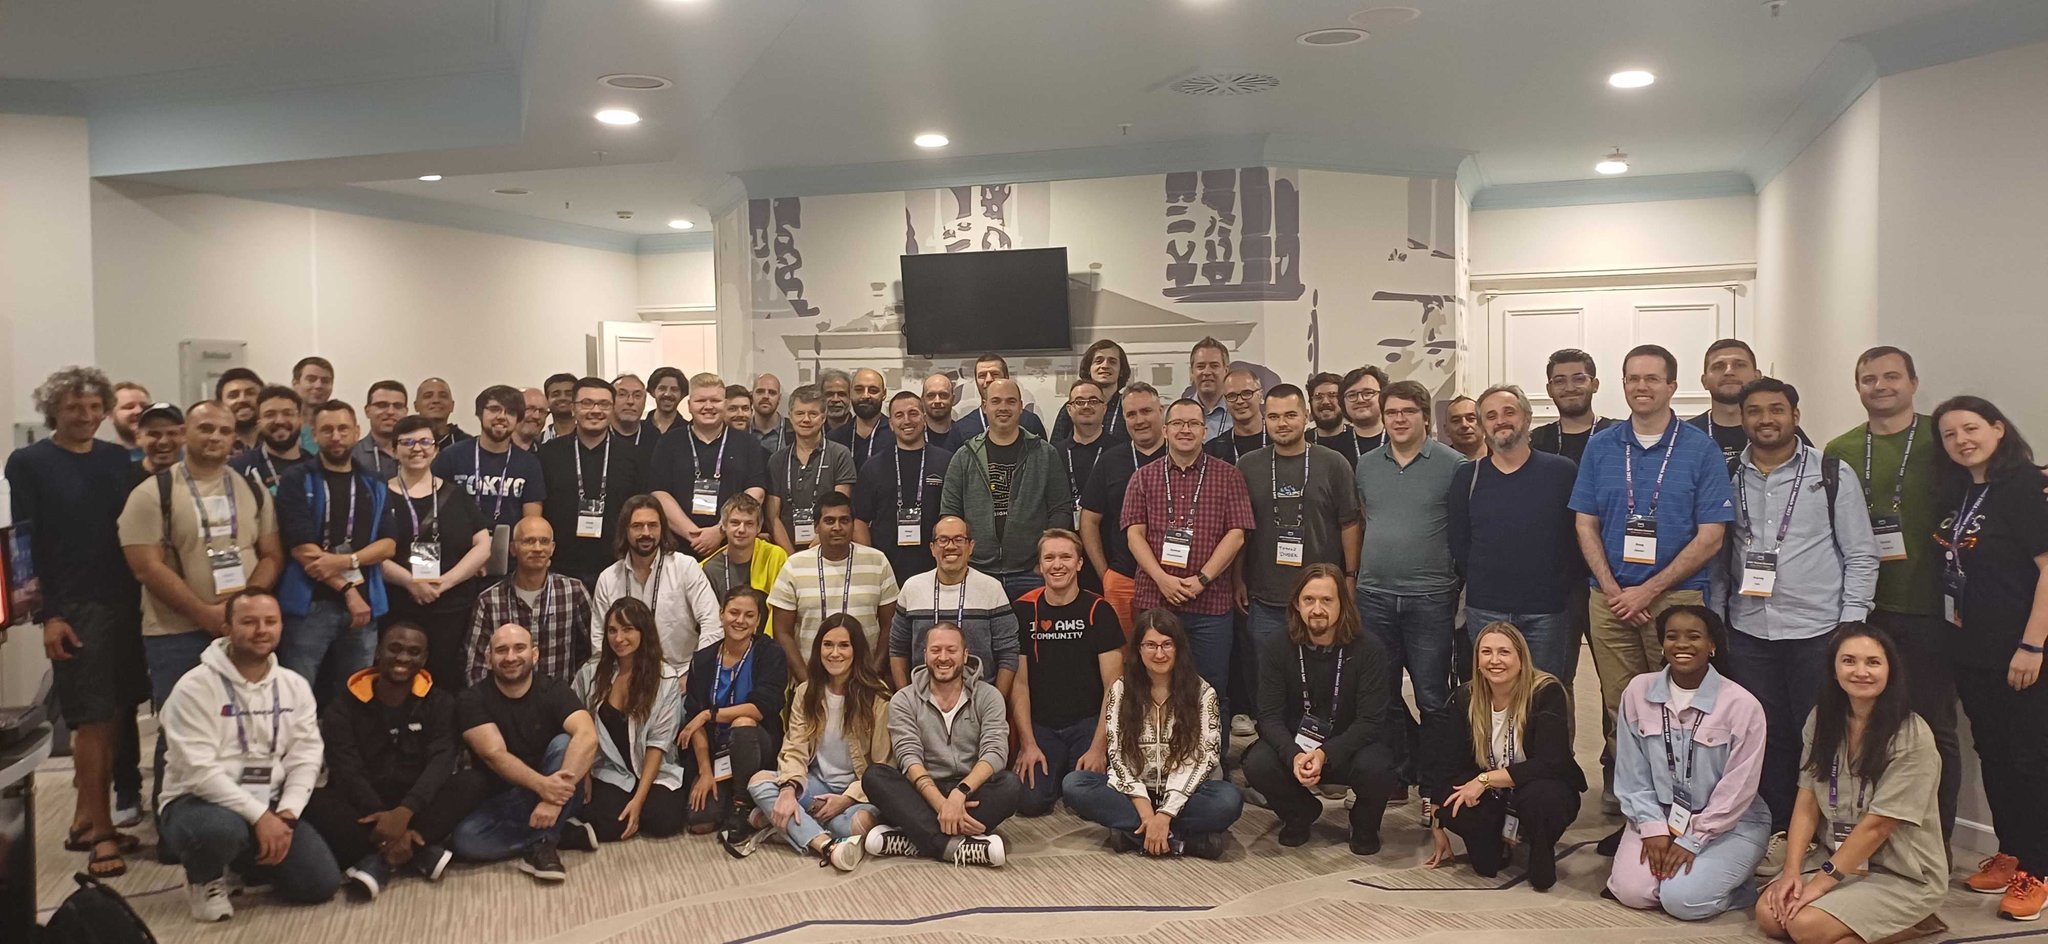
While daylight is getting shorter in the Northern hemisphere, we’ve got two new EC2 instance types optimized for compute and memory and many new capabilities for other services. Last week there was also the EMEA AWS Heroes Summit in Munich, an amazing day full of insights and passion. Here’s a nice picture of the participants!

AWS Heroes Summit EMEA 2023 in Munich

Last Week’s Launches
Here are some of the launches that caught my attention last week:

C7i Instances – Powered by custom 4th Generation Intel Xeon Scalable processors (code-named Sapphire Rapids) and available only on AWS, these compute-optimized instances offer up to 15 percent better performance over comparable x86-based Intel processors used by other cloud providers. A great choice for all compute-intensive workloads, such as batch processing, distributed analytics, high performance computing (HPC), ad serving, highly scalable multiplayer gaming, and video encoding, C7i instances deliver up to 15 percent better price performance versus C6i instances.

vCPUs
Memory (GiB)
Network Bandwidth
EBS Bandwidth
c7i.large 2 4 Up to 12.5 Gbps Up to 10 Gbps
c7i.xlarge 4 8 Up to 12.5 Gbps Up to 10 Gbps
c7i.2xlarge 8 16 Up to 12.5 Gbps Up to 10 Gbps
c7i.4xlarge 16 32 Up to 12.5 Gbps Up to 10 Gbps
c7i.8xlarge 32 64 12.5 Gbps 10 Gbps
c7i.12xlarge 48 96 18.75 Gbps 15 Gbps
c7i.16xlarge 64 128 25 Gbps 20 Gbps
c7i.24xlarge 96 192 37.5 Gbps 30 Gbps
c7i.48xlarge 192 384 50 Gbps 40 Gbps
c7i.metal-24xl* 96 192 37.5 Gbps 30 Gbps
c7i.metal-48xl* 192 384 50 Gbps 40 Gbps

*Bare metal instances are coming soon.

To facilitate efficient offload and acceleration of data operations and optimize performance for workloads, C7i instances support built-in Intel accelerators such as Data Streaming Accelerator (DSA), In-Memory Analytics Accelerator (IAA), QuickAssist Technology (QAT), and the new Intel Advanced Matrix Extensions (AMX) that accelerate matrix multiplication operations for applications such as CPU-based ML.

EC2 R7a Instances – Powered by 4th Gen AMD EPYC processors (code-named Genoa) with a maximum frequency of 3.7 GHz, these memory optimized instances deliver up to 50 percent higher performance compared to R6a instances and are ideal for high performance, memory-intensive workloads such as SQL and NoSQL databases, distributed web scale in-memory caches, in-memory databases, real-time big data analytics, and Electronic Design Automation (EDA) applications. Read more in Channy’s blog post.

Knowledge Base for Amazon Bedrock (Preview) – To deliver more relevant and contextual responses, Bedrock can now manage both the ingestion workflow and runtime orchestration to connect your organization’s private data sources to foundation models (FMs) and enable retrieval augmented generation (RAG) for your generative AI applications. To store data, you can choose from a range of vector databases including the vector engine for Amazon OpenSearch Serverless, Pinecone, and Redis Enterprise Cloud. Read more in Antje’s blog post.

High Query Rates with Amazon OpenSearch Serverless Extends Auto-Scaling – You can now rely on OpenSearch Serverless to help manage unpredictable surges in your search and query traffic and efficiently handle tens of thousands of query transactions per minute.

Amazon EMR on EKS – You can now improve resource utilization and simplify infrastructure management by using EMR to run Apache Flink (Public Preview) on the same Amazon EKS cluster as your other applications. Also, to provide a secure, stable, high-performance environment with the latest enhancements such as kernel, toolchain, glibc, and openssl, you can now use Amazon Linux 2023 as the operating system together with Java 17 as Java runtime to run your workloads with Amazon EMR on EKS.

Amazon Connect – Amazon Connect Cases now supports uploading attachments to a case, enabling agents to have the information they need at their fingertips in order to resolve cases, and displaying the author name for comments that are written on cases, to more easily track who contributed to the resolution of the case and collaborate more effectively. To receive near real-time stream of contact (voice calls, chat, and task) events (for example, call is queued) in a contact center, you can now subscribe to the new Contact Data Updated event.

Custom Notifications for AWS Chatbot – This lets you include additional information, such as number of orders or current throttling limits, when monitoring the health and performance of your AWS applications in Microsoft Teams and Slack channels.

AWS IAM Identity Center Session Duration Increased Up to 90 Days – You now have more flexibility based on your security context and desired end-user experience. Previously, the maximum duration was 7 days. The default session duration continues to be 8 hours and existing customer-configured session limits will remain unchanged.

Full Support of GraphQL APIs in Amplify Studio – You can now generate forms connected to your API, manage records in your API with Data Manager, and create data-bound Figma to React components for GraphQL APIs created with Amplify Studio or Amplify CLI. Previously, these data-powered features were only available when using Amplify DataStore.

Nested Filtering for AWS AppSync WebSockets-Based Subscriptions – You now have additional control over how data should be published out to connected clients by using filtering rules that allow you to target specific sub-items within the published data. Read more in this blog post.

API Gateway Console Refresh – There are usability improvements to REST and WebSocket API workflows (now visually aligned with the console experience of HTTP APIs) and dark mode support. Accessibility enhancements also help to better integrate with assistive technology.

Override Retention Capability for AWS Supply Chain – Manual forecast adjustments made by a demand planner are now automatically saved and reapplied from one planning cycle to the next.

Other AWS News
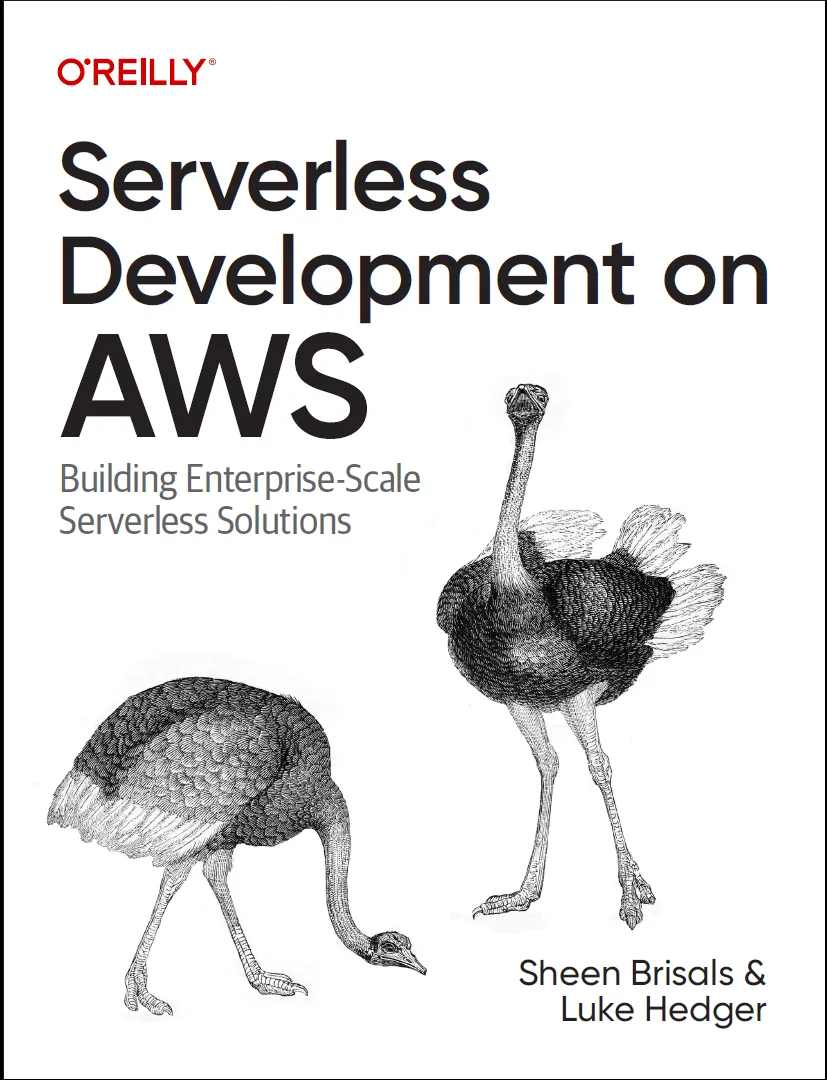
Serverless Development on AWS – Book CoverServerless Development on AWSAWS Hero Sheen Brisals and his colleague Luke Hedger revealed that they are sharing their expertise with a book that helps build enterprise-scale serverless solutions on AWS. The book outlines the adoption requirements in terms of people, mindset, and workloads, and details architectural patterns, security, and data best practices for building serverless applications.

More posts from AWS blogs – Here are a few posts from some of the other AWS and cloud blogs that I follow:

Upcoming AWS Events
Check your calendars and sign up for these AWS events:

AWS On Tour, Sept. 18-Oct. 6 – The AWS Developer Relations team is boarding a bus and traveling across European cities (London, Paris, Brussels, Amsterdam, Frankfurt, Zurich, Milan, Lyon, and Barcelona) to share their experiences and help you improve productivity.

AWS Global Summits, Sept. 26 – The last in-person AWS Summit of the year will be held in Johannesburg on Sept. 26.

CDK Day, Sept. 29Learn more at the website about this community-led fully virtual event with tracks in English and Spanish about CDK and related projects.

AWS re:Invent, Nov. 27-Dec. 1 – Browsing the session catalog is a nice way to start planning your re:Invent. Join us to hear the latest from AWS, learn from experts, and connect with the global cloud community.

AWS Community Days – Join a community-led conference run by AWS user group leaders in your region: Netherlands (Sept. 20), Spain (Sept. 23), Zimbabwe (Sept. 30), Peru (Sept. 30), Chile (Sept. 30), and Bulgaria (Oct. 7). Visit the landing page to check out all the upcoming AWS Community Days.

You can browse all upcoming AWS-led in-person and virtual events, and developer-focused events such as AWS DevDay.

Danilo

This post is part of our Weekly Roundup series. Check back each week for a quick roundup of interesting news and announcements from AWS!
AWS Entity Resolution: Match and Link Related Records from Multiple Applications and Data Stores

Post Syndicated from Danilo Poccia original https://aws.amazon.com/blogs/aws/aws-entity-resolution-match-and-link-related-records-from-multiple-applications-and-data-stores/

As organizations grow, the records that contain information about customers, businesses, or products tend to be increasingly fragmented and siloed across applications, channels, and data stores. Because information can be gathered in different ways, there is also the issue of different but equivalent data, such as for street addresses (“5th Avenue” and “5th Ave”). As a consequence, it’s not easy to link related records together to create a unified view and gain better insights.

For example, companies want to run advertising campaigns to reach consumers across multiple applications and channels with personalized messaging. Companies often have to deal with disparate data records that contain incomplete or conflicting information, creating a difficult matching process.

In the retail industry, companies have to reconcile, across their supply chain and stores, products that use multiple and different product codes, such as stock keeping units (SKUs), universal product codes (UPCs), or proprietary codes. This prevents them from analyzing information quickly and holistically.

One way to address this problem is to build bespoke data resolution solutions such as complex SQL queries interacting with multiple databases, or train machine learning (ML) models for record matching. But these solutions take months to build, require development resources, and are costly to maintain.

To help you with that, today we’re introducing AWS Entity Resolution, an ML-powered service that helps you match and link related records stored across multiple applications, channels, and data stores. You can get started in minutes configuring entity resolution workflows that are flexible, scalable, and can seamlessly connect to your existing applications.

AWS Entity Resolution offers advanced matching techniques, such as rule-based matching and machine learning models, to help you accurately link related sets of customer information, product codes, or business data codes. For example, you can use AWS Entity Resolution to create a unified view of your customer interactions by linking recent events (such as ad clicks, cart abandonment, and purchases) into a unique entity ID, or better track products that use different codes (like SKUs or UPCs) across your stores.

With AWS Entity Resolution, you can improve matching accuracy and protect data security while minimizing data movement because it reads records where they already live. Let’s see how that works in practice.

Using AWS Entity Resolution
As part of my analytics platform, I have a comma-separated values (CSV) file containing one million fictitious customers in an Amazon Simple Storage Service (Amazon S3) bucket. These customers come from a loyalty program but can have applied through different channels (online, in store, by post), so it’s possible that multiple records relate to the same customer.

This is the format of the data in the CSV file:

loyalty_id, rewards_id, name_id, first_name, middle_initial, last_name, program_id, emp_property_nbr, reward_parent_id, loyalty_program_id, loyalty_program_desc, enrollment_dt, zip_code,country, country_code, address1, address2, address3, address4, city, state_code, state_name, email_address, phone_nbr, phone_type

I use an AWS Glue crawler to automatically determine the content of the file and keep the metadata table updated in the data catalog so that it’s available for my analytics jobs. Now, I can use the same setup with AWS Entity Resolution.

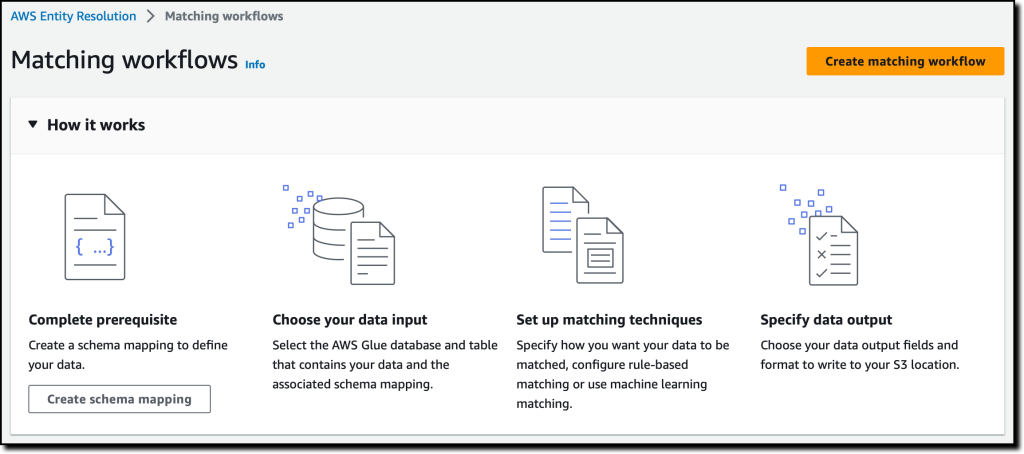
In the AWS Entity Resolution console, I choose Get started to see how to set up a matching workflow.

Console screenshot.

To create a matching workflow, I first need to define my data with a schema mapping.

Console screenshot.

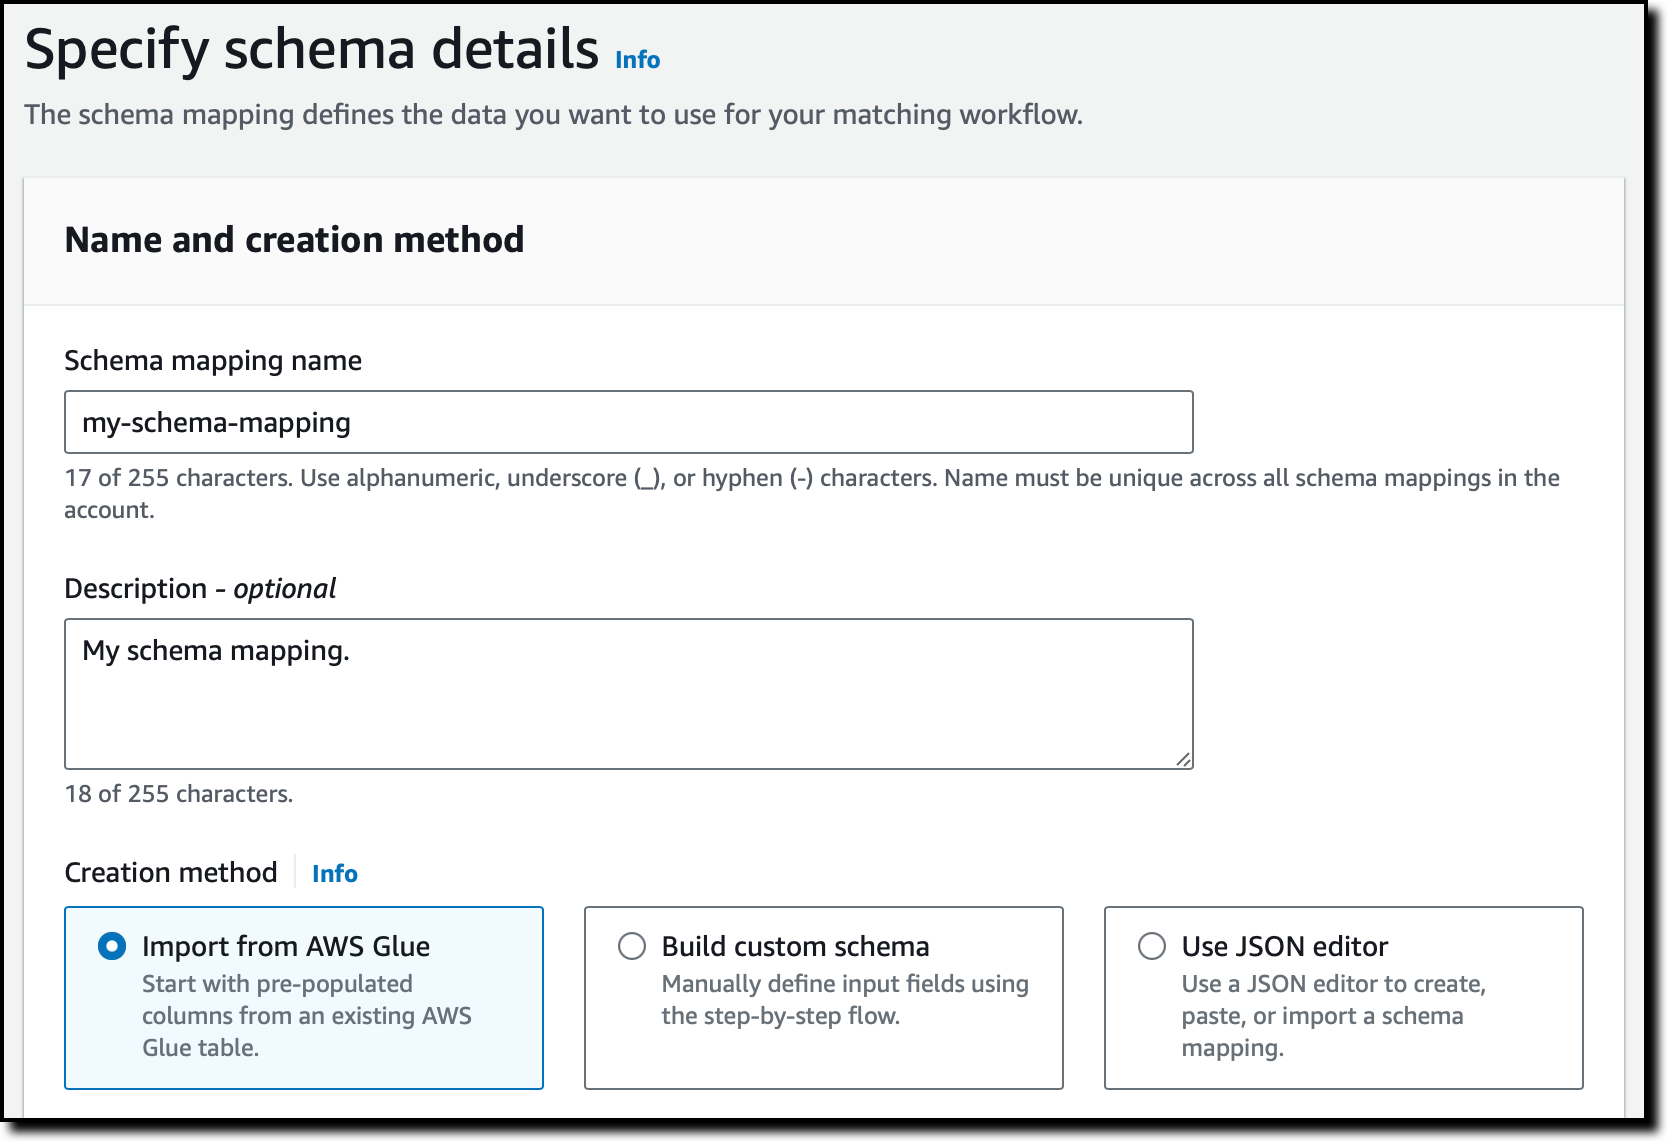
I choose Create schema mapping, enter a name and description, and select the option to import the schema from AWS Glue. I could also define a custom schema using a step-by-step flow or a JSON editor.

Console screenshot.

I select the AWS Glue database and table from the two dropdowns to import columns and pre-populate the input fields.

Console screenshot.

I select the Unique ID from the dropdown. The unique ID is the column that can distinctly reference each row of my data. In this case, it’s the loyalty_id in the CSV file.

Console screenshot.

I select the input fields that are going to be used for matching. In this case, I choose the columns from the dropdown that can be used to recognize if multiple records are related to the same customer. If some columns aren’t required for matching but are required in the output file, I can optionally add them as pass-through fields. I choose Next.

Console screenshot.

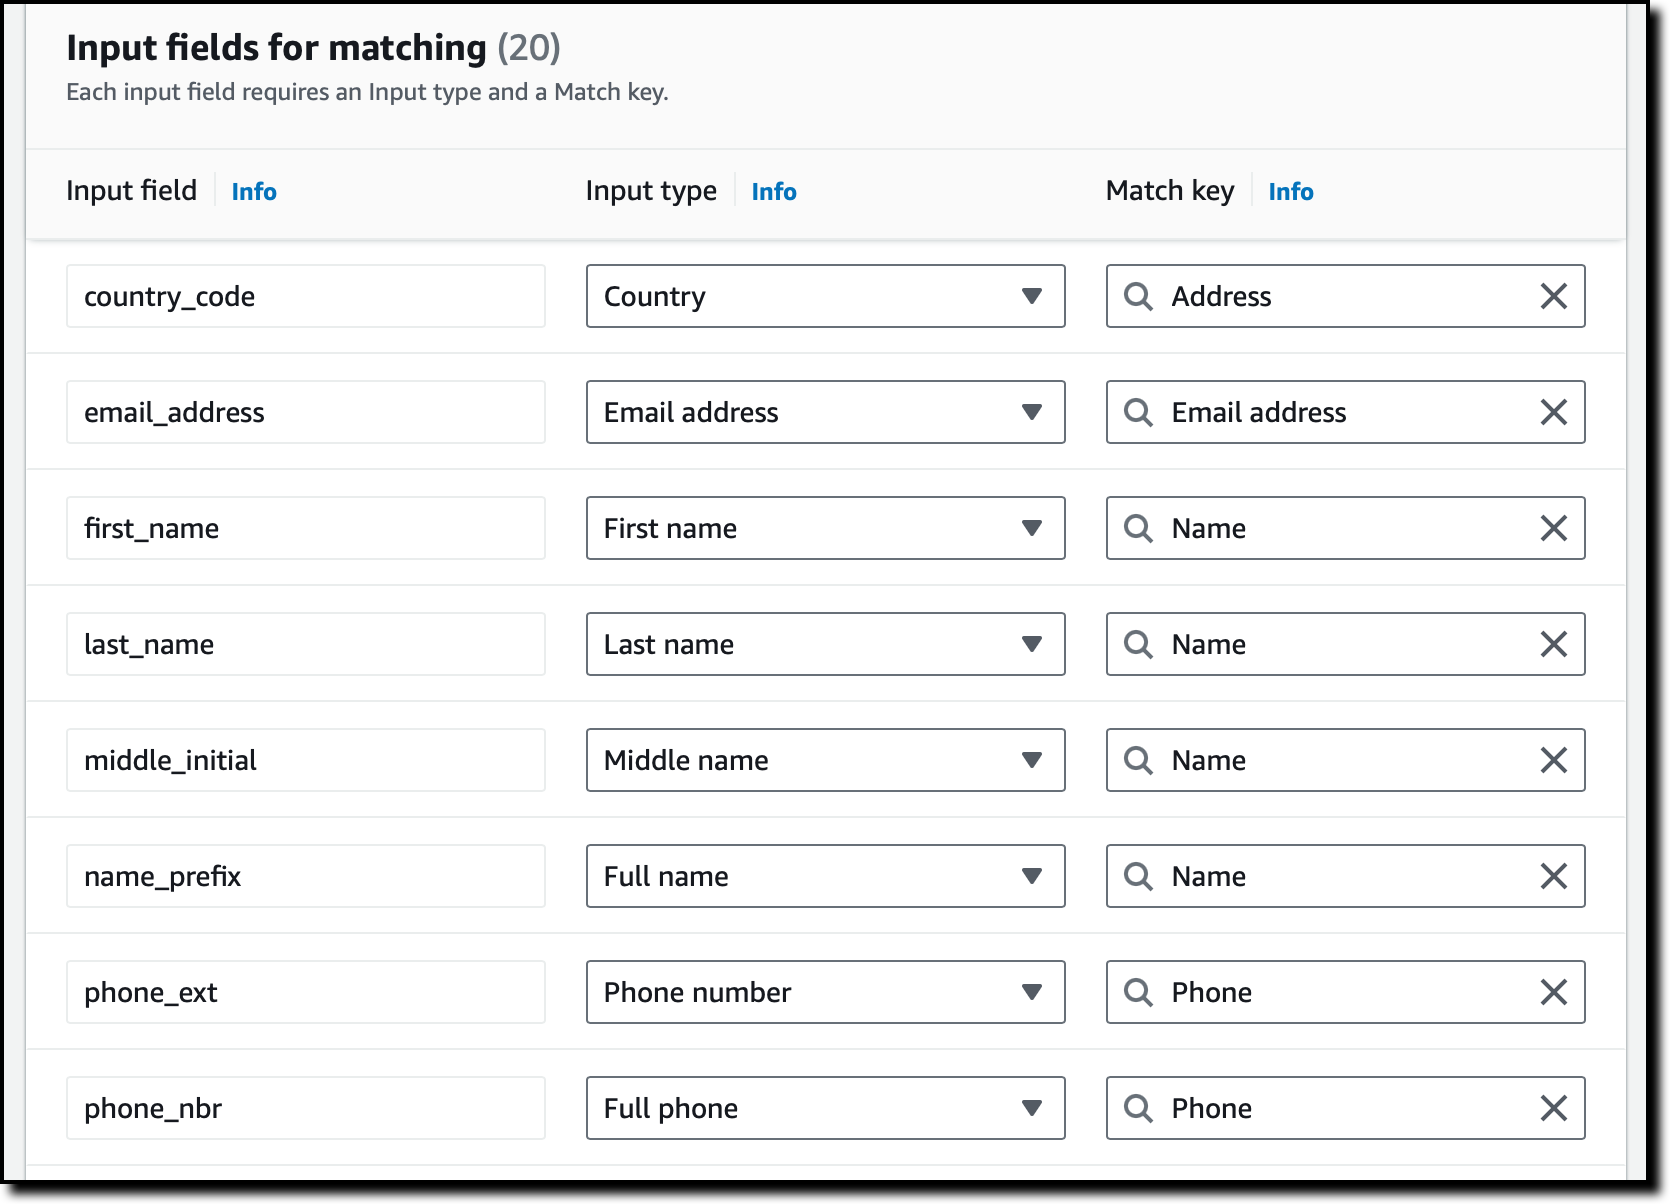
I map the input fields to their input type and match key. In this way, AWS Entity Resolution knows how to use these fields to match similar records. To continue, I choose Next.

Console screenshot.

Now, I use grouping to better organize the data I need to compare. For example, the First name, Middle name, and Last name input fields can be grouped together and compared as a Full name.

Console screenshot.

I also create a group for the Address fields.

Console screenshot.

I choose Next and review all configurations. Then, I choose Create schema mapping.

Now that I’ve created the schema mapping, I choose Matching workflows from the navigation pane and then Create matching workflow.

Console screenshot.

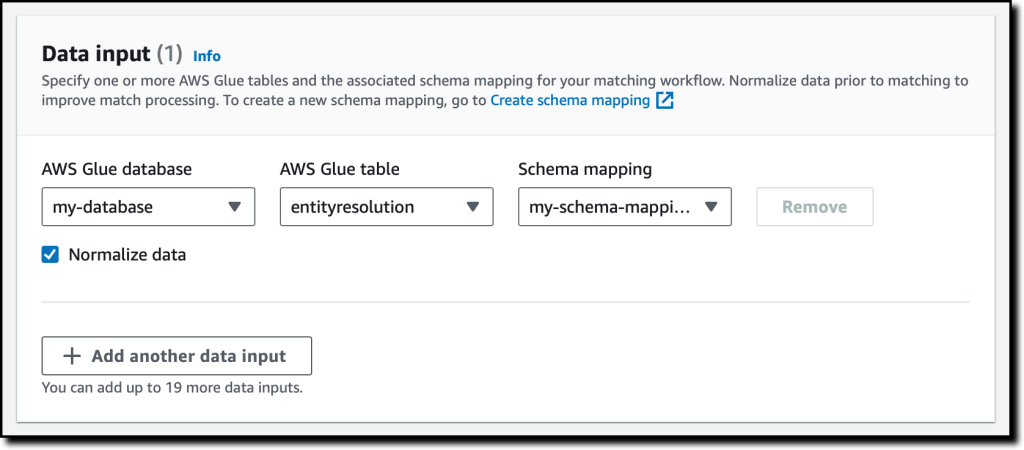
I enter a name and a description. Then, to configure the input data, I select the AWS Glue database and table and the schema mapping.

Console screenshot.

To give the service access to the data, I select a service role that I configured previously. The service role gives access to the input and output S3 buckets and the AWS Glue database and table. If the input or output buckets are encrypted, the service role can also give access to the AWS Key Management Service (AWS KMS) keys needed to encrypt and decrypt the data. I choose Next.

Console screenshot.

I have the option to use a rule-based or ML-powered matching method. Depending on the method, I can use a manual or automatic processing cadence to run the matching workflow job. For now, I select Machine learning matching and Manual for the Processing cadence, and then choose Next.

Console screenshot.

I configure an S3 bucket as the output destination. Under Data format, I select Normalized data so that special characters and extra spaces are removed, and data is formatted to lowercase.

Console screenshot.

I use the default Encryption settings. For Data output, I use the default so that all input fields are included. For security, I can hide fields to exclude them from output or hash fields I want to mask. I choose Next.

I review all settings and choose Create and run to complete the creation of the matching workflow and run the job for the first time.

After a few minutes, the job completes. According to this analysis, of the 1 million records, only 835 thousand are unique customers. I choose View output in Amazon S3 to download the output files.

Console screenshot.

In the output files, each record has the original unique ID (loyalty_id in this case) and a newly assigned MatchID. Matching records, related to the same customers, have the same MatchID. The ConfidenceLevel field describes the confidence that machine learning matching has that the corresponding records are actually a match.

I can now use this information to have a better understanding of customers who are subscribed to the loyalty program.

Availability and Pricing
AWS Entity Resolution is generally available today in the following AWS Regions: US East (Ohio, N. Virginia), US West (Oregon), Asia Pacific (Seoul, Singapore, Sydney, Tokyo), and Europe (Frankfurt, Ireland, London).

With AWS Entity Resolution, you pay only for what you use based on the number of source records processed by your workflows. Pricing doesn’t depend on the matching method, whether it’s machine learning or rule-based record matching. For more information, see AWS Entity Resolution pricing.

Using AWS Entity Resolution, you gain a deeper understanding of how data is linked. That helps you deliver new insights, enhance decision making, and improve customer experiences based on a unified view of their records.

Simplify the way you match and link related records across applications, channels, and data stores with AWS Entity Resolution.

Danilo


P.S. We’re focused on improving our content to provide a better customer experience, and we need your feedback to do so. Please take this quick survey to share insights on your experience with the AWS Blog. Note that this survey is hosted by an external company, so the link does not lead to our website. AWS handles your information as described in the AWS Privacy Notice.

Reimagine Software Development With CodeWhisperer as Your AI Coding Companion

Post Syndicated from Danilo Poccia original https://aws.amazon.com/blogs/aws/reimagine-software-development-with-codewhisperer-as-your-ai-coding-companion/

In the few months since Amazon CodeWhisperer became generally available, many customers have used it to simplify and streamline the way they develop software. CodeWhisperer uses generative AI powered by a foundational model to understand the semantics and context of your code and provide relevant and useful suggestions. It can help build applications faster and more securely, and it can help at different levels, from small suggestions to writing full functions and unit tests that help decompose a complex problem into simpler tasks.

Imagine you want to improve your code test coverage or implement a fine-grained authorization model for your application. As you begin writing your code, CodeWhisperer is there, working alongside you. It understands your comments and existing code, providing real-time suggestions that can range from snippets to entire functions or classes. This immediate assistance adapts to your flow, reducing the need for context-switching to search for solutions or syntax tips. Using a code companion can enhance focus and productivity during the development process.

When you encounter an unfamiliar API, CodeWhisperer accelerates your work by offering relevant code suggestions. In addition, CodeWhisperer offers a comprehensive code scanning feature that can detect elusive vulnerabilities and provide suggestions to rectify them. This aligns with best practices such as those outlined by the Open Worldwide Application Security Project (OWASP). This makes coding not just more efficient, but also more secure and with an increased assurance in the quality of your work.

CodeWhisperer can also flag code suggestions that resemble open-source training data, and flag and remove problematic code that might be considered biased or unfair. It provides you with the associated open-source project’s repository URL and license, making it easier for you to review them and add attribution where necessary.

Here are a few examples of CodeWhisperer in action that span different areas of software development, from prototyping and onboarding to data analytics and permissions management.

CodeWhisperer Speeds Up Prototyping and Onboarding
One customer using CodeWhisperer in an interesting way is BUILDSTR, a consultancy that provides cloud engineering services focused on platform development and modernization. They use Node.js and Python in the backend and mainly React in the frontend.

I talked with Kyle Hines, co-founder of BUILDSTR, who said, “leveraging CodeWhisperer across different types of development projects for different customers, we’ve seen a huge impact in prototyping. For example, we are impressed by how quickly we are able to create templates for AWS Lambda functions interacting with other AWS services such as Amazon DynamoDB.” Kyle said their prototyping now takes 40% less time, and they noticed a reduction of more than 50% in the number of vulnerabilities present in customer environments.

Screenshot of a code editor using CodeWhisperer to generate the handler of an AWS Lambda function.

Kyle added, “Because hiring and developing new talent is a perpetual process for consultancies, we leveraged CodeWhisperer for onboarding new developers and it helps BUILDSTR Academy reduce the time and complexity for onboarding by more than 20%.”

CodeWhisperer for Exploratory Data Analysis
Wendy Wong is a business performance analyst building data pipelines at Service NSW and agile projects in AI. For her contributions to the community, she’s also an AWS Data Hero. She says Amazon CodeWhisperer has significantly accelerated her exploratory data analysis process, when she is analyzing a dataset to get a summary of its main characteristics using statistics and visualization tools.

She finds CodeWhisperer to be a swift, user-friendly, and dependable coding companion that accurately infers her intent with each line of code she crafts, and ultimately aids in the enhancement of her code quality through its best practice suggestions.

“Using CodeWhisperer, building code feels so much easier when I don’t have to remember every detail as it will accurately autocomplete my code and comments,” she shared. “Earlier, it would take me 15 minutes to set up data preparation pre-processing tasks, but now I’m ready to go in 5 minutes.”

Screenshot of exploratory data analysis using Amazon CodeWhisperer in a Jupyter notebook.

Wendy says she has gained efficiency by delegating these repetitive tasks to CodeWhisperer, and she wrote a series of articles to explain how to use it to simplify exploratory data analysis.

Another tool used to explore data sets is SQL. Wendy is looking into how CodeWhisperer can help data engineers who are not SQL experts. For instance, she noticed they can just ask to “write multiple joins” or “write a subquery” to quickly get the correct syntax to use.

Asking Amazon CodeWhisperer to generate SQL syntax and code.

CodeWhisperer Accelerates Testing and Other Daily Tasks
I had the opportunity to spend some time with software engineers in the AWS Developer Relations Platform team. That’s the team that, among other things, builds and operates the community.aws website.

Screenshot of the community.aws website, built and operated by the AWS Developer Relations Platform team with some help from Amazon CodeWhisperer.

Nikitha Tejpal’s work primarily revolves around TypeScript, and CodeWhisperer aids her coding process by offering effective autocomplete suggestions that come up as she types. She said she specifically likes the way CodeWhisperer helps with unit tests.

“I can now focus on writing the positive tests, and then use a comment to have CodeWhisperer suggest negative tests for the same code,” she says. “In this way, I can write unit tests in 40% less time.”

Her colleague, Carlos Aller Estévez, relies on CodeWhisperer’s autocomplete feature to provide him with suggestions for a line or two to supplement his existing code, which he accepts or ignores based on his own discretion. Other times, he proactively leverages the predictive abilities of CodeWhisperer to write code for him. “If I want explicitly to get CodeWhisperer to code for me, I write a method signature with a comment describing what I want, and I wait for the autocomplete,” he explained.

For instance, when Carlos’s objective was to check if a user had permissions on a given path or any of its parent paths, CodeWhisperer provided a neat solution for part of the problem based on Carlos’s method signature and comment. The generated code checks the parent directories of a given resource, then creates a list of all possible parent paths. Carlos then implemented a simple permission check over each path to complete the implementation.

“CodeWhisperer helps with algorithms and implementation details so that I have more time to think about the big picture, such as business requirements, and create better solutions,” he added.

Code generated by CodeWhisperer based on method signature and comment.

CodeWhisperer is a Multilingual Team Player
CodeWhisperer is polyglot, supporting code generation for 15 programming languages: Python, Java, JavaScript, TypeScript, C#, Go, Rust, PHP, Ruby, Kotlin, C, C++, Shell scripting, SQL, and Scala.

CodeWhisperer is also a team player. In addition to Visual Studio (VS) Code and the JetBrains family of IDEs (including IntelliJ, PyCharm, GoLand, CLion, PhpStorm, RubyMine, Rider, WebStorm, and DataGrip), CodeWhisperer is also available for JupyterLab, in AWS Cloud9, in the AWS Lambda console, and in Amazon SageMaker Studio.

At AWS, we are committed to helping our customers transform responsible AI from theory into practice by investing to build new services to meet the needs of our customers and make it easier for them to identify and mitigate bias, improve explainability, and help keep data private and secure.

You can use Amazon CodeWhisperer for free in the Individual Tier. See CodeWhisperer pricing for more information. To get started, follow these steps.

Danilo

AWS Week in Review – Step Functions Versions and Aliases, EC2 Instances with Graviton3E Processors, and More – June 26, 2023

Post Syndicated from Danilo Poccia original https://aws.amazon.com/blogs/aws/aws-week-in-review-step-functions-versions-and-aliases-ec2-instances-with-graviton3e-processors-and-more-june-26-2023/

It’s now summer in the northern hemisphere, and you can feel it in London where I live. But let’s not get distracted by the nice weather and go through your AWS updates from the previous seven days.

Last Week’s Launches
Another interesting week with many announcements! Here are some that got more of my attention:

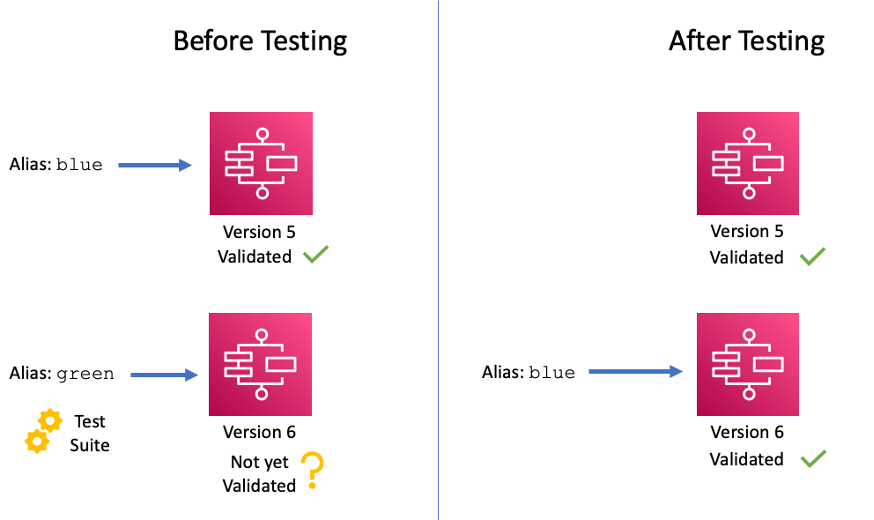
Architectural diagram for AWS Step Functions versioning and aliasesAWS Step FunctionsYou can now use versions and aliases to maintain multiple versions of your workflows, track which version was used for each execution, and create aliases that route traffic between workflow versions. To learn more, refer to this blog post.

AWS SAM – You can now simplify the way you define an AppSync GraphQL API in AWS SAM with the new a resource abstraction that includes everything necessary for a typical AppSync GraphQL API definition, including the API schema, the resolver pipeline functions, and data sources.

AWS Amplify – With the new Amplify UI Builder Figma plugin, you can theme your components, upgrade to new Amplify UI kit versions, and generate and preview React code from your designs directly in Figma.

AWS Local ZonesNow available in Manila, Philippines. You can use AWS Local Zones for applications that require single-digit millisecond latency or local data processing.

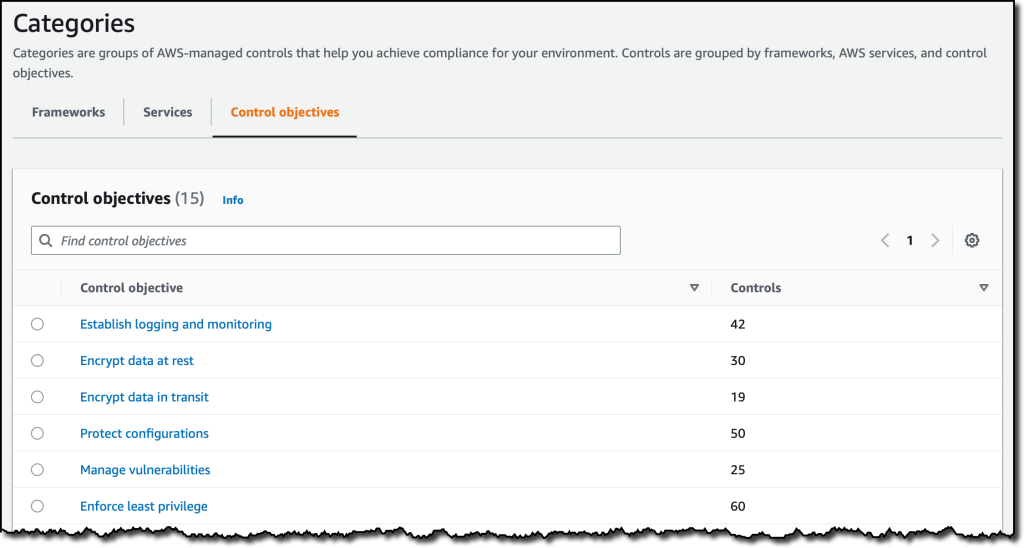
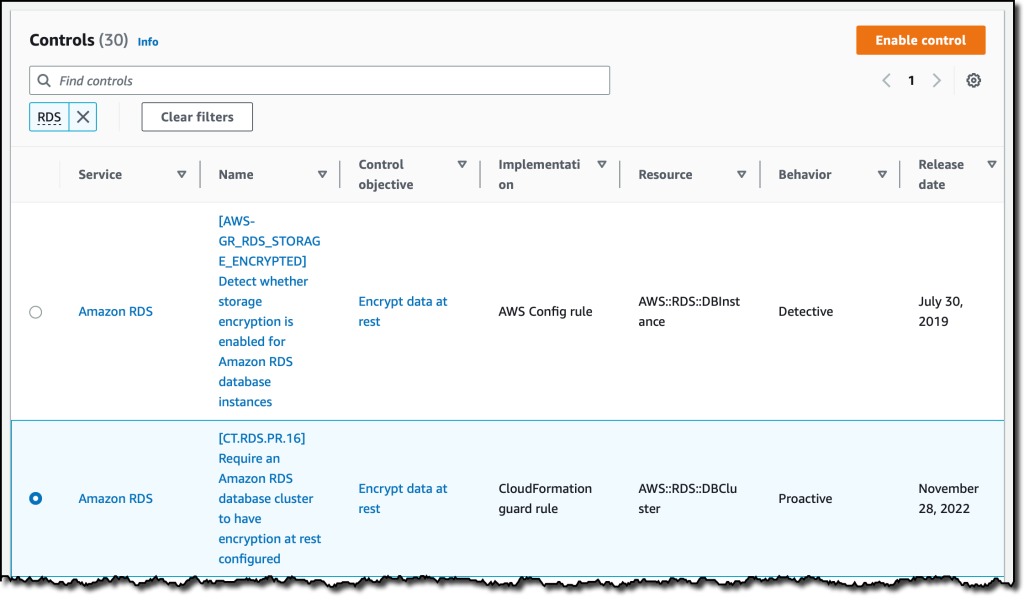
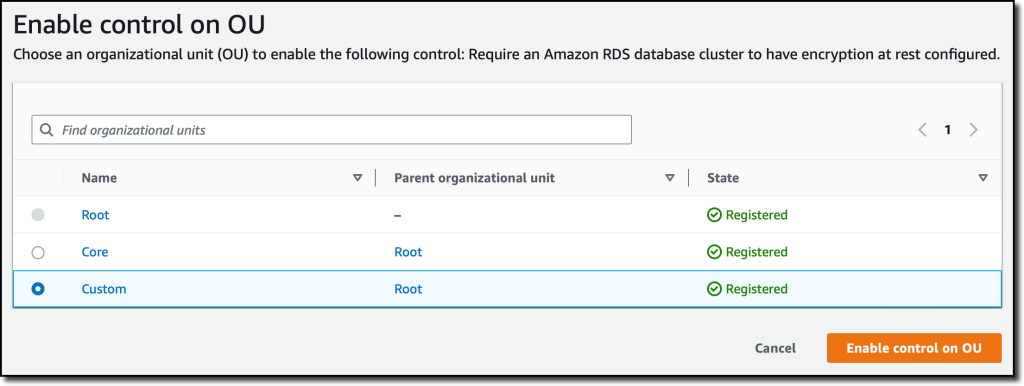
AWS Control Tower – The integration with Security Hub is now generally available. You can now enable over 170 Security Hub detective controls that map to related control objectives from AWS Control Tower. AWS Control Tower also detects drifts when you disable a control from Security Hub.

Amazon Kinesis Data Firehose – You can now deliver streaming data to Amazon Redshift Serverless. In this way, you can build an analytics platform without having to manage ingestion infrastructure or data warehouse clusters.

Amazon CloudWatch Internet MonitorNow available in all standard AWS Regions. Internet Monitor helps you diagnose internet issues between your AWS hosted applications and your application’s end users.

AWS Verified Access – Now provides improved logging functionality. With that, It’s easier to author and troubleshoot application access policies by reviewing the end-user context received from third-party services.

Amazon Managed Grafana – Now supports Trace Analytics with the OpenSearch Grafana data source plugin in addition to the existing support for Log Analytics. You can simplify the correlation and analysis of logs and trace data stored in OpenSearch along with metrics from other data sources.

Amazon CloudWatch Logs Insights – You can now use the new dedup command in your queries to view unique results based on one or more fields. Duplicates are discarded based on the sort order so that only the first result is kept.

AWS Config – Now supports 21 more resource types for services such as AWS Amplify, AWS App Mesh, AWS App Runner, Amazon Kinesis Data Firehose, and Amazon SageMaker.

Amazon EC2 – Announcing the new EC2 C7gn and Hpc7g instances that use Graviton3E processors. The Graviton3E processor delivers higher memory bandwidth and compute performance than Graviton2, and higher vector instruction performance than Graviton3. Read more in Jeff’s C7gn and Channy’s Hpc7g blog posts.

Amazon EFS – Provisioned Throughput now supports up to 10 GiB/s (from 3 GiB/s) for reads and 3 GiB/s (from 1 GiB/s) for writes.

For a full list of AWS announcements, be sure to keep an eye on the What’s New at AWS page.

Other AWS News
Architecture diagram for AWS Distro for OpenTelemetry sample app.A few more news items and blog posts you might have missed:

Good tipsMitigate Common Web Threats with One Click in Amazon CloudFront

A nice seriesLet’s Architect! Open-source technologies on AWS

An interesting solutionDeploy a serverless ML inference endpoint of large language models using FastAPI, AWS Lambda, and AWS CDK

For AWS open-source news and updates, check out the latest newsletter curated by Ricardo to bring you the most recent updates on open-source projects, posts, events, and more.

Upcoming AWS Events
Here are some opportunities to meet and learn:

AWS Applications Innovation Day (June 27) – Learn how product teams across applications, security, and artificial intelligence (AI) are collaborating with AWS Partners like Asana, Slack, Splunk, Atlassian, Okta, and more to help organizations work smarter together. For more information on the event, refer to this blog post.

AWS Summits – Get together to connect, collaborate, and learn about AWS in Hong Kong (July 20), New York (July 26), Taiwan (Aug 2 & 3), Sao Paulo (Aug 3).

AWS re:Invent (Nov 27 – Dec 1) – Join us to hear the latest from AWS, learn from experts, and connect with the global cloud community. Registration is now open.

Amazon Prime Day (July 11-12) is coming, and you can learn more in this blog post. We should keep an eye out for Jeff’s annual Prime Day post following the event.

That’s all from me for this week. Come back next Monday for another Week in Review!

Danilo

This post is part of our Week in Review series. Check back each week for a quick roundup of interesting news and announcements from AWS!

Simplify How You Manage Authorization in Your Applications with Amazon Verified Permissions – Now Generally Available

Post Syndicated from Danilo Poccia original https://aws.amazon.com/blogs/aws/simplify-how-you-manage-authorization-in-your-applications-with-amazon-verified-permissions-now-generally-available/

When developing a new application or integrating an existing one into a new environment, user authentication and authorization require significant effort to be correctly implemented. In the past, you would have built your own authentication system, but today you can use an external identity provider like Amazon Cognito. Yet, authorization logic is typically implemented in code.

This might begin simply enough, with all users assigned a role for their job function. However, over time, these permissions grow increasingly complex. The number of roles expands, as permissions become more fine-grained. New use cases drive the need for custom permissions. For instance, one user might share a document with another in a different role, or a support agent might require temporary access to a customer account to resolve an issue. Managing permissions in code is prone to errors, and presents significant challenges when auditing permissions and deciding who has access to what, particularly when these permissions are expressed in different applications and using multiple programming languages.

At re:Invent 2022, we introduced in preview Amazon Verified Permissions, a fine-grained permissions management and authorization service for your applications that can be used at any scale. Amazon Verified Permissions centralizes permissions in a policy store and helps developers use those permissions to authorize user actions within their applications. Similar to how an identity provider simplifies authentication, a policy store let you manage authorization in a consistent and scalable way.

To define fine-grained permissions, Amazon Verified Permissions uses Cedar, an open-source policy language and software development kit (SDK) for access control. You can define a schema for your authorization model in terms of principal types, resource types, and valid actions. In this way, when a policy is created, it is validated against your authorization model. You can simplify the creation of similar policies using templates. Changes to the policy store are audited so that you can see of who made the changes and when.

You can then connect your applications to Amazon Verified Permissions through AWS SDKs to authorize access requests. For each authorization request, the relevant policies are retrieved and evaluated to determine whether the action is permitted or not. You can reproduce those authorization requests to confirm that permissions work as intended.

Today, I am happy to share that Amazon Verified Permissions is generally available with new capabilities and a simplified user experience in the AWS Management Console.

Let’s see how you can use it in practice.

Creating a Policy Store with Amazon Verified Permissions
In the Amazon Verified Permissions console, I choose Create policy store. A policy store is a logical container that stores policies and schema. Authorization decisions are made based on all the policies present in a policy store.

To configure the new policy store, I can use different methods. I can start with a guided setup, a sample policy store (such as for a photo-sharing app, an online store, or a task manager), or an empty policy store (recommended for advanced users). I select Guided setup, enter a namespace for my schema (MyApp), and choose Next.

Console screenshot.

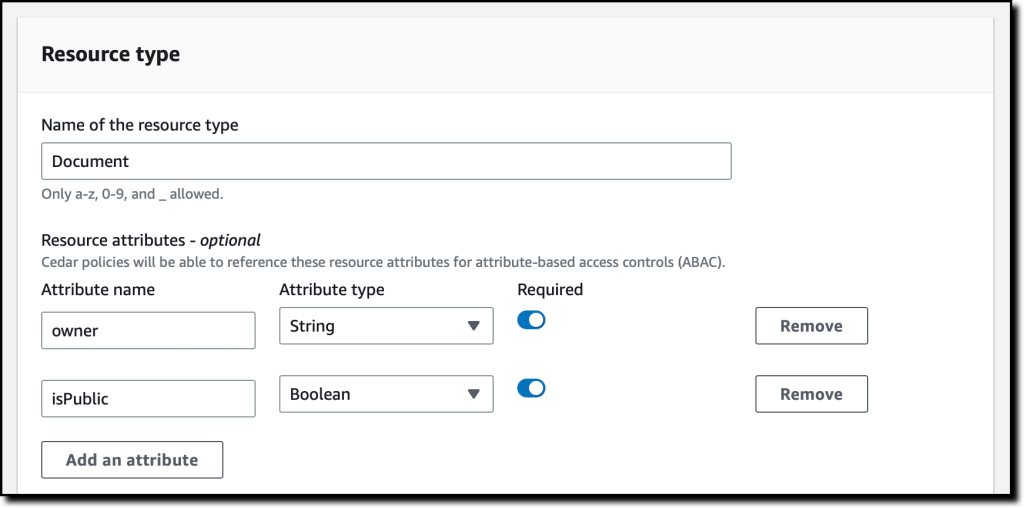
Resources are the objects that principals can act on. In my application, I have Users (principals) that can create, read, update, and delete Documents (resources). I start to define the Documents resource type.

I enter the name of the resource type and add two required attributes:

  • owner (String) to specify who is the owner of the document.
  • isPublic (Boolean) to flag public documents that anyone can read.

Console screenshot.

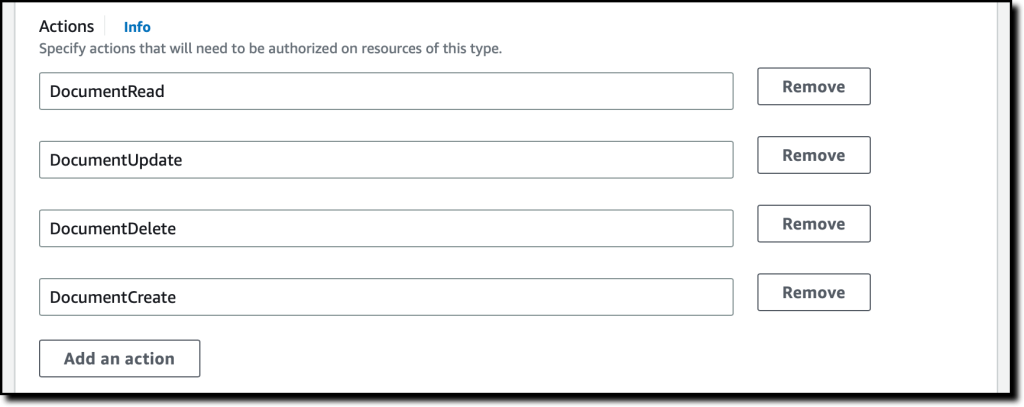
I specify four actions for the Document resource type:

  • DocumentCreate
  • DocumentRead
  • DocumentUpdate
  • DocumentDelete

Console screenshot.

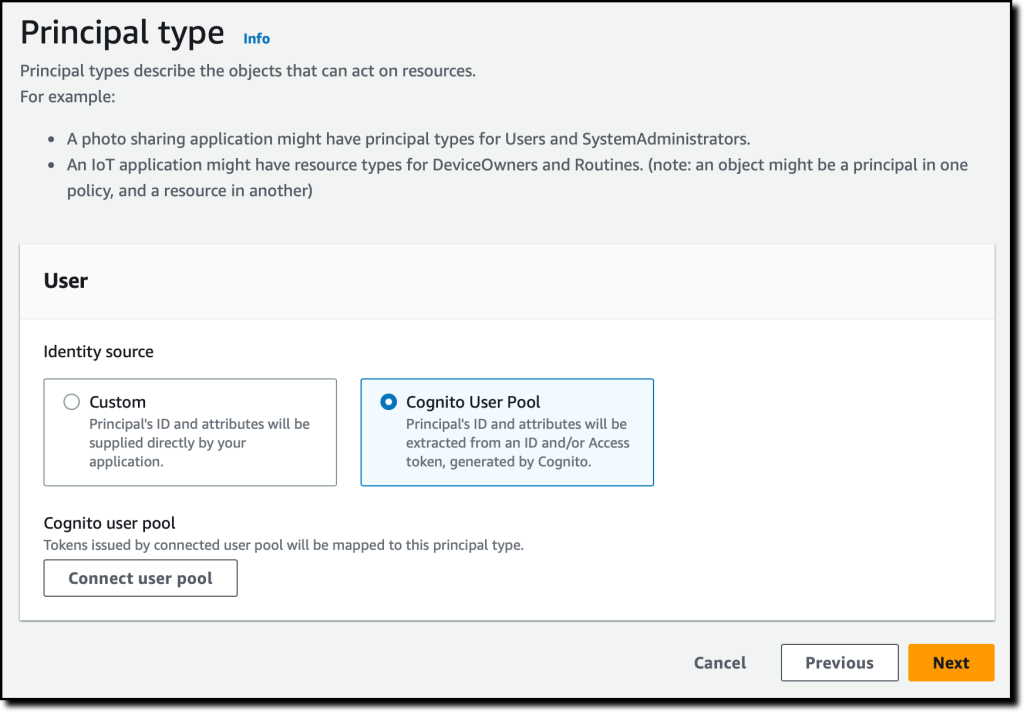
I enter User as the name of the principal type that will be using these actions on Documents. Then, I choose Next.

Console screenshot.

Now, I configure the User principal type. I can use a custom configuration to integrate an external identity source, but in this case, I use an Amazon Cognito user pool that I created before. I choose Connect user pool.

Console screenshot.

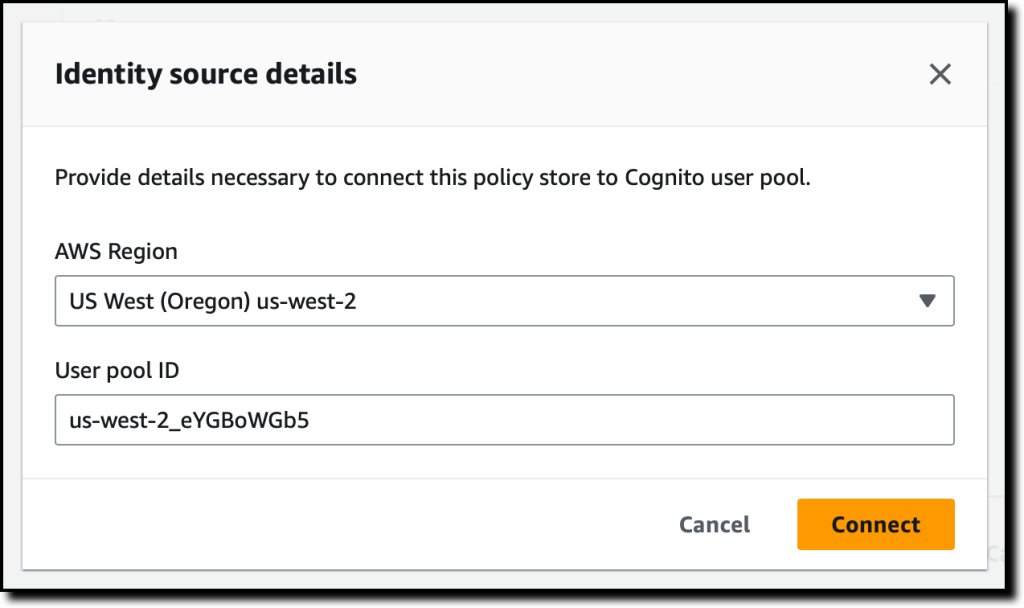
In the dialog, I select the AWS Region where the user pool is located, enter the user pool ID, and choose Connect.

Console screenshot.

Now that the Amazon Cognito user pool is connected, I can add another level of protection by validating the client application IDs. For now, I choose not to use this option.

In the Principal attributes section, I select which attributes I am planning to use for attribute-based access control in my policies. I select sub (the subject), used to identify the end user according to the OpenID Connect specification. I can select more attributes. For example, I can use email_verified in a policy to give permissions only to Amazon Cognito users whose email has been verified.

Console screenshot.

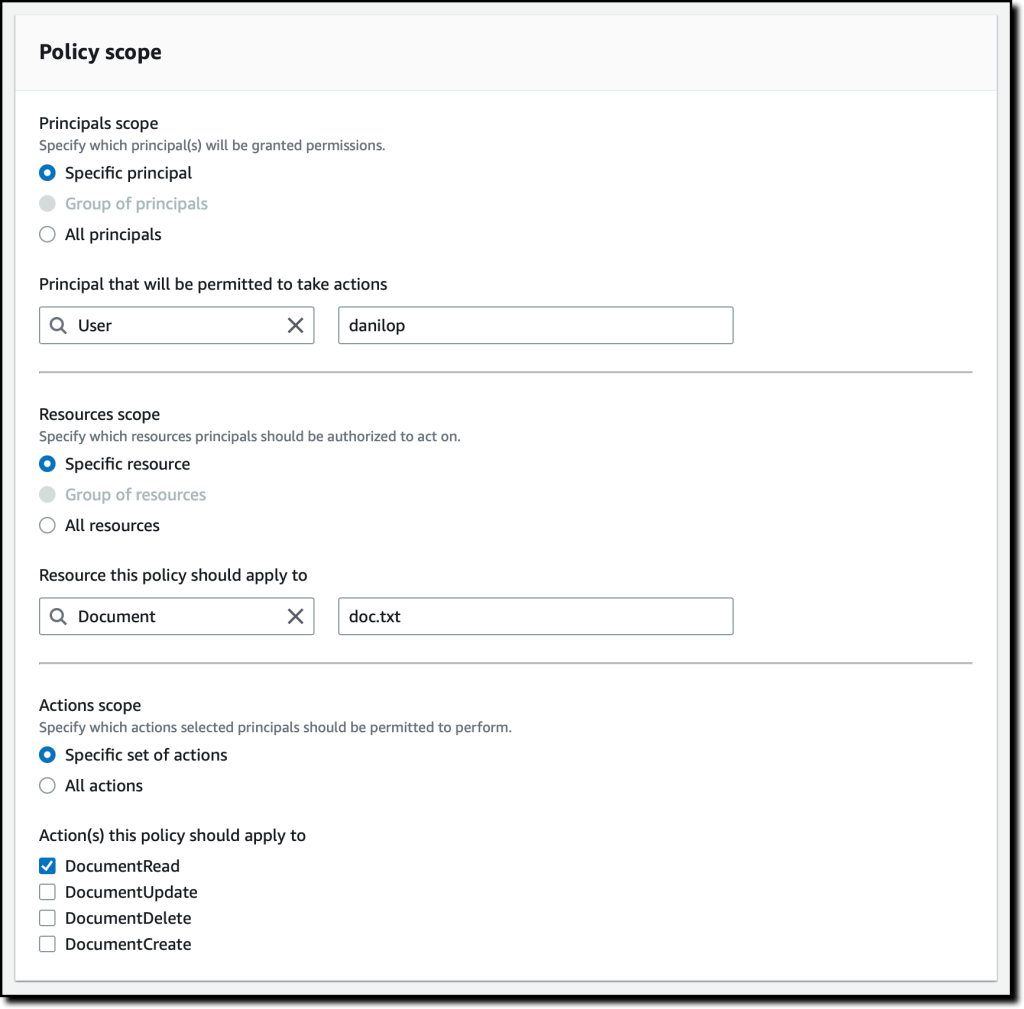
As part of the policy store creation, I create a first policy to give read access to user danilop to the doc.txt document.

Console screenshot.

In the following code, the console gives me a preview of the resulting policy using the Cedar language.

permit(
  principal == MyApp::User::"danilop",
  action in [MyApp::Action::"DocumentRead"],
  resource == MyApp::Document::"doc.txt"
) when {
  true
};

Finally, I choose Create policy store.

Adding Permissions to the Policy Store
Now that the policy store has been created, I choose Policies in the navigation pane. In the Create policy dropdown, I choose Create static policy. A static policy contains all the information needed for its evaluation. In my second policy, I allow any user to read public documents. By default everything is forbidden, so in Policy Effect I choose Permit.

In the Policy scope, I leave All principals and All resources selected, and select the DocumentRead action. In the Policy section, I change the when condition clause to limit permissions to resources where isPublic is equal to true:

permit (
  principal,
  action in [MyApp::Action::"DocumentRead"],
  resource
)
when { resource.isPublic };

I enter a description for the policy and choose Create policy.

For my third policy, I create another static policy to allow full access to the owner of a document. Again, in Policy Effect, I choose Permit and, in the Policy scope, I leave All principals and All resources selected. This time, I also leave All actions selected.

In the Policy section, I change the when condition clause to limit permissions to resources where the owner is equal to the sub of the principal:

permit (principal, action, resource)
when { resource.owner == principal.sub };

In my application, I need to allow read access to specific users that are not owners of a document. To simplify that, I create a policy template. Policy templates let me create policies from a template that uses placeholders for some of their values, such as the principal or the resource. The placeholders in a template are keywords that start with the ? character.

In the navigation pane, I choose Policy templates and then Create policy template. I enter a description and use the following policy template body. When using this template, I can specify the value for the ?principal and ?resource placeholders.

permit(
  principal == ?principal,
  action in [MyApp::Action::"DocumentRead"],
  resource == ?resource
);

I complete the creation of the policy template. Now, I use the template to simplify the creation of policies. I choose Policies in the navigation pane, and then Create a template-linked policy in the Create policy dropdown. I select the policy template I just created and choose Next.

To give access to a user (danilop) for a specific document (new-doc.txt), I just pass the following values (note that MyApp is the namespace of the policy store):

  • For the Principal: MyApp::User::"danilop"
  • For the Resource: MyApp::Document::"new-doc.txt"

I complete the creation of the policy. It’s now time to test if the policies work as expected.

Testing Policies in the Console
In my applications, I can use the AWS SDKs to run an authorization request. The console provides a way to to simulate what my applications would do. I choose Test bench in the navigation pane. To simplify testing, I use the Visual mode. As an alternative, I have the option to use the same JSON syntax as in the SDKs.

As Principal, I pass the janedoe user. As Resource, I use requirements.txt. It’s not a public document (isPublic is false) and the owner attribute is equal to janedoe‘s sub. For the Action, I select MyApp::Action::"DocumentUpdate".

When running an authorization request, I can pass Additional entities with more information about principals and resources associated with the request. For now, I leave this part empty.

I choose Run authorization request at the top to see the decision based on the current policies. As expected, the decision is allow. Here, I also see which policies hav been satisfied by the authorization request. In this case, it is the policy that allows full access to the owner of the document.

I can test other values. If I change the owner of the document and the action to DocumentRead, the decision is deny. If I then set the resource attribute isPublic to true, the decision is allow because there is a policy that permits all users to read public documents.

Handling Groups in Permissions
The administrative users in my application need to be able to delete any document. To do so, I create a role for admin users. First, I choose Schema in the navigation pane and then Edit schema. In the list of entity types, I choose to add a new one. I use Role as Type name and add it. Then, I select User in the entity types and edit it to add Role as a parent. I save changes and create the following policy:

permit (
  principal in MyApp::Role::"admin",
  action in [MyApp::Action::"DocumentDelete"],
  resource
);

In the Test bench, I run an authorization request to check if user jeffbarr can delete (DocumentDelete) resource doc.txt. Because he’s not the owner of the resource, the request is denied.

Now, in the Additional entities, I add the MyApp::User entity with jeffbarr as identifier. As parent, I add the MyApp::Role entity with admin as identifier and confirm. The console warns me that entity MyApp::Role::"admin" is referenced, but it isn’t included in additional entities data. I choose to add it and fix this issue.

I run an authorization request again, and it is now allowed because, according to the additional entities, the principal (jeffbarr) is an admin.

Using Amazon Verified Permissions in Your Application
In my applications, I can run an authorization requests using the isAuthorized API action (or isAuthrizedWithToken, if the principal comes from an external identity source).

For example, the following Python code uses the AWS SDK for Python (Boto3) to check if a user has read access to a document. The authorization request uses the policy store I just created.

import boto3
import time

verifiedpermissions_client = boto3.client("verifiedpermissions")

POLICY_STORE_ID = "XAFTHeCQVKkZhsQxmAYXo8"

def is_authorized_to_read(user, resource):

    authorization_result = verifiedpermissions_client.is_authorized(
        policyStoreId=POLICY_STORE_ID, 
        principal={"entityType": "MyApp::User", "entityId": user}, 
        action={"actionType": "MyApp::Action", "actionId": "DocumentRead"},
        resource={"entityType": "MyApp::Document", "entityId": resource}
    )

    print('Can {} read {} ?'.format(user, resource))

    decision = authorization_result["decision"]

    if decision == "ALLOW":
        print("Request allowed")
        return True
    else:
        print("Request denied")
        return False

if is_authorized_to_read('janedoe', 'doc.txt'):
    print("Here's the doc...")

if is_authorized_to_read('danilop', 'doc.txt'):
    print("Here's the doc...")

I run this code and, as you can expect, the output is in line with the tests run before.

Can janedoe read doc.txt ?
Request denied
Can danilop read doc.txt ?
Request allowed
Here's the doc...

Availability and Pricing
Amazon Verified Permissions is available today in all commercial AWS Regions, excluding those that are based in China.

With Amazon Verified Permissions, you only pay for what you use based on the number of authorization requests and API calls made to the service.

Using Amazon Verified Permissions, you can configure fine-grained permissions using the Cedar policy language and simplify the code of your applications. In this way, permissions are maintained in a centralized store and are easier to audit. Here, you can read more about how we built Cedar with automated reasoning and differential testing.

Manage authorization for your applications with Amazon Verified Permissions.

Danilo

New – Move Payment Processing to the Cloud with AWS Payment Cryptography

Post Syndicated from Danilo Poccia original https://aws.amazon.com/blogs/aws/new-move-payment-processing-to-the-cloud-with-aws-payment-cryptography/

Cryptography is everywhere in our daily lives. If you’re reading this blog, you’re using HTTPS, an extension of HTTP that uses encryption to secure communications. On AWS, multiple services and capabilities help you manage keys and encryption, such as:

HSMs are physical devices that securely protect cryptographic operations and the keys used by these operations. HSMs can help you meet your corporate, contractual, and regulatory compliance requirements. With CloudHSM, you have access to general-purpose HSMs. When payments are involved, there are specific payment HSMs that offer capabilities such as generating and validating the personal identification number (PIN) and the security code of a credit or debit card.

Today, I am happy to share the availability of AWS Payment Cryptography, an elastic service that manages payment HSMs and keys for payment processing applications in the cloud.

Applications using payments HSMs have challenging requirements because payment processing is complex, time sensitive, and highly regulated and requires the interaction of multiple financial service providers and payment networks. Every time you make a payment, data is exchanged between two or more financial service providers and must be decrypted, transformed, and encrypted again with a unique key at each step.

This process requires highly performant cryptography capabilities and key management procedures between each payment service provider. These providers might have thousands of keys to protect, manage, rotate, and audit, making the overall process expensive and difficult to scale. To add to that, payment HSMs historically employ complex and error-prone processes, such as exchanging keys in a secure room using multiple hand-carried paper forms, each with separate key components printed on them.

Introducing AWS Payment Cryptography
AWS Payment Cryptography simplifies your implementation of cryptographic functions and key management used to secure data in payment processing in accordance with various payment card industry (PCI) standards.

With AWS Payment Cryptography, you can eliminate the need to provision and manage on-premises payment HSMs and use the provided tools to avoid error-prone key exchange processes. For example, with AWS Payment Cryptography, payment and financial service providers can begin development within minutes and plan to exchange keys electronically, eliminating manual processes.

To provide its elastic cryptographic capabilities in a compliant manner, AWS Payment Cryptography uses HSMs with PCI PTS HSM device approval. These capabilities include encryption and decryption of card data, key creation, and pin translation. AWS Payment Cryptography is also designed in accordance with PCI security standards such as PCI DSS, PCI PIN, and PCI P2PE, and it provides evidence and reporting to help meet your compliance needs.

You can import and export symmetric keys between AWS Payment Cryptography and on-premises HSMs under key encryption key (KEKs) using the ANSI X9 TR-31 protocol. You can also import and export symmetric KEKs with other systems and devices using the ANSI X9 TR-34 protocol, which allows the service to exchange symmetric keys using asymmetric techniques.

To simplify moving consumer payment processing to the cloud, existing card payment applications can use AWS Payment Cryptography through the AWS SDKs. In this way, you can use your favorite programming language, such as Java or Python, instead of vendor-specific ASCII interfaces over TCP sockets, as is common with payment HSMs.

Access can be authorized using AWS Identity and Access Management (IAM) identity-based policies, where you can specify which actions and resources are allowed or denied and under which conditions.

Monitoring is important to maintain the reliability, availability, and performance needed by payment processing. With AWS Payment Cryptography, you can use Amazon CloudWatch, AWS CloudTrail, and Amazon EventBridge to understand what is happening, report when something is wrong, and take automatic actions when appropriate.

Let’s see how this works in practice.

Using AWS Payment Cryptography
Using the AWS Command Line Interface (AWS CLI), I create a double-length 3DES key to be used as a card verification key (CVK). A CVK is a key used for generating and verifying card security codes such as CVV, CVV2, and similar values.

Note that there are two commands for the CLI (and similarly two endpoints for API and SDKs):

  • payment-cryptography for control plane operation such as listing and creating keys and aliases.
  • payment-cryptography-data for cryptographic operations that use keys, for example, to generate PIN or card validation data.

Creating a key is a control plane operation:

aws payment-cryptography create-key \
    --no-exportable \
    --key-attributes KeyAlgorithm=TDES_2KEY,
                     KeyUsage=TR31_C0_CARD_VERIFICATION_KEY,
                     KeyClass=SYMMETRIC_KEY,
                     KeyModesOfUse='{Generate=true,Verify=true}'
{
    "Key": {
        "KeyArn": "arn:aws:payment-cryptography:us-west-2:123412341234:key/42cdc4ocf45mg54h",
        "KeyAttributes": {
            "KeyUsage": "TR31_C0_CARD_VERIFICATION_KEY",
            "KeyClass": "SYMMETRIC_KEY",
            "KeyAlgorithm": "TDES_2KEY",
            "KeyModesOfUse": {
                "Encrypt": false,
                "Decrypt": false,
                "Wrap": false,
                "Unwrap": false,
                "Generate": true,
                "Sign": false,
                "Verify": true,
                "DeriveKey": false,
                "NoRestrictions": false
            }
        },
        "KeyCheckValue": "B2DD4E",
        "KeyCheckValueAlgorithm": "ANSI_X9_24",
        "Enabled": true,
        "Exportable": false,
        "KeyState": "CREATE_COMPLETE",
        "KeyOrigin": "AWS_PAYMENT_CRYPTOGRAPHY",
        "CreateTimestamp": "2023-05-26T14:25:48.240000+01:00",
        "UsageStartTimestamp": "2023-05-26T14:25:48.220000+01:00"
    }
}

To reference this key in the next steps, I can use the Amazon Resource Name (ARN) as found in the KeyARN property, or I can create an alias. An alias is a friendly name that lets me refer to a key without having to use the full ARN. I can update an alias to refer to a different key. When I need to replace a key, I can just update the alias without having to change the configuration or the code of your applications. To be recognized easily, alias names start with alias/. For example, the following command creates the alias alias/my-key for the key I just created:

aws payment-cryptography create-alias --alias-name alias/my-key \
    --key-arn arn:aws:payment-cryptography:us-west-2:123412341234:key/42cdc4ocf45mg54h
{
    "Alias": {
        "AliasName": "alias/my-key",
        "KeyArn": "arn:aws:payment-cryptography:us-west-2:123412341234:key/42cdc4ocf45mg54h"
    }
}

Before I start using the new key, I list all my keys to check their status:

aws payment-cryptography list-keys
{
    "Keys": [
        {
            "KeyArn": "arn:aws:payment-cryptography:us-west-2:123421341234:key/42cdc4ocf45mg54h",
            "KeyAttributes": {
                "KeyUsage": "TR31_C0_CARD_VERIFICATION_KEY",
                "KeyClass": "SYMMETRIC_KEY",
                "KeyAlgorithm": "TDES_2KEY",
                "KeyModesOfUse": {
                    "Encrypt": false,
                    "Decrypt": false,
                    "Wrap": false,
                    "Unwrap": false,
                    "Generate": true,
                    "Sign": false,
                    "Verify": true,
                    "DeriveKey": false,
                    "NoRestrictions": false
                }
            },
            "KeyCheckValue": "B2DD4E",
            "Enabled": true,
            "Exportable": false,
            "KeyState": "CREATE_COMPLETE"
        },
        {
            "KeyArn": "arn:aws:payment-cryptography:us-west-2:123412341234:key/ok4oliaxyxbjuibp",
            "KeyAttributes": {
                "KeyUsage": "TR31_C0_CARD_VERIFICATION_KEY",
                "KeyClass": "SYMMETRIC_KEY",
                "KeyAlgorithm": "TDES_2KEY",
                "KeyModesOfUse": {
                    "Encrypt": false,
                    "Decrypt": false,
                    "Wrap": false,
                    "Unwrap": false,
                    "Generate": true,
                    "Sign": false,
                    "Verify": true,
                    "DeriveKey": false,
                    "NoRestrictions": false
                }
            },
            "KeyCheckValue": "905848",
            "Enabled": true,
            "Exportable": false,
            "KeyState": "DELETE_PENDING"
        }
    ]
}

As you can see, there is another key I created before, which has since been deleted. When a key is deleted, it is marked for deletion (DELETE_PENDING). The actual deletion happens after a configurable period (by default, 7 days). This is a safety mechanism to prevent the accidental or malicious deletion of a key. Keys marked for deletion are not available for use but can be restored.

In a similar way, I list all my aliases to see to which keys they are they referring:

aws payment-cryptography list-aliases
{
    "Aliases": [
        {
            "AliasName": "alias/my-key",
            "KeyArn": "arn:aws:payment-cryptography:us-west-2:123412341234:key/42cdc4ocf45mg54h"
        }
    ]
}

Now, I use the key to generate a card security code with the CVV2 authentication system. You might be familiar with CVV2 numbers that are usually written on the back of a credit card. This is the way they are computed. I provide as input the primary account number of the credit card, the card expiration date, and the key from the previous step. To specify the key, I use its alias. This is a data plane operation:

aws payment-cryptography-data generate-card-validation-data \
    --key-identifier alias/my-key \
    --primary-account-number=171234567890123 \
    --generation-attributes CardVerificationValue2={CardExpiryDate=0124}
{
    "KeyArn": "arn:aws:payment-cryptography:us-west-2:123412341234:key/42cdc4ocf45mg54h",
    "KeyCheckValue": "B2DD4E",
    "ValidationData": "343"
}

I take note of the three digits in the ValidationData property. When processing a payment, I can verify that the card data value is correct:

aws payment-cryptography-data verify-card-validation-data \
    --key-identifier alias/my-key \
    --primary-account-number=171234567890123 \
    --verification-attributes CardVerificationValue2={CardExpiryDate=0124} \
    --validation-data 343
{
    "KeyArn": "arn:aws:payment-cryptography:us-west-2:123412341234:key/42cdc4ocf45mg54h",
    "KeyCheckValue": "B2DD4E"
}

The verification is successful, and in return I get back the same KeyCheckValue as when I generated the validation data.

As you might expect, if I use the wrong validation data, the verification is not successful, and I get back an error:

aws payment-cryptography-data verify-card-validation-data \
    --key-identifier alias/my-key \
    --primary-account-number=171234567890123 \
    --verification-attributes CardVerificationValue2={CardExpiryDate=0124} \
    --validation-data 999

An error occurred (com.amazonaws.paymentcryptography.exception#VerificationFailedException)
when calling the VerifyCardValidationData operation:
Card validation data verification failed

In the AWS Payment Cryptography console, I choose View Keys to see the list of keys.

Console screenshot.

Optionally, I can enable more columns, for example, to see the key type (symmetric/asymmetric) and the algorithm used.

Console screenshot.

I choose the key I used in the previous example to get more details. Here, I see the cryptographic configuration, the tags assigned to the key, and the aliases that refer to this key.

Console screenshot.

AWS Payment Cryptography supports many more operations than the ones I showed here. For this walkthrough, I used the AWS CLI. In your applications, you can use AWS Payment Cryptography through any of the AWS SDKs.

Availability and Pricing
AWS Payment Cryptography is available today in the following AWS Regions: US East (N. Virginia) and US West (Oregon).

With AWS Payment Cryptography, you only pay for what you use based on the number of active keys and API calls with no up-front commitment or minimum fee. For more information, see AWS Payment Cryptography pricing.

AWS Payment Cryptography removes your dependencies on dedicated payment HSMs and legacy key management systems, simplifying your integration with AWS native APIs. In addition, by operating the entire payment application in the cloud, you can minimize round-trip communications and latency.

Move your payment processing applications to the cloud with AWS Payment Cryptography.

Danilo

AWS Week in Review – AWS Documentation Updates, Amazon EventBridge is Faster, and More – May 22, 2023

Post Syndicated from Danilo Poccia original https://aws.amazon.com/blogs/aws/aws-week-in-review-aws-documentation-updates-amazon-eventbridge-is-faster-and-more-may-22-2023/

AWS Data Hero Anahit Pogosova keynote at CloudConf 2023Here are your AWS updates from the previous 7 days. Last week I was in Turin, Italy for CloudConf, a conference I’ve had the pleasure to participate in for the last 10 years. AWS Hero Anahit Pogosova was also there sharing a few serverless tips in front of a full house. Here’s a picture I took from the last row during her keynote.

On Thursday, May 25, I’ll be at the AWS Community Day in Dublin to celebrate the 10 years of the local AWS User Group. Say hi if you’re there!

Last Week’s Launches
Last week was packed with announcements! Here are the launches that got my attention:

Amazon SageMakerGeospatial capabilities are now generally available with security updates and more use case samples.

Amazon DetectiveSimplify the investigation of AWS Security Findings coming from new sources such as AWS IAM Access Analyzer, Amazon Inspector, and Amazon Macie.

Amazon EventBridge – EventBridge now delivers events up to 80% faster than before, as measured by the time an event is ingested to the first invocation attempt. No change is required on your side.

AWS Control Tower – The service has launched 28 new proactive controls that allow you to block non-compliant resources before they are provisioned for services such as AWS OpenSearch Service, AWS Auto Scaling, Amazon SageMaker, Amazon API Gateway, and Amazon Relational Database Service (Amazon RDS). Check out the original posts from when proactive controls were launched.

Amazon CloudFront – CloudFront now supports two new control directives to help improve performance and availability: stale-while-revalidate (to immediately deliver stale responses to users while it revalidates caches in the background) and the stale-if-error cache (to define how long stale responses should be reused if there’s an error).

Amazon Timestream – Timestream now enables to export query results to Amazon S3 in a cost-effective and secure manner using the new UNLOAD statement.

AWS Distro for OpenTelemetryThe tail sampling and the group-by-trace processors are now generally available in the AWS Distro for OpenTelemetry (ADOT) collector. For example, with tail sampling, you can define sampling policies such as “ingest 100% of all error cases and 5% of all success cases.”

AWS DataSync – You can now use DataSync to copy data to and from Amazon S3 compatible storage on AWS Snowball Edge Compute Optimized devices.

AWS Device Farm – Device Farm now supports VPC integration for private devices, for example, when an unreleased version of an app is accessing a staging environment and tests are accessing internal packages only accessible via private networking. Read more at Access your private network from real mobile devices using AWS Device Farm.

Amazon Kendra – Amazon Kendra now helps you search across different content repositories with new connectors for Gmail, Adobe Experience Manager Cloud, Adobe Experience Manager On-Premise, Alfresco PaaS, and Alfresco Enterprise. There is also an updated Microsoft SharePoint connector.

Amazon Omics – Omics now offers pre-built bioinformatic workflows, synchronous upload capability, integration with Amazon EventBridge, and support for Graphical Processing Units (GPUs). For more information, check out New capabilities make it easier for healthcare and life science customers to get started, build applications, and scale-up on Amazon Omics.

Amazon Braket – Braket now supports Aria, IonQ’s largest and highest fidelity publicly available quantum computing device to date. To learn more, read Amazon Braket launches IonQ Aria whith built-in error mitigation.

For a full list of AWS announcements, be sure to keep an eye on the What’s New at AWS page.

Other AWS News
A few more news items and blog posts you might have missed:

AWS Documentation home page screenshot.AWS Documentation – The AWS Documentation home page has been redesigned. Leave your feedback there to let us know what you think or to suggest future improvements. Last week we also announced that we are retiring the AWS Documentation GitHub repo to focus our resources to directly improve the documentation and the website.

Peloton case studyPeloton embraces Amazon Redshift to unlock the power of data during changing times.

Zoom case studyLearn how Zoom implemented streaming log ingestion and efficient GDPR deletes using Apache Hudi on Amazon EMR.

Nice solutionIntroducing an image-to-speech Generative AI application using SageMaker and Hugging Face.

For AWS open-source news and updates, check out the latest newsletter curated by Ricardo to bring you the most recent updates on open-source projects, posts, events, and more.

Upcoming AWS Events
Here are some opportunities to meet and learn:

AWS Data Insights Day (May 24) – A virtual event to discover how to innovate faster and more cost-effectively with data. This event focuses on customer voices, deep-dive sessions, and best practices of Amazon Redshift. You can register here.

AWS Silicon Innovation Day (June 21) – AWS has designed and developed purpose-built silicon specifically for the cloud. Join to learn AWS innovations in custom-designed Amazon EC2 chips built for high performance and scale in the cloud. Register here.

AWS re:Inforce (June 13–14) – You can still register for AWS re:Inforce. This year it is taking place in Anaheim, California.

AWS Global Summits – Sign up for the AWS Summit closest to where you live: Hong Kong (May 23), India (May 25), Amsterdam (June 1), London (June 7), Washington, DC (June 7-8), Toronto (June 14), Madrid (June 15), and Milano (June 22). If you want to meet, I’ll be at the one in London.

AWS Community Days – Join these community-led conferences where event logistics and content is planned, sourced, and delivered by community leaders: Dublin, Ireland (May 25), Shenzhen, China (May 28), Warsaw, Poland (June 1), Chicago, USA (June 15), and Chile (July 1).

That’s all from me for this week. Come back next Monday for another Week in Review!

Danilo

This post is part of our Week in Review series. Check back each week for a quick roundup of interesting news and announcements from AWS!
New – Simplify the Investigation of AWS Security Findings with Amazon Detective

Post Syndicated from Danilo Poccia original https://aws.amazon.com/blogs/aws/new-simplify-the-investigation-of-aws-security-findings-with-amazon-detective/

With Amazon Detective, you can analyze and visualize security data to investigate potential security issues. Detective collects and analyzes events that describe IP traffic, AWS management operations, and malicious or unauthorized activity from AWS CloudTrail logs, Amazon Virtual Private Cloud (Amazon VPC) Flow Logs, Amazon GuardDuty findings, and, since last year, Amazon Elastic Kubernetes Service (EKS) audit logs. Using this data, Detective constructs a graph model that distills log data using machine learning, statistical analysis, and graph theory to build a linked set of data for your security investigations.

Starting today, Detective offers investigation support for findings in AWS Security Hub in addition to those detected by GuardDuty. Security Hub is a service that provides you with a view of your security state in AWS and helps you check your environment against security industry standards and best practices. If you’ve turned on Security Hub and another integrated AWS security services, those services will begin sending findings to Security Hub.

With this new capability, it is easier to use Detective to determine the cause and impact of findings coming from new sources such as AWS Identity and Access Management (IAM) Access Analyzer, Amazon Inspector, and Amazon Macie. All AWS services that send findings to Security Hub are now supported.

Let’s see how this works in practice.

Enabling AWS Security Findings in the Amazon Detective Console
When you enable Detective for the first time, Detective now identifies findings coming from both GuardDuty and Security Hub, and automatically starts ingesting them along with other data sources. Note that you don’t need to enable or publish these log sources for Detective to start its analysis because this is managed directly by Detective.

If you are an existing Detective customer, you can enable investigation of AWS Security Findings as a data source with one click in the Detective Management Console. I already have Detective enabled, so I add the source package.

In the Detective console, in the Settings section of the navigation pane, I choose General. There, I choose Edit in the Optional source packages section to enable Detective for AWS Security Findings.

Console screenshot.

Once enabled, Detective starts analyzing all the relevant data to identify connections between disparate events and activities. To start your investigation process, you can get a visualization of these connections, including resource behavior and activities. Historical baselines, which you can use to provide comparisons against recent activity, are established after two weeks.

Investigating AWS Security Findings in the Amazon Detective Console
I start in the Security Hub console and choose Findings in the navigation pane. There, I filter findings to only see those where the Product name is Inspector and Severity label is HIGH.

Console screenshot.

The first one looks suspicious, so I choose its Title (CVE-2020-36223 – openldap). The Security Hub console provides me with information about the corresponding Common Vulnerabilities and Exposures (CVE) ID and where and how it was found. At the bottom, I have the option to Investigate in Amazon Detective. I follow the Investigate finding link, and the Detective console opens in another browser tab.

Console screenshot.

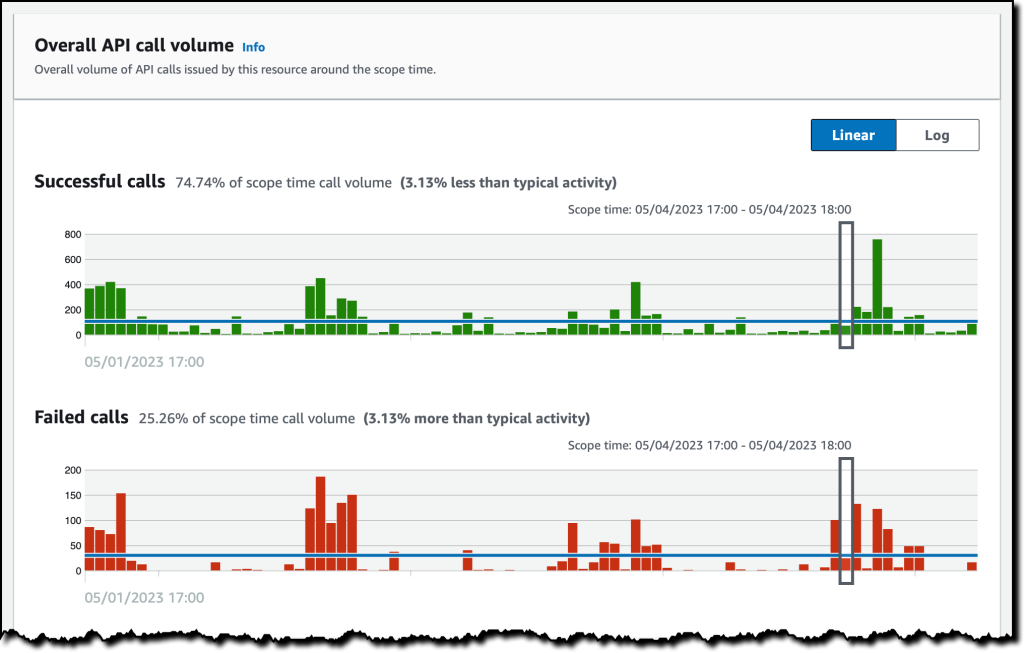
Here, I see the entities related to this Inspector finding. First, I open the profile of the AWS account to see all the findings associated with this resource, the overall API call volume issued by this resource, and the container clusters in this account.

For example, I look at the successful and failed API calls to have a better understanding of the impact of this finding.

Console screenshot.

Then, I open the profile for the container image. There, I see the images that are related to this image (because they have the same repository or registry as this image), the containers running from this image during the scope time (managed by Amazon EKS), and the findings associated with this resource.

Depending on the finding, Detective helps me correlate information from different sources such as CloudTrail logs, VPC Flow Logs, and EKS audit logs. This information makes it easier to understand the impact of the finding and if the risk has become an incident. For Security Hub, Detective only ingests findings for configuration checks that failed. Because configuration checks that passed have little security value, we’re filtering these outs.

Availability and Pricing
Amazon Detective investigation support for AWS Security Findings is available today for all existing and new Detective customers in all AWS Regions where Detective is available, including the AWS GovCloud (US) Regions. For more information, see the AWS Regional Services List.

Amazon Detective is priced based on the volume of data ingested. By enabling investigation of AWS Security Findings, you can increase the volume of ingested data. For more information, see Amazon Detective pricing.

When GuardDuty and Security Hub provide a finding, they also suggest the remediation. On top of that, Detective helps me investigate if the vulnerability has been exploited, for example, using logs and network traffic as proof.

Currently, findings coming from Security Hub are not included in the Finding groups section of the Detective console. Our plan is to expand Finding groups to cover the newly integrated AWS security services. Stay tuned!

Start using Amazon Detective to investigate potential security issues.

Danilo

New – Self-Service Provisioning of Terraform Open-Source Configurations with AWS Service Catalog

Post Syndicated from Danilo Poccia original https://aws.amazon.com/blogs/aws/new-self-service-provisioning-of-terraform-open-source-configurations-with-aws-service-catalog/

With AWS Service Catalog, you can create, govern, and manage a catalog of infrastructure as code (IaC) templates that are approved for use on AWS. These IaC templates can include everything from virtual machine images, servers, software, and databases to complete multi-tier application architectures. You can control which IaC templates and versions are available, what is configured by each version, and who can access each template based on individual, group, department, or cost center. End users such as engineers, database administrators, and data scientists can then quickly discover and self-service provision approved AWS resources that they need to use to perform their daily job functions.

When using Service Catalog, the first step is to create products based on your IaC templates. You can then collect products, together with configuration information, in a portfolio.

Starting today, you can define Service Catalog products and their resources using either AWS CloudFormation or Hashicorp Terraform and choose the tool that better aligns with your processes and expertise. You can now integrate your existing Terraform configurations into Service Catalog to have them part of a centrally approved portfolio of products and share it with the AWS accounts used by your end users. In this way, you can prevent inconsistencies and mitigate the risk of noncompliance.

When resources are deployed by Service Catalog, you can maintain least privilege access during provisioning and govern tagging on the deployed resources. End users of Service Catalog pick and choose what they need from the list of products and versions they have access to. Then, they can provision products in a single action regardless of the technology (CloudFormation or Terraform) used for the deployment.

The Service Catalog hub-and-spoke model that enables organizations to govern at scale can now be extended to include Terraform configurations. With the Service Catalog hub and spoke model, you can centrally manage deployments using a management/user account relationship:

  • One management account – Used to create Service Catalog products, organize them into portfolios, and share portfolios with user accounts
  • Multiple user accounts (up to thousands) – A user account is any AWS account in which the end users of Service Catalog are provisioning resources.

Let’s see how this works in practice.

Creating an AWS Service Catalog Product Using Terraform
To get started, I install the Terraform Reference Engine (provided by AWS on GitHub) that configures the code and infrastructure required for the Terraform open-source engine to work with AWS Service Catalog. I only need to do this once, in the management account for Service Catalog, and the setup takes just minutes. I use the automated installation script:

./deploy-tre.sh -r us-east-1

To keep things simple for this post, I create a product deploying a single EC2 instance using AWS Graviton processors and the Amazon Linux 2023 operating system. Here’s the content of my main.tf file:

terraform {
  required_providers {
    aws = {
      source  = "hashicorp/aws"
      version = "~> 4.16"
    }
  }

  required_version = ">= 1.2.0"
}

provider "aws" {
  region  = "us-east-1"
}

resource "aws_instance" "app_server" {
  ami           = "ami-00c39f71452c08778"
  instance_type = "t4g.large"

  tags = {
    Name = "GravitonServerWithAmazonLinux2023"
  }
}

I sign in to the AWS Management Console in the management account for Service Catalog. In the Service Catalog console, I choose Product list in the Administration section of the navigation pane. There, I choose Create product.

In Product details, I select Terraform open source as Product type. I enter a product name and description and the name of the owner.

Console screenshot.

In the Version details, I choose to Upload a template file (using a tar.gz archive). Optionally, I can specify the template using an S3 URL or an external code repository (on GitHub, GitHub Enterprise Server, or Bitbucket) using an AWS CodeStar provider.

Console screenshot.

I enter support details and custom tags. Note that tags can be used to categorize your resources and also to check permissions to create a resource. Then, I complete the creation of the product.

Adding an AWS Service Catalog Product Using Terraform to a Portfolio
Now that the Terraform product is ready, I add it to my portfolio. A portfolio can include both Terraform and CloudFormation products. I choose Portfolios from the Administrator section of the navigation pane. There, I search for my portfolio by name and open it. I choose Add product to portfolio. I search for the Terraform product by name and select it.

Console screenshot.

Terraform products require a launch constraint. The launch constraint specifies the name of an AWS Identity and Access Management (IAM) role that is used to deploy the product. I need to separately ensure that this role is created in every account with which the product is shared.

The launch role is assumed by the Terraform open-source engine in the management account when an end user launches, updates, or terminates a product. The launch role also contains permissions to describe, create, and update a resource group for the provisioned product and tag the product resources. In this way, Service Catalog keeps the resource group up-to-date and tags the resources associated with the product.

The launch role enables least privilege access for end users. With this feature, end users don’t need permission to directly provision the product’s underlying resources because your Terraform open-source engine assumes the launch role to provision those resources, such as an approved configuration of an Amazon Elastic Compute Cloud (Amazon EC2) instance.

In the Launch constraint section, I choose Enter role name to use a role I created before for this product:

  • The trust relationship of the role defines the entities that can assume the role. For this role, the trust relationship includes Service Catalog and the management account that contains the Terraform Reference Engine.
  • For permissions, the role allows to provision, update, and terminate the resources required by my product and to manage resource groups and tags on those resources.

Console screenshot.

I complete the addition of the product to my portfolio. Now the product is available to the end users who have access to this portfolio.

Launching an AWS Service Catalog Product Using Terraform
End users see the list of products and versions they have access to and can deploy them in a single action. If you already use Service Catalog, the experience is the same as with CloudFormation products.

I sign in to the AWS Console in the user account for Service Catalog. The portfolio I used before has been shared by the management account with this user account. In the Service Catalog console, I choose Products from the Provisioning group in the navigation pane. I search for the product by name and choose Launch product.

Console screenshot.

I let Service Catalog generate a unique name for the provisioned product and select the product version to deploy. Then, I launch the product.

Console screenshot.

After a few minutes, the product has been deployed and is available. The deployment has been managed by the Terraform Reference Engine.

Console screenshot.

In the Associated tags tab, I see that Service Catalog automatically added information on the portfolio and the product.

Console screenshot.

In the Resources tab, I see the resources created by the provisioned product. As expected, it’s an EC2 instance, and I can follow the link to open the Amazon EC2 console and get more information.

Console screenshot.

End users such as engineers, database administrators, and data scientists can continue to use Service Catalog and launch the products they need without having to consider if they are provisioned using Terraform or CloudFormation.

Availability and Pricing
AWS Service Catalog support for Terraform open-source configurations is available today in all AWS Regions where it is offered. There is no change in pricing when using Terraform. With Service Catalog, you pay for the API calls you make to the service, and you can start for free with the free tier. You also pay for the resources used and created by the Terraform Reference Engine. For more information, see Service Catalog Pricing.

Enable self-service provisioning at scale for your Terraform open-source configurations.

Danilo

AWS Supply Chain Now Generally Available – Mitigate Risks and Lower Costs with Increased Visibility and Actionable Insights

Post Syndicated from Danilo Poccia original https://aws.amazon.com/blogs/aws/aws-supply-chain-now-generally-available-mitigate-risks-and-lower-costs-with-increased-visibility-and-actionable-insights/

Like many of you, I experienced the disrupting effects introduced by external forces such as weather, geopolitical instability, and the COVID-19 pandemic. To improve supply chain resilience, organizations need visibility across their supply chain so that they can quickly find and respond to risks. This is increasingly complex as their customers’ preferences are rapidly changing, and historical demand assumptions are not valid anymore.

To add to that, supply chain data is often spread out across disconnected systems, and existing tools lack the elastic processing power and specialized machine learning (ML) models needed to create meaningful insights. Without real-time insights, organizations cannot detect variations in demand patterns, unexpected trends, or supply disruptions. And failing to react quickly can impact their customers and operational costs.

Today, I am happy to share that AWS Supply Chain is generally available. AWS Supply Chain is a cloud application that mitigates risk and lowers costs with unified data, ML-powered actionable insights, and built-in contextual collaboration. Let’s see how it can help your organization before taking a look at how you can use it.

How AWS Supply Chain Works
AWS Supply Chain connects to your existing enterprise resource planning (ERP) and supply chain management systems. When those connections are in place, you can benefit from the following capabilities:

  • A data lake is set up using ML models that have been pre-trained for supply chains to understand, extract, and transform data from different sources into a unified data model. The data lake can ingest data from a variety of data sources, including your existing ERP systems (such as SAP S4/HANA) and supply chain management systems.
  • Your data is represented in a real-time visual map using a set of interactive visual end-user interfaces built on a micro front-end architecture. This map highlights current inventory selection, quantity, and health at each location (for example, inventory that is at risk for stock out). Inventory managers can drill down into specific facilities and view the current inventory on hand, in transit, and potentially at risk in each location.
  • Actionable insights are automatically generated for potential supply chain risks (for example, overstock or stock outs) using the comprehensive supply chain data in the data lake and are shown in the real-time visual map. ML models, built on similar technology that Amazon uses, are used to generate more accurate vendor lead time predictions. Supply planners can use these predicted vendor lead times to update static assumptions built into planning models to reduce stock out or excess inventory risks.
  • Rebalancing options are automatically evaluated, ranked, and shared to provide inventory managers and planners with recommended actions to take if a risk is detected. Recommendation options are scored by the percentage of risk resolved, the distance between facilities, and the sustainability impact. Supply chain managers can also drill down to review the impact each option will have on other distribution centers across the network. Recommendations continuously improve by learning from the decisions you make.
  • To help you work with remote colleagues and implement rebalancing actions, contextual built-in collaboration capabilities are provided. When teams chat and message each other, the information about the risk and recommended options is shared, reducing errors and delays caused by poor communication so you can resolve issues faster.
  • To help remove the manual effort and guesswork around demand planning, ML is used to analyze historical sales data and real-time data (for example, open orders), create forecasts, and continually adjust models to improve accuracy. Demand planning also continuously learns from changing demand patterns and user inputs to offer near real-time forecast updates, allowing organizations to proactively adjust supply chain operations.

Now, let’s see how this works in practice.

Using AWS Supply Chain To Reduce Inventory Risks
The AWS Supply Chain team was kind enough to share an environment connected to an ERP system. When I log in, I choose Inventory and the Network Map from the navigation pane. Here, I have a general overview of the inventory status of the distribution centers (DCs). Using the timeline slider, I am able to fast forward in time and see how the inventory risks change over time. This allows me to predict future risks, not just the current ones.

Console screenshot.

I choose the Seattle DC to have more information on that location.

Console screenshot.

Instead of looking at each distribution center, I create an insight watchlist that is analyzed by AWS Supply Chain. I choose Insights from the navigation pane and then Inventory Risk to track stock out and inventory excess risks. I enter a name (Shortages) for the insight watchlist and select all locations and products.

Console screenshot.

In the Tracking parameters, I choose to only track Stock Out Risk. I want to be warned if the inventory level is 10 percent below the minimum inventory target and set my time horizon to two weeks. I save to complete the creation of the insight watchlist.

Console screenshot.

I choose New Insight Watchlist to create another one. This time, I select the Lead time Deviation insight type. I enter a name (Lead time) for the insight watchlist and, again, all locations and products. This time, I choose to be notified when there is a deviation in the lead time that is 20 percent or more than the planned lead times. I choose to consider one year of historical time.

Console screenshot.

After a few minutes, I see that new insights are available. In the Insights page, I select Shortages from the dropdown. On the left, I have a series of stacks of insights grouped by week. I expand the first stack and drag one of the insights to put it In Review.

Console screenshot.

I choose View Details to see the status and the recommendations for this out-of-stock risk for a specific product and location.

Console screenshot.

Just after the Overview, a list of Resolution Recommendations is sorted by a Score. Score weights are used to rank recommendations by setting the relative importance of distance, emissions (CO2), and percentage of the risk resolved. In the settings, I can also configure a max distance to be considered when proposing recommendations. The first recommendation is the best based on how I configure the score.

Console screenshot.

The recommendation shows the effect of the rebalance. If I move eight units of this product from the Detroit DC to the Seattle DC, the projected inventory is now balanced (color green) for the next two days in the After Rebalance section instead of being out of stock (red) as in the Before Rebalance section. This also solves the excess stock risk (purple) in the Detroit DC. At the top of the recommendation, I see the probability that this rebalance resolves the inventory risk and the impact on emissions (CO2).

I choose Select to proceed with this recommendation. In the dialog, I enter a comment and choose to message the team to start using the collaboration capabilities of AWS Supply Chain. In this way, all the communication from those involved in solving this inventory issue is stored and linked to the specific issue instead of happening in a separate channel such as emails. I choose Confirm.

Console screenshot.

Straight from the Stock Out Risk, I can message those that can help me implement the recommendation.

Console screenshot.

I get the reply here, but I prefer to see it in all its context. I choose Collaboration from the navigation pane. There, I find all the conversations started from insights (one for now) and the Stock Out Risk and Resolution recommendations as proposed before. All those collaborating on solving the issue have a clear view of the problem and the possible resolutions. For future reference, this conversation will be available with its risk and resolution context.

Console screenshot.

When the risk is resolved, I move the Stock Out Risk card to Resolved.

Console screenshot.

Now, I look at the Lead time insights. Similar to before, I choose an insight and put it In Review. I choose View Details to have more information. I see that, based on historical purchase orders, the recommended lead time for this specific product and location should be seven days and not one day as found in the connected ERP system. This can have a negative impact on the expectations of my customers.

Console screenshot.

Without the need of re-platforming or reimplementing the current systems, I was able to connect AWS Supply Chain and get insights on the inventory of the distribution centers and recommendations based on my personal settings. These recommendations help resolve inventory risks such as items being out of stock or having excess stock in a distribution center. By better understanding the lead time, I can set better expectations for end customers.

Availability and Pricing
AWS Supply Chain is available today in the following AWS Regions: US East (N. Virginia), US West (Oregon), and Europe (Frankfurt).

AWS Supply Chain allows your organization to quickly gain visibility across your supply chain, and it helps you make more informed supply chain decisions. You can use AWS Supply Chain to mitigate overstock and stock-out risks. In this way, you can improve your customer experience, and at the same time, AWS Supply Chain can help you lower excess inventory costs. Using contextual chat and messaging, you can improve the way you collaborate with other teams and resolve issues quickly.

With AWS Supply Chain, you only pay for what you use. There are no required upfront licensing fees or long-term contracts. For more information, see AWS Supply Chain pricing.

Mitigate risk and lower cost of with increased visibility and ML-powered actionable insights for your supply chain.

Danilo

Simplify Service-to-Service Connectivity, Security, and Monitoring with Amazon VPC Lattice – Now Generally Available

Post Syndicated from Danilo Poccia original https://aws.amazon.com/blogs/aws/simplify-service-to-service-connectivity-security-and-monitoring-with-amazon-vpc-lattice-now-generally-available/

At AWS re:Invent 2022, we introduced in preview Amazon VPC Lattice, a new capability of Amazon Virtual Private Cloud (Amazon VPC) that gives you a consistent way to connect, secure, and monitor communication between your services. With VPC Lattice, you can define policies for network access, traffic management, and monitoring to connect compute services across instances, containers, and serverless applications.

Today, I am happy to share that VPC Lattice is now generally available. Compared to the preview, you have access to new capabilities:

  • Services can use a custom domain name in addition to the domain name automatically generated by VPC Lattice. When using HTTPS, you can configure an SSL/TLS certificate that matches the custom domain name.
  • You can deploy the open-source AWS Gateway API Controller to use VPC Lattice with a Kubernetes-native experience. It uses the Kubernetes Gateway API to let you connect services across multiple Kubernetes clusters and services running on EC2 instances, containers, and serverless functions.
  • You can use an Application Load Balancer (ALB) or a Network Load Balancer (NLB) as a target for a service.
  • The IP address target type now supports IPv6 connectivity.

Let’s see some of these new features in practice.

Using Amazon VPC Lattice for Service-to-Service Connectivity
In my previous post introducing VPC Lattice, I show how to create a service network, associate multiple VPCs and services, and configure target groups for EC2 instances and Lambda functions. There, I also show how to route traffic based on request characteristics and how to use weighted routing. Weighted routing is really handy for blue/green and canary-style deployments or for migrating from one compute platform to another.

Now, let’s see how to use VPC Lattice to allow the services of an e-commerce application to communicate with each other. For simplicity, I only consider four services:

  • The Order service, running as a Lambda function.
  • The Inventory service, deployed as an Amazon Elastic Container Service (Amazon ECS) service in a dual-stack VPC supporting IPv6.
  • The Delivery service, deployed as an ECS service using an ALB to distribute traffic to the service tasks.
  • The Payment service, running on an EC2 instance.

First, I create a service network. The Order service needs to call the Inventory service (to check if an item is available for purchase), the Delivery service (to organize the delivery of the item), and the Payment service (to transfer the funds). The following diagram shows the service-to-service communication from the perspective of the service network.

Diagram describing the service network view of the e-commerce services.

These services run in different AWS accounts and multiple VPCs. VPC Lattice handles the complexity of setting up connectivity across VPC boundaries and permission across accounts so that service-to-service communication is as simple as an HTTP/HTTPS call.

The following diagram shows how the communication flows from an implementation point of view.

Diagram describing the implementation view of the e-commerce services.

The Order service runs in a Lambda function connected to a VPC. Because all the VPCs in the diagram are associated with the service network, the Order service is able to call the other services (Inventory, Delivery, and Payment) even if they are deployed in different AWS accounts and in VPCs with overlapping IP addresses.

Using a Network Load Balancer (NLB) as Target
The Inventory service runs in a dual-stack VPC. It’s deployed as an ECS service with an NLB to distribute traffic to the tasks in the service. To get the IPv6 addresses of the NLB, I look for the network interfaces used by the NLB in the EC2 console.

Console screenshot.

When creating the target group for the Inventory service, under Basic configuration, I choose IP addresses as the target type. Then, I select IPv6 for the IP Address type.

Console screenshot.

In the next step, I enter the IPv6 addresses of the NLB as targets. After the target group is created, the health checks test the targets to see if they are responding as expected.

Console screenshot.

Using an Application Load Balancer (ALB) as Target
Using an ALB as a target is even easier. When creating a target group for the Delivery service, under Basic configuration, I choose the new Application Load Balancer target type.

Console screenshot.

I select the VPC in which to look for the ALB and choose the Protocol version.

Console screenshot.

In the next step, I choose Register now and select the ALB from the dropdown. I use the default port used by the target group. VPC Lattice does not provide additional health checks for ALBs. However, load balancers already have their own health checks configured.

Console screenshot.

Using Custom Domain Names for Services
To call these services, I use custom domain names. For example, when I create the Payment service in the VPC console, I choose to Specify a custom domain configuration, enter a Custom domain name, and select an SSL/TLS certificate for the HTTPS listener. The Custom SSL/TLS certificate dropdown shows available certificates from AWS Certificate Manager (ACM).

Console screenshot.

Securing Service-to-Service Communications
Now that the target groups have been created, let’s see how I can secure the way services communicate with each other. To implement zero-trust authentication and authorization, I use AWS Identity and Access Management (IAM). When creating a service, I select the AWS IAM as Auth type.

I select the Allow only authenticated access policy template so that requests to services need to be signed using Signature Version 4, the same signing protocol used by AWS APIs. In this way, requests between services are authenticated by their IAM credentials, and I don’t have to manage secrets to secure their communications.

Console screenshot.

Optionally, I can be more precise and use an auth policy that only gives access to some services or specific URL paths of a service. For example, I can apply the following auth policy to the Order service to give to the Lambda function these permissions:

  • Read-only access (GET method) to the Inventory service /stock URL path.
  • Full access (any HTTP method) to the Delivery service /delivery URL path.
{
    "Version": "2012-10-17",
    "Statement": [
        {
            "Effect": "Allow",
            "Principal": {
                "AWS": "<Order Service Lambda Function IAM Role ARN>"
            },
            "Action": "vpc-lattice-svcs:Invoke",
            "Resource": "<Inventory Service ARN>/stock",
            "Condition": {
                "StringEquals": {
                    "vpc-lattice-svcs:RequestMethod": "GET"
                }
            }
        },
        {
            "Effect": "Allow",
            "Principal": {
                "AWS": "<Order Service Lambda Function IAM Role ARN>"
            },
            "Action": "vpc-lattice-svcs:Invoke",
            "Resource": "<Delivery Service ARN>/delivery"
        }
    ]
}

Using VPC Lattice, I quickly configured the communication between the services of my e-commerce application, including security and monitoring. Now, I can focus on the business logic instead of managing how services communicate with each other.

Availability and Pricing
Amazon VPC Lattice is available today in the following AWS Regions: US East (Ohio), US East (N. Virginia), US West (Oregon), Asia Pacific (Singapore), Asia Pacific (Sydney), Asia Pacific (Tokyo), and Europe (Ireland).

With VPC Lattice, you pay for the time a service is provisioned, the amount of data transferred through each service, and the number of requests. There is no charge for the first 300,000 requests every hour, and you only pay for requests above this threshold. For more information, see VPC Lattice pricing.

We designed VPC Lattice to allow incremental opt-in over time. Each team in your organization can choose if and when to use VPC Lattice. Other applications can connect to VPC Lattice services using standard protocols such as HTTP and HTTPS. By using VPC Lattice, you can focus on your application logic and improve productivity and deployment flexibility with consistent support for instances, containers, and serverless computing.

Simplify the way you connect, secure, and monitor your services with VPC Lattice.

Danilo

AWS Week in Review – March 20, 2023

Post Syndicated from Danilo Poccia original https://aws.amazon.com/blogs/aws/aws-week-in-review-march-20-2023/

This post is part of our Week in Review series. Check back each week for a quick roundup of interesting news and announcements from AWS!

A new week starts, and Spring is almost here! If you’re curious about AWS news from the previous seven days, I got you covered.

Last Week’s Launches
Here are the launches that got my attention last week:

Picture of an S3 bucket and AWS CEO Adam Selipsky.Amazon S3 – Last week there was AWS Pi Day 2023 celebrating 17 years of innovation since Amazon S3 was introduced on March 14, 2006. For the occasion, the team released many new capabilities:

Amazon Linux 2023 – Our new Linux-based operating system is now generally available. Sébastien’s post is full of tips and info.

Application Auto Scaling – Now can use arithmetic operations and mathematical functions to customize the metrics used with Target Tracking policies. You can use it to scale based on your own application-specific metrics. Read how it works with Amazon ECS services.

AWS Data Exchange for Amazon S3 is now generally available – You can now share and find data files directly from S3 buckets, without the need to create or manage copies of the data.

Amazon Neptune – Now offers a graph summary API to help understand important metadata about property graphs (PG) and resource description framework (RDF) graphs. Neptune added support for Slow Query Logs to help identify queries that need performance tuning.

Amazon OpenSearch Service – The team introduced security analytics that provides new threat monitoring, detection, and alerting features. The service now supports OpenSearch version 2.5 that adds several new features such as support for Point in Time Search and improvements to observability and geospatial functionality.

AWS Lake Formation and Apache Hive on Amazon EMR – Introduced fine-grained access controls that allow data administrators to define and enforce fine-grained table and column level security for customers accessing data via Apache Hive running on Amazon EMR.

Amazon EC2 M1 Mac Instances – You can now update guest environments to a specific or the latest macOS version without having to tear down and recreate the existing macOS environments.

AWS Chatbot – Now Integrates With Microsoft Teams to simplify the way you troubleshoot and operate your AWS resources.

Amazon GuardDuty RDS Protection for Amazon Aurora – Now generally available to help profile and monitor access activity to Aurora databases in your AWS account without impacting database performance

AWS Database Migration Service – Now supports validation to ensure that data is migrated accurately to S3 and can now generate an AWS Glue Data Catalog when migrating to S3.

AWS Backup – You can now back up and restore virtual machines running on VMware vSphere 8 and with multiple vNICs.

Amazon Kendra – There are new connectors to index documents and search for information across these new content: Confluence Server, Confluence Cloud, Microsoft SharePoint OnPrem, Microsoft SharePoint Cloud. This post shows how to use the Amazon Kendra connector for Microsoft Teams.

For a full list of AWS announcements, be sure to keep an eye on the What’s New at AWS page.

Other AWS News
A few more blog posts you might have missed:

Example of a geospatial query.Women founders Q&A – We’re talking to six women founders and leaders about how they’re making impacts in their communities, industries, and beyond.

What you missed at that 2023 IMAGINE: Nonprofit conference – Where hundreds of nonprofit leaders, technologists, and innovators gathered to learn and share how AWS can drive a positive impact for people and the planet.

Monitoring load balancers using Amazon CloudWatch anomaly detection alarms – The metrics emitted by load balancers provide crucial and unique insight into service health, service performance, and end-to-end network performance.

Extend geospatial queries in Amazon Athena with user-defined functions (UDFs) and AWS Lambda – Using a solution based on Uber’s Hexagonal Hierarchical Spatial Index (H3) to divide the globe into equally-sized hexagons.

How cities can use transport data to reduce pollution and increase safety – A guest post by Rikesh Shah, outgoing head of open innovation at Transport for London.

For AWS open-source news and updates, here’s the latest newsletter curated by Ricardo to bring you the most recent updates on open-source projects, posts, events, and more.

Upcoming AWS Events
Here are some opportunities to meet:

AWS Public Sector Day 2023 (March 21, London, UK) – An event dedicated to helping public sector organizations use technology to achieve more with less through the current challenging conditions.

Women in Tech at Skills Center Arlington (March 23, VA, USA) – Let’s celebrate the history and legacy of women in tech.

The AWS Summits season is warming up! You can sign up here to know when registration opens in your area.

That’s all from me for this week. Come back next Monday for another Week in Review!

Danilo

New – Use Amazon S3 Object Lambda with Amazon CloudFront to Tailor Content for End Users

Post Syndicated from Danilo Poccia original https://aws.amazon.com/blogs/aws/new-use-amazon-s3-object-lambda-with-amazon-cloudfront-to-tailor-content-for-end-users/

With S3 Object Lambda, you can use your own code to process data retrieved from Amazon S3 as it is returned to an application. Over time, we added new capabilities to S3 Object Lambda, like the ability to add your own code to S3 HEAD and LIST API requests, in addition to the support for S3 GET requests that was available at launch.

Today, we are launching aliases for S3 Object Lambda Access Points. Aliases are now automatically generated when S3 Object Lambda Access Points are created and are interchangeable with bucket names anywhere you use a bucket name to access data stored in Amazon S3. Therefore, your applications don’t need to know about S3 Object Lambda and can consider the alias to be a bucket name.

Architecture diagram.

You can now use an S3 Object Lambda Access Point alias as an origin for your Amazon CloudFront distribution to tailor or customize data for end users. You can use this to implement automatic image resizing or to tag or annotate content as it is downloaded. Many images still use older formats like JPEG or PNG, and you can use a transcoding function to deliver images in more efficient formats like WebP, BPG, or HEIC. Digital images contain metadata, and you can implement a function that strips metadata to help satisfy data privacy requirements.

Architecture diagram.

Let’s see how this works in practice. First, I’ll show a simple example using text that you can follow along by just using the AWS Management Console. After that, I’ll implement a more advanced use case processing images.

Using an S3 Object Lambda Access Point as the Origin of a CloudFront Distribution
For simplicity, I am using the same application in the launch post that changes all text in the original file to uppercase. This time, I use the S3 Object Lambda Access Point alias to set up a public distribution with CloudFront.

I follow the same steps as in the launch post to create the S3 Object Lambda Access Point and the Lambda function. Because the Lambda runtimes for Python 3.8 and later do not include the requests module, I update the function code to use urlopen from the Python Standard Library:

import boto3
from urllib.request import urlopen

s3 = boto3.client('s3')

def lambda_handler(event, context):
  print(event)

  object_get_context = event['getObjectContext']
  request_route = object_get_context['outputRoute']
  request_token = object_get_context['outputToken']
  s3_url = object_get_context['inputS3Url']

  # Get object from S3
  response = urlopen(s3_url)
  original_object = response.read().decode('utf-8')

  # Transform object
  transformed_object = original_object.upper()

  # Write object back to S3 Object Lambda
  s3.write_get_object_response(
    Body=transformed_object,
    RequestRoute=request_route,
    RequestToken=request_token)

  return

To test that this is working, I open the same file from the bucket and through the S3 Object Lambda Access Point. In the S3 console, I select the bucket and a sample file (called s3.txt) that I uploaded earlier and choose Open.

Console screenshot.

A new browser tab is opened (you might need to disable the pop-up blocker in your browser), and its content is the original file with mixed-case text:

Amazon Simple Storage Service (Amazon S3) is an object storage service that offers...

I choose Object Lambda Access Points from the navigation pane and select the AWS Region I used before from the dropdown. Then, I search for the S3 Object Lambda Access Point that I just created. I select the same file as before and choose Open.

Console screenshot.

In the new tab, the text has been processed by the Lambda function and is now all in uppercase:

AMAZON SIMPLE STORAGE SERVICE (AMAZON S3) IS AN OBJECT STORAGE SERVICE THAT OFFERS...

Now that the S3 Object Lambda Access Point is correctly configured, I can create the CloudFront distribution. Before I do that, in the list of S3 Object Lambda Access Points in the S3 console, I copy the Object Lambda Access Point alias that has been automatically created:

Console screenshot.

In the CloudFront console, I choose Distributions in the navigation pane and then Create distribution. In the Origin domain, I use the S3 Object Lambda Access Point alias and the Region. The full syntax of the domain is:

ALIAS.s3.REGION.amazonaws.com

Console screenshot.

S3 Object Lambda Access Points cannot be public, and I use CloudFront origin access control (OAC) to authenticate requests to the origin. For Origin access, I select Origin access control settings and choose Create control setting. I write a name for the control setting and select Sign requests and S3 in the Origin type dropdown.

Console screenshot.

Now, my Origin access control settings use the configuration I just created.

Console screenshot.

To reduce the number of requests going through S3 Object Lambda, I enable Origin Shield and choose the closest Origin Shield Region to the Region I am using. Then, I select the CachingOptimized cache policy and create the distribution. As the distribution is being deployed, I update permissions for the resources used by the distribution.

Setting Up Permissions to Use an S3 Object Lambda Access Point as the Origin of a CloudFront Distribution
First, the S3 Object Lambda Access Point needs to give access to the CloudFront distribution. In the S3 console, I select the S3 Object Lambda Access Point and, in the Permissions tab, I update the policy with the following:

{
    "Version": "2012-10-17",
    "Statement": [
        {
            "Effect": "Allow",
            "Principal": {
                "Service": "cloudfront.amazonaws.com"
            },
            "Action": "s3-object-lambda:Get*",
            "Resource": "arn:aws:s3-object-lambda:REGION:ACCOUNT:accesspoint/NAME",
            "Condition": {
                "StringEquals": {
                    "aws:SourceArn": "arn:aws:cloudfront::ACCOUNT:distribution/DISTRIBUTION-ID"
                }
            }
        }
    ]
}

The supporting access point also needs to allow access to CloudFront when called via S3 Object Lambda. I select the access point and update the policy in the Permissions tab:

{
    "Version": "2012-10-17",
    "Id": "default",
    "Statement": [
        {
            "Sid": "s3objlambda",
            "Effect": "Allow",
            "Principal": {
                "Service": "cloudfront.amazonaws.com"
            },
            "Action": "s3:*",
            "Resource": [
                "arn:aws:s3:REGION:ACCOUNT:accesspoint/NAME",
                "arn:aws:s3:REGION:ACCOUNT:accesspoint/NAME/object/*"
            ],
            "Condition": {
                "ForAnyValue:StringEquals": {
                    "aws:CalledVia": "s3-object-lambda.amazonaws.com"
                }
            }
        }
    ]
}

The S3 bucket needs to allow access to the supporting access point. I select the bucket and update the policy in the Permissions tab:

{
    "Version": "2012-10-17",
    "Statement": [
        {
            "Effect": "Allow",
            "Principal": {
                "AWS": "*"
            },
            "Action": "*",
            "Resource": [
                "arn:aws:s3:::BUCKET",
                "arn:aws:s3:::BUCKET/*"
            ],
            "Condition": {
                "StringEquals": {
                    "s3:DataAccessPointAccount": "ACCOUNT"
                }
            }
        }
    ]
}

Finally, CloudFront needs to be able to invoke the Lambda function. In the Lambda console, I choose the Lambda function used by S3 Object Lambda, and then, in the Configuration tab, I choose Permissions. In the Resource-based policy statements section, I choose Add permissions and select AWS Account. I enter a unique Statement ID. Then, I enter cloudfront.amazonaws.com as Principal and select lambda:InvokeFunction from the Action dropdown and Save. We are working to simplify this step in the future. I’ll update this post when that’s available.

Testing the CloudFront Distribution
When the distribution has been deployed, I test that the setup is working with the same sample file I used before. In the CloudFront console, I select the distribution and copy the Distribution domain name. I can use the browser and enter https://DISTRIBUTION_DOMAIN_NAME/s3.txt in the navigation bar to send a request to CloudFront and get the file processed by S3 Object Lambda. To quickly get all the info, I use curl with the -i option to see the HTTP status and the headers in the response:

curl -i https://DISTRIBUTION_DOMAIN_NAME/s3.txt

HTTP/2 200 
content-type: text/plain
content-length: 427
x-amzn-requestid: a85fe537-3502-4592-b2a9-a09261c8c00c
date: Mon, 06 Mar 2023 10:23:02 GMT
x-cache: Miss from cloudfront
via: 1.1 a2df4ad642d78d6dac65038e06ad10d2.cloudfront.net (CloudFront)
x-amz-cf-pop: DUB56-P1
x-amz-cf-id: KIiljCzYJBUVVxmNkl3EP2PMh96OBVoTyFSMYDupMd4muLGNm2AmgA==

AMAZON SIMPLE STORAGE SERVICE (AMAZON S3) IS AN OBJECT STORAGE SERVICE THAT OFFERS...

It works! As expected, the content processed by the Lambda function is all uppercase. Because this is the first invocation for the distribution, it has not been returned from the cache (x-cache: Miss from cloudfront). The request went through S3 Object Lambda to process the file using the Lambda function I provided.

Let’s try the same request again:

curl -i https://DISTRIBUTION_DOMAIN_NAME/s3.txt

HTTP/2 200 
content-type: text/plain
content-length: 427
x-amzn-requestid: a85fe537-3502-4592-b2a9-a09261c8c00c
date: Mon, 06 Mar 2023 10:23:02 GMT
x-cache: Hit from cloudfront
via: 1.1 145b7e87a6273078e52d178985ceaa5e.cloudfront.net (CloudFront)
x-amz-cf-pop: DUB56-P1
x-amz-cf-id: HEx9Fodp184mnxLQZuW62U11Fr1bA-W1aIkWjeqpC9yHbd0Rg4eM3A==
age: 3

AMAZON SIMPLE STORAGE SERVICE (AMAZON S3) IS AN OBJECT STORAGE SERVICE THAT OFFERS...

This time the content is returned from the CloudFront cache (x-cache: Hit from cloudfront), and there was no further processing by S3 Object Lambda. By using S3 Object Lambda as the origin, the CloudFront distribution serves content that has been processed by a Lambda function and can be cached to reduce latency and optimize costs.

Resizing Images Using S3 Object Lambda and CloudFront
As I mentioned at the beginning of this post, one of the use cases that can be implemented using S3 Object Lambda and CloudFront is image transformation. Let’s create a CloudFront distribution that can dynamically resize an image by passing the desired width and height as query parameters (w and h respectively). For example:

https://DISTRIBUTION_DOMAIN_NAME/image.jpg?w=200&h=150

For this setup to work, I need to make two changes to the CloudFront distribution. First, I create a new cache policy to include query parameters in the cache key. In the CloudFront console, I choose Policies in the navigation pane. In the Cache tab, I choose Create cache policy. Then, I enter a name for the cache policy.

Console screenshot.

In the Query settings of the Cache key settings, I select the option to Include the following query parameters and add w (for the width) and h (for the height).

Console screenshot.

Then, in the Behaviors tab of the distribution, I select the default behavior and choose Edit.

There, I update the Cache key and origin requests section:

  • In the Cache policy, I use the new cache policy to include the w and h query parameters in the cache key.
  • In the Origin request policy, use the AllViewerExceptHostHeader managed policy to forward query parameters to the origin.

Console screenshot.

Now I can update the Lambda function code. To resize images, this function uses the Pillow module that needs to be packaged with the function when it is uploaded to Lambda. You can deploy the function using a tool like the AWS SAM CLI or the AWS CDK. Compared to the previous example, this function also handles and returns HTTP errors, such as when content is not found in the bucket.

import io
import boto3
from urllib.request import urlopen, HTTPError
from PIL import Image

from urllib.parse import urlparse, parse_qs

s3 = boto3.client('s3')

def lambda_handler(event, context):
    print(event)

    object_get_context = event['getObjectContext']
    request_route = object_get_context['outputRoute']
    request_token = object_get_context['outputToken']
    s3_url = object_get_context['inputS3Url']

    # Get object from S3
    try:
        original_image = Image.open(urlopen(s3_url))
    except HTTPError as err:
        s3.write_get_object_response(
            StatusCode=err.code,
            ErrorCode='HTTPError',
            ErrorMessage=err.reason,
            RequestRoute=request_route,
            RequestToken=request_token)
        return

    # Get width and height from query parameters
    user_request = event['userRequest']
    url = user_request['url']
    parsed_url = urlparse(url)
    query_parameters = parse_qs(parsed_url.query)

    try:
        width, height = int(query_parameters['w'][0]), int(query_parameters['h'][0])
    except (KeyError, ValueError):
        width, height = 0, 0

    # Transform object
    if width > 0 and height > 0:
        transformed_image = original_image.resize((width, height), Image.ANTIALIAS)
    else:
        transformed_image = original_image

    transformed_bytes = io.BytesIO()
    transformed_image.save(transformed_bytes, format='JPEG')

    # Write object back to S3 Object Lambda
    s3.write_get_object_response(
        Body=transformed_bytes.getvalue(),
        RequestRoute=request_route,
        RequestToken=request_token)

    return

I upload a picture I took of the Trevi Fountain in the source bucket. To start, I generate a small thumbnail (200 by 150 pixels).

https://DISTRIBUTION_DOMAIN_NAME/trevi-fountain.jpeg?w=200&h=150

Picture of the Trevi Fountain with size 200x150 pixels.

Now, I ask for a slightly larger version (400 by 300 pixels):

https://DISTRIBUTION_DOMAIN_NAME/trevi-fountain.jpeg?w=400&h=300

Picture of the Trevi Fountain with size 400x300 pixels.

It works as expected. The first invocation with a specific size is processed by the Lambda function. Further requests with the same width and height are served from the CloudFront cache.

Availability and Pricing
Aliases for S3 Object Lambda Access Points are available today in all commercial AWS Regions. There is no additional cost for aliases. With S3 Object Lambda, you pay for the Lambda compute and request charges required to process the data, and for the data S3 Object Lambda returns to your application. You also pay for the S3 requests that are invoked by your Lambda function. For more information, see Amazon S3 Pricing.

Aliases are now automatically generated when an S3 Object Lambda Access Point is created. For existing S3 Object Lambda Access Points, aliases are automatically assigned and ready for use.

It’s now easier to use S3 Object Lambda with existing applications, and aliases open many new possibilities. For example, you can use aliases with CloudFront to create a website that converts content in Markdown to HTML, resizes and watermarks images, or masks personally identifiable information (PII) from text, images, and documents.

Customize content for your end users using S3 Object Lambda with CloudFront.

Danilo

How to Connect Business and Technology to Embrace Strategic Thinking (Book Review)

Post Syndicated from Danilo Poccia original https://aws.amazon.com/blogs/aws/how-to-connect-business-and-technology-to-embrace-strategic-thinking-book-review/

The Value Flywheel Effect: Power the Future and Accelerate Your Organization to the Modern Cloud
by David Anderson with Mark McCann and Michael O’Reilly

With this post, I’d like to share a new book that got my attention. It’s a book at the intersection of business, technology, and people. This is a great read for anyone who wants to understand how organizations can evolve to maximize the business impact of new technologies and speed up their internal processes.

The Value FlyWheel Effect book with David Anderson and Danilo Poccia

Last year at re:Invent, I had the opportunity to meet David Anderson. As Director of Technology at Liberty Mutual, he drove the technology change when the global insurance company, founded in 1912, moved its services to the cloud and adopted a serverless-first strategy. He created an environment where experimentation was normal, and software engineers had time and space to learn. This worked so well that, at some point, he had four AWS Heroes in his extended team.

A few months before, I heard that David was writing a book with Mark McCann and Michael O’Reilly. They all worked together at Liberty Mutual, and they were distilling their learnings to help other organizations implement a similar approach. The book was just out when we met, and I was curious to learn more, starting from the title. We met in the expo area, and David was kind enough to give me a signed copy of the book.

The book is published by IT Revolution, the same publisher behind some of my favorite books such as The Phoenix Project, Team Topologies, and Accelerate. The book is titled The Value Flywheel Effect because when you connect business and technology in an organization, you start to turn a flywheel that builds momentum with each small win.

The Value Flywhell
The four phases of the Value Flywheel are:

  1. Clarity of Purpose – This is the part where you look at what is really important for your organization, what makes your company different, and define your North Star and how to measure your distance from it. In this phase, you look at the company through the eyes of the CEO.
  2. Challenge & Landscape – Here you prepare the organization and set up the environment for the teams. We often forget the social aspect of technical teams and great focus is given here on how to set up the right level of psychological safety for teams to operate. This phase is for engineers.
  3. Next Best Action – In this phase, you think like a product leader and plan the next steps with a focus on how to improve the developer experience. One of the key aspects is that “code is a liability” and the less code you write to solve a business problem, the better it is for speed and maintenance. For example, you can avoid some custom implementations and offload their requirements to capabilities offered by cloud providers.
  4. Long-Term Value – This is the CTO perspective, looking at how to set up a problem-preventing culture with well-architected systems and a focus on observability and sustainability. Sustainability here is not just considering the global environment but also the teams and the people working for the organization.

As you would expect from a flywheel, you should iterate on these four phases so that every new spin gets easier and faster.

Wardley Mapping
One thing that I really appreciate from the book is how it made it easy for me to use Wardley mapping (usually applied to a business context) in a technical scenario. Wardley maps, invented by Simon Wardley, provide a visual representation of the landscape in which a business operates.

Each map consists of a value chain, where you draw the components that your customers need. The components are connected to show how they depend on each other. The position of the components is based on how visible they are to customers (vertical) and their evolution status from genesis to being a product or a commodity (horizontal). Over time, some components evolve from being custom-built to becoming a product or being commoditized. This displays on the map with a natural movement to the right as things evolve. For example, data centers were custom-built in the past, but then they became a standard product, and cloud computing made them available as a commodity.

Wardley mapping – Basic elements of a map

Basic elements of a map – Provided courtesy of Simon Wardley, CC BY-SA 4.0.

With mapping, you can more easily understand what improvements you need and what gaps you have in your technical solution. In this way, engineers can identify which components they should focus on to maximize their impact and what parts are not strategic and can be offloaded to a SaaS solution. It’s a sort of evolutionary architecture where mapping gives a way to look ahead at how the system should evolve over time and where inertia can slow down the evolution of part of the system.

Sometimes it seems the same best practices apply everywhere but this is not true. An advantage of mapping is that it helps identify the best team and methodology to use based on a component evolution status as described by its horizontal position on a map. For example, an “explorer” attitude is best suited for components in their genesis or being custom built, a “villager” works best on products, and when something becomes a commodity you need a “town planner.”

More Tools and Less Code
The authors look at many available tools and frameworks. For example, the book introduces the North Star Framework, a way to manage products by first identifying their most important metric (the North Star), and Gojko Adzic‘s Impact Mapping, a collaborative planning technique that focuses on leading indicators to help teams make a big impact with their software products. By the way, Gojko is also an AWS Serverless Hero.

Another interesting point is how to provide engineers with the necessary time and space to learn. I specifically like how internal events are called out and compared to public conferences. In internal events, engineers have a chance to use a new technology within their company environment, making it easier to demonstrate what can be done with all the limits of an actual scenario.

Finally, I’d like to highlight this part that clearly defines what the book intends by the statements, “code is a liability”:

“When you ask a software team to build something, they deliver a system, not lines of code. The asset is not the code; the asset is the system. The less code in the system, the less overhead you have bought. Some developers may brag about how much code they’ve written, but this isn’t something to brag about.”

This is not a programming book, and serverless technologies are used as examples of how you can speed up the flywheel. If you are looking for a technical deep dive on serverless technologies, you can find more on Serverless Land, a site that brings together the latest information and learning resources for serverless computing, or have a look at the Serverless Architectures on AWS book.

Now that every business is a technology business, The Value Flywheel Effect is about how to accelerate and transform an organization. It helps set the right environment, purpose, and stage to modernize your applications as you adopt cloud computing and get the benefit of it.

You can meet David, Mark, and Michael at the Serverless Edge, where a team of engineers, tech enthusiasts, marketers, and thought leaders obsessed with technology help learn and communicate how serverless can transform a business model.

Danilo

New for Amazon Redshift – Simplify Data Ingestion and Make Your Data Warehouse More Secure and Reliable

Post Syndicated from Danilo Poccia original https://aws.amazon.com/blogs/aws/new-for-amazon-redshift-simplify-data-ingestion-and-make-your-data-warehouse-more-secure-and-reliable/

When we talk with customers, we hear that they want to be able to harness insights from data in order to make timely, impactful, and actionable business decisions. A common pattern with data-driven organizations is that they have many different data sources they need to ingest into their analytics systems. This requires them to build manual data pipelines spanning across their operational databases, data lakes, streaming data, and data within their warehouse. As a consequence of this complex setup, it can take data engineers weeks or even months to build data ingestion pipelines. These data pipelines are costly, and the delays can lead to missed business opportunities. Additionally, data warehouses are increasingly becoming mission critical systems that require high availability, reliability, and security.

Amazon Redshift is a fully managed petabyte-scale data warehouse used by tens of thousands of customers to easily, quickly, securely, and cost-effectively analyze all their data at any scale. This year at re:Invent, Amazon Redshift has announced a number of features to help you simplify data ingestion and get to insights easily and quickly, within a secure, reliable environment.

In this blog, I introduce some of these new features that fit into two main categories:

  • Simplify data ingestion
    • Amazon Redshift now supports auto-copy from Amazon S3 (available in preview). With this new capability, Amazon Redshift automatically loads the files that arrive in an Amazon Simple Storage Service (Amazon S3) location that you specify into your data warehouse. The files can use any of the formats supported by the Amazon Redshift copy command, such as CSV, JSON, Parquet, and Avro. In this way, you don’t need to manually or repeatedly run copy procedures. Amazon Redshift automates file ingestion and takes care of data-loading steps under the hood.
    • With Amazon Aurora zero-ETL integration with Amazon Redshift, you can use Amazon Redshift for near real-time analytics and machine learning on petabytes of transactional data stored on Amazon Aurora MySQL databases (available in limited preview). With this capability, you can choose the Amazon Aurora databases containing the data you want to analyze with Amazon Redshift. Data is then replicated into your data warehouse within seconds after transactional data is written into Amazon Aurora, eliminating the need to build and maintain complex data pipelines. You can replicate data from multiple Amazon Aurora databases into the same Amazon Redshift instance to run analytics across multiple applications. With near real-time access to transactional data, you can leverage Amazon Redshift’s analytics and capabilities, such as built-in machine learning (ML), materialized views, data sharing, and federated access to multiple data stores and data lakes, to derive insights from transactional and other data.
    • With the general availability of Amazon Redshift Streaming Ingestion, you can now natively ingest hundreds of megabytes of data per second from Amazon Kinesis Data Streams and Amazon MSK into an Amazon Redshift materialized view and query it in seconds. Learn more in this post.
  • Make your data warehouse more secure and reliable
    • You can now improve the availability of your data warehouse by choosing multiple Availability Zone (AZ) deployments. Multi-AZ deployments for your Amazon Redshift clusters are available in preview and reduce recovery times to seconds through automatic recovery. In this way, you can build solutions that are more compliant with the recommendations of the Reliability Pillar of the AWS Well-Architected Framework.
    • With dynamic data masking (available in preview), you can protect sensitive information stored in your data warehouse and ensure that only the relevant data is accessible by users based on their roles. You can limit how much identifiable data is visible to users using multiple levels of policies so different users and groups can have different levels of data access without having to create multiple copies of data. Dynamic data masking complements other granular access control capabilities in Amazon Redshift including row-level and column-level security and role-based access controls. In this way, Dynamic Data Masking helps you meet requirements for GDPR, CCPA, and other privacy regulations.
    • Amazon Redshift now supports central access controls for data sharing with AWS Lake Formation (available in public preview). You can now use Lake Formation to simplify governance of data shared from Amazon Redshift and centrally manage granular access across all data-sharing consumers.

There have been other interesting news for Amazon Redshift at re:Invent you might have already heard about:

  • The general availability of Amazon Redshift integration for Apache Spark makes it easy to build and run Spark applications on Amazon Redshift and Redshift Serverless, opening up the data warehouse for a broader set of AWS analytics and machine learning solutions.
  • AWS Backup now supports Amazon Redshift. AWS Backup allows you to define a central backup policy to manage data protection of your applications and can also protect your Amazon Redshift clusters. In this way, you have a consistent experience when managing data protection across all supported services.

Availability and Pricing
Multi-AZ deployments, central access control for data sharing with AWS Lake Formation, auto-copy from Amazon S3, and dynamic data masking are available in preview in US East (Ohio), US East (N. Virginia), US West (Oregon), Asia Pacific (Tokyo), Europe (Ireland), and Europe (Stockholm).

There is no additional cost for using auto-copy from Amazon S3 and near real-time analytics on transactional data. There is no extra charge for dynamic data masking and central access control for data sharing. For more information, see Amazon Redshift pricing.

These new capabilities take you one step further in analyzing all your data across data sources with simple data ingestion capabilities, while improving the security and reliability of your data warehouse.

Danilo

Introducing VPC Lattice – Simplify Networking for Service-to-Service Communication (Preview)

Post Syndicated from Danilo Poccia original https://aws.amazon.com/blogs/aws/introducing-vpc-lattice-simplify-networking-for-service-to-service-communication-preview/

Modern applications are built using modular and distributed components. Each component is a service that implements its own subset of functionalities. To make these services communicate with each other, you need a way to let them discover where they are, authorize access, and route traffic. When troubleshooting issues, you need to keep communication configurations under control so that you can quickly understand what is happening at the application, service, and network levels. This can take a lot of your time.

Today, we are making available in preview Amazon VPC Lattice, a new capability of Amazon Virtual Private Cloud (Amazon VPC) that gives you a consistent way to connect, secure, and monitor communication between your services. With VPC Lattice, you can define policies for traffic management, network access, and monitoring so you can connect applications in a simple and consistent way across AWS compute services (instances, containers, and serverless functions). VPC Lattice automatically handles network connectivity between VPCs and accounts and network address translation between IPv4, IPv6, and overlapping IP addresses. VPC Lattice integrates with AWS Identity and Access Management (IAM) to give you the same authentication and authorization capabilities you are familiar with when interacting with AWS services today, but for your own service-to-service communication. With VPC Lattice, you have common controls to route traffic based on request characteristics and weighted routing for blue/green and canary-style deployments. For example, VPC Lattice allows you to mix and match compute types for a given service, which helps you modernize a monolith application architecture to microservices.

VPC Lattice is designed to be noninvasive, allowing teams across your organization to incrementally opt in over time. In this way, you are able to deliver applications faster by focusing on your application logic, while VPC Lattice handles service-to-service networking, security, and monitoring requirements.

How Amazon VPC Lattice Works
With VPC Lattice, you create a logical application layer network, called a service network, that connects clients and services across different VPCs and accounts, abstracting network complexity. A service network is a logical boundary that is used to automatically implement service discovery and connectivity as well as apply access and observability policies to a collection of services. It offers inter-application connectivity over HTTP/HTTPS and gRPC protocols within a VPC.

Once a VPC has been enabled for a service network, clients in the VPC will automatically be able to discover the services in the service network through DNS and will direct all inter-application traffic through VPC Lattice. You can use AWS Resource Access Manager (RAM) to control which accounts, VPCs, and applications can establish communication via VPC Lattice.

A service is an independently deployable unit of software that delivers a specific task or function. In VPC Lattice, a service is a logical component that can live in any VPC or account and can run on a mixture of compute types (virtual machines, containers, and serverless functions). A service configuration consists of:

  • One or two listeners that define the port and protocol that the service is expecting traffic on. Supported protocols are HTTP/1.1, HTTP/2, and gRPC, including HTTPS for TLS-enabled services.
  • Listeners have rules that consist of a priority, which specifies the order in which rules should be processed, one or more conditions that define when to apply the rule, and actions that forward traffic to target groups. Each listener has a default rule that takes effect when no additional rules are configured, or no conditions are met.
  • A target group is a collection of targets, or compute resources, that are running a specific workload you are trying to route toward. Targets can be Amazon Elastic Compute Cloud (Amazon EC2) instances, IP addresses, and Lambda functions. For Kubernetes workloads, VPC Lattice can target services and pods via the AWS Gateway Controller for Kubernetes. To have access to the AWS Gateway Controller for Kubernetes, you can join the preview.

VPC Lattice logical architecture.

To configure service access controls, you can use access policies. An access policy is an IAM resource policy that can be associated with a service network and individual services. With access policies, you can use the “PARC” (principal, action, resource, and condition) model to enforce context-specific access controls for services. For example, you can use an access policy to define which services can access a service you own. If you use AWS Organizations, you can limit access to a service network to a specific organization.

VPC Lattice also provides a service directory, a centralized view of the services that you own or have been shared with you via AWS RAM.

Using Amazon VPC Lattice
We expect people with different roles can use VPC Lattice. For example:

  • The service network administrator can:
    • Create and manage a service network.
    • Define access and monitoring for the service network.
    • Associate client and services.
    • Share the service network with other AWS accounts.
  • The service owner can:
    • Create and manage a service, including access and monitoring.
    • Define routing, for example, configuring listeners and rules that point to the target groups where the service is running.
    • Associate a service to service networks.

Let’s see how this works in practice. In this quick walkthrough, I am covering both roles.

Creating Two Backend Services
There is nothing specific to VPC Lattice in this section. I am just creating a couple of services, one running on Amazon EC2 and one on AWS Lambda, that I’ll use later when I configure networking with VPC Lattice.

In an Amazon Linux EC2 instance, I create a web app that replies “Hello from the instance” to HTTP requests. To allow access to the instance from clients coming via VPC Lattice, I add an inbound rule to the security group to allow TCP traffic on port 8080 from the VPC Lattice AWS-managed prefix list.

Here’s the app.py file. I am using Python and Flask for this app, but you don’t need to know them to follow along with the post.

from flask import Flask

app = Flask(__name__)

@app.route('/')
def index():
  return 'Hello from the instance'

@app.route('/<path>')
def somePath(path):
  return 'Hello from the instance at path "{}"'.format(path)

app.run(host='0.0.0.0', port=8080)

Here’s the requirements.txt file with the Python dependencies. There’s only one line because the only module I need is flask:

flask

I install the dependencies:

pip3 install -r requirements.txt

Then, I start the web app using the nohup command to keep it running in case I log out of the instance:

nohup flask run --host=0.0.0.0 --port 8080 &

On the EC2 instance, the web service is now listening to HTTP traffic on port 8080.

In the Lambda console, I create a simple function using the Node.js 18.x runtime that replies “Hello from the function” to all invocations.

exports.handler = async (event) => {
    const response = {
        statusCode: 200,
        body: JSON.stringify('Hello from the function'),
    };
    return response;
};

The two services are now both ready. Let’s use VPC Lattice to configure networking.

Creating VPC Lattice Target Groups
I start by creating two target groups, one for the EC2 instance and one for the Lambda function. In the VPC console, there is a new VPC Lattice section in the navigation pane. There, I choose Target groups and then Create target group.

For the first target group, I choose the Instances target type and enter a name.

Console screenshot.

I choose the protocol (HTTP) and port (8080) used by the web app running on the instance. I select the VPC where the instance is running and the protocol version (HTTP1).

Console screenshot.

Now I can configure the health check that will be used to test the target status. In this case, I use the default values proposed by the console.

Console screenshot.

In the next step, I can register the targets. I select the instance on which the web app is running from the list and choose to include it.

Console screenshot.

I review the selected targets (one instance in this case) and choose Submit.

In a similar way, I create a target group for the Lambda function. This time, I select the function from the list. I can choose which function version or function alias to use. For simplicity, I use the $LATEST version.

Console screenshot.

Creating VPC Lattice Services
Now that the target groups are ready, I choose Services in the navigation pane and then Create service. I enter a name and a description.

Console screenshot.

Now, I can choose the authentication type. If I choose None, the service network does not authenticate or authorize client access, and the auth policy, if present, is not used. I select AWS IAM and then, from the Apply policy template dropdown, the template that allows both authenticated and unauthenticated access.

Console screenshot.

In the Monitoring section, I turn on Access logs. As the destination for the access logs, I use an Amazon CloudWatch Log group that I created before. I also have the option to use an Amazon Simple Storage Service (Amazon S3) bucket or a Amazon Kinesis Data Firehose delivery stream.

Console screenshot.

In the next step, I define routing for the service. I choose Add listener. For the protocol, I configure the service to listen using HTTPS. In the default action, I choose to send two-thirds (Weight 20) of the requests to the instance target group and one-third (Weight 10) to the function target group.

Console screenshot.

Then, I add two additional rules. The first rule (Priority 10) sends all requests where the path is /to-instance to the instance target group.

Console screenshot.

The second rule (Priority 20) sends all traffic where the path is /to-function to the function target group.

Console screenshot.

In the next step, I am asked to associate the service with one or more service networks. I didn’t create a service network yet, so I skip this step for now and choose Next. I review the configuration and create the service.

Creating VPC Lattice Service Networks
Now, I create the service network so that I can associate the service and the VPCs I want to use. I choose Service network from the navigation pane and then Create service network. I enter a name and a description for the service network.

Console screenshot.

In the Associate services, I select the service I just created.

Console screenshot.

In the VPC associations, I select the VPC used by the instance where the web app runs. This can help in the future because it allows the web app to call other services associated with the service network.

Console screenshot.

Then, I select a second VPC where I have another EC2 instance that I want to use to run some tests.

Console screenshot.

For simplicity, in the Access section, I select the None auth type.

Console screenshot.

In the Monitoring section, I choose to send the access logs for the whole service network to an S3 bucket.

Console screenshot.

I review the summary of the configuration and create the service network. After a few seconds all service and VPC associations are active, and I can start using the service.

I write down the domain name of the service from the list of service associations.

Console screenshot.

Testing Access to the Service Using VPC Lattice
I look at the Routing tab of the service to find a nice recap of how the listener is handling routing towards the different target groups.

Console screenshot.

Then, I log into the EC2 instance in my second VPC and use curl to call the service domain name. As expected, I get about two-thirds of the responses from the instance and one-third from the function.

curl https://my-service-03e92ee54968d87ca.7d67968.vpc-lattice-svcs.us-west-2.on.aws
Hello from the instance

curl https://my-service-03e92ee54968d87ca.7d67968.vpc-lattice-svcs.us-west-2.on.aws
Hello from the instance

curl https://my-service-03e92ee54968d87ca.7d67968.vpc-lattice-svcs.us-west-2.on.aws
"Hello from the function"

When I call the /to-instance and /to-function paths, the additional rules forward the requests to the instance and the function, respectively.

curl https://my-service-03e92ee54968d87ca.7d67968.vpc-lattice-svcs.us-west-2.on.aws/to-instance
Hello from the instance "to-instance" path

curl https://my-service-03e92ee54968d87ca.7d67968.vpc-lattice-svcs.us-west-2.on.aws/to-function
"Hello from the function"

I can now review access to my service using the access log subscriptions I configured before.

For the service, I look in the CloudWatch Log group. There, I find a log stream containing detailed access information about the service.

Console screenshot.

The access log for all services associated with the service network is on the S3 bucket. I have only one service for now, but more are coming.

Console screenshot.

Available in Preview
Amazon VPC Lattice is available in preview in the US West (Oregon) Region.

VPC Lattice provides deployment consistency across AWS compute types so that you can connect your services across instances, containers, and serverless functions. You can use VPC Lattice to apply granular and rich traffic controls, such as policy-based routing and weighted targets to support blue/green and canary-style deployments.

VPC Lattice allows monitoring and troubleshooting service-to-service communication with detailed access logs and metrics that capture request type, volume of traffic, error rates, response time, and more. In this blog post, I only scratched the surface of what you can do with VPC Lattice.

Simplify the way you connect, secure, and monitor service-to-service communication with Amazon VPC Lattice.

New for Amazon Redshift – General Availability of Streaming Ingestion for Kinesis Data Streams and Managed Streaming for Apache Kafka

Post Syndicated from Danilo Poccia original https://aws.amazon.com/blogs/aws/new-for-amazon-redshift-general-availability-of-streaming-ingestion-for-kinesis-data-streams-and-managed-streaming-for-apache-kafka/

Ten years ago, just a few months after I joined AWS, Amazon Redshift was launched. Over the years, many features have been added to improve performance and make it easier to use. Amazon Redshift now allows you to analyze structured and semi-structured data across data warehouses, operational databases, and data lakes. More recently, Amazon Redshift Serverless became generally available to make it easier to run and scale analytics without having to manage your data warehouse infrastructure.

To process data as quickly as possible from real-time applications, customers are adopting streaming engines like Amazon Kinesis and Amazon Managed Streaming for Apache Kafka. Previously, to load streaming data into your Amazon Redshift database, you’d have to configure a process to stage data in Amazon Simple Storage Service (Amazon S3) before loading. Doing so would introduce a latency of one minute or more, depending on the volume of data.

Today, I am happy to share the general availability of Amazon Redshift Streaming Ingestion. With this new capability, Amazon Redshift can natively ingest hundreds of megabytes of data per second from Amazon Kinesis Data Streams and Amazon MSK into an Amazon Redshift materialized view and query it in seconds.

Architecture diagram.

Streaming ingestion benefits from the ability to optimize query performance with materialized views and allows the use of Amazon Redshift more efficiently for operational analytics and as the data source for real-time dashboards. Another interesting use case for streaming ingestion is analyzing real-time data from gamers to optimize their gaming experience. This new integration also makes it easier to implement analytics for IoT devices, clickstream analysis, application monitoring, fraud detection, and live leaderboards.

Let’s see how this works in practice.

Configuring Amazon Redshift Streaming Ingestion
Apart from managing permissions, Amazon Redshift streaming ingestion can be configured entirely with SQL within Amazon Redshift. This is especially useful for business users who lack access to the AWS Management Console or the expertise to configure integrations between AWS services.

You can set up streaming ingestion in three steps:

  1. Create or update an AWS Identity and Access Management (IAM) role to allow access to the streaming platform you use (Kinesis Data Streams or Amazon MSK). Note that the IAM role should have a trust policy that allows Amazon Redshift to assume the role.
  2. Create an external schema to connect to the streaming service.
  3. Create a materialized view that references the streaming object (Kinesis data stream or Kafka topic) in the external schemas.

After that, you can query the materialized view to use the data from the stream in your analytics workloads. Streaming ingestion works with Amazon Redshift provisioned clusters and with the new serverless option. To maximize simplicity, I am going to use Amazon Redshift Serverless in this walkthrough.

To prepare my environment, I need a Kinesis data stream. In the Kinesis console, I choose Data streams in the navigation pane and then Create data stream. For the Data stream name, I use my-input-stream and then leave all other options set to their default value. After a few seconds, the Kinesis data stream is ready. Note that by default I am using on-demand capacity mode. In a development or test environment, you can choose provisioned capacity mode with one shard to optimize costs.

Now, I create an IAM role to give Amazon Redshift access to the my-input-stream Kinesis data streams. In the IAM console, I create a role with this policy:

{
    "Version": "2012-10-17",
    "Statement": [
        {
            "Effect": "Allow",
            "Action": [
                "kinesis:DescribeStreamSummary",
                "kinesis:GetShardIterator",
                "kinesis:GetRecords",
                "kinesis:DescribeStream"
            ],
            "Resource": "arn:aws:kinesis:*:123412341234:stream/my-input-stream"
        },
        {
            "Effect": "Allow",
            "Action": [
                "kinesis:ListStreams",
                "kinesis:ListShards"
            ],
            "Resource": "*"
        }
    ]
}

To allow Amazon Redshift to assume the role, I use the following trust policy:

{
    "Version": "2012-10-17",
    "Statement": [
        {
            "Effect": "Allow",
            "Principal": {
                "Service": "redshift.amazonaws.com"
            },
            "Action": "sts:AssumeRole"
        }
    ]
}

In the Amazon Redshift console, I choose Redshift serverless from the navigation pane and create a new workgroup and namespace, similar to what I did in this blog post. When I create the namespace, in the Permissions section, I choose Associate IAM roles from the dropdown menu. Then, I select the role I just created. Note that the role is visible in this selection only if the trust policy allows Amazon Redshift to assume it. After that, I complete the creation of the namespace using the default options. After a few minutes, the serverless database is ready for use.

In the Amazon Redshift console, I choose Query editor v2 in the navigation pane. I connect to the new serverless database by choosing it from the list of resources. Now, I can use SQL to configure streaming ingestion. First, I create an external schema that maps to the streaming service. Because I am going to use simulated IoT data as an example, I call the external schema sensors.

CREATE EXTERNAL SCHEMA sensors
FROM KINESIS
IAM_ROLE 'arn:aws:iam::123412341234:role/redshift-streaming-ingestion';

To access the data in the stream, I create a materialized view that selects data from the stream. In general, materialized views contain a precomputed result set based on the result of a query. In this case, the query is reading from the stream, and Amazon Redshift is the consumer of the stream.

Because streaming data is going to be ingested as JSON data, I have two options:

  1. Leave all the JSON data in a single column and use Amazon Redshift capabilities to query semi-structured data.
  2. Extract JSON properties into their own separate columns.

Let’s see the pros and cons of both options.

The approximate_arrival_timestamp, partition_key, shard_id, and sequence_number columns in the SELECT statement are provided by Kinesis Data Streams. The record from the stream is in the kinesis_data column. The refresh_time column is provided by Amazon Redshift.

To leave the JSON data in a single column of the sensor_data materialized view, I use the JSON_PARSE function:

CREATE MATERIALIZED VIEW sensor_data AUTO REFRESH YES AS
    SELECT approximate_arrival_timestamp,
           partition_key,
           shard_id,
           sequence_number,
           refresh_time,
           JSON_PARSE(kinesis_data, 'utf-8') as payload    
      FROM sensors."my-input-stream";
CREATE MATERIALIZED VIEW sensor_data AUTO REFRESH YES AS
SELECT approximate_arrival_timestamp,
partition_key,
shard_id,
sequence_number,
refresh_time,
JSON_PARSE(kinesis_data) as payload 
FROM sensors."my-input-stream";

Because I used the AUTO REFRESH YES parameter, the content of the materialized view is automatically refreshed when there is new data in the stream.

To extract the JSON properties into separate columns of the sensor_data_extract materialized view, I use the JSON_EXTRACT_PATH_TEXT function:

CREATE MATERIALIZED VIEW sensor_data_extract AUTO REFRESH YES AS
    SELECT approximate_arrival_timestamp,
           partition_key,
           shard_id,
           sequence_number,
           refresh_time,
           JSON_EXTRACT_PATH_TEXT(FROM_VARBYTE(kinesis_data, 'utf-8'),'sensor_id')::VARCHAR(8) as sensor_id,
           JSON_EXTRACT_PATH_TEXT(FROM_VARBYTE(kinesis_data, 'utf-8'),'current_temperature')::DECIMAL(10,2) as current_temperature,
           JSON_EXTRACT_PATH_TEXT(FROM_VARBYTE(kinesis_data, 'utf-8'),'status')::VARCHAR(8) as status,
           JSON_EXTRACT_PATH_TEXT(FROM_VARBYTE(kinesis_data, 'utf-8'),'event_time')::CHARACTER(26) as event_time
      FROM sensors."my-input-stream";

Loading Data into the Kinesis Data Stream
To put data in the my-input-stream Kinesis Data Stream, I use the following random_data_generator.py Python script simulating data from IoT sensors:

import datetime
import json
import random
import boto3

STREAM_NAME = "my-input-stream"


def get_random_data():
    current_temperature = round(10 + random.random() * 170, 2)
    if current_temperature > 160:
        status = "ERROR"
    elif current_temperature > 140 or random.randrange(1, 100) > 80:
        status = random.choice(["WARNING","ERROR"])
    else:
        status = "OK"
    return {
        'sensor_id': random.randrange(1, 100),
        'current_temperature': current_temperature,
        'status': status,
        'event_time': datetime.datetime.now().isoformat()
    }


def send_data(stream_name, kinesis_client):
    while True:
        data = get_random_data()
        partition_key = str(data["sensor_id"])
        print(data)
        kinesis_client.put_record(
            StreamName=stream_name,
            Data=json.dumps(data),
            PartitionKey=partition_key)


if __name__ == '__main__':
    kinesis_client = boto3.client('kinesis')
    send_data(STREAM_NAME, kinesis_client)

I start the script and see the records that are being put in the stream. They use a JSON syntax and contain random data.

$ python3 random_data_generator.py
{'sensor_id': 66, 'current_temperature': 69.67, 'status': 'OK', 'event_time': '2022-11-20T18:31:30.693395'}
{'sensor_id': 45, 'current_temperature': 122.57, 'status': 'OK', 'event_time': '2022-11-20T18:31:31.486649'}
{'sensor_id': 15, 'current_temperature': 101.64, 'status': 'OK', 'event_time': '2022-11-20T18:31:31.671593'}
...

Querying Streaming Data from Amazon Redshift
To compare the two materialized views, I select the first ten rows from each of them:

  • In the sensor_data materialized view, the JSON data in the stream is in the payload column. I can use Amazon Redshift JSON functions to access data stored in JSON format.Console screenshot.
  • In the sensor_data_extract materialized view, the JSON data in the stream has been extracted into different columns: sensor_id, current_temperature, status, and event_time.Console screenshot.

Now I can use the data in these views in my analytics workloads together with the data in my data warehouse, my operational databases, and my data lake. I can use the data in these views together with Redshift ML to train a machine learning model or use predictive analytics. Because materialized views support incremental updates, the data in these views can be efficiently used as a data source for dashboards, for example, using Amazon Redshift as a data source for Amazon Managed Grafana.

Availability and Pricing
Amazon Redshift streaming ingestion for Kinesis Data Streams and Managed Streaming for Apache Kafka is generally available today in all commercial AWS Regions.

There are no additional costs for using Amazon Redshift streaming ingestion. For more information, see Amazon Redshift pricing.

It’s never been easier to use low-latency streaming data in your data warehouse and in your data lake. Let us know what you build with this new capability!

Danilo

New – AWS Config Rules Now Support Proactive Compliance

Post Syndicated from Danilo Poccia original https://aws.amazon.com/blogs/aws/new-aws-config-rules-now-support-proactive-compliance/

When operating a business, you have to find the right balance between speed and control for your cloud operations. On one side, you want to have the ability to quickly provision the cloud resources you need for your applications. At the same time, depending on your industry, you need to maintain compliance with regulatory, security, and operational best practices.

AWS Config provides rules, which you can run in detective mode to evaluate if the configuration settings of your AWS resources are compliant with your desired configuration settings. Today, we are extending AWS Config rules to support proactive mode so that they can be run at any time before provisioning and save time spent to implement custom pre-deployment validations.

When creating standard resource templates, platform teams can run AWS Config rules in proactive mode so that they can be tested to be compliant before being shared across your organization. When implementing a new service or a new functionality, development teams can run rules in proactive mode as part of their continuous integration and continuous delivery (CI/CD) pipeline to identify noncompliant resources.

You can also use AWS CloudFormation Guard in your deployment pipelines to check for compliance proactively and ensure that a consistent set of policies are applied both before and after resources are provisioned.

Let’s see how this works in practice.

Using Proactive Compliance with AWS Config
In the AWS Config console, I choose Rules in the navigation pane. In the rules table, I see the new Enabled evaluation mode column that specifies whether the rule is proactive or detective. Let’s set up my first rule.

Console screenshot.

I choose Add rule, and then I enter rds-storage in the AWS Managed Rules search box to find the rds-storage-encrypted rule. This rule checks whether storage encryption is enabled for your Amazon Relational Database Service (RDS) DB instances and can be added in proactive or detective evaluation mode. I choose Next.

Console screenshot.

In the Evaluation mode section, I turn on proactive evaluation. Now both the proactive and detective evaluation switches are enabled.

Console screenshot.

I leave all the other settings to their default values and choose Next. In the next step, I review the configuration and add the rule.

Console screenshot.

Now, I can use proactive compliance via the AWS Config API (including the AWS Command Line Interface (CLI) and AWS SDKs) or with CloudFormation Guard. In my CI/CD pipeline, I can use the AWS Config API to check the compliance of a resource before creating it. When deploying using AWS CloudFormation, I can set up a CloudFormation hook to proactively check my configuration before the actual deployment happens.

Let’s do an example using the AWS CLI. First, I call the StartProactiveEvaluationResponse API with in input the resource ID (for reference only), the resource type, and its configuration using the CloudFormation schema. For simplicity, in the database configuration, I only use the StorageEncrypted option and set it to true to pass the evaluation. I use an evaluation timeout of 60 seconds, which is more than enough for this rule.

aws configservice start-resource-evaluation --evaluation-mode PROACTIVE \
    --resource-details '{"ResourceId":"myDB",
                         "ResourceType":"AWS::RDS::DBInstance",
                         "ResourceConfiguration":"{\"StorageEncrypted\":true}",
                         "ResourceConfigurationSchemaType":"CFN_RESOURCE_SCHEMA"}' \
    --evaluation-timeout 60
{
    "ResourceEvaluationId": "be2a915a-540d-4595-ac7b-e105e39b7980-1847cb6320d"
}

I get back in output the ResourceEvaluationId that I use to check the evaluation status using the GetResourceEvaluationSummary API. In the beginning, the evaluation is IN_PROGRESS. It usually takes a few seconds to get a COMPLIANT or NON_COMPLIANT result.

aws configservice get-resource-evaluation-summary \
    --resource-evaluation-id be2a915a-540d-4595-ac7b-e105e39b7980-1847cb6320d
{
    "ResourceEvaluationId": "be2a915a-540d-4595-ac7b-e105e39b7980-1847cb6320d",
    "EvaluationMode": "PROACTIVE",
    "EvaluationStatus": {
        "Status": "SUCCEEDED"
    },
    "EvaluationStartTimestamp": "2022-11-15T19:13:46.029000+00:00",
    "Compliance": "COMPLIANT",
    "ResourceDetails": {
        "ResourceId": "myDB",
        "ResourceType": "AWS::RDS::DBInstance",
        "ResourceConfiguration": "{\"StorageEncrypted\":true}"
    }
}

As expected, the Amazon RDS configuration is compliant to the rds-storage-encrypted rule. If I repeat the previous steps with StorageEncrypted set to false, I get a noncompliant result.

If more than one rule is enabled for a resource type, all applicable rules are run in proactive mode for the resource evaluation. To find out individual rule-level compliance for the resource, I can call the GetComplianceDetailsByResource API:

aws configservice get-compliance-details-by-resource \
    --resource-evaluation-id be2a915a-540d-4595-ac7b-e105e39b7980-1847cb6320d
{
    "EvaluationResults": [
        {
            "EvaluationResultIdentifier": {
                "EvaluationResultQualifier": {
                    "ConfigRuleName": "rds-storage-encrypted",
                    "ResourceType": "AWS::RDS::DBInstance",
                    "ResourceId": "myDB",
                    "EvaluationMode": "PROACTIVE"
                },
                "OrderingTimestamp": "2022-11-15T19:14:42.588000+00:00",
                "ResourceEvaluationId": "be2a915a-540d-4595-ac7b-e105e39b7980-1847cb6320d"
            },
            "ComplianceType": "COMPLIANT",
            "ResultRecordedTime": "2022-11-15T19:14:55.588000+00:00",
            "ConfigRuleInvokedTime": "2022-11-15T19:14:42.588000+00:00"
        }
    ]
}

If, when looking at these details, your desired rule is not invoked, be sure to check that proactive mode is turned on.

Availability and Pricing
Proactive compliance will be available in all commercial AWS Regions where AWS Config is offered but it might take a few days to deploy this new capability across all these Regions. I’ll update this post when this deployment is complete. To see which AWS Config rules can be turned into proactive mode, see the Developer Guide.

You are charged based on the number of AWS Config rule evaluations recorded. A rule evaluation is recorded every time a resource is evaluated for compliance against an AWS Config rule. Rule evaluations can be run in detective mode and/or in proactive mode, if available. If you are running a rule in both detective mode and proactive mode, you will be charged for only the evaluations in detective mode. For more information, see AWS Config pricing.

With this new feature, you can use AWS Config to check your rules before provisioning and avoid implementing your own custom validations.

Danilo

New for AWS Control Tower – Comprehensive Controls Management (Preview)

Post Syndicated from Danilo Poccia original https://aws.amazon.com/blogs/aws/new-for-aws-control-tower-comprehensive-controls-management-preview/

Today, customers in regulated industries face the challenge of defining and enforcing controls needed to meet compliance and security requirements while empowering engineers to make their design choices. In addition to addressing risk, reliability, performance, and resiliency requirements, organizations may also need to comply with frameworks and standards such as PCI DSS and NIST 800-53.

Building controls that account for service relationships and their dependencies is time-consuming and expensive. Sometimes customers restrict engineering access to AWS services and features until their cloud architects identify risks and implement their own controls.

To make that easier, today we are launching comprehensive controls management in AWS Control Tower. You can use it to apply managed preventative, detective, and proactive controls to accounts and organizational units (OUs) by service, control objective, or compliance framework. AWS Control Tower does the mapping between them on your behalf, saving time and effort.

With this new capability, you can now also use AWS Control Tower to turn on AWS Security Hub detective controls across all accounts in an OU. In this way, Security Hub controls are enabled in every AWS Region that AWS Control Tower governs.

Let’s see how this works in practice.

Using AWS Control Tower Comprehensive Controls Management
In the AWS Control Tower console, there is a new Controls library section. There, I choose All controls. There are now more than three hundred controls available. For each control, I see which AWS service it is related to, the control objective this control is part of, the implementation (such as AWS Config rule or AWS CloudFormation Guard rule), the behavior (preventive, detective, or proactive), and the frameworks it maps to (such as NIST 800-53 or PCI DSS).

Console screenshot.

In the Find controls search box, I look for a preventive control called CT.CLOUDFORMATION.PR.1. This control uses a service control policy (SCP) to protect controls that use CloudFormation hooks and is required by the control that I want to turn on next. Then, I choose Enable control.

Console screenshot.

Then, I select the OU for which I want to enable this control.

Console screenshot.

Now that I have set up this control, let’s see how controls are presented in the console in categories. I choose Categories in the navigation pane. There, I can browse controls grouped as Frameworks, Services, and Control objectives. By default, the Frameworks tab is selected.

Console screenshot.

I select a framework (for example, PCI DSS version 3.2.1) to see all the related controls and control objectives. To implement a control, I can select the control from the list and choose Enable control.

Console screenshot.

I can also manage controls by AWS service. When I select the Services tab, I see a list of AWS services and the related control objectives and controls.

Console screenshot.

I choose Amazon DynamoDB to see the controls that I can turn on for this service.

Console screenshot.

I select the Control objectives tab. When I need to assess a control objective, this is where I have access to the list of related controls to turn on.

Console screenshot.

I choose Encrypt data at rest to see and search through the available controls for that control objective. I can also check which services are covered in this specific case. I type RDS in the search bar to find the controls related to Amazon Relational Database Service (RDS) for this control objective.

I choose CT.RDS.PR.16 – Require an Amazon RDS database cluster to have encryption at rest configured and then Enable control.

Console screenshot.

I select the OU for which I want to enable the control for, and I proceed. All the AWS accounts in this organization’s OU will have this control enabled in all the Regions that AWS Control Tower governs.

Console screenshot.

After a few minutes, the AWS Control Tower setup is updated. Now, the accounts in this OU have proactive control CT.RDS.PR.16 turned on. When an account in this OU deploys a CloudFormation stack, any Amazon RDS database cluster has to have encryption at rest configured. Because this control is proactive, it’ll be checked by a CloudFormation hook before the deployment starts. This saves a lot of time compared to a detective control that would find the issue only when the CloudFormation deployment is in progress or has terminated. This also improves my security posture by preventing something that’s not allowed as opposed to reacting to it after the fact.

Availability and Pricing
Comprehensive controls management is available in preview today in all AWS Regions where AWS Control Tower is offered. These enhanced control capabilities reduce the time it takes you to vet AWS services from months or weeks to minutes. They help you use AWS by undertaking the heavy burden of defining, mapping, and managing the controls required to meet the most common control objectives and regulations.

There is no additional charge to use these new capabilities during the preview. However, when you set up AWS Control Tower, you will begin to incur costs for AWS services configured to set up your landing zone and mandatory controls. For more information, see AWS Control Tower pricing.

Simplify how you implement compliance and security requirements with AWS Control Tower.

Danilo

New – Amazon CloudWatch Cross-Account Observability

Post Syndicated from Danilo Poccia original https://aws.amazon.com/blogs/aws/new-amazon-cloudwatch-cross-account-observability/

Deploying applications using multiple AWS accounts is a good practice to establish security and billing boundaries between teams and reduce the impact of operational events. When you adopt a multi-account strategy, you have to analyze telemetry data that is scattered across several accounts. To give you the flexibility to monitor all the components of your applications from a centralized view, we are introducing today Amazon CloudWatch cross-account observability, a new capability to search, analyze, and correlate cross-account telemetry data stored in CloudWatch such as metrics, logs, and traces.

You can now set up a central monitoring AWS account and connect your other accounts as sources. Then, you can search, audit, and analyze logs across your applications to drill down into operational issues in a matter of seconds. You can discover and visualize metrics from many accounts in a single place and create alarms that evaluate metrics belonging to other accounts. You can start with an aggregated cross-account view of your application to visually identify the resources exhibiting errors and dive deep into correlated traces, metrics, and logs to find the root cause. This seamless cross-account data access and navigation helps reduce the time and effort required to troubleshoot issues.

Let’s see how this works in practice.

Configuring CloudWatch Cross-Account Observability
To enable cross-account observability, CloudWatch has introduced the concept of monitoring and source accounts:

  • A monitoring account is a central AWS account that can view and interact with observability data shared by other accounts.
  • A source account is an individual AWS account that shares observability data and resources with one or more monitoring accounts.

You can configure multiple monitoring accounts with the level of visibility you need. CloudWatch cross-account observability is also integrated with AWS Organizations. For example, I can have a monitoring account with wide access to all accounts in my organization for central security and operational teams and then configure other monitoring accounts with more restricted visibility across a business unit for individual service owners.

First, I configure the monitoring account. In the CloudWatch console, I choose Settings in the navigation pane. In the Monitoring account configuration section, I choose Configure.

Console screenshot.

Now I can choose which telemetry data can be shared with the monitoring account: Logs, Metrics, and Traces. I leave all three enabled.

Console screenshot.

To list the source accounts that will share data with this monitoring account, I can use account IDs, organization IDs, or organization paths. I can use an organization ID to include all the accounts in the organization or an organization path to include all the accounts in a department or business unit. In my case, I have only one source account to link, so I enter the account ID.

Console screenshot.

When using the CloudWatch console in the monitoring account to search and display telemetry data, I see the account ID that shared that data. Because account IDs are not easy to remember, I can display a more descriptive “account label.” When configuring the label via the console, I can choose between the account name or the email address used to identify the account. When using an email address, I can also choose whether to include the domain. For example, if all the emails used to identify my accounts are using the same domain, I can use as labels the email addresses without that domain.

There is a quick reminder that cross-account observability only works in the selected Region. If I have resources in multiple Regions, I can configure cross-account observability in each Region. To complete the configuration of the monitoring account, I choose Configure.

Console screenshot.

The monitoring account is now enabled, and I choose Resources to link accounts to determine how to link my source accounts.

Console screenshot.

To link source accounts in an AWS organization, I can download an AWS CloudFormation template to be deployed in a CloudFormation delegated administration account.

To link individual accounts, I can either download a CloudFormation template to be deployed in each account or copy a URL that helps me use the console to set up the accounts. I copy the URL and paste it into another browser where I am signed in as the source account. Then, I can configure which telemetry data to share (logs, metrics, or traces). The Amazon Resource Name (ARN) of the monitoring account configuration is pre-filled because I copy-pasted the URL in the previous step. If I don’t use the URL, I can copy the ARN from the monitoring account and paste it here. I confirm the label used to identify my source account and choose Link.

In the Confirm monitoring account permission dialog, I type Confirm to complete the configuration of the source account.

Using CloudWatch Cross-Account Observability
To see how things work with cross-account observability, I deploy a simple cross-account application using two AWS Lambda functions, one in the source account (multi-account-function-a) and one in the monitoring account (multi-account-function-b). When triggered, the function in the source account publishes an event to an Amazon EventBridge event bus in the monitoring account. There, an EventBridge rule triggers the execution of the function in the monitoring account. This is a simplified setup using only two accounts. You’d probably have your workloads running in multiple source accounts.Architectural diagram.

In the Lambda console, the two Lambda functions have Active tracing and Enhanced monitoring enabled. To collect telemetry data, I use the AWS Distro for OpenTelemetry (ADOT) Lambda layer. The Enhanced monitoring option turns on Amazon CloudWatch Lambda Insights to collect and aggregate Lambda function runtime performance metrics.

Console screenshot.

I prepare a test event in the Lambda console of the source account. Then, I choose Test and run the function a few times.

Console screenshot.

Now, I want to understand what the components of my application, running in different accounts, are doing. I start with logs and then move to metrics and traces.

In the CloudWatch console of the monitoring account, I choose Log groups in the Logs section of the navigation pane. There, I search for and find the log groups created by the two Lambda functions running in different AWS accounts. As expected, each log group shows the account ID and label originating the data. I select both log groups and choose View in Logs Insights.

Console screenshot.

I can now search and analyze logs from different AWS accounts using the CloudWatch Logs Insights query syntax. For example, I run a simple query to see the last twenty messages in the two log groups. I include the @log field to see the account ID that the log belongs to.

Console screenshot.

I can now also create Contributor Insights rules on cross-account log groups. This enables me, for example, to have a holistic view of what security events are happening across accounts or identify the most expensive Lambda requests in a serverless application running in multiple accounts.

Then, I choose All metrics in the Metrics section of the navigation pane. To see the Lambda function runtime performance metrics collected by CloudWatch Lambda Insights, I choose LambdaInsights and then function_name. There, I search for multi-account and memory to see the memory metrics. Again, I see the account IDs and labels that tell me that these metrics are coming from two different accounts. From here, I can just select the metrics I am interested in and create cross-account dashboards and alarms. With the metrics selected, I choose Add to dashboard in the Actions dropdown.

Console screenshot.

I create a new dashboard and choose the Stacked area widget type. Then, I choose Add to dashboard.

Console screenshot.

I do the same for the CPU and memory metrics (but using different widget types) to quickly create a cross-account dashboard where I can keep under control my multi-account setup. Well, there isn’t a lot of traffic yet but I am hopeful.

Console screenshot.

Finally, I choose Service map from the X-Ray traces section of the navigation pane to see the flow of my multi-account application. In the service map, the client triggers the Lambda function in the source account. Then, an event is sent to the other account to run the other Lambda function.

Console screenshot.

In the service map, I select the gear icon for the function running in the source account (multi-account-function-a) and then View traces to look at the individual traces. The traces contain data from multiple AWS accounts. I can search for traces coming from a specific account using a syntax such as:

service(id(account.id: "123412341234"))

Console screenshot.

The service map now stitches together telemetry from multiple accounts in a single place, delivering a consolidated view to monitor their cross-account applications. This helps me to pinpoint issues quickly and reduces resolution time.

Availability and Pricing
Amazon CloudWatch cross-account observability is available today in all commercial AWS Regions using the AWS Management Console, AWS Command Line Interface (CLI), and AWS SDKs. AWS CloudFormation support is coming in the next few days. Cross-account observability in CloudWatch comes with no extra cost for logs and metrics, and the first trace copy is free. See the Amazon CloudWatch pricing page for details.

Having a central point of view to monitor all the AWS accounts that you use gives you a better understanding of your overall activities and helps solve issues for applications that span multiple accounts.

Start using CloudWatch cross-account observability to monitor all your resources.

Danilo