All posts by James Beswick

Composing AWS Step Functions to abstract polling of asynchronous services

Post Syndicated from James Beswick original https://aws.amazon.com/blogs/compute/composing-aws-step-functions-to-abstract-polling-of-asynchronous-services/

This post is written by Nicolas Jacob Baer, Senior Cloud Application Architect, Goeksel Sarikaya, Senior Cloud Application Architect, and Shukhrat Khodjaev, Engagement Manager, AWS ProServe.

AWS Step Functions workflows can use the three main integration patterns when calling AWS services. A common integration pattern is to call a service and wait for a response before proceeding to the next step.

While this works well with AWS services, there is no built-in support for third-party, on-premises, or custom-built services running on AWS. When a workflow integrates with such a service in an asynchronous fashion, it requires a primary step to invoke the service. There are additional steps to wait and check the result, and handle possible error scenarios, retries, and fallbacks.

Although this approach may work well for small workflows, it does not scale to multiple interactions in different steps of the workflow and becomes repetitive. This may result in a complex workflow, which makes it difficult to build, test, and modify. In addition, large workflows with many repeated steps are more difficult to troubleshoot and understand.

This post demonstrates how to decompose the custom service integration by nesting Step Functions workflows. One basic workflow is dedicated to handling the asynchronous communication that offers modularity. It can be re-used as a building block. Another workflow is used to handle the main process by invoking the nested workflow for service interaction, where all the repeated steps are now hidden in multiple executions of the nested workflow.

Overview

Consider a custom service that provides an asynchronous interface, where an action is initially triggered by an API call. After a few minutes, the result is available to be polled by the caller. The following diagram shows a basic workflow interacting with this custom service that encapsulates the service communication in a workflow:

Workflow diagram

  1. Call Custom Service API – calls a custom service, in this case through an API. Potentially, this could use a service integration or use AWS Lambda if there is custom code.
  2. Wait – waits for the service to prepare a result. This depends on the service that the workflow is interacting with, and could vary from seconds to days to months.
  3. Poll Result – attempts to poll the result from the custom service.
  4. Choice – repeats the polling in case the result was not available yet, move on to failed or success state if result was retrieved. In addition, a timeout should be in place here in case the result is not available within the expected time range. Otherwise, this might lead to an infinite loop.
  5. Fail – fails the workflow if a timeout or a threshold for the number of retries with error conditions is reached.
  6. Transform Result – transforms the result or adds additional meta information to provide further information to the caller (for example, runtime or retries).
  7. Success – finishes the workflow successfully.

If you build a larger workflow that interacts with this custom service in multiple steps in a workflow, you can reduce the complexity by using the Step Functions integration to call the nested workflow with a Wait state.

An illustration of this can be found in the following diagram, where the nested stack is called three times sequentially. Likewise, you can build a more complex workflow that adds additional logic through more steps or interacts with a custom service in parallel. The polling logic is hidden in the nested workflow.

Nested workflow

Walkthrough

To get started with AWS Step Functions and Amazon API Gateway using the AWS Management Console:

  1. Go to AWS Step Functions in the AWS Management Console.
  2. Choose Run a sample project and choose Start a workflow within a workflow.
    Defining state machine
  3. Scroll down to the sample projects, which are defined using Amazon States Language (ASL).
    Definition
  4. Review the example definition, then choose Next.
  5. Choose Deploy resources. The deployment can take up to 10 minutes. After deploying the resources, you can edit the sample ASL code to define steps in the state machine.
    Deploy resources
  6. The deployment creates two state machines: NestingPatternMainStateMachine and NestingPatternAnotherStateMachine. NestingPatternMainStateMachine orchestrates the other nested state machines sequentially or in parallel.
    Two state machines
  7. Select a state machine, then choose Edit to edit the workflow. In the NestingPatternMainStateMachine, the first state triggers the nested workflow NestingPatternAnotherStateMachine. You can pass necessary parameters to the nested workflow by using Parameters and Input as shown in the example below with Parameter1 and Parameter2. Once the first nested workflow completes successfully, the second nested workflow is triggered. If the result of the first nested workflow is not successful, the NestingPatternMainStateMachine fails with the Fail state.
    Editing state machine
  8. Select nested workflow NestingPatternAnotherStateMachine, and then select Edit to add AWS Lambda functions to start a job and poll the state of the jobs. This can be any asynchronous job that needs to be polled to query its state. Based on expected job duration, the Wait state can be configured for 10-20 seconds. If the workflow is successful, the main workflow returns a successful result.
    Edited next state machine

Use cases and limitations

This approach allows encapsulation of workflows consisting of multiple sequential or parallel services. Therefore, it provides flexibility that can be used for different use cases. Services can be part of distributed applications, part of automated business processes, big data or machine learning pipelines using AWS services.

Each nested workflow is responsible for an individual step in the main workflow, providing flexibility and scalability. Hundreds of nested workflows can run and be monitored in parallel with the main workflow (see AWS Step Functions Service Quotas).

The approach described here is not applicable for custom service interactions faster than 1 second, since it is the minimum configurable value for a wait step.

Nested workflow encapsulation

Similar to the principle of encapsulation in object-oriented programming, you can use a nested workflow for different interactions with a custom service. You can dynamically pass input parameters to the nested workflow during workflow execution and receive return values. This way, you can define a clear interface between the nested workflow and the parent workflow with different actions and integrations. Depending on the use-case, a custom service may offer a variety of different actions that must be integrated into workflows that run in Step Functions, but can all be combined into a single workflow.

Debugging and tracing

Additionally, debugging and tracing can be done through Execution Event History in the State Machine Management Console. In the Resource column, you can find a link to the executed nested step function. It can be debugged in case of any error in the nested Step Functions workflow.

Execution event history

However, debugging can be challenging in case of multiple parallel nested workflows. In such cases, AWS X-Ray can be enabled to visualize the components of a state machine, identify performance bottlenecks, and troubleshoot requests that have led to an error.

To enable AWS X-Ray in AWS Step Functions:

  1. Open the Step Functions console and choose Edit state machine.
  2. Scroll down to Tracing settings, and Choose Enable X-Ray tracing.

Tracing

For detailed information regarding AWS X-Ray and AWS Step Functions please refer to the following documentation: https://docs.aws.amazon.com/step-functions/latest/dg/concepts-xray-tracing.html

Conclusion

This blog post describes how to compose a nested Step Functions workflow, which asynchronously manages a custom service using the polling mechanism.

To learn more about how to use AWS Step Functions workflows for serverless microservices orchestration, visit Serverless Land.

Building a serverless image catalog with AWS Step Functions Workflow Studio

Post Syndicated from James Beswick original https://aws.amazon.com/blogs/compute/building-a-serverless-image-catalog-with-aws-step-functions-workflow-studio/

This post is written by Pascal Vogel, Associate Solutions Architect, and Benjamin Meyer, Sr. Solutions Architect.

Workflow Studio is a low-code visual workflow designer for AWS Step Functions that enables the orchestration of serverless workflows through a guided interactive interface. With the integration of Step Functions and the AWS SDK, you can now access more than 200 AWS services and over 9,000 API actions in your state machines.

This walkthrough uses Workflow Studio to implement a serverless image cataloging pipeline. It includes content moderation, automated tagging, and parallel image processing. Workflow Studio allows you to set up API integrations to other AWS services quickly with drag and drop actions, without writing custom application code.

Solution overview

Photo sharing websites often allow users to publish user-generated content such as text, images, or videos. Manual content review and categorization can be challenging. This solution enables the automation of these tasks.

Workflow overview

In this workflow:

  1. An image stored in Amazon S3 is checked for inappropriate content using the Amazon Rekognition DetectModerationLabels API.
  2. Based on the result of (1), appropriate images are forwarded to image processing while inappropriate ones trigger an email notification.
  3. Appropriate images undergo two processing steps in parallel: the detection of objects and text in the image via Amazon Rekognition’s DetectLabels and DetectText APIs. The results of both processing steps are saved in an Amazon DynamoDB table.
  4. An inappropriate image triggers an email notification for manual content moderation via the Amazon Simple Notification Service (SNS).

Prerequisites

To follow this walkthrough, you need:

  1. An AWS account.
  2. An AWS user with AdministratorAccess (see the instructions on the AWS Identity and Access Management (IAM) console).
  3. AWS CLI using the instructions here.
  4. AWS Serverless Application Model (AWS SAM) CLI using the instructions here.

Initial project setup

Get started by cloning the project repository from GitHub:

git clone https://github.com/aws-samples/aws-step-functions-image-catalog-blog.git

The cloned repository contains two AWS SAM templates.

  1. The starter directory contains a template. It deploys AWS resources and permissions that you use later for building the image cataloging workflow.
  2. The solution directory contains a template that deploys the finished image cataloging pipeline. Use this template if you want to skip ahead to the finished solution.

Both templates deploy the following resources to your AWS account:

  • An Amazon S3 bucket that holds the image files for the catalog.
  • A DynamoDB table as the data store of the image catalog.
  • An SNS topic and subscription that allow you to send an email notification.
  • A Step Functions state machine that defines the processing steps in the cataloging pipeline.

To follow the walkthrough, deploy the AWS SAM template in the starter directory using the AWS SAM CLI:

cd aws-step-functions-image-catalog-blog/starter
sam build
sam deploy --guided

Configure the AWS SAM deployment as follows. Input your email address for the parameter ModeratorEmailAddress:

Configuring SAM deploy

During deployment, you receive an email asking you to confirm the subscription to notifications generated by the Step Functions workflow. In the email, choose Confirm subscription to receive these notifications.

Subscription message

Confirm successful resource creation by going to the AWS CloudFormation console. Open the serverless-image-catalog-starter stack and choose the Stack info tab:

CloudFormation stack

View the Outputs tab of the CloudFormation stack. You reference these items later in the walkthrough:

Outputs tab

Implementing the image cataloging pipeline

Accessing Step Functions Workflow Studio

To access Step Functions in Workflow Studio:

  1. Access the Step Functions console.
  2. In the list of State machines, select image-catalog-workflow-starter.
  3. Choose the Edit button.
  4. Choose Workflow Studio.

Workflow Studio

Workflow Studio consists of three main areas:

  1. The Canvas lets you modify the state machine graph via drag and drop.
  2. The States Browser lets you browse and search more than 9,000 API Actions from over 200 AWS services.
  3. The Inspector panel lets you configure the properties of state machine states and displays the Step Functions definition in the Amazon States Language (ASL).

For the purpose of this walkthrough, you can delete the Pass state present in the state machine graph. Right click on it and choose Delete state.

Auto-moderating content with Amazon Rekognition and the Choice State

Use Amazon Rekognition’s DetectModerationLabels API to detect inappropriate content in the images processed by the workflow:

  1. In the States browser, search for the DetectModerationLabels API action.
  2. Drag and drop the API action on the state machine graph on the canvas.

Drag and drop

In the Inspector panel, select the Configuration tab and add the following API Parameters:

{
  "Image": {
    "S3Object": {
      "Bucket.$": "$.bucket",
      "Name.$": "$.key"
    }
  }
}

Switch to the Output tab and check the box next to Add original input to output using ResultPath. This allows you to pass both the original input and the task’s output on to the next state on the state machine graph.

Input the following ResultPath:

$.moderationResult

Step Functions enables you to make decisions based on the output of previous task states via the choice state. Use the result of the DetectModerationLabels API action to decide how to proceed with the image:

  1. Access the Flow tab in the States browser. Drag and drop a Choice state to the state machine graph below the DetectModerationLabels API action.
  2. In the States browser, choose Flow.
  3. Select a Choice state and place it after the DetectModerationLabels state on the graph.
  4. Select the added Choice state.
  5. In the Inspector panel, choose Rule #1 and select Edit.
  6. Choose Add conditions.
  7. For Variable, enter $.moderationResult.ModerationLabels[0].
  8. For Operator, choose is present.
  9. Choose Save conditions.
    Conditions for rule #1

If Amazon Rekognition detects inappropriate content, the workflow notifies content moderators to inspect the image manually:

  1. In the States browser, find the SNS Publish API Action.
  2. Drag the Action into the Rule #1 branch of the Choice state.
  3. For API Parameters, select the SNS topic that is visible in the Outputs of the serverless-image-catalog-starter stack in the CloudFormation console.

SNS topic in Workflow Studio

Speeding up image cataloging with the Parallel state

Appropriate images should be processed and included in the image catalog. In this example, processing includes the automated generation of tags based on objects and text identified in the image.

To accelerate this, instruct Step Functions to perform these tasks concurrently via a Parallel state:

  1. In the States browser, select the Flow tab.
  2. Drag and drop a Parallel state onto the Default branch of the previously added Choice state.
  3. Search the Amazon Rekognition DetectLabels API action in the States browser
  4. Drag and drop it inside the parallel state.
  5. Configure the following API parameters:
    {
      "Image": {
        "S3Object": {
          "Bucket.$": "$.bucket",
          "Name.$": "$.key"
        }
      }
    }
    
  6. Switch to the Output tab and check the box next to Add original input to output using ResultPath. Set the ResultPath to $.output.

Record the results of the Amazon Rekognition DetectLabels API Action to the DynamoDB database:

  1. Place a DynamoDB UpdateItem API Action inside the Parallel state below the Amazon Rekognition DetectLabels API action.
  2. Configure the following API Parameters to save the tags to the DynamoDB table. Input the name of the DynamoDB table visible in the Outputs of the serverless-image-catalog-starter stack in the CloudFormation console:
{
  "TableName": "<DynamoDB table name>",
  "Key": {
    "Id": {
      "S.$": "$.key"
    }
  },
  "UpdateExpression": "set detectedObjects=:o",
  "ExpressionAttributeValues": {
    ":o": {
      "S.$": "States.JsonToString($.output.Labels)"
    }
  }
}

This API parameter definition makes use of an intrinsic function to convert the list of objects identified by Amazon Rekognition from JSON to String.

Intrinsic functions

In addition to objects, you also want to identify text in images and store it in the database. To do so:

  1. Drag and drop an Amazon Rekognition DetectText API action into the Parallel state next to the DetectLabels Action.
  2. Configure the API Parameters and ResultPath identical to the DetectLabels API Action.
  3. Place another DynamoDB UpdateItem API Action inside the Parallel state below the Amazon Rekognition DetectText API Action. Set the following API Parameters and input the same DynamoDB table name as before.
{
  "TableName": "<DynamoDB table name>",
  "Key": {
    "Id": {
      "S.$": "$.key"
    }
  },
  "UpdateExpression": "set detectedText=:t",
  "ExpressionAttributeValues": {
    ":t": {
      "S.$": "States.JsonToString($.output.TextDetections)"
    }
  }
}

To save the state machine:

  1. Choose Apply and exit.
  2. Choose Save.
  3. Choose Save anyway.

Finishing up and testing the image cataloging workflow

To test the image cataloging workflow, upload an image to the S3 bucket created as part of the initial project setup. Find the name of the bucket in the Outputs of the serverless-image-catalog-starter stack in the CloudFormation console.

  1. Select the image-catalog-workflow-starter state machine in the Step Functions console.
  2. Choose Start execution.
  3. Paste the following test event (use your S3 bucket name):
    {
        "bucket": "<S3-bucket-name>",
        "key": "<Image-name>.jpeg"
    }
    
  4. Choose Start execution.

Once the execution has started, you can follow the state of the state machine live in the Graph inspector. For an appropriate image, the result will look as follows:

Graph inspector

Next, repeat the test process with an image that Amazon Rekognition classifies as inappropriate. Find out more about inappropriate content categories here. This produces the following result:

Graph inspector

You receive an email notifying you regarding the inappropriate image and its properties.

Cleaning up

To clean up the resources provisioned as part of the solution run the following command in the aws-step-functions-image-catalog-blog/starter directory:

sam delete

Conclusion

This blog post demonstrates how to implement a serverless image cataloging pipeline using Step Functions Workflow Studio. By orchestrating AWS API actions and flow states via drag and drop, you can process user-generated images. This example checks images for appropriateness and generates tags based on their content without custom application code.

You can now expand and improve this workflow by triggering it automatically each time an image is uploaded to the Amazon S3 bucket or by adding a manual approval step for submitted content. To find out more about Workflow Studio, visit the AWS Step Functions Developer Guide.

For more serverless learning resources, visit Serverless Land.

Decoding protobuf messages using AWS Lambda

Post Syndicated from James Beswick original https://aws.amazon.com/blogs/compute/decoding-protobuf-messages-using-aws-lambda/

This post is written by Ennio Pastore, Data Lab Architect.

Protobuf is short for protocol buffers, which are language- and platform-neutral mechanisms for serializing structured data. Compared to XML or JSON the size of the messages is smaller, so the network transfer is faster, reducing latency in the interactions between applications. They are commonly used in communications protocols like RPC systems, for persistent storage of data in a variety of storage systems, and in use-cases ranging from data analysis pipelines to mobile clients.

Since the protobuf messages are encoded in a binary format, they are non-human readable and in order to be processed you have to decode them. You define how you want your data to be structured once, then you can use generated source code to read and write structured data more easily. You can use a variety of languages to read and write data from a variety of data streams. Currently the supported languages are C++, C#, Dart, Go, Java, Kotlin, Python.

This blog post shows you how to decode protobuf messages in a data stream processing application using AWS Lambda functions.

Overview

Solution architecture

This example assumes you are already receiving protobuf messages in an Amazon Kinesis Data Streams.

You will learn how to deploy a Lambda function that decodes protobuf messages and store them in JSON format in an Amazon S3 bucket.

To achieve this, create an AWS Lambda layer (step 1) containing the protobuf libraries that are required for the decoding. You can use any development environment where you can install Python 3.x and pip to create the Lambda layers.

After creating the layer, you can include it in the Lambda function (step 2) and you can implement the logic to decode the messages.

Prerequisites

You need the following prerequisites to deploy the solution:

To generate the Python source code required to decode protobuf data, you need a development environment with Python (3.x) and pip already installed.

You can use a local machine, an Amazon EC2 instance, or if you cannot install Python locally, use AWS Cloud9.

Generation of the Python source code for protobuf

Generate the Python source code required for the protobuf encoding and decoding, starting from the proto definition file. This code can be generated using the protobuf compiler from the proto definition file.

  1. Create the proto definition file:
    cat > /home/ec2-user/environment/demo.proto << ENDOFFILE
    syntax = "proto3";
    message demo {
      optional int32 id = 1;
      optional string name = 2;
      optional int32 timevalue = 3;
      optional string event = 4;
    }
    ENDOFFILE 
    
  2. Compile this file with the protobuf compiler (protoc) to generate the Python source code required for the protobuf encoding/decoding. The generated code only works for the classes defined in the proto definition file.
    wget 
    https://github.com/protocolbuffers/protobuf/releases/download/v3.19.1/protoc-3.19.1-linux-x86_64.zip
    
    unzip protoc-3.19.1-linux-x86_64.zip
    
    mkdir /home/ec2-user/environment/output
    
    /home/ec2-user/environment/bin/protoc -I=/home/ec2-user/environment/ --python_out=/home/ec2-user/environment/output demo.proto
    

Create the Lambda layer

  1. In your development environment, in the output directory, create a new directory named protobuf. Install the protobuf libraries locally:
    mkdir -p ~/environment/output/protobuf
    cd ~/environment/output/protobuf
    mkdir python
    cd python
    pip3 install protobuf --target .
    
  2. Include the Python source code to the libraries installed locally:
    mkdir custom
    cd custom
    cp ~/environment/output/demo_pb2.py .
    echo 'custom' >> ~/environment/output/protobuf/python/protobuf-3.19.1.dist-info/namespace_packages.txt
    echo 'custom/demo_pb2.py' >> ~/environment/output/protobuf/python/protobuf-3.19.1.dist-info/RECORD
    echo 'custom' >> ~/environment/output/protobuf/python/protobuf-3.19.1.dist-info/top_level.txt
    
  3. Zip the Python folder:
    cd ~/environment/output/protobuf
    zip -r protobuf.zip .
    
  4. The Lambda layer is ready. If you built it on a remote instance, you must download it in your local machine.

Step 4: Adding the Protobuf Layer to Lambda

Add the layer created in the previous steps to Lambda:

  1. From the AWS Management Console select the Lambda service and choose Create a Layer:
    Creation of the Lambda layer
  2. Enter the name protobuf-lambda and upload the protobuf.zip that you created in the previous step.
  3. Once the upload is complete, select x86_64 compatible architecture and select the corresponding Python runtime versions.

Implementation

The full source of the solution is in the GitHub repository and is deployed with AWS SAM.

  1. Clone the solution repository using git:
    git clone https://github.com/aws-samples/lambda-protobuf-decoder
  2. Build the AWS SAM project:
    sam build
  3. Deploy the project using AWS SAM and the AWS SAM CLI. Follow the prompts, entering:
    1. The name of the Kinesis Data Stream containing the protobuf messages
    2. The name of the S3 Bucket that will be used to store the decoded messages
    3. The name of your previously created AWS Lambda layer.For all other prompts select “Y”.
  4. Deploy the project using AWS SAM:
    sam deploy --guided --capabilities CAPABILITY_NAMED_IAM

SAM output

The stack is complete when the message “Successfully created/updated stack”. If the stack fails, find the resources that failed to create and troubleshoot any issues.

Success message

Testing the AWS SAM stack

  1. Once the AWS SAM stack is successfully deployed, navigate to the Lambda service and choose “protobuf-decoder-lambda”.
    Choose function
  2. Choose the “Monitoring” tab, then “View logs in CloudWatch”:
    View logs in CloudWatch
  3. Select the top Log stream from the list. The logs show for each message the original protobuf message and the decoded message:
    Log messages

Check that all the messages are stored correctly in JSON format in the S3 bucket:

  1. Navigate to the Amazon S3 console and find the destination bucket you specified in the AWS SAM template.
    S3 objects
  2. There are multiple files. Select one and choose Actions -> Query with S3 Select.
    Select multiple objects
  3. In the “Input settings” panel and “Output settings” panels, for the “Format” options, select the value JSON.
    JSON selection #1
  4. In the “SQL query” panel, using the default query, choose Run SQL Query. You can see that the content of the object in the S3 bucket is a JSON message.
    SQL query

Cleaning up

If you have generated any events, empty the S3 bucket before deleting the entire stack. If you do not, the data will not be deleted.

To delete the stack, use the AWS SAM CLI. Assuming the stack name is protodecoder, run:

sam delete --stack-name protodecoder

Conclusion

This post shows how to create a Lambda function to decode in real-time protobuf messages. You import the proto message definition in a development environment and compile it to generate the Python source code.

You create the Lambda layer for the protobuf decoding Lambda function, integrating the Python source code previously created with the protobuf libraries. Using AWS SAM, you create the Lambda function including the protobuf libraries.

If you want to dig deeper into Lambda functions, see What is AWS Lambda? To extend the Lambda function to interact with multiple AWS services, see the Boto3 documentation.

For more serverless learning resources, visit Serverless Land.

Migrating a monolithic .NET REST API to AWS Lambda

Post Syndicated from James Beswick original https://aws.amazon.com/blogs/compute/migrating-a-monolithic-net-rest-api-to-aws-lambda/

This post is written by James Eastham, Cloud Infrastructure Architect.

There are many ways to deploy a .NET application to AWS. From a single process ASP.NET core web API hosted on an EC2 instance to a serverless API backed by AWS Lambda. This post explains key topics to simplify your move from monolith to serverless.

The .NET Framework launched in 2002. This means that there are years’ worth of existing .NET application code that can benefit from moving to a serverless architecture. With the release of the AWS Porting Assistant for .NET and the AWS Microsoft Extractor for .NET, AWS tooling can assist directly with this modernization.

These tools help modernization but don’t migrate the compute layer from traditional servers to serverless technology.

Hexagonal architecture

The hexagonal architecture pattern proposes the division of a system into loosely coupled and interchangeable components. The application and business logic sit at the core of the application.

Layers of a hexagonal architecture

The next layer up is a set of interfaces that handle bidirectional communication from the core business logic layer. Implementation details are moved to the outside. The inputs (API controllers, UI, consoles, test scripts) and outputs (database implementations, message bus interactions) are at the perimeter.

The chosen compute layer becomes an implementation detail, not a core part of the system. It allows a cleaner process for migrating any integrations, from the frontend, to the compute layer and underlying database engine.

Code examples

The GitHub repo contains the code examples from this post with instructions for deploying the migrated serverless application.

The repository contains a .NET core REST API. It uses MySQL for its database engine and relies on an external API as part of its business logic. It also contains a migrated serverless version of the same application that you can deploy to your AWS account. This uses a combination of the AWS Cloud Development Kit (CDK) and the AWS Serverless Application Model (AWS SAM) CLI.

The architecture of the deployed monolithic application is:

Architecture of the deployed monolithic application

After migrating the application to Lambda, the architecture is:

Architecture after migrating

Integrations

Modern web applications rely on databases, file systems, and even other applications. With first class support for dependency injection in .NET Core, managing these integrations is simpler.

The following code snippet is taken from the BookingController.cs file. It shows how required interfaces are injected into the constructor of the controller. One of the controller methods uses the injected interface to list bookings from the BookingRepository.

    [ApiController]
    [Route("[controller]")]
    public class BookingController : ControllerBase
    {
        private readonly ILogger<BookingController> _logger;
        private readonly IBookingRepository _bookingRepository;
        private readonly ICustomerService _customerService;

        public BookingController(ILogger<BookingController> logger,
            IBookingRepository bookingRepository,
            ICustomerService customerService)
        {
            this._logger = logger;
            this._bookingRepository = bookingRepository;
            this._customerService = customerService;
        }

        /// <summary>
        /// HTTP GET endpoint to list all bookings for a customer.
        /// </summary>
        /// <param name="customerId">The customer id to list for.</param>
        /// <returns>All <see cref="Booking"/> for the given customer.</returns>
        [HttpGet("customer/{customerId}")]
        public async Task<IActionResult> ListForCustomer(string customerId)
        {
            this._logger.LogInformation($"Received request to list bookings for {customerId}");

            return this.Ok(await this._bookingRepository.ListForCustomer(customerId));
        }
}

The implementation of the IBookingRepository is configured at startup using dependency injection in the Startup.cs file.

services.AddTransient<IBookingRepository, BookingRepository>();

This works when using an ASP.NET Core Web API project, since the framework abstracts much of the complexity and configuration. But it’s possible to apply the same practices for .NET core code running in Lambda.

Configuring dependency injection in AWS Lambda

The startup logic is moved to a standalone DotnetToLambda.Serverless.Config library. This allows you to share the dependency injection configuration between multiple Lambda functions. This library contains a single static class named ServerlessConfig.

There is little difference between this file and the Startup.cs file:

public void ConfigureServices(IServiceCollection services)
{
	var databaseConnection =
		new DatabaseConnection(this.Configuration.GetConnectionString("DatabaseConnection"));
	
	services.AddSingleton<DatabaseConnection>(databaseConnection);
	
	services.AddDbContext<BookingContext>(options =>
		options.UseMySQL(databaseConnection.ToString()));

	services.AddTransient<IBookingRepository, BookingRepository>();
	services.AddHttpClient<ICustomerService, CustomerService>();
	
	services.AddControllers();
}

And the configuration method in the ServerlessConfig class:


public static void ConfigureServices()
{
	var client = new AmazonSecretsManagerClient();
	
	var serviceCollection = new ServiceCollection();

	var connectionDetails = LoadDatabaseSecret(client);

	serviceCollection.AddDbContext<BookingContext>(options =>
		options.UseMySQL(connectionDetails.ToString()));
	
	serviceCollection.AddHttpClient<ICustomerService, CustomerService>();
	serviceCollection.AddTransient<IBookingRepository, BookingRepository>();
	serviceCollection.AddSingleton<DatabaseConnection>(connectionDetails);
	serviceCollection.AddSingleton<IConfiguration>(LoadAppConfiguration());

	serviceCollection.AddLogging(logging =>
	{
		logging.AddLambdaLogger();
		logging.SetMinimumLevel(LogLevel.Debug);
	});

	Services = serviceCollection.BuildServiceProvider();
}

The key addition is the manual creation of the ServiceCollection object on line 27 and the call to BuildServiceProvider on line 45. In.NET core the framework abstracts away this manual object initialization. The created ServiceProvider is then exposed as a read-only property of the ServerlessConfig class. All we have done is taken the boilerplate code that an ASP.NET Core web API performs behind the scenes and brought it into the foreground.

This allows you to copy and paste large parts of the startup configuration directly from the web API and re-use it in your Lambda functions.

Lambda API controllers

For the function code, follow a similar process. For example, here is the ListForCustomer endpoint re-written for Lambda:

 public class Function
{
	private readonly IBookingRepository _bookingRepository;
	private readonly ILogger<Function> _logger;
	
	public Function()
	{
		ServerlessConfig.ConfigureServices();

		this._bookingRepository = ServerlessConfig.Services.GetRequiredService<IBookingRepository>();
		this._logger = ServerlessConfig.Services.GetRequiredService<ILogger<Function>>();
	}
	
	public async Task<APIGatewayProxyResponse> FunctionHandler(APIGatewayProxyRequest apigProxyEvent, ILambdaContext context)
	{
		if (!apigProxyEvent.PathParameters.ContainsKey("customerId"))
		{
			return new APIGatewayProxyResponse
			{
				StatusCode = 400,
				Headers = new Dictionary<string, string> { { "Content-Type", "application/json" } }
			};
		}

		var customerId = apigProxyEvent.PathParameters["customerId"];
		
		this._logger.LogInformation($"Received request to list bookings for: {customerId}");

		var customerBookings = await this._bookingRepository.ListForCustomer(customerId);
		
		return new APIGatewayProxyResponse
		{
			Body = JsonSerializer.Serialize(customerBookings),
			StatusCode = 200,
			Headers = new Dictionary<string, string> { { "Content-Type", "application/json" } }
		};
	}
}

The function constructor calls the startup configuration. This allows the initial configuration to be re-used while the Lambda execution environment is still active. Once the services have been configured any required interfaces can be retrieved from the services property of the ServerlessConfig class.

The second key differences are the mapping of the inbound request and response back to API Gateway. The HTTP request arrives as an event and the contents must be manually parsed out of the raw HTTP data. The same applies to the HTTP response, which must be constructed manually. Other than these two differences, it’s a copy from the original BookingController.

Application configuration

An ASP.NET Core Web API contains an appsettings.json file, which contains runtime specific configuration. The framework handles loading the file and exposing it as an injectable IConfiguration interface. It’s also possible to load settings from environment variables.

This is still possible when using Lambda. You can package an appsettings.json file with the compiled code and load it manually at runtime. However, when using Lambda as the compute layer, there are AWS-specific options for managing configuration.

Environment variables

Lambda environment variables are used to add runtime configuration, as shown in the template.yaml file:

 Environment:
	Variables:
		SERVICE: bookings
		DATABASE_CONNECTION_SECRET_ID: !Ref SecretArn

This AWS SAM configuration adds an environment variable named DATABASE_CONNECTION_SECRET_ID. You can access this in Lambda the same way an environment variable is accessed in any C# application:

 var databaseConnectionSecret = client.GetSecretValueAsync(new GetSecretValueRequest()
            {
                SecretId = Environment.GetEnvironmentVariable("DATABASE_CONNECTION_SECRET_ID"),
            }).Result;

This is the simplest way to add runtime configuration. The variables are stored in plaintext and any change requires a redeployment or manual interaction.

External configuration services

AWS has services that allow you to move application configuration outside of the function code. These include AWS Systems Manager Parameter Store, AWS AppConfig and AWS Secrets Manager.

You can use Parameter Store to store plaintext parameters that can also be encrypted using the AWS Key Management Service. The contents of the appsettings.json file from the ASP.NET Core API is directly copied into the parameter string and deployed using the AWS CDK.

 var parameter = new StringParameter(this, "dev-configuration", new StringParameterProps()
{
	ParameterName = "dotnet-to-lambda-dev",
	StringValue = "{\"CustomerApiEndpoint\": \"https://jsonplaceholder.typicode.com/users\"}",
	DataType = ParameterDataType.TEXT,
	Tier = ParameterTier.STANDARD,
	Type = ParameterType.STRING,
	Description = "Dev configuration for dotnet to lambda",
});

This JSON data is loaded as part of the startup configuration. The IConfiguration implementation is then built manually using the parameter string.

 private static IConfiguration LoadAppConfiguration()
{
	var client = new AmazonSimpleSystemsManagementClient();
	var param = client.GetParameterAsync(new GetParameterRequest()
	{
		Name = "dotnet-to-lambda-dev"
	}).Result;
	
	return new ConfigurationBuilder()
		.AddJsonStream(new MemoryStream(Encoding.ASCII.GetBytes(param.Parameter.Value)))
		.Build();

The second configuration mechanism is Secrets Manager. This helps protect secrets and provides easier rotation and management of database credentials.

Amazon RDS is integrated with Secrets Manager. When creating a new RDS instance, the database connection details can be automatically encrypted and persisted as a secret. The details for the MySQL instance are stored in Secrets Manager and are not exposed. These connection details can be accessed as part of the startup configuration using the Secrets Manager SDK.

private static DatabaseConnection LoadDatabaseSecret(AmazonSecretsManagerClient client)
{
	var databaseConnectionSecret = client.GetSecretValueAsync(new GetSecretValueRequest()
	{
		SecretId = Environment.GetEnvironmentVariable("DATABASE_CONNECTION_SECRET_ID"),
	}).Result;

	return JsonSerializer
		.Deserialize<DatabaseConnection>(databaseConnectionSecret.SecretString);
}

The Lambda functions require IAM permissions to access both Secrets Manager and Parameter Store. AWS SAM includes pre-defined policy templates that you can add to the template. Four lines of YAML apply the required Secrets Manager and SSM permissions:

Policies:
	- AWSSecretsManagerGetSecretValuePolicy:
		SecretArn: !Ref SecretArn
	- SSMParameterReadPolicy:
		ParameterName: dotnet-to-lambda-dev

For a full list, see the policy template list.

Networking

The final architectural component is the network. Lambda functions are deployed into a VPC owned by the service. The function can access anything available on the public internet such as other AWS services, HTTPS endpoints for APIs, or services and endpoints outside AWS. The function then has no way to connect to your private resources inside of your VPC.

When deploying an RDS instance into AWS, it’s best practice to place the database in a private subnet with external ingress. If Lambda uses RDS, you must create a connection between the Lambda service VPC and your VPC. The details of this networking component can be found in this blog article.

The AWS SAM template defines this networking configuration:

VpcConfig:
	SubnetIds:
	  - !Ref PrivateSubnet1
	  - !Ref PrivateSubnet2
	SecurityGroupIds:
	  - !Ref SecurityGroup

In this example, the networking configuration is applied globally. This means that the same configuration is applied to all Lambda functions in the template. The functions here are deployed across two subnets and one security group. Learn more about the steps for configuring the subnets and security groups for RDS access in this article.

The specific values for the subnets and security groups are taken from environment variables. When running locally, you can provide these variables manually. When deploying via CICD, these variables can be changed dynamically based on the stage of the pipeline.

 PrivateSubnet1:
	Description: 'Required. Private subnet 1. Output from cdk deploy'
	Type: 'String'
PrivateSubnet2:
	Description: 'Required. Private subnet 2. Output from cdk deploy'
	Type: 'String'
SecurityGroup:
	Description: 'Required. Security group. Output from cdk deploy'
	Type: 'String'

Conclusion

This blog post shows the required considerations for migrating a .NET core REST API to AWS Lambda. You can now start to look at your existing code base and make an informed decision whether Lambda is for you. With the right abstractions and configuration, you can migrate a .NET core API to Lambda compute with copy and paste.

For more serverless learning resources, visit Serverless Land.

Introducing the .NET 6 runtime for AWS Lambda

Post Syndicated from James Beswick original https://aws.amazon.com/blogs/compute/introducing-the-net-6-runtime-for-aws-lambda/

This is written by Norm Johanson, Senior Software Dev Engineer.

You can now use the .NET 6 runtime to build AWS Lambda functions. The new managed runtime supports both x86 and Arm/Graviton2 processors. You can get started with .NET 6 and Lambda using your tool of choice, including Visual Studio 2022 with the AWS Toolkit for Visual Studio, the .NET CLI with the Amazon.Lambda.Tools global tool, and the AWS Serverless Application Model CLI (AWS SAM CLI).

.NET 6 has many new features for .NET developers including support for C# 10 and F# 6. In addition to these features in .NET 6, this blog post explains new features added to the .NET Lambda experience. You can use these to improve diagnostics and performance and use new coding patterns.

Improved logging

Logging in .NET Lambda functions has been improved for .NET 6, providing better traceability, and control of what is being logged. If you prefer the style of logging in previous .NET managed runtimes, set the environment variable AWS_LAMBDA_HANDLER_LOG_FORMAT to Unformatted.

Request ID

One of the common requested features for the previous .NET Lambda runtime is adding the Lambda request ID to logs for better traceability. This is available in the .NET 6 runtime, making the .NET logging format similar to other Lambda runtimes.

Log levels

.NET 6 logging uses log levels. The ILambdaLogger is accessed from the ILambdaContext and has the following new logging APIs:

  • LogCritical(string message)
  • LogError(string message)
  • LogWarning(string message)
  • LogInformation(string message)
  • LogDebug(string message)
  • LogTrace(string message)
  • Log(LogLevel level, string message)

Levels for log messages are visible in Amazon CloudWatch Logs, like the request id. This makes it easier to filter and search the logs for particular types of messages, such as errors or warnings.

Console.WriteLine calls are written to CloudWatch Logs as an info level message; Console.Error.WriteLine calls are written as error level.

The following example shows using info messages for logging the fetched user object. It writes a warning message if the user is not found:

public APIGatewayProxyResponse Get(APIGatewayProxyRequest request, ILambdaContext context)
{
    User user = null;
    try
    {
        var id = request.PathParameters["id"];

        context.Logger.LogInformation($"Loading user {id}");
        user = FetchUser(id);
        context.Logger.LogInformation($"User: {user.Name}");
    }
    catch(Exception e)
    {
        context.Logger.LogWarning($"Unable to find user: {e.Message}");
    }

    ...

}

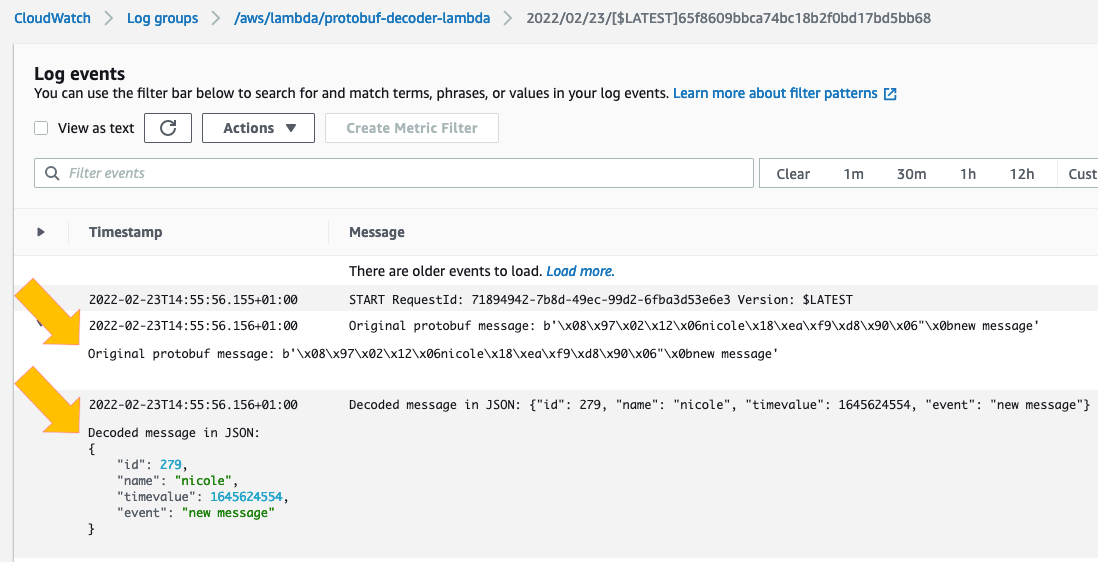
When the user cannot be fetched, this is the resulting log messages showing the log level and request id:

Log messages

By default, info level messages or higher are written to CloudWatch Logs. You can adjust the level written to CloudWatch Logs using the AWS_LAMBDA_HANDLER_LOG_LEVEL environment variable. The value of the environment variable is set to the values of the LogLevel enum.

With this new filtering, you can instrument Lambda functions with additional logging using the debug and trace log levels. This allows you to turn on additional logging from Lambda functions for troubleshooting, without redeploying new code.

Using source generator for JSON serialization

C# 9 provides source generators, which allow code generation during compilation. This can reduce the use of reflection APIs and improve application startup time. .NET 6 updated the native JSON library System.Text.Json to use source generators, allowing JSON parsing without requiring reflection APIs.

When targeting .NET 6 support, you can take advantage of System.Text.Json’s source generator support to improve cold start performance. This is done using the Amazon.Lambda.Serialization.SystemTextJson package that handles the serialization of Lambda events and responses to .NET types.

To use the source generator, you must define a new empty class in your project that derives from System.Text.Json.Serialization.JsonSerializerContext. This class must be a partial class because the source generator adds code to this class to handle serialization. On the empty partial class, add the JsonSerializable attribute for each .NET type the source generator must generate the serialization code for.

Here is an example called HttpApiJsonSerializerContext that registers the Amazon API Gateway HTTP API event and response types to have the serialization code generated:

[JsonSerializable(typeof(APIGatewayHttpApiV2ProxyRequest))]
[JsonSerializable(typeof(APIGatewayHttpApiV2ProxyResponse))]
public partial class HttpApiJsonSerializerContext : JsonSerializerContext
{
}

Lambda functions using Amazon.Lambda.Serialization.SystemTextJson use the Amazon.Lambda.Core.LambdaSerializer attribute to register the serializer. Most commonly the DefaultLambdaJsonSerializer type is specified. To use the source generator, you must register SourceGeneratorLambdaJsonSerializer, passing the previously defined JsonSerializerContext subclass as the generic parameter.

Here is an example of registering the serializer using the HttpApiJsonSerializerContext type:

[assembly: LambdaSerializer(typeof(SourceGeneratorLambdaJsonSerializer<APIGatewayExampleImage.HttpApiJsonSerializerContext>))]

After these steps, Lambda uses the source-generated JSON serialization code to handle all of the serialization of Lambda events and responses. Reflection API calls are not used for serialization, improving the Lambda function’s cold start performance.

Below is a full example of an API Gateway-based Lambda function using the source generator.

using System.Collections.Generic;
using System.Net;
using System.Text.Json.Serialization;


using Amazon.Lambda.Core;
using Amazon.Lambda.APIGatewayEvents;
using Amazon.Lambda.Serialization.SystemTextJson;

[assembly: LambdaSerializer(typeof(SourceGeneratorLambdaJsonSerializer<SourceGeneratorExample.HttpApiJsonSerializerContext>))]

namespace SourceGeneratorExample;

[JsonSerializable(typeof(APIGatewayHttpApiV2ProxyRequest))]
[JsonSerializable(typeof(APIGatewayHttpApiV2ProxyResponse))]
public partial class HttpApiJsonSerializerContext : JsonSerializerContext
{
}


public class Functions
{
    public APIGatewayProxyResponse Get(APIGatewayHttpApiV2ProxyRequest request, ILambdaContext context)
    {
        context.Logger.LogInformation("Get Request");

        var response = new APIGatewayHttpApiV2ProxyResponse
        {
            StatusCode = (int)HttpStatusCode.OK,
            Body = "Hello AWS Serverless",
            Headers = new Dictionary<string, string> { { "Content-Type", "text/plain" } }
        };

        return response;
    }
}

Top-level statements

The new .NET 6 Lambda runtime adds support for writing Lambda functions using C# 9’s top-level statements feature. Top-level statements allow you to remove much of the initial boilerplate code for a .NET project.

In a typical hello world example:

using System;

namespace Application
{
    class Program
    {
        static void Main(string[] args)
        {
            Console.WriteLine(“Enjoying .NET 6 in AWS Lambda”);
        }
    }
}

With top-level statements, you can write this in one line, removing brackets, indentations, namespaces, and type declarations:

Console.WriteLine(“Enjoying .NET 6 in AWS Lambda”);

At a high level, the C# compiler generates the .NET assembly’s Main() method, with your top-level code within it.

Executable assemblies

With top-level statements, the Main() method has been generated by the compiler. This is different from the traditional way of writing .NET Lambda functions. Previously, a Lambda project is a class library and the Lambda function handler is set to the assembly, type, and method name that the Lambda runtime client invokes.

Here is an example of .NET Lambda function handler string:

LambdaProject::LambdaProject.Function::FunctionHandler

And here is what the code for this function handler could look like:

using System.IO;
using System.Threading.Tasks;

using Amazon.Lambda.Core;
using Amazon.Lambda.S3Events;
using Amazon.S3;

// Assembly attribute to enable the Lambda function’s JSON input to be converted into a .NET class.
[assembly: LambdaSerializer(typeof(Amazon.Lambda.Serialization.SystemTextJson.DefaultLambdaJsonSerializer))]

namespace LambdaProject
{
    public class Function
    {
        IAmazonS3 _s3Client;

        public Function()
        {
            _s3Client = new AmazonS3Client();
        }

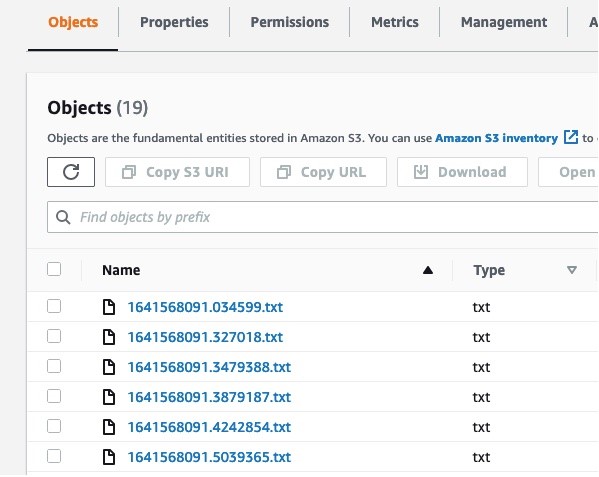
        public async Task FunctionHandler(S3Event evnt, IlambdaContext context)
        {
            foreach (var record in evnt.Records)
            {
                using var response = await _s3Client.GetObjectAsync(record.S3.Bucket.Name, record.S3.Object.Key);
                using var reader = new StreamReader(response.ResponseStream);
                // Run business logic on the text contexts of the S3 object
            }
        }
    }
}

Using reflection, the .NET Lambda runtime client uses the function handler string to identify the method to call in the .NET assembly.

When using top-level statements, you instead tell Lambda to run the assembly, which runs the top-level statements. To indicate that you want Lambda to run the assembly, set the Lambda function handler to the assembly name only. Using the previous example, the .NET Lambda function handler string is LambdaProject.

With the .NET assembly containing the Lambda function being run at startup, instead of the Lambda runtime client, your function code must start the Lambda runtime client so that Lambda events are sent to your code.

To start the Lambda runtime client:

  1. Add the Amazon.Lambda.RuntimeSupport NuGet package to your project.
  2. In the file that defines all of your top-level statements add to the end of the file the code to start the Lambda runtime client. The exact code is shown at the end of the example below.

This is a full example of a C# Lambda function using top-level statements that processes Lambda events:

using Amazon.Lambda.Core;
using Amazon.Lambda.RuntimeSupport;
using Amazon.Lambda.Serialization.SystemTextJson;
using Amazon.Lambda.S3Events;
using Amazon.S3;

// Code outside of the handler will be executed during Lambda initialization
var s3Client = new AmazonS3Client();

// The function handler that will be called for each Lambda event
var handler = async (S3Event evnt, ILambdaContext context) =>
{
    foreach(var record in evnt.Records)
    {
        using var response = await s3Client.GetObjectAsync(record.S3.Bucket.Name, record.S3.Object.Key);
        using var reader = new StreamReader(response.ResponseStream);
        // Run business logic on the text contexts of the S3 object
    }
};

// Build the Lambda runtime client passing in the handler to call for each
// event and the JSON serializer to use for translating Lambda JSON documents
// to .NET types.
await LambdaBootstrapBuilder.Create(handler, new DefaultLambdaJsonSerializer())
        .Build()
        .RunAsync();

ASP.NET Core minimal APIs

Since the first .NET Lambda runtime, you can run ASP.NET Core applications as Lambda functions using the Amazon.Lambda.AspNetCoreServer NuGet package.

.NET 6 introduces a new style of writing ASP.NET Core applications called Minimal APIs. These take advantage of C# 9’s top-level statement support simplifying the initialization of an ASP.NET Core application, allowing you to define an entire ASP.NET Core application in a single file.

To deploy an ASP.NET Core application using Minimal APIs to Lambda:

  1. Add the Amazon.Lambda.AspNetCoreServer.Hosting NuGet package to your project.
  2. Add a call to AddAWSLambdaHosting in your application when the services are being defined for the application. The argument for AddAWSLambdaHosting is the event source for the Lambda function. This can be an API Gateway REST or HTTP API, or an Application Load Balancer.

When the ASP.NET Core project is run locally, AddAWSLambdaHosting does nothing, allowing the normal .NET Kestrel web server to handle the local experience. When running in Lambda, AddAWSLambdaHosting swaps out Kestrel with Amazon.Lambda.AspNetCoreServer allowing Lambda and API Gateway to act as the web server instead of Kestrel. Since Minimal APIs take advantage of top-level statements, AddAWSLambdaHosting also starts the Lambda runtime client.

This example shows a Minimal API ASP.NET Core application. There is one Lambda-specific line calling AddAWSLambdaHosting that configures the project for Lambda support:

using Amazon.S3;
using Microsoft.AspNetCore.Mvc;

var builder = WebApplication.CreateBuilder(args);

// Add Swagger/OpenAPI support
builder.Services.AddEndpointsApiExplorer();
builder.Services.AddSwaggerGen();

builder.Services.AddControllers();

// Add S3 service client to dependency injection container
builder.Services.AddAWSService<IAmazonS3>();

// Add AWS Lambda support.
builder.Services.AddAWSLambdaHosting(LambdaEventSource.HttpApi);

var app = builder.Build();

app.UseSwagger();
app.UseSwaggerUI();

// Add support for controllers defined in other files
app.MapControllers();

// Example GET route
app.MapGet("/document/{name}", async ([FromServices] IAmazonS3 s3Client, string name) =>
{
    using var response = await s3Client.GetObjectAsync(app.Configuration["S3Bucket"], name);
    using var reader = new StreamReader(response.ResponseStream);
    var content = await reader.ReadToEndAsync();

    // Run business logic on the text contexts of the S3 object

    return content;
});

app.Run();

You must deploy as an executable assembly so the function handler string is set to the assembly name only. For example, this is how the preceding ASP.NET Core application is defined in AWS CloudFormation:

   ...
    
   "AspNetCoreFunction": {
      "Type": "AWS::Serverless::Function",
      "Properties": {
        "Handler": "AspNetCoreMinimalApiExample", // The assembly name only
        "Runtime": "dotnet6"
        "MemorySize": 256,
        "Timeout": 30,
        "Role": null,
        "Policies": [
          "AWSLambda_FullAccess",
          "AmazonS3ReadOnlyAccess"
        ],
        "Events": {
          "ProxyResource": {
            "Type": "HttpApi",
            "Properties": {
              "Path": "/{proxy+}",
              "Method": "ANY"
            }
          },
          "RootResource": {
            "Type": "HttpApi",
            "Properties": {
              "Path": "/",
              "Method": "ANY"
            }
          }
        }
      }
    }
  },
  
  ...

Open source Lambda runtime client

Over the last few years, AWS has open sourced more components of Lambda to help the community contribute to the Lambda experience. For .NET, you can find all the AWS client libraries in the aws/aws-lambda-dotnet GitHub repository.

For .NET 6, the managed runtime now uses the open source Lambda runtime client from the aws/aws-lambda-dotnet repository. Previously, the open source Lambda runtime client was used for functions that used Lambda’s custom runtime or container-image based support.

Now you have a consistent and transparent Lambda runtime client experience in all environments whether that is the managed runtime, container images or using the Lambda runtime client for .NET custom runtimes. The switch from the previous runtime client to the open source runtime client is transparent as Lambda functions are migrated to .NET 6.

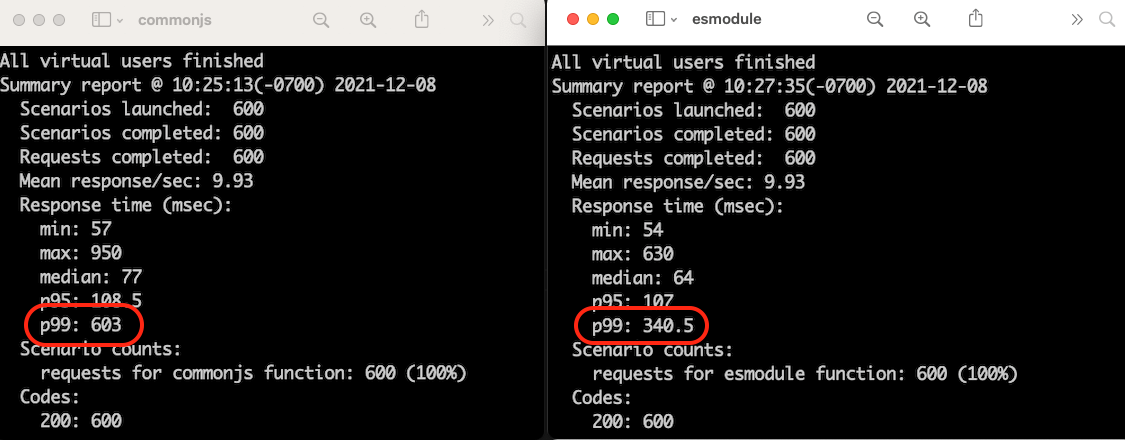
The open source Lambda runtime client has different performance characteristics than the .NET Core 3.1 Lambda runtime client. This is because the open source client uses all managed code, whereas the .NET Core 3.1 client uses a mix of managed and native code. In our testing, cold starts for basic “Hello, world!” functions may be slightly faster in .NET Core 3.1. However, for Lambda functions that do real world work, the testing shows a significant cold start improvement in .NET 6. For example, a .NET 6 Lambda function that uses the AWS .NET SDK to retrieve an item from DynamoDB showed a 25% performance improvement.

Migrating to .NET 6

To migrate existing .NET Lambda functions to the new .NET 6 runtime:

  1. Open the csproj or fsproj file. Set the TargetFramework element to net6.0.
  2. Open the aws-lambda-tools-defaults.json file, if it exists:
    1. Set the function-runtime field to dotnet6
    2. Set the framework field to net6.0. If you remove the field, the value is inferred from the project file.
  3. If it exists, open the serverless.template file. For any AWS::Lambda::Function or AWS::Servereless::Function resource, set the Runtime property to dotnet6.
  4. Update all Amazon.Lambda.* NuGet package references to the latest versions.

Conclusion

We are excited to add support for .NET 6 to Lambda. It’s fast to get started or migrate existing functions to .NET 6, with many new features in .NET 6 to take advantage of. Read the Lambda Developer Guide for more getting started information.

To provide feedback for .NET on AWS Lambda, contact the AWS .NET team on the .NET Lambda GitHub repository.

For more serverless learning resources, visit Serverless Land.

Building custom connectors using the Amazon AppFlow Custom Connector SDK

Post Syndicated from James Beswick original https://aws.amazon.com/blogs/compute/building-custom-connectors-using-the-amazon-appflow-custom-connector-sdk/

This post is written by Kamen Sharlandjiev, Sr. Specialist SA, Integration, Ray Jang, Principal PMT, Amazon AppFlow, and Dhiraj Mahapatro, Sr. Specialist SA, Serverless.

Amazon AppFlow is a fully managed integration service that enables you to transfer data securely between software as a service (SaaS) applications like Salesforce, SAP, Zendesk, Slack, ServiceNow, and AWS services like Amazon S3 and Amazon Redshift. Amazon AppFlow lets you run enterprise-scale data flows on a schedule, in response to business events, or on-demand.

Overview diagram

Amazon AppFlow is a managed integration service that replaces the heavy-lifting of developing, maintaining, and updating connectors. It supports bidirectional integration between external SaaS applications and AWS services.

The Custom Connector Software Development Kit (SDK) now makes it easier to integrate with private API endpoints, proprietary applications, or other cloud services. It provides access to all available managed integrations and the ability to build your own custom integration as part of the integrated experience. The SDK is open-source and available for Java or Python.

You can deploy custom connectors built with the SDK in different ways:

  • Private – The connector is available only inside the AWS account where deployed.
  • Shared – The connector can be shared for use with other AWS accounts.
  • Public – Publish connectors on the AWS Marketplace for free or charge a subscription fee. For more information, refer to Sharing AppFlow connectors via AWS Marketplace.

Overview

This blog takes you through building and deploying your own Amazon AppFlow Custom Connector using the Java SDK. The sample application shows how to build your first custom connector with Amazon AppFlow.

Custom connector flow

The process of building, deploying, and using a custom connector is:

  1. Create a custom connector as an AWS Lambda function using the Amazon AppFlow Custom Connector SDK.
  2. Deploy the custom connector Lambda function, which provides the serverless compute for the connector.
  3. Lambda function integrates with a SaaS application or private API.
  4. Register the custom connector with Amazon AppFlow.
  5. Users can now use this custom connector in the Amazon AppFlow service.

Building an Amazon AppFlow custom connector

The sample application used in this blog creates a new custom connector that implements a MySQL JDBC driver. With this connector, you can connect to a remote MySQL or MariaDB instance to read and write data.

The SDK allows you to build custom connectors and use the service’s built-in authentication support for: OAuth2, API key, and basic auth. For other use cases, such as JDBC, you must create your own custom authentication implementation.

The SDK includes the source code for an example Salesforce connector. This highlights a complete use case for a source and destination Amazon AppFlow connector using OAuth2 as authentication.

Details

There are three mandatory Java interfaces that a connector must implement:

  1. ConfigurationHandler.java: Defines the functionality to implement connector configurations, and credentials-related operations.
  2. MetadataHandler.java: Represents the functionality to implement for objects metadata.
  3. RecordHandler.java: Defines functionality to implement record-related CRUD operations.

Prerequisites

Ensure that the following software is installed on your workstation:

  1. Java 11
  2. Maven
  3. AWS CLI
  4. AWS SAM CLI

To run the sample application:

  1. Clone the code repository:
    git clone https://github.com/aws-samples/amazon-appflow-custom-jdbc-connector.git
    
    cd amazon-appflow-custom-jdbc-connector
  2. After cloning the sample application, visit these Java classes for more details:

To add JDBC clients for other database engines, implement JDBCClient.java interface. The custom connector uses a Lambda function as a POJO class to handle requests. The SDK provides an abstract BaseLambdaConnectorHandler class that, which you use as follows:

import com.amazonaws.appflow.custom.connector.lambda.handler.BaseLambdaConnectorHandler;

public class JDBCConnectorLambdaHandler extends BaseLambdaConnectorHandler {

  public JDBCConnectorLambdaHandler() {
    super(
      new JDBCConnectorMetadataHandler(),
      new JDBCConnectorRecordHandler(),
      new JDBCConnectorConfigurationHandler()
    );
  }
}

Local testing and debugging

While developing the connector specific functionality, developers require local testing capability to build and debug faster. The SDK and the example connector provides examples on testing custom connectors.

Additionally, you can experiment with JUnit and the DSL builders provided by the SDK. The JUnit test allows you to test this implementation locally by simulating an appropriate request to the Lambda functions. You can use debug points and step into the code implementation from start to end using the built-in IDE debugger. The sample application comes with example of JUnit tests that can be used with debug points.

Credentials management 

Amazon AppFlow stores all sensitive information in AWS Secrets Manager. The secret is created when you create a connector profile. The secret ARN is passed in the ConnectorContext that forms part of the Lambda function’s invocation request.

To test locally:

  • Mock the “CredentialsProvider” and stub out the response of GetCredentials API. Note that the CredentialProvider provides several different GetCredentials methods, depending on the authentication used.
  • Create a secret in AWS Secrets Manager. Configure an IAM user with programmatic access and sufficient permissions to allow the secretsmanager:GetSecretValue action and let the CredentialsProvider call Secrets Manager locally. When you initialize a new service client without supplying any arguments, the SDK attempts to find AWS credentials by using the default credential provider chain.

For more information, read Working with AWS Credentials (SDK for Java) and Creating an IAM user with programmatic access.

Deploying the Lambda function in an AWS account

This example connector package provides an AWS Serverless Application Model (AWS SAM) template in the project folder. It describes the following resources:

  1. The Lambda function containing the custom connector code.
  2. The AWS IAM policy, allowing the function to read secrets from AWS Secrets Manager.
  3. The AWS Lambda policy permission allowing Amazon AppFlow to invoke the Lambda function.

The sample application’s AWS SAM template provides two resources:

AWSTemplateFormatVersion: '2010-09-09'
Transform: 'AWS::Serverless-2016-10-31'
Description: Template to deploy the lambda connector in your account.
Resources:
  ConnectorFunction:
    Type: 'AWS::Serverless::Function'
    Properties:
      Handler: "org.custom.connector.jdbc.handler.JDBCConnectorLambdaHandler::handleRequest"
      CodeUri: "./target/appflow-custom-jdbc-connector-jdbc-1.0.jar"
      Description: "AppFlow custom JDBC connector example"
      Runtime: java11
      Timeout: 30
      MemorySize: 1024
      Policies:
        Version: '2012-10-17'
        Statement:
          Effect: Allow
          Action: 'secretsmanager:GetSecretValue'
          Resource: !Sub 'arn:aws:secretsmanager:${AWS::Region}:${AWS::AccountId}:secret:appflow!${AWS::AccountId}-*'

  PolicyPermission:
    Type: 'AWS::Lambda::Permission'
    Properties:
      FunctionName: !GetAtt ConnectorFunction.Arn
      Action: lambda:InvokeFunction
      Principal: 'appflow.amazonaws.com'
      SourceAccount: !Ref 'AWS::AccountId'
      SourceArn: !Sub 'arn:aws:appflow:${AWS::Region}:${AWS::AccountId}:*'

Deploy this custom connector by using the following command from the amazon-appflow-custom-jdbc-connector base directory:

mvn package && sam deploy –-guided

Once deployment completes, follow below steps to register and use the connector.

Registering the custom connector

There are two ways to register the custom connector.

1. Register through the AWS Management Console

  1. From the AWS Management Console, navigate to Amazon AppFlow. Select Connectors on the left-side menu. Choose on the “Register New Connector” button.
  2. Register the connector by selecting your Lambda function and typing in the connector label.
    Register a new connectorThe newly created custom connector Lambda function appears in the list if you deployed using AWS SAM by following the steps in this tutorial. If you deployed the Lambda function manually, ensure that appropriate Lambda permissions are set, as described in the Lambda Permissions and Resource Policy section.
  3. Provide a label for the connector. The label must be unique per account per Region. Choose Register.
    Provide a label
  4. The connector appears in the list of custom connectors.
    List of connectors

2. Register with the API

Invoke the registerConnector public API endpoint with the following request payload:

{
   "connectorLabel":"TestCustomConnector",
   "connectorProvisioningType":"LAMBDA",
   "connectorProvisioningConfig":{
      "lambda":{ "lambdaArn":"arn:aws:lambda:<region>:<aws_account_id>:function:<lambdaFunctionName>"
      }
   }
}

For connectorLabel, use a unique label. Currently, the only supported connectorProvisioningType is LAMBDA.

Using the new custom connector

  1. Navigate to the Connections link from the left-menu. Select the registered connector from the drop-down.
    Selecting the connector
  2. Choose Create Connection.
    Choose Create Connection
  3. Complete the connector-specific setup:
    Setup page
  4. Proceed with creating a flow and selecting your new connection.
  5. Check Lambda function’s Amazon CloudWatch Logs to troubleshoot errors, if any, during connector registration, connector profile creation, and flow execution process.

Production considerations

This example is a proof of concept. To build a production-ready solution, review the non-exhaustive list of differences between sample and production-ready solutions.

If you plan to use the custom connector with high concurrency, review AWS Lambda quotas and limitations.

Cleaning up the custom connector stack

To delete the connector:

  1. Delete all flows in Amazon AppFlow that you created as part of this tutorial.
  2. Delete any connector profiles.
  3. Unregister the custom connector.
  4. To delete the stack, run the following command from the amazon-appflow-custom-jdbc-connector base directory:
    sam delete

Conclusion

This blog post shows how to extend the Amazon AppFlow service to move data between SaaS endpoints and custom APIs. You can now build custom connectors using the Amazon AppFlow Custom Connector SDK.

Using custom connectors in Amazon AppFlow allows you to integrate siloed applications with minimal code. For example, different business units using legacy applications in an organization can now integrate their services via the Amazon AppFlow Custom Connectors SDK.

Depending on your choice of framework you can use the open source Python SDK or Java SDK from GitHub. To learn more, refer to the Custom Connector SDK Developer Guide.

For more serverless learning resources, visit Serverless Land.

Introducing AWS Virtual Waiting Room

Post Syndicated from James Beswick original https://aws.amazon.com/blogs/compute/introducing-aws-virtual-waiting-room/

This post is written by Justin Pirtle, Principal Solutions Architect, Joan Morgan, Software Developer Engineer, and Jim Thario, Software Developer Engineer.

Today, AWS is introducing an official AWS Virtual Waiting Room solution. You can integrate this new, open-source solution with existing web and mobile applications. It can help buffer users during times of peak demand and sudden bursts of traffic, preventing systems from resource exhaustion.

Events commonly use virtual waiting rooms where there is either unknown demand or expected large bursts of traffic. Examples of such events include concert ticket sales, Black Friday promotions, COVID-19 vaccine registrations, and more. Virtual waiting rooms allow a quota of users to view, select, and complete their transactions directly. They shield the application’s backend environment from traffic by buffering users in a waiting room until it is their turn in line.

Like any real-life queuing system, a user enters the AWS Virtual Waiting Room and requests a number in line. After receiving a number corresponding to the unique device ID, the browser then polls regularly for updates. The update provides the current number being served and anticipated time until they are front of line.

After reaching the front of the line, the user can exchange the number and device ID for a secure session token. This is included with their downstream requests to authenticate users securely.

If a user discovers the backend endpoint and tries to send requests, they are redirected into the waiting room. The API requests are denied access until they have a valid token. This prevents the backend from needing to scale to accommodate all users at a single time.

Integrating the AWS Virtual Waiting Room into your application

Integration steps depend on the integration pattern for your application. You can decide if all users are routed through the waiting room or only during periods of excessive traffic. You can also choose to protect only the web host serving the backend webpages or one or more APIs powering backend commerce services.

There are four common patterns supported for integrating the waiting room into your application:

  1. Upstream redirection of all traffic from the main target site to flow through AWS Virtual Waiting Room. This option sends all user traffic through the waiting room with the initial capacity of users permitted to the protected system. The traffic passes through transparently, then it buffers the remaining users. It admits new users as capacity becomes available. The target system is only accessible by users who pass through the waiting room.
  2. Downstream redirection to the virtual waiting room from the target site. This option sends all traffic to the target site. The target site conditionally redirects requests that need to enter the waiting room. No DNS or upstream modifications are needed. The target site must be able to handle the initial user requests and redirection responses.
  3. Direct target site API integration for buffering users from an existing website without any redirection. Your web or mobile application integrates the virtual waiting room at the API-level. This does not need any redirection to a different waiting room endpoint or site. This can offer a seamless user experience but may require more development for the integration.
  4. OpenID Connect (OIDC) adapter. This option offers no-code native integration of the waiting room with OpenID Connect-enabled system components, such as the AWS Application Load Balancer (ALB). Users are redirected by the load balancer or similar component to the waiting room. They are buffered until issued a signed, time-limited JSON Web Token (JWT). Once the user’s JWT token is issued, the load balancer then forwards user requests to the target backend systems.

Overview of the AWS Virtual Waiting Room solution

The AWS Virtual Waiting Room solution implementation includes three main components:

  • Core APIs. The main resources deployed include two Amazon API Gateway deployments, a VPC, several AWS Lambda functions, an Amazon DynamoDB table, and an Amazon ElastiCache cluster. This API provides the basic mechanisms for tracking clients entering the waiting room. It requests status of the line progression and an authentication token to enter the target protected site.
  • Waiting room front-end website. The waiting room static site is shown to users awaiting their turn. This site dynamically updates the position being served and their place in line on a configurable interval. You customize this site’s HTML, CSS, and JavaScript to match your frontend styling and theme.
  • Lambda authorizer for protected target system. The Lambda authorizer wraps and protects the downstream protected target system’s APIs. This ensures that all user invocations have a validated time-limited token issued by the waiting room core API. It helps to prevent users from bypassing the waiting room.

Reference architecture

The Virtual Waiting Room CloudFormation template deploys the following infrastructure:

  1. An Amazon CloudFront distribution to deliver public API calls for the client.
  2. Amazon API Gateway public API resources to process queue requests from the virtual waiting room, track the queue position, and support validation of tokens that allow access to the target website.
  3. An Amazon Simple Queue Service (Amazon SQS) queue to regulate traffic to the AWS Lambda function that processes the queue messages. Instead of invoking the Lambda function for each request, the SQS queue batches the incoming bursts of requests.
  4. API Gateway private API resources to support administrative functions.
  5. Lambda functions to validate and process public and private API requests, and return the appropriate responses.
  6. Amazon Virtual Private Cloud (VPC) to host the Lambda functions that interact directly with the Amazon ElastiCache for Redis cluster. VPC endpoints allow Lambda functions in the VPC to communicate with services within the solution.
  7. An Amazon CloudWatch rule to invoke a Lambda function that works with a custom Amazon EventBridge bus to periodically broadcast status updates.
  8. An Amazon DynamoDB table to store token data.
  9. AWS Secrets Manager to store keys for token operations and other sensitive data.
  10. (Optional) Authorizer component consisting of an AWS Identity and Access Management (IAM) role and a Lambda function to validate signatures for your API calls. The only requirement for the authorizer to protect your API is to use API Gateway.
  11. (Optional) Amazon Simple Notification Service (Amazon SNS), CloudWatch, and Lambda functions to support two inlet strategies.
  12. (Optional) OpenID adaptor component with API Gateway and Lambda functions to allow an OpenID provider to authenticate users to your website. CloudFront distribution with an Amazon Simple Storage Service (Amazon S3) bucket for the waiting room page for this component.
  13. (Optional) A CloudFront distribution with Amazon S3 origin bucket for the optional sample waiting room web application.

Deploying the AWS Virtual Waiting Room

To get started with the AWS Virtual Waiting Room, deploy the Getting Started stack. This deploys the Core APIs stack, the Authorizers stack, and a sample application CloudFormation stack:

  1. Launch the Getting Started CloudFormation stack. The template launches in the US East (N. Virginia) Region by default. To launch the solution in a different AWS Region, use the Region selector in the console navigation bar.
  2. On the Create stack page, verify that the correct template URL is in the Amazon S3 URL text box and choose Next.
    Create stack page
  3. On the Specify stack details page, assign a name to your solution stack, and accept all default parameter values. For information about naming character limitations, refer to IAM and STS Limits in the AWS Identity and Access Management User Guide. Choose Next.
    Specify stack details page
  4. On the Configure stack options page, choose Next.
  5. On the Review page, review and confirm the settings. Check the box acknowledging that the template creates AWS Identity and Access Management (IAM) resources.
  6. Choose Create stack to deploy the stack.
  7. You can view the status of the stack in the AWS CloudFormation Console in the Status column. You should receive a CREATE_COMPLETE status in approximately 30 minutes.
  8. Once successfully deployed, browse to the Outputs tab.
  9. Copy the ControlPanelURL and WaitingRoomURL to a scratch pad file for later use.

Configuring the AWS Virtual Waiting Room

After deploying the three stacks, test the waiting room using the sample application:

  1. Navigate to the IAM console. Create a new IAM user or select an existing IAM user in the same account where you deployed the waiting room stack.
  2. Grant the selected IAM user programmatic access. Download the key file or copy the access key ID and secret access key values to your scratch pad for later use.
  3. Add the IAM user to the ProtectedAPIGroup IAM user group created by the getting started template:
    Add user to groups
  4. Open the control panel in a new tab or browser window using the ControlPanelURL output you saved earlier.
  5. In the control panel, expand the Configuration section.
  6. Enter the access key ID and secret access key that you retrieved in Generate AWS keys to call the IAM secured APIs. The endpoints and event ID are filled in from the URL parameters.
    Control panel
  7. Choose Use. The button activates after you have supplied the credentials.
  8. You now see the status “Connected” shown following the various metrics reported:
    Metrics page

Test the sample waiting room

  1. Browse to the sample waiting room in a new browser tab. Use the WaitingRoomURL you captured previously from the CloudFormation stack output values.
  2. Select Reserve to enter the waiting room. If you are unable to proceed with your transaction, your assigned number is not yet reached.
    Waiting room status page
  3. Navigate back to the browser tab with the control panel.
  4. Under Increment Serving Counter, select Change. This manually increments the serving counter and allows 100 users to move on from the waiting room to the target site.
    Increment serving counter
  5. Navigate back to the waiting room and choose Check out now! You are redirected to the target site since your serving number is eligible to proceed beyond the waiting room.
    Waiting room config page
  6. Select Purchase now to finish your transaction at the target site. This page represents the protected system beyond the waiting room. Replace this with the actual system users you are protecting.
    Purchase now page
  7. After the simulated purchase is complete, you can see that the transaction is successful. This transaction is authorized using the time-limited authorization token, which came from the waiting room previously. If a user bypasses the waiting room, they would not be successful in completing a transaction.
    Purchase receipt

Customizing the AWS Virtual Waiting Room for your application

The sample browser client demonstrates an entire user flow frontend with the AWS Virtual Waiting Room flow for an ecommerce purchase. You can use this code as a starting point for your waiting room or reference the API communication code for integrating the waiting room into your existing website.

This sample code is built with Vue.js and Bootstrap to render the user interface. It uses the Axios and Axios-Retry packages to make API calls to the virtual waiting room stack. The sample code uses the Axios-Retry package to show how to handle throttling conditions and exponential backoff in high-traffic situations.

The control panel client is used to make requests to the private waiting room API that requires IAM-based authorization. The control panel client demonstrates how to construct and sign requests to the private API. It can be used in production or customized further. All of the sample source code room source is available in GitHub including the sample user client and control panel client.

Conclusion

The AWS Virtual Waiting Room solution is available today at no additional cost, provided as open source under the Apache 2 license. It supports customized integration with any front-end application via a variety of integration techniques. You can also customize how and when the waiting room allows users to progress into the protected target system using a variety of strategies.

To learn more about the AWS Virtual Waiting Room solution, visit the solution implementation and implementation guide.

For more serverless learning resources, visit Serverless Land.

Capturing client events using Amazon API Gateway and Amazon EventBridge

Post Syndicated from James Beswick original https://aws.amazon.com/blogs/compute/capturing-client-events-using-amazon-api-gateway-and-amazon-eventbridge/

This post is written by Tim Bruce, Senior Solutions Architect, DevAx.

Event producers are one of the three main components in an event-driven architecture. Event producers create and publish events to event routers, which send them to event consumers. Any portion of a system, including a mobile or web client, can be an event producer.

To extend the event model to your mobile and web clients, you must implement standards for security, messaging formats, and event storage.

This post shows how to build a client-enabled event-handling solution. It uses Amazon EventBridge, Amazon API Gateway, AWS Lambda, and Amazon Cognito. This architecture supports routing client events to internal and external destinations. It provides a blueprint that you can use to simplify the integration.

Overview

This example creates a RESTful API using API Gateway. It sends events directly to EventBridge without the need for compute services. In production, you have more requirements than only receiving and forwarding events. Additional requirements include security, user identification, validation, enrichment, transformation, event forwarding, and storing.

In this example, API Gateway provides security and user identification by invoking a Lambda authorizer. The authorizer generates a policy and returns client identification to API Gateway. API Gateway then performs request validation and message enrichment before forwarding the events to EventBridge.

EventBridge evaluates the events against rules and forwards the events to targets. The rules apply transformation to the events and forward an event to up to five targets. Targets include AWS services, such as Amazon Kinesis Data Firehose, and many third-party solutions, such as Zendesk, with HTTPS endpoints.

Lastly, Kinesis Data Firehose provides a cost-effective solution to store events into an Amazon S3 bucket. Before storing the events, Kinesis Data Firehose transforms records via Lambda transformers. It also partitions records using data in the record or calculated data via a Lambda function. Kinesis Data Firehose uses this partitioning data to create keys in the bucket and store matching records within the keys.

Example architecture

Example architecture

The example consists of the following resources defined in the AWS SAM template:

Data flow

Data flow

  1. Application clients collect or generate the events.
  2. The client sends the events to API Gateway as URL-encoded JSON. The client includes the user’s JWT in an authorization header with the request for validation.
  3. The Lambda authorizer validates the JWT with Amazon Cognito and returns the user’s unique clientID value to API Gateway.
  4. API Gateway transforms the request into events, appending clientId, the bus name, and environment.
  5. API Gateway sends the events to EventBridge.
  6. EventBridge rules match the events and:
    1. Forwards all client events to Kinesis Data Firehose.
    2. Forwards client events with detail.eventType of “loyaltypurchase” to Zendesk.
  7. Kinesis Data Firehose receives the records.
  8. The Kinesis Data Firehose data transformation processes each record, moving the client ID to the detail object.
  9. Kinesis Data Firehose partitions the records and stores them in an S3 bucket.

Overall design

The following sections discuss details of the solution, starting from the event in a web or mobile client. This solution requires the client to create an HTTPS request, including the user’s JWT as an authorization header.

{"entries": [{"entry": "{\"eventType\": \"searching\", \"schemaVersion\":1, \"data\": {\"searchTerm\":\"games\"}}"}]}

The preceding JSON shows a sample request body for this solution. The top-level item “entries” is an array of “entry” items. API Gateway will translate each “entry” to the event-detail field in EventBridge events. The client must escape the data for “entry” to prevent translation errors.

API Gateway and Lambda authorizer

API Gateway receives the request and validates the JWT by invoking the Lambda authorizer. The authorizer generates a policy allowing the request for valid tokens. It adds the Amazon Cognito “custom:clientId” custom attribute to the response context before returning the response to API Gateway. The “custom:clientId” attribute is a unique client identifier in the form of a UUID that downstream systems can use to retrieve data about the customer.

API Gateway validates the request by matching the request body against a model. Models represent what a request should look like. A mapping template then transforms valid requests to the format required by EventBridge. Mapping templates use velocity templating language (VTL) to do this.

VTL template
This mapping template uses a #foreach loop to process the array “entries” from the request body. The process enriches each event with the user’s “custom:clientId” and stage variables for bus name and environment from API Gateway.

Integration request

The preceding API Gateway AWS integration enables API Gateway to send the events to EventBridge without using compute services, such as Lambda or Amazon EC2. The integration and IAM execution role enable API Gateway to call the EventBridge PutEvents API to do this.

EventBridge rules and transformations

EventBridge rules match events against criteria, transform the events, and forward the events to targets. There are two rules in this example. One processes events for Zendesk tickets and the other forwards data to Kinesis Data Firehose to store events for triage and analytics.

This example creates service tickets in the Zendesk ticketing system. The tickets trigger agents to contact customers who are expecting a call to complete their purchases. The software client, by sending the event directly, reducing time-to-action for back-office processes and helping improve customer satisfaction.

Matching EventBridge rule

This rule matches client event messages for loyalty purchases and forwards details to the Zendesk API. The rule includes a transformation, which selects a portion of the event before sending the information to the target.

EventBridge uses an API destination to store details about the HTTP endpoint and usage policies. Additionally, an EventBridge connection and an AWS Secrets Manager secret store details. These include the authentication policy and authentication credentials to connect to the API destination.

Zendesk dashboard

Successfully processed events open tickets in Zendesk using the API destination. Agents now have a list of customers to contact.

Enterprises often require storing the events for troubleshooting or analytics. EventBridge does not include a newline between records when forwarding events to Kinesis Data Firehose. Because of this, it may be more challenging to discern each record when analyzing the data.

Rule to transform events
A rule for all client events changes this behavior. This AWS CloudFormation snippet defines the rule that will transform each event, adding a new line after each. The “\n” character in the InputTemplate field adds the separator between records before forwarding the data to Kinesis Data Firehose.

After, Kinesis Data Firehose receives each record separated by a new line, enabling both triage and analytics without extra overhead.

Kinesis Data Firehose to S3

Kinesis Data Firehose is a cost-effective way to batch and write records to S3. It offers optional transformation capabilities by invoking a Lambda function. This example uses a Lambda function that moves the “clientID” field to the detail section of the event record.

Kinesis Data Firehose to S3

Kinesis Data Firehose also supports dynamic partitioning of records when writing to S3. It selects data from the records or data calculated by a Lambda function. In this example, it selects data from the records to store data in separate folders in S3.

Event durability considerations

You can extend this example using an EventBridge archive and Amazon Kinesis Data Streams. Archiving allows you to create an encrypted archive of matching events. You can define the data retention in days, from one through indefinite. You can replay events from your archive when you must re-process data.

Kinesis Data Streams is a serverless data streaming solution. The EventBridge rule for all records can forward data to Kinesis Data Streams instead of Kinesis Data Firehose. Multiple applications can consume the Kinesis Data Streams. Kinesis Data Firehose would consume this stream of data and store it in S3.

Prerequisites

You need the following prerequisites to deploy the example solution:

Implementation

The full source of the solution is in the GitHub repository and is deployed with AWS SAM.

  1. Create a Secrets Manager secret using the command the AWS CLI:
    aws secretsmanager create-secret --name proto/Zendesk --secret-string '{"username":"<YOUR EMAIL>","apiKey":"<YOUR APIKEY>"}
  2. Clone the solution repository using git:
    git clone https://github.com/aws-samples/client-event-sample
  3. Build the AWS SAM project:
    sam build --use-container
  4. Deploy the project using AWS SAM:
    sam deploy --guided --capabilities CAPABILITY_NAMED_IAMAWS SAM deployment output
  5. From the outputs from the deployment, set the following shell variables:
    APPCLIENTID=<output APPCLIENTID>
    APIID=<output APIID>
    REGION=<region you deployed to>
  6. Create a user in Amazon Cognito using the AWS CLI:
    aws cognito-idp sign-up --client-id $APPCLIENTID --username <YOUR USER ID> --password <YOUR PASSWORD> --user-attributes Name=email,Value=<YOUR EMAIL>
  7. After you receive the confirmation code, confirm the user using the AWS CLI:
    aws cognito-idp confirm-sign-up --client-id $APPCLIENTID --username <userid> --confirmation-code <confirmation code>
  8. Test the user login with the AWS CLI:
    aws cognito-idp initiate-auth --auth-flow USER_PASSWORD_AUTH --client-id $APPCLIENTID --auth-parameters USERNAME=<YOUR USER ID>,PASSWORD=<YOUR PASSWORD>

If successful, this returns a JSON web token (JWT).

Testing the client event solution

  1. The sample repository includes an event generator in the util directory. The generator uses your credentials and simulates events from a user’s software client. From the utils directory, run the generator:
    python3 generator.py
    --minutes <minutes to run generator> --batch <batch size from 1-10>
    --errors <True|False> --userid <YOUR USER ID> --password <YOUR
    PASSWORD> --region $REGION --appclientid $APPCLIENTID --apiid $APIID
  2. Log in to your Zendesk console and view the created tickets.
  3. After five minutes, review the “clientevents” bucket to view the event records.

Cleaning up

To remove the example:

  1. Delete the data stored in the clientevents buckets created from the template.
  2. Delete the stack using the command:
    sam delete --stack-name clientevents
  3. Delete the secret using the command:
    aws secretsmanager delete-secret --secret-id <arn of secret>

Conclusion

This post shows how to send client events to an API and EventBridge to enable new customer experiences. The example covers enabling new experiences by creating a way for software clients to send events with minimal custom code. This blueprint shows how you can include client events in your solution, featuring validation, enrichment, transformation, and storage.

You can modify the example code provided here for your use in your organization. This enables your client software to register events without modifying backend code.

For more serverless learning resources, visit Serverless Land.

Using Node.js ES modules and top-level await in AWS Lambda

Post Syndicated from James Beswick original https://aws.amazon.com/blogs/compute/using-node-js-es-modules-and-top-level-await-in-aws-lambda/

This post is written by Dan Fox, Principal Specialist Solutions Architect, Serverless.

AWS Lambda now enables the use of ECMAScript (ES) modules in Node.js 14 runtimes. This feature allows Lambda customers to use dependency libraries that are configured as ES modules, or to designate their own function code as an ES module. It provides customers the benefits of ES module features like import/export operators, language-level support for modules, strict mode by default, and improved static analysis and tree shaking. ES modules also enable top-level await, a feature that can lower cold start latency when used with Provisioned Concurrency.

This blog post shows how to use ES modules in a Lambda function. It also provides guidance on how to use top-level await with Provisioned Concurrency to improve cold start performance for latency sensitive workloads.

Designating a function handler as an ES module

You may designate function code as an ES module in one of two ways. The first way is to specify the “type” in the function’s package.json file. By setting the type to “module”, you designate all “.js” files in the package to be treated as ES modules. Set the “type” as “commonjs” to specify the package contents explicitly as CommonJS modules:

// package.json
{
  "name": "ec-module-example",
  "type": "module",
  "description": "This package will be treated as an ES module.",
  "version": "1.0",
  "main": "index.js",
  "author": "Dan Fox",
  "license": "ISC"
}

// index.js – this file will inherit the type from 
// package.json and be treated as an ES module.

import { double } from './lib.mjs';

export const handler = async () => {
    let result = double(6); // 12
    return result;
};

// lib.mjs

export function double(x) {
    return x + x;
}

The second way to designate a function as either an ES module or a CommonJS module is by using the file name extension. File name extensions override the package type directive.

File names ending in .cjs are always treated as CommonJS modules. File names ending in .mjs are always treated as ES modules. File names ending in .js inherit their type from the package. You may mix ES modules and CommonJS modules within the same package. Packages are designated as CommonJS by default:

// this file is named index.mjs – it will always be treated as an ES module
import { square } from './lib.mjs';

export async function handler() {
    let result = square(6); // 36
    return result;
};

// lib.mjs
export function square(x) {
    return x * x;
}

Understanding Provisioned Concurrency

When a Lambda function scales out, the process of allocating and initializing new runtime environments may increase latency for end users. Provisioned Concurrency gives customers more control over cold start performance by enabling them to create runtime environments in advance.

In addition to creating execution environments, Provisioned Concurrency also performs initialization tasks defined by customers. Customer initialization code performs a variety of tasks including importing libraries and dependencies, retrieving secrets and configurations, and initializing connections to other services. According to an AWS analysis of Lambda service usage, customer initialization code is the largest contributor to cold start latency.

Provisioned Concurrency runs both environment setup and customer initialization code. This enables runtime environments to be ready to respond to invocations with low latency and reduces the impact of cold starts for end users.

Reviewing the Node.js event loop

Node.js has an event loop that causes it to behave differently than other runtimes. Specifically, it uses a non-blocking input/output model that supports asynchronous operations. This model enables it to perform efficiently in most cases.

For example, if a Node.js function makes a network call, that request may be designated as an asynchronous operation and placed into a callback queue. The function may continue to process other operations within the main call stack without getting blocked by waiting for the network call to return. Once the network call is returned, the callback is run and then removed from the callback queue.

This non-blocking model affects the Lambda execution environment lifecycle. Asynchronous functions written in the initialization block of a Node.js Lambda function may not complete before handler invocation. In fact, it is possible for function handlers to be invoked with open items remaining in the callback queue.

Typically, JavaScript developers use the await keyword to instruct a function to block and force it to complete before moving on to the next step. However, await is not permitted in the initialization block of a CommonJS JavaScript function. This behavior limits the amount of asynchronous initialization code that can be run by Provisioned Concurrency before the invocation cycle.

Improving cold start performance with top-level await

With ES modules, developers may use top-level await within their functions. This allows developers to use the await keyword in the top level of the file. With this feature, Node.js functions may now complete asynchronous initialization code before handler invocations. This maximizes the effectiveness of Provisioned Concurrency as a mechanism for limiting cold start latency.

Consider a Lambda function that retrieves a parameter from the AWS Systems Manager Parameter Store. Previously, using CommonJS syntax, you place the await operator in the body of the handler function:

// method1 – CommonJS

// CommonJS require syntax
const { SSMClient, GetParameterCommand } = require("@aws-sdk/client-ssm"); 

const ssmClient = new SSMClient();
const input = { "Name": "/configItem" };
const command = new GetParameterCommand(input);
const init_promise = ssmClient.send(command);

exports.handler = async () => {
    const parameter = await init_promise; // await inside handler
    console.log(parameter);

    const response = {
        "statusCode": 200,
        "body": parameter.Parameter.Value
    };
    return response;
};

When you designate code as an ES module, you can use the await keyword at the top level of the code. As a result, the code that makes a request to the AWS Systems Manager Parameter Store now completes before the first invocation:

// method2 – ES module

// ES module import syntax
import { SSMClient, GetParameterCommand } from "@aws-sdk/client-ssm"; 

const ssmClient = new SSMClient();
const input = { "Name": "/configItem" }
const command = new GetParameterCommand(input);
const parameter = await ssmClient.send(command); // top-level await

export async function handler() {
    const response = {
        statusCode: 200,
        "body": parameter.Parameter.Value
    };
    return response;
};

With on-demand concurrency, an end user is unlikely to see much difference between these two methods. But when you run these functions using Provisioned Concurrency, you may see performance improvements. Using top-level await, Provisioned Concurrency fetches the parameter during its startup period instead of during the handler invocation. This reduces the duration of the handler execution and improves end user response latency for cold invokes.

Performing benchmark testing

You can perform benchmark tests to measure the impact of top level await. I have created a project that contains two Lambda functions, one that contains an ES module and one that contains a CommonJS module.

Both functions are configured to respond to a single API Gateway endpoint. Both functions retrieve a parameter from AWS Systems Manager Parameter Store and are configured to use Provisioned Concurrency. The ES module uses top-level await to retrieve the parameter. The CommonJS function awaits the parameter retrieval in the handler.

Example architecture

Before deploying the solution, you need:

To deploy:

  1. From a terminal window, clone the git repo:
    git clone https://github.com/aws-samples/aws-lambda-es-module-performance-benchmark
  2. Change directory:
    cd ./aws-lambda-es-module-performance-benchmark
  3. Build the application:
    sam build
  4. Deploy the application to your AWS account:
    sam deploy --guided
  5. Take note of the API Gateway URL in the Outputs section.
    Deployment outputs

This post uses a popular open source tool Artillery to provide load testing. To perform load tests:

  1. Open config.yaml document in the /load_test directory and replace the target string with the URL of the API Gateway:
    target: “Put API Gateway url string here”
  2. From a terminal window, navigate to the /load_test directory:
    cd load_test
  3. Download and install dependencies:
    npm install
  4. Begin load test for the CommonJS function.
    ./test_commonjs.sh
  5. Begin load test for ES module function.
    ./test_esmodule.sh

Reviewing the results

Test results

Here is a side-by-side comparison of the results of two load tests of 600 requests each. The left shows the results for the CommonJS module and the right shows the results for the ES module. The p99 response time reflects the cold start durations when the Lambda service scales up the function due to load. The p99 for the CommonJS module is 603 ms while the p99 for the ES module is 340.5 ms, a performance improvement of 43.5% (262.5 ms) for the p99 of this comparison load test.

Cleaning up

To delete the sample application, use the latest version of the AWS SAM CLI and run:

sam delete

Conclusion

Lambda functions now support ES modules in Node.js 14.x runtimes. ES modules support await at the top-level of function code. Using top-level await maximizes the effectiveness of Provisioned Concurrency and can reduce the latency experienced by end users during cold starts.

This post demonstrates a sample application that can be used to perform benchmark tests that measure the impact of top-level await.

For more serverless content, visit Serverless Land.

Validating addresses with AWS Lambda and the Amazon Location Service

Post Syndicated from James Beswick original https://aws.amazon.com/blogs/compute/validating-addresses-with-aws-lambda-and-the-amazon-location-service/

This post is written by Matthew Nightingale, Associate Solutions Architect.

Traditional methods of performing address validation on geospatial datasets can be expensive and time consuming. Using Amazon Location Service with AWS Lambda in a serverless data processing pipeline, you may achieve significant performance improvements and cost savings on address validation jobs that use geospatial data.

This blog contains a deployable AWS Serverless Application Model (AWS SAM) template. It also uses sample data sourced from publicly available datasets that you can deploy and use to test the application. This blog offers a starting point to build out a serverless address validation pipeline in your own AWS account.

Overview

This application implements a serverless scatter/gather architecture using Lambda and Amazon S3, performing address validation with the Amazon Location Service. An S3 PUT event triggers each Lambda function to run data processing jobs along each step of the pipeline.

To test the application, a user uploads a .CSV file to S3. This dataset is labeled with fields that are recognized by the 2waygeocoder Lambda function. The application returns a processed dataset to S3 appended with location information from the Amazon Location Places API.

Solution overview

  1. The Scatter Lambda function takes a dataset from the S3 bucket labeled input and splits it into equally sized shards.
  2. The Process Lambda function takes each shard from the pre-processed bucket. It performs address validation in parallel with a 2waygeocoder function calling the Amazon Location Service Places API.
  3. The Gather Lambda function takes each shard from the post-processed bucket. It appends the data into a complete dataset with additional address information.

Amazon Location Service

Amazon Location Service sources high-quality geospatial data from HERE and ESRI to support searches by using a place index resource.

With the Amazon Locations Places API, you can convert addresses and other textual queries into geographic coordinates (also known as geocoding). You can also convert geographic positions into addresses and place descriptions (known as reverse geocoding).

The example application includes a 2waygeocoder capable of both geocoding and reverse geocoding. The next section shows examples of the call and response from the Amazon Location Places API for both geocoding and reverse geocoding.

Geocoding with Amazon Location Service

Here is an example of calling the Amazon Location Service Places API using the AWS SDK for Python (Boto3). This uses the search_place_index_for_text method:

Response = location.search_place_index_for_text(
	IndexName = ‘explore.place’ 
###index is created using Amazon Location service
	Text = “Boston, MA”)
location_response = Reponse[“Results”]
print(location_response)

Example response:

Response

Example reverse-geocoding with Amazon Location Service

Here is another example of calling the Amazon Location Service Places API using the AWS SDK for Python (boto3). This uses the search_place_index_for_position method:

Response = location.search_place_index_for_position(
	IndexName = ‘explore.place’ 
###index is created using Amazon Location service
	Position = “-71.056739, 42.358660”))
location_response = Reponse[“Results”]
print(location_response)

Example response:

Response

Design considerations

Processing data with Lambda in parallel using a serverless scatter/gather pipeline helps provide performance efficiency at lower cost. To provide even greater performance, you can optimize your Lambda configuration for higher throughput. There are several strategies you can implement to do this and a key few topics to keep in mind.

Increase the allocated memory for your Lambda function

The simplest way to increase throughput is to increase the allocated memory of the Lambda function.

Faster Lambda functions can process more data and increase throughput. This works even if a Lambda function’s memory utilization is low. This is because increasing memory also increases vCPUs in proportion to the amount configured. Each function supports up to 10 GB of memory and you can access up to six vCPUs per function.

To see the average cost and execution speed for each memory configuration, the Lambda Power Tuning tool helps to visualize the tradeoffs.

Optimize shard size

Another method for increasing performance in a serverless scatter/gather architecture is to optimize the total number of shards created by the scatter function. Increasing the total number of shards consequently reduces the size of any single shard, allowing Lambda to process each shard faster.

When scaling with Lambda, one instance of a function handles one request at a time. When the number of requests increases, Lambda creates more instances of the function to process traffic. Because S3 invokes Lambda asynchronously, there is an internal queue buffering requests between the event source and the Lambda service.

In a serverless scatter/gather architecture, having more shards results in more concurrent invocations of the process Lambda function. For more information about scaling and concurrency with Lambda, see this blog post. Increasing concurrency with Lambda can lead to API request throttling.

Consider API request throttling with your concurrent Lambda functions

In a serverless scatter/gather architecture, the rate at which your code calls APIs increases by a factor equal to the number of concurrent Lambda functions. This means API request limits can quickly be exceeded. You must consider Service Quotas and API request limits when trying to increase the performance of your serverless scatter/gather architecture.

For example, the Amazon Location Places APIs called in the processing function of this application has a default limit of 50 API requests per second. The 2waygeocoder calls on average about 12 APIs per second. Splitting the application into more than four shards may cause API throttling exception errors in this case. Requests to increase Service Quotas can be made through your AWS account.

Deploying the solution

You need the following perquisites to deploy the example application:

Deploy the example application:

  1. Clone the repository and download the sample source code to your environment where AWS SAM is installed:
    git clone https://github.com/aws-samples/amazon-location-service-serverless-address-validation
  2. Change into the project directory containing the template.yaml file:
    cd ~/environment/amazon-location-service-serverless-address-validation
  3. Build the application using AWS SAM:
    sam build
    Terminal output
  4. Deploy the application to your account using AWS SAM. Be sure to follow proper S3 naming conventions providing globally unique names for S3 buckets:
    sam deploy --guided
    Deployment output

Testing the application

Testing geocoding

To test the application, download the dataset that is linked in Testing the Application section of the GitHub repository. These tests demonstrate both the geocoding and reverse-geocoding capabilities of the application.

First, test the geocoding capabilities. You perform address validation on the City of Hartford Business Listing dataset linked in the GitHub repository. The dataset contains a listing of all the active businesses registered in the city Hartford, CT, and each business address. The GitHub repo links to an external website where you can download the dataset.

  1. Download the .csv version of the City of Hartford Business Listing dataset. The link is found in the Testing the Application section of the README file on GitHub.
  2. Open the file locally to explore its contents.
  3. Ensure that the .csv file contains columns labeled as “Address”, “City”, and “State”. The 2waygeocoder deployed as part of the AWS SAM template recognizes these columns to perform geocoding.
  4. Before testing the application’s geocoding capabilities, explore the pricing of Amazon Location Service. In order to save money, you can trim the length of the dataset for testing by removing rows. Once the dataset is trimmed to a desired length, navigate to S3 in the AWS Management Console.
  5. Upload the dataset to the S3 bucket labeled “input”. This triggers the scatter function.
  6. Navigate to the S3 bucket labeled “raw” to view the shards of your dataset created by the scatter function.
  7. Navigate to Lambda and select the 2waygeocoder function to view the CloudWatch Logs to see any information that is returned by the function code in near-real-time.
  8. Once the data is processed, navigate to the S3 bucket labeled “destination” to view the complete processed dataset that is created by the gather function. It may take several minutes for your dataset to finish processing.

Congratulations! You have successfully geocoded a dataset using Amazon Location Service with a serverless address validation pipeline.

Testing reverse-geocoding

Next, test the reverse-geocoding capabilities of the application. You perform address validation on the Miami Housing Dataset linked in the GitHub repository. This dataset contains information on 13,932 single-family homes sold in Miami. The repo links to an external website where you can download the dataset.

Before testing, explore the pricing of Amazon Location Service. To start the test:

  1. Download the zip file containing the .csv version of the dataset from . The link is found in the Testing the Application section of the README file on GitHub.
  2. Open the file locally to explore its contents.
  3. Ensure the .csv file contains columns A and B labeled “Latitude” and “Longitude”. You must edit these column headers to match the correct format that is recognized by the 2waygeocoder to perform reverse-geocoding. Only the “L” should be capitalized.
  4. To minimize cost, trim the length of the dataset for testing by removing rows. At the full size of ~13,933 rows, the dataset takes approx. 5 minutes to process.
  5. Once the dataset is trimmed to a desired length and both column A and B are labeled as “Latitude” and “Longitude” respectively, navigate to S3 in the AWS Management Console, and upload the dataset to your S3 bucket labeled “Input”.
  6. Navigate to the S3 bucket labeled “raw” to view the shards of your dataset.
  7. Navigate to Lambda and select the 2waygeocoder function to view the CloudWatch Logs to see any information that is returned by the function code in near-real-time.
  8. Navigate to the S3 bucket labeled “destination” to view the complete processed dataset that is created by the gather function. It may take several minutes for your dataset to finish processing.

Congratulations! You have successfully reverse-geocoded a dataset with Amazon Location Service using a serverless scatter/gather pipeline. You can move on to the conclusion, or continue to test the geocoding capabilities of the application with additional datasets.

Next steps

To get started testing your own datasets, use the AWS SAM template from GitHub deployed as part of this blog. Ensure that the labels in your dataset are labeled to match the constructs used in this blog post. The 2waygeocoder recognizes columns labeled “Latitude” and “Longitude” to perform reverse-geocoding, and “Address”, “City”, and “State” to perform geocoding.

Now that the data has been geocoded by Amazon Location Service and is in S3, you can use Amazon QuickSight geospatial charts to quickly and easily create interactive charts. For information on how to create a Dataset in QuickSight using Amazon S3 Files, check out the QuickSight User Guide.

Below is an example using QuickSight Geospatial charts to map the Miami housing dataset. The map shows average sale price by zipcode:

QuickSight map

This example uses QuickSight geospatial charts to map the City of Hartford Business dataset. The map shows DBA (doing business as) by latitude and longitude:

Dataset visualization

Conclusion

This blog post performs address validation with the Amazon Location Service, demonstrating both geocoding and reverse geocoding capabilities.

Using a serverless architecture with S3 and Lambda, you can achieve both cost optimization and performance improvement compared with traditional methods of address validation. Using this application, your organization can better understand and harness geospatial data.

For more serverless learning resources, visit Serverless Land.

ICYMI: Serverless Q4 2021

Post Syndicated from James Beswick original https://aws.amazon.com/blogs/compute/icymi-serverless-q4-2021/

Welcome to the 15th edition of the AWS Serverless ICYMI (in case you missed it) quarterly recap. Every quarter, we share all of the most recent product launches, feature enhancements, blog posts, webinars, Twitch live streams, and other interesting things that you might have missed!

Q4 calendar

In case you missed our last ICYMI, check out what happened last quarter here.

AWS Lambda

For developers using Amazon MSK as an event source, Lambda has expanded authentication options to include IAM, in addition to SASL/SCRAM. Lambda also now supports mutual TLS authentication for Amazon MSK and self-managed Kafka as an event source.

Lambda also launched features to make it easier to operate across AWS accounts. You can now invoke Lambda functions from Amazon SQS queues in different accounts. You must grant permission to the Lambda function’s execution role and have SQS grant cross-account permissions. For developers using container packaging for Lambda functions, Lambda also now supports pulling images from Amazon ECR in other AWS accounts. To learn about the permissions required, see this documentation.

The service now supports a partial batch response when using SQS as an event source for both standard and FIFO queues. When messages fail to process, Lambda marks the failed messages and allows reprocessing of only those messages. This helps to improve processing performance and may reduce compute costs.

Lambda launched content filtering options for functions using SQS, DynamoDB, and Kinesis as an event source. You can specify up to five filter criteria that are combined using OR logic. This uses the same content filtering language that’s used in Amazon EventBridge, and can dramatically reduce the number of downstream Lambda invocations.

Amazon EventBridge

Previously, you could consume Amazon S3 events in EventBridge via CloudTrail. Now, EventBridge receives events from the S3 service directly, making it easier to build serverless workflows triggered by activity in S3. You can use content filtering in rules to identify relevant events and forward these to 18 service targets, including AWS Lambda. You can also use event archive and replay, making it possible to reprocess events in testing, or in the event of an error.

AWS Step Functions

The AWS Batch console has added support for visualizing Step Functions workflows. This makes it easier to combine these services to orchestrate complex workflows over business-critical batch operations, such as data analysis or overnight processes.

Additionally, Amazon Athena has also added console support for visualizing Step Functions workflows. This can help when building distributed data processing pipelines, allowing Step Functions to orchestrate services such as AWS Glue, Amazon S3, or Amazon Kinesis Data Firehose.

Synchronous Express Workflows now supports AWS PrivateLink. This enables you to start these workflows privately from within your virtual private clouds (VPCs) without traversing the internet. To learn more about this feature, read the What’s New post.

Amazon SNS

Amazon SNS announced support for token-based authentication when sending push notifications to Apple devices. This creates a secure, stateless communication between SNS and the Apple Push Notification (APN) service.

SNS also launched the new PublishBatch API which enables developers to send up to 10 messages to SNS in a single request. This can reduce cost by up to 90%, since you need fewer API calls to publish the same number of messages to the service.

Amazon SQS

Amazon SQS released an enhanced DLQ management experience for standard queues. This allows you to redrive messages from a DLQ back to the source queue. This can be configured in the AWS Management Console, as shown here.

Amazon DynamoDB

The NoSQL Workbench for DynamoDB is a tool to simplify designing, visualizing and querying DynamoDB tables. The tools now supports importing sample data from CSV files and exporting the results of queries.

DynamoDB announced the new Standard-Infrequent Access table class. Use this for tables that store infrequently accessed data to reduce your costs by up to 60%. You can switch to the new table class without an impact on performance or availability and without changing application code.

AWS Amplify

AWS Amplify now allows developers to override Amplify-generated IAM, Amazon Cognito, and S3 configurations. This makes it easier to customize the generated resources to best meet your application’s requirements. To learn more about the “amplify override auth” command, visit the feature’s documentation.

Similarly, you can also add custom AWS resources using the AWS Cloud Development Kit (CDK) or AWS CloudFormation. In another new feature, developers can then export Amplify backends as CDK stacks and incorporate them into their deployment pipelines.

AWS Amplify UI has launched a new Authenticator component for React, Angular, and Vue.js. Aside from the visual refresh, this provides the easiest way to incorporate social sign-in in your frontend applications with zero-configuration setup. It also includes more customization options and form capabilities.

AWS launched AWS Amplify Studio, which automatically translates designs made in Figma to React UI component code. This enables you to connect UI components visually to backend data, providing a unified interface that can accelerate development.

AWS AppSync

You can now use custom domain names for AWS AppSync GraphQL endpoints. This enables you to specify a custom domain for both GraphQL API and Realtime API, and have AWS Certificate Manager provide and manage the certificate.

To learn more, read the feature’s documentation page.

News from other services

Serverless blog posts

October

November

December

AWS re:Invent breakouts

AWS re:Invent was held in Las Vegas from November 29 to December 3, 2021. The Serverless DA team presented numerous breakouts, workshops and chalk talks. Rewatch all our breakout content:

Serverlesspresso

We also launched an interactive serverless application at re:Invent to help customers get caffeinated!

Serverlesspresso is a contactless, serverless order management system for a physical coffee bar. The architecture comprises several serverless apps that support an ordering process from a customer’s smartphone to a real espresso bar. The customer can check the virtual line, place an order, and receive a notification when their drink is ready for pickup.

Serverlesspresso booth

You can learn more about the architecture and download the code repo at https://serverlessland.com/reinvent2021/serverlesspresso. You can also see a video of the exhibit.

Videos

Serverless Land videos

Serverless Office Hours – Tues 10 AM PT

Weekly live virtual office hours. In each session we talk about a specific topic or technology related to serverless and open it up to helping you with your real serverless challenges and issues. Ask us anything you want about serverless technologies and applications.

YouTube: youtube.com/serverlessland
Twitch: twitch.tv/aws

October

November

December

Still looking for more?

The Serverless landing page has more information. The Lambda resources page contains case studies, webinars, whitepapers, customer stories, reference architectures, and even more Getting Started tutorials.

You can also follow the Serverless Developer Advocacy team on Twitter to see the latest news, follow conversations, and interact with the team.

Building a serverless multi-player game that scales: Part 3

Post Syndicated from James Beswick original https://aws.amazon.com/blogs/compute/building-a-serverless-multi-player-game-that-scales-part-3/

This post is written by Tim Bruce, Sr. Solutions Architect, DevAx, Chelsie Delecki, Solutions Architect, DNB, and Brian Krygsman, Solutions Architect, Enterprise.

This blog series discusses building a serverless game that scales, using Simple Trivia Service:

  • Part 1 describes the overall architecture, how to deploy to your AWS account, and the different communication methods.
  • Part 2 describes adding automation to the game to help your teams scale.

This post discusses how the game scales to support concurrent users (CCU) under a load test. While this post focuses on Simple Trivia Service, you can apply the concepts to any serverless workload.

To set up the example, see the instructions in the Simple Trivia Service GitHub repo and the README.md file. This example uses services beyond AWS Free Tier and incurs charges. To remove the example from your account, see the README.md file.

Overview

Simple Trivia Service is launching at a new trivia conference. There are 200,000 registered attendees who are invited to play the game during the conference. The developers are following AWS Well-Architected best practice and load test before the launch.

Load testing is the practice of simulating user load to validate the system’s ability to scale. The focus of the load test is the game’s microservices, built using AWS Serverless services, including:

  • Amazon API Gateway and AWS IoT, which provide serverless endpoints, allowing users to interact with the Simple Trivia Service microservices.
  • AWS Lambda, which provides serverless compute services for the microservices.
  • Amazon DynamoDB, which provides a serverless NoSQL database for storing game data.

Preparing for load testing

Defining success criteria is one of the first steps in preparing for a load test. You use success criteria to determine how well the game meets the requirements and includes concurrent users, error rates, and response time. These three criteria help to ensure that your users have a good experience when playing your game.

Excluding one can lead to invalid assumptions about the scale of users that the game can support. If you exclude error rate goals, for example, users may encounter more errors, impacting their experience.

The success criteria used for Simple Trivia Service are:

  • 200,000 concurrent users split across game types.
  • Error rates below 0.05%.
  • 95th percentile synchronous responses under 1 second.

With these identified, you can develop dashboards to report on the targets. Dashboards allow you to monitor system metrics over the course of load tests. You can develop dashboards using Amazon CloudWatch dashboards, using custom widgets that organize and display metrics.

Common metrics to monitor include:

  • Error rates – total errors / total invocations.
  • Throttles – invocations resulting in 429 errors.
  • Percentage of quota usage – usage against your game’s Service Quotas.
  • Concurrent execution counts – maximum concurrent Lambda invocations.
  • Provisioned concurrency invocation rate – provisioned concurrency spillover invocation count / provisioned concurrency invocation count.
  • Latency – percentile-based response time, such as 90th and 95th percentiles.

Documentation and other services are also helpful during load testing. Centralized logging via Amazon CloudWatch Logs and AWS CloudTrail provide your team with operational data for the game. This data can help triage issues during testing.

System architecture documents provide key details to help your team focus their work during triage. Amazon DevOps Guru can also provide your team with potential solutions for issues. This uses machine learning to identify operational deviations and deployments and provides recommendations for resolving issues.

A load testing tool simplifies your testing, allowing you to model users playing the game. Popular load testing tools include Apache JMeter, Artillery.io Artillery, and Locust.io Locust. The load testing tool you select can act as your application client and access your endpoints directly.

This example uses Locust to load test Simple Trivia Service based on language and technical requirements. It allows you to accurately model usage and not only generate transactions. In production applications, select a tool that aligns to your team’s skills and meets your technical requirements.

You can place automation around load testing tool to reduce manual effort of running tests. Automation can include allocating environments, deploying and running test scripts, and collecting results. You can include this as part of your continuous integration/continuous delivery (CI/CD) pipeline. You can use the Distributed Load Testing on AWS solution to support Taurus-compatible load testing.

Also, document a plan, working backwards from your goals to help measure your progress. Plans typically use incremental growth of CCU, which can help you to identify constraints in your game. Use your plan while you are in development once portions of your game feature complete.

Testing plan for STS

This shows an example plan for load testing Simple Trivia Service:

  1. Start with individual game testing to validate tests and game modes separately.
  2. Add in testing of the three game modes together, mirroring expected real world activity.

Finally, evaluate your load test and architecture against your AWS Customer Agreement, AWS Acceptable Use Policy, Amazon EC2 Testing Policy, and the AWS Customer Support Policy for Penetration Testing. These policies are put in place to help you to be successful in your load testing efforts. AWS Support requires you to notify them at least two weeks prior to your load test using the Simulated Events Submission Form with the AWS Management Console. This form can also be used if you have questions before your load test.

Additional help for your load test may be available on the AWS Forums, AWS re:Post, or via your account team.

Testing

After triggering a test, automation scales up your infrastructure and initializes the test users. Depending on the number of users you need and their startup behavior, this ramp-up phase can take several minutes. Similarly, when the test run is complete, your test users should ramp down. Unless you have modeled the ramp-up and ramp-down phases to match real-world behavior, exclude these phases from your measurements. If you include them, you may optimize for unrealistic user behavior.

While tests are running, let metrics normalize before drawing conclusions. Services may report data at different rates. Investigate when you find metrics that cross your acceptable thresholds. You may need to make adjustments like adding Lambda Provisioned Concurrency or changing application code to resolve constraints. You may even need to re-evaluate your requirements based on how the system performs. When you make changes, re-test to verify any changes had the impact you expected before continuing with your plan.

Finally, keep an organized record of the inputs and outputs of tests, including dashboard exports and your own observations. This record is valuable when sharing test outcomes and comparing test runs. Mark your progress against the plan to stay on track.

Analyzing and improving Simple Trivia Service performance

Running the test plan, using observability tools to measure performance, finds opportunities to tune performance bottlenecks.

In this example, during single player individual tests, the dashboards show acceptable latency values. As the test size grows, increasing read capacity for retrieving leaderboards indicates a tuning opportunity:

Dashboard reads 1

Dashboard reads 2

  1. The CloudWatch dashboard reveals that the LeaderboardGet function is leading to high consumed read capacity for the Players DynamoDB table. A process within the function is querying scores and player records with every call to load avatar URLs
  2. Standardizing the player avatar URL process within the code reduces reads from the table. The update improves DynamoDB reads.

Moving into the full test phase of the plan with combined game types identified additional areas for performance optimization. In one case, dashboards highlight unexpected error rates for a Lambda function. Consulting function logs and DevOps Guru to triage the behavior, these show a downstream issue with an Amazon Kinesis Data Stream:

Identifying error rates in dashboards

  1. DevOps Guru, within an insight, highlights the problem of the Kinesis:WriteProvisionedThroughputExceeded metric during our test window
  2. DevOps Guru also correlates that metric with the Kinesis:GetRecords.Latency metric.

DevOps Guru also links to a recommendation for Kinesis Data Streams to troubleshoot and resolve the incident with the data stream. Following this advice helps to resolve the Lambda error rates during the next test.

Load testing results

By following the plan, making incremental changes as optimizations became apparent, you can reach the goals.

Table of results

The preceding table is a summary of data from Amazon CloudWatch Lambda Insights and statistics captured from Locust:

  1. The test exceeded the goal of 200k CCU with a combined total of 236,820 CCU.
  2. Less than 0.05% error rate with a combined average of 0.010%.
  3. Performance goals are achieved without needing Provisioned Concurrency in Lambda.

Function latency

Function concurrency and throttles

  1. The function latency goal of < 1 second is met, based on data from CloudWatch Lambda Insights.
  2. Function concurrency is below Service Quotas for Lambda during the test, based on data from our custom CloudWatch dashboard.

Conclusion

This post discusses how to perform a load test on a serverless workload. The process was used to validate a scale of Simple Trivia Service, a single- and multi-player game built using a serverless-first architecture on AWS. The results show a scale of over 220,000 CCUs while maintaining less than 1-second response time and an error rate under 0.05%.

For more serverless learning resources, visit Serverless Land.

Using an Amazon MQ network of broker topologies for distributed microservices

Post Syndicated from James Beswick original https://aws.amazon.com/blogs/compute/using-an-amazon-mq-network-of-broker-topologies-for-distributed-microservices/

This post is written by Suranjan Choudhury Senior Manager SA and Anil Sharma, Apps Modernization SA.

This blog looks at ActiveMQ topologies that customers can evaluate when planning hybrid deployment architectures spanning AWS Regions and customer data centers, using a network of brokers. A network of brokers can have brokers on-premises and Amazon MQ brokers on AWS.

Distributing broker nodes across AWS and on-premises allows for messaging infrastructure to scale, provide higher performance, and improve reliability. This post also explains a topology spanning two Regions and demonstrates how to deploy on AWS.

A network of brokers is composed of multiple simultaneously active single-instance brokers or active/standby brokers. A network of brokers provides a large-scale messaging fabric in which multiple brokers are networked together. It allows a system to survive the failure of a broker. It also allows distributed messaging. Applications on remote, disparate networks can exchange messages with each other. A network of brokers helps to scale the overall broker throughput in your network, providing increased availability and performance.

Types of ActiveMQ topologies

Network of brokers can be configured in a variety of topologies – for example, mesh, concentrator, and hub and spoke. The topology depends on requirements such as security and network policies, reliability, scaling and throughput, and management and operational overheads. You can configure individual brokers to operate as a single broker or in an active/standby configuration.

Mesh topology

Mesh topology

A mesh topology provides multiple brokers that are all connected to each other. This example connects three single-instance brokers, but you can configure more brokers as a mesh. The mesh topology needs subnet security group rules to be opened for allowing brokers in internal subnets to communicate with brokers in external subnets.

For scaling, it’s simpler to add new brokers for incrementing overall broker capacity. The mesh topology by design offers higher reliability with no single point of failure. Operationally, adding or deleting of nodes requires broker re-configuration and restarting the broker service.

Concentrator topology

Concentrator topology

In a concentrator topology, you deploy brokers in two (or more) layers to funnel incoming connections into a smaller collection of services. This topology allows segmenting brokers into internal and external subnets without any additional security group changes. If additional capacity is needed, you can add new brokers without needing to update other brokers’ configurations. The concentrator topology provides higher reliability with alternate paths for each broker. This enables hybrid deployments with lower operational overheads.

Hub and spoke topology

Hub and spoke topology

A hub and spoke topology preserves messages if there is disruption to any broker on a spoke. Messages are forwarded throughout and only the central Broker1 is critical to the network’s operation. Subnet security group rules must be opened to allow brokers in internal subnets to communicate with brokers in external subnets.

Adding brokers for scalability is constrained by the hub’s capacity. Hubs are a single point of failure and should be configured as active-standby to increase reliability. In this topology, depending on the location of the hub, there may be increased bandwidth needs and latency challenges.

Using a concentrator topology for large-scale hybrid deployments

When planning deployments spanning AWS and customer data centers, the starting point is the concentrator topology. The brokers are deployed in tiers such that brokers in each tier connect to fewer brokers at the next tier. This allows you to funnel connections and messages from a large number of producers to a smaller number of brokers. This concentrates messages at fewer subscribers:

Hybrid deployment topology

Deploying ActiveMQ brokers across Regions and on-premises

When placing brokers on-premises and in the AWS Cloud in a hybrid network of broker topologies, security and network routing are key. The following diagram shows a typical hybrid topology:

Typical hybrid topology

Amazon MQ brokers on premises are placed behind a firewall. They can communicate to Amazon MQ brokers through an IPsec tunnel terminating on the on-premises firewall. On the AWS side, this tunnel terminates on an AWS Transit Gateway (TGW). The TGW routes all network traffic to a firewall in AWS in a service VPC.

The firewall inspects the network traffic and routes all inspected traffic sent back to the transit gateway. The TGW, based on routing configured, sends the traffic to the Amazon MQ broker in the application VPC. This broker concentrates messages from Amazon MQ brokers hosted on AWS. The on premises brokers and the AWS brokers form a hybrid network of brokers that spans AWS and customer data center. This allows applications and services to communicate securely. This architecture exposes only the concentrating broker to receive and send messages to the broker on premises. The applications are protected from outside, non-validated network traffic.

This blog shows how to create a cross-Region network of brokers. This topology removes multiple brokers in the internal subnet. However, in a production environment, you have multiple brokers’ internal subnets catering to multiple producers and consumers. This topology spans an AWS Region and an on-premises customer data center represented in a second AWS Region:

Cross-Region topology

Best practices for configuring network of brokers

Client-side failover

In a network of brokers, failover transport configures a reconnect mechanism on top of the transport protocols. The configuration allows you to specify multiple URIs to connect to. An additional configuration using the randomize transport option allows for random selection of the URI when re-establishing a connection.

The example Lambda functions provided in this blog use the following configuration:

//Failover URI
failoverURI = "failover:(" + uri1 + "," + uri2 + ")?randomize=True";

Broker side failover

Dynamic failover allows a broker to receive a list of all other brokers in the network. It can use the configuration to update producer and consumer clients with this list. The clients can update to rebalance connections to these brokers.

In the broker configuration in this blog, the following configuration is set up:

<transportConnectors> <transportConnector name="openwire" updateClusterClients="true" updateClusterClientsOnRemove = "false" rebalanceClusterClients="true"/> </transportConnectors>

Network connector properties – TTL and duplex

TTL values allow messages to traverse through the network. There are two TTL values – messageTTL and consumerTTL. Another way is to set up the network TTL, which sets both the message and consumer TTL.

The duplex option allows for creating a bidirectional path between two brokers for sending and receiving messages. This blog uses the following configuration:

<networkConnector name="connector_1_to_3" networkTTL="5" uri="static:(ssl://xxxxxxxxx.mq.us-east-2.amazonaws.com:61617)" userName="MQUserName"/>

Connection pooling for producers

In the example Lambda function, a pooled connection factory object is created to optimize connections to broker:

// Create a conn factory

final ActiveMQSslConnectionFactory connFacty = new ActiveMQSslConnectionFactory(failoverURI);
connFacty.setConnectResponseTimeout(10000);
return connFacty;

// Create a pooled conn factory

final PooledConnectionFactory pooledConnFacty = new PooledConnectionFactory();
pooledConnFacty.setMaxConnections(10);
pooledConnFacty.setConnectionFactory(connFacty);
return pooledConnFacty;

Deploying the example solution

  1. Create an IAM role for Lambda by following the steps at https://github.com/aws-samples/aws-mq-network-of-brokers#setup-steps.
  2. Create the network of brokers in the first Region. Navigate to the CloudFormation console and choose Create stack:
    Stack name
  3. Provide the parameters for the network configuration section:
    Network configuration
  4. In the Amazon MQ configuration section, configure the following parameters. Ensure that these two parameter values are the same in both Regions.
    MQ configuration
  5. Configure the following in the Lambda configuration section. Deploy mqproducer and mqconsumer in two separate Regions:
    Lambda Configuration
  6. Create the network of brokers in the second Region. Repeat step 2 to create the network of brokers in the second Region. Ensure that the VPC CIDR in region2 is different than the one in region1. Ensure that the user name and password are the same as in the first Region.
  7. Complete VPC peering and updating route tables:
    1. Follow the steps here to complete VPC peering between the two VPCs.
    2. Update the route tables in both the VPC.
    3. Enable DNS resolution for the peering connection.
      Route table
  8. Configure the network of brokers and create network connectors:
    1. In region1, choose Broker3. In the Connections section, copy the endpoint for the openwire protocol.
    2. In region2 on broker3, set up the network of brokers using the networkConnector configuration element.
      Brokers
    3. Edit the configuration revision and add a new NetworkConnector within the NetworkConnectors section. Replace the uri with the URI for the broker3 in region1.
      <networkConnector name="broker3inRegion2_to_ broker3inRegion1" duplex="true" networkTTL="5" userName="MQUserName" uri="static:(ssl://b-123ab4c5-6d7e-8f9g-ab85-fc222b8ac102-1.mq.ap-south-1.amazonaws.com:61617)" />
  9. Send a test message using the mqProducer Lambda function in region1. Invoke the producer Lambda function:
    aws lambda invoke --function-name mqProducer out --log-type Tail --query 'LogResult' --output text | base64 -d

    Terminal output

  10. Receive the test message. In region2, invoke the consumer Lambda function:
    aws lambda invoke --function-name mqConsumer out --log-type Tail --query 'LogResult' --output text | base64 -d

    Terminal response

The message receipt confirms that the message has crossed the network of brokers from region1 to region2.

Cleaning up

To avoid incurring ongoing charges, delete all the resources by following the steps at https://github.com/aws-samples/aws-mq-network-of-brokers#clean-up.

Conclusion

This blog explains the choices when designing a cross-Region or a hybrid network of brokers architecture that spans AWS and your data centers. The example starts with a concentrator topology and enhances that with a cross-Region design to help address network routing and network security requirements.

The blog provides a template that you can modify to suit specific network and distributed application scenarios. It also covers best practices when architecting and designing failover strategies for a network of brokers or when developing producers and consumers client applications.

The Lambda functions used as producer and consumer applications demonstrate best practices in designing and developing ActiveMQ clients. This includes storing and retrieving parameters, such as passwords from the AWS Systems Manager.

For more serverless learning resources, visit Serverless Land.

Visualizing AWS Step Functions workflows from the Amazon Athena console

Post Syndicated from James Beswick original https://aws.amazon.com/blogs/compute/visualizing-aws-step-functions-workflows-from-the-amazon-athena-console/

This post is written by Dhiraj Mahapatro, Senior Specialist SA, Serverless.

In October 2021, AWS announced visualizing AWS Step Functions from the AWS Batch console. Now you can also visualize Step Functions from the Amazon Athena console.

Amazon Athena is an interactive query service that makes it easier to analyze Amazon S3 data using standard SQL. Athena is a serverless service and can interact directly with data stored in S3. Athena can process unstructured, semistructured, and structured datasets.

AWS Step Functions is a low-code visual workflow service used to orchestrate AWS services, automate business processes, and build serverless applications. Step Functions workflows manage failures, retries, parallelization, service integrations, and observability so builders can focus on business logic. Athena is one of the service integrations that are available for Step Functions.

This blog walks through Step Functions integration in Amazon Athena console. It shows how you can visualize and operate Athena queries at scale using Step Functions.

Introducing workflow orchestration in Amazon Athena console

AWS customers store large amounts of historical data on S3 and query the data using Athena to get results quickly. They also use Athena to process unstructured data or analyze structured data as part of a data processing pipeline.

Data processing involves discrete steps for ingesting, processing, storing the transformed data, and post-processing, such as visualizing or analyzing the transformed data. Each step involves multiple AWS services. With Step Functions workflow integration, you can orchestrate these steps. This helps to create repeatable and scalable data processing pipelines as part of a larger business application and visualize the workflows in the Athena console.

With Step Functions, you can run queries on a schedule or based on an event by using Amazon EventBridge. You can poll long-running Athena queries before moving to the next step in the process, and handle errors without writing custom code. Combining these two services provides developers with a single method that is scalable and repeatable.

Step Functions workflows in the Amazon Athena console allow orchestration of Athena queries with Step Functions state machines:

Athena console

Using Athena query patterns from Step Functions

Execute multiple queries

In Athena, you run SQL queries in the Athena console against Athena workgroups. With Step Functions, you can run Athena queries in a sequence or run independent queries simultaneously in parallel using a parallel state. Step Functions also natively handles errors and retries related to Athena query tasks.

Workflow orchestration in the Athena console provides these capabilities to run and visualize multiple queries in Step Functions. For example:

UI flow

  1. Choose Get Started from Execute multiple queries.
  2. From the pop-up, choose Create your own workflow and select Continue.

A new browser tab opens with the Step Functions Workflow Studio. The designer shows a workflow pattern template pre-created. The workflow loads data from a data source running two Athena queries in parallel. The results are then published to an Amazon SNS topic.

Alternatively, choosing Deploy a sample project from the Get Started pop-up deploys a sample Step Functions workflow.

Get started flow

This option creates a state machine. You then review the workflow definition, deploy an AWS CloudFormation stack, and run the workflow in the Step Functions console.

Deploy and run

Once deployed, the state machine is visible in the Step Functions console as:

State machines

Select the AthenaMultipleQueriesStateMachine to land on the details page:

Details page

The CloudFormation template provisions the required AWS Glue database, S3 bucket, an Athena workgroup, the required AWS Lambda functions, and the SNS topic for query results notification.

To see the Step Functions workflow in action, choose Start execution. Keep the optional name and input and choose Start execution:

Start execution

The state machine completes the tasks successfully by Executing multiple queries in parallel using Amazon Athena and Sending query results using the SNS topic:

Successful execution

The state machine used the Amazon Athena StartQueryExecution and GetQueryResults tasks. The Workflow orchestration in Athena console now highlights this newly created Step Functions state machine:

Athena console

Any state machine that uses this task in Step Functions in this account is listed here as a state machine that orchestrates Athena queries.

Query large datasets

You can also ingest an extensive dataset in Amazon S3, partition it using AWS Glue crawlers, then run Amazon Athena queries against that partition.

Select Get Started from the Query large datasets pop-up, then choose Create your own workflow and Continue. This action opens the Step Functions Workflow studio with the following pattern. The Glue crawler starts and partitions large datasets for Athena to query in the subsequent query execution task:

Query large datasets

Step Functions allows you to combine Glue crawler tasks and Athena queries to partition where necessary before querying and publishing the results.

Keeping data up to date

You can also use Athena to query a target table to fetch data, then update it with new data from other sources using Step Functions’ choice state. The choice state in Step Functions provides branching logic for a state machine.

Keep data up to date

You are not limited to the previous three patterns shown in workflow orchestration in the Athena console. You can start from scratch and build Step Functions state machine by navigating to the bottom right and using Create state machine:

Create state machine

Create State Machine in the Athena console opens a new tab showing the Step Functions console’s Create state machine page.

Choosing authoring method

Refer to building a state machine AWS Step Functions Workflow Studio for additional details.

Step Functions integrates with all Amazon Athena’s API actions

In September 2021, Step Functions announced integration support for 200 AWS services to enable easier workflow automation. With this announcement, Step Functions can integrate with all Amazon Athena API actions today.

Step Functions can automate the lifecycle of an Athena query: Create/read/update/delete/list workGroups; Create/read/update/delete/list data catalogs, and more.

Other AWS service integrations

Step Functions’ integration with the AWS SDK provides support for 200 AWS Services and over 9,000 API actions. Athena tasks in Step Functions can evolve by integrating available AWS services in the workflow for their pre and post-processing needs.

For example, you can read Athena query results that are put to an S3 bucket by using a GetObject S3 task AWS SDK integration in Step Functions. You can combine different AWS services into a single business process so that they can ingest data through Amazon Kinesis, do processing via AWS Lambda or Amazon EMR jobs, and send notifications to interested parties via Amazon SNS or Amazon SQS or Amazon EventBridge to trigger other parts of their business application.

There are multiple ways to decorate around an Amazon Athena job task. Refer to AWS SDK service integrations and optimized integrations for Step Functions for additional details.

Important considerations

Workflow orchestrations in the Athena console only show Step Functions state machines that use Athena’s optimized API integrations. This includes StartQueryExecution, StopQueryExecution, GetQueryExecution, and GetQueryResults.

Step Functions state machines do not show in the Athena console when:

  1. A state machine uses any other AWS SDK Athena API integration task.
  2. The APIs are invoked inside a Lambda function task using an AWS SDK client (like Boto3 or Node.js or Java).

Cleanup

First, empty DataBucket and AthenaWorkGroup to delete the stack successfully. To delete the sample application stack, use the latest version of AWS CLI and run:

aws cloudformation delete-stack --stack-name <stack-name>

Alternatively, delete the sample application stack in the CloudFormation console by selecting the stack and choosing Delete:

Stack deletion

Conclusion

Amazon Athena console now provides an integration with AWS Step Functions’ workflows. You can use the provided patterns to create and visualize Step Functions’ workflows directly from the Amazon Athena console. Step Functions’ workflows that use Athena’s optimized API integration appear in the Athena console. To learn more about Amazon Athena, read the user guide.

To get started, open the Workflows page in the Athena console. Select Create Athena jobs with Step Functions Workflows to deploy a sample project, if you are new to Step Functions.

For more serverless learning resources, visit Serverless Land.

Expanding cross-Region event routing with Amazon EventBridge

Post Syndicated from James Beswick original https://aws.amazon.com/blogs/compute/expanding-cross-region-event-routing-with-amazon-eventbridge/

This post is written by Stephen Liedig, Sr Serverless Specialist SA.

In April 2021, AWS announced a new feature for Amazon EventBridge that allows you to route events from any commercial AWS Region to US East (N. Virginia), US West (Oregon), and Europe (Ireland). From today, you can now route events between any AWS Regions, except AWS GovCloud (US) and China.

EventBridge enables developers to create event-driven applications by routing events between AWS services, integrated software as a service (SaaS) applications, and your own applications. This helps you produce loosely coupled, distributed, and maintainable architectures. With these new capabilities, you can now route events across Regions and accounts using the same model used to route events to existing targets.

Cross-Region event routing with Amazon EventBridge makes it easier for customers to develop multi-Region workloads to:

  • Centralize your AWS events into one Region for auditing and monitoring purposes, such as aggregating security events for compliance reasons in a single account.
  • Replicate events from source to destinations Regions to help synchronize data in cross-Region data stores.
  • Invoke asynchronous workflows in a different Region from a source event. For example, you can load balance from a target Region by routing events to another Region.

A previous post shows how cross-Region routing works. This blog post expands on these concepts and discusses a common use case for cross-Region event delivery – event auditing. This example explores how you can manage resources using AWS CloudFormation and EventBridge resource policies.

Multi-Region event auditing example walkthrough

Compliance is an important part of building event-driven applications and reacting to any potential policy or security violations. Customers use EventBridge to route security events from applications and globally distributed infrastructure into a single account for analysis. In many cases, they share specific AWS CloudTrail events with security teams. Customers also audit events from their custom-built applications to monitor sensitive data usage.

In this scenario, a company has their base of operations located in Asia Pacific (Singapore) with applications distributed across US East (N. Virginia) and Europe (Frankfurt). The applications in US East (N. Virginia) and Europe (Frankfurt) are using EventBridge for their respective applications and services. The security team in Asia Pacific (Singapore) wants to analyze events from the applications and CloudTrail events for specific API calls to monitor infrastructure security.

Reference architecture

To create the rules to receive these events:

  1. Create a new set of rules directly on all the event buses across the global infrastructure. Alternatively, delegate the responsibility of managing security rules to distributed teams that manage the event bus resources.
  2. Provide the security team with the ability to manage rules centrally, and control the lifecycle of rules on the global infrastructure.

Allowing the security team to manage the resources centrally provides more scalability. It is more consistent with the design principle that event consumers own and manage the rules that define how they process events.

Deploying the example application

The following code snippets are shortened for brevity. The full source code of the solution is in the GitHub repository. The solution uses AWS Serverless Application Model (AWS SAM) for deployment. Clone the repo and navigate to the solution directory:

git clone https://github.com/aws-samples/amazon-eventbridge-resource-policy-samples
cd ./patterns/ cross-region-cross-account-pattern/

To allow the security team to start receiving accounts from any of the cross-Region accounts:

1. Create a security event bus in the Asia Pacific (Singapore) Region with a rule that processes events from the respective event sources.

ap-southest-1 architecture

For simplicity, this example uses an Amazon CloudWatch Logs target to visualize the events arriving from cross-Region accounts:

 SecurityEventBus:
  Type: AWS::Events::EventBus
  Properties:
   Name: !Ref SecurityEventBusName

 # This rule processes events coming in from cross-Region accounts
 SecurityAnalysisRule:
  Type: AWS::Events::Rule
  Properties:
   Name: SecurityAnalysisRule
   Description: Analyze events from cross-Region event buses
   EventBusName: !GetAtt SecurityEventBus.Arn
   EventPattern:
    source:
     - anything-but: com.company.security
   State: ENABLED
   RoleArn: !GetAtt WriteToCwlRole.Arn
   Targets:
    - Id: SendEventToSecurityAnalysisRule
     Arn: !Sub "arn:aws:logs:${AWS::Region}:${AWS::AccountId}:log-group:${SecurityAnalysisRuleTarget}"

In this example, you set the event pattern to process any event from a source that is not from the security team’s own domain. This allows you to process events from any account in any Region. You can filter this further as needed.

2. Set an event bus policy on each default and custom event bus that the security team must receive events from.

Event bus policy

This policy allows the security team to create rules to route events to its own security event bus in the Asia Pacific (Singapore) Region. The following policy defines a custom event bus in Account 2 in US East (N. Virginia) and an AWS::Events::EventBusPolicy that sets the Principal as the security team account.

This allows the security team to manage rules on the CustomEventBus:

 CustomEventBus: 
  Type: AWS::Events::EventBus
  Properties: 
    Name: !Ref EventBusName

 SecurityServiceRuleCreationStatement:
  Type: AWS::Events::EventBusPolicy
  Properties:
   EventBusName: !Ref CustomEventBus # If you omit this, the default event bus is used.
   StatementId: "AllowCrossRegionRulesForSecurityTeam"
   Statement:
    Effect: "Allow"
    Principal:
     AWS: !Sub "arn:aws:iam::${SecurityAccountNo}:root"
    Action:
     - "events:PutRule"
     - "events:DeleteRule"
     - "events:DescribeRule"
     - "events:DisableRule"
     - "events:EnableRule"
     - "events:PutTargets"
     - "events:RemoveTargets"
    Resource:
     - !Sub 'arn:aws:events:${AWS::Region}:${AWS::AccountId}:rule/${CustomEventBus.Name}/*'
    Condition:
     StringEqualsIfExists:
      "events:creatorAccount": "${aws:PrincipalAccount}"

3. With the policies set on the cross-Region accounts, now create the rules. Because you cannot create CloudFormation resources across Regions, you must define the rules in separate templates. This also gives the ability to expand to other Regions.

Once the template is deployed to the cross-Region accounts, use EventBridge resource policies to propagate rule definitions across accounts in the same Region. The security account must have permission to create CloudFormation resources in the cross-Region accounts to deploy the rule templates.

Resource policies

There are two parts to the rule templates. The first specifies a role that allows EventBridge to assume a role to send events to the target event bus in the security account:

 # This IAM role allows EventBridge to assume the permissions necessary to send events
 # from the source event buses to the destination event bus.
 SourceToDestinationEventBusRole:
  Type: "AWS::IAM::Role"
  Properties:
   AssumeRolePolicyDocument:
    Version: 2012-10-17
    Statement:
     - Effect: Allow
      Principal:
       Service:
        - events.amazonaws.com
      Action:
       - "sts:AssumeRole"
   Path: /
   Policies:
    - PolicyName: PutEventsOnDestinationEventBus
     PolicyDocument:
      Version: 2012-10-17
      Statement:
       - Effect: Allow
        Action: "events:PutEvents"
        Resource:
         - !Ref SecurityEventBusArn

The second is the definition of the rule resource. This requires the Amazon Resource Name (ARN) of the event bus where you want to put the rule, the ARN of the target event bus in the security account, and a reference to the SourceToDestinationEventBusRole role:

 SecurityAuditRule2:
  Type: AWS::Events::Rule
  Properties:
   Name: SecurityAuditRuleAccount2
   Description: Audit rule for the Security team in Singapore
   EventBusName: !Ref EventBusArnAccount2 # ARN of the custom event bus in Account 2
   EventPattern:
    source:
     - com.company.marketing
   State: ENABLED
   Targets:
    - Id: SendEventToSecurityEventBusArn
     Arn: !Ref SecurityEventBusArn
     RoleArn: !GetAtt SourceToDestinationEventBusRole.Arn

You can use the AWS SAM CLI to deploy this:

sam deploy -t us-east-1-rules.yaml \
  --stack-name us-east-1-rules \
  --region us-east-1 \
  --profile default \
  --capabilities=CAPABILITY_IAM \
  --parameter-overrides SecurityEventBusArn="arn:aws:events:ap-southeast-1:111111111111:event-bus/SecurityEventBus" EventBusArnAccount1="arn:aws:events:us-east-1:111111111111:event-bus/default" EventBusArnAccount2="arn:aws:events:us-east-1:222222222222:event-bus/custom-eventbus-account-2"

Testing the example application

With the rules deployed across the Regions, you can test by sending events to the event bus in Account 2:

  1. Navigate to the applications/account_2 directory. Here you find an events.json file, which you use as input for the put-events API call.
  2. Run the following command using the AWS CLI. This sends messages to the event bus in us-east-1 which are routed to the security event bus in ap-southeast-1:
    aws events put-events \
     --region us-east-1 \
     --profile [NAMED PROFILE FOR ACCOUNT 2] \
     --entries file://events.json
    

    If you have run this successfully, you see:
    Entries:
    - EventId: a423b35e-3df0-e5dc-b854-db9c42144fa2
    - EventId: 5f22aea8-51ea-371f-7a5f-8300f1c93973
    - EventId: 7279fa46-11a6-7495-d7bb-436e391cfcab
    - EventId: b1e1ecc1-03f7-e3ef-9aa4-5ac3c8625cc7
    - EventId: b68cea94-28e2-bfb9-7b1f-9b2c5089f430
    - EventId: fc48a303-a1b2-bda8-8488-32daa5f809d8
    FailedEntryCount: 0

  3. Navigate to the Amazon CloudWatch console to see a collection of log entries with the events you published. The log group is /aws/events/SecurityAnalysisRule.CloudWatch Logs

Congratulations, you have successfully sent your first events across accounts and Regions!

Conclusion

With cross-Region event routing in EventBridge, you can now route events to and from any AWS Region. This post explains how to manage and configure cross-Region event routing using CloudFormation and EventBridge resource policies to simplify rule propagation across your global event bus infrastructure. Finally, I walk through an example you can deploy to your AWS account.

For more serverless learning resources, visit Serverless Land.

Deploying AWS Lambda layers automatically across multiple Regions

Post Syndicated from James Beswick original https://aws.amazon.com/blogs/compute/deploying-aws-lambda-layers-automatically-across-multiple-regions/

This post is written by Ben Freiberg, Solutions Architect, and Markus Ziller, Solutions Architect.

Many developers import libraries and dependencies into their AWS Lambda functions. These dependencies can be zipped and uploaded as part of the build and deployment process but it’s often easier to use Lambda layers instead.

A Lambda layer is an archive containing additional code, such as libraries or dependencies. Layers are deployed as immutable versions, and the version number increments each time you publish a new layer. When you include a layer in a function, you specify the layer version you want to use.

Lambda layers simplify and speed up the development process by providing common dependencies and reducing the deployment size of your Lambda functions. To learn more, refer to Using Lambda layers to simplify your development process.

Many customers build Lambda layers for use across multiple Regions. But maintaining up-to-date and consistent layer versions across multiple Regions is a manual process. Layers are set as private automatically but they can be shared with other AWS accounts or shared publicly. Permissions only apply to a single version of a layer. This solution automates the creation and deployment of Lambda layers across multiple Regions from a centralized pipeline.

Overview of the solution

This solution uses AWS Lambda, AWS CodeCommit, AWS CodeBuild and AWS CodePipeline.

Reference architecture

This diagram outlines the workflow implemented in this blog:

  1. A CodeCommit repository contains the language-specific definition of dependencies and libraries that the layer contains, such as package.json for Node.js or requirements.txt for Python. Each commit to the main branch triggers an execution of the surrounding CodePipeline.
  2. A CodeBuild job uses the provided buildspec.yaml to create a zipped archive containing the layer contents. CodePipeline automatically stores the output of the CodeBuild job as artifacts in a dedicated Amazon S3 bucket.
  3. A Lambda function is invoked for each configured Region.
  4. The function first downloads the zip archive from S3.
  5. Next, the function creates the layer version in the specified Region with the configured permissions.

Walkthrough

The following walkthrough explains the components and how the provisioning can be automated via CDK. For this walkthrough, you need:

To deploy the sample stack:

  1. Clone the associated GitHub repository by running the following command in a local directory:
    git clone https://github.com/aws-samples/multi-region-lambda-layers
  2. Open the repository in your preferred editor and review the contents of the src and cdk folder.
  3. Follow the instructions in the README.md to deploy the stack.
  4. Check the execution history of your pipeline in the AWS Management Console. The pipeline has been started once already and published a first version of the Lambda layer.
    Execution history

Code repository

The source code of the Lambda layers is stored in AWS CodeCommit. This is a secure, highly scalable, managed source control service that hosts private Git repositories. This example initializes a new repository as part of the CDK stack:

    const asset = new Asset(this, 'SampleAsset', {
      path: path.join(__dirname, '../../res')
    });

    const cfnRepository = new codecommit.CfnRepository(this, 'lambda-layer-source', {
      repositoryName: 'lambda-layer-source',
      repositoryDescription: 'Contains the source code for a nodejs12+14 Lambda layer.',
      code: {
        branchName: 'main',
        s3: {
          bucket: asset.s3BucketName,
          key: asset.s3ObjectKey
        }
      },
    });

This code uploads the contents of the ./cdk/res/ folder to an S3 bucket that is managed by the CDK. The CDK then initializes a new CodeCommit repository with the contents of the bucket. In this case, the repository gets initialized with the following files:

  • LICENSE: A text file describing the license for this Lambda layer
  • package.json: In Node.js, the package.json file is a manifest for projects. It defines dependencies, scripts, and metainformation about the project. The npm install command installs all project dependencies in a node_modules folder. This is where you define the contents of the Lambda layer.

The default package.json in the sample code defines a Lambda layer with the latest version of the AWS SDK for JavaScript:

{
    "name": "lambda-layer",
    "version": "1.0.0",
    "description": "Sample AWS Lambda layer",
    "dependencies": {
      "aws-sdk": "latest"
    }
}

To see what is included in the layer, run npm install in the ./cdk/res/ directory. This shows the files that are bundled into the Lambda layer. The contents of this folder initialize the CodeCommit repository, so delete node_modules and package-lock.json inspecting these files.

Node modules directory

This blog post uses a new CodeCommit repository as the source but you can adapt this to other providers. CodePipeline also supports repositories on GitHub and Bitbucket. To connect to those providers, see the documentation.

CI/CD Pipeline

CodePipeline automates the process of building and distributing Lambda layers across Region for every change to the main branch of the source repository. It is a fully managed continuous delivery service that helps you automate your release pipelines for fast and reliable application and infrastructure updates. CodePipeline automates the build, test, and deploy phases of your release process every time there is a code change, based on the release model you define.

The CDK creates a pipeline in CodePipeline and configures it so that every change to the code base of the Lambda layer runs through the following three stages:

new codepipeline.Pipeline(this, 'Pipeline', {
      pipelineName: 'LambdaLayerBuilderPipeline',
      stages: [
        {
          stageName: 'Source',
          actions: [sourceAction]
        },
        {
          stageName: 'Build',
          actions: [buildAction]
        },
        {
          stageName: 'Distribute',
          actions: parallel,
        }
      ]
    });

Source

The source phase is the first phase of every run of the pipeline. It is typically triggered by a new commit to the main branch of the source repository. You can also start the source phase manually with the following AWS CLI command:

aws codepipeline start-pipeline-execution --name LambdaLayerBuilderPipeline

When started manually, the current head of the main branch is used. Otherwise CodePipeline checks out the code in the revision of the commit that triggered the pipeline execution.

CodePipeline stores the code locally and uses it as an output artifact of the Source stage. Stages use input and output artifacts that are stored in the Amazon S3 artifact bucket you chose when you created the pipeline. CodePipeline zips and transfers the files for input or output artifacts as appropriate for the action type in the stage.

Build

In the second phase of the pipeline, CodePipeline installs all dependencies and packages according to the specs of the targeted Lambda runtime. CodeBuild is a fully managed build service in the cloud. It reduces the need to provision, manage, and scale your own build servers. It provides prepackaged build environments for popular programming languages and build tools like npm for Node.js.

In CodeBuild, you use build specifications (buildspecs) to define what commands need to run to build your application. Here, it runs commands in a provisioned Docker image with Amazon Linux 2 to do the following:

  • Create the folder structure expected by Lambda Layer.
  • Run npm install to install all Node.js dependencies.
  • Package the code into a layer.zip file and define layer.zip as output of the Build stage.

The following CDK code highlights the specifications of the CodeBuild project.

const buildAction = new codebuild.PipelineProject(this, 'lambda-layer-builder', {
      buildSpec: codebuild.BuildSpec.fromObject({
        version: '0.2',
        phases: {
          install: {
            commands: [
              'mkdir -p node_layer/nodejs',
              'cp package.json ./node_layer/nodejs/package.json',
              'cd ./node_layer/nodejs',
              'npm install',
            ]
          },
          build: {
            commands: [
              'rm package-lock.json',
              'cd ..',
              'zip ../layer.zip * -r',
            ]
          }
        },
        artifacts: {
          files: [
            'layer.zip',
          ]
        }
      }),
      environment: {
        buildImage: codebuild.LinuxBuildImage.STANDARD_5_0
      }
    })

Distribute

In the final stage, Lambda uses layer.zip to create and publish a Lambda layer across multiple Regions. The sample code defines four Regions as targets for the distribution process:

regionCodesToDistribute: ['eu-central-1', 'eu-west-1', 'us-west-1', 'us-east-1']

The Distribution phase consists of n (one per Region) parallel invocations of the same Lambda function, each with userParameter.region set to the respective Region. This is defined in the CDK stack:

const parallel = props.regionCodesToDistribute.map((region) => new codepipelineActions.LambdaInvokeAction({
      actionName: `distribute-${region}`,
      lambda: distributor,
      inputs: [buildOutput],
      userParameters: { region, layerPrincipal: props.layerPrincipal }
}));

Each Lambda function runs the following code to publish a new Lambda layer in each Region:

// Simplified code for brevity
// Omitted error handling, permission management and logging 
// See code samples for full code.
export async function handler(event: any) {
    // #1 Get job specific parameters (e.g. target region)
    const { location } = event['CodePipeline.job'].data.inputArtifacts[0];
    const { region, layerPrincipal } = JSON.parse(event["CodePipeline.job"].data.actionConfiguration.configuration.UserParameters);
    
    // #2 Get location of layer.zip and download it locally
    const layerZip = s3.getObject(/* Input artifact location*/);
    const lambda = new Lambda({ region });
    // #3 Publish a new Lambda layer version based on layer.zip
    const layer = lambda.publishLayerVersion({
        Content: {
            ZipFile: layerZip.Body
        },
        LayerName: 'sample-layer',
        CompatibleRuntimes: ['nodejs12.x', 'nodejs14.x']
    })
    
    // #4 Report the status of the operation back to CodePipeline
    return codepipeline.putJobSuccessResult(..);
}

After each Lambda function completes successfully, the pipeline ends. In a production application, you likely would have additional steps after publishing. For example, it may send notifications via Amazon SNS. To learn more about other possible integrations, read Working with pipeline in CodePipeline.

Pipeline output

Testing the workflow

With this automation, you can release a new version of the Lambda layer by changing package.json in the source repository.

Add the AWS X-Ray SDK for Node.js as a dependency to your project, by making the following changes to package.json and committing the new version to your main branch:

{
    "name": "lambda-layer",
    "version": "1.0.0",
    "description": "Sample AWS Lambda layer",
    "dependencies": {
        "aws-sdk": "latest",
        "aws-xray-sdk": "latest"
    }
}

After committing the new version to the repository, the pipeline is triggered again. After a while, you see that an updated version of the Lambda layer is published to all Regions:

Execution history results

Cleaning up

Many services in this blog post are available in the AWS Free Tier. However, using this solution may incur cost and you should tear down the stack if you don’t need it anymore. Cleaning up steps are included in the readme in the repository.

Conclusion

This blog post shows how to create a centralized pipeline to build and distribute Lambda layers consistently across multiple Regions. The pipeline is configurable and allows you to adapt the Regions and permissions according to your use-case.

For more serverless learning resources, visit Serverless Land.

Understanding how AWS Lambda scales with Amazon SQS standard queues

Post Syndicated from James Beswick original https://aws.amazon.com/blogs/compute/understanding-how-aws-lambda-scales-when-subscribed-to-amazon-sqs-queues/

This post is written by John Lee, Solutions Architect, and Isael Pelletier, Senior Solutions Architect.

Many architectures use Amazon SQS, a fully managed message queueing service, to decouple producers and consumers. SQS is a fundamental building block for building decoupled architectures. AWS Lambda is also fully managed by AWS and is a common choice as a consumer as it supports native integration with SQS. This combination of services allows you to write and maintain less code and unburden you from the heavy lifting of server management.

This blog post looks into optimizing the scaling behavior of Lambda functions when subscribed to an SQS standard queue. It discusses how Lambda’s scaling works in this configuration and reviews best practices for maximizing message throughput. The post provides insight into building your own scalable workload and guides you in building well-architected workloads.

Scaling Lambda functions

When a Lambda function subscribes to an SQS queue, Lambda polls the queue as it waits for messages to arrive. Lambda consumes messages in batches, starting at five concurrent batches with five functions at a time.

If there are more messages in the queue, Lambda adds up to 60 functions per minute, up to 1,000 functions, to consume those messages. This means that Lambda can scale up to 1,000 concurrent Lambda functions processing messages from the SQS queue.

Lambda poller

Figure 1. The Lambda service polls the SQS queue and batches messages that are processed by automatic scaling Lambda functions. You start with five concurrent Lambda functions.

This scaling behavior is managed by AWS and cannot be modified. To process more messages, you can optimize your Lambda configuration for higher throughput. There are several strategies you can implement to do this.

Increase the allocated memory for your Lambda function

The simplest way to increase throughput is to increase the allocated memory of the Lambda function. While you do not have control over the scaling behavior of the Lambda functions subscribed to an SQS queue, you control the memory configuration.

Faster Lambda functions can process more messages and increase throughput. This works even if a Lambda function’s memory utilization is low. This is because increasing memory also increases vCPUs in proportion to the amount configured. Each function now supports up to 10 GB of memory and you can access up to six vCPUs per function.

You may need to modify code to take advantage of the extra vCPUs. This consists of implementing multithreading or parallel processing to use all the vCPUs. You can find a Python example in this blog post.

To see the average cost and execution speed for each memory configuration before making a decision, Lambda Power Tuning tool helps to visualize the tradeoffs.

Optimize batching behavior

Batching can increase message throughput. By default, Lambda batches up to 10 messages in a queue to process them during a single Lambda execution. You can increase this number up to 10,000 messages, or up to 6 MB of messages in a single batch for standard SQS queues.

If each payload size is 256 KB (the maximum message size for SQS), Lambda can only take 23 messages per batch, regardless of the batch size setting. Similar to increasing memory for a Lambda function, processing more messages per batch can increase throughput.

However, increasing the batch size does not always achieve this. It is important to understand how message batches are processed. All messages in a failed batch return to the queue. This means that if a Lambda function with five messages fails while processing the third message, all five messages are returned to the queue, including the successfully processed messages. The Lambda function code must be able to process the same message multiple times without side effects.

Failed message processing

Figure 2. A Lambda function returning all five messages to the queue after failing to process the third message.

To prevent successfully processed messages from being returned to SQS, you can add code to delete the processed messages from the queue manually. You can also use existing open source libraries, such as Lambda Powertools for Python or Lambda Powertools for Java that provide this functionality.

Catch errors from the Lambda function

The Lambda service scales to process messages from the SQS queue when there are sufficient messages in the queue.

However, there is a case where Lambda scales down the number of functions, even when there are messages remaining in the queue. This is when a Lambda function throws errors. The Lambda function scales down to minimize erroneous invocations. To sustain or increase the number of concurrent Lambda functions, you must catch the errors so the function exits successfully.

To retain the failed messages, use an SQS dead-letter queue (DLQ). There are caveats to this approach. Catching errors without proper error handling and tracking mechanisms can result in errors being ignored instead of raising alerts. This may lead to silent failures while Lambda continues to scale and process messages in the queue.

Relevant Lambda configurations

There are several Lambda configuration settings to consider for optimizing Lambda’s scaling behavior. Paying attention to the following configurations can help prevent throttling and increase throughput of your Lambda function.

Reserved concurrency

If you use reserved concurrency for a Lambda function, set this value greater than five. This value sets the maximum number of concurrent Lambda functions that can run. Lambda allocates five functions to consume five batches at a time. If the reserved concurrency value is lower than five, the function is throttled when it tries to process more than this value concurrently.

Batching Window

For larger batch sizes, set the MaximumBatchingWindowInSeconds parameter to at least 1 second. This is the maximum amount of time that Lambda spends gathering records before invoking the function. If this value is too small, Lambda may invoke the function with a batch smaller than the batch size. If this value is too large, Lambda polls for a longer time before processing the messages in the batch. You can adjust this value to see how it affects your throughput.

Queue visibility timeout

All SQS messages have a visibility timeout that determines how long the message is hidden from the queue after being selected up by a consumer. If the message is not successfully processed or deleted, the message reappears in the queue when the visibility timeout ends.

Give your Lambda function enough time to process the message by setting the visibility timeout based on your function-specific metrics. You should set this value to six times the Lambda function timeout plus the value of MaximumBatchingWindowInSeconds. This prevents other functions from unnecessarily processing the messages while the message is already being processed.

Dead-letter queues (DLQs)

Failed messages are placed back in the queue to be retried by Lambda. To prevent failed messages from getting added to the queue multiple times, designate a DLQ and send failed messages there.

The number of times the messages should be retried is set by the Maximum receives value for the DLQ. Once the message is re-added to the queue more than the Maximum receives value, it is placed in the DLQ. You can then process this message at a later time.

This allows you to avoid situations where many failed messages are continuously placed back into the queue, consuming Lambda resources. Failed messages scale down the Lambda function and add the entire batch to the queue, which can worsen the situation. To ensure smooth scaling of the Lambda function, move repeatedly failing messages to the DLQ.

Conclusion

This post explores Lambda’s scaling behavior when subscribed to SQS standard queues. It walks through several ways to scale faster and maximize Lambda throughput when needed. This includes increasing the memory allocation for the Lambda function, increasing batch size, catching errors, and making configuration changes. Better understanding the levers available for SQS and Lambda interaction can help in meeting your scaling needs.

To learn more about building decoupled architectures, see these videos on Amazon SQS. For more serverless learning resources, visit https://serverlessland.com.

Creating static custom domain endpoints with Amazon MQ for RabbitMQ

Post Syndicated from James Beswick original https://aws.amazon.com/blogs/compute/creating-static-custom-domain-endpoints-with-amazon-mq-for-rabbitmq/

This post is written by Nate Bachmeier, Senior Solutions Architect, Wallace Printz, Senior Solutions Architect, Christian Mueller, Principal Solutions Architect.

Many cloud-native application architectures take advantage of the point-to-point and publish-subscribe, or “pub-sub”, model of message-based communication between application components. Not only is this architecture generally more resilient to failure because of the loose coupling and because message processing failures can be retried, it is also more efficient because individual application components can independently scale up or down to maintain message processing SLAs, compared to monolithic application architectures.

Synchronous (REST-based) systems are tightly coupled. A problem in a synchronous downstream dependency has immediate impact on the upstream callers. Retries from upstream callers can fan out and amplify problems.

For applications requiring messaging protocols including JMS, NMS, AMQP, STOMP, MQTT, and WebSocket, Amazon provides Amazon MQ. This is a managed message broker service for Apache ActiveMQ and RabbitMQ that makes it easier to set up and operate message brokers in the cloud.

Amazon MQ provides two managed broker deployment connection options: public brokers and private brokers. Public brokers receive internet-accessible IP addresses while private brokers receive only private IP addresses from the corresponding CIDR range in their VPC subnet. In some cases, for security purposes, customers may prefer to place brokers in a private subnet, but also allow access to the brokers through a persistent public endpoint, such as a subdomain of their corporate domain like ‘mq.example.com’.

This blog explains how to provision private Amazon MQ brokers behind a secure public load balancer endpoint using an example subdomain.

AmazonMQ also supports ActiveMQ – to learn more, read Creating static custom domain endpoints with Amazon MQ to simplify broker modification and scaling.

Overview

There are several reasons one might want to deploy this architecture beyond the security aspects. First, human-readable URLs are easier for people to parse when reviewing operations and troubleshooting, such as deploying updates to ‘mq-dev.example.com’ before ‘mq-prod.example.com’. Additionally, maintaining static URLs for your brokers helps reduce the necessity of modifying client code when performing maintenance on the brokers.

The following diagram shows the solutions architecture. This blog post assumes some familiarity with AWS networking fundamentals, such as VPCs, subnets, load balancers, and Amazon Route 53. For additional information on these topics, see the Elastic Load Balancing documentation.

Reference architecture

  1. The client service tries to connect with a RabbitMQ connection string to the domain endpoint setup in Route 53.
  2. The client looks up the domain name from Route 53, which returns the IP address of the Network Load Balancer (NLB).
  3. The client creates a Transport Layer Security (TLS) connection to the NLB with a secure socket layer (SSL) certificate provided from AWS Certificate Manager (ACM).
  4. The NLB chooses a healthy endpoint from the target group and creates a separate SSL connection. This provides secure, end-to-end SSL encrypted messaging between client and brokers.

To build this architecture, you build the network segmentation first, then add the Amazon MQ brokers, and finally the network routing. You need a VPC, one private subnet per Availability Zone, and one public subnet for your bastion host (if desired).

This demonstration VPC uses the 10.0.0.0/16 CIDR range. Additionally, you must create a custom security group for your brokers. You must set up this security group to allow traffic from your Network Load Balancer to the RabbitMQ brokers.

This example does not use this VPC for other workloads so it allows all incoming traffic that originates within the VPC (which includes the NLB) through to the brokers on the AMQP port of 5671 and the web console port of 443.

Inbound rules

Adding the Amazon MQ brokers

With the network segmentation set up, add the Amazon MQ brokers:

  1. Choose Create brokers on the Active Amazon MQ home page.
  2. Toggle the radio button next to RabbitMQ and choose Next.
  3. Choose a deployment mode of either single-instance broker (for development environments), or cluster deployment (for production environments).
  4. In Configure settings, specify the broker name and instance type.
  5. Confirm that the broker engine version is 3.8.22 or higher and set Access type to Private access.
    Configure settings page
  6. Specify the VPC, private subnets, and security groups before choosing Next.
    Additional settings

Finding the broker’s IP address

Before configuring the NLB’s target groups, you must look up the broker’s IP address. Unlike Amazon MQ for Apache ActiveMQ, RabbitMQ does not show its private IP addresses, though you can reliably find its VPC endpoints using DNS. Amazon MQ creates one VPC endpoint in each subnet with a static address that won’t change until you delete the broker.

  1. Navigate to the broker’s details page and scroll to the Connections panel.
  2. Find the endpoint’s fully qualified domain name. It is formatted like broker-id.mq.region.amazonaws.com.
  3. Open a command terminal on your local workstation.
  4. Retrieve the ‘A’ record values using the host (Linux) or nslookup (Windows) command.
  5. Record these values for the NLB configuration steps later.
    Terminal results

Configure the load balancer’s target group

The next step in the build process is to configure the load balancer’s target group. You use the private IP addresses of the brokers as targets for the NLB. Create a Target Group, select the target type as IP, and make sure to choose the TLS protocol and for each required port, as well as the VPC your brokers reside in.

Choose a target type

It is important to configure the health check settings so traffic is only routed to active brokers. Select the TCP protocol and override the health check port to 443 Rabbit MQ’s console port. Also, configure the healthy threshold to 2 with a 10-second check interval so the NLB detects faulty hosts within 20 seconds.

Be sure not to use RabbitMQ’s AMQP port as the target group health check port. The NLB may not be able to recognize the host as healthy on that port. It is better to use the broker’s web console port.

Health checks

Add the VPC endpoint addresses as NLB targets. The NLB routes traffic across the endpoints and provides networking reliability if an AZ is offline. Finally, configure the health checks to use the web console (TCP port 443).

Specify IPs and ports

Creating a Network Load Balancer

Next, you create a Network Load Balancer. This is an internet-facing load balancer with TLS listeners on port 5671 (AMQP), routing traffic to the brokers’ VPC and private subnets. You select the target group you created, selecting TLS for the connection between the NLB and the brokers. To allow clients to connect to the NLB securely, select an ACM certificate for the subdomain registered in Route 53 (for example ‘mq.example.com’).

To learn about ACM certificate provisioning, read more about the process here. Make sure that the ACM certificate is provisioned in the same Region as the NLB or the certificate is not shown in the dropdown menu.

Basic configuration page

Optionally configure IP filtering

The NLB is globally accessible and this may be overly permissive for some workloads. You can restrict incoming traffic to specific IP ranges on the NLB’s public subnet by using network access control list (NACL) configuration:

  1. Navigate to the AWS Management Console to the VPC service and choose Subnets.
  2. Select your public subnet and then switch to the Network ACL tab.
  3. Select the link to the associated network ACL (e.g., acl-0d6fxxxxxxxx) details.
  4. Activate this item and choose Edit inbound rules in the Action menu.
  5. Specify the desired IP range and then choose Save changes.

Edit inbound rules

Configuring Route 53

Finally, configure Route 53 to serve traffic at the subdomain of your choice to the NLB:

  1. Go to the Route 53 hosted zone and create a new subdomain record set, such as mq.example.com, that matches the ACM certificate that you previously created.
  2. In the “type” field, select “A – IPv4 address”, then select “Yes” for alias. This allows you to select the NLB as the alias target.
  3. Select from the alias target menu the NLB you just created and save the record set.

Quick create record

Now callers can use the friendly name in the RabbitMQ connection string. This capability improves the developer experience and reduces operational cost when rebuilding the cluster. Since you added multiple VPC endpoints (one per subnet) into the NLB’s target group, the solution has Multi-AZ redundancy.

Testing with a RabbitMQ client process

The entire process can be tested using any RabbitMQ client process. One approach is to launch the official Docker image and connect with the native client. The service documentation also provides sample code for authenticating, publishing, and subscribing to RabbitMQ channels.

To log in to the broker’s RabbitMQ web console, there are three options. Due to the security group rules, only traffic originating from inside the VPC is allowed to the brokers:

  1. Use a VPN connection from your corporate network to the VPC. Many customers use this option but for rapid testing, there is a simpler and more cost-effective method.
  2. Connect to the brokers’ web console through your Route 53 subdomain, which requires creating a separate web console port listener (443) on the existing NLB and creating a separate TLS target group for the brokers.
  3. Use a bastion host to proxy traffic to the web console.

RabbitMQ

Conclusion

In this post, you build a highly available Amazon MQ broker in a private subnet. You layer security by placing the brokers behind a highly scalable Network Load Balancer. You configure routing from a single custom subdomain URL to multiple brokers with a built-in health check.

For more serverless learning resources, visit Serverless Land.

Choosing between storage mechanisms for ML inferencing with AWS Lambda

Post Syndicated from James Beswick original https://aws.amazon.com/blogs/compute/choosing-between-storage-mechanisms-for-ml-inferencing-with-aws-lambda/

This post is written by Veda Raman, SA Serverless, Casey Gerena, Sr Lab Engineer, Dan Fox, Principal Serverless SA.

For real-time machine learning inferencing, customers often have several machine learning models trained for specific use-cases. For each inference request, the model must be chosen dynamically based on the input parameters.

This blog post walks through the architecture of hosting multiple machine learning models using AWS Lambda as the compute platform. There is a CDK application that allows you to try these different architectures in your own account. Finally, it then discusses the different storage options for hosting the models and the benefits of each.

Overview

The serverless architecture for inferencing uses AWS Lambda and API Gateway. The machine learning models are stored either in Amazon S3 or Amazon EFS. Alternatively, they are part of the Lambda function deployed as a container image and stored in Amazon ECR.

All three approaches package and deploy the machine learning inference code as Lambda function along with the dependencies as a container image. More information on how to deploy Lambda functions as container images can be found here.

Solution architecture

  1. A user sends a request to Amazon API Gateway requesting a machine learning inference.
  2. API Gateway receives the request and triggers Lambda function with the necessary data.
  3. Lambda loads the container image from Amazon ECR. This container image contains the inference code and business logic to run the machine learning model. However, it does not store the machine learning model (unless using the container hosted option, see step 6).
  4. Model storage option: For S3, when the Lambda function is triggered, it downloads the model files from S3 dynamically and performs the inference.
  5. Model storage option: For EFS, when the Lambda function is triggered, it accesses the models via the local mount path set in the Lambda file system configuration and performs the inference.
  6. Model storage option: If using the container hosted option, you must package the model in Amazon ECR with the application code defined for the Lambda function in step 3. The model runs in the same container as the application code. In this case, choosing the model happens at build-time as opposed to runtime.
  7. Lambda returns the inference prediction to API Gateway and then to the user.

The storage option you choose, either Amazon S3, Amazon EFS, or Amazon ECR via Lambda OCI deployment, to host the models influences the inference latency, cost of the infrastructure and DevOps deployment strategies.

Comparing single and multi-model inference architectures

There are two types of ML inferencing architectures, single model and multi-model. In single model architecture, you have a single ML inference model that performs the inference for all incoming requests. The model is stored either in S3, ECR (via OCI deployment with Lambda), or EFS and is then used by a compute service such as Lambda.

The key characteristic of a single model is that each has its own compute. This means that for every Lambda function there is a single model associated with it. It is a one-to-one relationship.

Multi-model inferencing architecture is where there are multiple models to be deployed and the model to perform the inference should be selected dynamically based on the type of request. So you may have four different models for a single application and you want a Lambda function to choose the appropriate model at invocation time. It is a many-to-one relationship.

Regardless of whether you use single or multi-model, the models must be stored in S3, EFS, or ECR via Lambda OCI deployments.

Should I load a model outside the Lambda handler or inside?

It is a general best practice in Lambda to load models and anything else that may take a longer time to process outside of the Lambda handler. For example, loading a third-party package dependency. This is due to cold start invocation times – for more information on performance, read this blog.

However, if you are running a multi-model inference, you may want to load inside the handler so you can load a model dynamically. This means you could potentially store 100 models in EFS and determine which model to load at the time of invocation of the Lambda function.

In these instances, it makes sense to load the model in the Lambda handler. This can increase the processing time of your function, since you are loading the model at the time of request.

Deploying the solution

The example application is open-sourced. It performs NLP question/answer inferencing using the HuggingFace BERT model using the PyTorch framework (expanding upon previous work found here). The inference code and the PyTorch framework are packaged as a container image and then uploaded to ECR and the Lambda service.

The solution has three stacks to deploy:

  • MlEfsStack – Stores the inference models inside of EFS and loads two models inside the Lambda handler, the model is chosen at invocation time.
  • MlS3Stack – Stores the inference model inside of S3 and loads a single model outside of the Lambda handler.
  • MlOciStack – Stores the inference models inside of the OCI container loads two models outside of the Lambda handler, the model is chosen at invocation time.

To deploy the solution, follow along the README file on GitHub.

Testing the solution

To test the solution, you can either send an inference request through API Gateway or invoke the Lambda function through the CLI. To send a request to the API, run the following command in a terminal (be sure to replace with your API endpoint and Region):

curl --location --request POST 'https://asdf.execute-api.us-east-1.amazonaws.com/develop/' --header 'Content-Type: application/json' --data-raw '{"model_type": "nlp1","question": "When was the car invented?","context": "Cars came into global use during the 20th century, and developed economies depend on them. The year 1886 is regarded as the birth year of the modern car when German inventor Karl Benz patented his Benz Patent-Motorwagen. Cars became widely available in the early 20th century. One of the first cars accessible to the masses was the 1908 Model T, an American car manufactured by the Ford Motor Company. Cars were rapidly adopted in the US, where they replaced animal-drawn carriages and carts, but took much longer to be accepted in Western Europe and other parts of the world."}'

General recommendations for model storage

For single model architectures, you should always load the ML model outside of the Lambda handler for increased performance on subsequent invocations after the initial cold start, this is true regardless of the model storage architecture that is chosen.

For multi-model architectures, if possible, load your model outside of the Lambda handler; however, if you have too many models to load in advance then load them inside of the Lambda handler. This means that a model will be loaded at every invocation of Lambda, increasing the duration of the Lambda function.

Recommendations for model hosting on S3

S3 is a good option if you need a simpler, low-cost storage option to store models. S3 is recommended when you cannot predict your application traffic volume for inference.

Additionally, if you must retrain the model, you can upload the retrained model to the S3 bucket without redeploying the Lambda function.

Recommendations for model hosting on EFS

EFS is a good option if you have a latency-sensitive workload for inference or you are already using EFS in your environment for other machine learning related activities (for example, training or data preparation).

With EFS, you must VPC-enable the Lambda function to mount the EFS filesystem, which requires an additional configuration.

For EFS, it’s recommended that you perform throughput testing with both EFS burst mode and provisioned throughput modes. Depending on inference request traffic volume, if the burst mode is not able to provide the desired performance, you must provision throughput for EFS. See the EFS burst throughput documentation for more information.

Recommendations for container hosted models

This is the simplest approach since all the models are available in the container image uploaded to Lambda. This also has the lowest latency since you are not downloading models from external storage.

However, it requires that all the models are packaged into the container image. If you have too many models that cannot fit into the 10 GB of storage space in the container image, then this is not a viable option.

One drawback of this approach is that anytime a model changes, you must re-package the models with the inference Lambda function code.

This approach is recommended if your models can fit in the 10 GB limit for container images and you are not re-training models frequently.

Cleaning up

To clean up resources created by the CDK templates, run “cdk destroy <StackName>”

Conclusion

Using a serverless architecture for real-time inference can scale your application for any volume of traffic while removing the operational burden of managing your own infrastructure.

In this post, we looked at the serverless architecture that can be used to perform real-time machine learning inference. We then discussed single and multi-model architectures and how to load the models in the Lambda function. We then looked at the different storage mechanisms available to host the machine learning models. We compared S3, EFS, and container hosting for storing models and provided our recommendations of when to use each.

For more learning resources on serverless, visit Serverless Land.

Build workflows for Amazon Forecast with AWS Step Functions

Post Syndicated from James Beswick original https://aws.amazon.com/blogs/compute/build-workflows-for-amazon-forecast-with-aws-step-functions/

This post is written by Péter Molnár, Data Scientist, ML ProServe and Sachin Doshi, Senior Application Architect, ProServe.

This blog builds a full lifecycle workflow for Amazon Forecast to predict household electricity consumption from historic data. Previously, developers used AWS Lambda function to build workflows for Amazon Forecast. You can now use AWS Step Functions with AWS SDK integrations to reduce cost and complexity.

Step Functions recently expanded the number of supported AWS service integrations from 17 to over 200 with AWS API actions from 46 to over 9,000 with AWS SDK service integrations.

Step Functions is a low-code visual workflow service used for workflow automation and service orchestration. Developers use Step Functions with managed services such as artificial intelligence servicesAmazon S3, and AWS Glue.

You can create state machines that use AWS SDK Service Integrations with Amazon States Language (ASL)AWS Cloud Development Kit (AWS CDK), AWS Serverless Application Model (AWS SAM), or visually using AWS Step Function Workflow Studio.

To create workflows for AWS AI services like Forecast, you can use Step Functions AWS SDK service integrations. This approach can be simpler because it allows users to build solutions without writing JavaScript or Python code.

Workflow for Amazon Forecast

The solution includes four components:

Solution architecture

  1. IAM role granting Step Functions control over Forecast.
  2. IAM role granting Forecast access to S3 storage locations.
  3. S3 bucket with input data
  4. Define Step Functions state machine and parameters for Forecast.

The repo provides an AWS SAM template to deploy these resources in your AWS account.

Understanding Amazon Forecast

Amazon Forecast is a fully managed service for time series forecasting. Forecast uses machine learning to combine time series data with additional variables to build forecasts.

Using Amazon Forecast involves steps that may take from minutes to hours. Instead of executing each step and waiting for its completion, you use Step Functions to define the steps of the forecasting process.

These are the individual steps of the Step Functions workflow:

Step Functions workflow

  1. Create a dataset: In Forecast, there are three types of datasets, target time series, related time series, and item metadata. The target time series is required and the others provide additional context with certain algorithms.
  2. Import data: This moves the information from S3 into a storage volume where the data is used for training and validation.
  3. Create a dataset group: This is the large box that isolates models and the data they are trained on from each other.
  4. Train a model: Forecast automates this process for you but you can also select algorithms. You can provide your own hyper parameters or use hyperparameter optimization (HPO) to determine the most performant values.
  5. Export back-test results: this creates a detailed table of the model performance.
  6. Deploy a predictor to deploy the model to use it to generate a forecast.
  7. Export forecast to create future predictions.

For more details, read the documentation of the Forecast APIs.

Example dataset

This example uses the individual household electric power consumption dataset. This dataset is available from the UCI Machine Learning Repository. We have aggregated the usage data to hourly intervals.

The dataset has three columns: the timestamp, value, and item ID. These are the minimum required to generate a forecast with Amazon Forecast.

Read more about the data and parameters in https://github.com/aws-samples/amazon-forecast-samples/tree/master/notebooks/basic/Tutorial.

Step Functions AWS SDK integrations

The AWS SDK integrations of Step Functions reduce the need for Lambda functions that call the Forecast APIs. You can call any AWS SDK-compatible service directly from the ASL. Use the following syntax in the resource field of a Step Functions task:

arn:aws:states:::aws-sdk:serviceName:apiAction.[serviceIntegrationPattern]

The following example compares using Step Functions AWS SDK service integrations with calling the boto3 Python method to create a dataset with a corresponding resource in the state machine definition. This is the ASL of a Step Functions state machine:

"States": {
  "Create-Dataset": {
    "Resource": "arn:aws:states:::aws-sdk:forecast:createDataset",
    "Parameters": {
      "DatasetName": "blog_example",
      "DataFrequency": "H",
      "Domain": "CUSTOM",
      "DatasetType": "TARGET_TIME_SERIES",
      "Schema": {
        "Attributes": [
          {
            "AttributeName": "timestamp",
            "AttributeType": "timestamp"
          },
          {
            "AttributeName": "target_value",
            "AttributeType": "float"
          },
          {
            "AttributeName": "item_id",
            "AttributeType": "string"
          }
        ]
      }
    },
    "ResultPath": "$.createDatasetResult",
    "Next": "Import-Data"
  }

The structure is similar to the corresponding boto3 methods. Compare the Python code with the state machine code – it uses the same parameters as calling the Python API:

forecast = boto3.client('forecast')
response = forecast.create_dataset(
             Domain='CUSTOM',
             DatasetType='TARGET_TIME_SERIES',
             DatasetName='blog_example',
             DataFrequency='H', 
             Schema={
               'Attributes': [
                  {
                    'AttributeName': 'timestamp',
                    'AttributeType': 'timestamp'
                  },
                  {
                    'AttributeName': 'target_value',
                    'AttributeType': 'float'
                  },
                  {
                    'AttributeName': 'item_id',
                    'AttributeType': 'string'
                  }
               ]
             }
           )

Handling asynchronous API calls

Several Forecast APIs run asynchronously, such as createDatasetImportJob and createPredictor. This means that your workflow must wait until the import job is completed.

You can use one of two methods in the state machine: create a wait loop, or allow any following task that depends on the completion of the previous task to retry.

In general, it is good practice to allow any task to retry for a few times. For simplicity this example does not include general error handling. Read the blog Handling Errors, Retries, and adding Alerting to Step Function State Machine Executions to learn more about writing robust state machines.

1. State machine wait loop

Wait loop

To wait for an asynchronous task to complete, use the services’ Describe* API methods to get the status of current job. You can implement the wait loop with the native Step Function tasks Choice and Wait.

Here, the task “Check-Data-Import” calls the describeDatasetImportJob API to receive a status value of the running job:

"Check-Data-Import": {
  "Type": "Task",
  "Resource": "arn:aws:states:::aws-sdk:forecast:describeDatasetImportJob",
  "Parameters": {
    "DatasetImportJobArn.$": "$.createDatasetImportJobResult.DatasetImportJobArn"
   },
   "ResultPath": "$.describeDatasetImportJobResult",
   "Next": "Fork-Data-Import"
 },
 "Fork-Data-Import": {
   "Type": "Choice",
   "Choices": [
     {
       "Variable": "$.describeDatasetImportJobResult.Status",
       "StringEquals": "ACTIVE",
       "Next": "Done-Data-Import"
     }
   ],
   "Default": "Wait-Data-Import"
 },
 "Wait-Data-Import": {
   "Type": "Wait",
   "Seconds": 60,
   "Next": "Check-Data-Import"
 },
 "Done-Data-Import": {
   "Type": "Pass",
   "Next": "Create-Predictor"
 },

2. Fail and retry

Alternatively, use the Retry parameter to specify how to repeat the API call in case of an error. This example shows how the attempt to create the forecast is repeated if the resource that it depends on is not created. In this case, the preceding task of creating the predictor.

The time between retries is set to 180 seconds and the number of retries must not exceed 100. This means that the workflow waits 3 minutes before trying again. The longest time to wait for the ML training is five hours.

With the BackoffRate set to 1, the wait interval of 3 minutes remains constant. Value greater that 1 may reduce the number of retries but may also add increased wait time for training jobs that run for several hours:

"Create-Forecast": {
  "Type": "Task",
  "Resource": "arn:aws:states:::aws-sdk:forecast:createForecast",
  "Parameters": {
    "ForecastName.$": "States.Format('{}_forecast', $.ProjectName)",
    "PredictorArn.$": "$.createPredictorResult.PredictorArn"
   },
   "ResultPath": "$.createForecastResult",
   "Retry": [
     {
       "ErrorEquals": ["Forecast.ResourceInUseException"],
       "IntervalSeconds": 180,
       "BackoffRate": 1.0,
       "MaxAttempts": 100
     }
   ],
   "Next": "Forecast-Export"
 },

Deploying the workflow

The AWS Serverless Application Model Command Line Interface (AWS SAM CLI) is an extension of the AWS CLI that adds functionality for building and testing serverless applications. Follow the instructions to install the AWS SAM CLI.

To build and deploy the application:

  1. Clone the GitHub repo:
    git clone https://github.com/aws-samples/aws-stepfunctions-examples/tree/main/sam/demo-forecast-service-integration
  2. Change directory to cloned repo.
    cd demo-forecast-service-integration
  3. Enable execute permissions for the deployment script
    chmod 700 ./bootstrap_deployment_script.sh
  4. Execute the script with a stack name of your choosing as parameter.
    ./bootstrap_deployment_script.sh <Here goes your stack name>

The script builds the AWS SAM template and deploys the stack under the given name. The AWS SAM template creates the underlying resources like S3 bucket, IAM policies, and Step Functions workflow. The script also copies the data file used for training to the newly created S3 bucket.

Running the workflow

After the AWS SAM Forecast workflow application is deployed, run the workflow to train a forecast predictor for the energy consumption:

  1. Navigate to the AWS Step Functions console.
  2. Select the state machine named “ForecastWorkflowStateMachine-*” and choose New execution.
  3. Define the “ProjectName” parameter in form of a JSON structure. The name for the Forecast Dataset group is “household_energy_forecast”.
    Start execution
  4. Choose Start execution.

Viewing resources in the Amazon Forecast console

Navigate to the Amazon Forecast console and select the data set group “household_energy_forecast”. You can see the details of the Forecast resource as they are created. The provided state machine executes every step in the workflow and then deletes all resources, leaving the output files in S3.

Amazon Forecast console

You can disable the clean-up process by editing the state machine:

  1. Choose Edit to open the editor.
  2. Find the tasks “Clean-Up” and change the “Next” state from “Delete-Forecast_export” to “SuccessState”.
    "Clean-Up": {
       "Type": "Pass",
       "Next": "SuccessState"
    },
    
  3. Delete all tasks named Delete-*.

Remember to delete the dataset group manually if you bypass the clean-up process of the workflow.

Analyzing Forecast Results

The forecast workflow creates a folder “forecast_results” for all of its output files. In there you find the subfolders “backtestexport” with data produced by Backtest-Export task, and “forecast” with the predicted energy demand forecast produced by the Forecast-Export job.

The “backtestexport” folder contains two tables: “accuracy-metrics-values” with the model performance accuracy metrics, and “forecast-values” with the predicted forecast values of the training set. Read the blog post Amazon Forecast now supports accuracy measurements for individual items for details.

The forecast predictions are stored in the “forecast” folder. The table contains forecasts at three different quantiles: 10%, 50% and 90%.

The data files are partitioned into multiple CSV files. In order to analyze them, first download and merge the files into proper tables. Use the AWS CLI command to download

BUCKET="<your account number>-<your region>-sf-forecast-workflow"
aws s3 cp s3://$BUCKET/forecast_results . –recursive

Alternatively, you may import and analyze the data into Amazon Athena.

Cleaning up

To delete the application that you created, use the AWS SAM CLI.

sam delete --stack-name <Here goes your stack name>

Also delete the data files in the S3 bucket. If you skipped the clean-up tasks in your workflow, you must delete the dataset group from the Forecast console.

Important things to know

Here are things know, that will help you to use AWS SDK service integration:

  • Call AWS SDK services directly from the ASL in the resource field of a task state. To do this, use the following syntax: arn:aws:states:::aws-sdk:serviceName:apiAction.[serviceIntegrationPattern]
  • Use camelCase for apiAction names in the Resource field, such as “copyObject”, and use PascalCase for parameter names in the Parameters field, such as “CopySource”.
  • Step Functions cannot generate IAM policies for most AWS SDK service integrations. You must add those to the IAM role of the state machine explicitly.

Learn more about this new capability by reading its documentation.

Conclusion

This post shows how to create a Step Functions workflow for Forecast using AWS SDK service integrations, which allows you to use over 200 with AWS API actions. It shows two patterns for handling asynchronous tasks. The first pattern queries the describe-* API repeatedly and the second pattern uses the “Retry” option. This simplifies the development of workflows because in many cases they can replace Lambda functions.

For more serveless learning resources, visit Serverless Land.