Post Syndicated from James Beswick original https://aws.amazon.com/blogs/compute/building-a-serverless-gif-generator-with-aws-lambda-part-1/
Many video streaming services show GIF animations in the frontend when users fast forward and rewind throughout a video. This helps customers see a preview and makes the user interface more intuitive.
Generating these GIF files is a compute-intensive operation that becomes more challenging to scale when there are many videos. Over a typical 2-hour movie with GIF previews every 30 seconds, you need 240 separate GIF animations to support this functionality.
In a server-based solution, you can use a library like FFmpeg to load the underlying MP4 file and create the GIF exports. However, this may be a serial operation that slows down for longer videos or when there are many different videos to process. For a service providing thousands of videos to customers, they need a solution where the encoding process keeps pace with the number of videos.
In this two-part blog post, I show how you can use a serverless approach to create a scalable GIF generation service. I explain how you can use parallelization in AWS Lambda-based workloads to reduce processing time significantly.
The example application uses the AWS Serverless Application Model (AWS SAM), enabling you to deploy the application more easily in your own AWS account. This walkthrough creates some resources covered in the AWS Free Tier but others incur cost. To set up the example, visit the GitHub repo and follow the instructions in the README.md file.
Overview
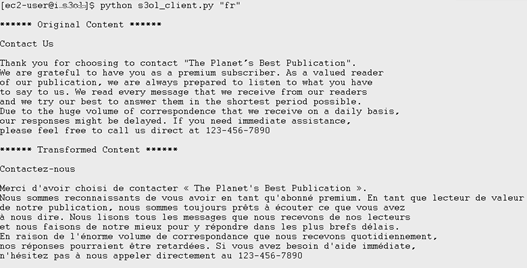
To show the video player functionality, visit the demo front end. This loads the assets for an example video that is already processed. In the example, there are GIF animations every 30 seconds and freeze frames for every second of video. Move the slider to load the frame and GIF animation at that point in the video:

- The demo site defaults to an existing video. After deploying the backend application, you can test your own videos here.
- Move the slider to select a second in the video playback. This simulates a typical playback bar used in video application frontends.
- This displays the frame at the chosen second, which is a JPG file created by the backend application.
- The GIF animation for the selected playback point is a separate GIF file, created by the backend application.
Comparing server-based and serverless solutions
The example application uses FFmpeg, an open source application to record and process video. FFmpeg creates the GIF animations and individual frames for each second of video. You can use FFmpeg directly from a terminal or in scripts and applications. In comparing the performance, I use the AWS re:Invent 2019 keynote video, which is almost 3 hours long.
To show the server-based approach, I use a Node.js application in the GitHub repo. This loops through the video length in 30-second increments, calling FFmpeg with the necessary command line parameters:
const main = async () => {
	const length = 10323
	const inputVideo = 'test.mp4'
	const ffTmp = './output'
	const snippetSize = 30
 	const baseFilename = inputVideo.split('.')[0]

	console.time('task')
	for (let start = 0; start < length; start += snippetSize) {
		const gifName = `${baseFilename}-${start}.gif`
		const end = start + snippetSize -1

		console.log('Now creating: ', gifName)
		// Generates gif in local tmp
		await execPromise(`${ffmpegPath} -loglevel error -ss ${start} -to ${end} -y -i "${inputVideo}" -vf "fps=10,scale=240:-1:flags=lanczos,split[s0][s1];[s0]palettegen[p];[s1][p]paletteuse" -loop 0 ${ffTmp}/${gifName}`)
		await execPromise(`${ffmpegPath} -loglevel error -ss ${start} -to ${end} -i "${inputVideo}" -vf fps=1 ${ffTmp}/${baseFilename}-${start}-frame-%d.jpg`)
	}
	console.timeEnd('task')
}
Running this script from my local development machine, it takes almost 21 minutes to complete the operation and creates over 10,000 output files.

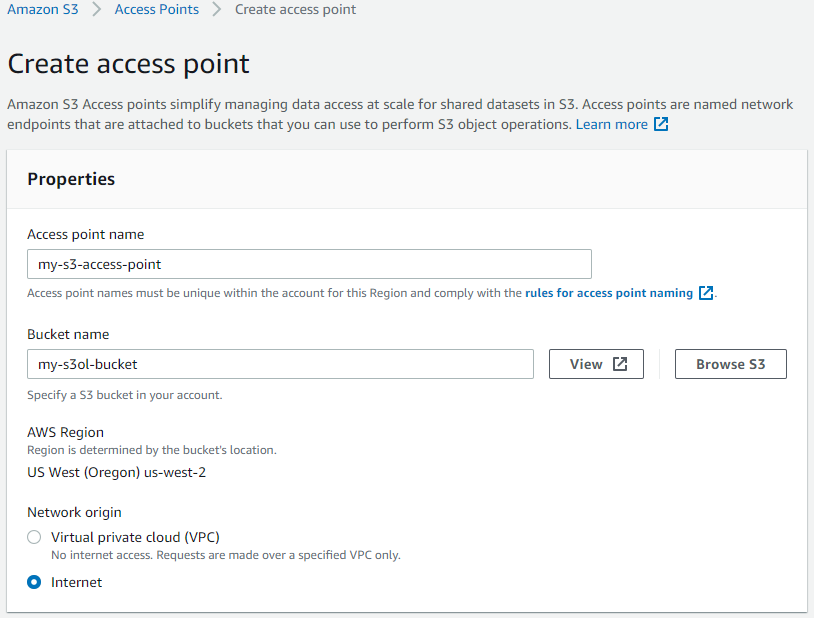
After deploying the example serverless application in the GitHub repo, I upload the video to the source Amazon S3 bucket using the AWS CLI:
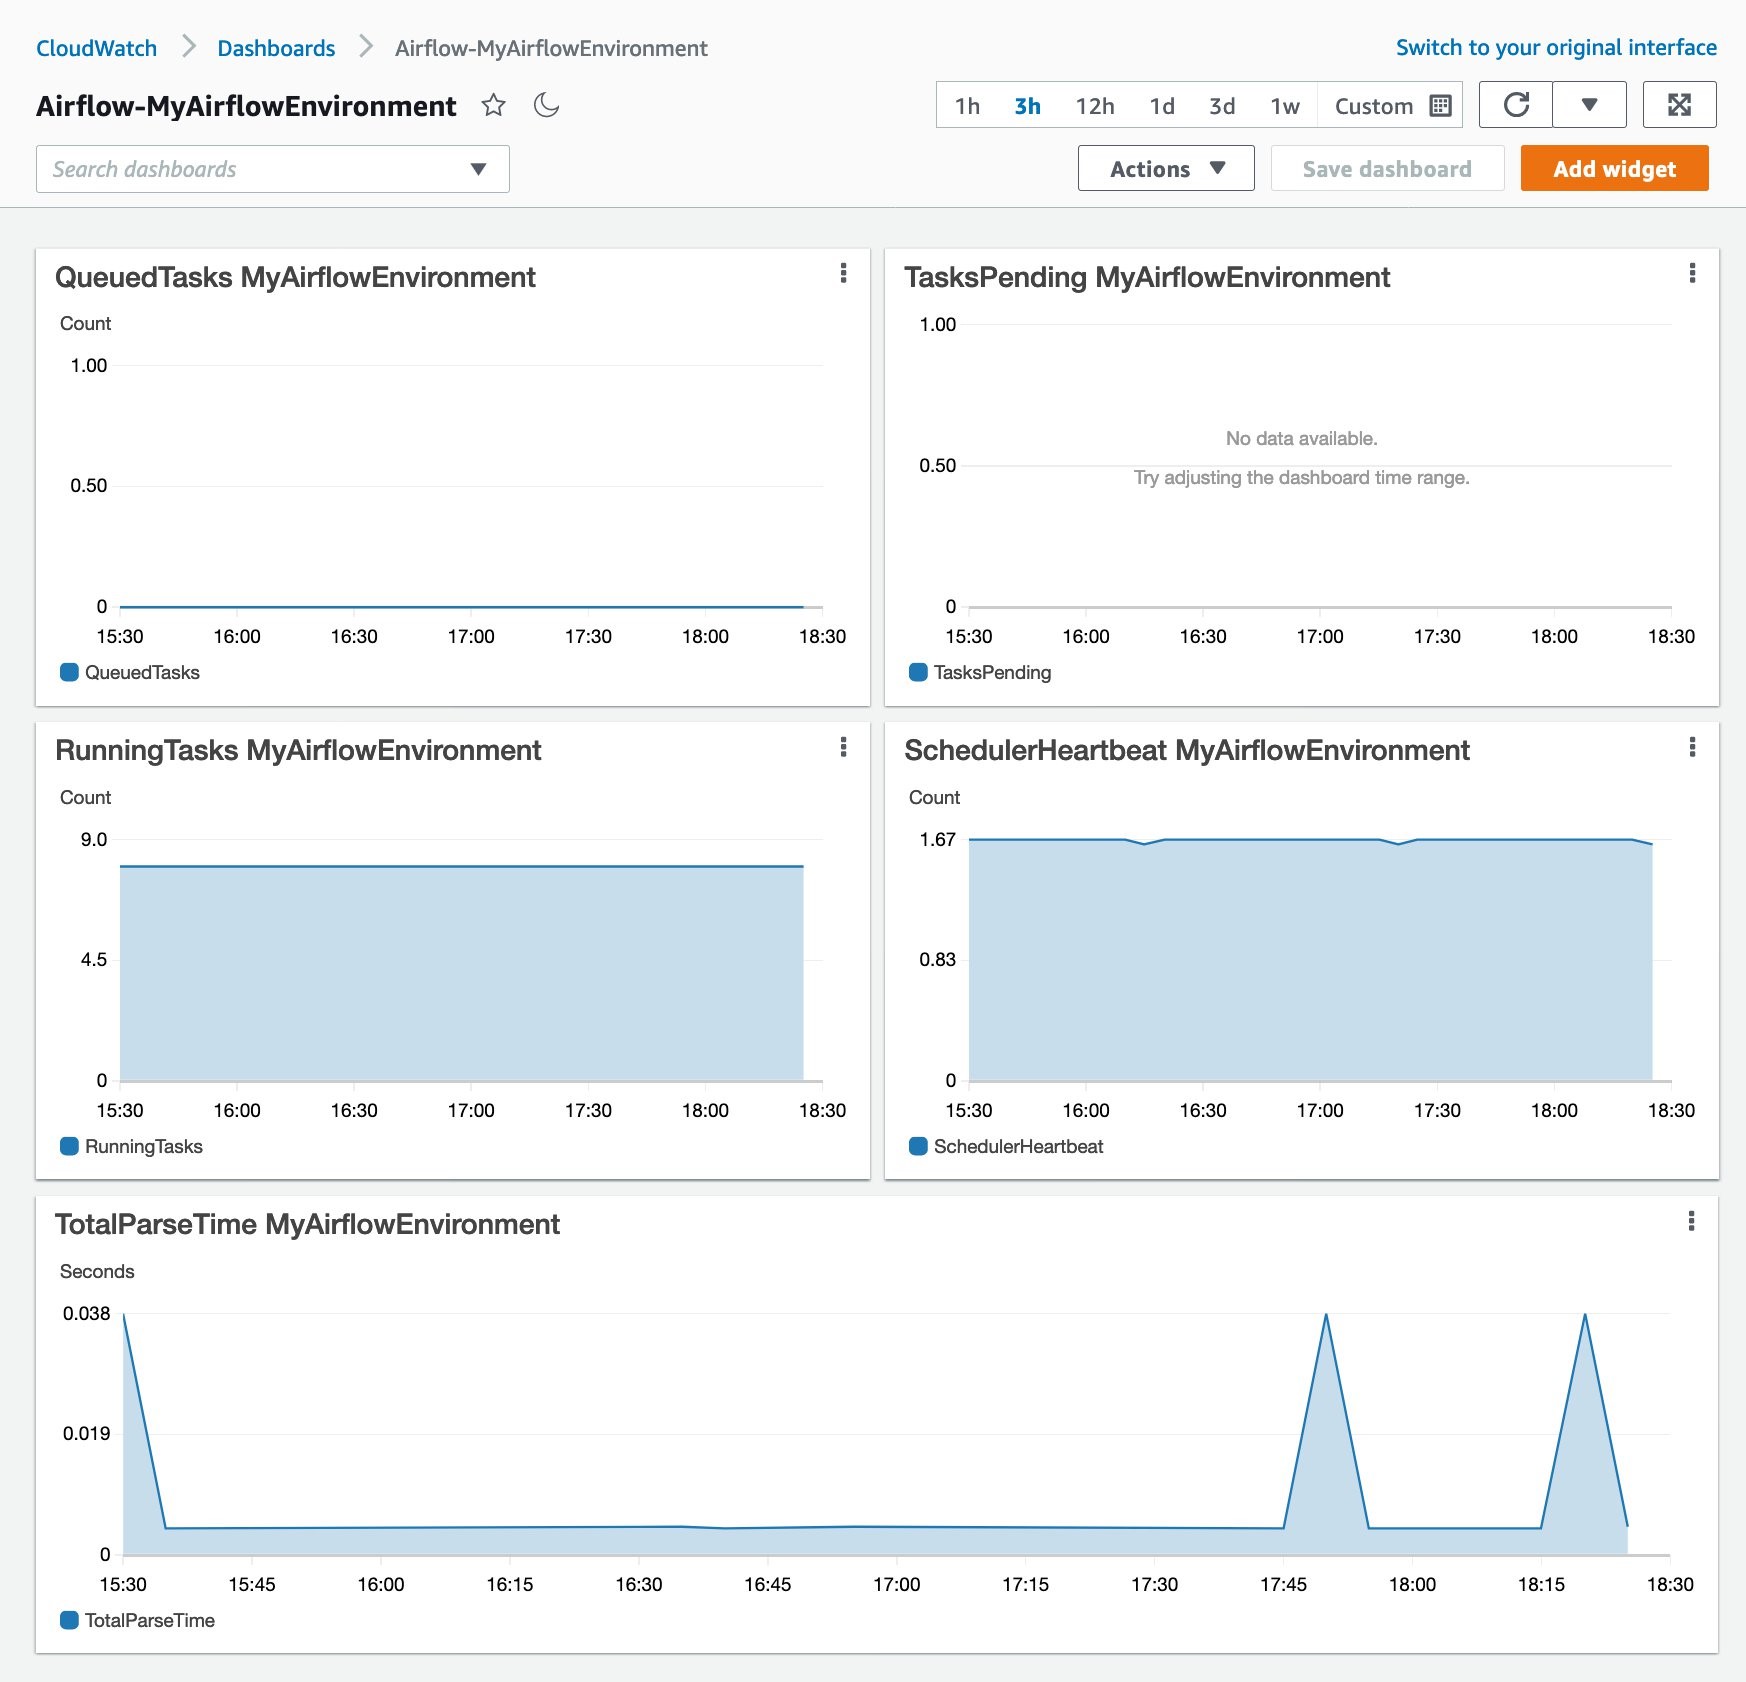
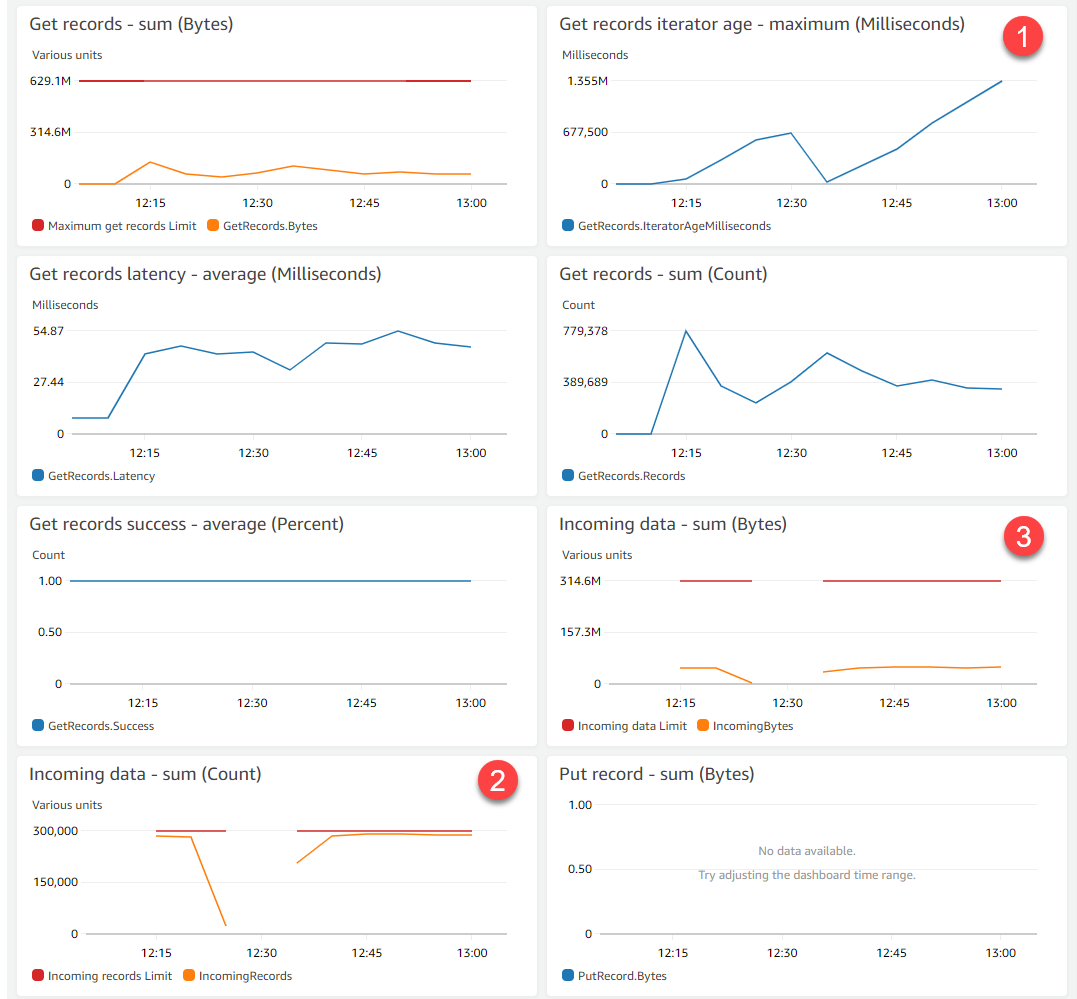
aws s3 cp ./reinvent.mp4 s3://source-bucket-name --acl public-readThe completed S3 PutObject operation starts the GIF generation process. The function that processes the GIF files emits the following metrics on the Monitor tab in the Lambda console:

- There are 345 invocations to process the source file into 30-second GIF animations.
- The average duration for each invocation is 4,311 ms. The longest is 9,021 ms.
- No errors occurred in processing the video.
- Lambda scaled up to 344 concurrent execution environments.
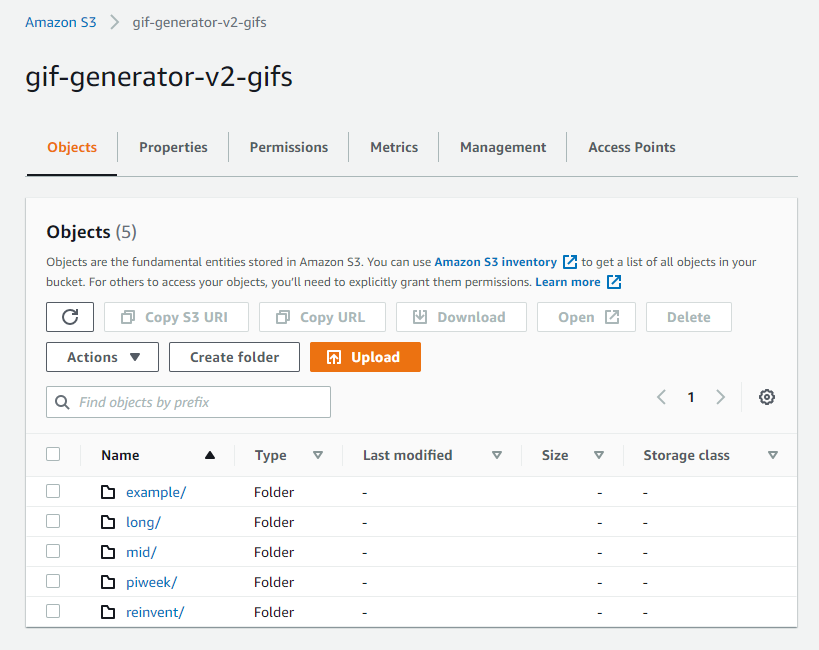
After approximately 10 seconds, the conversion is complete and there are over 10,000 objects in the application’s output S3 bucket:

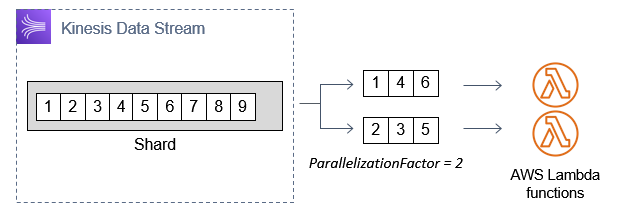
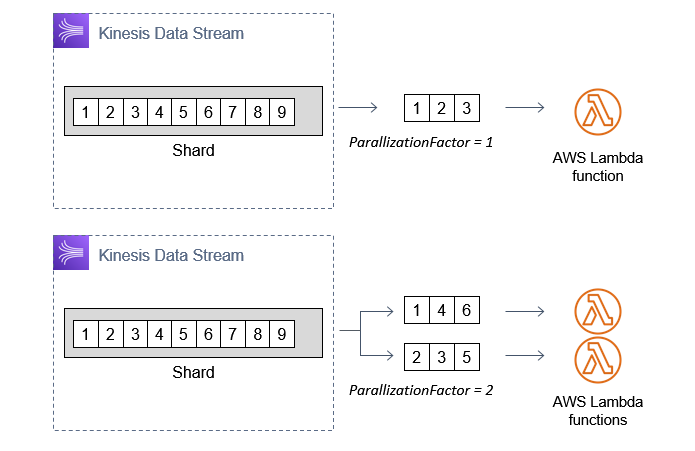
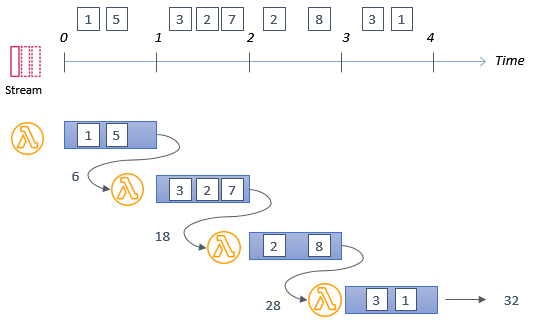
The main reason that the task duration is reduced from nearly 21 minutes to around 10 seconds is parallelization. In the server-based approach, each 30 second GIF is processed sequentially. In the Lambda-based solution, all of the 30-second clips are generated in parallel, at around the same time:

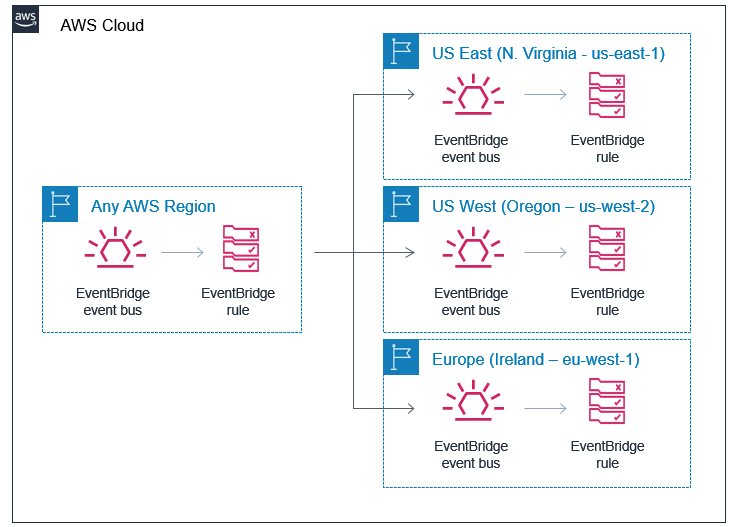
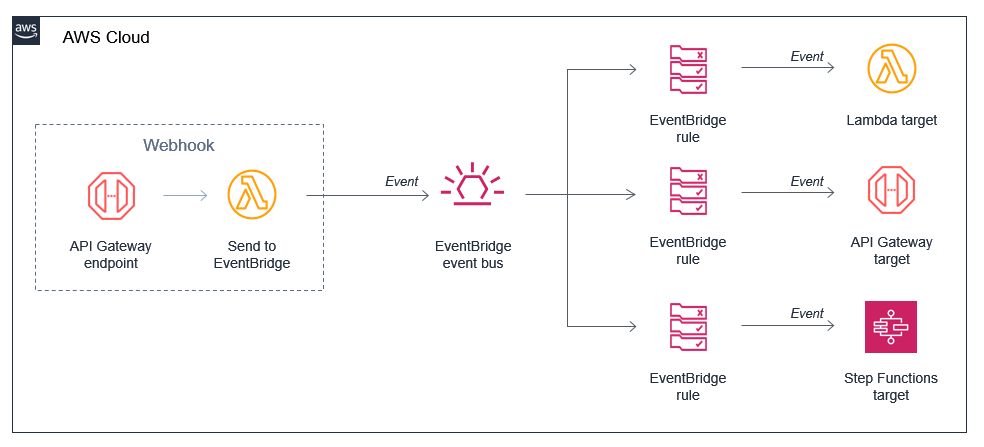
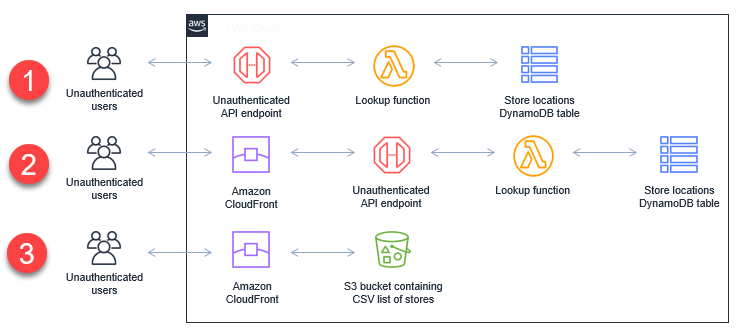
Solution architecture
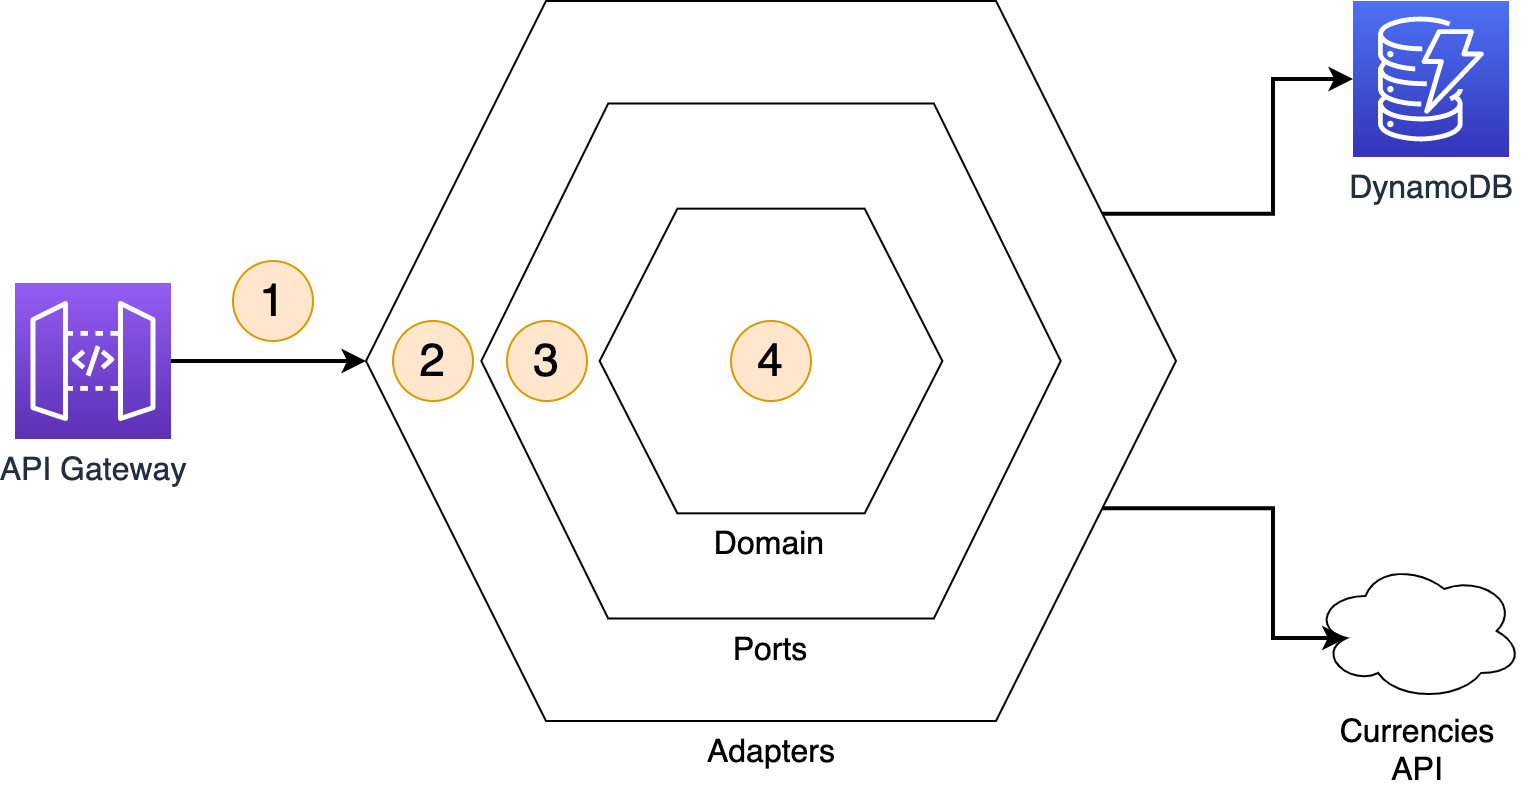
The example application uses the following serverless architecture:

- When the original MP4 video is put into the source S3 bucket, it invokes the first Lambda function.
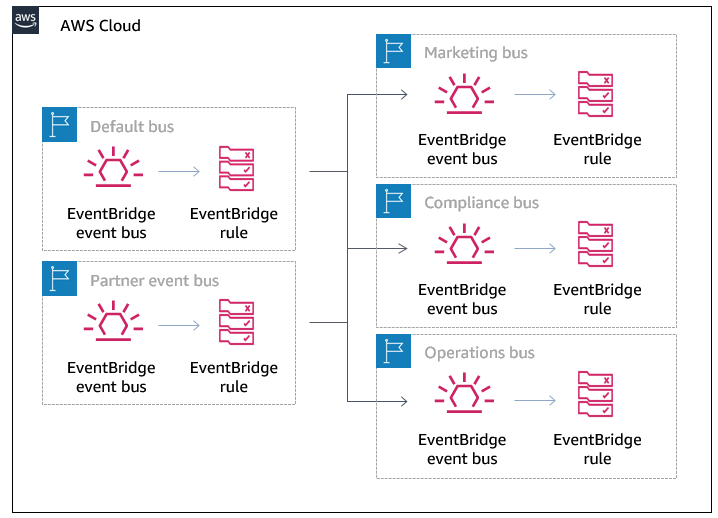
- The Snippets Lambda function detects the length of the video. It determines the number of 30-second snippets and then puts events onto the default event bus. There is one event for each snippet.
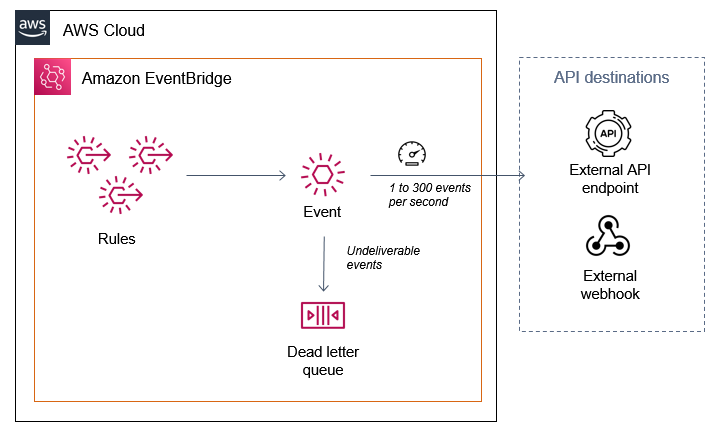
- An Amazon EventBridge rule matches for events created by the first Lambda function. It invokes the second Lambda function.
- The Process MP4 Lambda function receives the event as a payload. It loads the original video using FFmpeg to generate the GIF and per-second frames.
- The resulting files are stored in the output S3 bucket.
The first Lambda function uses the following code to detect the length of the video and create events for EventBridge:
const createSnippets = async (record) => {
	// Get signed URL for source object
	const params = {
		Bucket: record.s3.bucket.name,
		Key: record.s3.object.key,
		Expires: 300
	}
	const url = s3.getSignedUrl('getObject', params)

	// Get length of source video
	const metadata = await ffProbe(url)
	const length = metadata.format.duration
	console.log('Length (seconds): ', length)

	// Build data array for DynamoDB
	const items = []
	const snippetSize = parseInt(process.env.SnippetSize)

	for (let start = 0; start < length; start += snippetSize) {
		items.push({
			key: record.s3.object.key,
			start,
			end: (start + snippetSize - 1),
			length,
			tsCreated: Date.now()
		})
	}
	// Send events to EventBridge
	await writeBatch(items)
}
The eventbridge.js file contains a function that sends the event array to the default bus in EventBridge. It uses the putEvents method in the EventBridge JavaScript SDK to send events in batches of 10:
const writeBatch = async (items) => {

    console.log('writeBatch items: ', items.length)

    for (let i = 0; i < items.length; i += BATCH_SIZE ) {
        const tempArray = items.slice(i, i + BATCH_SIZE)

        // Create new params array
        const paramsArray = tempArray.map((item) => {
            return {
                DetailType: 'newVideoCreated',
                Source: 'custom.gifGenerator',
                Detail: JSON.stringify ({
                    ...item
                })
            }
        })

        // Create params object for DDB DocClient
        const params = {
            Entries: paramsArray
        }

        // Write to DDB
        const result = await eventbridge.putEvents(params).promise()
        console.log('Result: ', result)
    }
}
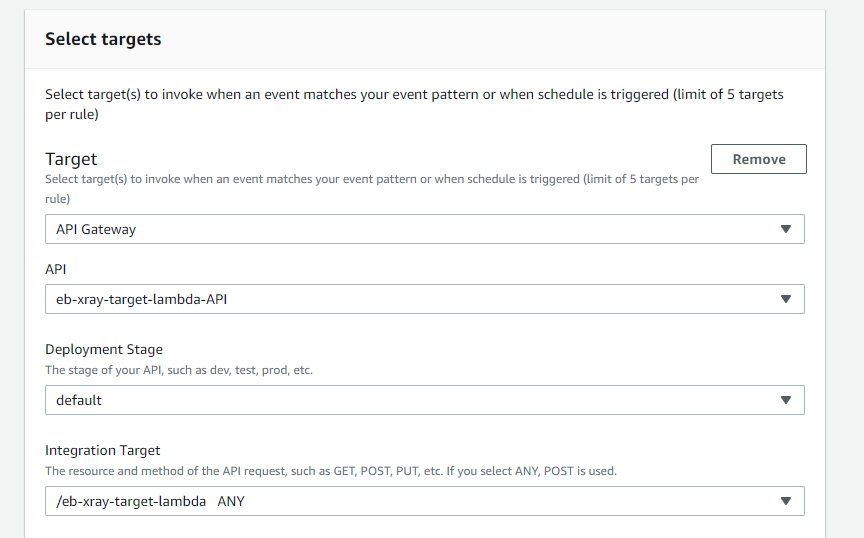
The second Lambda function is invoked by an EventBridge rule, matching on the Source and DetailType values. Both the Lambda function and the rule are defined in the AWS SAM template:
  GifsFunction:
    Type: AWS::Serverless::Function
    Properties:
      CodeUri: gifsFunction/
      Handler: app.handler
      Runtime: nodejs14.x
      Timeout: 30
      MemorySize: 4096
      Layers:
        - !Ref LayerARN
      Environment:
        Variables:
          GenerateFrames: !Ref GenerateFrames
          GifsBucketName: !Ref GifsBucketName
          SourceBucketName: !Ref SourceBucketName
      Policies:
        - S3ReadPolicy:
            BucketName: !Ref SourceBucketName
        - S3CrudPolicy:
            BucketName: !Ref GifsBucketName
      Events:
        Trigger:
          Type: EventBridgeRule
          Properties:
            Pattern:
              source:
                - custom.gifGenerator
              detail-type:
                - newVideoCreated
This Lambda function receives an event payload specifying the start and end time for the video clip it should process. The function then calls the FFmpeg application to generate the output files. It stores these in the local /tmp storage before uploading to the output S3 bucket:
const processMP4 = async (event) => {
    // Get settings from the incoming event
    const originalMP4 = event.detail.Key
    const start =  event.detail.start
    const end =  event.detail.end

    // Get signed URL for source object
    const params = {
        Bucket: process.env.SourceBucketName,
        Key: originalMP4,
        Expires
    }
    const url = s3.getSignedUrl('getObject', params)
    console.log('processMP4: ', { url, originalMP4, start, end })

    // Extract frames from MP4 (1 per second)
    console.log('Create GIF')
    const baseFilename = params.Key.split('.')[0]

    // Create GIF
    const gifName = `${baseFilename}-${start}.gif`
    // Generates gif in local tmp
    await execPromise(`${ffmpegPath} -loglevel error -ss ${start} -to ${end} -y -i "${url}" -vf "fps=10,scale=240:-1:flags=lanczos,split[s0][s1];[s0]palettegen[p];[s1][p]paletteuse" -loop 0 ${ffTmp}/${gifName}`)
    // Upload gif to local tmp
    // Generate frames
    if (process.env.GenerateFrames === 'true') {
        console.log('Capturing frames')
        await execPromise(`${ffmpegPath} -loglevel error -ss ${start} -to ${end} -i "${url}" -vf fps=1 ${ffTmp}/${baseFilename}-${start}-frame-%d.jpg`)
    }

    // Upload all generated files
    await uploadFiles(`${baseFilename}/`)

    // Cleanup temp files
    await tmpCleanup()
}
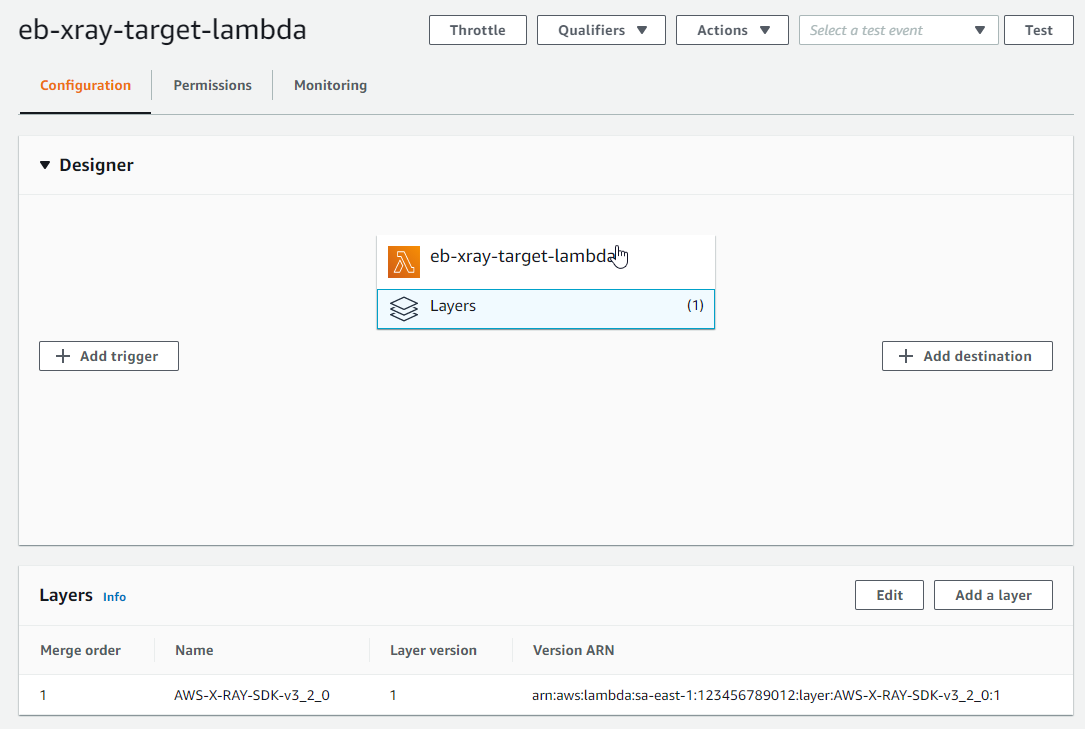
Creating and using the FFmpeg Lambda layer
FFmpeg uses operating system-specific binaries that may be different on your development machine from the Lambda execution environment. The easiest way to test the code on a local machine and deploy to Lambda with the appropriate binaries is to use a Lambda layer.
As described in the example application’s README file, you can create the FFmpeg Lambda layer by deploying the ffmpeg-lambda-layer application in the AWS Serverless Application Repository. After deployment, the Layers menu in the Lambda console shows the new layer. Copy the version ARN and use this as a parameter in the AWS SAM deployment:

On your local machine, download and install the FFmpeg binaries for your operating system. The package.json file for the Lambda functions uses two npm installer packages to help ensure the Node.js code uses the correct binaries when tested locally:
{
  "name": "gifs",
  "version": "1.0.0",
  "description": "",
  "main": "index.js",
  "scripts": {
    "test": "echo \"Error: no test specified\" && exit 1"
  },
  "keywords": [],
  "author": "James Beswick",
  "license": "MIT-0",
  "dependencies": {
  },
  "devDependencies": {
    "@ffmpeg-installer/ffmpeg": "^1.0.20",
    "@ffprobe-installer/ffprobe": "^1.1.0",
    "aws-sdk": "^2.927.0"
  }
}
Any npm packages specified in the devDependencies section of package.json are not deployed to Lambda by AWS SAM. As a result, local testing uses local ffmpeg binaries and Lambda uses the previously deployed Lambda layer. This approach also helps to reduce the size of deployment uploads and can help make the testing and deployment cycle faster in development.
Using FFmpeg from a Lambda function
FFmpeg is an application that’s generally used via a terminal. It takes command line parameters as options to determine input files, output locations, and the type of processing needed. To use terminal commands from Lambda, both functions use the asynchronous child_process module in Node.js. The execPromise function wraps this module in a Promise so the main function can use async/await syntax:
const { exec } = require('child_process')

const execPromise = async (command) => {
    console.log(command)
    return new Promise((resolve, reject) => {
        const ls = exec(command, function (error, stdout, stderr) {
          if (error) {
            console.error('Error: ', error)
            reject(error)
          }
          if (stdout) console.log('stdout: ', stdout)
          if (stderr) console.error('stderr: ' ,stderr)
        })

        ls.on('exit', (code) => {
          console.log('execPromise finished with code ', code)
          resolve()
        })
    })
}
As a result, you can then call FFmpeg by constructing a command line with options parameters and passing to execPromise:
await execPromise(`${ffmpegPath} -loglevel error -ss ${start} -to ${end} -i "${url}" -vf fps=1 ${ffTmp}/${baseFilename}-${start}-frame-%d.jpg`)Alternatively, you can also use the fluent-ffmpeg npm library, which exposes the command line options as methods. The example application uses this in the ffmpeg-promisify.js file:
const ffmpeg = require("fluent-ffmpeg")
   ffmpeg(source)
      .noAudio()
      .size(`${IMG_WIDTH}x${IMG_HEIGHT}`)
      .setStartTime(startFormatted)
      .setDuration(snippetSize - 1)
      .output(outputFile)
      .on("end", async (err) => {
        // do work
      })
      .on("error", function (err) {
        console.error('FFMPEG error: ', err)
      })
      .run()
Deploying the application
In the GitHub repository, there are detailed deployment instructions for the example application. The repo contains separate directories for the demo frontend application, server-based script, and the two versions of backend service.
After deployment, you can test the application by uploading an MP4 video to the source S3 bucket. The output GIF and JPG files are written to the application’s destination S3 bucket. The files from each MP4 file are grouped in a folder in the bucket:
Frontend application
The frontend application allows you to visualize the outputs of the backend application. There is also a hosted version of this application. This accepts custom parameters to load graphics resources from S3 buckets in your AWS account. Alternatively, you can run the frontend application locally.
To launch the frontend application:
- After cloning the repo, change to the frontend directory.
- Run npm install to install Vue.js and all the required npm modules from package.json.
- Run npm run serve to start the development server. After building the modules in the project, the terminal shows the local URL where the application is running:

- Open a web browser and navigate to http://localhost:8080 to see the application:


Conclusion
In part 1 of this blog post, I explain how a GIF generation service can support a front-end application for video streaming. I compare the performance of a server-based and serverless approach and show how parallelization can significantly improve processing time. I walk through the solution architecture used in the example application and show how you can use FFmpeg in Lambda functions.
Part 2 covers advanced topics around this implementation. It explains the scaling behavior and considers alternative approaches, and looks at the cost of using this service.
For more serverless learning resources, visit Serverless Land.