This post is written by Suraj Tripathi, Cloud Consultant, AppDev.
You can now develop AWS Lambda functions using the Node.js 18 runtime. This version is in active LTS status and considered ready for general use. When creating or updating functions, specify a runtime parameter value of nodejs18.x or use the appropriate container base image to use this new runtime.
This runtime version is supported by functions running on either Arm-based AWS Graviton2 processors or x86-based processors. Using the Graviton2 processor architecture option allows you to get up to 34% better price performance.
This blog post explains the major changes available with the Node.js 18 runtime in Lambda.
AWS SDK for JavaScript upgrade to v3
Lambda’s Node.js runtimes include the AWS SDK for JavaScript. This enables customers to use the AWS SDK to connect to other AWS services from their function code, without having to include the AWS SDK in their function deployment. This is especially useful when creating functions in the AWS Management Console. It’s also useful for Lambda functions deployed as inline code in CloudFormation templates.
If your existing Lambda functions are using the included SDK v2, then you must update your function code to use the SDK v3 when upgrading to the Node.js 18 runtime. This is the recommended approach when upgrading existing functions to Node.js 18. Alternatively, you can use the Node.js 18 runtime without updating your existing code if you deploy the SDK v2 together with your function code.
Version 3 of the SDK for JavaScript offers many benefits over version 2. Most importantly, it is modular, so your code only loads the modules it needs. Modularity also reduces your function size if you choose to deploy the SDK with your function code rather than using the version built into the Lambda runtime. Learn more about optimizing Node.js dependencies in Lambda here.
For example, for a function interacting with Amazon S3 using the v2 SDK, you import the entire SDK, even though you don’t use most of it:
const AWS = require("aws-sdk");
With the v3 SDK, you only import the modules you need, such as ListBucketsCommand, and a service client like S3Client.
import { S3Client, ListBucketsCommand } from "@aws-sdk/client-s3";
Another difference between SDK v2 and SDK v3 is the default settings for TCP connection re-use. In the SDK v2, connection re-use is disabled by default. In SDK v3, it is enabled by default. In most cases, enabling connection re-use improves function performance. To stop TCP connection reuse, set the AWS_NODEJS_CONNECTION_REUSE_ENABLED environment variable to false. You can also stop keeping the connections alive on a per-service client basis.
Another change in the Node.js 18 runtime is added support for ES module resolution via the NODE_PATH environment variable.
ES modules are supported by Lambda’s Node.js 14 and Node.js 16 runtimes. They enable top-level await, which can lower cold start latency when used with Provisioned Concurrency. However, by default Node.js does not search the folders in the NODE_PATH environment variable when importing ES modules. This makes it difficult to import ES modules from folders outside of the /var/task/ folder in which the function code is deployed. For example, to load the AWS SDK included in the runtime as an ES module, or to load ES modules from Lambda layers.
The Node.js 18.x runtime for Lambda searches the folders listed in NODE_PATH when loading ES modules. This makes it easier to include the AWS SDK as an ES module or load ES modules from Lambda layers.
Node.js 18 language updates
The Lambda Node.js 18 runtime also enables you to take advantage of new Node.js 18 language features. This includes improved performance for class fields and private class methods, JSON import assertions, and experimental features such as the Fetch API, Test Runner module, and Web Streams API.
JSON import assertion
The import assertions feature allows module import statements to include additional information alongside the module specifier. Now the following code is valid:
While still experimental, the global fetch API is available by default in Node.js 18. The API includes a fetch function, making fetch polyfills and third-party HTTP packages redundant.
// index.mjs

export const handler = async(event) => {

    const res = await fetch('https://nodejs.org/api/documentation.json');
    if (res.ok) {
      const data = await res.json();
      console.log(data);
    }

    const response = {
        statusCode: 200,
        body: JSON.stringify('Hello from Lambda!'),
    };
    return response;
};
Experimental features in Node.js can be enabled/disabled via the NODE_OPTIONS environment variable. For example, to stop the experimental fetch API you can create a Lambda environment variable NODE_OPTIONS and set the value to --no-experimental-fetch.
With this change, if you run the previous code for the fetch API in your Lambda function, it throws a reference error because the experimental fetch API is now disabled.
Conclusion
Node.js 18 is now supported by Lambda. When building your Lambda functions using the zip archive packaging style, use a runtime parameter value of nodejs18.x to get started building with Node.js 18.
You can also build Lambda functions in Node.js 18 by deploying your function code as a container image using the Node.js 18 AWS base image for Lambda. You may learn more about writing functions in Node.js 18 by reading about the Node.js programming model in the Lambda documentation.
Even a single kernel oops is never a good thing; it is an indication that something has
gone badly wrong in the system somewhere and a straightforward
recovery is not possible. But it seems that oopsing a large number
of times has the potential to be even worse. To head off problems that
might result from repeated oopsing, there
is currently work afoot to put an upper limit on the number of times that
the kernel can be allowed to oops before just giving up and rebooting.
ENGIE—one of the largest utility providers in France and a global player in the zero-carbon energy transition—produces, transports, and deals in electricity, gas, and energy services. With 160,000 employees worldwide, ENGIE is a decentralized organization and operates 25 business units with a high level of delegation and empowerment. ENGIE’s decentralized global customer base had accumulated lots of data, and it required a smarter, unique approach and solution to align its initiatives and provide data that is ingestible, organizable, governable, sharable, and actionable across its global business units.
ENGIE built an enterprise data repository named the Common Data Hub to align its customers and business units around the same solution. ENGIE used AWS to create the Common Data Hub, a custom solution built using a globally distributed data lake and analytics solutions on AWS. The Common Data Hub empowers teams to innovate by simplifying data access and delivering a comprehensive set of analytics tools, such as Amazon QuickSight, Microsoft Power BI, Tableau, and more.
In 2018, the company’s business leadership decided to accelerate its digital transformation through data and innovation by becoming a data-driven company.
“Amazon Athena is a key service in the ENGIE data ecosystem. It makes it easy to analyze data in a serverless manner so there is no infrastructure to manage. We used Athena to quickly build operational dashboards and get insight and high business value from the data available in our data lake.”
– Gregory Wolowiec, chief technology officer at ENGIE
ENGIE uses Microsoft Power BI to create dashboards and leverages the power of Amazon Athena through the out-of-the-box connector for Microsoft Power BI in which, complete raw data sets are not downloaded to the user’s workstation. While users create or interact with a visualization, Microsoft Power BI works with Athena to dynamically query the underlying data source so that they are always viewing current data.
In a previous blog post, you learned how to manually configure all the required infrastructure to create Microsoft Power BI dashboards using Athena with Microsoft Power BI DirectQuery enabled. ENGIE automated the creation and configuration of the Athena connections on Microsoft Power BI Gateway and Microsoft Power BI Online to be able to scale and reduce the manual overhead. In this post, you learn how ENGIE is doing it today.
Solution overview
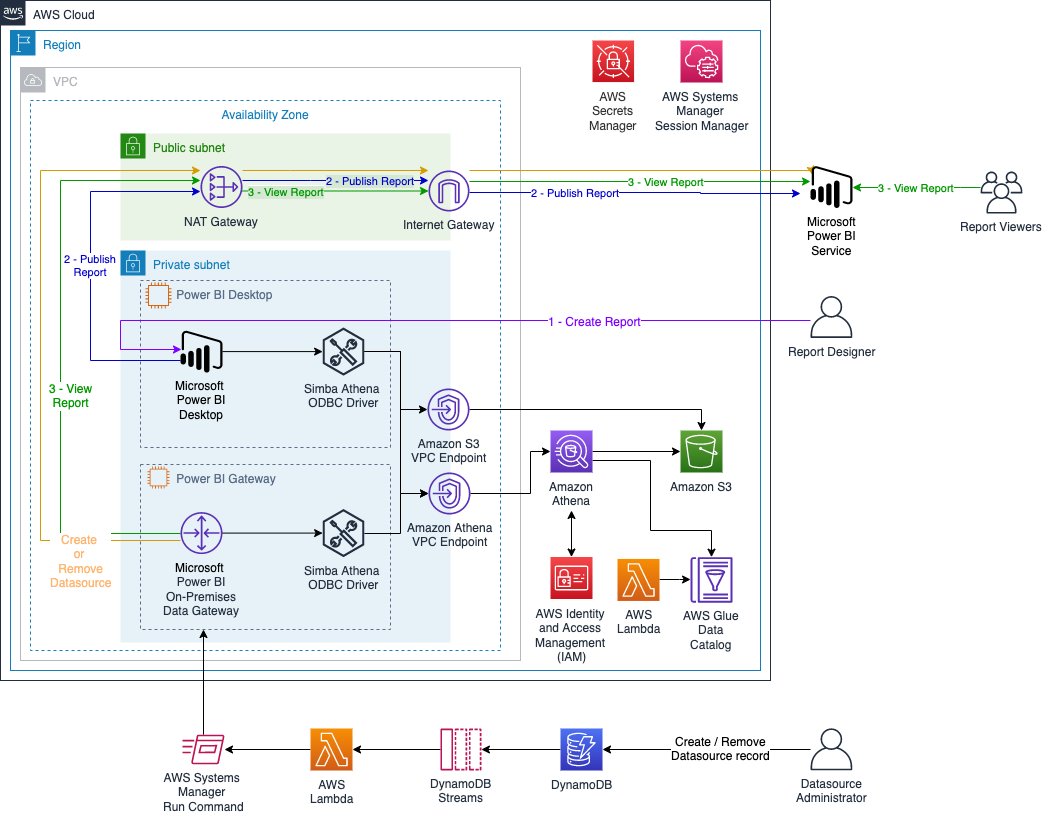
The following diagram illustrates the solution architecture to automate the creation and configuration of the Athena connections on Microsoft Power BI Gateway and Microsoft Power BI Online.
Additionally, the CloudFormation template creates an AWS Glue table that gives you access to the dataset. It creates an AWS Lambda function as an AWS CloudFormation custom resource that updates all the partitions in the AWS Glue table.
In addition to the architecture presented in the previous blog post, this stack creates multiple AWS Systems Manager documents to configure the Athena data sources on Microsoft Power BI Gateway and on Microsoft Power BI Online. The Systems Manager documents are run by another Lambda function that is triggered when we create or delete an entry on Amazon DynamoDB.
From the security standpoint, all resources are deployed within an Amazon VPC (a logically isolated virtual network), and it uses Amazon VPC endpoints to communicate between resources within your Amazon VPC and AWS services without the need of crossing an internet gateway, NAT gateway, VPN connection, or AWS Direct Connect. Additionally, the Microsoft Power BI on-premises data gateway doesn’t require inbound connections. Additionally, authentication with Athena is done on Microsoft Power BI Desktop and on the Microsoft Power BI on-premises data gateway using AWS Identity and Access Management (IAM) profile.
The daily estimated cost of this architecture is $18 USD, mainly driven by the EC2 instances.
First, you deploy the CloudFormation stack with all the infrastructure required. Then, you use AWS Systems Manager Session Manager (see Starting a session (Systems Manager console)) and any remote desktop client to configure the Microsoft Power BI instance in order to create and publish your dashboard. Complete the following steps:
Deploy the CloudFormation stack.
On the EC2 instance that has the name tag PowerBiDesktop, install and configure the Simba Athena ODBC driver and Microsoft Power BI Desktop.
Create your dashboard on Microsoft Power BI Desktop and publish it.
On the EC2 instance that has the name tag PowerBiGateway, install the Simba Athena ODBC driver and Microsoft Power BI on-premises data gateway.
Create Athena resources on the Microsoft Power BI Gateway instance and data source on Microsoft Power BI Online.
View your report on Microsoft Power BI Online.
Remove data source on Microsoft Power BI Online and Athena resources on the Microsoft Power BI Gateway instance.
Prerequisites
For this walkthrough, you should have the following prerequisites:
Download the Microsoft Power BI on-premises data gateway standard mode and launch the installer.
For your gateway, choose On-premises data gateway (recommended).
Accept the default values and choose Install.
When the installer asks you to sign in, enter the email address associated with the Microsoft Power BI Pro tenant that doesn’t require MFA. (This should be the same user name and password that you provided when you launched the CloudFormation stack.)
Choose Sign in.
If asked to register a new gateway or migrate, restore, or take over an existing gateway, choose Register a new gateway.
Give your gateway a name (use the same gateway name passed as a parameter when deploying the CloudFormation stack) and provide a recovery key.
Choose Configure.
You should see a green check mark indicating the gateway is online and ready to be used.
Create Athena resources automatically on the Microsoft Power BI Gateway instance and Microsoft Power BI Online
To automate this process, you insert an entry on DynamoDB. The entry’s attributes have the DSN properties and the users that are allowed to use the data source on Microsoft Power BI Online.
Run the script, passing as parameters your CloudFormation stack name, the DSN name that you want to create, and the users that you want to attach to the dataset (you can pass multiple users separated by a comma without spaces). For example:
This script inserts an entry with all the required properties in your DynamoDB table. When a new entry is added to DynamoDB, an event is captured by Amazon DynamoDB Streams and a Lambda function is triggered to run a Systems Manager document. The last document runs two scripts on the instance: the first one creates a new Athena ODBC DSN, and the second script creates a new data source on Microsoft Power BI Online.
View your report on Microsoft Power BI
To view your report, complete the following steps:
Choose the workspace where you saved your report.
On the Datasets + dataflows tab, locate the dataset, which has the same name as your report (for example, taxireport) and choose the options icon (three dots).
Choose Settings.
Choose Discover Data Sources.
Expand Gateway Connection.
Choose your gateway.
For Maps to, choose taxiconnection.
Choose Apply.
Return to the workspace where you saved your report.
On the Content tab, choose your report (taxireport).
You can now see your report online using the most recent data.
Remove Athena resources automatically on Microsoft Power BI Online and on the Microsoft Power BI Gateway instance
To automate this process, you remove an entry from the DynamoDB table. The entry’s attributes have the DSN properties and the users that are allowed to use the data source on Microsoft Power BI Online.
Run the script, passing as parameters the DSN name that you want to delete. For example:
./delete_record.sh taxiconnection
This command removes an item from your DynamoDB table. When an entry is deleted from DynamoDB, an event is captured by DynamoDB Streams and a Lambda function is triggered to run a Systems Manager document. The last document runs two scripts on the instance: the first one removes the data source on Microsoft Power BI Online, and the second script removes the Athena ODBC DSN.
Clean up
To avoid incurring future charges, delete the CloudFormation stack and the resources that you deployed as part of this post.
Conclusion
ENGIE discovered significant value by using AWS services on top of Microsoft Power BI, enabling its global business units to analyze data in more productive ways. This post presented how ENGIE automated the process of creating reports using Athena with Microsoft Power BI.
The first part of the post described the architecture components and how to successfully create a dashboard using the NYC taxi dataset. The stack deployed uses only one EC2 instance for the Microsoft Power BI on-premises data gateway, but in production, you should consider creating a high-availability cluster of gateway installations, ideally in different Availability Zones.
The second part of this post deployed a demo environment and walked you through the steps to automate Athena data sources to be used on Microsoft Power BI. On the GitHub repository, you can find more scripts to help you to manage the users from your data sources on Microsoft Power BI and more.
For native access to your data in AWS without any downloads or servers, be sure to also check out Amazon QuickSight.
About the authors
Amine Belhabib is Hand-On Cloud Core Service Manager at ENGIE/ ENGIE IT. Innovative Cloud Surfer, helping ENGIE entities to accelerate their digital transformation and cloud first adoption strategy by designing, building, managing group cloud products and patterns in a use cases driven approach.
Armando Segnini is a Senior Data Architect with AWS Professional Services. He spends his time building scalable big data and analytics solutions for AWS Enterprise and Strategic customers. Armando also loves to travel with his family all around the world and take pictures of the places he visits.
Xavier Naunay is a Data Architect with AWS Professional Services. He is part of the AWS ProServe team, helping enterprise customers solve complex problems using AWS services. In his free time, he is either traveling or learning about technology and other cultures.
Amine El Mallem is a Senior Data/ML Ops Engineer in AWS Professional Services. He works with customers to design, automate, and build solutions on AWS for their business needs.
Anouar Zaaber is a Senior Engagement Manager in AWS Professional Services. He leads internal AWS, external partners, and customer teams to deliver AWS Cloud services that enable customers to realize their business outcomes.
Releases like this are too rare to disregard and thus all the more
to treasure. In one swift motion the team is doing away with
floating selections and bringing strokes/outlines for text. But
this has been a bumpy road
Sourceware, a volunteer group that has been supporting various
critical FOSS developer tools for more than two decades, is being
courted by The Linux Foundation’s Open Source Security Foundation
(OpenSSF). The OpenSSF aims to improve open source software
security by providing Sourceware projects with more modern IT
infrastructure.
But some members of the Sourceware community fear that accepting
the help of the OpenSSF would give the corporate Linux world more
leverage over FOSS developer tools. They would prefer to seek
support from the Software Freedom Conservancy, a charitable
non-profit that they believe is better aligned with software
freedom.
Time-triggered Ethernet (TTE) is used in spacecraft, basically to use the same hardware to process traffic with different timing and criticality. Researchers have defeated it:
On Tuesday, researchers published findings that, for the first time, break TTE’s isolation guarantees. The result is PCspooF, an attack that allows a single non-critical device connected to a single plane to disrupt synchronization and communication between TTE devices on all planes. The attack works by exploiting a vulnerability in the TTE protocol. The work was completed by researchers at the University of Michigan, the University of Pennsylvania, and NASA’s Johnson Space Center.
“Our evaluation shows that successful attacks are possible in seconds and that each successful attack can cause TTE devices to lose synchronization for up to a second and drop tens of TT messages—both of which can result in the failure of critical systems like aircraft or automobiles,” the researchers wrote. “We also show that, in a simulated spaceflight mission, PCspooF causes uncontrolled maneuvers that threaten safety and mission success.”
The Author Spotlight series pulls back the curtain on some of AWS’s most prolific authors. Read on to find out more about our very own Luca Mezzalira’s journey, in his own words!
My name is Luca, and I’m a Principal Serverless Specialist Solutions Architect—probably the longest job title I’ve ever had in my 20-year career in the tech industry. One thing you have to know about me upfront: I love challenges. I tread an unconventional path, on which I found several hurdles, but, after a few years, I grew to love them.
Since I joined Amazon Web Services (AWS) in January 2021, I discovered (and continue to discover) all the challenges I’ve always dreamed of. I can also find solutions for customers, industries, and communities—what better place is there for a challenge-hunter like me!
I am self-taught. I learned my foundational skills from the developer communities I joined out of a thirst for knowledge. Fast-forward 20 years later, I still try to pay my “debt” to them by sharing what I learn and do on a regular basis.
Luca Mezzalira during the opening talk at JS Poland 2022
AWS gave me the opportunity to first help our Media & Entertainment industry customers in the UK and Ireland and, now, to follow my passion working as a Serverless Specialist.
“Passionate” is another word that characterizes me, both personally and professionally: I’m Italian and there is a lot of passion under our skin. I don’t consider what I do a job but, rather, something I just love to do.
During these past couple of years with AWS, I have been able to use all 360° of my knowledge. With customers experimenting with new ideas and solutions, with colleagues urging customers outside their comfort zone and onto new horizons or into new adventures with AWS, I am blurring the edges of different worlds. With each passing day, I provide new perspectives for solving existing challenges! With internal and external communities, I support and organize events for spreading our ever-growing knowledge and creating new, meaningful connections.
Another great passion of mine is software architecture. Design patterns, distributed systems, team topology, domain-driven design, and any topic related to software architecture is what I deeply love. Do you know why? Because there isn’t right or wrong in architecture—it’s just trade-offs! The challenge is to find the least-worse decision for making a project successful.
Moreover, architectures are like living organisms. They evolve, requiring care and attention. Many might think that architecting is only a technical concern, but it is deeply connected with the organizational structure, as well the communication and engineering practices. When we acknowledge these aspects and work across these dimensions, the role of an architect is one of the best you can have—or at least it is for me!
What’s on my mind
There are two main topics I am focusing on at the moment: (1) distributed architecture on the frontend (i.e., micro-frontends); and (2) educating our builders on thinking in patterns, choosing the right solution to implement at the right moment.
In both cases, I create a lot of content trying to bridge the gap between the technical implementation and the architecture characteristics a company wants to optimize for.
The first contribution I wanted to provide in AWS was without any doubt architectural. Hexagonal architecture (or ports and adapters) is not a new topic by any stretch, however, I wasn’t able to find solid resources with a simplified explanation of this approach. Once in place, hexagonal architectures can help the portability of your business logic across different AWS services or even on a hybrid-cloud. Using this architecture on Lambda functions has generated a lot of interest inside the serverless community.
The second resource I am extremely proud of is a collaboration with AWS’s Zamira Jaupaj, Laura Hyatt, and Vittorio Denti… the Let’s Architect! team.
I met them in my first year in AWS, and they share a similar passion for helping people and community engagement. Moreover, we all want to learn something new. Together, we created Let’s Architect!, a blog series that publishes a fortnightly post on a specific topic since January 2022. For example, serverless, containers, or data architectures are explored, gathering four different AWS content pieces that provide an architect’s perspective on why that content is relevant (or still relevant).
This initiative has had a strong influence, and we now have customers and even many of our colleagues awaiting our upcoming posts. If you want to discover more, check out the AWS Architecture Blog.
The last resource is part of my dream to lead the frontend community in their discovery of AWS services.
The frontend community is exposed to a lot of new frameworks and libraries, however, I believe they should look to the cloud as well, as they can unlock a variety of new possibilities.
Considering my expertise on micro-frontends and serverless, I started with a reference architecture to build distributed frontend using serverless. I recently started a new series on the AWS Compute Blog explaining the reasoning behind this reference architecture and how to approach server-side rendering micro-frontends using serverless. Read my first post on server-side rendering micro-frontends.
Security updates have been issued by Debian (asterisk, firefox-esr, php-phpseclib, phpseclib, python-django, and thunderbird), Fedora (grub2, samba, and thunderbird), Mageia (firefox, sudo, systemd, and thunderbird), Slackware (freerdp), SUSE (firefox, go1.18, go1.19, kernel, openvswitch, python-Twisted, systemd, and xen), and Ubuntu (expat, git, multipath-tools, unbound, and webkit2gtk).
Cloudflare is building the fastest network in the world. But we don’t want you to just take our word for it. To demonstrate it, we are continuously testing ourselves versus everyone else to make sure we’re the fastest. Since it’s Developer Week, we wanted to provide an update on how our Workers products perform against the competition, as well as our overall network performance.
Earlier this year, we compared ourselves to Fastly’s Compute@Edge and overall we were faster. This time, not only did we repeat the tests, but we also added AWS Lambda@Edge to help show how we stack up against more and more competitors. The summary: we offer the fastest developer platform on the market. Let’s talk about how we build our network to help make you faster, and then we’ll get into how that translates to our developer platform.
Latest update on network performance
We have two updates on data: a general network performance update, and then data on how Workers compares with Compute@Edge and Lambda@Edge.
To quantify global network performance, we have to get enough data from around the world, across all manner of different networks, comparing ourselves with other providers. We used Real User Measurements (RUM) to fetch a 100kB file from different providers. Users around the world report the performance of different providers. The more users who report the data, the higher fidelity the signal is. The goal is to provide an accurate picture of where different providers are faster, and more importantly, where Cloudflare can improve. You can read more about the methodology in the original Speed Week blog post here.
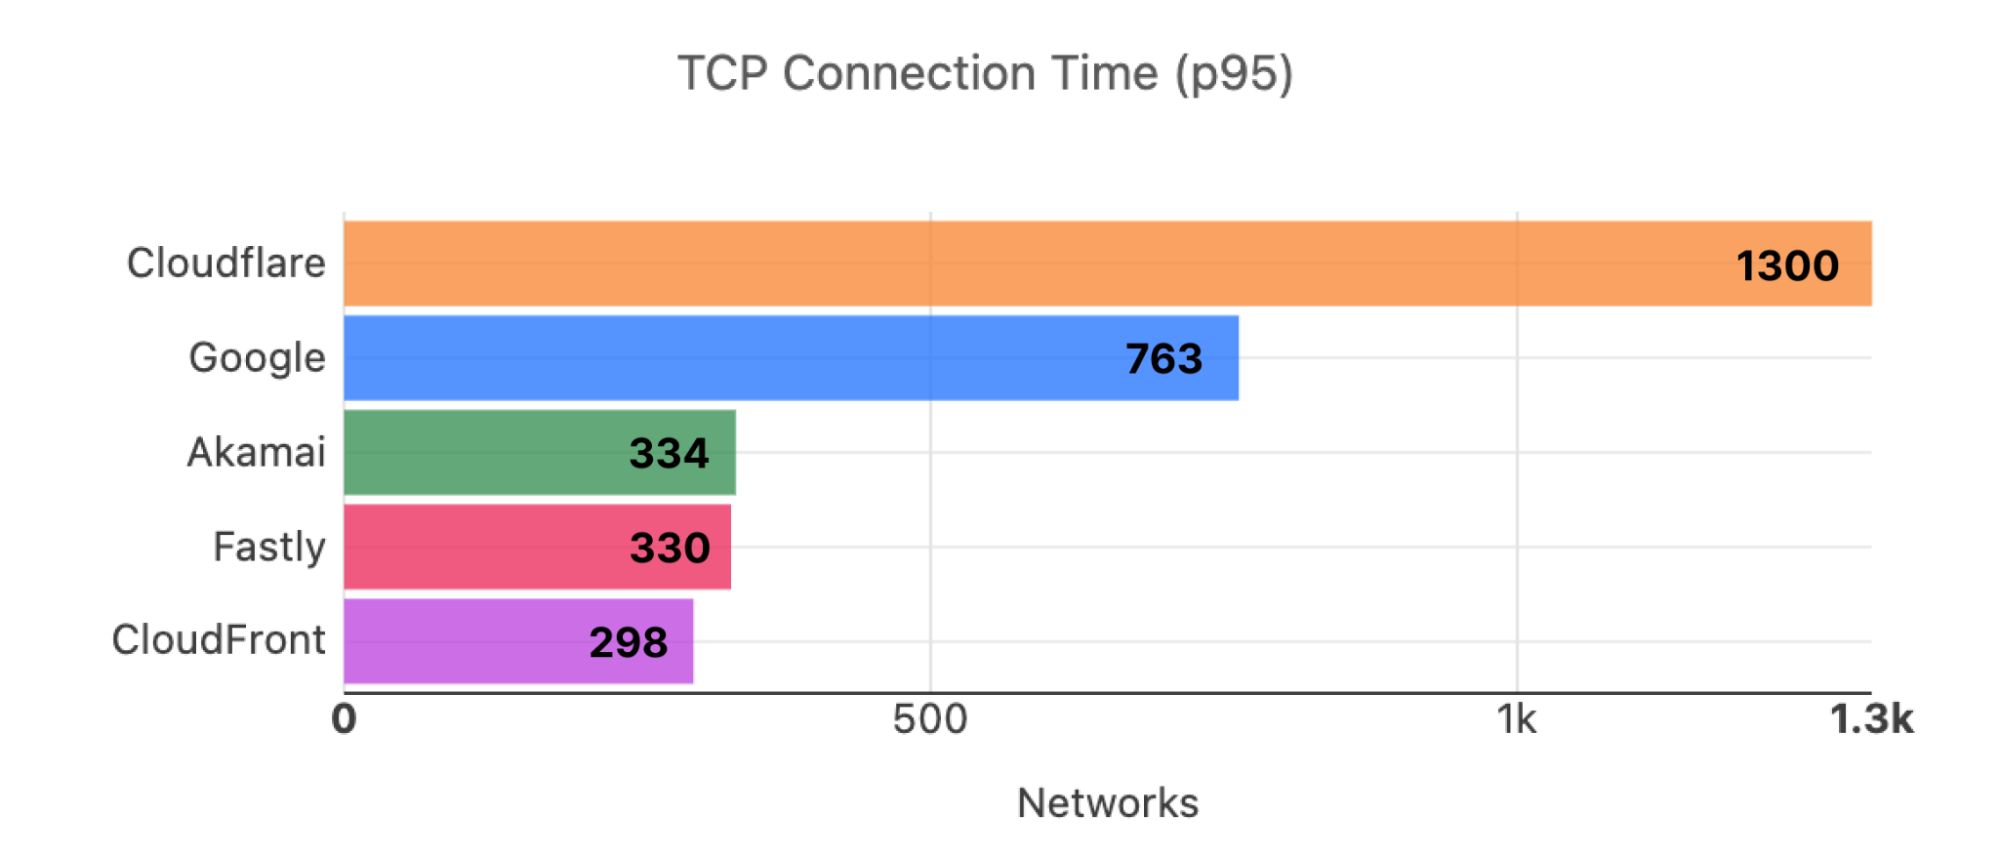
During Cloudflare One Week (June 2022), we shared that we were faster in more of the most reported networks than our competitors. Out of the top 3,000 networks in the world (by number of IPv4 addresses advertised), here’s a breakdown of the number of networks where each provider is number one in p95 TCP Connection Time, which represents the time it takes for a user on a given network to connect to the provider. This data is from Cloudflare One Week (June 2022):
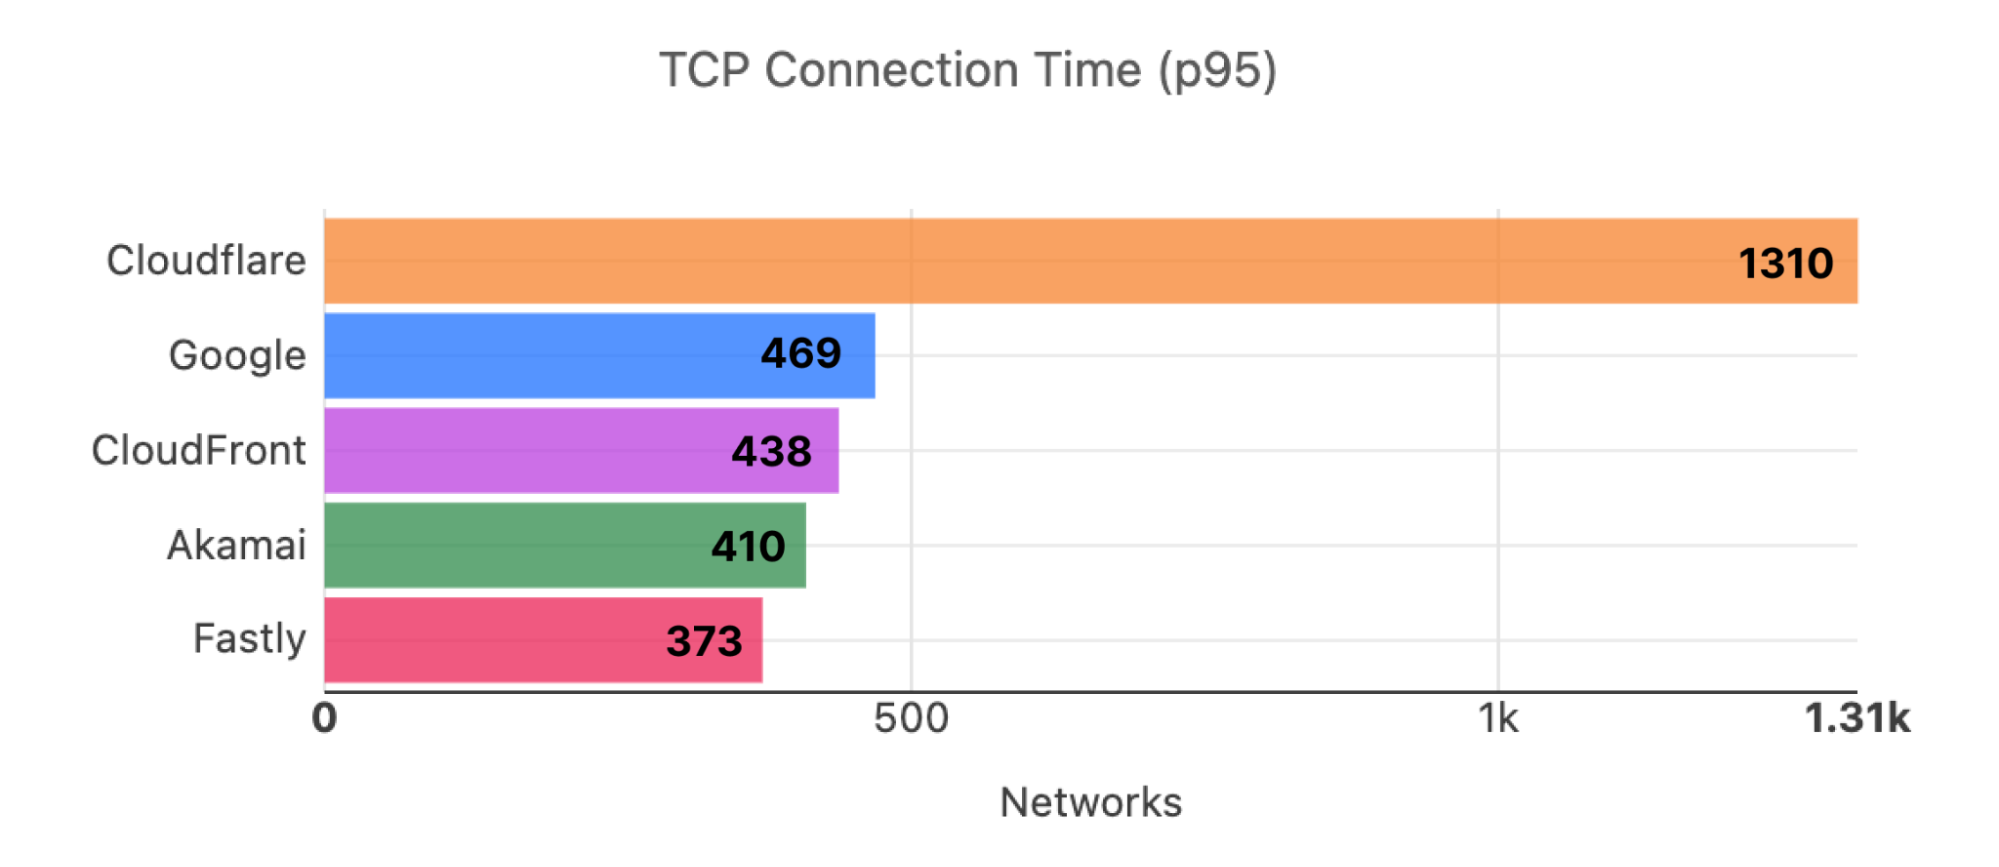
Here is what the distribution looks like for the top 3,000 networks for Developer Week (November 2022):
In addition to being the fastest across popular networks, Cloudflare is also committed to being the fastest provider in every country.
Using data on the top 3,000 networks from Cloudflare One Week (June 2022), here’s what the world map looks like (Cloudflare is in orange):
And here’s what the world looks like while looking at the top 3,000 networks for Developer Week (November 2022):
Cloudflare became #1 in more countries in Europe and Asia, specifically Russia, Ukraine, Kazakhstan, India, and China, further delivering on our mission to be the fastest network in the world. So let’s talk about how that network helps power the Supercloud to be the fastest developer platform around.
How we’re comparing developer platforms
It’s been six months since we published our initial tests, but here’s a quick refresher. We make comparisons by measuring time to connect to the network, time spent completing requests, and overall time to respond. We call these numbers connect, wait, and response. We’ve chosen these numbers because they are critical components of a request that need to be as fast as possible in order for users to see a good experience. We can reduce the connect times by peering as close as possible to the users. We can reduce the wait times by optimizing code execution to be as fast as possible. If we optimize those two processes, we’ve optimized the response, which represents the end-to-end latency of a request.
Test methodology
To measure connect, wait, and response, we perform three tests against each provider: a simple no-op JavaScript function, a complex JavaScript function, and a complex Rust function. We don’t do a simple Rust function because we expect it to take almost no time at all, and we already have a baseline for end-to-end functionality in the no-op JavaScript function since many providers will often compile both down to WebAssembly.
Here are the functions for each of them:
JavaScript no-op:
async function getErrorResponse(event, message, status) {
  return new Response(message, {status: status, headers: {'Content-Type': 'text/plain'}});
}
JavaScript hard function:
function testHardBusyLoop() {
  let value = 0;
  let offset = Date.now();

  for (let n = 0; n < 15000; n++) {
    value += Math.floor(Math.abs(Math.sin(offset + n)) * 10);
  }

  return value;
}
Rust hard function:
fn test_hard_busy_loop() -> i32 {
  let mut value = 0;
  let offset = Date::now().as_millis();

  for n in 0..15000 {
    value += (((offset + n) as f64).sin().abs() * 10.0) as i32;
  }

  value
}
We’re trying to test how good each platform is at optimizing compute in addition to evaluating how close each platform is to end-users. However, for this test, we did not run a Rust test on Lambda@Edge because it did not natively support our Rust function without uploading a WASM binary that you compile yourself. Since Lambda@Edge does not have a true first-class developer platform and tooling to run Rust, we decided to exclude the Rust scenarios for Lambda@Edge. So when we compare numbers for Lambda@Edge, it will only be for the JavaScript simple and JavaScript hard tests.
Measuring Workers performance from real users
To collect data, we use two different methods: one from a third party service called Catchpoint, and a second from our own network performance benchmarking tests. First, we used Catchpoint to gather a set of data from synthetic probes. Catchpoint is an industry standard “synthetic” testing tool, and measurements collected from real users distributed around the world. Catchpoint is a monitoring platform that has around 2,000 total endpoints distributed around the world that can be configured to fetch specific resources and time for each test. Catchpoint is useful for network providers like us as it provides a consistent, repeatable way to measure end-to-end performance of a workload, and delivers a best-effort approximation for what a user sees.
Catchpoint has backbone nodes that are embedded in ISPs around the world. That means that these nodes are plugged into ISP routers just like you are, and the traffic goes through the ISP network to each endpoint they are monitoring. These can approximate a real user, but they will never truly replicate a real user. For example, the bandwidth for these nodes is 100% dedicated for platform monitoring, as opposed to your home Internet connection, where your Internet experience will be a mixed bag of different use cases, some of which won’t talk to Workers applications at all.
For this new test, we chose 300 backbone nodes that are embedded in last mile ISPs around the world. We filtered out nodes in cloud providers, or in metro areas with multiple transit options, trying to remove duplicate paths as much as possible.
We cross-checked these tests with our own data set, which is collected from users connecting to free websites when they are served 1xxx error pages, just like how we collect data for global network performance. When a user sees this error page, that page that will execute these tests as a part of rendering and upload performance metrics on these calls to Cloudflare.
We also changed our test methodology to use paid accounts for Fastly, Cloudflare, and AWS.
Workers vs Compute@Edge vs Lambda@Edge
This time, let’s start off with the response times to show how we’re doing end-to-end:
Test
95th percentile response (ms)
Cloudflare JavaScript no-op
479
Fastly JavaScript no-op
634
AWS JavaScript no-op
1,400
Cloudflare JavaScript hard
471
Fastly JavaScript hard
683
AWS JavaScript hard
1,411
Cloudflare Rust hard
472
Fastly Rust hard
638
We’re fastest in all cases. Now let’s look at connect times, which show us how fast users connect to the compute platform before doing any actual compute:
Test
95th percentile connect (ms)
Cloudflare JavaScript no-op
82
Fastly JavaScript no-op
94
AWS JavaScript no-op
295
Cloudflare JavaScript hard
82
Fastly JavaScript hard
94
AWS JavaScript hard
297
Cloudflare Rust hard
79
Fastly Rust hard
94
Note that we don’t expect these times to differ based on the code being run, but we extract them from the same set of tests, so we’ve broken them out here.
But what about wait times? Remember, wait times represent time spent computing the request, so who has optimized their platform best? Again, it’s Cloudflare, although Fastly still has a slight edge on the hard Rust test (which we plan to beat by further optimization):
Test
95th percentile wait (ms)
Cloudflare JavaScript no-op
110
Fastly JavaScript no-op
122
AWS JavaScript no-op
362
Cloudflare JavaScript hard
115
Fastly JavaScript hard
178
AWS JavaScript hard
367
Cloudflare Rust hard
125
Fastly Rust hard
122
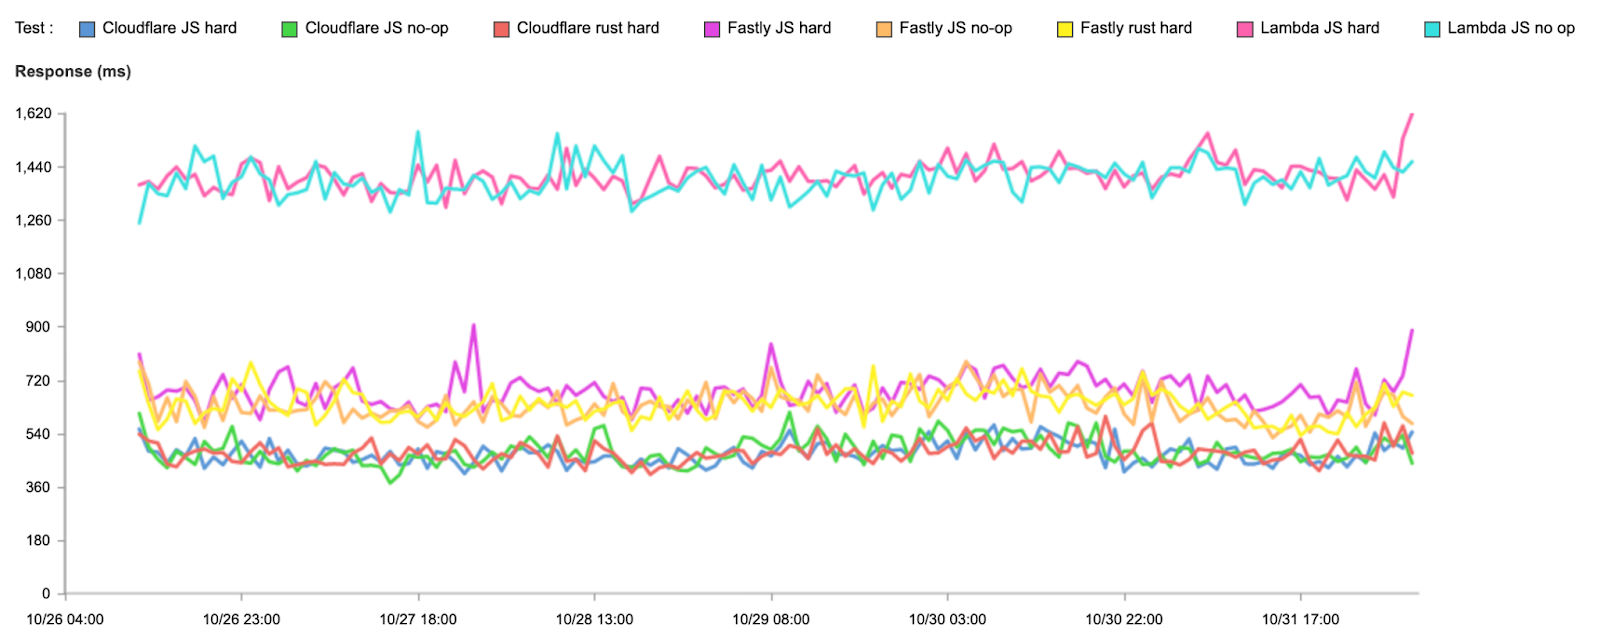
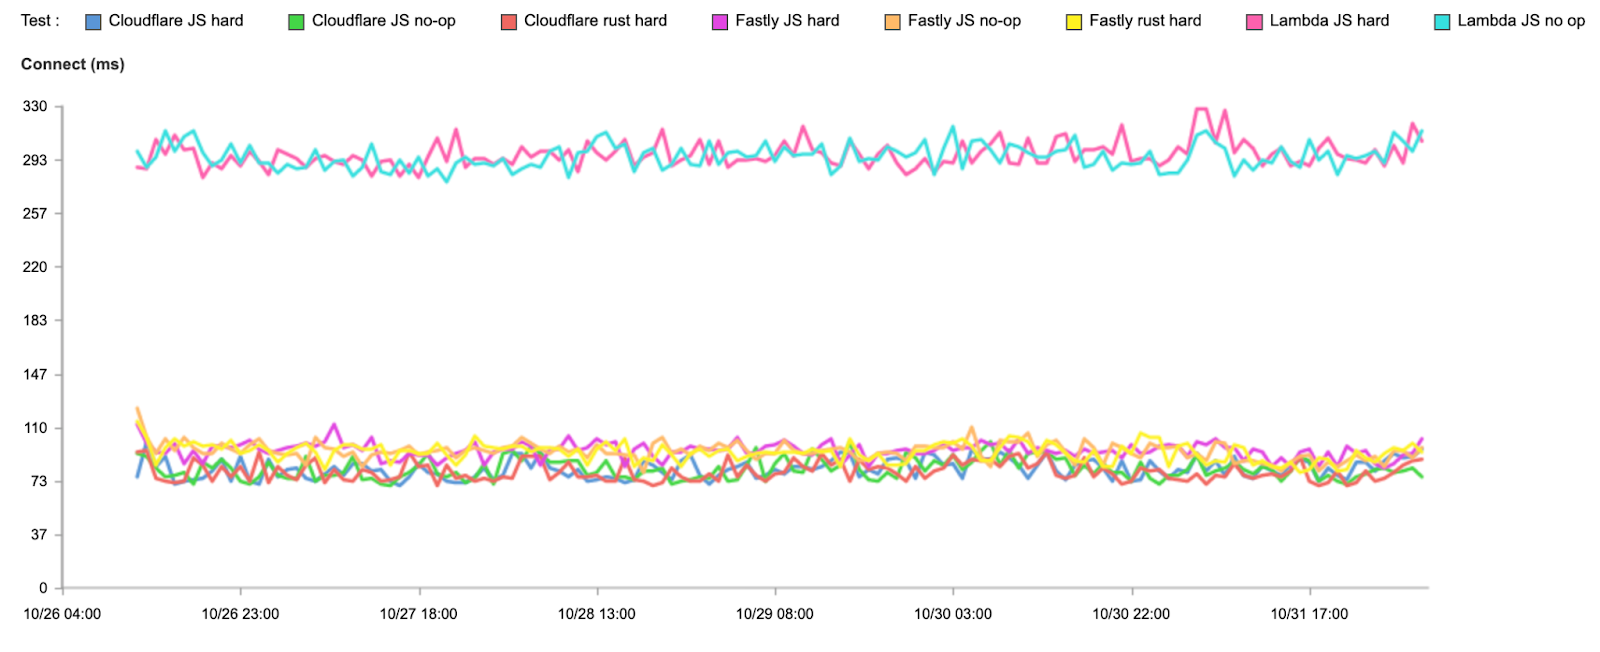
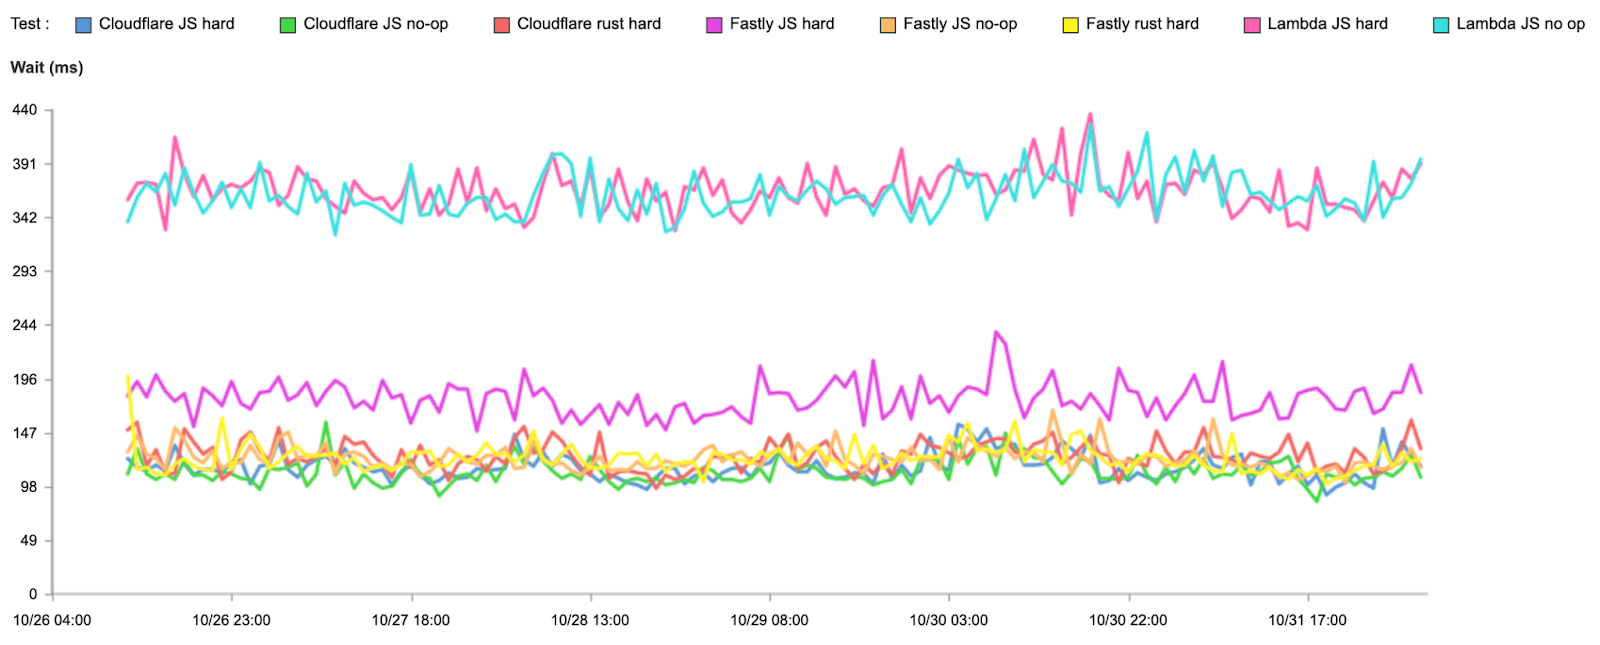
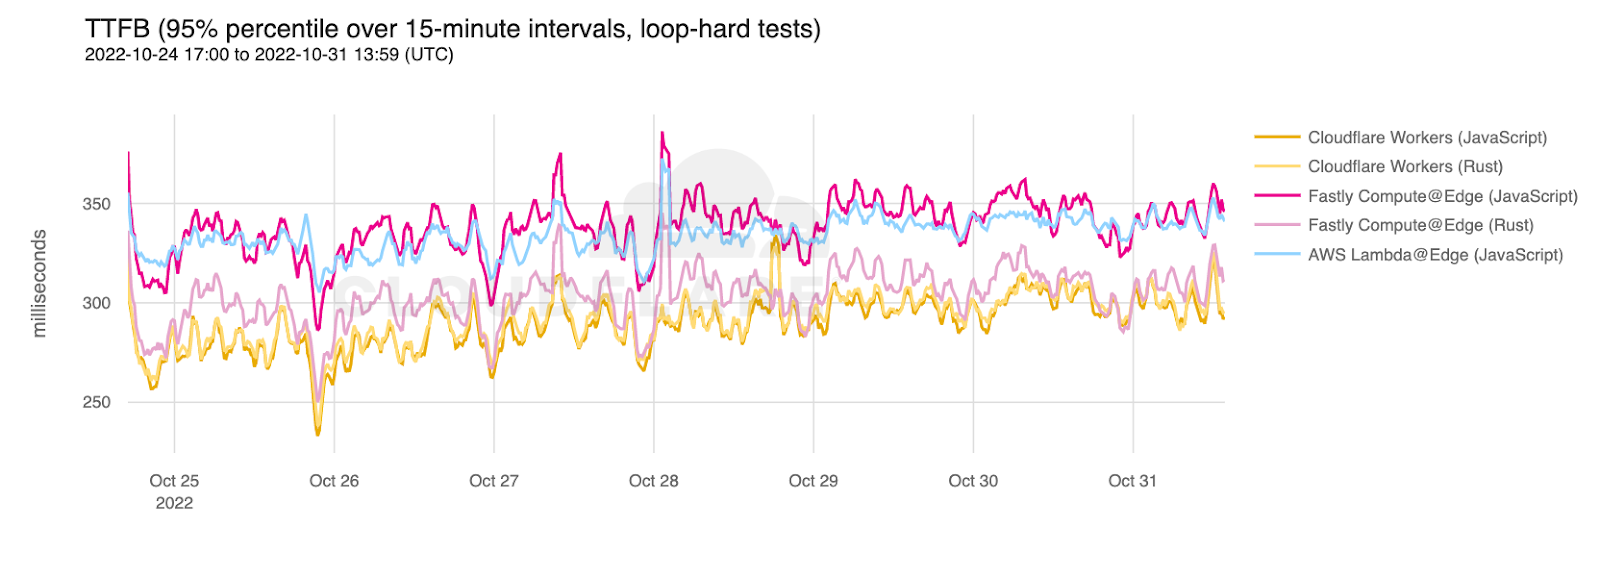
To verify these results, we compared the Catchpoint results to our own data set. Here is the p95 TTFB for the JavaScript and Rust hard loops for Fastly, AWS, and Cloudflare from our data:
Cloudflare is faster on JavaScript and Rust calls. These numbers also back up the slight compute advantage for Fastly on Rust calls.
The big takeaway from this is that in addition to Cloudflare being faster for the time spent processing requests in nearly every test, Cloudflare’s network and performance optimizations as a whole set us apart and make our Workers platform even faster for everything. And, of course, we plan to keep it that way.
Your application, but faster
Latency is an important component of the user experience, and for developers, being able to ensure their users can do things as fast as possible is critical for the success of an application. Whether you’re building applications in Workers, D1, and R2, hosting your documentation in Pages, or even leveraging Workers as part of your SaaS platform, having your code run in the SuperCloud that is our global network will ensure that your users see the best experience they possibly can.
Our network is hyper-optimized to make your code as fast as possible. By using Cloudflare’s network to run your applications, you can focus on making the best possible application possible and rest easy knowing that Cloudflare is providing you the best user experience possible. This is because Cloudflare’s developer platform is built on top of the world’s fastest network. So go out and build your dreams, and know that we’ll make your dreams as fast as they can possibly be.
When writing code, you can only move as fast as you can debug.
Our goal at Cloudflare is to give our developers the tools to deploy applications faster than ever before. This means giving you tools to do everything from initializing your Workers project to having visibility into your application successfully serving production traffic.
Last year we introduced wrangler tail, letting you access a live stream of Workers logs to help pinpoint errors to debug your applications. Workers Trace Events Logpush (or just Workers Logpush for short) extends this functionality – you can use it to send Workers logs to an object storage destination or analytics platform of your choice.
Workers Logpush is now available to everyone on the Workers Paid plan! Read on to learn how to get started and about pricing information.
Move fast and don’t break things
With the rise of platforms like Cloudflare Workers over containers and VMs, it now takes just minutes to deploy applications. But, when building an application, any tech stack that you choose comes with its own set of trade-offs.
As a developer, choosing Workers means you don’t need to worry about any of the underlying architecture. You just write code, and it works (hopefully!). A common criticism of this style of platform is that observability becomes more difficult.
We want to change that.
Over the years, we’ve made improvements to the testing and debugging tools that we offer — wrangler dev, Miniflare and most recently our open sourced runtime workerd. These improvements have made debugging locally and running unit tests much easier. However, there will always be edge cases or bugs that are only replicated in production environments.
If something does break…enter Workers Logpush
Wrangler tail lets you view logs in real time, but we’ve heard from developers that you would also like to set up monitoring for your services and have a historical record to look back on. Workers Logpush includes metadata about requests, console.log() messages and any uncaught exceptions. To give you an idea of what it looks like, below is a sample log line:
Logpush has support for the most popular observability tools. Send logs to Datadog, New Relic or even R2 for storage and ad hoc querying.
Pricing
Workers Logpush is available to both customers on our Workers Paid and Enterprise plans. We wanted this to be very affordable for our developers. Workers Logpush is priced at $0.05 per million requests, and we only charge you for requests that result in logs delivered to an end destination after any filtering or sampling is applied. It also has an included usage of 10M requests each month.
Configuration
Logpush is incredibly simple to set up.
1. Create a Logpush job. The following example sends Workers logs to R2.
In Logpush, you can also configure filters and a sampling rate to have more control of the volume of data that is sent to your configured destination. For example if you only want to receive logs for resulted in an exception, you could add the following under logpull_options:
You can do this by adding a new property, logpush = true, to your wrangler.toml file. This can be added either in the top level configuration or under an environment. Any new scripts with this property will automatically get picked up by the Logpush job.
Get started today!
Both customers on our Workers Paid Plan and Enterprise plan can get started with Workers Logpush now! The full guide on how to get started is here.
The Cloudflare team was so excited to hear how Twilio Segment solved problems they encountered with tracking first-party data and personalization using Cloudflare Workers. We are happy to have guest bloggers Pooya Jaferian and Tasha Alfano from Twilio Segment to share their story.
Introduction
Twilio Segment is a customer data platform that collects, transforms, and activates first-party customer data. Segment helps developers collect user interactions within an application, form a unified customer record, and sync it to hundreds of different marketing, product, analytics, and data warehouse integrations.
There are two “unsolved” problem with app instrumentation today:
Problem #1: Many important events that you want to track happen on the “wild-west” of the client, but collecting those events via the client can lead to low data quality, as events are dropped due to user configurations, browser limitations, and network connectivity issues.
Problem #2: Applications need access to real-time (<50ms) user state to personalize the application experience based on advanced computations and segmentation logic that must be executed on the cloud.
The Segment Edge SDK – built on Cloudflare Workers – solves for both. With Segment Edge SDK, developers can collect high-quality first-party data. Developers can also use Segment Edge SDK to access real-time user profiles and state, to deliver personalized app experiences without managing a ton of infrastructure.
This post goes deep on how and why we built the Segment Edge SDK. We chose the Cloudflare Workers platform as the runtime for our SDK for a few reasons. First, we needed a scalable platform to collect billions of events per day. Workers running with no cold-start made them the right choice. Second, our SDK needed a fast storage solution, and Workers KV fitted our needs perfectly. Third, we wanted our SDK to be easy to use and deploy, and Workers’ ease and speed of deployment was a great fit.
It is important to note that the Segment Edge SDK is in early development stages, and any features mentioned are subject to change.
Serving a JavaScript library 700M+ times per day
analytics.js is our core JavaScript UI SDK that allows web developers to send data to any tool without having to learn, test, or use a new API every time.
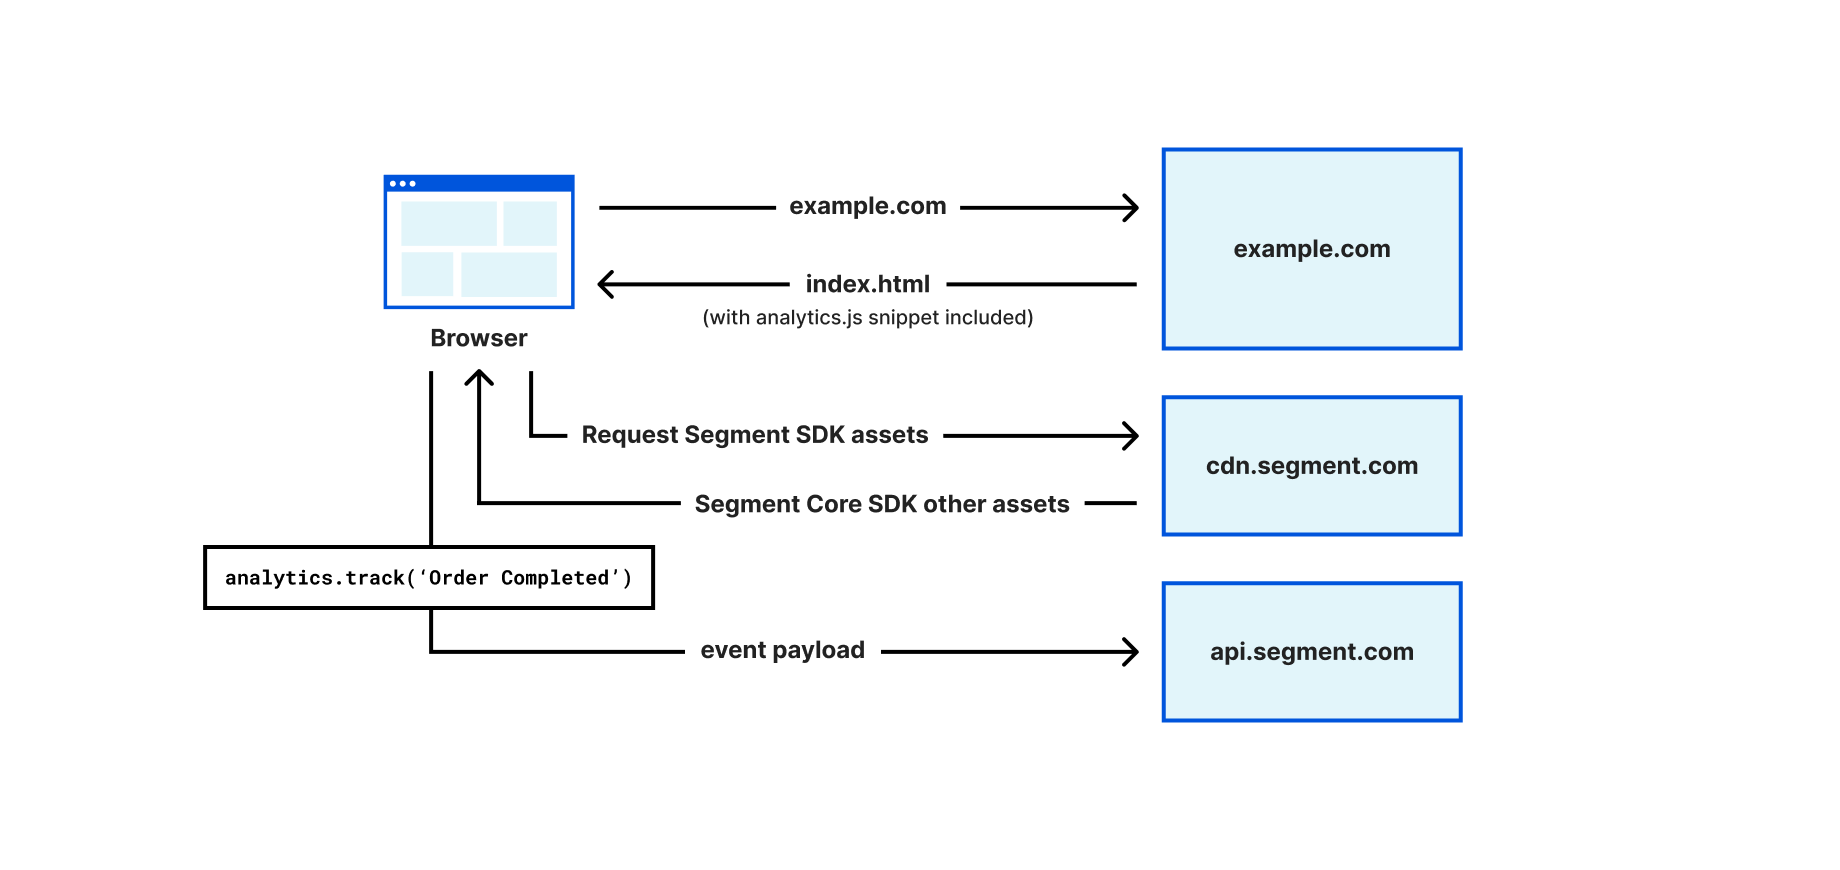
Figure 1 illustrates how Segment can be used to collect data on a web application. Developers add Segment’s web SDK, analytics.js, to their websites by including a JavaScript snippet to the HEAD of their web pages. The snippet can immediately collect and buffer events while it also loads the full library asynchronously from the Segment CDN. Developers can then use analytics.js to identify the visitors, e.g., analytics.identify('john'), and track user behavior, e.g., analytics.track('OrderCompleted'). Calling the `analytics.js methods such as identify or track will send data to Segment’s API (api.segment.io). Segment’s platform can then deliver the events to different tools, as well as create a profile for the user (e.g., build a profile for user “John”, associate “Order Completed”, as well as add all future activities of john to the profile).
Analytics.js also stores state in the browser as first-party cookies (e.g., storing an ajs_user_id cookie with the value of john, with cookie scoped at the example.com domain) so that when the user visits the website again, the user identifier stored in the cookie can be used to recognize the user.
Figure 1- How analytics.js loads on a website and tracks events
While analytics.js only tracks first-party data (i.e., the data is collected and used by the website that the user is visiting), certain browser controls incorrectly identify analytics.js as a third-party tracker, because the SDK is loaded from a third-party domain (cdn.segment.com) and the data is going to a third-party domain (api.segment.com). Furthermore, despite using first-party cookies to store user identity, some browsers such as Safari have limited the TTL for non-HTTPOnly cookies to 7-days, making it challenging to maintain state for long periods of time.
To overcome these limitations, we have built a Segment Edge SDK (currently in early development) that can automatically add Segment’s library to a web application, eliminate the use of third-party domains, and maintain user identity using HTTPOnly cookies. In the process of solving the first-party data problem, we realized that the Edge SDK is best positioned to act as a personalization library, given it has access to the user identity on every request (in the form of cookies), and it can resolve such identity to a full-user profile stored in Segment. The user profile information can be used to deliver personalized content to users directly from the Cloudflare Workers platform.
The remaining portions of this post will cover how we solved the above problems. We first explain how the Edge SDK helps with first-party collection. Then we cover how the Segment profiles database becomes available on the Cloudflare Workers platform, and how to use such data to drive personalization.
Segment Edge SDK and first-party data collection
Developers can set up the Edge SDK by creating a Cloudflare Worker sitting in front of their web application (via Routes) and importing the Edge SDK via npm. The Edge SDK will handle requests and automatically injects analytics.js snippets into every webpage. It also configures first-party endpoints to download the SDK assets and send tracking data. The Edge SDK also captures user identity by looking at the Segment events and instructs the browser to store such identity as HTTPOnly cookies.
How the Edge SDK works under the hood to enable first-party data collection
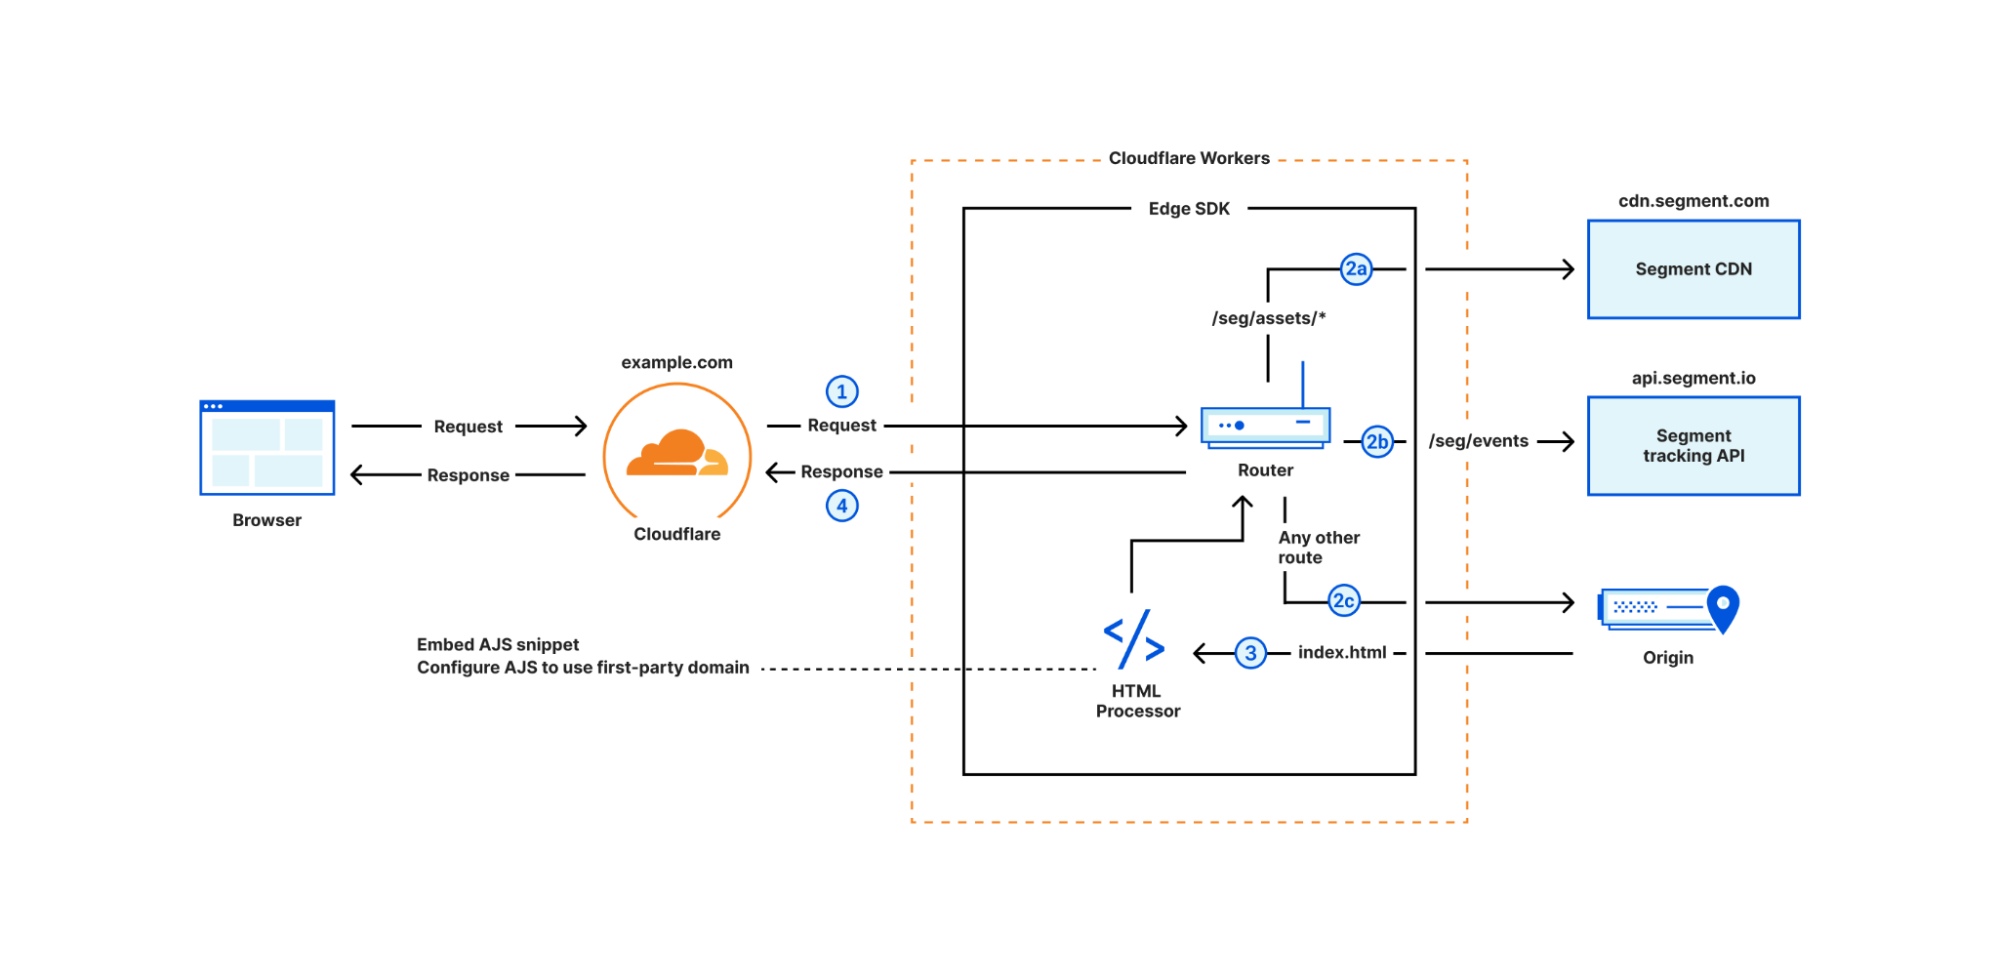
The Edge SDK’s internal router checks the inbound request URL against predefined patterns. If the URL matches a route, the router runs the route’s chain of handlers to process the request, fetch the origin, or modify the response.
Figure 2 demonstrates the routing of incoming requests. The Worker calls segment.handleEvent method with the request object (step 1), then the router matches the request.url and request.method against a set of predefined routes:
GET requests with /seg/assets/* path are proxied to Segment CDN (step 2a)
POST requests with /seg/events/* path are proxied to Segment tracking API (step 2b)
Other requests are proxied to the origin (step 2c) and the HTML responses are enriched with the analytics.js snippet (step 3)
Regardless of the route, the router eventually returns a response to the browser (step 4) containing data from the origin, the response from Segment tracking API, or analytics.js assets. When Edge SDK detects the user identity in an incoming request (more on that later), it sets an HTTPOnly cookie in the response headers to persist the user identity in the browser.
Figure 2- Edge SDK router flow
In the subsequent three sections, we explain how we inject analytics.js, proxy Segment endpoints, and set server-side cookies.
Injecting Segment SDK on requests to origin
For all the incoming requests routed to the origin, the Edge SDK fetches the HTML page and then adds the analytics.js snippet to the <HEAD> tag, embeds the write key, and configures the snippet to download the subsequent javascript bundles from the first-party domain ([first-party host]/seg/assets/*) and sends data to the first-party domain as well ([first-party host]/seg/events/*). This is accomplished using the HTMLRewriter API.
import snippet from "@segment/snippet"; // Existing Segment package that generates snippet

class ElementHandler {
   constructor(host: string, writeKey: string)

   element(element: Element) {
     // generate Segment snippet and configure it with first-party host info
     const snip = snippet.min({
         host: `${this.host}/seg`,
         apiKey: this.writeKey,
       })
     element.append(`<script>${snip}</script>`, { html: true });
   }
 }

export const enrichWithAJS: HandlerFunction = async (
   request,
   response,
   context
 ) => {
   const {
     settings: { writeKey },
   } = context;
   const host = request.headers.get("host") || "";
    return [
     request,
     new HTMLRewriter().on("head",
         new ElementHandler(host, writeKey))
       .transform(response),
     context,
   ];
 };
Proxy SDK bundles and Segment API
The Edge SDK proxies the Segment CDN and API under the first-party domain. For example, when the browser loads a page with the injected analytics.js snippet, the snippet loads the full analytics.js bundle from https://example.com/seg/assets/sdk.js, and the Edge SDK will proxy that request to the Segment CDN:
Similarly, analytics.js collects events and sends them via a POST request to https://example.com/seg/events/[method] and the Edge SDK will proxy such requests to the Segment tracking API:
The Edge SDK also re-writes existing client-side analytics.js cookies as HTTPOnly cookies. When Edge SDK intercepts an identify event e.g., analytics.identify('john'), it extracts the user identity (“john”) and then sets a server-side cookie when sending a response back to the user. Therefore, any subsequent request to the Edge SDK can be associated with “john” using request cookies.
Intercepting the ajs_user_id on the Workers, and using the cookie identifier to associate each request to a user, is quite powerful, and it opens the door for delivering personalized content to users. The next section covers how Edge SDK can drive personalization.
Personalization on the Supercloud
The Edge SDK offers a registerVariation method that can customize how a request to a given route should be fetched from the origin. For example, let’s assume we have three versions of a landing page in the origin: /red, /green, and / (default), and we want to deliver one of the three versions based on the visitor traits. We can use Edge SDK as follows:
   const segment = new Segment(env.SEGMENT_WRITE_KEY);
   segment.registerVariation("/", (profile) => {
     if (profile.red_group) {
       return "/red"
     } else if (profile.green_group)
       return "/green"
     }
   });

   const resp = await segment.handleEvent(request, env);

   return resp
The registerVariation accepts two inputs: the path that displays the personalized content, and a decision function that should return the origin address for the personalized content. The decision function receives a profile object visitor in Segment. In the example, when users visit example.com/(root path), personalized content is delivered by checking if the visitor has a red_group or green_group trait and subsequently requesting the content from either /red or /green path at the origin.
We already explained that Edge SDK knows the identity of the user via ajs_user_id cookie, but we haven’t covered how the Edge SDK has access to the full profile object. The next section explains how the full profile becomes available on the Cloudflare Workers platform.
How does personalization work under the hood?
The Personalization feature of the Edge SDK requires storage of profiles on the Cloudflare Workers platform. A Cloudflare KV should be created for the Worker running the Edge SDK and passed to the Edge SDK during initialization. Edge SDK will store profiles in KV, where keys are the ajs_user_id, and values are the serialized profile object. To move Profiles data from Segment to the KV, the SDK uses two methods:
Profiles data push from Segment to the Cloudflare Workers platform: The Segment product can sync user profiles database with different tools, including pushing the data to a webhook. The Edge SDK automatically exposes a webhook endpoint under the first-party domain (e.g., example.com/seg/profiles-webhook) that Segment can call periodically to sync user profiles. The webhook handler receives incoming sync calls from Segment, and writes profiles to the KV.
Pulling data from Segment by the Edge SDK: If the Edge SDK queries the KV for a user id, and doesn’t find the profile (i.e., data hasn’t synced yet), it requests the user profile from the Segment API, and stores it in the KV.
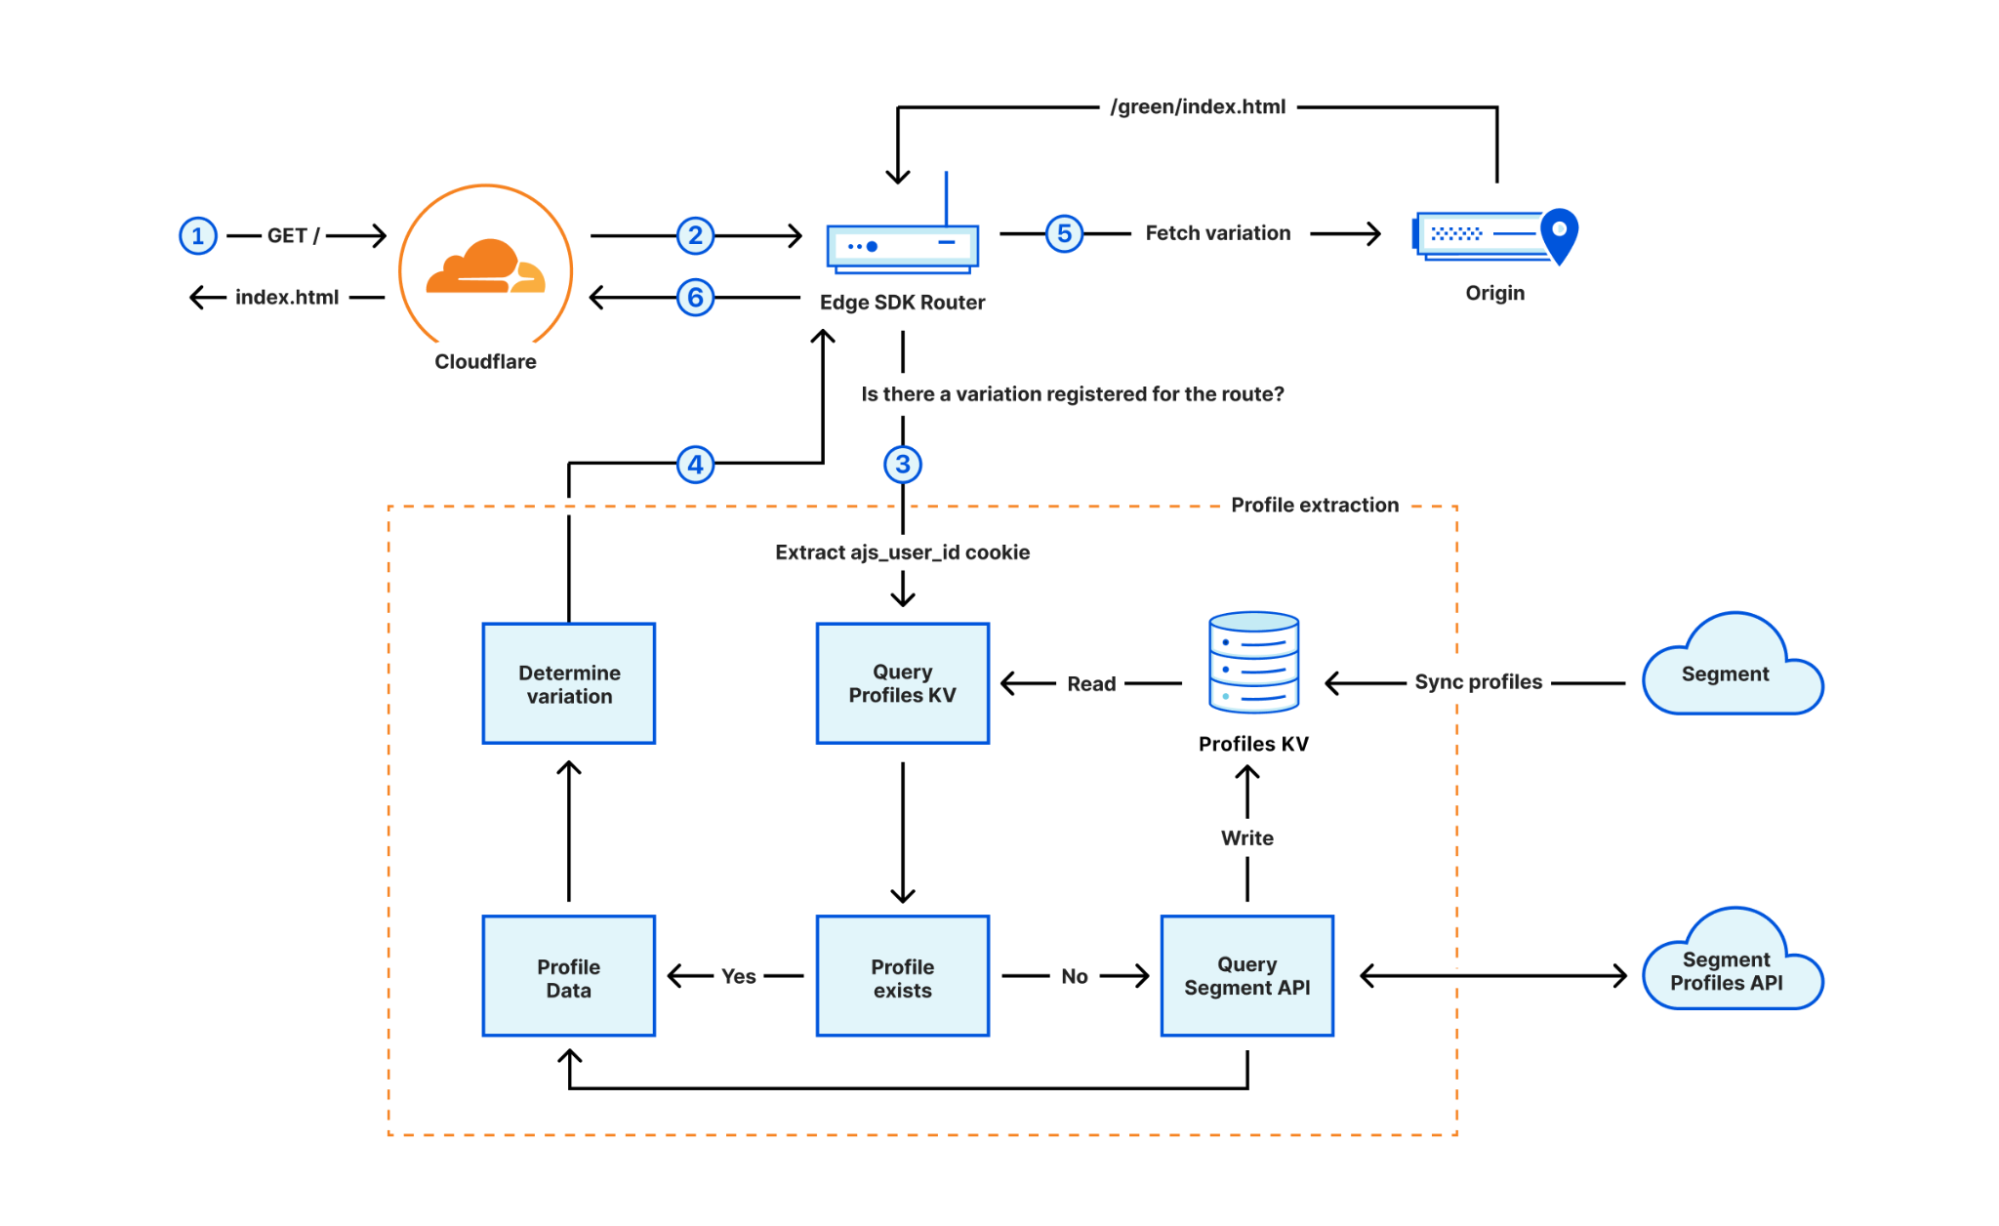
Figure 3 demonstrates how the personalization flow works. In step 1, the user requests content for the root path ( / ), and the Worker sends the request to the Edge SDK (step 2). The Edge SDK router determines that a variation is registered on the route, therefore, extracts the ajs_user_id from the request cookies, and goes through the full profile extraction (step 3). The SDK first checks the KV for a record with the key of ajs_user_id value and if not found, queries Segment API to fetch the profile, and stores the profile in the KV. Eventually, the profile is extracted and passed into the decision function to decide which path should be served to the user (step 4). The router eventually fetches the variation from the origin (step 5) and returns the response under the / path to the browser (step 6).
Figure 3- Personalization flow
Summary
In this post we covered how the Cloudflare Workers platform can help with tracking first-party data and personalization. We also explained how we built a Segment Edge SDK to enable Segment customers to get those benefits out of the box, without having to create their own DIY solution. The Segment Edge SDK is currently in early development, and we are planning to launch a private pilot and open-source it in the near future.
TypeScript makes it easy for developers to write code that doesn’t crash, by catching type errors before your program runs. We want developers to take advantage of this tooling, which is why one year ago, we built a system to automatically generate TypeScript types for the Cloudflare Workers runtime. This enabled developers to see code completions in their IDEs for Workers APIs, and to type check code before deploying. Each week, a new version of the types would be published, reflecting the most recent changes.
Over the past year, we’ve received lots of feedback from customers and internal teams on how we could improve our types. With the switch to the Bazel build system in preparation for open-sourcing the runtime, we saw an opportunity to rebuild our types to be more accurate, easier to use, and simpler to generate. Today, we’re excited to announce the next major release of @cloudflare/workers-types with a bunch of new features, and the open-sourcing of the fully-rewritten automatic generation scripts.
How to use TypeScript with Workers
Setting up TypeScript in Workers is easy! If you’re just getting started with Workers, install Node.js, then run npx wrangler init in your terminal to generate a new project. If you have an existing Workers project and want to take advantage of our improved typings, install the latest versions of TypeScript and @cloudflare/workers-types with npm install --save-dev typescript @cloudflare/workers-types@latest, then create a tsconfig.json file with the following contents:
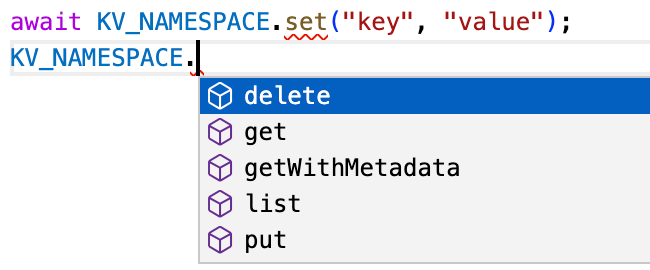
Your editor will now highlight issues and give you code completions as you type, leading to a less error-prone and more enjoyable developer experience.
Editor highlighting incorrect use of set instead of put, and providing code completions
Improved interoperability with standard types
Cloudflare Workers implement many of the same runtime APIs as browsers, and we’re working to improve our standards compliance even more with the WinterCG. However, there will always be fundamental differences between what browsers and Workers can do. For example, browsers can play audio files, whereas Workers have direct access to Cloudflare’s network for storing globally-distributed data. This mismatch means that the runtime APIs and types provided by each platform are different, which in turn makes it difficult to use Workers types with frameworks, like Remix, that run the same files on the Cloudflare network and in the browser. These files need to be type-checked against lib.dom.d.ts, which is incompatible with our types.
To solve this problem, we now generate a separate version of our types that can be selectively imported, without having to include @cloudflare/workers-types in your tsconfig.json’s types field. Here’s an example of what this looks like:
import type { KVNamespace } from "@cloudflare/workers-types";

declare const USERS_NAMESPACE: KVNamespace;
In addition, we automatically generate a diff of our types against TypeScript’s lib.webworker.d.ts. Going forward, we’ll use this to identify areas where we can further improve our spec-compliance.
Improved compatibility with compatibility dates
Cloudflare maintains strong backwards compatibility promises for all the APIs we provide. We use compatibility flags and dates to make breaking changes in a backwards-compatible way. Sometimes these compatibility flags change the types. For example, the global_navigator flag adds a new navigator global, and the url_standard flag changes the URLSearchParams constructor signature.
We now allow you to select the version of the types that matches your compatibility date, so you can be sure you’re not using features that won’t be supported at runtime.
In addition to compatibility dates, your Worker environment configuration also impacts the runtime and type API surface. If you have bindings such as KV namespaces or R2 buckets configured in your wrangler.toml, these need to be reflected in TypeScript types. Similarly, custom text, data and WebAssembly module rules need to be declared so TypeScript knows the types of exports. Previously, it was up to you to create a separate ambient TypeScript file containing these declarations.
To keep wrangler.toml as the single source of truth, you can now run npx wrangler types to generate this file automatically.
For example, the following wrangler.toml…
kv_namespaces = [{ binding = "MY_NAMESPACE", id = "..." }]
rules = [{ type = "Text", globs = ["**/*.txt"] }]
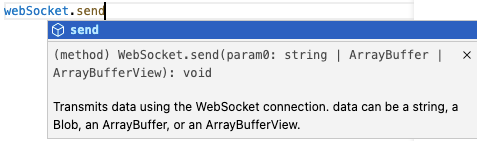
Code completions provide a great way for developers new to the Workers platform to explore the API surface. We now include the documentation for standard APIs from TypeScript’s official types in our types. We’re also starting the process of bringing docs for Cloudflare specific APIs into them too.
For developers already using the Workers platform, it can be difficult to see how types are changing with each release of @cloudflare/workers-types. To avoid type errors and highlight new features, we now generate a detailed changelog with each release that splits out new, changed and removed definitions.
How does type generation work under the hood?
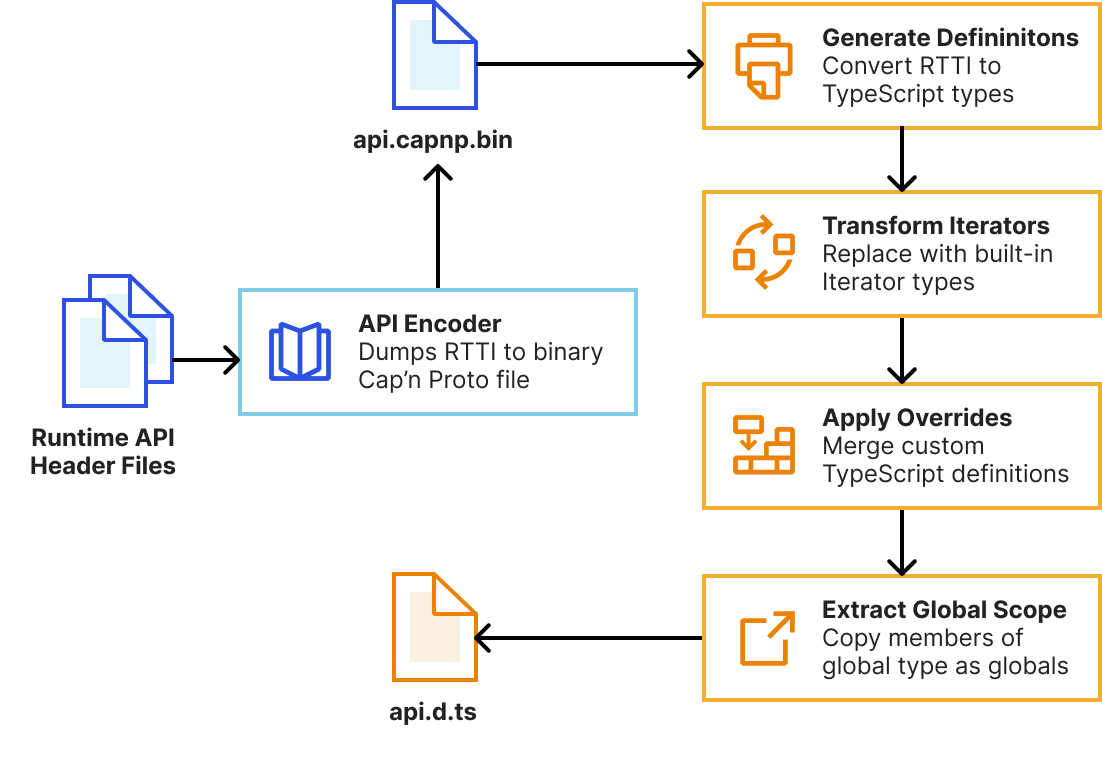
As mentioned earlier, we’ve completely rebuilt the automatic type generation scripts to be more reliable, extensible and maintainable. This means developers will get improved types as soon as new versions of the runtime are published. Our system now uses workerd’s new runtime-type-information (RTTI) system to query types of Workers runtime APIs, rather than attempting to extract this information from parsed C++ ASTs.
// Encode the KV namespace type without any compatibility flags enabled
CompatibilityFlags::Reader flags = {};
auto builder = rtti::Builder(flags);
auto type = builder.structure<KvNamespace>();
capnp::TextCodec codec;
auto encoded = codec.encode(type);
KJ_DBG(encoded); // (name = "KvNamespace", members = [ ... ], ...)
We then pass this RTTI to a TypeScript program that uses the TypeScript Compiler API to generate declarations and perform AST transformations to tidy them up. This is built into workerd’s Bazel build system, meaning generating types is now a single bazel build //types:types command. We leverage Bazel’s cache to rebuild as little as possible during generation.
Whilst the auto-generated types correctly describe the JavaScript interface of Workers runtime APIs, TypeScript provides additional features we can use to provide higher-fidelity types and improve developer ergonomics. Our system allows us to handwrite partial TypeScript “overrides” that get merged with the auto-generated types. This enables us to…
Add type parameters (generics) to types such as ReadableStream and avoid any typed values.
Specify the correspondence between input and output types with method overloads. For example, KVNamespace#get() should return a string when the type argument is text, but ArrayBuffer when it’s arrayBuffer.
Rename types to match TypeScript standards and reduce verbosity.
Fully-replace a type for more accurate declarations. For example, we replace WebSocketPair with a const declaration for better types with Object.values().
Provide types for values that are internally untyped such as the Request#cf object.
Hide internal types that aren’t usable in your workers.
Previously, these overrides were defined in separate TypeScript files to the C++ declarations they were overriding. This meant they often fell out-of-sync with the original declarations. In the new system, overrides are defined alongside the originals with C++ macros, meaning they can be reviewed alongside runtime implementation changes. See the README for workerd’s JavaScript glue code for many more details and examples.
Try typing with workers-types today!
We encourage you to upgrade to the latest version of @cloudflare/workers-types with npm install --save-dev @cloudflare/workers-types@latest, and try out the new wrangler types command. We’ll be publishing a new version of the types with each workerd release. Let us know what you think on the Cloudflare Developers Discord, and please open a GitHub issue if you find any types that could be improved.
Local development gives you a fully-controllable and easy-to-debug testing environment. At the start of this year, we brought this experience to Workers developers by launching Miniflare 2.0: a local Cloudflare Workers simulator. Miniflare 2 came with features like step-through debugging support, detailed console.logs, pretty source-mapped error pages, live reload and a highly-configurable unit testing environment. Not only that, but we also incorporated Miniflare into Wrangler, our Workers CLI, to enable wrangler dev’s —local mode.
Today, we’re taking local development to the next level! In addition to introducing new support for migrating existing projects to your local development environment, we’re making it easier to work with your remote data—locally! Most importantly, we’re releasing a much more accurate Miniflare 3, powered by the recently open-sourced workerd runtime—the same runtime used by Cloudflare Workers!
Enabling local development with workerd
One of the superpowers of having a local development environment is that you can test changes without affecting users in production. A great local environment offers a level of fidelity on par with production.
The way we originally approached local development was with Miniflare 2, which reimplemented Workers runtime APIs in JavaScript. Unfortunately, there were subtle behavior mismatches between these re-implementations and the real Workers runtime. These types of issues are really difficult for developers to debug, as they don’t appear locally, and step-through debugging of deployed Workers isn’t possible yet. For example, the following Worker returns responses successfully in Miniflare 2, so we might assume it’s safe to publish:
let cachedResponsePromise;
export default {
  async fetch(request, env, ctx) {
    // Let's imagine this fetch takes a few seconds. To speed up our worker, we
    // decide to only fetch on the first request, and reuse the result later.
    // This works fine in Miniflare 2, so we must be good right?
    cachedResponsePromise ??= fetch("https://example.com");
    return (await cachedResponsePromise).clone();
  },
};
However, as soon as we send multiple requests to our deployed Worker, it fails with Error: Cannot perform I/O on behalf of a different request. The problem here is that response bodies created in one request’s handler cannot be accessed from a different request’s handler. This limitation allows Cloudflare to improve overall Worker performance, but it was almost impossible for Miniflare 2 to detect these types of issues locally. In this particular case, the best solution is to cache using fetch itself.
Additionally, because the Workers runtime uses a very recent version of V8, it supports some JavaScript features that aren’t available in all versions of Node.js. This meant a few features implemented in Workers, like Array#findLast, weren’t always available in Miniflare 2.
With the Workers runtime now open-sourced, Miniflare 3 can leverage the same implementations that are deployed on Cloudflare’s network, giving bug-for-bug compatibility and practically eliminating behavior mismatches. 🎉
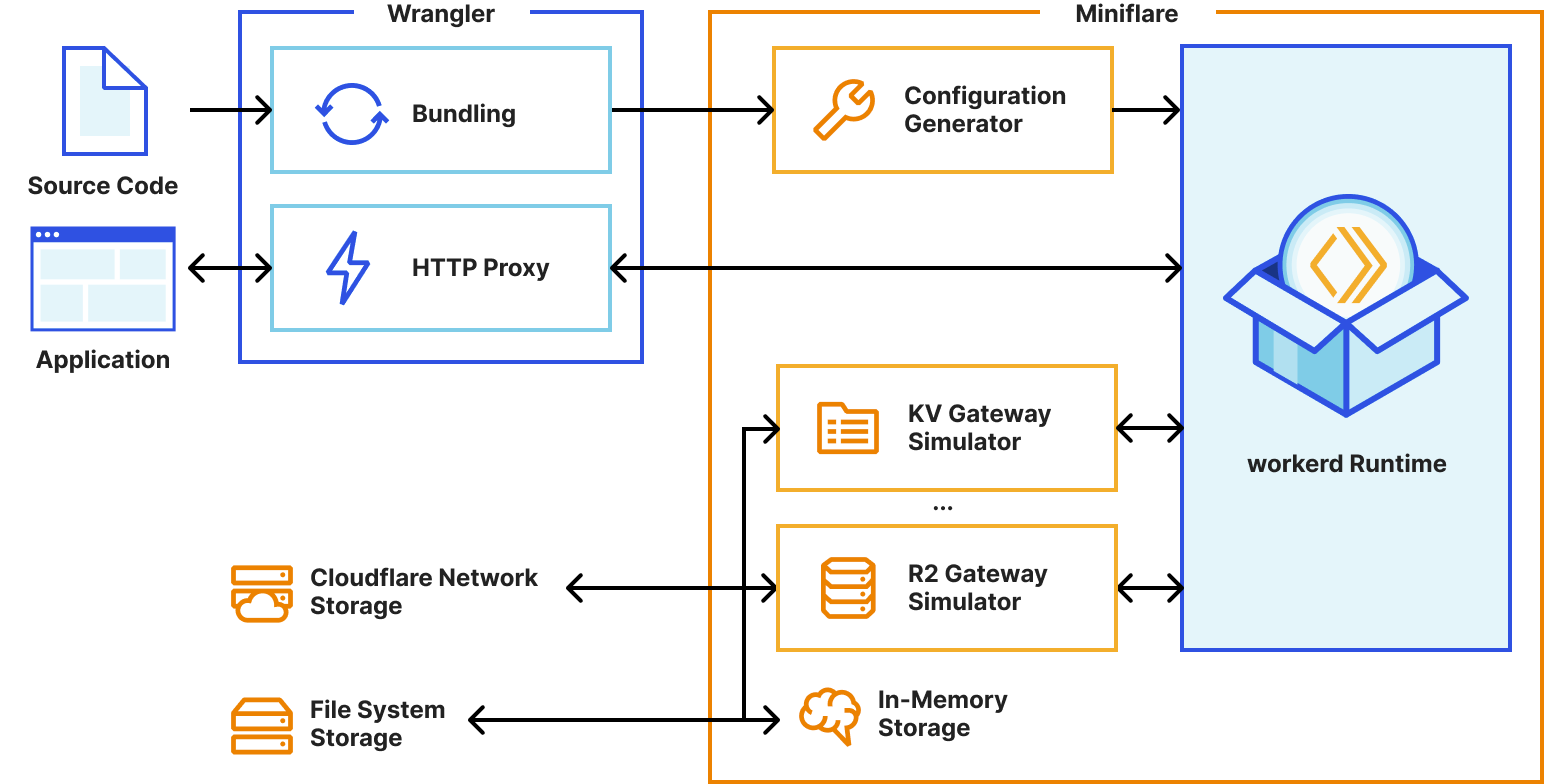
Miniflare 3’s new simplified architecture using worked
This radically simplifies our implementation too. We were able to remove over 50,000 lines of code from Miniflare 2. Of course, we still kept all the Miniflare special-sauce that makes development fun like live reload and detailed logging. 🙂
Local development with real data
We know that many developers choose to test their Workers remotely on the Cloudflare network as it gives them the ability to test against real data. Testing against fake data in staging and local environments is sometimes difficult, as it never quite matches the real thing.
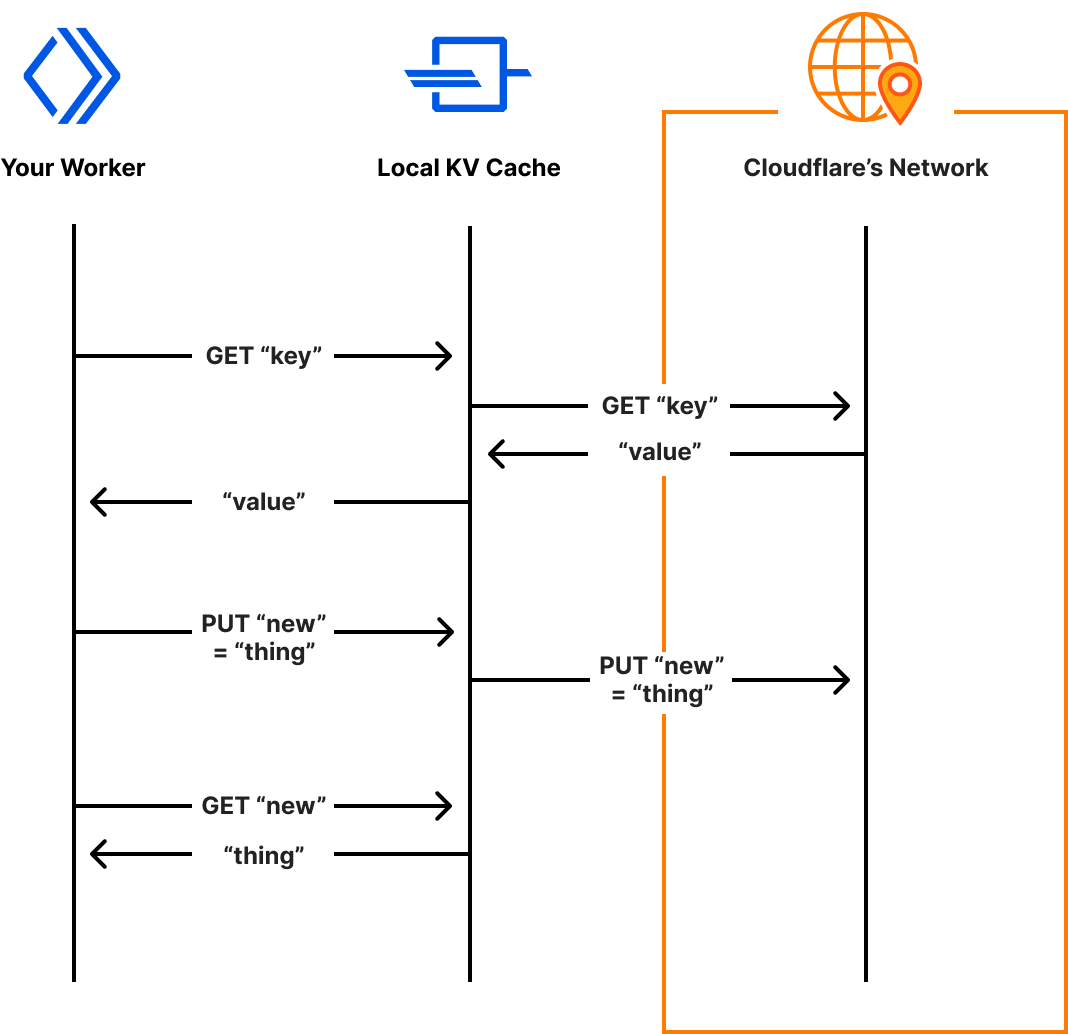
With Miniflare 3, we’re blurring the lines between local and remote development, by bringing real data to your machine as an experimental opt-in feature. If enabled, Miniflare will read and write data to namespaces on the Cloudflare network, as your Worker would when deployed. This is only supported with Workers KV for now, but we’re exploring similar solutions for R2 and D1.
Miniflare’s system for accessing real KV data, reads and writes are cached locally for future accesses
A new default for Wrangler
With Miniflare 3 now effectively as accurate as the real Workers environment, and the ability to access real data locally, we’re revisiting the decision to make remote development the initial Wrangler experience. In a future update, wrangler dev --local will become the default. --local will no longer be required. Benchmarking suggests this will bring an approximate 10x reduction to startup and a massive 60x reduction to script reload times! Over the next few weeks, we’ll be focusing on further optimizing Wrangler’s performance to bring you the fastest Workers development experience yet!
wrangler init --from-dash
We want all developers to be able to take advantage of the improved local experience, so we’re making it easy to start a local Wrangler project from an existing Worker that’s been developed in the Cloudflare dashboard. With Node.js installed, run npx wrangler init –from-dash <your_worker_name> in your terminal to set up a new project with all your existing code and bindings such as KV namespaces configured. You can now seamlessly continue development of your application locally, taking advantage of all the developer experience improvements Wrangler and Miniflare provide. When you’re ready to deploy your worker, run npx wrangler publish.
Looking to the future
Over the next few months, the Workers team is planning to further improve the local development experience with a specific focus on automated testing. Already, we’ve released a preliminary API for programmatic end-to-end tests with wrangler dev, but we’re also investigating ways of bringing Miniflare 2’s Jest/Vitest environments to workerd. We’re also considering creating extensions for popular IDEs to make developing workers even easier. 👀
Miniflare 3.0 is now included in Wrangler! Try it out by running npx wrangler@latest dev --experimental-local. Let us know what you think in the #wrangler channel on the Cloudflare Developers Discord, and please open a GitHub issue if you hit any unexpected behavior.
Workers Analytics Engine is a new tool, announced earlier this year, that enables developers and product teams to build time series analytics about anything, with high dimensionality, high cardinality, and effortless scaling. We built Analytics Engine for teams to gain insights into their code running in Workers, provide analytics to end customers, or even build usage based billing.
In this blog post we’re going to tell you about how we use Analytics Engine to build Analytics Engine. We’ve instrumented our own Analytics Engine SQL API using Analytics Engine itself and use this data to find bugs and prioritize new product features. We hope this serves as inspiration for other teams who are looking for ways to instrument their own products and gather feedback.
Why do we need Analytics Engine?
Analytics Engine enables you to generate events (or “data points”) from Workers with just a few lines of code. Using the GraphQL or SQL API, you can query these events and create useful insights about the business or technology stack. For more about how to get started using Analytics Engine, check out our developer docs.
Since we released the Analytics Engine open beta in September, we’ve been adding new features at a rapid clip based on feedback from developers. However, we’ve had two big gaps in our visibility into the product.
First, our engineering team needs to answer classic observability questions, such as: how many requests are we getting, how many of those requests result in errors, what are the nature of these errors, etc. They need to be able to view both aggregated data (like average error rate, or p99 response time) and drill into individual events.
Second, because this is a newly launched product, we are looking for product insights. By instrumenting the SQL API, we can understand the queries our customers write, and the errors they see, which helps us prioritize missing features.
We realized that Analytics Engine would be an amazing tool for both answering our technical observability questions, and also gathering product insight. That’s because we can log an event for every query to our SQL API, and then query for both aggregated performance issues as well as individual errors and queries that our customers run.
In the next section, we’re going to walk you through how we use Analytics Engine to monitor that API.
Adding instrumentation to our SQL API
The Analytics Engine SQL API lets you query events data in the same way you would an ordinary database. For decades, SQL has been the most common language for querying data. We wanted to provide an interface that allows you to immediately start asking questions about your data without having to learn a new query language.
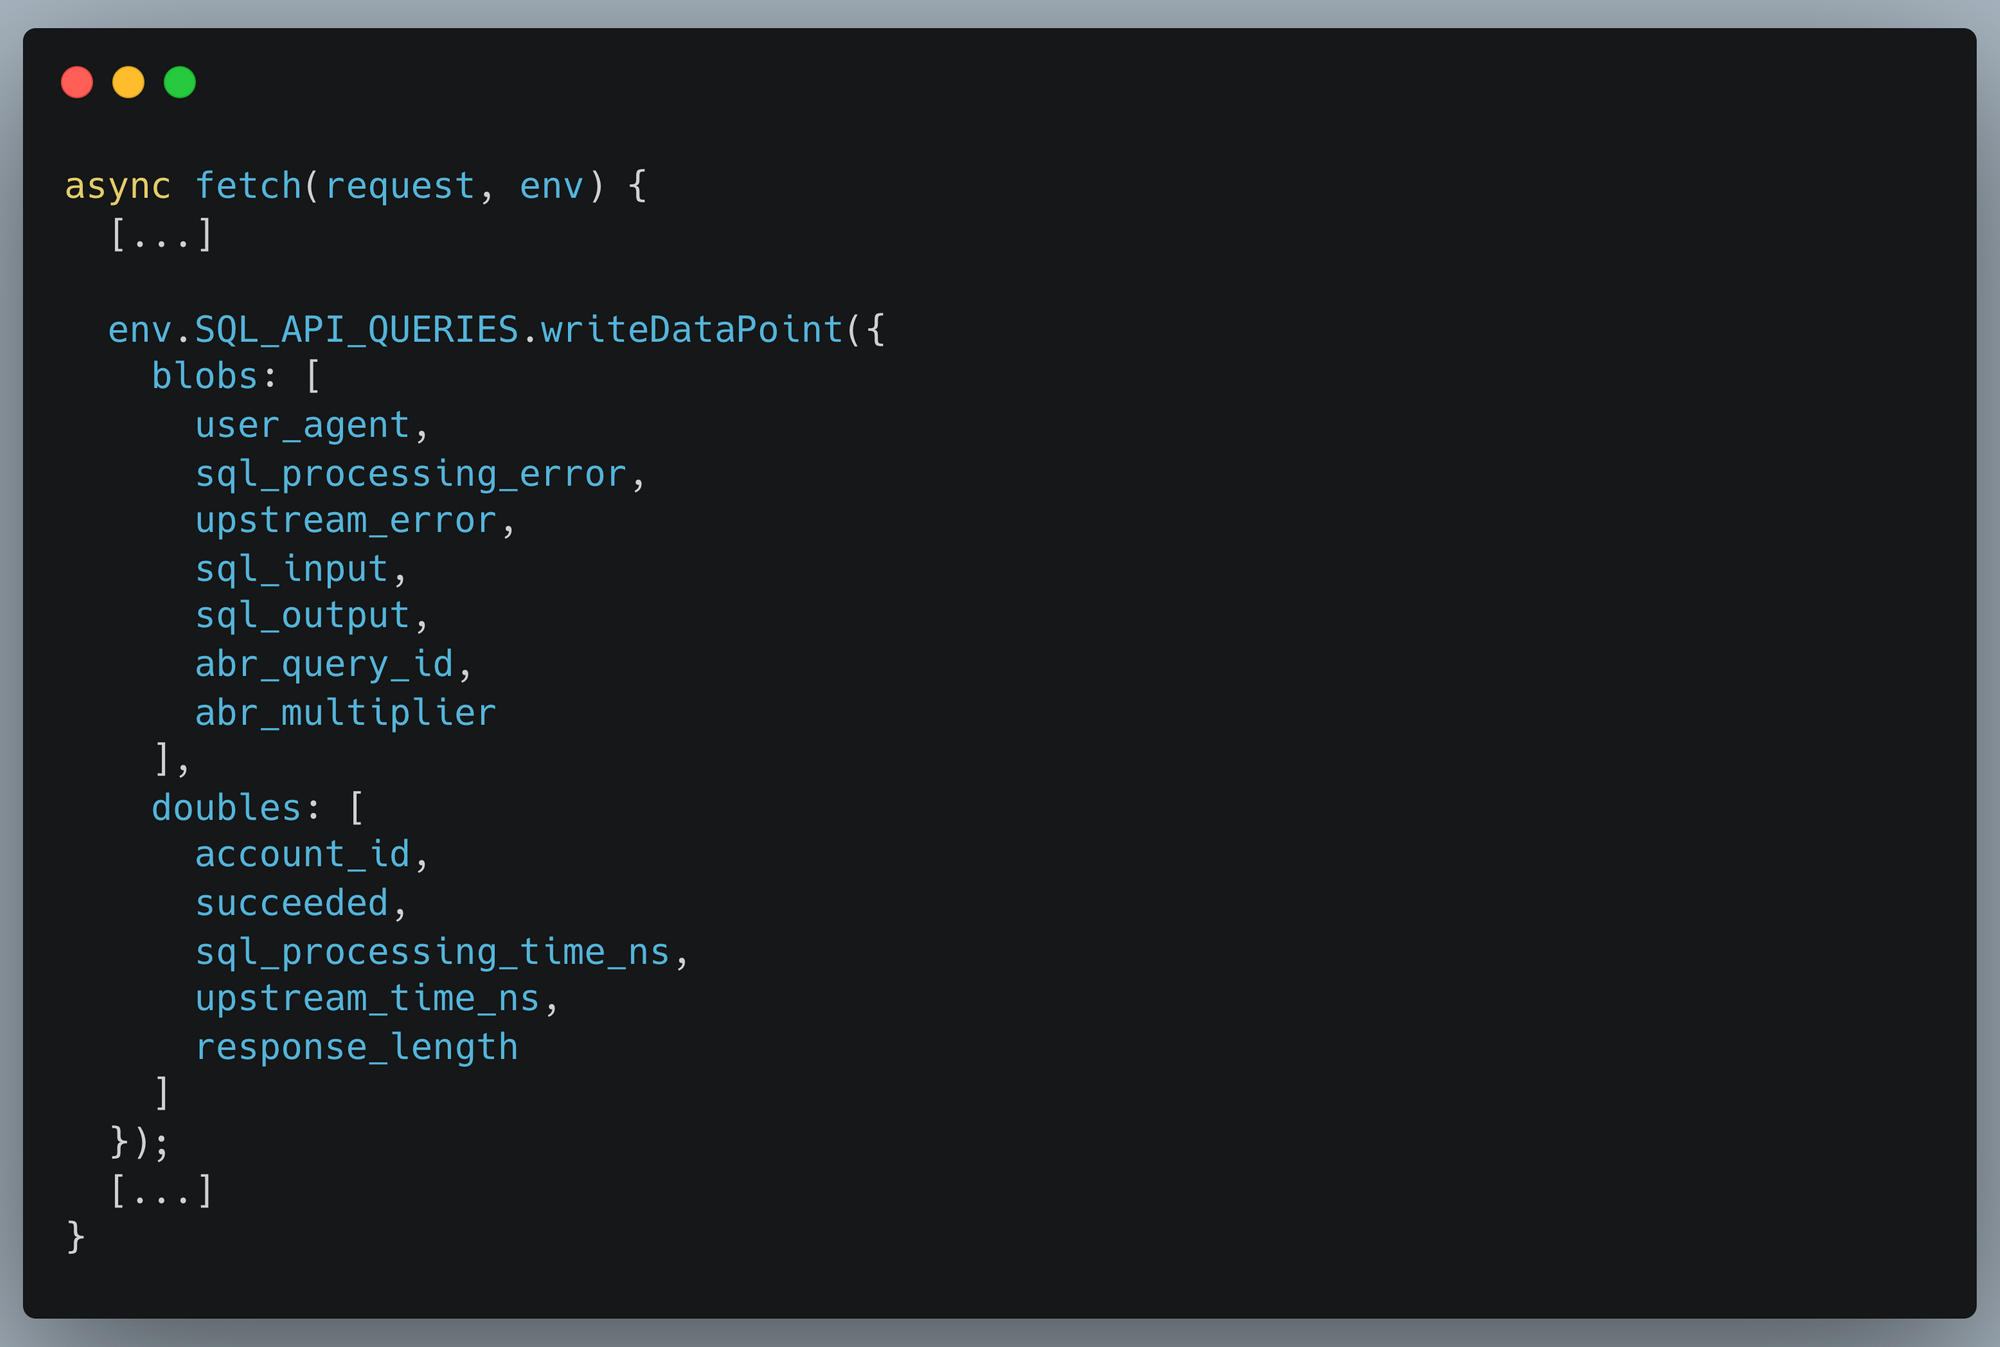
Our SQL API parses user SQL queries, transforms and validates them, and then executes them against backend database servers. We then write information about the query back into Analytics Engine so that we can run our own analytics. Writing data into Analytics Engine from a Cloudflare Worker is very simple and explained in our documentation. We instrument our SQL API in the same way our users do, and this code excerpt shows the data we write into Analytics Engine:
With that data now being stored in Analytics Engine, we can then pull out insights about every field we’re reporting.
Querying for insights
Having our analytics in an SQL database gives you the freedom to write any query you might want. Compared to using something like metrics which are often predefined and purpose specific, you can define any custom dataset desired, and interrogate your data to ask new questions with ease.
We need to support datasets comprising trillions of data points. In order to accomplish this, we have implemented a sampling method called Adaptive Bit Rate (ABR). With ABR, if you have large amounts of data, your queries may be returned sampled events in order to respond in reasonable time. If you have more typical amounts of data, Analytics Engine will query all your data. This allows you to run any query you like and still get responses in a short length of time. Right now, you have to account for sampling in how you make your queries, but we are exploring making it automatic.
Any data visualization tool can be used to visualize your analytics. At Cloudflare, we heavily use Grafana (and you can too!). This is particularly useful for observability use cases.
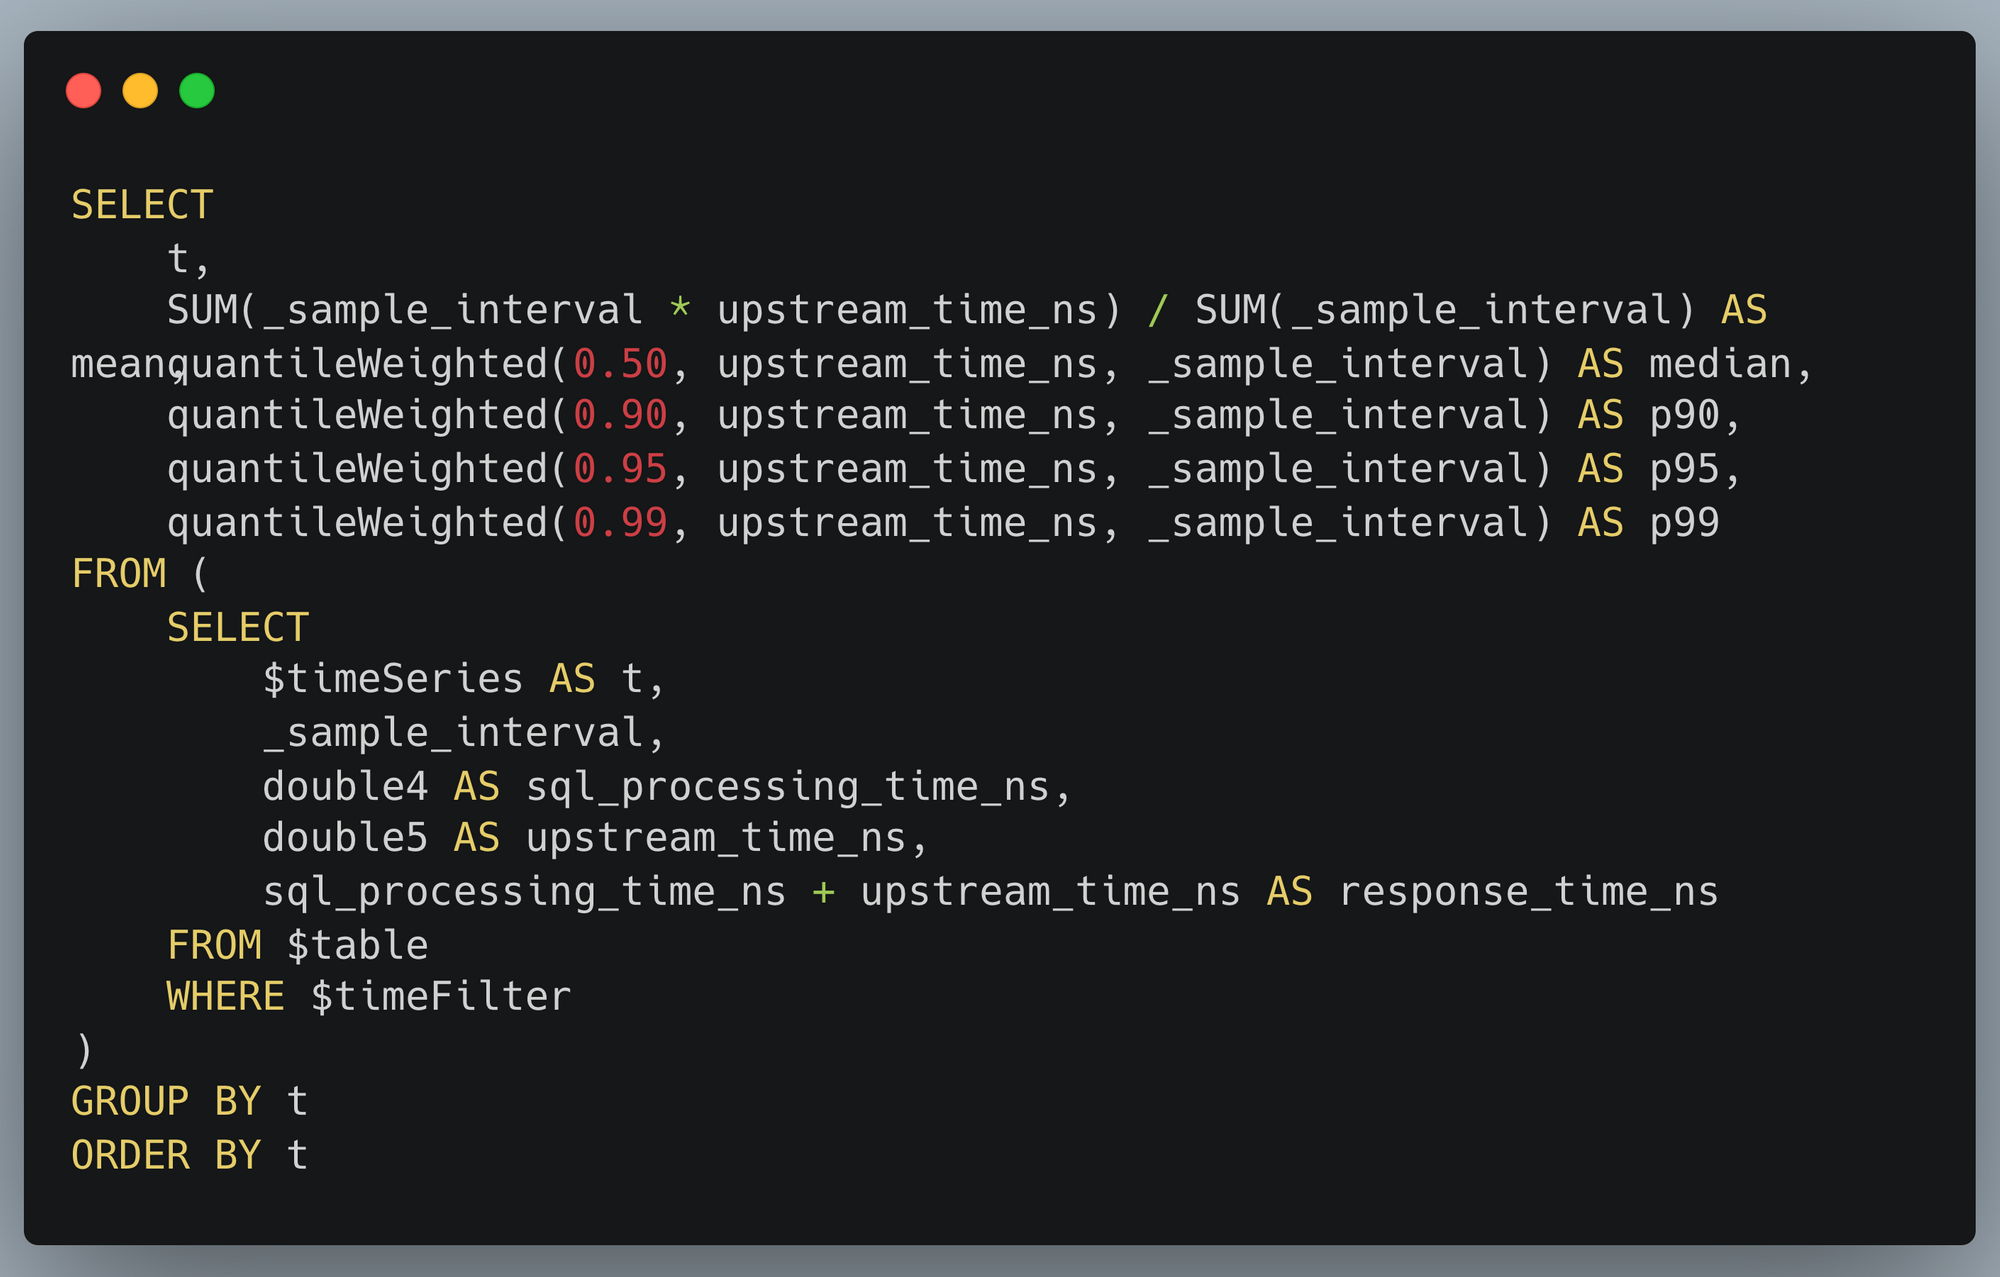
Observing query response times
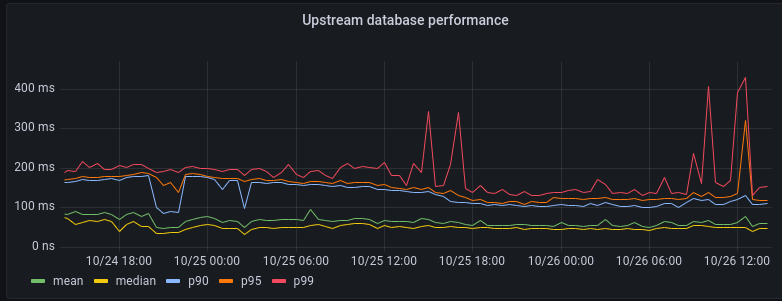
One query we pay attention to gives us information about the performance of our backend database clusters:
As you can see, the 99% percentile (corresponding to the 1% most complex queries to execute) sometimes spikes up to about 300ms. But on average our backend responds to queries within 100ms.
This visualization is itself generated from an SQL query:
Customer insights from high-cardinality data
Another use of Analytics Engine is to draw insights out of customer behavior. Our SQL API is particularly well-suited for this, as you can take full advantage of the power of SQL. Thanks to our ABR technology, even expensive queries can be carried out against huge datasets.
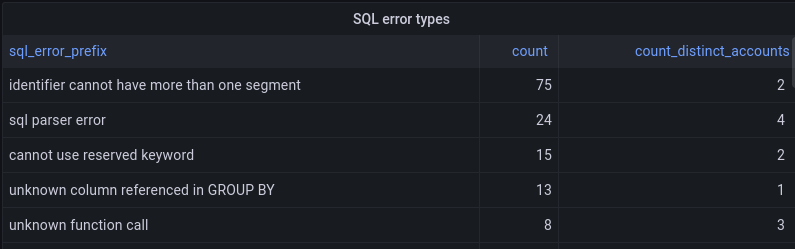
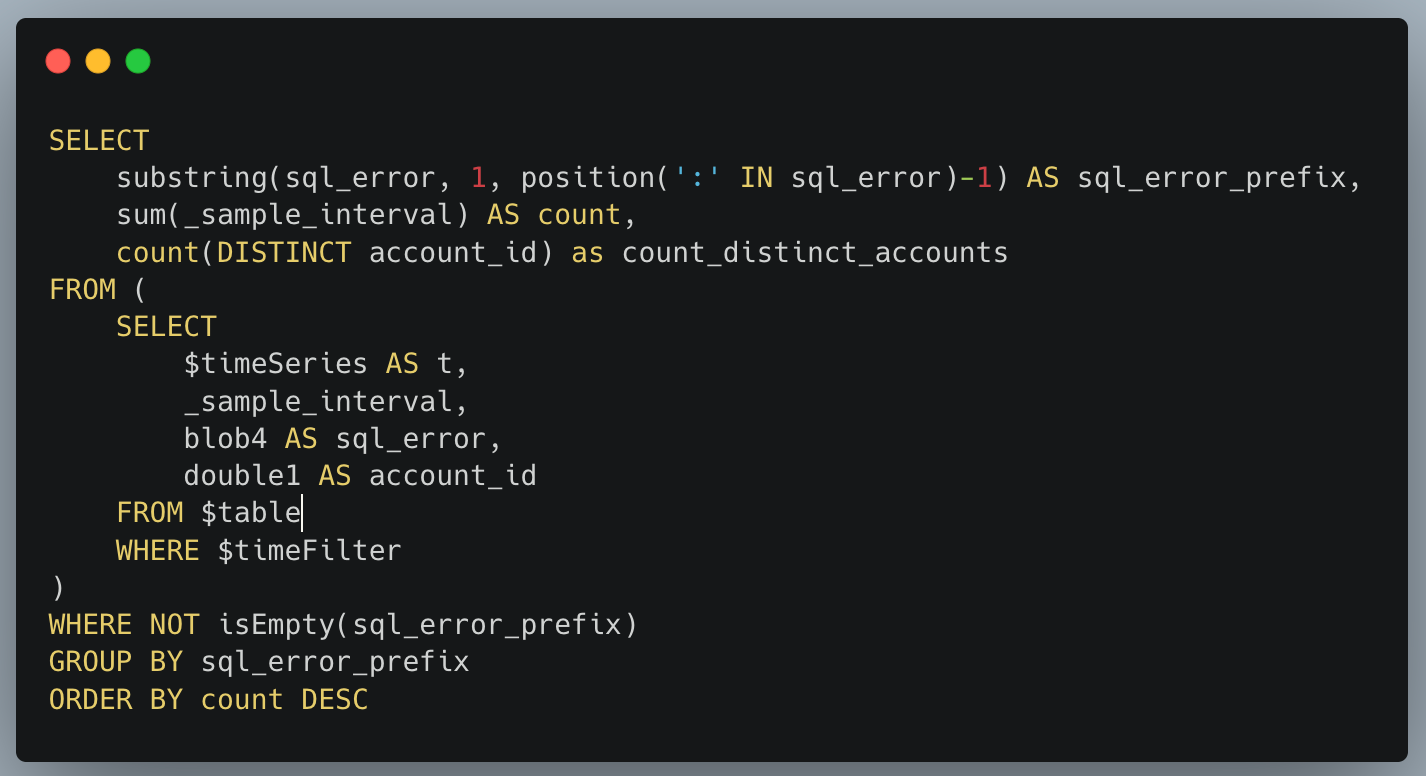
We use this ability to help prioritize improvements to Analytics Engine. Our SQL API supports a fairly standard dialect of SQL but isn’t feature-complete yet. If a user tries to do something unsupported in an SQL query, they get back a structured error message. Those error messages are reported into Analytics Engine. We’re able to aggregate the kinds of errors that our customers encounter, which helps inform which features to prioritize next.
The SQL API returns errors in the format of type of error: more details, and so we can take the first portion before the colon to give us the type of error. We group by that, and get a count of how many times that error happened and how many users it affected:
To perform the above query using an ordinary metrics system, we would need to represent each error type with a different metric. Reporting that many metrics from each microservice creates scalability challenges. That problem doesn’t happen with Analytics Engine, because it’s designed to handle high-cardinality data.
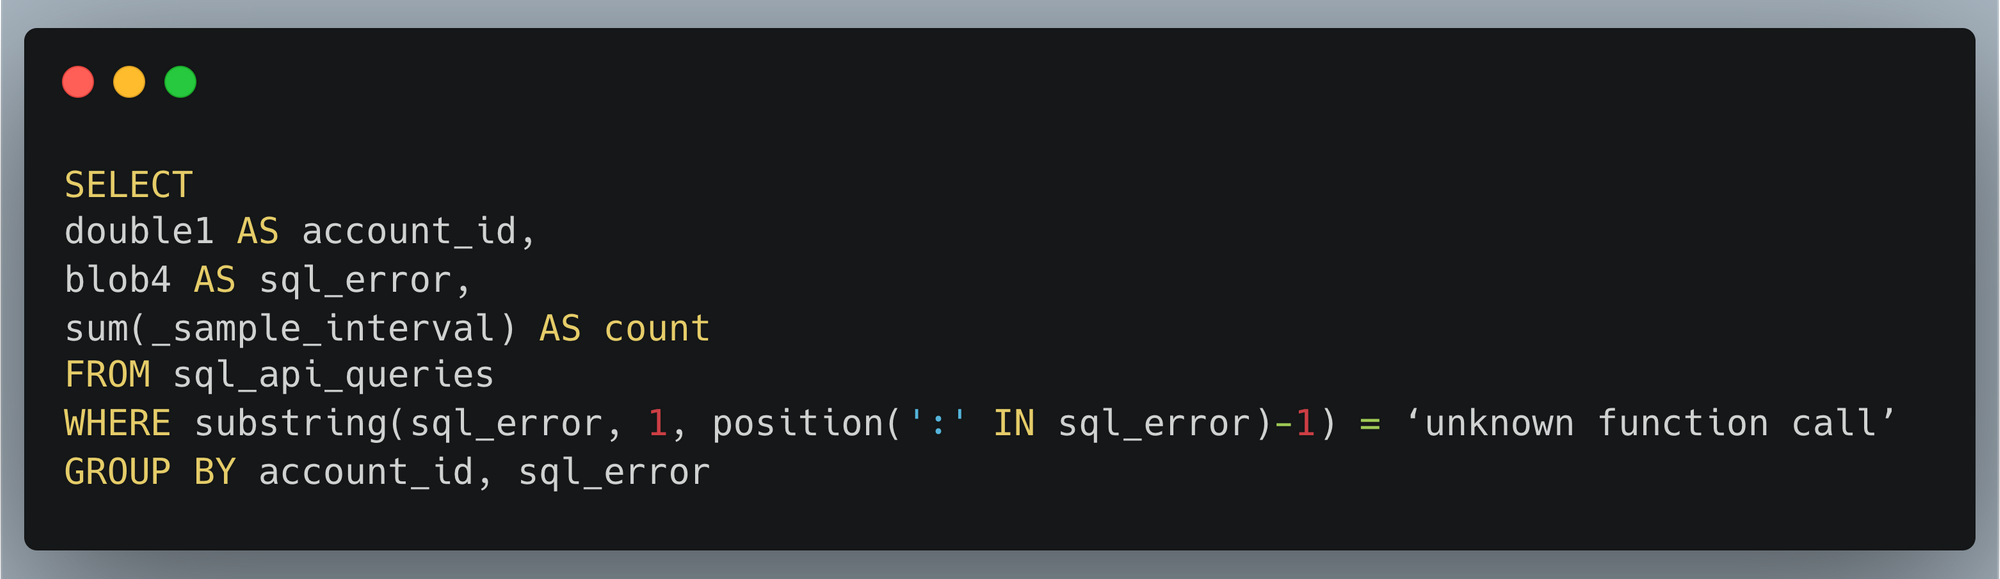
Another big advantage of a high-cardinality store like Analytics Engine is that you can dig into specifics. If there’s a large spike in SQL errors, we may want to find which customers are having a problem in order to help them or identify what function they want to use. That’s easy to do with another SQL query:
Inside Cloudflare, we have historically relied on querying our backend database servers for this type of information. Analytics Engine’s SQL API now enables us to open up our technology to our customers, so they can easily gather insights about their services at any scale!
Conclusion and what’s next
The insights we gathered about usage of the SQL API are a super helpful input to our product prioritization decisions. We already added support for substring and position functions which were used in the visualizations above.
Looking at the top SQL errors, we see numerous errors related to selecting columns. These errors are mostly coming from some usability issues related to the Grafana plugin. Adding support for the DESCRIBE function should alleviate this because without this, the Grafana plugin doesn’t understand the table structure. This, as well as other improvements to our Grafana plugin, is on our roadmap.
We also can see that users are trying to query time ranges for older data that no longer exists. This suggests that our customers would appreciate having extended data retention. We’ve recently extended our retention from 31 to 92 days, and we will keep an eye on this to see if we should offer further extension.
We saw lots of errors related to common mistakes or misunderstandings of proper SQL syntax. This indicates that we could provide better examples or error explanations in our documentation to assist users with troubleshooting their queries.
Stay tuned into our developer docs to be informed as we continue to iterate and add more features!
You can start using Workers Analytics Engine Now! Analytics Engine is now in open beta with free 90-day retention. Start using it today or join our Discord community to talk with the team.
Съдебен иск за клевета срешу Биволъ от шведския гражданин Зияд Тарек Ахмад е окончателно отхвърлен от Върховния касационен съд с Определение от 14 ноември 2022 г. Решението е подробно мотивирано…
When you are binge-watching the latest season of Stranger Things or Ozark, we strive to deliver the best possible video quality to your eyes. To do so, we continuously push the boundaries of streaming video quality and leverage the best video technologies. For example, we invest in next-generation, royalty-free codecs and sophisticated video encoding optimizations. Recently, we added another powerful tool to our arsenal: neural networks for video downscaling. In this tech blog, we describe how we improved Netflix video quality with neural networks, the challenges we faced and what lies ahead.
How can neural networks fit into Netflix video encoding?
There are, roughly speaking, two steps to encode a video in our pipeline:
Video preprocessing, which encompasses any transformation applied to the high-quality source video prior to encoding. Video downscaling is the most pertinent example herein, which tailors our encoding to screen resolutions of different devices and optimizes picture quality under varying network conditions. With video downscaling, multiple resolutions of a source video are produced. For example, a 4K source video will be downscaled to 1080p, 720p, 540p and so on. This is typically done by a conventional resampling filter, like Lanczos.
Video encoding using a conventional video codec, like AV1. Encoding drastically reduces the amount of video data that needs to be streamed to your device, by leveraging spatial and temporal redundancies that exist in a video.
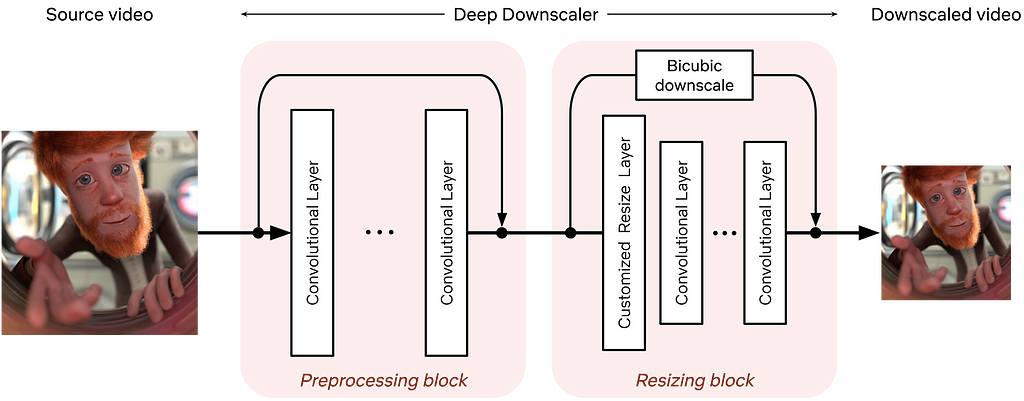
We identified that we can leverage neural networks (NN) to improve Netflix video quality, by replacing conventional video downscaling with a neural network-based one. This approach, which we dub “deep downscaler,” has a few key advantages:
A learned approach for downscaling can improve video quality and be tailored to Netflix content.
It can be integrated as a drop-in solution, i.e., we do not need any other changes on the Netflix encoding side or the client device side. Millions of devices that support Netflix streaming automatically benefit from this solution.
A distinct, NN-based, video processing block can evolve independently, be used beyond video downscaling and be combined with different codecs.
Of course, we believe in the transformative potential of NN throughout video applications, beyond video downscaling. While conventional video codecs remain prevalent, NN-based video encoding tools are flourishing and closing the performance gap in terms of compression efficiency. The deep downscaler is our pragmatic approach to improving video quality with neural networks.
Our approach to NN-based video downscaling
The deep downscaler is a neural network architecture designed to improve the end-to-end video quality by learning a higher-quality video downscaler. It consists of two building blocks, a preprocessing block and a resizing block. The preprocessing block aims to prefilter the video signal prior to the subsequent resizing operation. The resizing block yields the lower-resolution video signal that serves as input to an encoder. We employed an adaptive network design that is applicable to the wide variety of resolutions we use for encoding.
Architecture of the deep downscaler model, consisting of a preprocessing block followed by a resizing block.
During training, our goal is to generate the best downsampled representation such that, after upscaling, the mean squared error is minimized. Since we cannot directly optimize for a conventional video codec, which is non-differentiable, we exclude the effect of lossy compression in the loop. We focus on a robust downscaler that is trained given a conventional upscaler, like bicubic. Our training approach is intuitive and results in a downscaler that is not tied to a specific encoder or encoding implementation. Nevertheless, it requires a thorough evaluation to demonstrate its potential for broad use for Netflix encoding.
Improving Netflix video quality with neural networks
The goal of the deep downscaler is to improve the end-to-end video quality for the Netflix member. Through our experimentation, involving objective measurements and subjective visual tests, we found that the deep downscaler improves quality across various conventional video codecs and encoding configurations.
For example, for VP9 encoding and assuming a bicubic upscaler, we measured an average VMAF Bjøntegaard-Delta (BD) rate gain of ~5.4% over the traditional Lanczos downscaling. We have also measured a ~4.4% BD rate gain for VMAF-NEG. We showcase an example result from one of our Netflix titles below. The deep downscaler (red points) delivered higher VMAF at similar bitrate or yielded comparable VMAF scores at a lower bitrate.
Besides objective measurements, we also conducted human subject studies to validate the visual improvements of the deep downscaler. In our preference-based visual tests, we found that the deep downscaler was preferred by ~77% of test subjects, across a wide range of encoding recipes and upscaling algorithms. Subjects reported a better detail preservation and sharper visual look. A visual example is shown below.
Left: Lanczos downscaling; right: deep downscaler. Both videos are encoded with VP9 at the same bitrate and were upscaled to FHD resolution (1920×1080). You may need to zoom in to see the visual difference.
We also performed A/B testing to understand the overall streaming impact of the deep downscaler, and detect any device playback issues. Our A/B tests showed QoE improvements without any adverse streaming impact. This shows the benefit of deploying the deep downscaler for all devices streaming Netflix, without playback risks or quality degradation for our members.
How do we apply neural networks at scale efficiently?
Given our scale, applying neural networks can lead to a significant increase in encoding costs. In order to have a viable solution, we took several steps to improve efficiency.
The neural network architecture was designed to be computationally efficient and also avoid any negative visual quality impact. For example, we found that just a few neural network layers were sufficient for our needs. To reduce the input channels even further, we only apply NN-based scaling on luma and scale chroma with a standard Lanczos filter.
We implemented the deep downscaler as an FFmpeg-based filter that runs together with other video transformations, like pixel format conversions. Our filter can run on both CPU and GPU. On a CPU, we leveraged oneDnn to further reduce latency.
Integrating neural networks into our next-generation encoding platform
The Encoding Technologies and Media Cloud Engineering teams at Netflix have jointly innovated to bring Cosmos, our next-generation encoding platform, to life. Our deep downscaler effort was an excellent opportunity to showcase how Cosmos can drive future media innovation at Netflix. The following diagram shows a top-down view of how the deep downscaler was integrated within a Cosmos encoding microservice.
A top-down view of integrating the deep downscaler into Cosmos.
A Cosmos encoding microservice can serve multiple encoding workflows. For example, a service can be called to perform complexity analysis for a high-quality input video, or generate encodes meant for the actual Netflix streaming. Within a service, a Stratum function is a serverless layer dedicated to running stateless and computationally-intensive functions. Within a Stratum function invocation, our deep downscaler is applied prior to encoding. Fueled by Cosmos, we can leverage the underlying Titus infrastructure and run the deep downscaler on all our multi-CPU/GPU environments at scale.
What lies ahead
The deep downscaler paves the path for more NN applications for video encoding at Netflix. But our journey is not finished yet and we strive to improve and innovate. For example, we are studying a few other use cases, such as video denoising. We are also looking at more efficient solutions to applying neural networks at scale. We are interested in how NN-based tools can shine as part of next-generation codecs. At the end of the day, we are passionate about using new technologies to improve Netflix video quality. For your eyes only!
Acknowledgments
We would like to acknowledge the following individuals for their help with the deep downscaler project:
Lishan Zhu, Liwei Guo, Aditya Mavlankar, Kyle Swanson and Anush Moorthy (Video Image and Encoding team), Mariana Afonso and Lukas Krasula (Video Codecs and Quality team), Ameya Vasani (Media Cloud Engineering team), Prudhvi Kumar Chaganti (Streaming Encoding Pipeline team), Chris Pham and Andy Rhines (Data Science and Engineering team), Amer Ather (Netflix performance team), the Netflix Metaflow team and Prof. Alan Bovik (University of Texas at Austin).
To provide the best experiences, we use technologies like cookies to store and/or access device information. Consenting to these technologies will allow us to process data such as browsing behavior or unique IDs on this site. Not consenting or withdrawing consent, may adversely affect certain features and functions.
Functional
Always active
The technical storage or access is strictly necessary for the legitimate purpose of enabling the use of a specific service explicitly requested by the subscriber or user, or for the sole purpose of carrying out the transmission of a communication over an electronic communications network.
Preferences
The technical storage or access is necessary for the legitimate purpose of storing preferences that are not requested by the subscriber or user.
Statistics
The technical storage or access that is used exclusively for statistical purposes.The technical storage or access that is used exclusively for anonymous statistical purposes. Without a subpoena, voluntary compliance on the part of your Internet Service Provider, or additional records from a third party, information stored or retrieved for this purpose alone cannot usually be used to identify you.
Marketing
The technical storage or access is required to create user profiles to send advertising, or to track the user on a website or across several websites for similar marketing purposes.