Add comparative and cumulative date/time calculations in Amazon QuickSight

Post Syndicated from Emily Zhu original https://aws.amazon.com/blogs/big-data/add-comparative-and-cumulative-date-time-calculations-in-amazon-quicksight/

Amazon QuickSight recently added native support for comparative (e.g., year-over-year) and cumulative (e.g., year-to-date) period functions which allow you to easily introduce these calculations in business reporting, trend analysis and time series analysis. This allows authors in QuickSight to implement advanced calculations without having to use complicated date offsets in calculations to achieve such datetime-aware comparisons.

In this post, we introduce the new period functions and their capabilities, and demonstrate several typical use cases. We also discuss several scenarios to extend the usage of the period functions, which will be useful in more advanced situations.

New period functions

Before we demonstrate use cases, let’s go over the new period function suite and see what new functions we now support. We can divide period functions into two main groups: comparative (period over period) functions and cumulative (period to date) functions.

Comparative (period over period) functions

You can use period over period functions to compare measures at different time periods, such as year, quarter, and month. For example, you can compute a year-over-year increase in sales, or week-over-week percentage revenue changes.

A typical comparative period function has the syntax periodOverPeriodDifference(measure, date, period, offset), with two optional arguments: period and offset.

You can use the period argument in the function to define the period granularity of the calculation. The granularity of YEAR means year-over-year computation, Quarter means quarter-over-quarter, and so on. If the period argument is left empty, the calculation changes based on the period granularity that is chosen (in the field well) to be displayed in the visual.

You can also use the offset argument to specify how many periods apart you want to compute the comparison. For instance, a period of a quarter with an offset of 2 means comparing against the previous two quarters.

Note that period and offset have to be both specified or both left empty. You can’t specify just one of them.

The following table summarizes the three available period over period functions.

Function Name Function Type Description
periodOverPeriodDifference Table Calculation Calculates the difference of a measure over two different time periods as specified by period granularity and offset.
periodOverPeriodLastValue Table Calculation Calculates the last (previous) value of a measure from a previous time period as specified by period granularity and offset.
periodOverPeriodPercentDifference Table Calculation Calculates the percent difference of a measure over two different time periods as specified by period granularity and offset.

Cumulative (period to date) functions

You can use period to date functions to calculate metrics within a given period-to-date window. There are two main types of cumulative functions.

  • “OverTime” functions, which are table calculations and return outputs for each row in the visual.

E.g., you can use periodToDateCountOverTime with WEEK granularity to compute a series of week-to-date new customer counts to track the fluctuation of customer engagement.

  • Aggregation functions, which output an aggregated value for a fixed period-to-date time range.

E.g., periodtoDateSum with YEAR granularity returns a single value for the total of the metric from the beginning of the year to the endDate provided in the formula. If left blank, the default endDate takes now(), which is the moment when users load the dashboard.

The following table summarizes the period to date functions.

Function Name Function Type Description
periodToDateAvgOverTime Table Calculation Calculates the average of a measure for a given time granularity (for instance, a quarter) up to a point in time.
periodToDateCountOverTime Table Calculation Calculates the count of a dimension or measure for a given time granularity (for instance, a quarter) up to a point in time.
periodToDateMaxOverTime Table Calculation Calculates the maximum of a measure or date for a given time granularity (for instance, a quarter) up to a point in time.
periodToDateMinOverTime Table Calculation Calculates the minimum of a measure or date for a given time granularity (for instance, a quarter) up to a point in time.
periodToDateSumOverTime Table Calculation Calculates the sum of a measure for a given time granularity (for instance, a quarter) up to a point in time.
periodToDateAvg Aggregation Averages the set of numbers in the specified measure for a given time granularity (for instance, a quarter) up to a point in time.
periodToDateCount Aggregation Calculates the number of values in a dimension or measure for a given time granularity (for instance, a quarter) up to a point in time, including duplicates.
periodToDateMax Aggregation Returns the maximum value of the specified measure for a given time granularity (for instance, a quarter) up to a point in time.
periodToDateMedian Aggregation Returns the median value of the specified measure for a given time granularity (for instance, a quarter) up to a point in time.
periodToDateMin Aggregation Returns the minimum value of the specified measure or date for a given time granularity (for instance, a quarter) up to a point in time.
periodToDatePercentile Aggregation Calculates the percentile based on the actual numbers in the measure for a given time granularity (for instance, a quarter) up to a point in time.
periodToDatePercentileCont Aggregation Calculates the percentile based on a continuous distribution of the numbers in the measure for a given time granularity (for instance, a quarter) up to a point in time.
periodToDateStDev Aggregation Calculates the standard deviation of the set of numbers in the specified measure for a given time granularity (for instance, a quarter) up to a point in time based on a sample.
periodToDateStDevP Aggregation Calculates the population standard deviation of the set of numbers in the specified measure for a given time granularity (for instance, a quarter) up to a point in time based on a sample.
periodtoDateSum Aggregation Adds the set of numbers in the specified measure for a given time granularity (for instance, a quarter) up to a point in time.
periodToDateVar Aggregation Calculates the sample variance of the set of numbers in the specified measure for a given time granularity (for instance, a quarter) up to a point in time.
periodToDateVarP Aggregation Calculates the population variance of the set of numbers in the specified measure for a given time granularity (for instance, a quarter) up to a point in time.

Use case 1: Using a period over period function to analyze sales growth in fixed and dynamic granularity

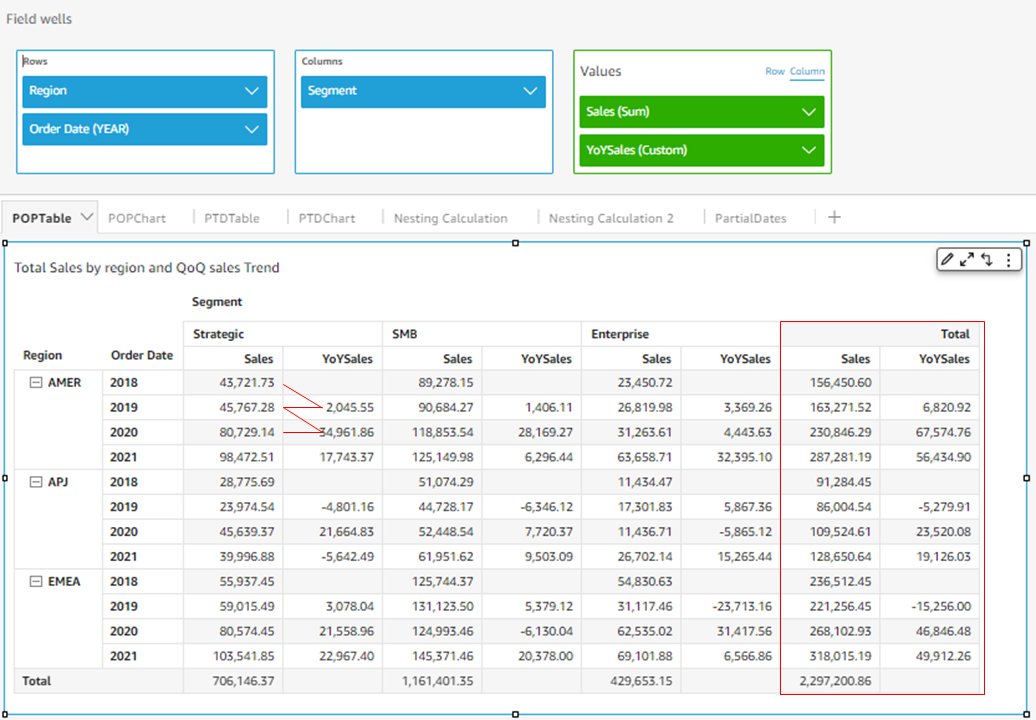
Let’s dive into how period over period functions can support typical business and financial use cases. The following example uses periodOverPeriodDifference to calculate YoY sales growth. Because we have Segment and Region in the visual, the YoY sales is calculated for each segment and region.

We define the measure of YoYSales with the following formula: YoYSales=periodOverPeriodDifference(sum(Sales),{Order Date},YEAR,1)

The first argument, sum(Sales), tells the function to calculate based on this measure. The second argument, Order Date, specifies the date/time column from which Year information is extracted. The third argument, YEAR, fixes the granularity of this calculation. When this optional argument is specified, this measure always returns YoY (not QoQ or MoM) no matter how Order Date is selected (in the field well) to be displayed in the visual. The fourth argument, 1, specifies the offset of the comparison. In this example, it means we want to compare the sales of each order date with the same date of the previous year. The measure returns empty for order dates of 2018, because no previous periods exist to be compared with.

The period functions are working with totals and subtotals. By adding the total for columns into the visual, you can see the total sales and total YoYSales for each region.

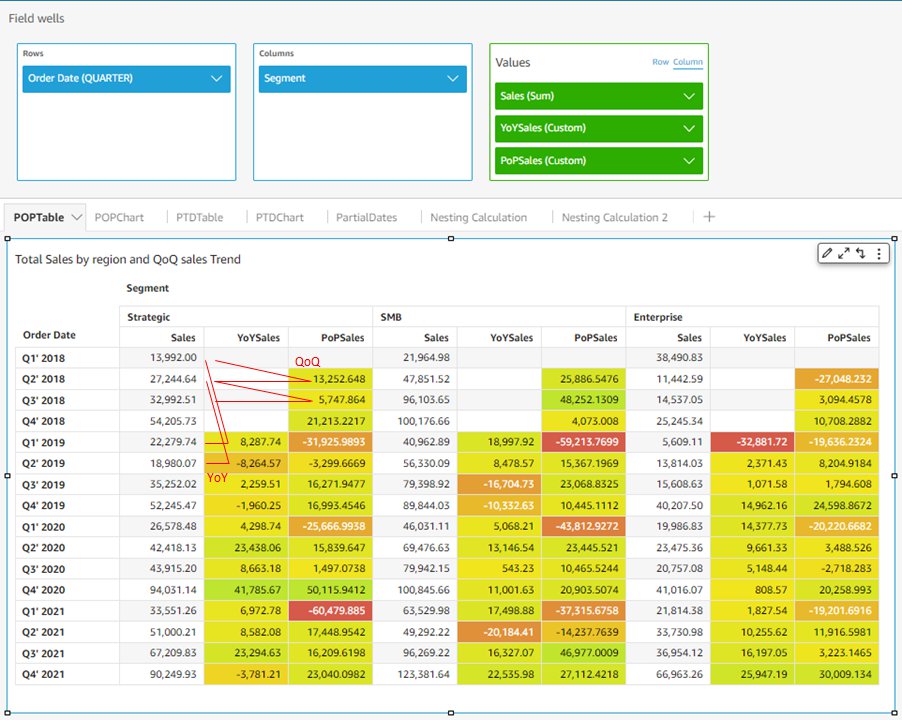
If you leave the optional argument of period granularity empty, meaning change the formula to PoPSales=periodOverPeriodDifference(sum(Sales),{Order Date})as shown in the following example, the time period of the calculation is then determined by the granularity of Order Date displayed on the visual. In the following example, Order Date is chosen to display at quarter level (in the field well), so PoPSales dynamically calculates the QoQ sales growth. Changing Order Date to the monthly level updates the measure to calculate MoM. For PoPSales, only Q1 2018 returns empty because that’s the only quarter that doesn’t have a previous quarter to compare with.

If we add YoYSales from the previous example to this visual, it calculates YoY sales growth at the quarter level (compares sales of Q1 2019 with Q1 2018). This demonstrates the difference between a fixed granularity and a dynamic granularity of period over period functions.

The period over period functions can differentiate between a positive change (increase) and negative change (decrease). Therefore, when we add the conditional formatting to the visual, it’s very straightforward to see the financial performance of each period (green is good, red is bad).

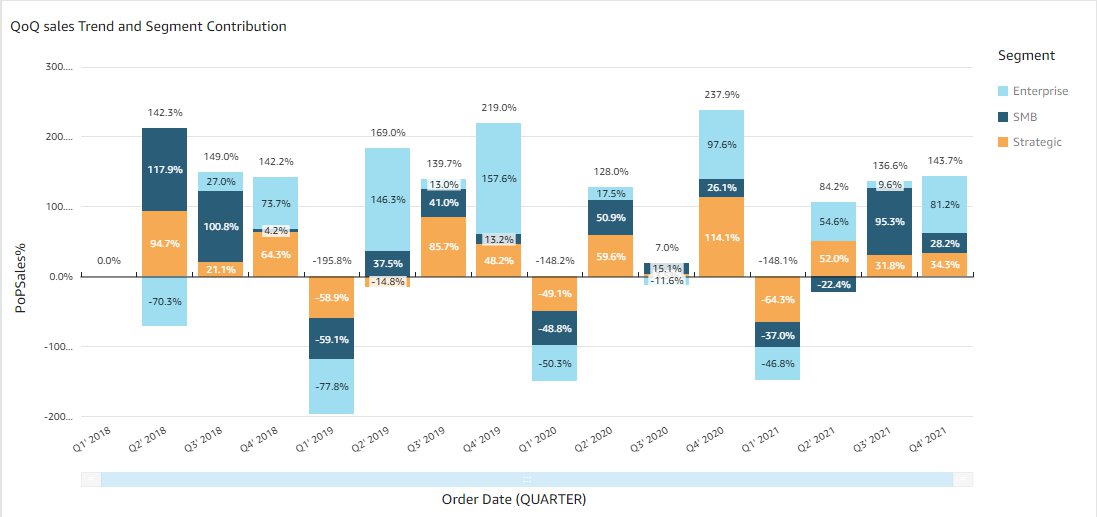
Similarly, you can use periodOverPeriodPercentDifference to calculate relative sales growth over time. You can add dimensions into the visual to dive further into business insights, such as analyzing the breakdown of each business segment’s sales change by quarter, and their contribution to the total sales increase. We use the formula PoPSales%=periodOverPeriodPercentDifference(sum(Sales),{Order Date}).

Use case 2: Using a period to date function to track YTD sales in table calculations and aggregations

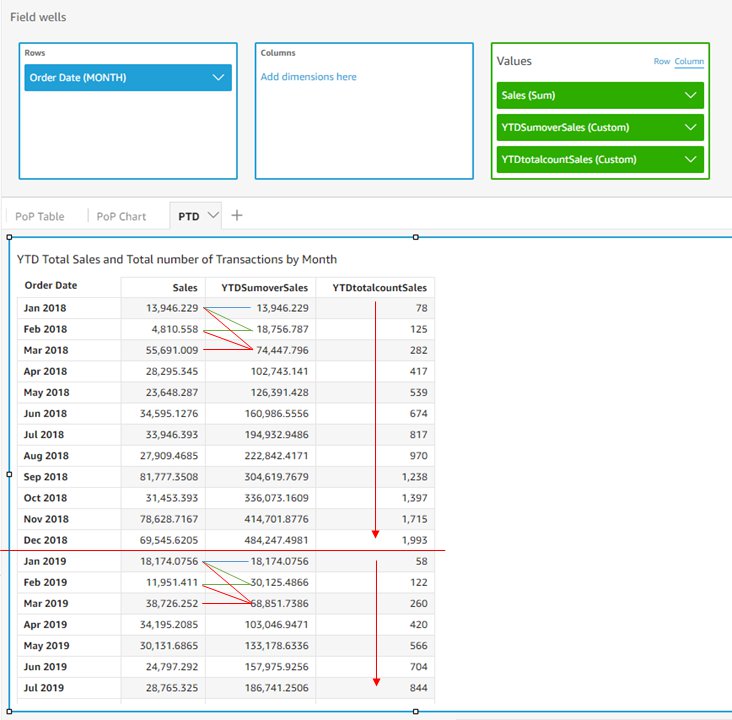
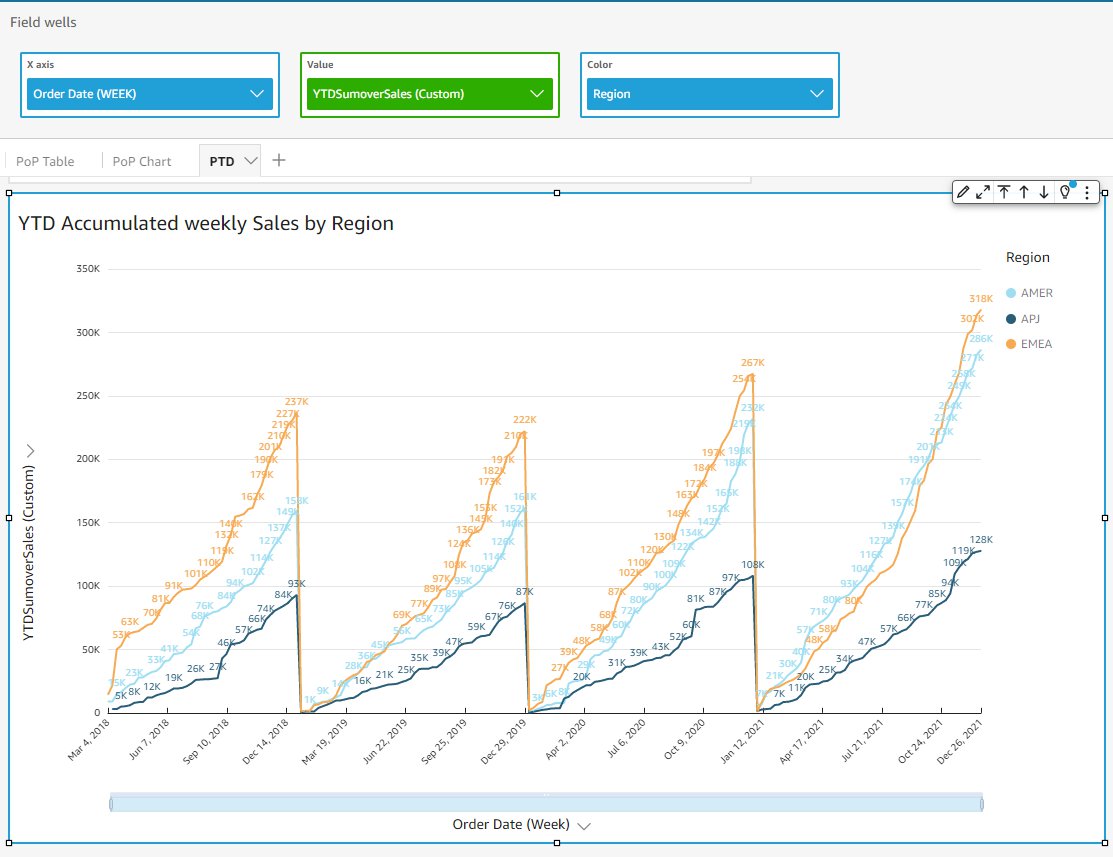
Similar to period over period functions, the period to date function suite provides a quick and easy way to calculate year-to-date (YTD) or quarter-to-date (QTD) metrics. In the following example, we use the formula of YTDSumoverSales=periodToDateSumOverTime(sum(Sales),{Order Date},YEAR), and YTDtotalcountSales=periodToDateSumOverTime(count(Sales),{Order Date},YEAR) to calculate YTD sales and YTD total number of transactions.

Contrary to period over period functions, the third argument of period to date functions, period, isn’t optional. Therefore, the calculation granularity is always fixed. In this example, with the granularity defined as YEAR, this measure always calculates YTD, instead of QTD or MTD. Because Order Date is displayed at the monthly level, this calculation outputs the YTD sales of each month, and starts over again in January for the next year. As shown in the result table, YTDSumoverSales of January 2018 is the monthly sales of January 2018, and YTDSumoverSales of February 2018 is the monthly sales of January 2018 plus that of February 2018. And YTDSumoverSales of January 2019 goes back to the monthly sales of January 2019.

You can further dive into the details by populating the calculations in a line chart, and adding more dimensions into the analysis. The following example shows the YTD weekly sales growth trend for each region along the past four years, and uncovers some interesting sales competition between AMER and EMEA in year 2021.

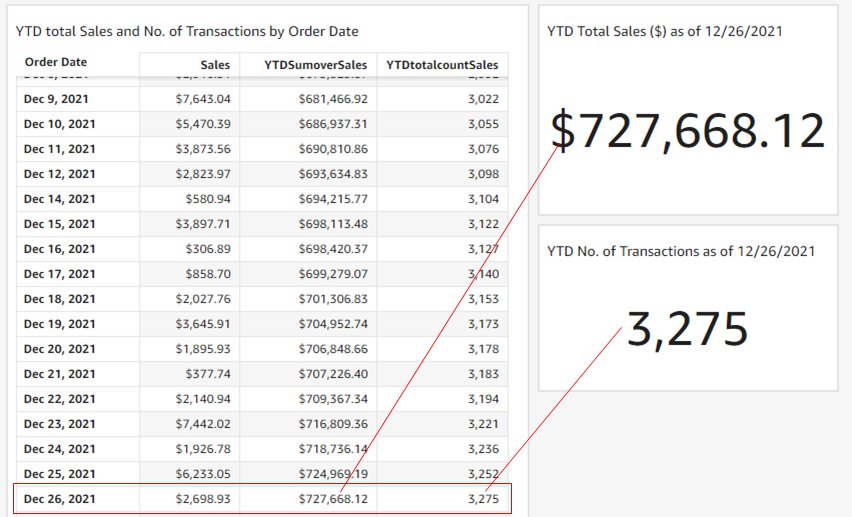
In addition to the table calculations, the aggregation period functions are particularly useful when you need to build KPI charts to evaluate YTD metrics in a real-time manner. In the following example, we use the aggregation period to date functions to build two KPI charts to track the YTD total sales, and YTD total number of transactions. For the date December 26, 2021, the timestamp results match the corresponding table calculations for the date of December 26, 2021 in the table. The following table summarizes the formulas.

Formula Formula Type
YTDSumoverSales=periodToDateSumOverTime(sum(Sales),{Order Date},YEAR) Table Calculation
YTDtotalcountSales=periodToDateSumOverTime(count(Sales),{Order Date},YEAR) Table Calculation
YTDSumSales=periodToDateSum(Sales,{Order Date},YEAR) Aggregation (KPI chart)
YTDCountSales=periodToDateCount(Sales,{Order Date},YEAR) Aggregation (KPI chart)

Advanced use case 1: Date/time awareness with period functions

Period functions are not only easier to define and read, they’re also date/time-aware, meaning the functions are calculated based on a date/time-based offset instead of a fixed number of rows. It can solve two major problems that were not possible to be addressed before.

Period functions can handle varying period duration

If you want to calculate the daily MoM sales increase, you can’t use a fixed offset on each month because the number of days of each month are different (31 days for January and 28 or 29 days for February).

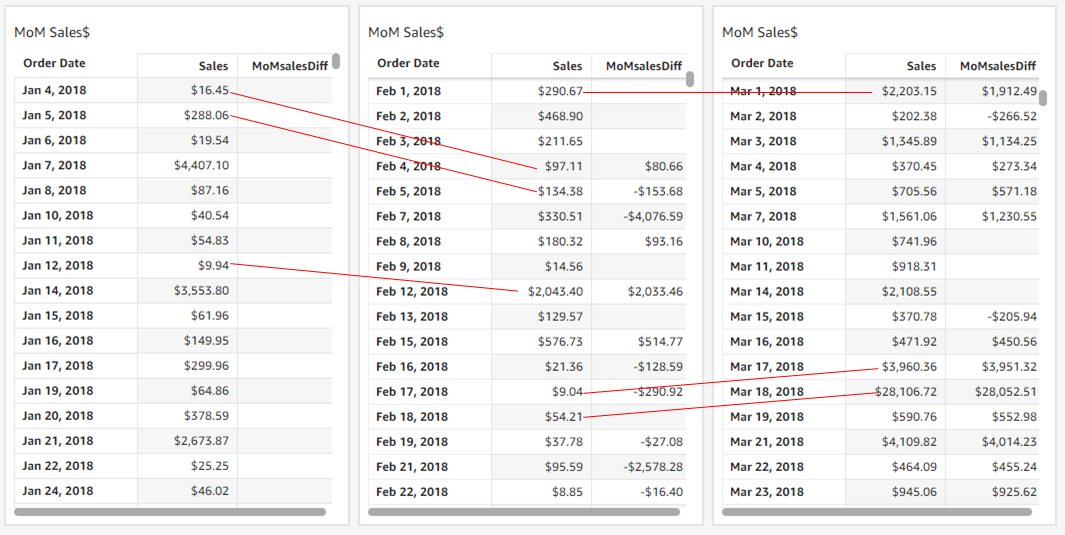
Period functions are calculated based on calendar dates instead of a fixed offset. In the following example, we use the formula MoMsalesDiff=periodOverPeriodDifference(sum(Sales),{Order Date},MONTH,1). The daily MoM increase is calculated correctly based on the day of the month. The sales of the first day of the month are compared with the first day of the previous month, and the same applies to all other days. (Visuals are duplicated for demonstration purposes.)

Period functions can handle sparse (missing) data points

Not all datasets can guarantee a complete set of dates. In the previous example, sales data of January 1, 2018, is missing. Using the workaround based on a fixed offset can cause a problem here because we compare February 1, 2018, with a different date instead of January 1, 2018. Period functions always compare measures by date/time offsets so that only desired dates are compared. In the previous example, MoMsalesDiff shows empty for February 1, 2018, because of the missing data of January 1, 2018.

Advanced use case 2: Nesting period functions with other calculations

Now that we can use period over period and period to date functions to create calculated fields, we can nest these functions with other calculations to drive more advanced analysis.

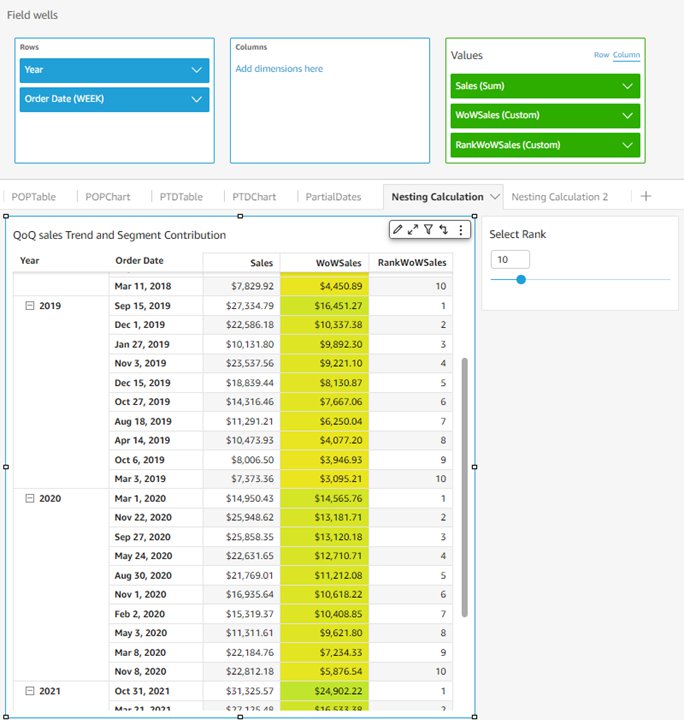
For example, you may want to know for each year, what are the top 10 weeks of the year in regards to week-over-week sales growth. You can do this by calculating WoWSales first: WoWSales=periodOverPeriodDifference(sum(Sales), {Order Date}, WEEK, 1). Then you nest it with the denseRank window function: RankWoWSales=denseRank([WoWSales DESC],[{YEAR}]). This wouldn’t be possible using the fixed-row based workaround, which is implemented using on-visual calculations instead of calculated fields. In the following visual, the top 10 weeks of each year with the highest sales growth are fetched by a simple filter on RankWoWSales.

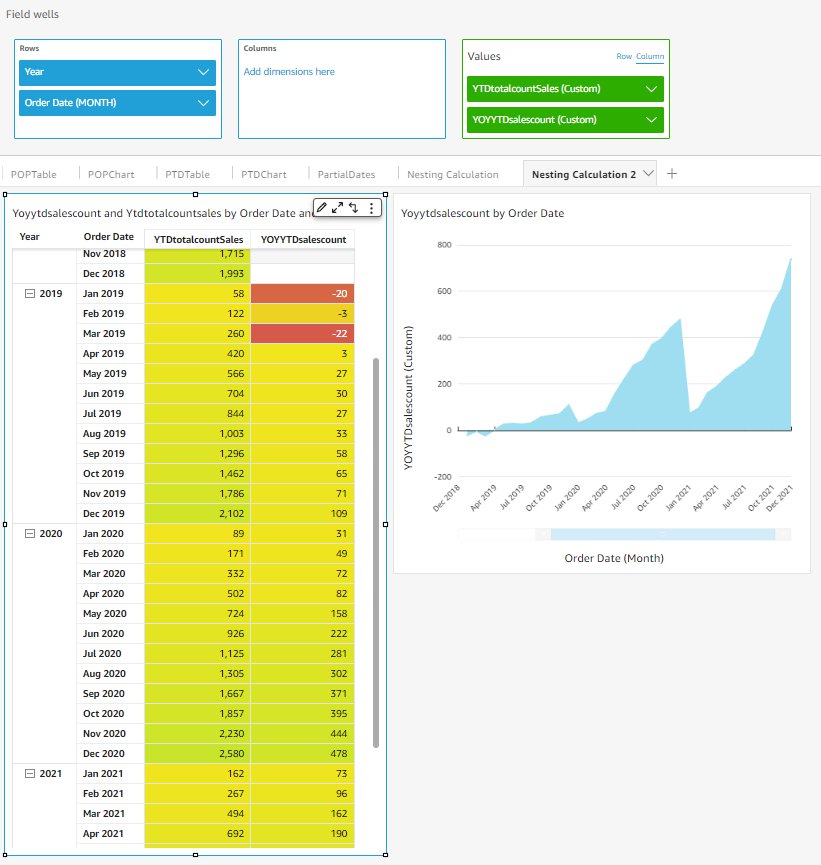
You can even nest the period functions with other period functions to generate interesting insights. For example, you can calculate a monthly YoY growth based on the monthly YTD number of transactions. The following formula demonstrates the capability of nesting a YTD calculated field inside a YoY calculated field:

YTDtotalsountSales=periodToDateSumOverTime(count(Sales),{Order Date},YEAR)
YoYYTDSalesCount=periodOverPeriodDifference(YTDtotalcountSales,{Order Date},YEAR,1)

The results in the following visual show a YoY growth based on a YTD accumulated number of transactions instead of the absolute monthly numbers.

Advanced use case 3: Partial period comparisons

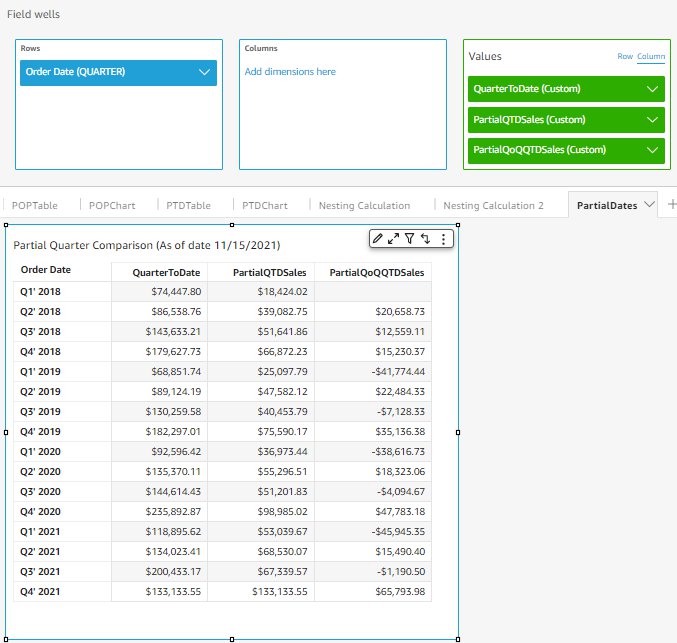
Finally, we discuss a third advanced use case: partial period comparison. Imagine it’s November 15, 2021 (which is the 46th day of the last quarter of 2021), and you want to calculate 4 to compare the performance of this quarter with past quarters, but only using the first 46 days of each quarter instead of the whole quarter. This requires a calculated field using periodOverPeriodDifference nested with the sumIf() window function.

The following example demonstrates using a nested calculated field to address this use case:

QuarterToDate=periodToDateSumOverTime(sum(Sales), {Order Date}, QUARTER)
PartialQTDSales=sumIf(Sales, dateDiff(truncDate("Q", {Order Date}), {Order Date}, "HH") <= dateDiff(truncDate("Q", now()), now(), "HH"))
PartialQoQQTDSales=periodOverPeriodDifference(sumif(Sales, {Order Date} <= addDateTime(dateDiff(truncDate("Q", now()), now(), "HH"), "HH", truncDate("Q", {Order Date}))), {Order Date}, QUARTER, 1)

PartialQTDSales computes how many hours from the beginning of this quarter to the current date and uses sumIf() to calculate the total sales of that period of each quarter. partialQoQQTDSales then nests the periodOverPeriodDifference function with PartialQTDSales to find the partial QoQ differences. Such a comparison based on a partial period isn’t feasible without the new date/time-aware period functions.

Conclusion

In this blog, we introduced new QuickSight period functions which enable quick and powerful date/time-based calculations. We reviewed comparative and cumulative period functions (i.e., period over period and period to date), discussed two major use cases (fixed vs. dynamic granularity and table calculation vs. aggregation), and extended the usage to three advanced use cases. Period functions are now generally available in all supported QuickSight Regions.

Looking forward to your feedback and stories on how you apply these calculations for your business needs.


About the Authors

Emily Zhu is a Senior Product Manager at Amazon QuickSight, AWS’s cloud-native, fully managed SaaS BI service. She leads the development of QuickSight core analytics and calculations capability. Before joining AWS, she was working in the Amazon Prime Air drone delivery program and the Boeing company as senior strategist for several years. Emily is passionate about potentials of cloud-based BI solutions and looks forward to helping customers to advance in their data-driven strategy making.

Rajkumar Haridoss is a Senior Software Development Engineer for AWS QuickSight. He is the lead engineer on the Query Generation team and works on back-end calculations, query planning, and query generation layer in QuickSight. Outside of work, he likes spending quality time with family and 4-year-old.

Protecting Holocaust educational websites

Post Syndicated from Omer Yoachimik original https://blog.cloudflare.com/protecting-holocaust-educational-websites/

Protecting Holocaust educational websites

Protecting Holocaust educational websites

Today is the International Holocaust Remembrance Day. On this day, we commemorate the victims that were murdered by the Nazis and their accomplices.

During the Holocaust, and in the events that led to it, the Nazis exterminated one third of the European Jewish population. Six million Jews, along with countless other members of minority and disability groups, were murdered because the Nazis believed they were inferior.

Cloudflare’s Project Galileo provides free protection to at-risk groups across the world including Holocaust educational and remembrance websites. During the past year alone, Cloudflare mitigated over a quarter of a million cyber threats launched against Holocaust-related websites.

Antisemitism and the Final Solution

In the Second World War and the years leading up to it, antisemitism served as the foundation of racist laws and fueled violent Pogroms against Jews. The tipping point was a night of violence known as the Kristallnacht (“Night of Broken Glass”). Jews and other minority groups were outlawed, dehumanized, persecuted and killed. Jewish businesses were boycotted, Jewish books burned and synagogues destroyed. Jews, Roma and other “enemies of the Reich” were forced into closed ghettos and concentration camps. Finally, as part of the Final Solution for the Jewish Question, Germany outlined a policy to deliberately and systematically exterminate the Jewish race in what came to be known as the Holocaust.

As part of the Final Solution, the Nazis deployed mobile killing units. Jews were taken to forests near their villages, forced to dig mass graves, undress, and then shot — falling into the mass graves they dug. This was the first step. However, this was “inefficient”. More “efficient” solutions were engineered using deadly gas. Eventually, six main extermination camps were established. They were extremely “efficient” at exterminating humans. Initially, the Nazis experimented with gas vans for mass extermination. Later, they built and operated gas chambers which could kill more humans and do it faster. After being gassed, prisoners would load the bodies into ovens in crematoriums to be burned. In one of the larger death camps, Auschwitz-Birkenau, more than one million Jews were murdered — some 865,000 were gassed and burned on arrival.

Fighting racism with education

Seventy-seven years later, sadly, racism and antisemitism are once again on the rise and have gained traction across Europe during the pandemic and across UK university campuses. Earlier this week, United Nations Secretary-General António Guterres decried the resurgence of antisemitism and said that “…the rise in antisemitism — the oldest form of hate and prejudice — has seen new reports of physical attacks, verbal abuse, the desecration of Jewish cemeteries, synagogues vandalized, and last week the hostage-taking of the rabbi and members of Beth Israel Congregation in Colleyville, Texas.

It is through education that we will defeat bigotry and racism, and we will do our part at Cloudflare — through education and by supporting Holocaust educational organizations.

“Our response to ignorance must be education”
– United Nations Secretary-General António Guterres

Supporting Holocaust educational organizations with Project Galileo

As part of Project Galileo, we currently provide free security and performance products to more than 1,500 organizations in 111 countries. These organizations are targeted by cyber attacks due to their critical work. These groups include human rights defenders, independent media and journalists, and organizations that work in strengthening democracy. Among them are organizations dedicated to educating about the horrors of the Holocaust, and preserving and telling the stories of the victims and survivors of the Holocaust to younger and future generations.

Protecting Holocaust educational websites

Over the past year, we’ve seen cyber attacks on Holocaust-related websites gradually increase throughout the year. These attacks include mostly application-layer attacks that were automatically detected and mitigated by Cloudflare’s Web Application Firewall and DDoS Protection systems.

In May 2021, cyber attacks on Holocaust-related websites peaked as they increased by 263% compared to their monthly average.

Protecting Holocaust educational websites

Applying to Project Galileo

Cloudflare’s mission is to help build a better Internet. Part of this mission includes protecting free expression online for vulnerable groups.

The Internet can be a powerful tool in this matter. However, organizations often face attacks from powerful and entrenched opponents, yet operate on limited budgets and lack the resources to secure themselves against malicious traffic intended to silence them. If they are silenced, the Internet stops fulfilling its promise.

To combat the threats, Cloudflare’s Project Galileo provides robust security and performance products for at-risk public interest websites at no cost. Application to Project Galileo is open to any vulnerable public interest website. You can apply via our partners or apply directly to Project Galileo if you don’t have any affiliation with our trusted partners.

A note from Cloudflare’s Jewish employees

Many of us, like myself, are descendants of Holocaust survivors. My grandparents fled from Nazi-occupied Poland to survive. Sadly, my grandparents — as other elderly survivors, are no longer with us. Many of us have faced antisemitism in various forms. Together, we are part of Cloudflare’s Employee Resource Group for Cloudflare’s Jewish community: Judeoflare. We have a responsibility to make sure the world remembers and never forgets the atrocities of the Holocaust and what racism and antisemitism can lead to.

Protecting Holocaust educational websites

Making the web better. With blocks!

Post Syndicated from Joel Spolsky original https://www.joelonsoftware.com/2022/01/27/making-the-web-better-with-blocks/

You’ve probably seen web editors based on the idea of blocks. I’m typing this in WordPress, which has a little + button that brings up a long list of potential blocks that you can insert into this page:

This kind of “insert block” user interface concept is showing up in almost every blogging tool, web editor, note-taking app, and content management system. People like it and it makes sense.

We have seem to have standardized on one thing: the / key to insert a new block. Everything else, though, is completely proprietary and non-standard.

I thought, wouldn’t it be cool if blocks were interchangeable and reusable across the web?

Until now, every app that wants blocks has to implement them from scratch. Want a calendar block? Some kind of fancy Kanban board? Something to embed image galleries? Code it up yourself, buddy.

As a result of the non-standardization of blocks, our end-users suffer. If someone is using my blog engine, they can only use those blocks that I had time to implement. Those blocks may be pretty basic or incomplete. Users might want to use a fancier block that they saw in WordPress or Medium or Notion, but my editor doesn’t have it. Blocks can’t be shared or moved around very easily, and our users are limited to the features and capabilities that we had time to re-implement.

To fix this, we’re going to create a protocol called the Block Protocol.

It’s open, free, non-proprietary, we want it to be everywhere on the web.

It’s just a protocol that embedding applications can use to embed blocks. Any block can be used in any embedding application if they all follow the protocol.

Our hope is that this will make life much easier for app developers to support a huge variety of block types. At the same time, anyone can develop a block once and have it work in any blog platform, note-taking app, or content management system. It is all 100% free, open, and any sample code we develop showing how to use the protocol will be open-source.

We’ve released a very early draft of the Block Protocol, and we’ve started building some very simple blocks and a simple editor that can host them.

We’re hoping to foster an open source community that creates a huge open source library of amazing blocks:

What can be a block?

  • Anything that makes sense in a document: a paragraph, list, table, diagram, or a kanban board.
  • Anything that makes sense on the web: an order form, a calendar, a video.
  • Anything that lets you interact with structured or typed data: I’ll get to that in a minute.

If you work on any kind of editor—be it a blogging tool, a note-taking app, a content management system, or anything like that—you should allow your users to embed blocks that conform to the Block Protocol. This way you can write the embedding code once and immediately make your editor able to embed a rich variety of block types with no extra work on your part.

If you work on any kind of custom data type that might make sense to embed in web pages, you should support the Block Protocol. That way anybody with a hosting application that supports the protocol can embed your custom data type.

Because it’s all 100% open, we hope that the Block Protocol will become a web standard and commonly used across the Internet.

That will mean that common block types, from paragraphs and lists to images and videos, will get better and better. But it will also mean that some esoteric block types will be embeddable anywhere. Want to create a block that shows the Great Circle routing for a flight between two airports? Write the code for the block once and it can be embedded anywhere.

Oh, and one more thing. Blocks can be highly structured, that is, they can have types. That means that they magically become machine-readable without screen scraping. For example, if you want to create an event block to represent an event on a calendar, you will be able to specify a schema that describes the event data type in a standard way. That way tools like calendars can instantly parse and understand web pages that contain your event block, reliably.

Over time, it will mean that anyone can easy publish complex, typed data sets on the web that are automatically machine-readable without extra work. (Have you ever seen one of those websites where there’s a link to “download the data set in .XLS format”? Yeah, say goodbye to that.)

We’re going public with this very early in the development process because we need a lot of help!

Everything we have so far is version 0.1. It’s simple and not very good yet and going to need some iteration before it has the hope of truly being a useful web protocol.

This is an open protocol, free and non-proprietary, and it’s going to make the open web much better if widely adopted, so we need to start getting people involved early, giving us feedback, and building new things!

Go read more about the Block Protocol now!

[$] An attic for LibreOffice Online

Post Syndicated from original https://lwn.net/Articles/882460/rss

In mid-December, Thorsten Behrens, a board member for the Document Foundation (TDF),
posted a
seemingly simple proposal
for an “attic” that would become the home of
abandoned projects. No specific projects were named as the first intended
residents of the attic, but the proposal
clearly related to the LibreOffice
Online
(LOOL) project. The following
discussion made it clear that the unhappiness around LOOL has yet to fade
away, and that the Foundation still has some work to do when it comes to
defining its relationship with its corporate members.

Migrating to Cloudflare Email Routing

Post Syndicated from Celso Martinho original https://blog.cloudflare.com/migrating-to-cloudflare-email-routing/

Migrating to Cloudflare Email Routing

A few days ago Google announced that the users from the “G Suite legacy free edition” would need to switch to the paid edition before May 1, 2022, to maintain their services and accounts working. Because of this, many people are now considering alternatives.

One use case for G Suite legacy was handling email for custom domains.

In September, during Birthday Week, we announced Cloudflare Email Routing. This service allows you to create any number of custom email addresses you want on top of the domains you already have with Cloudflare and automatically forward the incoming traffic to any destination inboxes you wish.

Email Routing was designed to be privacy-first, secure, powerful, and very simple to use. Also, importantly, it’s available to all our customers for free.

The closed beta allowed us to keep improving the service and make it even more robust, compliant with all the technical nuances of email, and scalable. Today we’re pleased to report that we have over two hundred thousand zones testing Email Routing in production, and we started the countdown to open beta and global availability.

With Email Routing, you can effectively start receiving Emails in any of your domains for any number of custom addresses you want and forward the messages to any existing destination mailboxes. We will automatically set up everything for you, and you can have it running in minutes today, at no cost.

Here’s a step-by-step tutorial on how you can start receiving emails to example.com, forward them to Gmail (or any other email provider) at [email protected].

Using Cloudflare Email Routing with Gmail

First, login to your Cloudflare Dashboard and select your example.com zone. Click “Email (Beta)” in the left navigation panel, and request to join the Beta program.

Today it still takes a couple of days to get approved into the beta, but feel free to ping us on the Discord server or community forum if you can’t wait.

Migrating to Cloudflare Email Routing

Once you get invited to join Email Routing, we will take you to our three-step easy configuration wizard. The first step is to define the custom address [email protected] and the destination address [email protected]. Don’t worry too much, you can modify or add others later.

Migrating to Cloudflare Email Routing

This step will trigger sending a confirmation email to [email protected] so that we can prove that the destination Inbox is yours. You need to open Gmail and press the verification link.

Then, on the last step, you need to configure your zone MX and SPF DNS records. We will do this automatically for you. Just press “Add records automatically“. If you already have MX or SPF configured, we will guide you through the conflicts we find and help you solve them.

Migrating to Cloudflare Email Routing

That’s it, Email Routing is now configured, and you can start sending emails to [email protected] and read them at [email protected] in Gmail.

Migrating to Cloudflare Email Routing

Gmail address conventions

Gmail and G suite, now Google Workspace, support two email address conventions that help organize your messages and fight spam.

The first one is the plus (“+”) sign. If you append a “+” sign and any combination of words after your email address, it will still get delivered to your inbox. For example, you can use [email protected], and it will get delivered at [email protected] and automatically get tagged “finance”. You can then use this to set up filters in Gmail.

The second one is Gmail ignores dots (“.”) in addresses entirely. For instance, sending an email to [email protected], [email protected], or [email protected] is all the same.

If you want to use these conventions with Cloudflare Email Routing, you can. Enable the “Catch-all address” feature and forward every incoming address for which there’s no other rule configured to the verified destination address of your choice ([email protected] in this example).

Migrating to Cloudflare Email Routing

Conclusion

This is only one small example of what you can do with Email Routing today. We hope you find it helpful if you’re looking for a new home for your email. For more information see our documentation pages.

Email needs more innovation. We’re immensely excited about Email Routing and our ideas for it in the roadmap. Expect improved metrics and advanced routing options in our rules engine in the near future.

Feel free to join the Beta today and ping us in our Discord server or community forum if you can’t wait; we’ll do our best to prioritize the community requests before we open the service.

Why Security in Kubernetes Isn’t the Same as in Linux: Part 1

Post Syndicated from Sagi Rosenthal original https://blog.rapid7.com/2022/01/27/why-security-in-kubernetes-isnt-the-same-as-in-linux-part-1/

Why Security in Kubernetes Isn't the Same as in Linux: Part 1

Kubernetes was first presented in 2014, and it almost entirely changed the way technological and even non-tech companies use infrastructure for running their applications. The Kubernetes platform still feels new and exciting — it has awesome features and can fit most use cases.

But hackers find the combination of new technology and user inexperience that’s just right for their malicious activity. Deploying your product on a Kubernetes cluster has a different security cost than on a traditional Linux server.

What are the risks of using Kubernetes?

The risks of a Kubernetes (K8s) deployment are actually the same as in traditional Linux servers. Most of them can be summed up to these 3 targets:

  • Denial of Service (DoS): These kinds of attacks want your service down. They can be caused in many different ways, including distributed denial of service (DDoS) attacks or SQL injections that erase your databases. As there is no direct profit to the attacker, these attacks are of most interest to malicious groups who disagree with your company values or products, or to your competitors.
Why Security in Kubernetes Isn't the Same as in Linux: Part 1
  • Information exfiltration: Another type of attack targets the information you hold. These attacks can collect your information, like your profits, source codes, names of employees, and so on. Or they can collect private data about your customers and users — who they are, their credit card numbers, health state, financial assets, and everything you know about them. None of this is data you want to be known outside the company.
  • Hardware hijack: A hardware hijack is any type of attack that runs a malicious code on your compute resources and causes them to operate in a way that you did not program or intend them to run. Most of these attacks are related to cryptocurrency. They typically either turn your CPU/GPU to Bitcoin miner or conduct a ransomware attack by encrypting your file system and requesting you to pay ransom (usually in Bitcoin) to unencrypt it. As the important point here for attackers is profit, not the identity of the victim, these attacks usually originate from bots or automatic scripts, rather than with dedicated special operations of malicious groups or individuals.

How can you defend yourself?

Securing deployments and identifying malicious activity on Kubernetes clusters is similar to how it’s done on traditional Linux servers. Most of the differences are in the implementation itself. But there are some distinctions worth mentioning. Let’s focus in on the operating system aspects of security.

Processes and system calls

“The system call is the fundamental interface between an application and the Linux kernel.” —Linux manual page

Linux has over 400 different system calls. These can be used for requesting to read a file, executing another program, sending a network message, and more. As you’ve probably guessed, these operations can be risky when used by unwanted programs.

The Linux Kernel has security mechanisms against malware, but it isn’t fully protected. So system calls may seem legitimate even when they aren’t. Tracking these system calls can give good insight on what a process does. In native Linux, it can be easy to track these down from a single point on the server. However, in K8s Linux nodes, the distribution, dynamics, and containerization makes this mission a very complex task.

Network security

The internet connection is your face for the customers, but it’s also the entry point for various malicious software into your infrastructure. Luckily, the big cloud providers and most of the internet-facing frameworks are well-protected against these attacks. But nothing is 100% safe. Moreover, some of the images you are using may contain security holes themselves. These can cause a malicious program to initiate from inside your cluster.

Tracking the network from the inside out can give you a lot of information on malicious activity. But you also have to consider the “east-to-west” traffic inside your infrastructure — the internal communication. In traditional Linux servers and VMs, you know exactly which microservices exist and define firewall services accordingly. However, in Kubernetes, the dynamic nature of the pods and resources makes it hard to track this traffic, so it can be difficult to find the network holes.

Why Security in Kubernetes Isn't the Same as in Linux: Part 1

File system

It may seem easy to detect new files and file changes in order to determine unwanted changes, but tracking and analyzing your whole file system can be a large, complex task in Linux servers. They can have terabytes of storage, and reading them — especially from a magnetic hard disk — isn’t fast enough to detect malicious activity when it happens. However, the containerization concept of Kubernetes can be to our advantage here, as container images are usually small, lightweight, and repetitive. Looking inside the containers files should have highly expected results.

More to come

This is one of two articles covering the detective resources that can help us identify unwanted activity in your Kubernetes clusters. In this first part, we saw that both Kubernetes and traditional Linux servers have vulnerabilities that originate in the processes, network, or file system. However, there are differences in how to monitor malicious activity in Kubernetes versus Linux. Some vulnerabilities may seem harder to defend in Kubernetes, but most of them are actually easier.

InsightCloudSec, Rapid7’s cloud-native security platform, covers these differences and ensures your on-premises server farm is secured.

The next article will explain further about the unique aspects of Kubernetes security that do not exist in traditional Linux servers. Stay tuned!

Additional reading

Kubernetes Guardrails: Bringing DevOps and Security Together on Cloud

Stay Ahead of Threats With Cloud Workload Protection

Make Room for Cloud Security in Your 2022 Budget

Time to Act: Bridging the Gap in Cloud Automation Adoption

NEVER MISS A BLOG

Get the latest stories, expertise, and news about security today.

Security updates for Thursday

Post Syndicated from original https://lwn.net/Articles/882882/rss

Security updates have been issued by CentOS (polkit), Debian (uriparser), Fedora (cryptsetup, flatpak, flatpak-builder, and polkit), Gentoo (polkit), Mageia (virtualbox), Red Hat (httpd24-httpd, httpd:2.4, and parfait:0.5), SUSE (clamav, log4j, python-numpy, and strongswan), and Ubuntu (vim).

The Roots project: Implementing culturally responsive computing teaching in schools in England

Post Syndicated from Sue Sentance original https://www.raspberrypi.org/blog/culturally-responsive-computing-teaching-schools-england-roots-research-project/

Since last year, we have been investigating culturally relevant pedagogy and culturally responsive teaching in computing education. This is an important part of our research to understand how to make computing accessible to all young people. We are now continuing our work in this area with a new project called Roots, bridging our research team here at the Foundation and the team at the Raspberry Pi Computing Education Research Centre, which we jointly created with the University of Cambridge in its Department of Computer Science and Technology.

Across both organisations, we’ve got great ambitions for the Centre, and I’m delighted to have been appointed as its Director. It’s a great privilege to lead this work. 

What do we mean by culturally relevant pedagogy?

Culturally relevant pedagogy is a framework for teaching that emphasises the importance of incorporating and valuing all learners’ knowledge, ways of learning, and heritage. It promotes the development of learners’ critical consciousness of the world and encourages them to ask questions about ethics, power, privilege, and social justice. Culturally relevant pedagogy emphasises opportunities to address issues that are important to learners and their communities.

Culturally responsive teaching builds on the framework above to identify a range of teaching practices that can be implemented in the classroom. These include:

  • Drawing on learners’ cultural knowledge and experiences to inform the curriculum
  • Providing opportunities for learners to choose personally meaningful projects and express their own cultural identities
  • Exploring issues of social justice and bias

The story so far

The overall objective of our work in this area is to further our understanding of ways to engage underrepresented groups in computing. In 2021, funded by a Special Projects Grant from ACM’s Special Interest Group in Computer Science Education (SIGCSE), we established a working group of teachers and academics who met up over the course of three months to explore and discuss culturally relevant pedagogy. The result was a collaboratively written set of practical guidelines about culturally relevant and responsive teaching for classroom educators.

The video below is an introduction for teachers who may not be familiar with the topic, showing the perspectives of three members of the working group and their students. You can also find other resources that resulted from this first phase of the work, and read our Special Projects Report.

We’re really excited that, having developed the guidelines, we can now focus on how culturally responsive computing teaching can be implemented in English schools through the Roots project, a new, related project supported by funding from Google. This funding continues Google’s commitment to grow the impact of computer science education in schools, which included a £1 million donation to support us and other organisations to develop online courses for teachers.

The next phase of work: Roots

In our new Roots project, we want to learn from practitioners how culturally responsive computing teaching can be implemented in classrooms in England, by supporting teachers to plan activities, and listening carefully to their experiences in school. Our approach is similar to the Research-Practice-Partnership (RPP) approach used extensively in the USA to develop research in computing education; this approach hasn’t yet been used in the UK. In this way, we hope to further develop and improve the guidelines with exemplars and case studies, and to increase our understanding of teachers’ motivations and beliefs with respect to culturally responsive computing teaching.

The pilot phase of the Roots project starts this month and will run until December 2022. During this phase, we will work with a small group of schools around London, Essex, and Cambridgeshire. Longer-term, we aim to scale up this work across the UK.

The project will be centred around two workshops held in participating teachers’ schools during the first half of the year. In the first workshop, teachers will work together with facilitators from the Foundation and the Raspberry Pi Computing Education Research Centre to discuss culturally responsive computing teaching and how to make use of the guidelines in adapting existing lessons and programmes of study. The second workshop will take place after the teachers have implemented the guidelines in their classroom, and it will be structured around a discussion of the teachers’ experiences and suggestions for iteration of the guidelines. We will also be using a visual research methodology to create a number of videos representing the new knowledge gleaned from all participants’ experiences of the project. We’re looking forward to sharing the results of the project later on in the year. 

We’re delighted that Dr Polly Card will be leading the work on this project at the Raspberry Pi Computing Education Research Centre, University of Cambridge, together with Saman Rizvi in the Foundation’s research team and Katie Vanderpere-Brown, Assistant Headteacher, Saffron Walden County High School, Essex and Computing Lead of the NCCE London, Hertfordshire and Essex Computing Hub.

More about equity, diversity, and inclusion in computing education

We hold monthly research seminars here at the Foundation, and in the first half of 2021, we invited speakers who focus on a range of topics relating to equity, diversity, and inclusion in computing education.

As well as holding seminars and building a community of interested people around them, we share the insights from speakers and attendees through video recordings of the sessions, blog posts, and the speakers’ presentation slides. We also publish a series of seminar proceedings with referenced chapters written by the speakers.

You can download your copy of the proceedings of the equity, diversity, and inclusion series now.  

The post The Roots project: Implementing culturally responsive computing teaching in schools in England appeared first on Raspberry Pi.

New – Amazon EC2 X2iezn Instances Powered by the Fastest Intel Xeon Scalable CPU for Memory-Intensive Workloads

Post Syndicated from Channy Yun original https://aws.amazon.com/blogs/aws/new-amazon-ec2-x2iezn-instances-powered-by-the-fastest-intel-xeon-scalable-cpu-for-memory-intensive-workloads/

Electronic Design Automation (EDA) workloads require high computing performance and a large memory footprint. These workloads are sensitive to faster CPU performance and higher clock speeds since the faster performance allows more jobs to be completed on the lower number of cores. At AWS re:Invent 2020, we launched Amazon EC2 M5zn instances which use second-generation Intel Xeon Scalable (Cascade Lake) processors with an all-core turbo clock frequency of up to 4.5 GHz, which is the fastest of any cloud instance.

Our customers have enjoyed the high single-threaded performance, high-speed networking, and balanced memory-to-vCPU ratio of EC2 M5zn instances. They have asked for instances that will leverage these features while also providing them a greater memory footprint per vCPU.

Today, we are launching Amazon EC2 X2iezn instances, which use the same Intel Xeon Scalable processors as M5zn instances, with an all-core turbo clock frequency of 4.5 GHz and up to 1.5 TiB of memory, which is the fastest of any cloud instance for EDA workloads. These instances are capable of delivering up to 55 percent better price-performance per vCPU compared to X1e instances.

X2iezn instances offer 32 GiB of memory per vCPU and will support up to 48 vCPUs and 1536 GiB of memory. Built on the AWS Nitro, they deliver up to 100 Gbps of networking bandwidth and 19 Gbps of dedicated Amazon EBS bandwidth to improve performance for EDA applications.

You might have noticed that we’re now using the “i” suffix in the instance type to specify that the instances are using an Intel processor, “e” in the memory-optimized instance family to indicate extended memory, “z” which indicates high-frequency processors, and “n” to support higher network bandwidth up to 100 Gbps.

X2iezn instances are VPC only, HVM-only, and EBS-Optimized, with support for Optimize vCPU. As you can see, the memory-to-vCPU ratio on these instances is the same as that of previous-generation X1e instances:

Instance Name vCPUs RAM (GiB) Network Bandwidth (Gbps) EBS-Optimized Bandwidth (Gbps)
x2iezn.2xlarge 8 256 Up to 25 3.170
x2iezn.4xlarge 16 512 Up to 25 4.750
x2iezn.6xlarge 24 768 50 9.5
x2iezn.8xlarge 32 1024 75 12
x2iezn.12xlarge 48 1536 100 19
x2iezn.metal 48 1536 100 19

Many customers will be able to benefit from using X2iezn instances to improve performance and efficiency for their EDA workloads. Here are some examples:

  • Annapurna Labs tested the X2iezn instances with Calibre’s Design Rule Checking, which has shown a 40 percent faster runtime compared to X1e instances, and a 25 percent faster runtime over R5d instances.
  • Astera Labs is a fabless, cloud-based semiconductor company developing purpose-built CXL, PCIe, and Ethernet connectivity solutions for data-centric systems. They were able to see performance gains of up to 25 percent compared to similar EDA workloads running on R5 instances.
  • Cadence tested the X2iezn instances using their Pegasus True Cloud feature, which allows designers to run physical verification jobs on the cloud and observed a 50 percent performance improvement over R5 instances. They see X2iezn instances as an excellent environment for testing EDA workloads.
  • NXP Semiconductors worked with AWS to run their Calibre and Spectre workloads on Amazon EC2 X2iezn instances, which measured 10-15 percent higher performance using X2iezn instances compared to their on-premises, Xeon Gold 6254 with max turbo frequency of 4.0GHz.
  • Siemens EDA worked with AWS to test the new Amazon EC2 X2iezn HPC/EDA focused instances with the industry performance and sign-off leader Calibre evaluating advanced node DRC workloads. They were pleased to demonstrate performance improvements of up to 14% using the 4.5 GHz all core turbo frequency of X2iezn instances for all VMs in the run. Additionally, they successfully demonstrated the use of a heterogeneous server configuration using the X2iezn as the primary node and other lower memory VMs for remote compute – providing an 11% speed up and attractive value. These results confirmed the X2iezn is a good fit for primary server EDA workloads for Calibre Physical and Circuit verification applications.
  • Synopsys IC Validator provides highly scalable high-performance physical verification signoff. They achieved 15 percent performance improvement, scalability to 1000s of cores, and 30 percent better efficiency using IC Validator’s unique elastic CPU management technology versus R5d instances.

Things to Know
Here are some fun facts about the X2iezn instances:

Optimizing CPU—You can disable Intel Hyper-Threading Technology for workloads that perform well with single-threaded CPUs, like some HPC applications.

NUMA—You can make use of non-uniform memory access (NUMA) on x2iezn.12xlarge instances. This advanced feature is worth exploring if you have a deep understanding of your application’s memory access patterns.

Available Now
Amazon EC2 X2iezn instances are now available in the US East (N. Virginia), US West (Oregon), Asia Pacific (Tokyo), and Europe (Ireland) Regions. You can use On-Demand Instances, Reserved Instances, Savings Plan, and Spot Instances. Dedicated Instances and Dedicated Hosts are also available.

To learn more, visit our EC2 X2i Instances page, and please send feedback to the AWS forum for EC2 or through your usual AWS Support contacts.

Channy

[$] Goodbye FLoC, hello Topics

Post Syndicated from original https://lwn.net/Articles/882607/rss

Back in May, we looked at a Google proposal
to replace third-party
cookies
with something called the
Federated Learning of Cohorts
(FLoC). Third-party cookies were once used to track users all over the web
so that advertisers could, supposedly, target their ads better, but, of the
major browsers, only Google’s Chrome browser fails to block them today. Google
took a fair amount of flak for FLoC, since it was not perceived to be much
of a win for users’ privacy—and was mostly a sop to the (Google-dominated)
web-advertising industry. Now the company is back with a different
proposal that could, eventually, replace third-party cookies in Chrome: Topics.

Incorrect proxying of 24 hostnames on January 24, 2022

Post Syndicated from Jeremy Hartman original https://blog.cloudflare.com/incorrect-proxying-of-24-hostnames-on-january-24-2022/

Incorrect proxying of 24 hostnames on January 24, 2022

On January 24, 2022, as a result of an internal Cloudflare product migration, 24 hostnames (including www.cloudflare.com) that were actively proxied through the Cloudflare global network were mistakenly redirected to the wrong origin. During this incident, traffic destined for these hostnames was passed through to the clickfunnels.com origin and may have resulted in a clickfunnels.com page being displayed instead of the intended website. This was our doing and clickfunnels.com was unaware of our error until traffic started to reach their origin.

API calls or other expected responses to and from these hostnames may not have responded properly, or may have failed completely. For example, if you were making an API call to api.example.com, and api.example.com was an impacted hostname, you likely would not have received the response you would have expected.

Here is what happened:

At 2022-01-24 22:24 UTC we started a migration of hundreds of thousands of custom hostnames to the Cloudflare for SaaS product. Cloudflare for SaaS allows SaaS providers to manage their customers’ websites and SSL certificates at scale – more information is available here. This migration was intended to be completely seamless, with the outcome being enhanced features and security for our customers. The migration process was designed to read the custom hostname configuration from a database and migrate it from SaaS v1 (the old system) to SaaS v2 (the current version) automatically.

To better understand what happened next, it’s important to explain a bit more about how custom hostnames are configured.

First, Cloudflare for SaaS customers can configure any hostname; but before we will proxy traffic to them, they must prove (via DNS validation) that they actually are allowed to handle that hostname’s traffic.

When the Cloudflare for SaaS customer first configures the hostname, it is marked as pending until DNS validation has occurred. Pending hostnames are very common for Cloudflare for SaaS customers as the hostname gets provisioned, and then the SaaS provider will typically work with their customer to put in place the appropriate DNS validation that proves ownership.

Once a hostname passes DNS validation, it moves from a pending state to an active state and can be proxied. Except in one case: there’s a special check for whether the hostname is marked as blocked within Cloudflare’s system. A blocked hostname is one that can’t be activated without manual approval by our Trust & Safety team. Some scenarios that could lead to a hostname being blocked include when the hostname is a Cloudflare-owned property, a well known brand, or a hostname in need of additional review for a variety of reasons.

During this incident, a very small number of blocked hostnames were erroneously moved to the active state while migrating clickfunnels.com’s customers. Once that occurred, traffic destined for those previously blocked hostnames was then processed by a configuration belonging to clickfunnels.com, sending traffic to the clickfunnels.com’s origin. One of those hostnames was www.cloudflare.com. Note that it was www.cloudflare.com and not cloudflare.com, so subdomains like dash.cloudflare.com, api.cloudflare.com, cdnjs.cloudflare.com, and so on were unaffected by this problem.

As the migration process continued down the list of hostnames, additional traffic was re-routed to the clickfunnels.com origin. At 23:06 UTC www.cloudflare.com was affected. At 23:15 UTC an incident was declared internally. Since the first alert we received was for www.cloudflare.com, we started our investigation there. In the next 19 minutes, the team restored www.cloudflare.com to its correct origin, determined the breadth of the impact and the root cause of the incident, and began remediation for the remaining affected hostnames.

By 2022-01-25 00:13 UTC, all custom hostnames had been restored to their proper configuration and the incident was closed. We have contacted all the customers who were affected by this error. We have worked with ClickFunnels to delete logs of this event to ensure that no data erroneously sent to the clickfunnels.com’s origin is retained by them and are very grateful for their speedy assistance.

Here is a graph (on a log scale) of requests to clickfunnels.com during the event. Out of a total of 268,430,157 requests redirected, 268,220,296 (99.92%) were for www.cloudflare.com:

Incorrect proxying of 24 hostnames on January 24, 2022

At Cloudflare, we take these types of incidents very seriously, dedicating massive amounts of resources in preventative action and in follow-up engineering. In this case, there are both procedural and technical follow-ups to prevent reoccurrence. Here are our next steps:

  • No more blocked hostname overrides. All blocked hostname changes will route through our verification pipeline as part of the migration process.
  • All migrations will require explicit validation and approval from SaaS customers for a blocked hostname to be considered for activation.
  • Additional monitoring will be added to the hostnames being migrated to spot potential erroneous traffic patterns and alert the migration team.
  • Additional monitoring added for www.cloudflare.com.
  • Stage hostname activations on non-production elements prior to promoting to production will enable the ability to verify the new hostname state is expected. This will allow us to catch issues before they hit production traffic.

Conclusion

This event exposed previously unknown gaps in our process and technology that directly impacted our customers. We are truly sorry for the disruption to our customers and any potential visitor to the impacted properties. Our commitment is to provide fully reliable and secure products, and we will continue to make every effort possible to deliver just that for our customers and partners.

Let’s Architect! Architecture and Sustainability

Post Syndicated from Luca Mezzalira original https://aws.amazon.com/blogs/architecture/lets-architect-1-architecture-and-sustainability/

We often read news about sustainability and how governments and large corporations are working to build a better world for the future. But, have you ever asked yourself what you can do? As a software architect, how can you make a difference by addressing sustainability challenges?

In this first post of Let’s Architect!, a series of posts that gathers content to help software architects and tech leaders explore new ideas, case studies, and technical approaches, we provide materials to help you design sustainable architectures and create awareness on sustainability.

Optimizing your AWS Infrastructure for Sustainability

How do you optimize the compute layer of your environment from a sustainability perspective? An idle server still consumes power, and regulating its power consumption is one way to improve environmental impact. But, the cloud offers many other metrics and features to monitor and optimize your system.

This blog post shows you how to analyze the utilization of your compute resources, explains the main features to automatically scale based on demand, and highlights how serverless can optimize your resource utilization. Knowing how to use your resources efficiently will help reduce the amount of energy spent by your workload.

The shared responsibility model for sustainability shows how it is a shared responsibility between AWS and customers

The shared responsibility model for sustainability shows how it is a shared responsibility between AWS and customers

Building Sustainably on AWS

This talk provides several best practices you can follow as to design more sustainable architectures. It gives different tips to integrate sustainable practices throughout business operations and provides some guardrails that could help you achieve your organization’s sustainability goals more quickly.

Luke Hargreaves explaining how to build sustainably on AWS

Luke Hargreaves explaining how to build sustainably on AWS

Moving to event-driven architectures

An efficient architecture is typically a more sustainable architecture. This video explains how Amazon.com approaches event-driven architectures.

Event-driven architectures use events to communicate across different microservices. This architectural pattern works to reduce bandwidth consumption and CPU utilization and potentially lower cost. By choosing a serverless event-driven architecture, you’ll optimize your overall resource utilization because the code is run in response to events.

Tim Bray presenting how to move to an event-driven architecture at re:Invent 2019

Tim Bray presenting how to move to an event-driven architecture at re:Invent 2019

Supporting climate model simulations to accelerate climate science

This blog post discusses how collaborating research teams use the data generated through climate model simulations to study impacts on Earth and human systems—including agriculture, drought, flooding, and human health—in various parts of the world.

These studies will advance understanding of near-term climate and climate-intervention responses, and accelerate progress on a time-sensitive problem for humanity.

This architecture built on AWS Parallel Cluster supports weather and climate modeling workloads

This architecture built on AWS ParallelCluster supports weather and climate modeling workloads

See you next time!

Thanks for reading! If you want to deep dive into the topic of sustainability even more, don’t miss the Architecture Monthly edition on Sustainability.

See you in a couple of weeks when we discuss novel ways to use machine learning and artificial intelligence!

Looking for more architecture content? AWS Architecture Center provides reference architecture diagrams, vetted architecture solutions, Well-Architected best practices, patterns, icons, and more!

New DeadBolt Ransomware Targets NAT Devices

Post Syndicated from Bruce Schneier original https://www.schneier.com/blog/archives/2022/01/new-deadbolt-ransomware-targets-nat-devices.html

There’s a new ransomware that targets NAT devices made by QNAP:

The attacks started today, January 25th, with QNAP devices suddenly finding their files encrypted and file names appended with a .deadbolt file extension.

Instead of creating ransom notes in each folder on the device, the QNAP device’s login page is hijacked to display a screen stating, “WARNING: Your files have been locked by DeadBolt”….

[…]

BleepingComputer is aware of at least fifteen victims of the new DeadBolt ransomware attack, with no specific region being targeted.

As with all ransomware attacks against QNAP devices, the DeadBolt attacks only affect devices accessible to the Internet.

As the threat actors claim the attack is conducted through a zero-day vulnerability, it is strongly advised that all QNAP users disconnect their devices from the Internet and place them behind a firewall.

Security updates for Wednesday

Post Syndicated from original https://lwn.net/Articles/882724/rss

Security updates have been issued by CentOS (httpd), Debian (libxfont, lrzsz, nss, openjdk-17, policykit-1, webkit2gtk, and wpewebkit), Mageia (polkit), openSUSE (expat, json-c, kernel, polkit, qemu, rust1.55, rust1.57, thunderbird, unbound, and webkit2gtk3), Oracle (httpd:2.4, java-11-openjdk, and polkit), Red Hat (httpd:2.4, OpenShift Container Platform 3.11.570, polkit, and Red Hat OpenStack Platform 16.1 (etcd)), Scientific Linux (polkit), Slackware (polkit), SUSE (aide, expat, firefox, json-c, kernel, polkit, qemu, rust, rust1.55, rust1.57, thunderbird, unbound, and webkit2gtk3), and Ubuntu (policykit-1 and xorg-server).

How Ransomware Is Changing US Federal Policy

Post Syndicated from Harley Geiger original https://blog.rapid7.com/2022/01/26/how-ransomware-is-changing-us-federal-policy/

How Ransomware Is Changing US Federal Policy

In past decades, attackers breaching systems and stealing sensitive information prompted a wave of regulations focused on consumer privacy and breach notification. The current surge in ransomware attacks is prompting a new wave of action from policymakers. Unlike the more abstract harms threatened by breaches of personal information, ransomware will grind systems to a halt, suspending business and government operations and potentially threatening health and safety. One indication of the shift in awareness of this form of cybercrime is that President Biden addressed the ransomware threat multiple times in 2021.

The increased stakes of the ransomware threat are pushing regulators to take a harder look at whether regulatory requirements for cybersecurity safeguards are effective or if new requirements are needed to help combat the threat. The federal agencies are also stepping up their coordination on information sharing and incident reporting, and the Administration is growing its collaboration with international partners and the private sector. Let’s look at a few recent and ongoing initiatives.

Cybersecurity requirements for critical infrastructure

In March 2021, Secretary of Homeland Security Mayorkas announced a series of initiatives to strengthen cybersecurity for critical infrastructure, citing ransomware as a national security threat driving the effort. Less than two months later, the Colonial Pipeline ransomware event disrupted the East Coast fuel supply.

Not long after the Colonial attack, the Transportation Security Administration (TSA) exercised its authority to impose security regulations on the pipeline sector. Through two separate rules, TSA required pipeline operators to establish incident response and recovery plans, implement mitigation measures to protect against ransomware attacks, and undergo annual cybersecurity audits and architecture reviews, among other things.

In December 2021, TSA also issued new security regulations for the aviation, freight rail, and passenger rail sectors. The regulations require (among other things) reporting ransomware incidents to CISA and maintaining an incident response plan to detect, mitigate, and recover from ransomware attacks.

Ransomware is a key motivating factor in the sudden tightening of cybersecurity requirements. Previously, the cybersecurity regulations for pipelines were voluntary, with an accommodative relationship between pipeline operators and their regulators. Policymakers are increasingly voicing concern that other critical infrastructure sectors are in a similar position. With basic societal needs at risk when ransomware successfully disrupts critical infrastructure operations, some lawmakers are signaling openness to creating additional cybersecurity regulations for critical sectors.

OFAC sanctions

The federal government is also using its sanctions authority to head off ransomware payments. According to a recent FinCEN report, the average amount of reported ransomware transactions was approximately $100 million per month in 2021. These payments encourage more ransom-based attacks and fund other criminal activities.

The Office of Foreign Assets Control (OFAC) issued guidance warning that paying ransoms to sanctioned persons and organizations is in violation of sanctions regulations. Liability for these violations, OFAC notes, applies even if the person did not know that the ransomware payment was sent to a sanctioned entity.

Critics of this approach warn that applying sanctions to specific attacker groups is ineffective as the groups can simply rebrand or partner with other criminal elements to take payments. They add that sanctions imposed on payments does nothing but further victimize those organizations or individuals being attacked and remove their choices for recovery or force them underground. Ransomware is already grossly under-reported, and critics of sanctions warn that sanctions will likely encourage a lack of transparency.

More recently, OFAC also issued virtual currency guidance — aimed at currency companies, miners, exchanges, and users — emphasizing that the facilitation of ransomware payments to sanctioned entities is illegal. The guidance also describes best practices for assessing the risk of violating sanctions during transactions. In addition, OFAC imposed sanctions on a Russia-based cryptocurrency exchange for allegedly facilitating financial transactions for ransomware actors — the first sanctions of this kind.

OFAC followed up with an advisory on sanctions guidance for the virtual currency industry and applied sanctions on a cryptocurrency firm that was not doing its due diligence in preventing the facilitation of payments to ransomware criminal gangs.

Ransomware reporting

Requirements to report ransomware payments and ransomware-related incidents to federal authorities is another area to watch. Incident reporting requirements are in place for federal agencies and contractors via a Biden Administration Executive Order, but Congress is taking steps to expand these requirements to other private-sector entities.

Both the House of Representatives and the Senate have advanced legislation that would require businesses to report ransomware payments within 24 hours. The report would need to include the method of payment, instructions for making the payment, and other details to help federal investigators follow the payment flows and identify ransomware trends over time. The legislation would also require owners and operators of critical infrastructure to report substantial cybersecurity incidents (including a disruptive ransomware attack) within 72 hours. Interestingly, the legislation’s definition of “ransomware” encompasses all extortion-based attacks (such as the threat of DDoS), not just malware that locks system operations until a ransom is paid.

Although the House and Senate legislation cleared several hurdles, it did not pass Congress in 2021. However, we expect a renewed push for incident reporting, or other legislation to address ransomware, in 2022 and beyond.

A more collaborative, whole-of-government approach

The Biden Administration characterized ransomware as an economic and national security concern relatively early on and has detailed numerous federal efforts to counter it. We have also seen a marked increase in both international government and law enforcement cooperation, and public-private collaboration to identify, prosecute, and disrupt ransomware criminals, and address their safe harbors. In addition to the above, recent efforts have included:

  • In April 2021, the Department of Justice (DOJ) created a Digital Extortion Task Force, and in June elevated ransomware to be a priority on par with terrorism.
  • In June 2021, the US government attended the G7 Summit and discussed ransomware, making a commitment “to work together to urgently address the escalating shared threat from criminal ransomware networks.” They went on to “call on all states to urgently identify and disrupt ransomware criminal networks operating from within their borders, and hold those networks accountable for their actions.”
  • Also in June 2021, ransomware was discussed during the EU-US Justice and Home Affairs Ministerial Meeting, with commitments made to work together to combat “ransomware including through law enforcement action, raising public awareness on how to protect networks as well as the risk of paying the criminals responsible, and to encourage those states that turn a blind eye to this crime to arrest and extradite or effectively prosecute criminals on their territory.”
  • In August 2021, the Cybersecurity and Infrastructure Security Agency (CISA) announced the formation of the Joint Cyber Defense Collaborative (JCDC) to “integrate unique cyber capabilities across multiple federal agencies, many state and local governments, and countless private sector entities.”
  • In August 2021, the White House announced the voluntary Industrial Control System Cybersecurity Initiative to strengthen the resilience of critical infrastructure against ransomware.
  • In September 2021, NIST issued a ransomware risk management profile for its Cybersecurity Framework.
  • In October 2021, the White House hosted a Counter Ransomware Initiative Meeting, bringing together governments from 30 nations around the world “to discuss the escalating global security threat from ransomware” and identify potential solutions.
  • Also in October 2021, a group of international law enforcement agencies and private sector experts collaborated to force ransomware group REvil offline.
  • In November 2021, the US Department of Justice announced the arrest of three ransomware actors, charges against a fourth, and the “seizure of $6.1 million in funds traceable to alleged ransom payments.” It attributed these successes to “the culmination of close collaboration with our international, US government, and especially our private-sector partners.”
  • Collaboration by multiple federal agencies to produce the StopRansomware site, which provides basic resources on what ransomware is, how to reduce risks, and how to report an incident or request assistance.
  • Ongoing work of senior policymakers such as Deputy Attorney General Lisa Monaco, as well as federal agencies such as CISA and the FBI, to keep up a steady flow of timely alerts about the threat of ransomware and the need for public and private-sector collaboration to fight it.

Ransomware brings security center-stage

For years, it was arguable that most policymakers did not “get” the need for cybersecurity. Now the landscape has changed significantly, with ransomware and nation-state competition driving the renewed sense of urgency. Given the seriousness, persistence, and widespread nature of the ransomware threat, Rapid7 supports new measures to detect and mitigate these attacks. These trends do not seem likely to abate soon, and we expect regulatory activity and information sharing on cybersecurity to be driven by ransomware for some time to come.

Additional reading:

NEVER MISS A BLOG

Get the latest stories, expertise, and news about security today.

Landscape of API Traffic

Post Syndicated from Daniele Molteni original https://blog.cloudflare.com/landscape-of-api-traffic/

Landscape of API Traffic

Landscape of API Traffic

In recent years we have witnessed an explosion of Internet-connected applications. Whether it is a new mobile app to find your soulmate, the latest wearable to monitor your vitals, or an industrial solution to detect corrosion, our life is becoming packed with connected systems.

How is the Internet changing because of this shift? This blog provides an overview of how Internet traffic is evolving as Application Programming Interfaces (APIs) have taken the centre stage among the communication technologies. With help from the Cloudflare Radar team, we have harnessed the data from our global network to provide this snapshot of global APIs in 2021.

The huge growth in API traffic comes at a time when Cloudflare has been introducing new technologies that protect applications from nascent threats and vulnerabilities. The release of API Shield with API Discovery, Schema Validation, mTLS and API Abuse Detection has provided customers with a set of tools designed to protect their applications and data based on how APIs work and their challenges.

We are also witnessing increased adoption of new protocols. Among encryption protocols, for example, TLS v1.3 has become the most used protocol for APIs on Cloudflare while, for transport protocols, we saw an uptake of QUIC and gRPC (Cloudflare support announced in 2018 and 2020 respectively).

In the following sections we will quantify the growth of APIs and identify key industries affected by this shift. We will also look at the data to better understand the source and type of traffic we see on our network including how much malicious traffic our security systems block.

Why is API use exploding?

By working closely with our customers and observing the broader trends and data across our network in application security, we have identified three main trends behind API adoption: how applications are built is changing, API-first businesses are thriving, and finally machine-to-machine and human-to-machine communication is evolving.

During the last decade, APIs became popular because they allowed developers to separate backend and frontend, thus creating applications with better user experience. The Jamstack architecture is the most recent trend highlighting this movement, where technologies such as JavaScript, APIs and markup are being used to create responsive and high-performance applications. The growth of microservices and serverless architectures are other drivers behind using efficient HTTP-powered application interfaces.

APIs are also enabling companies to innovate their business models. Across many industries there is a trend of modularizing complex processes by integrating self-contained workflows and operations. The product has become the service delivered via APIs, allowing companies to scale and monetize their new capabilities. Financial Services is a prime example where a monolithic industry with vertically integrated service providers is giving way to a more fragmented landscape. The new Open Banking standard (PSD2) is an example of how small companies can provide modular financial services that can be easily integrated into larger applications. Companies like TrueLayer have productized APIs, allowing e-commerce organizations to onboard new sellers to a marketplace within seconds or to deliver more efficient payment options for their customers. A similar shift is happening in the logistics industry as well, where Shippo allows the same e-commerce companies to integrate with services to initiate deliveries, print labels, track goods and streamline the returns process. And of course, everything is powered by APIs.

Finally, the increase of connected devices such as wearables, sensors and robots are driving more APIs, but another aspect of this is the way manual and repetitive tasks are being automated. Infrastructure-as-Code is an example of relying on APIs to replace manual processes that have been used to manage Internet Infrastructure in the past. Cloudflare is itself a product of this trend as our solutions allow customers to use services like Terraform to configure how their infrastructure should work with our products.

Labelling traffic

The data presented in the following paragraphs is based on the total traffic proxied by Cloudflare and traffic is classified according to the Content-Type header generated in the response phase. Only requests returning a 200 response were included in the analysis except for the analysis in the ‘Security’ section where other error codes were included. Traffic generated by identified bots is not included.

When looking at trends, we compare data from the first week of February 2021 to the first week of December 2021. We chose these dates to compare how traffic changed over the year but excluding January which is affected by the holiday season.

Specifically, API traffic is labelled based on responses with types equal application/json, application/xml, and text/xml, while Web accounts for text/html, application/x-javascript, application/javascript, text/css, and text/javascript. Requests categorised as Text are text/plain; Binary are application/octet-stream; Media includes all image types, video and audio.

Finally, Other catches everything that doesn’t clearly fall into the labels above, which includes empty and unknown. Part of this traffic might be API and the categorisation might be missing due to the client or server not adding a Content-Type header.

API use in 2021

We begin by examining the current state of API traffic at our global network and the types of content served. During the first week of December 2021, API calls represented 54% of total requests, up from 52% during the first week of February 2021.

Landscape of API Traffic

When looking at individual data types, API was by far the fastest growing data type (+21%) while Web only grew by 10%. Media (such as images and videos) grew just shy of 15% while binary was the only traffic that in aggregate experienced a reduction of 6%.

Landscape of API Traffic

In summary, APIs have been one of the drivers of the traffic growth experienced by the Cloudflare network in 2021. APIs account for more than half of the total traffic generated by end users and connected devices, and they’re growing twice as fast as traditional web traffic.

New industries are contributing to this increase

We analysed where this growth comes from in terms of industry and application types. When looking at the total volume of API traffic, unsurprisingly the general Internet and Software industry accounts for almost 40% of total API traffic in 2021. The second-largest industry in terms of size is Cryptocurrency (7% of API traffic) followed by Banking and Retail (6% and 5% of API traffic respectively).

The following chart orders industries according to their API traffic growth. Banking, Retail and Financial Services have experienced the largest year-on-year growth with 70%, 51% and 50% increases since February 2021, respectively.

Landscape of API Traffic

The growth of Banking and Financial Services traffic is aligned with the trends we have observed anecdotally in the sector. The industry has seen the entrance of a number of new platforms that aggregate accounts from different providers, streamline transactions, or allow investing directly from apps, all of which rely heavily on APIs. The new “challenger banks” movement is an example where newer startups are offering captivating mobile services based on APIs while putting pressure on larger institutions to modernise their infrastructure and applications.

A closer look at the API characteristics

Generally speaking, a RESTful API request is a call to invoke a function. It includes the address of a specific resource (the endpoint) and the action you want to perform on that resource (method). A payload might be present to carry additional data and HTTP headers might be populated to add information about the origin of the call, what software is requesting data, requisite authentication credentials, etc. The method (or verb) expresses the action you want to perform, such as retrieve information (GET) or update information (POST).

It’s useful to understand the composition and origin of API traffic, such as the most commonly used methods, the most common protocol used to encode the payload, or what service generates traffic (like Web, mobile apps, or IoT). This information will help us identify the macro source of vulnerabilities and design and deploy the best tools to protect traffic.

Methods

The vast majority of API traffic is the result of POST or GET requests (98% of all requests). POST itself accounts for 53.4% of all requests and GET 44.4%. Generally speaking, GET tends to transfer sensitive data in the HTTP request header, query and in the response body, while POST typically transfers data in the request header and body. While many security tools apply to both of these types of calls, this distinction can be useful when deploying tools such as API Schema Validation (request and response) or Data Loss Prevention/Sensitive Data Detection (response), both launched by Cloudflare in March 2021.

Landscape of API Traffic

Payload encoding review

API payloads encode data using different rules and languages that are commonly referred to as transport protocols. When looking at the breakdown between two of the most common protocols, JSON has by far the largest number of requests (~97%) while XML has a smaller share of requests as it still carries the heaviest traffic. In the following figure, JSON and XML are compared in terms of response sizes. XML is the most verbose protocol and the one handling the largest payloads while JSON is more compact and results in smaller payloads.

Landscape of API Traffic

Since we have started supporting gRPC (September 2020), we have seen a steady increase in gRPC traffic and many customers we speak with are in the planning stages of migrating from JSON to gRPC, or designing translation layers at the edge from external JSON callers to internal gRPC services.

Source of API traffic

We can look at the HTTP request headers to better understand the origin and intended use of the API. The User-Agent header allows us to identify what type of client made the call, and we can divide it into three broader groups: “browser”, “non-browser” and “unknown” (which indicates that the User-Agent header was not set).

About 38% of API calls are made by browsers as part of a web application built on top of backend APIs. Here, the browser loads an HTML page and populates dynamic fields by generating AJAX API calls against the backend service. This paradigm has become the de-facto standard as it provides an effective way to build dynamic yet flexible Web applications.

The next 56% comes from non-browsers, including mobile apps and IoT devices with a long tail of different types (wearables, connected sport equipment, gaming platforms and more). Finally, approximately 6% are “unknown” and since well-behaving browsers and tools like curl send a User-Agent by default, one could attribute much of this unknown to programmatic or automated tools, some of which could be malicious.

Landscape of API Traffic

Encryption

A key aspect of securing APIs against snooping and tampering is encrypting the session. Clients use SSL/TLS to authenticate the server they are connecting with, for example, by making sure it is truly their cryptocurrency vendor. The benefit of transport layer encryption is that after handshaking, all application protocol bytes are encrypted, providing both confidentiality and integrity assurances.

Cloudflare launched the latest version of TLS (v1.3) in September 2016, and it was enabled by default on some properties in May 2018. When looking at API traffic today, TLS v1.3 is the most adopted protocol with 55.9% of traffic using it. The vulnerable v1.0  and v1.1 were deprecated in March 2021 and their use has virtually disappeared.

Transport security protocol December 2021
TLS 1.3 55.9%
TLS 1.2 32.7%
QUIC 8.4%
None 2.8%
TLS 1.0 0.3%

The protocol that is growing fastest is QUIC. While QUIC can be used to carry many types of application protocols, Cloudflare has so far focused on HTTP/3, the mapping of HTTP over IETF QUIC. We started supporting draft versions of QUIC in 2018 and when QUIC version 1 was published as RFC 9000 in May 2021, we enabled it for everyone the next day. QUIC uses the TLS 1.3 handshake but has its own mechanism for protecting and securing packets. Looking at HTTP-based API traffic, we see HTTP/3 going from less than 3% in early February 2021 to more than 8% in December 2021. This growth broadly aligns RFC 9000 being published and during the periodHTTP/3 support being stabilized and enabled in a range of client implementations.

Mutual TLS, which is often used for mobile or IoT devices, accounts for 0.3% of total API traffic. Since we released the first version of mTLS in 2017 we’ve seen a growing number of inquiries from users across all Cloudflare plans, as we have recently made it easier for customers to start using mTLS with Cloudflare API Shield. Customers can now use Cloudflare dashboard to issue and manage certificates with one-click avoiding all the complexity of having to manage a Private Key Infrastructure and root certificates themselves.

Finally, unencrypted traffic can provide a great opportunity for attackers to access plain communications. The total unencrypted API traffic dropped from 4.6% of total requests in early 2021 to 2.6% in December 2021. This represents a significant step forward in establishing basic security for all API connections.

Security

Given the huge amount of traffic that Cloudflare handles every second, we can look for trends in blocked traffic and identify common patterns in threats or attacks.

When looking at the Cloudflare security systems, an HTML request is twice as likely to be blocked than an API request. Successful response codes (200, 201, 301 and 302) account for 91% of HTML and 97% of API requests, while 4XX error codes (like 400, 403, 404) are generated for 2.8% of API calls as opposed to 7% of HTML. Calls returning 5XXs codes (such as Internal Server Error, Bad Gateway, Service Unavailable) are almost nonexistent for APIs (less than 0.2% of calls) while are almost 2% of requests for HTML.

The relatively larger volume of unmitigated API requests can be explained by the automated nature of APIs, for example more API calls are generated in order to render a page that would require a single HTML request. Malicious or malformed requests are therefore diluted in a larger volume of calls generated by well-behaving automated systems.

Landscape of API Traffic

We can further analyse the frequency of specific error codes to get a sense of what the most frequent malformed (and possibly malicious) requests are. In the following figure, we plot the share of a particular error code when compared to all 4XXs.

Landscape of API Traffic

We can identify three groups of issues all equally likely (excluding the more obvious “404 Not Found” case): “400 Bad Request” (like malformed, invalid request), “429 Too Many Requests” (“Rate Limiting”), and the combination of Authentication and Authorization issues (“403 Forbidden” and “401 Unauthorized”). Those codes are followed by a long tail of other errors, including “422 Unprocessable Entity”, “409 Conflict”, and “402 Payment Required”.

This analysis confirms that the most common attacks rely on sending non-compliant requests, brute force efforts (24% of generated 4XXs are related to rate limiting), and accessing resources with invalid authentication or permission.

We can further analyse the reason why calls were blocked (especially relative to the 400s codes) by looking at what triggered the Cloudflare WAF. The OWASP and the Cloudflare Managed Ruleset are tools that scan incoming traffic looking for fingerprints of known vulnerabilities (such as SQLi, XSS, etc.) and they can provide context on what attack was detected.

A portion of the blocked traffic has triggered a managed rule for which we can identify the threat category. Although a malicious request can match multiple categories, the WAF assigns it to the first threat that is identified. User-Agent anomaly is the most common reason why traffic is blocked. This is usually triggered by the lack of or by a malformed User-Agent header, capturing requests that do not provide enough credible information on what type of client has sent the request. The next most common threat is cross-site scripting. After these two categories, there is a long tail of other anomalies that were identified.

Landscape of API Traffic

Conclusions

More than one out of two requests we process is an API call, and industries such as Banking, Retail and Financial Services are leading in terms of adoption and growth.

Furthermore, API calls are growing twice as fast as HTML traffic, making it an ideal candidate for new security solutions aimed at protecting customer data.

The collective thoughts of the interwebz