Post Syndicated from The Atlantic original https://www.youtube.com/watch?v=H0No6x5FYGo
A Conversation With Rosario Dawson About Hulu’s "Dopesick"
Post Syndicated from The Atlantic original https://www.youtube.com/watch?v=0EwpNUvyot8
Field Notes: How to Prepare Large Text Files for Processing with Amazon Translate and Amazon Comprehend
Post Syndicated from Veeresh Shringari original https://aws.amazon.com/blogs/architecture/field-notes-how-to-prepare-large-text-files-for-processing-with-amazon-translate-and-amazon-comprehend/
Biopharmaceutical manufacturing is a highly regulated industry where deviation documents are used to optimize manufacturing processes. Deviation documents in biopharmaceutical manufacturing processes are geographically diverse, spanning multiple countries and languages. The document corpus is complex, with additional requirements for complete encryption. Therefore, to reduce downtime and increase process efficiency, it is critical to automate the ingestion and understanding of deviation documents. For this workflow, a large biopharma customer needed to translate and classify documents at their manufacturing site.
The customer’s challenge included translation and classification of paragraph-sized text documents into statement types. First, the tokenizer previously used was failing for certain languages. Second, post-tokenization, big paragraphs were needed to be sliced into sizes smaller than 5,000 bytes to facilitate consumption into Amazon Translate and Amazon Comprehend. Because each sentence and paragraphs were of differing sizes, the customer needed to slice them so that each sentence and paragraph did not lose their context and meaning.
This blog post describes a solution to tokenize text documents into appropriate-sized chunks for easy consumption by Amazon Translate and Amazon Comprehend.
Overview of solution
The solution is divided into the following steps. Text data coming from the AWS Glue output is transformed and stored in Amazon Simple Storage Service (Amazon S3) in a .txt file. This transformed data is passed into the sentence tokenizer with slicing and encryption using AWS Key Management Service (AWS KMS). This data is now ready to be fed into Amazon Translate and Amazon Comprehend, and then to a Bidirectional Encoder Representations from Transformers (BERT) model for clustering. All of the models are developed and managed in Amazon SageMaker.
Prerequisites
For this walkthrough, you should have the following prerequisites:
- An AWS account
- SageMaker
- Amazon S3
- Amazon Comprehend
- Amazon Translate
- Amazon CloudWatch enabled
The architecture in Figure 1 shows a complete document classification and clustering workflow running the sentence tokenizer solution (step 4) as an input to Amazon Translate and Amazon Comprehend. The complete architecture also uses AWS Glue crawlers, Amazon Athena, Amazon S3 , AWS KMS, and SageMaker.

Figure 1. Higher level architecture describing use of the tokenizer in the system
Solution steps
- Ingest the streaming data from the daily pharma supply chain incidents from the AWS Glue crawlers and Athena-based view tables. AWS Glue is used for ETL (extract, transform, and load), while Athena helps to analyze the data in Amazon S3 for its integrity.
- Ingest the streaming data into Amazon S3, which is AWS KMS encrypted. This limits any unauthorized access to the secured files, as required for the healthcare domain.
- Enable the CloudWatch logs. CloudWatch logs help to store, monitor, and access error messages logged by SageMaker.
- Open the SageMaker notebook using AWS console, and navigate to the integrated development environment (IDE) with Python notebook.
Solution description
Initialize the Amazon S3 client, and enable the get_execution role.

Figure 2. Code sample to initialize Amazon S3 Client execution roles
Figure 3 shows the code for tokenizing large paragraphs into sentences. This helps to feed a sentence of 5,000 byte chunks to Amazon Translate and Amazon Comprehend. Additionally, in the regulated environment, data at rest and in transition, is encrypted using AWS KMS (using S3 IO object) before chunking into 5,000-byte size files using last-in-first-out (LIFO) process.

Figure 3. Code sample with file chunking function and AWS KMS encryption
Figure 4 shows the function for writing the file chunks to objects in Amazon S3, and objects are AWS KMS encrypted.

Figure 4. Code sample for writing chunked 5,000-byte sized data to Amazon S3
Code sample
The following example code details the tokenizer and chunking tool which we subsequently run through SageMaker:
https://gitlab.aws.dev/shringv/aws-samples-aws-tokenizer-slicing-file
Cleaning up
To avoid incurring future charges, delete the resources (like S3 objects) used for the practice files after you have completed implementation of the solution.
Conclusion
In this blog post, we presented a solution which incorporates sentence-level tokenization with rules governing expected sentence size. The solution includes automation scripts to reduce bigger files into smaller chunked sizes of 5,000 bytes to facilitate Amazon Translate and Amazon Comprehend. The solution is effective for tokenizing and chunking complex environments with multi-language files. Furthermore, the solution uses file exchange security by using AWS KMS, as required by regulated industries.
Field Notes provides hands-on technical guidance from AWS Solutions Architects, consultants, and technical account managers, based on their experiences in the field solving real-world business problems for customers.
AWS achieves FedRAMP P-ATO for 18 additional services in the AWS US East/West and AWS GovCloud (US) Regions
Post Syndicated from Alexis Robinson original https://aws.amazon.com/blogs/security/aws-achieves-fedramp-p-ato-for-18-additional-services-in-the-aws-us-east-west-and-aws-govcloud-us-regions/
We’re pleased to announce that 18 additional AWS services have achieved Provisional Authority to Operate (P-ATO) by the Federal Risk and Authorization Management Program (FedRAMP) Joint Authorization Board (JAB). The following are the 18 additional services with FedRAMP authorization for the US federal government, and organizations with regulated workloads:
- Amazon Cognito lets you add user sign-up, sign-in, and access control to their web and mobile apps quickly and easily.
- Amazon Comprehend Medical is a HIPAA-eligible natural language processing (NLP) service that uses machine learning to extract health data from medical text–no machine learning experience is required.
- Amazon Elastic Kubernetes Service (Amazon EKS) is a managed container service that gives you the flexibility to start, run, and scale Kubernetes applications in the AWS cloud or on-premises.
- Amazon Pinpoint is a flexible and scalable outbound and inbound marketing communications service.
- Amazon QuickSight is a scalable, serverless, embeddable, machine learning-powered business intelligence (BI) service built for the cloud that lets you easily create and publish interactive BI dashboards that include Machine Learning-powered insights.
- Amazon Simple Email Service (Amazon SES) is a cost-effective, flexible, and scalable email service that enables developers to send mail from within any application.
- Amazon Textract is a machine learning service that automatically extracts text, handwriting, and other data from scanned documents that goes beyond simple optical character recognition (OCR) to identify, understand, and extract data from forms and tables.
- AWS Backup enables you to centralize and automate data protection across AWS services.
- AWS CloudHSM is a cloud-based hardware security module (HSM) that enables you to easily generate and use your own encryption keys on the AWS Cloud.
- AWS CodePipeline is a fully managed continuous delivery service that helps you automate your release pipelines for fast and reliable application and infrastructure updates.
- AWS Ground Station is a fully managed service that lets you control satellite communications, process data, and scale your operations without having to worry about building or managing your own ground station infrastructure.
- AWS OpsWorks for Chef Automate and AWS OpsWorks for Puppet Enterprise. AWS OpsWorks for Chef Automate provides a fully managed Chef Automate server and suite of automation tools that give you workflow automation for continuous deployment, automated testing for compliance and security, and a user interface that gives you visibility into your nodes and node statuses. AWS OpsWorks for Puppet Enterprise is a fully managed configuration management service that hosts Puppet Enterprise, a set of automation tools from Puppet for infrastructure and application management.
- AWS Personal Health Dashboard provides alerts and guidance for AWS events that might affect your environment, and provides proactive and transparent notifications about your specific AWS environment.
- AWS Resource Groups grants you the ability to organize your AWS resources, and manage and automate tasks on large numbers of resources at one time.
- AWS Security Hub is a cloud security posture management service that performs security best practice checks, aggregates alerts, and enables automated remediation.
- AWS Storage Gateway is a set of hybrid cloud storage services that gives you on-premises access to virtually unlimited cloud storage.
- AWS Systems Manager provides a unified user interface so you can track and resolve operational issues across your AWS applications and resources from a central place.
- AWS X-Ray helps developers analyze and debug production, distributed applications, such as those built using a microservices architecture.
The following services are now listed on the FedRAMP Marketplace and the AWS Services in Scope by Compliance Program page.
Service authorizations by Region
| Service | FedRAMP Moderate in AWS US East/West | FedRAMP High in AWS GovCloud (US) |
| Amazon Cognito | ✓ | |
| Amazon Comprehend Medical | ✓ | ✓ |
| Amazon Elastic Kubernetes Service (Amazon EKS) | ✓ | |
| Amazon Pinpoint | ✓ | |
| Amazon QuickSight | ✓ | |
| Amazon Simple Email Service (Amazon SES) | ✓ | |
| Amazon Textract | ✓ | ✓ |
| AWS Backup | ✓ | ✓ |
| AWS CloudHSM | ✓ | |
| AWS CodePipeline | ✓ | ✓ |
| AWS Ground Station | ✓ | |
| ✓ | ||
| AWS Personal Health Dashboard | ✓ | ✓ |
| AWS Resource Groups | ✓ | |
| AWS Security Hub | ✓ | |
| AWS Storage Gateway | ✓ | ✓ |
| AWS Systems Manager | ✓ | ✓ |
| AWS X-Ray | ✓ | ✓ |
AWS is continually expanding the scope of our compliance programs to help customers use authorized services for sensitive and regulated workloads. Today, AWS offers 100 AWS services authorized in the AWS US East/West Regions under FedRAMP Moderate Authorization, and 90 services authorized in the AWS GovCloud (US) Regions under FedRAMP High Authorization.
To learn what other public sector customers are doing on AWS, see our Customer Success Stories page. For up-to-date information when new services are added, see our AWS Services in Scope by Compliance Program page.
If you have feedback about this post, submit comments in the Comments section below.
Want more AWS Security how-to content, news, and feature announcements? Follow us on Twitter.
New – Amazon Genomics CLI Is Now Open Source and Generally Available
Post Syndicated from Danilo Poccia original https://aws.amazon.com/blogs/aws/new-amazon-genomics-cli-is-now-open-source-and-generally-available/
Less than 70 years separate us from one of the greatest discoveries of all time: the double helix structure of DNA. We now know that DNA is a sort of a twisted ladder composed of four types of compounds, called bases. These four bases are usually identified by an uppercase letter: adenine (A), guanine (G), cytosine (C), and thymine (T). One of the reasons for the double helix structure is that when these compounds are at the two sides of the ladder, A always bonds with T, and C always bonds with G.
If we unroll the ladder on a table, we’d see two sequences of “letters”, and each of the two sides would carry the same genetic information. For example, here are two series (AGCT and TCGA) bound together:
These series of letters can be very long. For example, the human genome is composed of over 3 billion letters of code and acts as the biological blueprint of every cell in a person. The information in a person’s genome can be used to create highly personalized treatments to improve the health of individuals and even the entire population. Similarly, genomic data can be use to track infectious diseases, improve diagnosis, and even track epidemics, food pathogens and toxins. This is the emerging field of environmental genomics.
Accessing genomic data requires genome sequencing, which with recent advances in technology, can be done for large groups of individuals, quickly and more cost-effectively than ever before. In the next five years, genomics datasets are estimated to grow and contain more than a billion sequenced genomes.
How Genomics Data Analysis Works
Genomics data analysis uses a variety of tools that need to be orchestrated as a specific sequence of steps, or a workflow. To facilitate developing, sharing, and running workflows, the genomics and bioinformatics communities have developed specialized workflow definition languages like WDL, Nextflow, CWL, and Snakemake.
However, this process generates petabytes of raw genomic data and experts in genomics and life science struggle to scale compute and storage resources to handle data at such massive scale.
To process data and provide answers quickly, cloud resources like compute, storage, and networking need to be configured to work together with analysis tools. As a result, scientists and researchers often have to spend valuable time deploying infrastructure and modifying open-source genomics analysis tools instead of making contributions to genomics innovations.
Introducing Amazon Genomics CLI
A couple of months ago, we shared the preview of Amazon Genomics CLI, a tool that makes it easier to process genomics data at petabyte scale on AWS. I am excited to share that the Amazon Genomics CLI is now an open source project and is generally available today. You can use it with publicly available workflows as a starting point and develop your analysis on top of these.
Amazon Genomics CLI simplifies and automates the deployment of cloud infrastructure, providing you with an easy-to-use command line interface to quickly setup and run genomics workflows on AWS. By removing the heavy lifting from setting up and running genomics workflows in the cloud, software developers and researchers can automatically provision, configure and scale cloud resources to enable faster and more cost-effective population-level genetics studies, drug discovery cycles, and more.
Amazon Genomics CLI lets you run your workflows on an optimized cloud infrastructure. More specifically, the CLI:
- Includes improvements to genomics workflow engines to make them integrate better with AWS, removing the burden to manually modify open-source tools and tune them to run efficiently at scale. These tools work seamlessly across Amazon Elastic Container Service (Amazon ECS), Amazon DynamoDB, Amazon Elastic File System (Amazon EFS), and Amazon Simple Storage Service (Amazon S3), helping you to scale compute and storage and at the same time optimize your costs using features like EC2 Spot Instances.
- Eliminates the most time-consuming tasks like provisioning storage and compute capacities, deploying the genomics workflow engines, and tuning the clusters used to execute workflows.
- Automatically increases or decreases cloud resources based on your workloads, which eliminates the risk of buying too much or too little capacity.
- Tags resources so that you can use tools like AWS Cost & Usage Report to understand the costs related to your genomics data analysis across multiple AWS services.
The use of Amazon Genomics CLI is based on these three main concepts:
Workflow – These are bioinformatics workflows written in languages like WDL or Nextflow. They can be either single script files or packages of multiple files. These workflow script files are workflow definitions and combined with additional metadata, like the workflow language the definition is written in, form a workflow specification that is used by the CLI to execute workflows on appropriate compute resources.
Context – A context encapsulates and automates time-consuming tasks to configure and deploy workflow engines, create data access policies, and tune compute clusters (managed using AWS Batch) for operation at scale.
Project – A project links together workflows, datasets, and the contexts used to process them. From a user perspective, it handles resources related to the same problem or used by the same team.
Let’s see how this works in practice.
Using Amazon Genomics CLI
I follow the instructions to install Amazon Genomics CLI on my laptop. Now, I can use the agc command to manage genomic workloads. I see the available options with:
The first time I use it, I activate my AWS account:
This creates the core infrastructure that Amazon Genomics CLI needs to operate, which includes an S3 bucket, a virtual private cloud (VPC), and a DynamoDB table. The S3 bucket is used for durable metadata, and the VPC is used to isolate compute resources.
Optionally, I can bring my own VPC. I can also use one of my named profiles for the AWS Command Line Interface (CLI). In this way, I can customize the AWS Region and the AWS account used by the Amazon Genomics CLI.
I configure my email address in the local settings. This wil be used to tag resources created by the CLI:
There are a few demo projects in the examples folder included by the Amazon Genomics CLI installation. These projects use different engines, such as Cromwell or Nextflow. In the demo-wdl-project folder, the agc-project.yaml file describes the workflows, the data, and the contexts for the Demo project:
---
name: Demo
schemaVersion: 1
workflows:
  hello:
    type:
      language: wdl
      version: 1.0
    sourceURL: workflows/hello
  read:
    type:
      language: wdl
      version: 1.0
    sourceURL: workflows/read
  haplotype:
    type:
      language: wdl
      version: 1.0
    sourceURL: workflows/haplotype
  words-with-vowels:
    type:
      language: wdl
      version: 1.0
    sourceURL: workflows/words
data:
  - location: s3://gatk-test-data
    readOnly: true
  - location: s3://broad-references
    readOnly: true
contexts:
  myContext:
    engines:
      - type: wdl
        engine: cromwell

  spotCtx:
    requestSpotInstances: true
    engines:
      - type: wdl
        engine: cromwell
For this project, there are four workflows (hello, read, words-with-vowels, and haplotype). The project has read-only access to two S3 buckets and can run workflows using two contexts. Both contexts use the Cromwell engine. One context (spotCtx) uses Amazon EC2 Spot Instances to optimize costs.
In the demo-wdl-project folder, I use the Amazon Genomics CLI to deploy the spotCtx context:
After a few minutes, the context is ready, and I can execute the workflows. Once started, a context incurs about $0.40 per hour of baseline costs. These costs don’t include the resources created to execute workflows. Those resources depend on your specific use case. Contexts have the option to use spot instances by adding the requestSpotInstances flag to their configuration.
I use the CLI to see the status of the contexts of the project:
Now, let’s look at the workflows included in this project:
The simplest workflow is hello. The content of the hello.wdl file is quite understandable if you know any programming language:
The hello workflow defines a single task (hello) that prints the output of a command. The task is executed on a specific container image (ubuntu:latest). The output is taken from standard output (stdout), the default file descriptor where a process can write output.
Running workflows is an asynchronous process. After submitting a workflow from the CLI, it is handled entirely in the cloud. I can run multiple workflows at a time. The underlying compute resources will automatically scale and I will be charged only for what I use.
Using the CLI, I start the hello workflow:
The workflow was successfully submitted, and the last line is the workflow execution ID. I can use this ID to reference a specific workflow execution. Now, I check the status of the workflow:
The hello workflow is still running. After a few minutes, I check again:
The workflow has terminated and is now complete. I look at the workflow logs:
In the logs, I find as expected the Hello Amazon Genomics CLI! message printed by workflow.
I can also look at the content of hello-stdout.log on S3 using the information in the log above:
It worked! Now, let’s look for at more complex workflows. Before I change project, I destroy the context for the Demo project:
In the gatk-best-practices-project folder, I list the available workflows for the project:
In the agc-project.yaml file, the gatk4-data-processing workflow points to a local directory with the same name. This is the content of that directory:
This workflow processes high-throughput sequencing data with GATK4, a genomic analysis toolkit focused on variant discovery.
The directory contains a MANIFEST.json file. The manifest file describes which file contains the main workflow to execute (there can be more than one WDL file in the directory) and where to find input parameters and options. Here’s the content of the manifest file:
In the gatk-best-practices-project folder, I create a context to run the workflows:
Then, I start the gatk4-data-processing workflow:
After a couple of hours, the workflow has terminated:
I look at the logs:
Results have been written to the S3 bucket created during the account activation. The name of the bucket is in the logs but I can also find it stored as a parameter by AWS Systems Manager. I can save it in an environment variable with the following command:
Using the AWS Command Line Interface (CLI), I can now explore the results on the S3 bucket and get the outputs of the workflow.
Before looking at the results, I remove the resources that I don’t need by stopping the context. This will destroy all compute resources, but retain data in S3.
Additional examples on configuring different contexts and running additional workflows are provided in the documentation on GitHub.
Availability and Pricing
Amazon Genomics CLI is an open source tool, and you can use it today in all AWS Regions with the exception of AWS GovCloud (US) and Regions located in China. There is no cost for using the AWS Genomics CLI. You pay for the AWS resources created by the CLI.
With the Amazon Genomics CLI, you can focus on science instead of architecting infrastructure. This gets you up and running faster, enabling research, development, and testing workloads. For production workloads that scale to several thousand parallel workflows, we can provide recommended ways to leverage additional Amazon services, like AWS Step Functions, just reach out to our account teams for more information.
— Danilo
137 AWS services achieve HITRUST certification
Post Syndicated from Sonali Vaidya original https://aws.amazon.com/blogs/security/137-aws-services-achieve-hitrust-certification/
We’re excited to announce that 137 Amazon Web Services (AWS) services are certified for the Health Information Trust Alliance (HITRUST) Common Security Framework (CSF) for the 2021 cycle.
The full list of AWS services that were audited by a third-party auditor and certified under HITRUST CSF is available on our Services in Scope by Compliance Program page. You can view and download our HITRUST CSF certification on demand through AWS Artifact.
AWS HITRUST CSF certification is available for customer inheritance
You don’t have to assess inherited controls for your HITRUST validated assessment, because AWS already has! You can deploy business solutions into AWS and inherit our HITRUST CSF certification, provided that you use only in-scope services and apply the controls detailed on the HITRUST website that you are responsible for implementing.
With the HITRUST certification, you, as an AWS customer, can tailor your security control baselines to a variety of factors—including, but not limited to, regulatory requirements and organization type. The HITRUST CSF is widely adopted by leading organizations in a variety of industries as part of their approach to security and privacy. Visit the HITRUST website for more information.
As always, we value your feedback and questions and are committed to helping you achieve and maintain the highest standard of security and compliance. Feel free to contact the team through AWS Compliance Contact Us. If you have feedback about this post, submit comments in the Comments section below.
Want more AWS Security how-to content, news, and feature announcements? Follow us on Twitter.
How NortonLifelock built a serverless architecture for real-time analysis of their VPN usage metrics
Post Syndicated from Madhu Nunna original https://aws.amazon.com/blogs/big-data/how-nortonlifelock-built-a-serverless-architecture-for-real-time-analysis-of-their-vpn-usage-metrics/
This post presents a reference architecture and optimization strategies for building serverless data analytics solutions on AWS using Amazon Kinesis Data Analytics. In addition, this post shows the design approach that the engineering team at NortonLifeLock took to build out an operational analytics platform that processes usage data for their VPN services, consuming petabytes of data across the globe on a daily basis.
NortonLifeLock is a global cybersecurity and internet privacy company that offers services to millions of customers for device security, and identity and online privacy for home and family. NortonLifeLock believes the digital world is only truly empowering when people are confident in their online security. NortonLifeLock has been an AWS customer since 2014.
For any organization, the value of operational data and metrics decreases with time. This lost value can equate to lost revenue and wasted resources. Real-time streaming analytics helps capture this value and provide new insights that can create new business opportunities.
AWS offers a rich set of services that you can use to provide real-time insights and historical trends. These services include managed Hadoop infrastructure services on Amazon EMR as well as serverless options such as Kinesis Data Analytics and AWS Glue.
Amazon EMR also supports multiple programming options for capturing business logic, such as Spark Streaming, Apache Flink, and SQL.
As a customer, it’s important to understand organizational capabilities, project timelines, business requirements, and AWS service best practices in order to define an optimal architecture from performance, cost, security, reliability, and operational excellence perspectives (the five pillars of the AWS Well-Architected Framework).
NortonLifeLock is taking a methodical approach to real-time analytics on AWS while using serverless technology to deliver on key business drivers such as time to market and total cost of ownership. In addition to NortonLifeLock’s implementation, this post provides key lessons learned and best practices for rapid development of real-time analytics workloads.
Business problem
NortonLifeLock offers a VPN product as a freemium service to users. Therefore, they need to enforce usage limits in real time to stop freemium users from using the service when their usage is over the limit. The challenge for NortonLifeLock is to do this in a reliable and affordable fashion.
NortonLifeLock runs its VPN infrastructure in almost all AWS Regions. Migrating to AWS from smaller hosting vendors has greatly improved user experience and VPN edge server performance, including a reduction in connection latency, time to connect and connection errors, faster upload and download speed, and more stability and uptime for VPN edge servers.
VPN usage data is collected by VPN edge servers and uploaded to backend stats servers every minute and persisted in backend databases. The usage information serves multiple purposes:
- Displaying how much data a device has consumed for the past 30 days.
- Enforcing usage limits on freemium accounts. When a user exhausts their free quota, that user is unable to connect through VPN until the next free cycle.
- Analyzing usage data by the internal business intelligence (BI) team based on time, marketing campaigns, and account types, and using this data to predict future growth, ability to retain users, and more.
Design challenge
NortonLifeLock had the following design challenges:
- The solution must be able to simultaneously satisfy both real-time and batch analysis.
- The solution must be economical. NortonLifeLock VPN has hundreds of thousands of concurrent users, and if a user’s usage information is persisted as it comes in, it results in tens of thousands of reads and writes per second and tens of thousands of dollars a month in database costs.
Solution overview
NortonLifeLock decided to split storage into two parts by storing usage data in Amazon DynamoDB for real-time access and in Amazon Simple Storage Service (Amazon S3) for analysis, which addresses real-time enforcement and BI needs. Kinesis Data Analytics aggregates and loads data to Amazon S3 and DynamoDB. With Amazon Kinesis Data Streams and AWS Lambda as consumers of Kinesis Data Analytics, the implementation of user and device-level aggregations was simplified.
To keep costs down, user usage data was aggregated by the hour and persisted in DynamoDB. This spread hundreds of thousands of writes over an hour and reduced DynamoDB cost by 30 times.
Although increasing aggregation might not be an option for other problem domains, it’s acceptable in this case because it’s not necessary to be precise to the minute for user usage, and it’s acceptable to calculate and enforce the usage limit every hour.
The following diagram illustrates the high-level architecture. The solution is broken into three logical parts:
- End-users – Real-time queries from devices to display current usage information (how much data is used daily)
- Business analysts – Query historical usage information through Amazon Athena to extract business insights
- Usage limit enforcement – Usage data ingestion and aggregation in real time
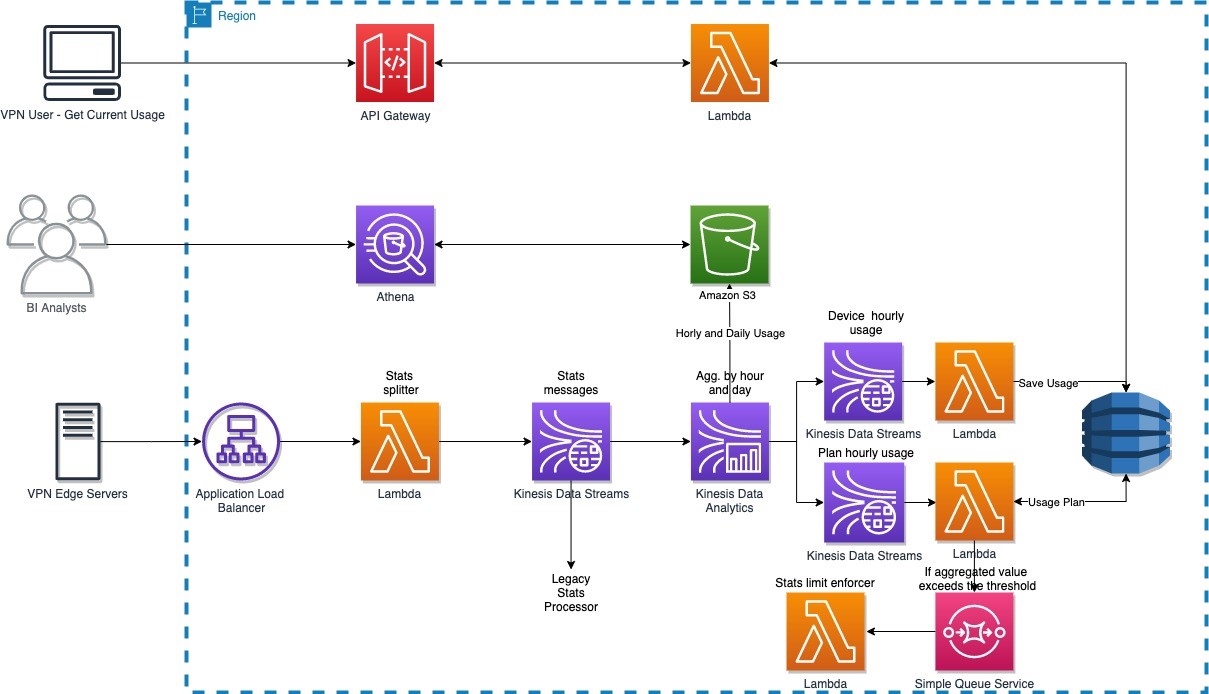
The solution has the following workflow:
- Usage data is collected by a VPN edge server and sends it to the backend service through Application Load Balancer.
- A single usage data record sent by the VPN edge server contains usage data for many users. A stats splitter splits the message into individual usage stats per user and forwards the message to Kinesis Data Streams.
- Usage data is consumed by both the legacy stats processor and the new Apache Flink application developed and deployed on Kinesis Data Analytics.
- The Apache Flink application carries out the following tasks:
- Aggregate device usage data hourly and send the aggregated result to Amazon S3 and the outgoing Kinesis data stream, which is picked up by a Lambda function that persists the usage data in DynamoDB.
- Aggregate device usage data daily and send the aggregated result to Amazon S3.
- Aggregate account usage data hourly and forward the aggregated results to the outgoing data stream, which is picked up by a Lambda function that checks if account usage is over the limit for that account. If account usage is over the limit, the function forwards the account information to another Lambda function, via Amazon Simple Queue Service (Amazon SQS), to cut off access on that account.
Design journey
NortonLifeLock needed a solution that was capable of real-time streaming and batch analytics. Kinesis Data Analysis fits this requirement because of the following key features:
- Real-time streaming and batch analytics for data aggregation
- Fully managed with a pay-as-you-go model
- Auto scaling
NortonLifeLock needed Kinesis Data Analytics to do the following:
- Aggregate customer usage data per device hourly and send results to Kinesis Data Streams (ultimately to DynamoDB) and the data lake (Amazon S3)
- Aggregate customer usage data per account hourly and send results to Kinesis Data Streams (ultimately to DynamoDB and Lambda, which enforces usage limit)
- Aggregate customer usage data per device daily and send results to the data lake (Amazon S3)
The legacy system processes usage data from an incoming Kinesis data stream, and they plan to use Kinesis Data Analytics to consume and process production data from the same stream. As such, NortonLifeLock started with SQL applications on Kinesis Data Analytics.
First attempt: Kinesis Data Analytics for SQL
Kinesis Data Analytics with SQL provides a high-level SQL-based abstraction for real-time stream processing and analytics. It’s configuration driven and very simple to get started. NortonLifeLock was able to create a prototype from scratch, get to production, and process the production load in less than 2 weeks. The solution met 90% of the requirements, and there were alternates for the remaining 10%.
However, they started to receive “read limit exceeded” alerts from the source data stream, and the legacy application was read throttled. With Amazon Support’s help, they traced the issues to the drastic reversal of the Kinesis Data Analytics MillisBehindLatest metric in Kinesis record processing. This was correlated to the Kinesis Data Analytics auto scaling events and application restarts, as illustrated by the following diagram. The highlighted areas show the correlation between spikes due to autoscaling and reversal of MillisBehindLatest metrics.
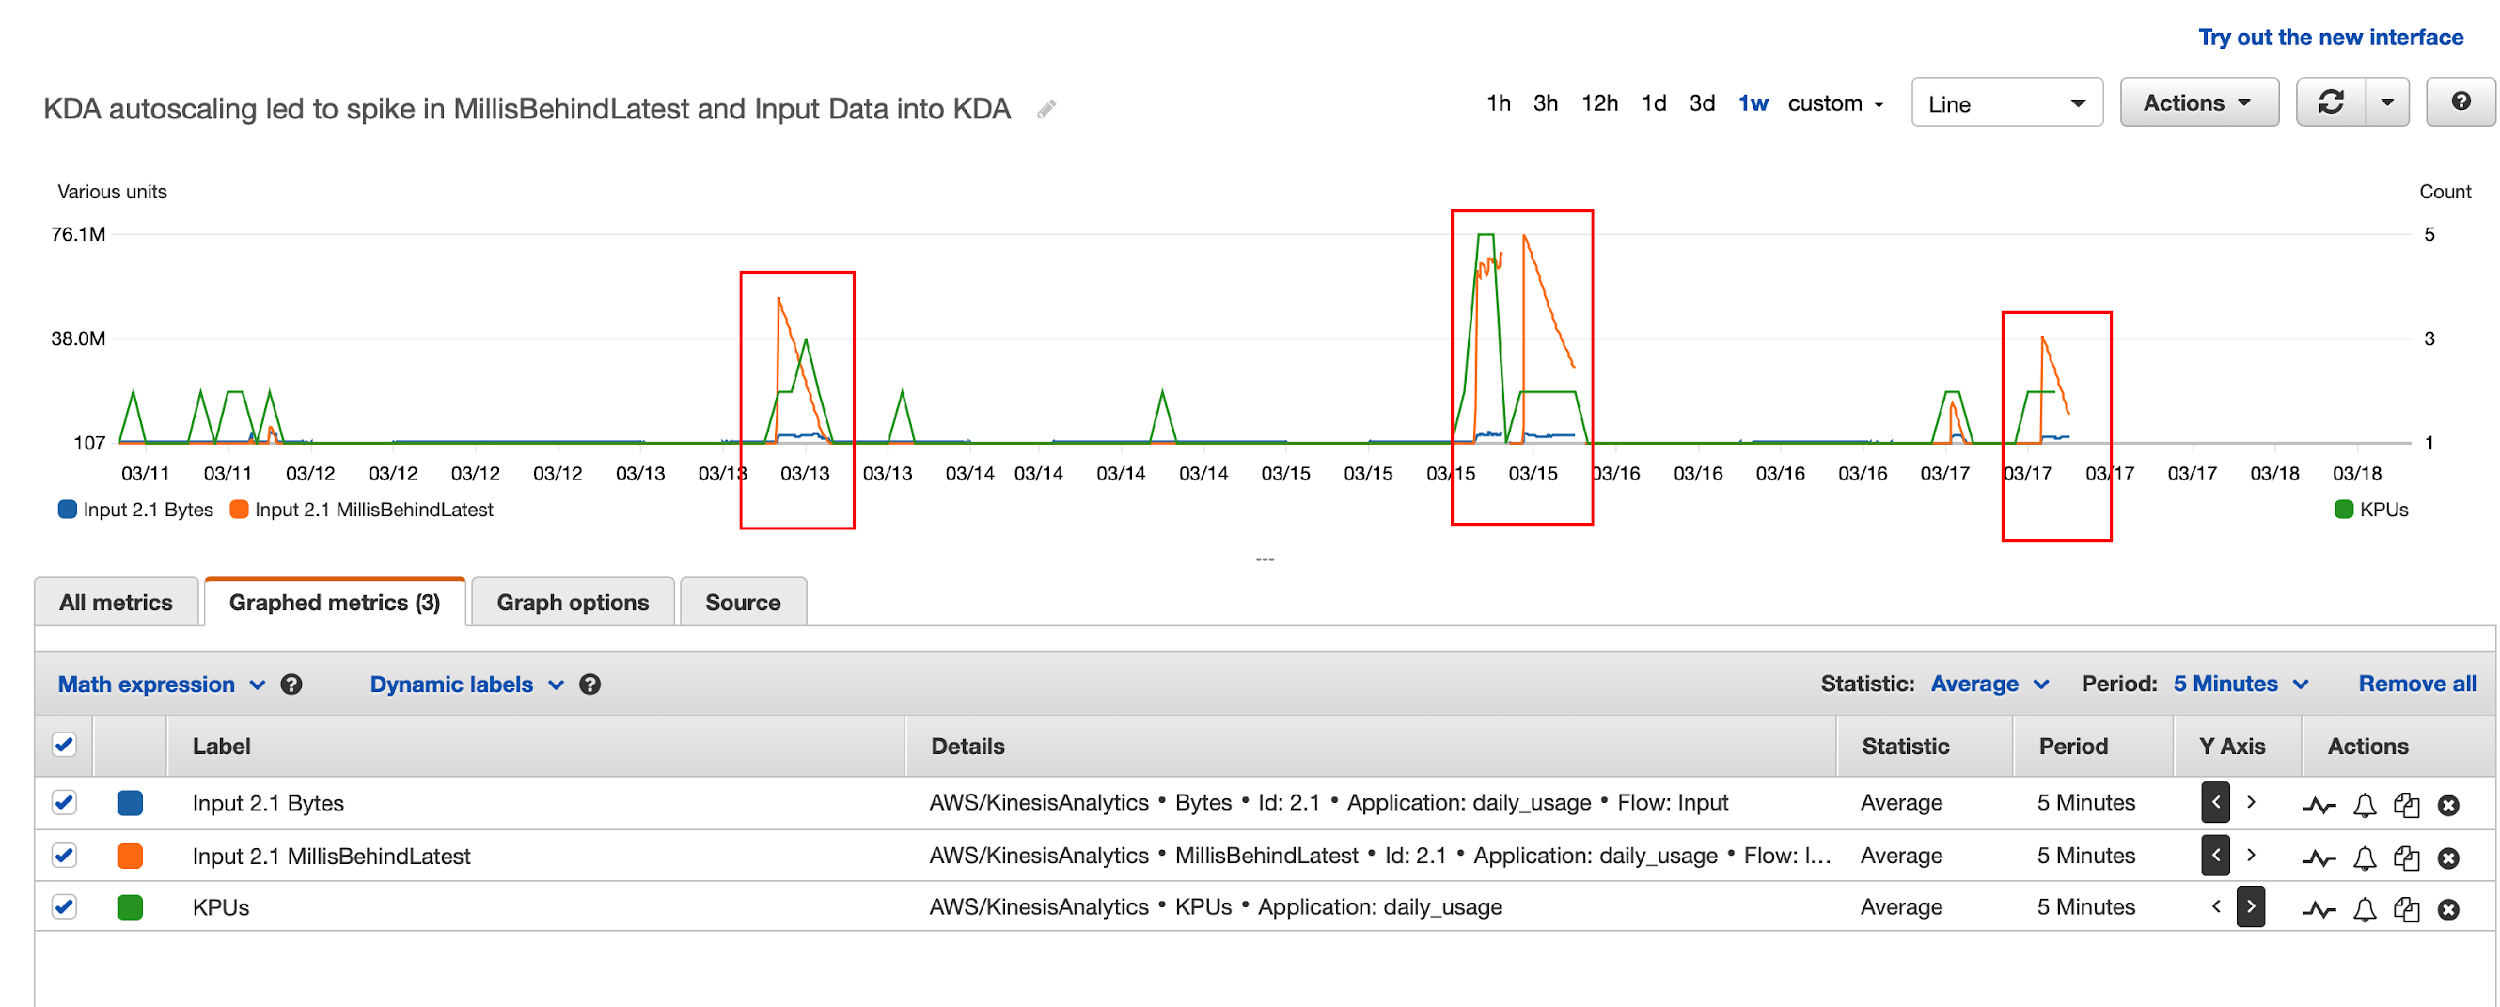
Here’s what happened:
- Kinesis Data Analytics for SQL scaled up KPU due to load automatically, and the Kinesis Data Analytics application was restarted (part of scaling up).
- Kinesis Data Analytics for SQL supports the at least once delivery model and uses checkpoints to ensure no data loss. But it doesn’t support taking a snapshot and restoring from the snapshot after a restart. For more details, see Delivery Model for Persisting Application Output to an External Destination.
- When the Kinesis Data Analytics for SQL application was restarted, it needed to reprocess data from the beginning of the aggregation window, resulting in a very large number of duplicate records, which led to a dramatic increase in the Kinesis Data Analytics
MillisBehindLatestmetric. - To catch up with incoming data, Kinesis Data Analytics started re-reading from the Kinesis data stream, which led to over-consumption of read throughput and the legacy application being throttled.
In summary, Kinesis Data Analytics for SQL’s duplicates record processing on restarts, no other means to eliminate duplicates, and limited ability to control auto scaling led to this issue.
Although they found Kinesis Data Analytics for SQL easy to get started, these limitations demanded other alternatives. NortonLifeLock reached out to the Kinesis Data Analytics team and discussed the following options:
- Option 1 – AWS was planning to release a new service, Kinesis Data Analytics Studio for SQL, Python, and Scala, which addresses these limitations. But this service was still a few months away (this service is now available, launched May 27, 2021).
- Option 2 – The alternative was to switch to Kinesis Data Analytics for Apache Flink, which also provides the necessary tools to address all their requirements.
Second attempt: Kinesis Data Analytics for Apache Flink
Apache Flink has a comparatively steep learning curve (we used Java for streaming analytics instead of SQL), and it took about 4 weeks to build the same prototype, deploy it to Kinesis Data Analytics, and test the application in production. NortonLifeLock had to overcome a few hurdles, which we document in this section along with the lessons learned.
Challenge 1: Too many writes to outgoing Kinesis data stream
The first thing they noticed was that the write threshold on the outgoing Kinesis data stream was greatly exceeded. Kinesis Data Analytics was attempting to write 10 times the amount of expected data to the data stream, with 95% of data throttled.
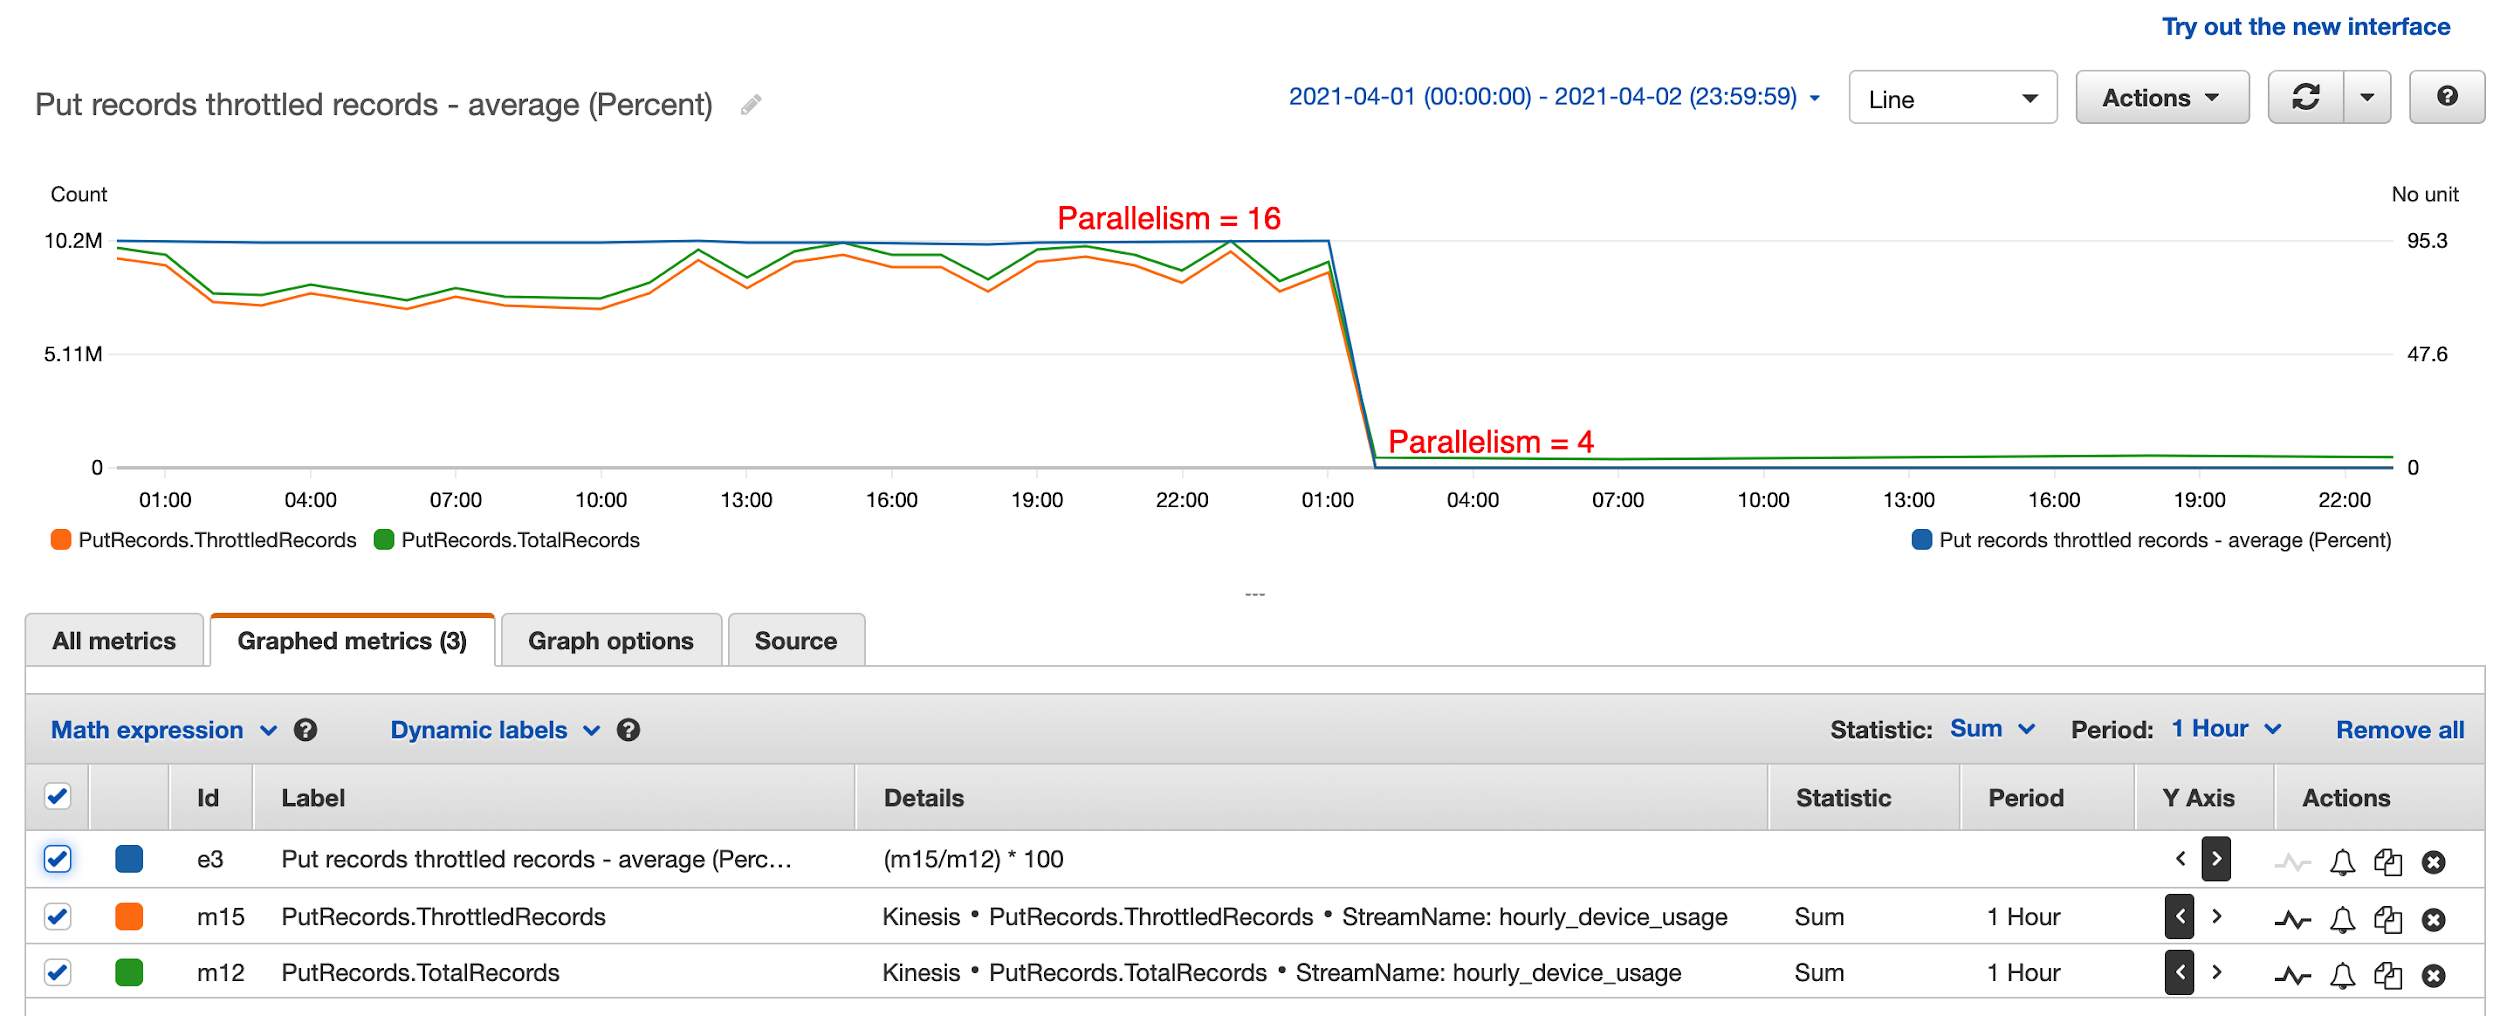
After a lengthy investigation, it turned out that having too much parallelism in the Kinesis Data Analytics application led to this issue. They had followed default recommendations and set parallelism to 12 and it scaled up to 16. This means that every hour, 16 separate threads were attempting to write to the destination data stream simultaneously, leading to massive contention and writes throttled. These threads attempted to retry continuously, until all records were written to the data stream. This resulted in 10 times the amount of data processing attempted, even though only one tenth of the writes eventually succeeded.
The solution was to reduce parallelism to 4 and disable auto scaling. In the preceding diagram, the percentage of throttled records dropped to 0 from 95% after they reduced parallelism to 4 in the Kinesis Data Analytics application. This also greatly improved KPU utilization and reduced Kinesis Data Analytics cost from $50 a day to $8 a day.
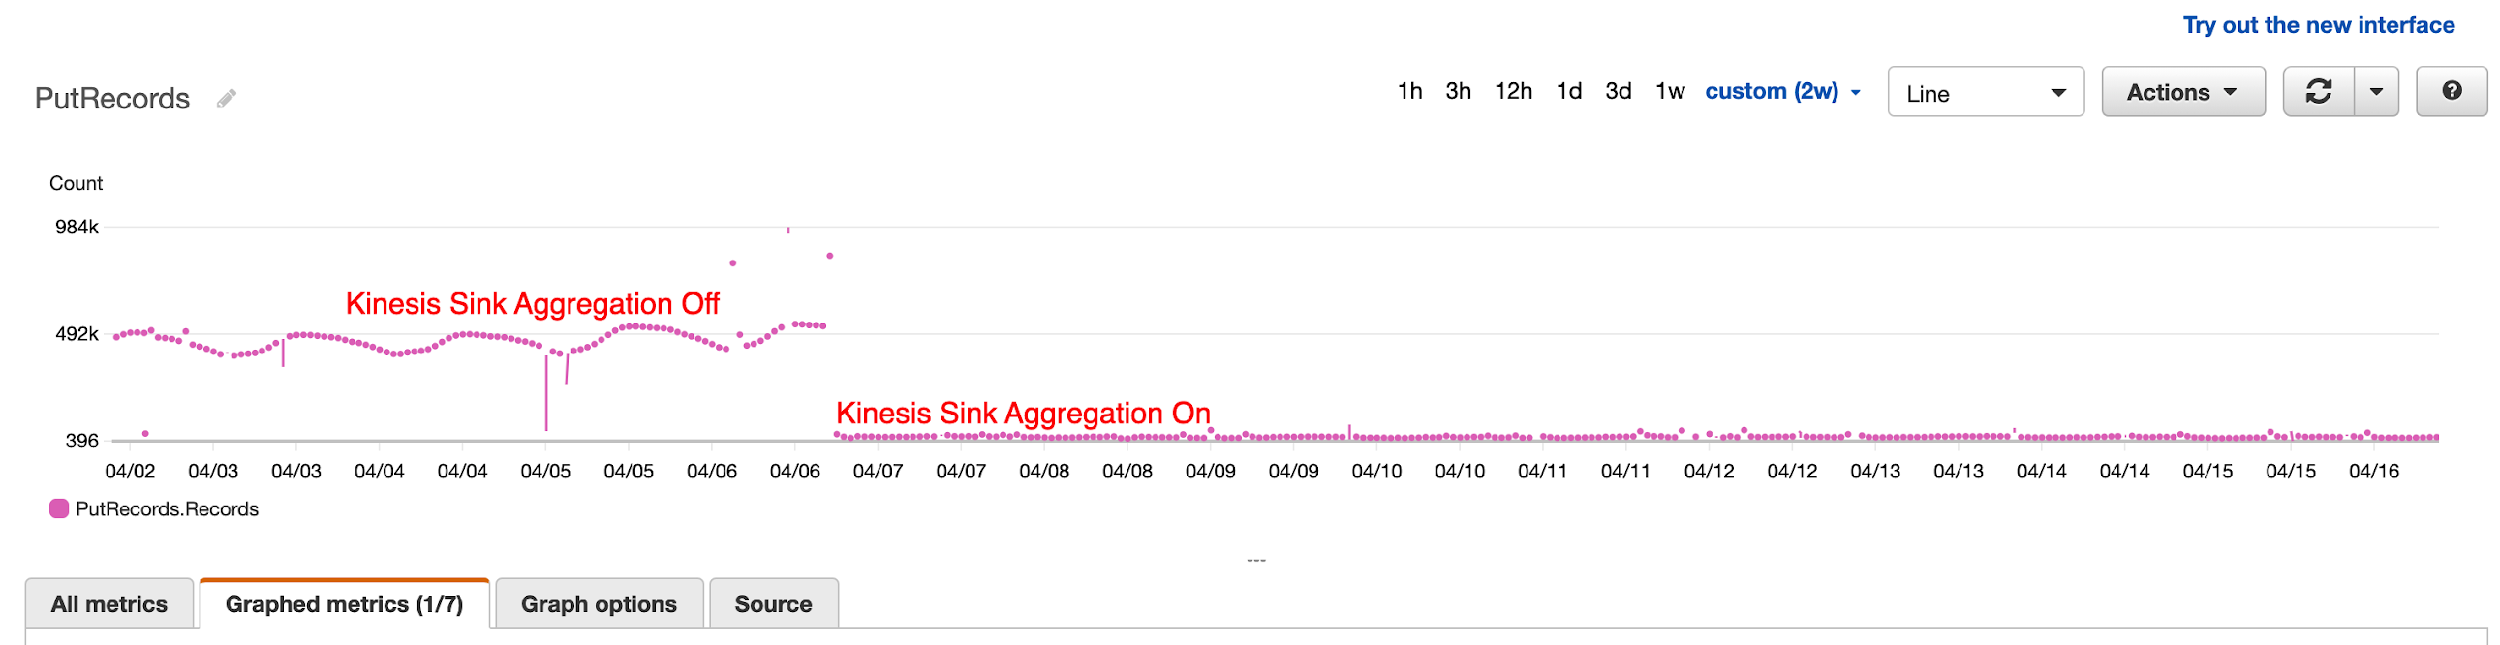
Challenge 2: Use Kinesis Data Analytics sink aggregation
After tuning parallelism, they still noticed occasional throttling by Kinesis Data Streams because of the number of records being written, not record size. To overcome this, they turned on Kinesis Data Analytics sink aggregation to reduce the number of records being written to the data stream, and the result was dramatic. They were able to reduce the number of writes by 1,000 times.
Challenge 3: Handle Kinesis Data Analytics Flink restarts and the resulting duplicate records
Kinesis Data Analytics applications restart because of auto scaling or recovery from application or task manager crashes. When this happens, Kinesis Data Analytics saves a snapshot before shutdown and automatically reloads the latest snapshot and picks up where the work was left off. Kinesis Data Analytics also saves a checkpoint every minute so no data is lost, guaranteeing exactly-once processing.
However, when the Kinesis Data Analytics application shut down in the middle of sending results to Kinesis Data Streams, it doesn’t guarantee exactly-once data delivery. In fact, Flink only guarantees at least once delivery to Kinesis Data Analytics sink, meaning that Kinesis Data Analytics guarantees to send a record at least once, which leads to duplicate records sent when Kinesis Data Analytics is restarted.
How were duplicate records handled in the outgoing data stream?
Because duplicate records aren’t handled by Kinesis Data Analytics when sinks do not have exactly-once semantics, the downstream application must deal with the duplicate records. The first question you should ask is whether it’s necessary to deal with the duplicate records. Maybe it’s acceptable to tolerate duplicate records in your application? This, however, is not an option for NortonLifeLock, because no user wants to have their available usage taken twice within the same hour. So, logic had to be built in the application to handle duplicate usage records.
To deal with duplicate records, you can employ a strategy in which the application saves an update timestamp along with the user’s latest usage. When a record comes in, the application reads existing daily usage and compares the update timestamp against the current time. If the difference is less than a configured window (50 minutes if the aggregation window is 60 minutes), the application ignores the new record because it’s a duplicate. It’s acceptable for the application to potentially undercount vs. overcount user usage.
How were duplicate records handled in the outgoing S3 bucket?
Kinesis Data Analytics writes temporary files in Amazon S3 before finalizing and removing them. When Kinesis Data Analytics restarts, it attempts to write new S3 files, and potentially leaves behind temporary S3 files because of restart. Because Athena ignores all temporary S3 files, no further is action needed. If your BI tools take temporary S3 files into consideration, you have to configure the Amazon S3 lifecycle policy to clean up temporary S3 files after a certain time.
Conclusion
NortonLifelock has been successfully running a Kinesis Data Analytics application in production since May 2021. It provides several key benefits. VPN users can now keep track of their usage in near-real time. BI analysts can get timely insights that are used for targeted sales and marketing campaigns, and upselling features and services. VPN usage limits are enforced in near-real time, thereby optimizing the network resources. NortonLifelock is saving tens of thousands of dollars each month with this real-time streaming analytics solution. And this telemetry solution is able to keep up with petabytes of data flowing through their global VPN service, which is seeing double-digit monthly growth.
To learn more about Kinesis Data Analytics and getting started with serverless streaming solutions on AWS, please see Developer Guide for Studio, the easiest way to build Apache Flink applications in SQL, Python, Scala in a notebook interface.
About the Authors
 Lei Gu has 25 years of software development experience and the architect for three key Norton products, Norton Secure Backup, VPN and Norton Family. He is passionate about cloud transformation and most recently spoke about moving from Cassandra to Amazon DynamoDB at AWS re:Invent 2019. Check out his Linkedin profile at https://www.linkedin.com/in/leigu/.
 Madhu Nunna is a Sr. Solutions Architect at AWS, with over 20 years of experience in networks and cloud, with the last two years focused on AWS Cloud. He is passionate about Analytics and AI/ML. Outside of work, he enjoys hiking and reading books on philosophy, economics, history, astronomy and biology.
[$] The 2021 Kernel Maintainers Summit
Post Syndicated from original https://lwn.net/Articles/870415/rss
The Kernel Maintainers Summit is an invitation-only gathering of top-level
kernel subsystem maintainers; it is concerned mostly with process-oriented
issues that are not easily worked out on the mailing lists. There was no
maintainers summit in 2020; plans had been made to hold it in an electronic
form, but there turned out to be a lack of things to talk about. In 2021,
though, a number of interesting topics turned up, so an online gathering
was held on September 24 as part of the Linux Plumbers Conference.
Read on for a summary of the discussions held at this year’s Summit.
Partitioning GitHub’s relational databases to handle scale
Post Syndicated from Thomas Maurer original https://github.blog/2021-09-27-partitioning-githubs-relational-databases-scale/
More than 10 years ago, GitHub.com started out like many other web applications of that time—built on Ruby on Rails, with a single MySQL database to store most of its data.
Over the years, this architecture went through many iterations to support GitHub’s growth and ever-evolving resiliency requirements. For example, we started storing data for some features (like statuses) in separate MySQL databases, we added read replicas to spread the load across multiple machines, and we started using ProxySQL to reduce the number of connections opened against our primary MySQL instances.
Yet at its core, GitHub.com remained built around one main database cluster (called mysql1) that housed a large portion of the data used by core GitHub features, like user profiles, repositories, issues, and pull requests.
With GitHub’s growth, this inevitably led to challenges. We struggled to keep our database systems adequately sized, always moving to newer and bigger machines to scale up. Any sort of incident negatively affecting mysql1 would affect all features that stored their data on this cluster.
In 2019, in order to meet the growth and availability challenges we faced, we set a plan in motion to improve our tooling and our ability to partition relational databases. As you can imagine, this was a complex challenge necessitating the introduction and creation of various tools as outlined below.
The result, we see in 2021, is a 50% load reduction on database hosts housing the data that once was on mysql1. This contributed significantly to reducing the number of database-related incidents and improved GitHub.com’s reliability for all our users.
Virtual partitions
The first concept we introduced was virtual partitions of database schemas. Before database tables can be moved physically, we have to make sure they are separated virtually in the application layer, and this has to happen without impacting teams working on new or existing features.
To do that, we group database tables that belong together into schema domains and enforce boundaries between the domains with SQL linters. This allows us to safely partition data later without ending up with queries and transactions that span partitions.
Schema domains
Schema domains are a tool we came up with to implement virtual partitions. A schema domain describes a tightly coupled set of database tables that are frequently used together in queries (such as, when using table joins or subqueries) and transactions. For example, the gists schema domain contains all of the tables supporting the GitHub Gist feature–like the gists, gist_comments and starred_gists tables. Since they belong together, they should stay together. A schema domain is the first step to codify that.
Schema domains put clear boundaries in place and expose sometimes-hidden dependencies between features. In the Rails application, the information is stored in a simple YAML configuration located at db/schema-domains.yml. Here’s an example illustrating the contents of that file:
gists:
  - gist_comments
  - gists
  - starred_gists
repositories:
  - issues
  - pull_requests
  - repositories
users:
  - avatars
  - gpg_keys
  - public_keys
  - users
A linter makes sure that the list of tables in this file matches our database schema. In turn, the same linter enforces the assignment of a schema domain to every table.
SQL linters
Building on top of schema domains, two new SQL linters enforce virtual boundaries between domains. They identify any violating queries and transactions that span schema domains by adding a query annotation and treating them as exemptions. If a domain has no violations, it is virtually partitioned and ready to be physically moved to another database cluster.
Query linter
The query linter verifies that only tables belonging to the same schema domain can be referenced in the same database query. If it detects tables from different domains, it throws an exception with a helpful message for the developer to avoid the issue.
Since the linter is only enabled in development and test environments, developers encounter violation errors early in the development process. In addition, during CI runs, the linter ensures that no new violations are introduced by accident.
The linter has a way to suppress the exception by annotating the SQL query with a special comment: /* cross-schema-domain-query-exempted */
We even built and upstreamed a new method to ActiveRecord to make adding such a comment easier:
Repository.joins(:owner).annotate("cross-schema-domain-query-exempted")
# => SELECT * FROM `repositories` INNER JOIN `users` ON `users`.`id` = `repositories.owner_id` /* cross-schema-domain-query-exempted */
By annotating all queries that cause failures, a backlog of queries needing modification can be built. Here’s a couple approaches we often use to eliminate exemptions:
- Sometimes, an exemption can easily be addressed by triggering separate queries instead of joining tables. One example is using
ActiveRecord‘spreloadmethod instead ofincludes.Another challenge is
has_many :throughrelations that lead toJOINs across tables from different schema domains. For that, we worked on a generic solution that got upstreamed to Rails as well:has_manynow has adisable_joins option that tells Active Record not to do anyJOINqueries across the underlying tables. Instead, it runs several queries passing primary key values. -
Joining data in the application instead of in the database is another common solution. For example, replacing
INNER JOINstatements with two separate queries and instead performing the “union” operation in Ruby (for example,A.pluck(:b_id) & B.where(id: ...)).In some cases, this leads to surprising performance improvements. Depending on the data structure and cardinality, MySQL’s query planner can sometimes create suboptimal query execution plans, whereas an application-side join has a more stable performance cost.
As with almost all reliability and performance-related changes, we ship them behind Scientist experiments that execute both the old and new implementations for a subset of requests, allowing us to assess the performance impact of each change.
Transaction linter
In addition to queries, transactions are a concern as well. Existing application code was written with a certain database schema in mind. MySQL transactions guarantee consistency across tables within a database. If a transaction includes queries to tables that will move to separate databases, it will no longer be able to guarantee consistency.
To understand which transactions need to be reviewed, we introduced a transaction linter. Similar to the query linter, it verifies that all tables which are used together in a given transaction belong to the same schema domain.
This linter runs in production with heavy sampling to keep the performance impact at a minimum. The linting results are collected and analyzed to understand where most cross-domain transactions happen, allowing us to decide to either update certain code paths or adapt our data model.
In cases where transactional consistency guarantees are crucial, we extract data into new tables that belong to the same schema domain. This ensures they stay on the same database cluster and therefore continue to have transactional consistency. This often happens with polymorphic tables that house data from different schema domains (for example, a reactions table storing records for different features like issues, pull requests, discussions, etc.)
Moving data without downtime
A schema domain that is virtually isolated is ready to be physically moved to another database cluster. To move tables on the fly, we use two different approaches: Vitess, and a custom write-cutover process.
Vitess
Vitess is a scaling layer on top of MySQL that helps with sharding needs. We use its vertical sharding feature to move sets of tables together in production without downtime.
To do that, we deploy Vitess’ VTGate in our Kubernetes clusters. These VTGate processes become the endpoint for the application to connect to, instead of direct connections to MySQL. They implement the same MySQL protocol and are indistinguishable from the application side.
The VTGate processes know the current state of the Vitess setup and talk to the MySQL instances via another Vitess component: VTTablet. Behind the scenes, Vitess’ table moving feature is powered by VReplication, which replicates data between database clusters.
Write-cutover process
Because Vitess’ adoption was still in its early stages at the beginning of 2020, we developed an alternative approach to move large sets of tables at once. This mitigated the risk of relying on a single solution to ensure the continued availability of GitHub.com.
We use MySQL’s regular replication feature to feed data to another cluster. Initially, the new cluster is added to the replication tree of the old cluster. Then a script quickly executes a series of changes to effect the cutover.
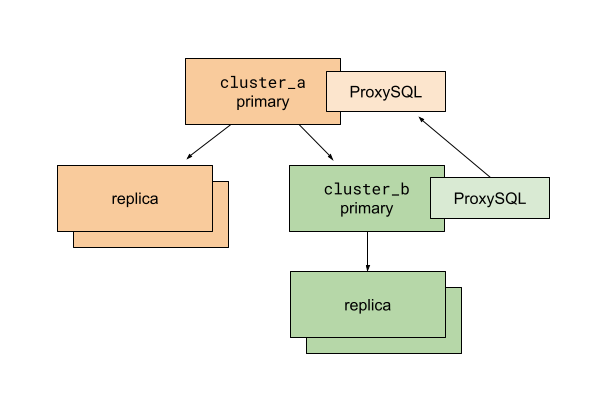
The MySQL database cluster setup before executing the write-cutover process
Before running the script, we prepare the application and database replication so that a destination cluster called cluster_b is a sub-cluster of the existing cluster_a. ProxySQL is used for multiplexing client connections to MySQL primaries. The ProxySQL instance on cluster_b is configured to route all traffic to the cluster_a primary. The use of ProxySQL allows us to change database traffic routing quickly and with minimal impact on database clients—in our case, the Rails application.
With this setup, we can move database connections to cluster_b without splitting anything. All read traffic still goes to hosts replicating from the cluster_a primary. All write traffic remains with the cluster_a primary too.
In this situation, we run a cutover script executing the following:
- Enable read-only mode for the
cluster_aprimary. At this point, all writes tocluster_aandcluster_bare prevented. All web requests that try to write to these database primaries fail and result in 500s. - Read the last executed MySQL GTID from the
cluster_aprimary. - Poll the
cluster_bprimary to verify the last executed GTID has arrived. - Stop replication on the
cluster_bprimary fromcluster_a. - Update ProxySQL routing configuration on
cluster_bto direct traffic to thecluster_bprimary. - Disable read-only mode for the
cluster_aandcluster_bprimaries. - Celebrate!
After thorough preparation and exercising, we learned that these six steps execute in only a few tens of milliseconds for our busiest database tables. Since we execute such cutovers during our lowest traffic time of day, we only cause a handful of user-facing errors because of failed writes. The results of this approach were better than we expected.
Learnings
The write-cutover process was used to split up mysql1, our original main database cluster. We moved 130 of our busiest tables at once––those that power GitHub’s core features: repositories, issues, and pull requests. This process was created as a risk-mitigation strategy to have multiple, independent tools at our disposal. In addition, because of factors like deployment topology and read-your-writes support, we didn’t choose Vitess as the tool to move database tables in every case. We anticipate the opportunity to use it for the majority of data migrations in the future though.
Results
The main database cluster mysql1, mentioned in the introduction, housed a large portion of the data used by many of GitHub’s most important features, like users, repositories, issues, and pull requests. Since 2019 we achieved the ability to scale this relational database with the following results:
- In 2019,
mysql1answered 950,000 queries/s on average, 900,000 queries/s on replicas, and 50,000 queries/s on the primary. - Today, in 2021, the same database tables are spread across several clusters. In two years, they saw continued growth, accelerating year-over-year. All hosts of these clusters combined answer 1,200,000 queries/s on average (1,125,000 queries/s on replicas, 75,000 queries/s on the primaries). At the same time, the average load on each host halved.
The load reduction contributed significantly to reducing the number of database-related incidents and improved GitHub.com’s reliability for all our users.
More partitioning
In addition to vertical partitioning to move database tables, we also use horizontal partitioning (aka sharding). This allows us to split database tables across multiple clusters, enabling more sustainable growth. We’ll detail the tooling, linters, and Rails improvements related to this in a future blog post.
Conclusion
Over the last 10 years, GitHub has been learning to scale according to its needs. We often choose to leverage “boring” technology that has been proven to work at our scale, as reliability remains the primary concern. But the combination of industry-proven tools with simple changes to our production code and its dependencies has provided us with a path for the continued growth of our databases into the future.
Marcello Canuto | Mapping the World of the Maya | Talks at Google
Post Syndicated from Talks at Google original https://www.youtube.com/watch?v=Lvkl5SHPHDo
Get Started with Amazon S3 Event Driven Design Patterns
Post Syndicated from Micah Walter original https://aws.amazon.com/blogs/architecture/get-started-with-amazon-s3-event-driven-design-patterns/
Event driven programs use events to initiate succeeding steps in a process. For example, the completion of an upload job may then initiate an image processing job. This allows developers to create complex architectures by using the principle of decoupling. Decoupling is preferable for many workflows, as it allows each component to perform its tasks independently, which improves efficiency. Examples are ecommerce order processing, image processing, and other long running batch jobs.
Amazon Simple Storage Service (S3) is an object-based storage solution from Amazon Web Services (AWS) that allows you to store and retrieve any amount of data, at any scale. Amazon S3 Event Notifications provides users a mechanism for initiating events when certain actions take place inside an S3 bucket.
In this blog post, we will illustrate how you can use Amazon S3 Event Notifications in combination with a powerful suite of Amazon messaging services. This will allow you to implement an event driven architecture for a variety of common use cases.
Setting up Amazon S3 Event Notifications
We first must understand the types of events that can be initiated with Amazon S3 Event Notifications. Events can be initiated by uploading, modifying, deleting an object, or other actions. When an event is initiated, a payload is created containing the event metadata. This includes information about the object that initiated the event itself.
To enable notifications, you must first add a notification configuration that identifies the events you want Amazon S3 to publish. Specify the destinations where you want Amazon S3 to send the notifications. This configuration is stored in the notification subresource, which you can find under the Properties tab within your S3 bucket, see Figure 1.

Figure 1. Properties tab showing S3 Event Notifications subresource
An event notification can be initiated anytime an object is uploaded, modified, or deleted, depending on your configuration details. You can create multiple notification configurations for different scenarios, shown in Figure 2. For example, one configuration can handle new or modified objects, and another configuration can handle deletions. You can specify that events will only be initiated when objects contain a specific prefix, or following the restoration of an object. For a complete listing of all the configuration options and event types, read documentation on supported event types.

Figure 2. S3 Event Notifications subresource details and options
When all of the conditions in your configuration have been met, a new event will be initiated and sent to the destination you specify. An S3 event destination can be an AWS Lambda function, an Amazon Simple Queue Service (SQS) queue, or an Amazon Simple Notification Service (SNS) topic, see Figure 3.

Figure 3. S3 Event Notifications subresource destination settings
Event driven design patterns
There are many common design patterns for building event driven programs with Amazon S3 Event Notifications. Once you have set up your notification configuration, the next step is to consume the event. The following describes a few typical architectures you might consider, depending on the needs of your application.
Synchronous and reliable point-to-point processing

Figure 4. Point-to-point processing with S3 and Lambda as a destination
One common use case for event driven processing, is when synchronous and reliable information is required. For example, a mobile application processes images uploaded by users and automatically tags the images with the detected objects using Artificial Intelligence/Machine Learning (AI/ML). From an architectural perspective (Figure 4), an image is uploaded to an S3 bucket, which generates an event notification. This initiates a Lambda function that sends the details of the uploaded image to Amazon Rekognition for tagging. Results from Amazon Rekognition could be further processed by the Lambda function and stored in a database like Amazon DynamoDB.
With this type of architecture, there is no contingency for dealing with multiple images arriving simultaneously in the S3 bucket. If this application sends too many requests to Lambda, events can start to pile up. This can cause a failure to process some of the images. To make our program more fault tolerant, adding an Amazon SQS queue would help, as shown in Figure 5.
Asynchronous and queued point-to-point processing

Figure 5. Queued point-to-point processing with S3, SQS, and Lambda
Architectures that require the processing of information in an asynchronous fashion can use this pattern. Building off the first example, a mobile application might provide a solution to allow end users to bulk upload thousands of images simultaneously. It can then use AWS Lambda to send the images to Amazon Rekognition for tagging.
By providing a queue-based asynchronous solution, the Lambda function can retrieve work from the SQS queue at its own pace. This allows it to control the processing flow by processing files sequentially without risk of being overloaded. This is especially useful if the application must handle incomplete or partial uploads when a connection is temporarily lost.
Currently, Amazon S3 Event Notifications only work with standard SQS queues, and first-in-first-out (FIFO) SQS queues are not supported. Read more about how to configure S3 event notification with an SQS queue as a destination. Your Lambda function in this architecture must be adjusted to handle the message payload arriving from SQS. This is because it will have a slightly different form than the original event notification body generated from S3.
Parallel processing with “Fan Out” architecture

Figure 6. Fan out design pattern with S3, SNS, and SQS before sending to a Lambda function
To create a “fan out” style architecture where a single event is propagated to many destinations in parallel, SNS is combined with SQS. Configure your S3 event notification to use an SNS topic as its destination, as shown in Figure 6. You can then direct multiple subsequent processes to act on the same event. This is especially useful if you aim to do parallel processing on the same object in S3.
For example, if you wanted to process a source image into multiple target resolutions, you could create a Lambda function. The function will use the “fan-out” pattern to process all images at the same time, at each resolution. You could then subscribe an SQS queue to your SNS topics. This ensures that Event Notifications sent to SNS are verified as complete by SQS, once they’ve been processed by your Lambda function.

Figure 7. Fan out design pattern including secondary pipeline for deleting images
To extend the use case of image processing even further, you could create multiple SNS topics to handle different types of events from the same S3 bucket. As depicted in Figure 7, this architecture would allow your program to handle creations and updates differently than deletions. You could also process images differently based on their S3 prefix.
Adjust your Lambda code to handle messages making their way through SNS and SQS. Their payloads will be slightly different than the original S3 Event Notification payload.
Real-time notifications

Figure 8. Event driven design pattern for real-time notifications
In addition to application-to-application messaging, Amazon SNS provides application-to-person (A2P) communication (see Figure 8). Amazon SNS can send SMS text messages to mobile subscribers in over 100 countries. It can also send push notifications to Android and Apple devices and emails over SMTP. Using A2P, uploading an image to an Amazon S3 bucket can generate a notification to a group of users via their choice of Amazon SNS A2P platform.
Conclusion
In this blog post, we’ve shown you the basic design patterns for developing an event driven architecture using Amazon S3 Event Notifications. You can create many more complicated architecture patterns to suit your needs. By using Amazon SQS, Amazon SNS, and AWS Lambda, you can design an event driven program that is fault tolerant, scalable, and smartly decoupled. But don’t stop there! Consider expanding your program further by utilizing AWS Lambda destinations. Or combine parallel image processing with highly scalable A2P notifications, which will alert your users when a task is complete.
For further reading:
Creating a serverless face blurring service for photos in Amazon S3
Post Syndicated from James Beswick original https://aws.amazon.com/blogs/compute/creating-a-serverless-face-blurring-service-for-photos-in-amazon-s3/
Many workloads process photos or imagery from web applications or mobile applications. For privacy reasons, it can be useful to identify and blur faces in these photos. This blog post shows how to build a serverless face blurring service for photos uploaded to an Amazon S3 bucket.
The example application uses the AWS Serverless Application Model (AWS SAM), enabling you to deploy the application more easily in your own AWS account. This walkthrough creates resources covered in the AWS Free Tier but usage beyond the Free Tier allowance may incur cost. To set up the example, visit the GitHub repo and follow the instructions in the README.md file.
Overview
Using a serverless approach, this face blurring microservice runs on demand in response to new photos being uploaded to S3. The solution uses the following architecture:

- When an image is uploaded to the source S3 bucket, S3 sends a notification event to an Amazon SQS queue.
- The Lambda service polls the SQS queue and invokes an AWS Lambda function when messages are available.
- The Lambda function uses Amazon Rekognition to detect faces in the source image. The service returns the coordinates of faces to the function.
- After blurring the faces in the source image, the function stores the resulting image in the output S3 bucket.
Deploying the solution
Before deploying the solution, you need:
- An AWS account (sign up for an account if you don’t have one).
- The AWS SAM CLI installed.
- Node.js installed (version 14 minimum).
To deploy:
- From a terminal window, clone the GitHub repo:
git clone https://github.com/aws-samples/serverless-face-blur-service - Change directory:
cd ./serverless-face-blur-service - Download and install dependencies:
sam build - Deploy the application to your AWS account:
sam deploy --guided - During the guided deployment process, enter unique names for the two S3 buckets. These names must be globally unique.
To test the application, upload a JPG file containing at least one face into the source S3 bucket. After a few seconds, the destination bucket contains the output file, with the same name. The output file shows blur content when the faces are detected:

How the face blurring Lambda function works
The Lambda function receives messages from the SQS queue when available. These messages contain metadata about the JPG object uploaded to S3:
{
    "Records": [
        {
            "messageId": "e9a12dd2-1234-1234-1234-123456789012",
            "receiptHandle": "AQEBnjT2rUH+kmEXAMPLE",
            "body": "{\"Records\":[{\"eventVersion\":\"2.1\",\"eventSource\":\"aws:s3\",\"awsRegion\":\"us-east-1\",\"eventTime\":\"2021-06-21T19:48:14.418Z\",\"eventName\":\"ObjectCreated:Put\",\"userIdentity\":{\"principalId\":\"AWS:AROA3DTKMEXAMPLE:username\"},\"requestParameters\":{\"sourceIPAddress\":\"73.123.123.123\"},\"responseElements\":{\"x-amz-request-id\":\"AZ39QWJFVEQJW9RBEXAMPLE\",\"x-amz-id-2\":\"MLpNwwQGQtrNai/EXAMPLE\"},\"s3\":{\"s3SchemaVersion\":\"1.0\",\"configurationId\":\"5f37ac0f-1234-1234-82f12343-cbc8faf7a996\",\"bucket\":{\"name\":\"s3-face-blur-source\",\"ownerIdentity\":{\"principalId\":\"EXAMPLE\"},\"arn\":\"arn:aws:s3:::s3-face-blur-source\"},\"object\":{\"key\":\"face.jpg\",\"size\":3541,\"eTag\":\"EXAMPLE\",\"sequencer\":\"123456789\"}}}]}",
            "attributes": {
                "ApproximateReceiveCount": "6",
                "SentTimestamp": "1624304902103",
                "SenderId": "AIDAJHIPREXAMPLE",
                "ApproximateFirstReceiveTimestamp": "1624304902103"
            },
            "messageAttributes": {},
            "md5OfBody": "12345",
            "eventSource": "aws:sqs",
            "eventSourceARN": "arn:aws:sqs:us-east-1:123456789012:s3-lambda-face-blur-S3EventQueue-ABCDEFG01234",
            "awsRegion": "us-east-1"
        }
    ]
}
The body attribute contained a serialized JSON object with an array of records, containing the S3 bucket name and object keys. The Lambda handler in app.js uses the JSON.parse method to create a JSON object from the string:
const s3Event = JSON.parse(event.Records[0].body)The handler extracts the bucket and key information. Since the S3 key attribute is URL encoded, it must be decoded before further processing:
const Bucket = s3Event.Records[0].s3.bucket.name
const Key = decodeURIComponent(s3Event.Records[0].s3.object.key.replace(/\+/g, " "))
There are three steps in processing each image: detecting faces in the source image, blurring faces, then storing the output in the destination bucket.
Detecting faces in the source image
The detectFaces.js file contains the detectFaces function. This accepts the bucket name and key as parameters, then uses the AWS SDK for JavaScript to call the Amazon Rekognition service:
const AWS = require('aws-sdk')
AWS.config.region = process.env.AWS_REGION
const rekognition = new AWS.Rekognition()

const detectFaces = async (Bucket, Name) => {

  const params = {
    Image: {
      S3Object: {
       Bucket,
       Name
      }
     }
  }

  console.log('detectFaces: ', params)

  try {
    const result = await rekognition.detectFaces(params).promise()
    return result.FaceDetails
  } catch (err) {
    console.error('detectFaces error: ', err)
    return []
  }
}
The detectFaces method of the Amazon Rekognition API accepts a parameter object defining a reference to the source S3 bucket and key. The service returns a data object with an array called FaceDetails:
{
    "BoundingBox": {
        "Width": 0.20408163964748383,
        "Height": 0.4340078830718994,
        "Left": 0.727995753288269,
        "Top": 0.3109045922756195
    },
    "Landmarks": [
        {
            "Type": "eyeLeft",
            "X": 0.784351646900177,
            "Y": 0.46120116114616394
        },
        {
            "Type": "eyeRight",
            "X": 0.8680923581123352,
            "Y": 0.5227685570716858
        },
        {
            "Type": "mouthLeft",
            "X": 0.7576283812522888,
            "Y": 0.617080807685852
        },
        {
            "Type": "mouthRight",
            "X": 0.8273565769195557,
            "Y": 0.6681531071662903
        },
        {
            "Type": "nose",
            "X": 0.8087539672851562,
            "Y": 0.5677543878555298
        }
    ],
    "Pose": {
        "Roll": 23.821317672729492,
        "Yaw": 1.4818285703659058,
        "Pitch": 2.749311685562134
    },
    "Quality": {
        "Brightness": 83.74250793457031,
        "Sharpness": 89.85481262207031
    },
    "Confidence": 99.9793472290039
}
The Confidence score is the percentage confidence that the image contains a face. This example uses the BoundingBox coordinates to find the location of the face in the image. The response also includes positional data for facial features like the mouth, nose, and eyes.
Blurring faces in the source image
In the blurFaces.js file, the blurFaces function uses the open source GraphicsMagick library to process the source image. The function takes the bucket and key as parameters with the metadata returned by the Amazon Rekognition service:
const AWS = require('aws-sdk')
AWS.config.region = process.env.AWS_REGION
const s3 = new AWS.S3()
const gm = require('gm').subClass({imageMagick: process.env.localTest})

const blurFaces = async (Bucket, Key, faceDetails) => {

  const object = await s3.getObject({ Bucket, Key }).promise()
  let img = gm(object.Body)

  return new Promise ((resolve, reject) => {
    img.size(function(err, dimensions) {
        if (err) reject(err)
        console.log('Image size', dimensions)

        faceDetails.map((faceDetail) => {
            const box = faceDetail.BoundingBox
            const width  = box.Width * dimensions.width
            const height = box.Height * dimensions.height
            const left = box.Left * dimensions.width
            const top = box.Top * dimensions.height

            img.region(width, height, left, top).blur(0, 70)
        })

        img.toBuffer((err, buffer) => resolve(buffer))
    })
  })
}
The function loads the source object from S3 using the getObject method of the S3 API. In the response, the Body attribute contains a buffer with the image data – this is used to instantiate a ‘gm’ object for processing.
Amazon Rekognition’s bounding box coordinates are percentage-based relative to the size of the image. This code converts these percentages to X- and Y-based coordinates and uses the region method to identify a portion of the image. The blur method uses a Gaussian operator based on the inputs provided. Once the transformation is complete, the function returns a buffer with the new image.
Using GraphicsMagick with Lambda functions
The GraphicsMagick package contains operating system-specific binaries. Depending on the operating system of your development machine, you may install binaries locally that are not compatible with Lambda. The Lambda service uses Amazon Linux 2 (AL2).
To simplify local testing and deployment, the sample application uses Lambda layers to package this library. This open source Lambda layer repo shows how to build, deploy, and test GraphicsMagick as a Lambda layer. It also publishes public layers to help you use the library in your Lambda functions.
When testing this function locally with the test.js script, the GM npm package uses the binaries on the local development machine. When the function is deployed to the Lambda service, the package uses the Lambda layer with the AL2-compatible binaries.
Limiting throughput with Amazon Rekognition
Both S3 and Lambda are highly scalable services and in this example can handle thousands of image uploads a second. In this configuration, S3 sends Event Notifications to an SQS queue each time an object is uploaded. The Lambda function processes events from this queue.
When using downstream services in Lambda functions, it’s important to note the quotas and throughputs in place for those services. This can help avoid throttling errors or overwhelming non-serverless services that may not be able to handle the same level of traffic.
The Amazon Rekognition service sets default transaction per second (TPS) rates for AWS accounts. For the DetectFaces API, the default is between 5-50 TPS depending upon the AWS Region. If you need a higher throughput, you can request an increase in the Service Quotas console.
In the AWS SAM template of the example application, the definition of the Lambda function uses two attributes to control the throughput. The ReservedConcurrentExecutions attribute is set to 1, which prevents the Lambda service from scaling beyond one instance of the function. The BatchSize in event source mapping is also set to 1, so each invocation contains only a single S3 event from the SQS queue:
  BlurFunction:
    Type: AWS::Serverless::Function
    Properties:
      CodeUri: src/
      Handler: app.handler
      Runtime: nodejs14.x
      Timeout: 10
      MemorySize: 2048
      ReservedConcurrentExecutions: 1
      Policies:
        - S3ReadPolicy:
            BucketName: !Ref SourceBucketName
        - S3CrudPolicy:
            BucketName: !Ref DestinationBucketName
        - RekognitionDetectOnlyPolicy: {}
      Environment:
        Variables:
          DestinationBucketName: !Ref DestinationBucketName
      Events:
        MySQSEvent:
          Type: SQS
          Properties:
            Queue: !GetAtt S3EventQueue.Arn
            BatchSize: 1
The combination of these two values means that this function processes images one at a time, regardless of how many images are uploaded to S3. By increasing these values, you can change the scaling behavior and number of messages processed per invocation. This allows you to control the throughput of the number of the messages sent to Amazon Rekognition for processing.
Conclusion
A serverless face blurring service can provide a simpler way to process photos in workloads with large amounts of traffic. This post introduces an example application that blurs faces when images are saved in an S3 bucket. The S3 PutObject event invokes a Lambda function that uses Amazon Rekognition to detect faces and GraphicsMagick to process the images.
This blog post shows how to deploy the example application and walks through the functions that process the images. It explains how to use GraphicsMagick and how to control throughput in the SQS event source mapping.
For more serverless learning resources, visit Serverless Land.
Security updates for Monday
Post Syndicated from original https://lwn.net/Articles/870597/rss
Security updates have been issued by Debian (kernel, libxml-security-java, and openssl), Fedora (fetchmail and python-rsa), openSUSE (grafana-piechart-panel and opera), and Red Hat (nodejs:14).
Strengthening the Small-Business Support System
Post Syndicated from The Atlantic original https://www.youtube.com/watch?v=eI7hH3i4wfc
What Aperture should you use?
Post Syndicated from Matt Granger original https://www.youtube.com/watch?v=Dd4HfdijGWo
To the Left: Your Guide to Infrastructure as Code for Shifting Left
Post Syndicated from Marla Rosner original https://blog.rapid7.com/2021/09/27/to-the-left-your-guide-to-infrastructure-as-code-for-shifting-left/

It’s the cloud’s world now, and we’re all just living in it. The mass migration of organizational infrastructure to the cloud isn’t slowing down any time soon — and really, why would it? Cloud computing has allowed developers to move at vastly greater speeds than ever before. And this in turn lets businesses move at greater speeds than ever before. What could go wrong?
If you’re reading this blog, you probably already know the answer: data security and regulatory compliance. With so much development, testing, and deployment happening all the time, it’s far too easy for infrastructure misconfigurations, compliance violations, or other risks to slip through the cracks.
Right now, these risks are most often found and addressed at runtime, after the proverbial barn door has already been left open and the horses are long gone. It’s obviously not ideal to have developers racing around trying to fix security issues that have already gone live and put the organization at risk. It’s also not all that optimal for those developers to constantly have to drop their current projects to put out security fires.
So our beleaguered security teams are stuck acting as the organizational killjoys constantly pumping the brakes on development, while developers are left unable to take full advantage of the speed cloud offers them. The bottom line: No one’s happy.
The power of infrastructure as code
This, of course, is where our favorite catchy slogan “shift left” comes into play. What organizations need to address all these issues is to shift security left, earlier in the development cycle. This shift allows teams to catch misconfigurations before they go live and expose an organization to risk. In this way, shifting left also keeps security from becoming a bottleneck for development. And it keeps both DevOps and SecOps happy — with their processes and with each other.
So how do you make this rosy picture a reality for yourself and your organization? The key is infrastructure as code (IaC). Traditionally, you would need to create security infrastructure by hand. But the IaC approach replaces manual creation with declarative statements that define the infrastructure needed to run code. Essentially, IaC turns the creation of security infrastructure into a shared, programmatic task within and between teams that can easily be replicated as often as needed.
By evaluating these IaC templates before runtime, developers are empowered to build more secure applications. The IaC templates provide the structure and feedback developers need to understand and resolve risks, and integrate security and compliance into all parts of the CI/CD process. With this, DevOps can become the primary safeguard against misconfigurations and risk without overly disturbing their established workflows.
All in all, IaC helps increase the speed of deployment, reduce misconfiguration and compliance errors, improve the relationship between developers and security, and lower costs.
Getting started with IaC
At this point, you may be thinking, “OK, shifting left with IaC sounds great — but how do I make that happen?”
There’s no one-size-fits-all answer to that question. Not all tools for IaC and shifting cloud security left are created equal. And the type of tool you need will depend on the specific characteristics of your own organization. But if you’re looking to bring the IaC revolution home to your organization, there are a few crucial points to keep in mind.
- Make use of both static and dynamic analysis. These are the two main approaches for shifting left using IaC. Static analysis is faster but more limited in scope, whereas dynamic analysis is slower but more accurate, as it analyzes not only the IaC template but any environments or services the template works with. You’ll need access to both approaches to properly safeguard your cloud.
- Be sure the cloud security tool you choose supports not only the cloud environment you currently use, but also any you might expand to in the future. Not all tools support all cloud environments. Whatever tool you invest in needs to fit the current state of your organization, without imposing limits on your future growth. This also applies to CI/CD orchestration tools: Any IaC tool you acquire should be compatible with your CI/CD tools, and not all of them will be.
- Keep the total number of IaC tools to a minimum. Modern cloud security is complex enough as it is, and excess tools will only multiply the headaches for Dev and SecOps exponentially.
- Consider where and how different security policies need to be used. Depending on their nature (say, public vs. private) and the kind of information they hold, different clouds may need different policies. Policies may also need to be enforced differently for different stages of the CI/CD pipeline. You’ll need a tool that’s flexible enough to manage all of these scenarios effectively.
Rapid7’s own cloud security tool, InsightCloudSec, is a fully integrated solution enabling continuous security and compliance for complex, multi-cloud environments. InsightCloudSec allows you to shift cloud security left using IaC, catching and remediating misconfigurations and vulnerabilities before they go live.
With InsightCloudSec, security and compliance in the cloud doesn’t have to slow you down. Learn more here.
Motion Sensor LUX Temp Results & Call for Help
Post Syndicated from digiblurDIY original https://www.youtube.com/watch?v=91pXSlpQg8I
Easily creating and routing email addresses with Cloudflare Email Routing
Post Syndicated from Joao Sousa Botto original https://blog.cloudflare.com/introducing-email-routing/


Over four billion people — or half of the world’s population — have at least one email address, many of whom use it as an essential tool to stay on top of their personal and professional matters. More than 300 billion emails are sent and received every day, but seeing email as just a communications tool wouldn’t do it justice. Its impact in our lives goes far beyond being a vessel for messages — its use cases also cover being a common way of validating one’s identity online, and serving as the gateway for other communication platforms.
Today, most people use their email for sensitive purposes, such as logging in to their bank account, or communicating with governmental entities. At the same time, they will use that email to sign up for a 10% off coupon they found online, which will surely spam them for months to come. Despite these two use cases being polar opposites in relation to importance and security, people take the risk, usually for the sake of conveniently managing one account.
Much in the same way, businesses want to have different email addresses for different types of inquiries, such as sales and support, but often find it cumbersome to control who receives these emails. And as the business evolves, matters that were handled by the owner often need to be handed off to other people. But for small businesses it’s not usually straightforward to configure mailboxes and aliases.
And then there are countless individuals and families that juggle multiple mailboxes to handle the Internet identities that they use, to represent their various online presences.
We understand these challenges, and that’s why we’re launching Cloudflare Email Routing, the most straightforward way to create any number of email addresses that are redirected to the mailbox you, your family or your team are already using.
Cloudflare Email Routing
Cloudflare Email Routing is designed to simplify the way you create and manage email addresses, without needing to keep an eye on additional mailboxes.
The process is simple:
- You enter the email address you want to create on your domain
- You enter the email address you want it forwarded to
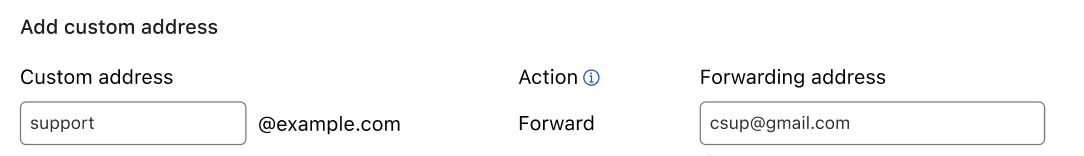
As some of you already know, email consists of the envelope, the header, and its body.
The envelope is part of the SMTP transport protocol and tells the servers where the email is coming from and where it’s supposed to be delivered.
The headers contain structured information like the message traveled path, date, the sender and recipients’ addresses, subject, and other technical metadata like SPF pass results, DKIM signatures, and anti-spam scores. Every time the message goes through a server, it can add new headers or modify the existing ones until it reaches the final inbox.
And finally, there’s the body of the message, where the actual content resides. The body can be plain text, rich HTML, it can contain file attachments, and in some cases, it can be signed or even encrypted.
Here’s a simplified diagram of how the SMTP protocol works and how the three steps of an Email message fit together:
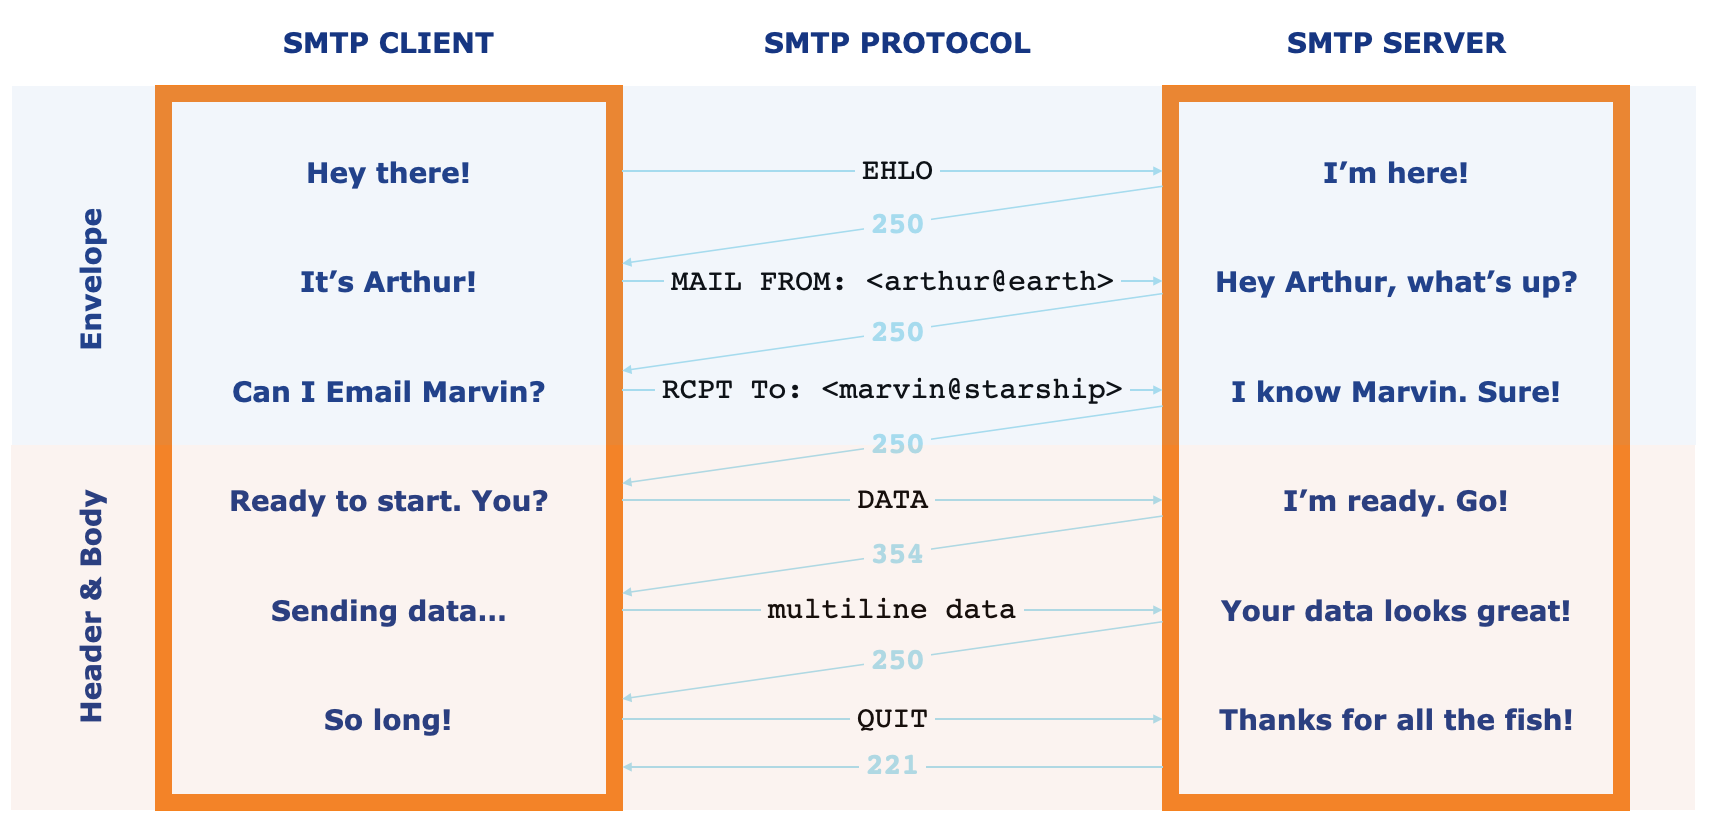
Cloudflare Email Routing service acts as an intelligent router at the transport layer, handling and modifying the SMTP envelope to deliver the message at its final destination but preserving the original headers and keeping the body intact. This approach ensures that things like SPF, DKIM, and other security or anti-spam protocols don’t break and the recipient stays protected.
Furthermore, following the same privacy-first approach we use in other products, we don’t look into, queue, or store emails at any point. Messages are received, handled according to the configured rules, and delivered to their final destinations in real-time.
Private Beta access
Email Forwarding is now in private beta, and you can save your place in line through this sign-up form.
Then, to start using Email Routing, all you need to do is to add your domain to Cloudflare DNS.
If you don’t currently own a domain, you can buy one right here on our registrar.
Step-by-Step Configuration
Then there are only a few steps to creating a new email address and setting up forwarding:
- Go to the email page on the Cloudflare dashboard.
- Select Configure.
- Enter the email address you want to create (remember, this is for your domain, so you can pick anything you like). Alternatively, you can choose to use a catch-all so that all possible emails addresses in your domain are considered valid and forwarded.
- The DNS configuration step is automatic if you don’t have email configured for your domain. Otherwise, we provide straightforward guidance on how to best configure it for your needs.
- Lastly, you just need to validate that the destination email belongs to you. Super simple, and exactly the same as you’ve done a million times before.
We did say we made it straightforward!
With efficiency and simplicity in mind, we’re launching Email Routing with support for multiple rules and message forwarding to any upstream inbox of your choice.
However, we feel like the email scene has been long-dormant, and we have exciting new features coming soon that advantage of the Cloudflare platform, resources, and know-how.
We’re also listening. If you have questions, suggestions, or new ideas, share them in the community forum. We’ll be around.
To start using Cloudflare Email Routing just join the waitlist today through this form. We will be opening up this service to more users on a daily basis, and promise the short wait will be worth it!
Tackling Email Spoofing and Phishing
Post Syndicated from Hannes Gerhart original https://blog.cloudflare.com/tackling-email-spoofing/


Today we’re rolling out a new tool to tackle email spoofing and phishing and improve email deliverability: The new Email Security DNS Wizard can be used to create DNS records that prevent others from sending malicious emails on behalf of your domain. This new feature also warns users about insecure DNS configurations on their domain and shows recommendations on how to fix them. The feature will first be rolled out to users on the Free plan and over the next weeks be made available for Pro, Business and Enterprise customers, as well.

Before we dive into what magic this wizard is capable of, let’s take a step back and take a look at the problem: email spoofing and phishing.
What is email spoofing and phishing?
Spoofing is the process of posing as someone else which can be used in order to gain some kind of illicit advantage. One example is domain spoofing where someone hosts a website like mycoolwebpaqe.xyz to trick users of mycoolwebpage.xyz to provide sensitive information without knowing they landed on a false website. When looking at the address bar side by side in a browser, it’s very hard to spot the difference.
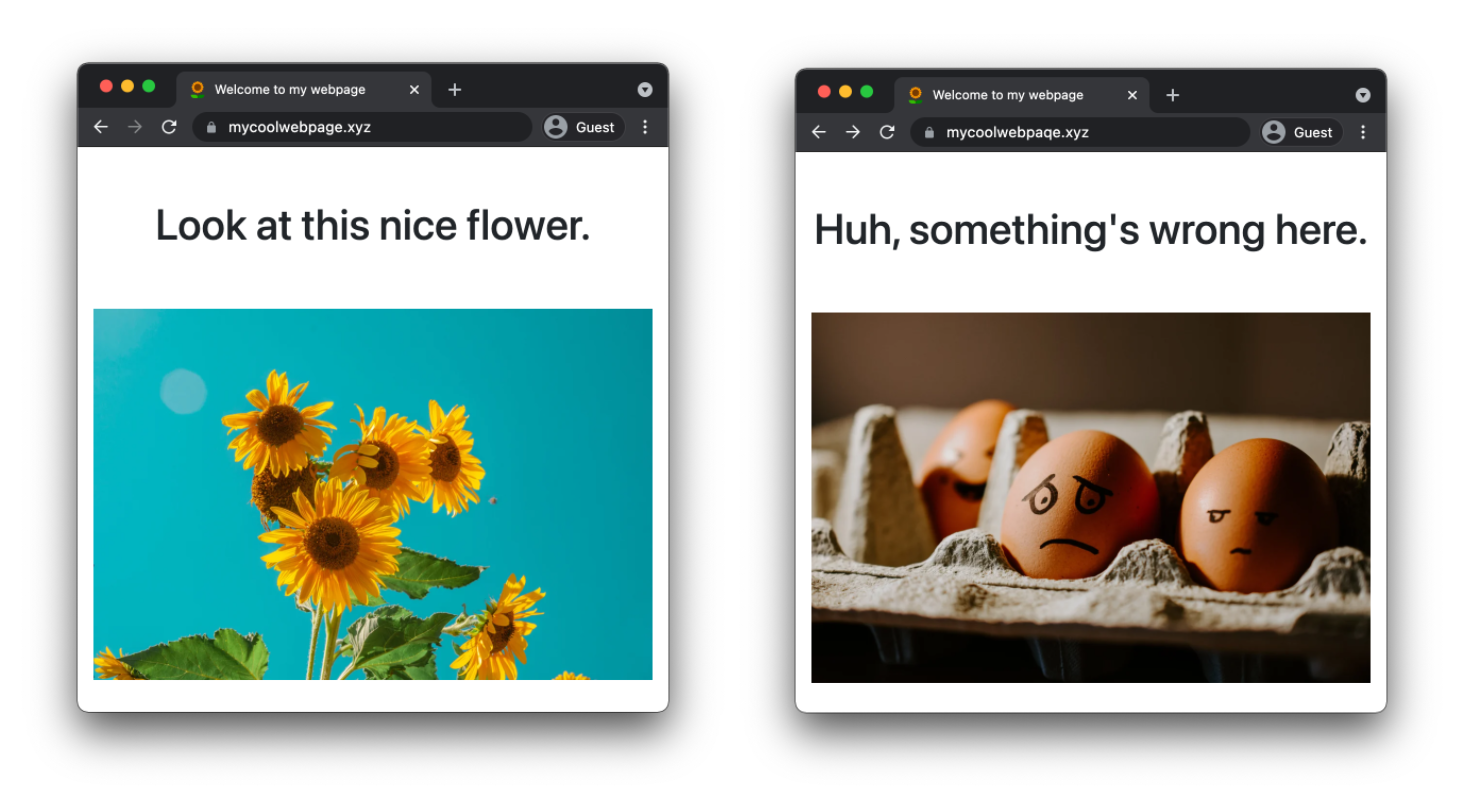
Then, there is email spoofing. In order to understand how this works, let’s take a look at a Cloudflare product update email I received on my personal email address. With most email providers you can look at the full source of an email which contains a number of headers and of course the body of the email.
Date: Thu, 23 Sep 2021 10:30:02 -0500 (CDT)
From: Cloudflare <[email protected]>
Reply-To: [email protected]
To: <my_personal_email_address>
Above you can see four headers of the email, when it was received, who it came from, who I should reply to, and my personal email address. The value of the From header is used to display the sender in my email program.

When I receive an email as above, I automatically assume this email has been sent from Cloudflare. However, nobody is stopped from sending an email with a modified From header from their mail server. If my email provider is not performing the right checks, which we will cover later in this blog post, I could be tricked into believing that an email was sent from Cloudflare, but it actually was not.

This brings us to the second attack type: phishing. Let’s say a malicious actor has successfully used email spoofing to send emails to your company’s customers that seem to originate from one of your corporate service emails. The content of these emails look exactly like a legitimate email from your company using the same styling and format. The email text could be an urgent message to update some account information including a hyperlink to the alleged web portal. If the receiving mail server of a user does not flag the email as spam or insecure origin, the user might click on the link which could execute malicious code or lead them to a spoofed domain asking for sensitive information.
According to the FBI’s 2020 Internet Crime Report, phishing was the most common cyber crime in 2020 with over 240,000 victims leading to a loss of over $50M. And the number of victims has more than doubled since 2019 and is almost ten times higher than in 2018.

In order to understand how most phishing attacks are carried out, let’s take a closer look at the findings of the 2020 Verizon Data Breach Investigations Report. It lies out that phishing accounts for more than 80% of all “social actions”, another word for social engineering attacks, making it by far the most common type of such an attack. Furthermore, the report states that 96% of social actions are sent via email and only 3% through a website and 1% via phone or text.

This clearly shows that email phishing is a serious problem causing Internet users a big headache. So let’s see what domain owners can do to stop bad actors from misusing their domain for email phishing.
How can DNS help prevent this?
Luckily, there are three anti-spoofing mechanisms already built into the Domain Name System (DNS):
- Sender Policy Framework (SPF)
- DomainKeys Identified Mail (DKIM)
- Domain-based Message Authentication Reporting and Conformance (DMARC)
However, it is not trivial to configure them correctly, especially for someone less experienced. In case your configuration is too strict, legitimate emails will be dropped or marked as spam. And if you keep your configuration too relaxed, your domain might be misused for email spoofing.
Sender Policy Framework (SPF)
SPF is used to specify which IP addresses and domains are permitted to send email on behalf of your domain. An SPF policy is published as a TXT record on your domain, so everyone can access it via DNS. Let’s inspect the TXT record for cloudflare.com:
cloudflare.com TXT "v=spf1 ip4:199.15.212.0/22 ip4:173.245.48.0/20 include:_spf.google.com include:spf1.mcsv.net include:spf.mandrillapp.com include:mail.zendesk.com include:stspg-customer.com include:_spf.salesforce.com -all"
An SPF TXT record always needs to start with v=spf1. It usually contains a list of IP addresses of sending email servers using the ip4 or ip6 mechanism. The include mechanism is used to reference another SPF record on another domain. This is usually done if you are relying on other providers that need to send emails on our behalf. You can see a few examples in the SPF record of cloudflare.com above: we’re using Zendesk as customer support software and Mandrill for marketing and transactional emails.
Finally, there is the catch-all mechanism -all which specifies how all incoming, but unspecified emails should be treated The catch-all mechanism is preceded by a qualifier that can be either + (Allow), ~ (Softfail) or – (Fail). Using the Allow qualifier is not recommended as it basically makes the SPF record useless and allows all IP addresses and domains to send email on behalf of your domain. Softfail is interpreted differently by receiving mail servers, marking an email as Spam or insecure, depending on the server. Fail tells a server not to accept any emails originating from unspecified sources.
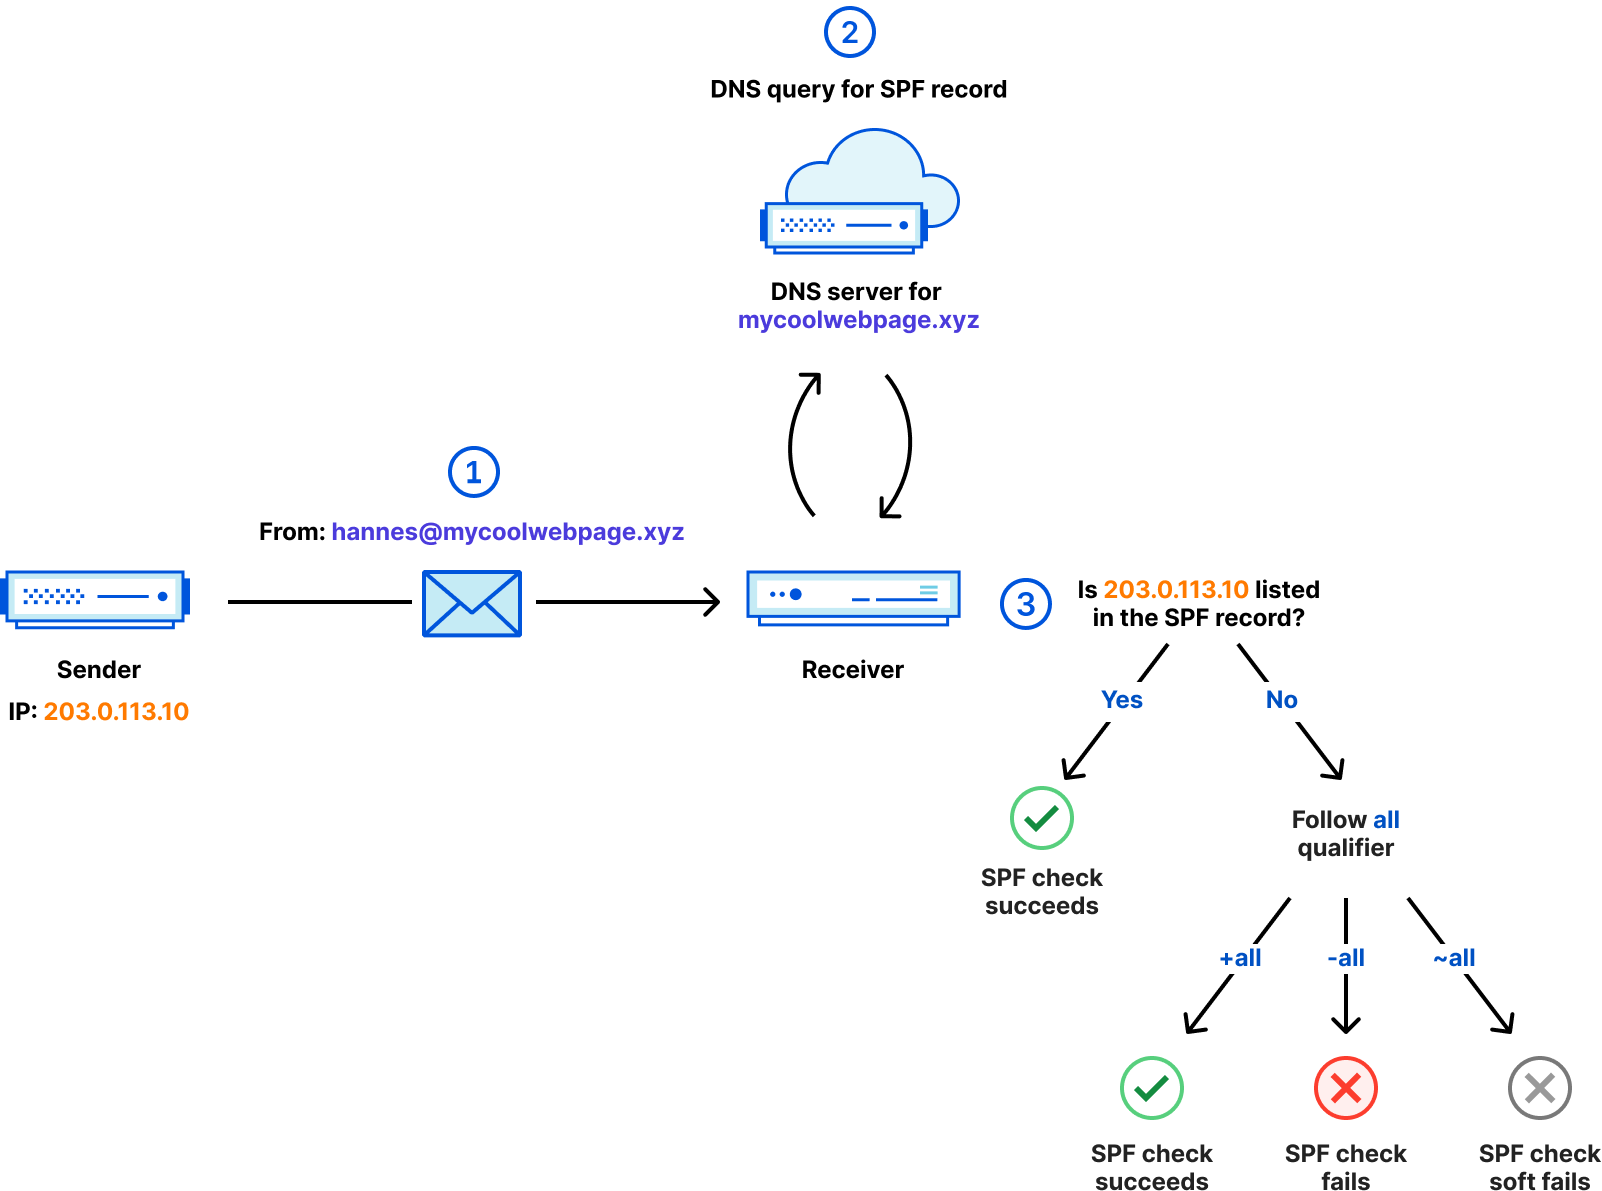
The diagram above shows the steps taken to ensure a received email is SPF compliant.
- The email is sent from the IP address
203.0.113.10and contains aFromheader with the value of[email protected]. - After receiving the email, the receiver queries the SPF record on
mycoolwebpage.xyzto retrieve the SPF policy for this domain. - The receiver checks if the sending IP address
203.0.113.10is listed in the SPF record. If it is, the email succeeds the SPF check. If it is not, the qualifier of theallmechanism defines the outcome.
For a full list of all mechanisms and more details about SPF, refer to RFC7208.
DomainKeys Identified Mail (DKIM)
Okay, with SPF we’ve ensured that only permitted IP addresses and domains can send emails on behalf of cloudflare.com. But what if one of the IPs changes owner without us noticing and updating the SPF record? Or what if someone else who is also using Google’s email server on the same IP tries to spoof emails coming from cloudflare.com?
This is where DKIM comes in. DKIM provides a mechanism to cryptographically sign parts of an email — usually the body and certain headers — using public key encryption. Before we dive into how this works, let’s take a look at the DKIM record used for cloudflare.com:
google._domainkey.cloudflare.com. TXT "v=DKIM1; k=rsa; p=MIGfMA0GCSqGSIb3DQEBAQUAA4GNADCBiQKBgQDMxbNxA2V84XMpZgzMgHHey3TQFvHkwlPF2a11Ex6PGD71Sp8elVMMCdZhPYqDlzbehg9aWVwPz0+n3oRD73o+JXoSswgUXPV82O8s8dGny/BAJklo0+y+Bh2Op4YPGhClT6mRO2i5Qiqo4vPCuc6GB34Fyx7yhreDNKY9BNMUtQIDAQAB"
The structure of a DKIM record is <selector>._domainkey.<domain>, where the selector is provided by your email provider. The content of the DKIM TXT record always starts with v=DKIM1 followed by the public key. We can see the public key type, referenced by the k tag, and the public key itself, preceded by the p tag.
Below is a simplified sequence how the signing and DKIM check work:
- The sending email server creates a hash from the email content.
- The sending email server encrypts this hash with the private DKIM key.
- The email is sent, containing the encrypted hash.
- The receiving email server retrieves the public key from the DKIM TXT record published on the email domain.
- The receiving email server decrypts the hash using the public DKIM key.
- The receiving email server generates the hash from the email content.
- If the decrypted hash and the generated hash match, email authenticity is proven. Otherwise, the DKIM check fails.
The full DKIM specification can be found in RFC4871 and RFC5672.
Domain-based Message Authentication Reporting and Conformance (DMARC)
Domain-based Message Authentication Reporting and Conformance, that’s definitely a mouthful. Let’s focus on two words: Reporting and Conformance. DMARC provides exactly that. Regular reports let the email sender know how many emails are non-conforming and potentially spoofed. Conformance helps provide a clear signal to the email receiver how to treat non-conforming emails. Email receivers might impose their own policies for emails that fail SPF or DKIM checks even without a DMARC record. However, the policy configured on the DMARC record is an explicit instruction by the email sender, so it increases the confidence for email receivers what to do with non-conforming emails.
Here is the DMARC record for cloudflare.com
_dmarc.cloudflare.com. TXT "v=DMARC1; p=reject; pct=100; rua=mailto:[email protected]"
The DMARC TXT record is always set on the _dmarc subdomain of the email domain and — similar to SPF and DKIM — the content needs to start with v=DMARC1. Then we see three additional tags:
The policy tag (p) indicates how email receivers should treat emails that fail SPF or DKIM checks. Possible values are none, reject, and quarantine. The none policy is also called monitoring only and allows emails failing the checks to still be accepted. By specifying quarantine, email receivers will put SPF or DKIM non-conforming emails in the Spam folder. With reject, emails are dropped and not delivered at all if they fail SPF or DKIM.
The percentage tag (pct) can be used to apply the specified policy to a subset of incoming emails. This is helpful if you’re just rolling out DMARC and want to make sure everything is configured correctly by testing on a subset.
The last tag we can find on the record is the reporting URI (rua). This is used to specify an email address that will receive aggregate reports (usually daily) about non-conforming emails.
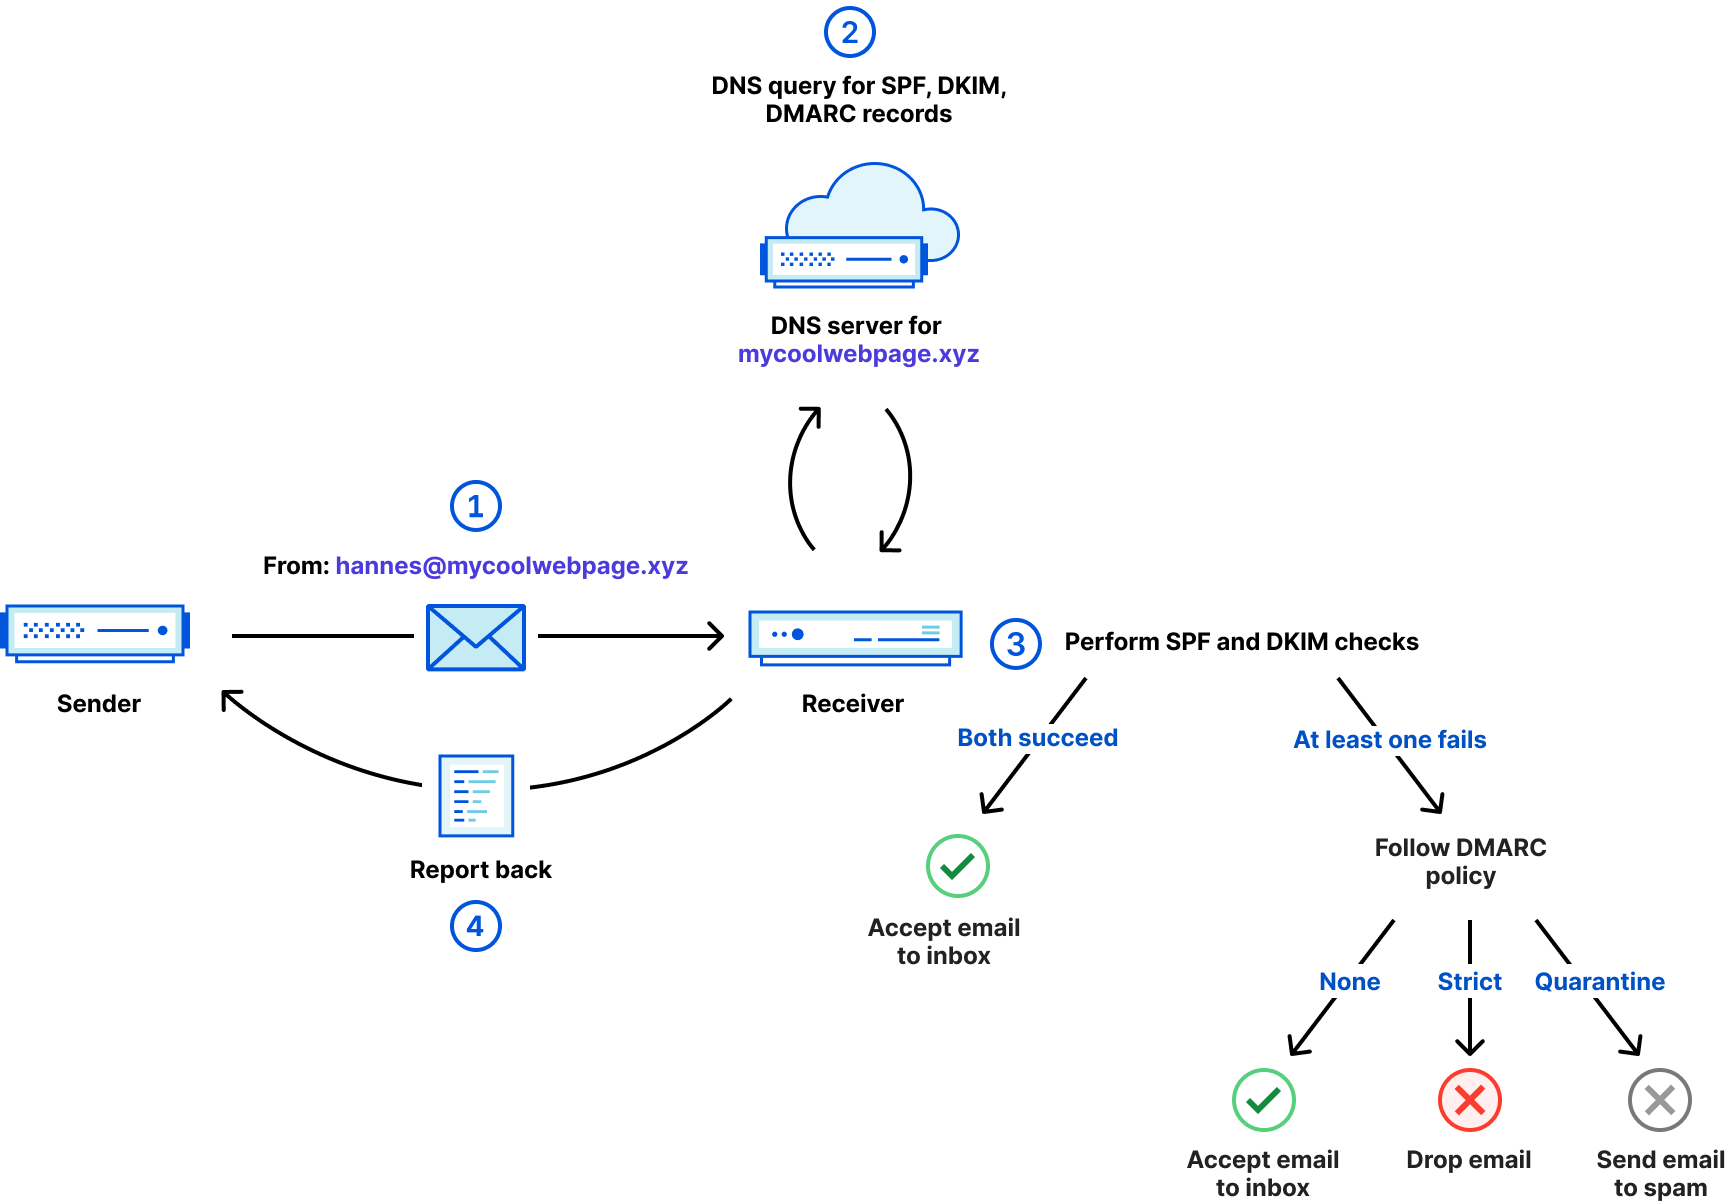
Above, we can see how DMARC works step by step.
- An email is sent with a
Fromheader containing[email protected]. - The receiver queries SPF, DKIM and DMARC records from the domain
mycoolwebpage.xyzto retrieve the required policies and the DKIM public key. - The receiver performs SPF and DKIM checks as outlined previously. If both succeed, the email is accepted and delivered to the inbox. If either SPF or DKIM check fails, the DMARC policy will be followed and determines if the email is still accepted, dropped or sent to the spam folder.
- Finally, the receiver sends back an aggregate report. Depending on the email specified in the
ruatag this report could also be sent to a different email server which is responsible for that email address.
Other optional tags and the complete DMARC specification is described in RFC7489.
A few numbers on the current adoption
Now that we’ve learned what the problem is and how to tackle it using SPF, DKIM, and DMARC, let’s see how widely they’re adopted.
Dmarc.org has published the adoption of DMARC records of domains in a representative dataset. It shows that by the end of 2020, still less than 50% of domains even had a DMARC record. And remember, without a DMARC record there is no clear enforcement of SPF and DKIM checks. The study further shows that, of the domains that have a DMARC record, more than 65% are using the monitoring only policy (p=none), so there is a significant potential to drive this adoption higher. The study does not mention if these domains are sending or receiving emails, but even if they didn’t, a secure configuration should include a DMARC record (more about this later).
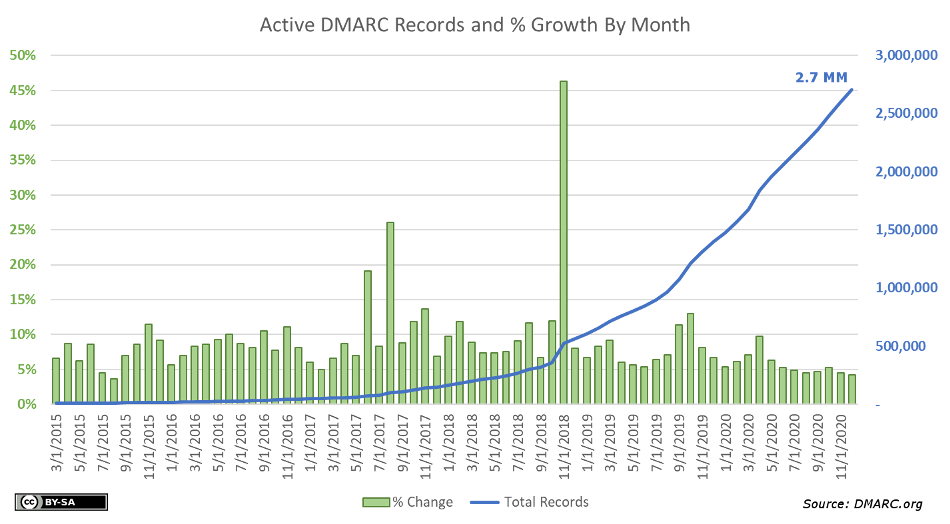
Another report from August 1, 2021 tells a similar story for domains that belong to entities in the banking sector. Of 2,881 banking entities in the United States, only 44% have published a DMARC record on their domain. Of those that have a DMARC record, roughly 2 out of 5 have set the DMARC policy to None and another 8% are considered “Misconfigured”. Denmark has a very high adoption of DMARC on domains in the banking sector of 94%, in contrast to Japan where only 13% of domains are using DMARC. SPF adoption is on average significantly higher than DMARC, which might have to do with the fact that the SPF standard was first introduced as experimental RFC in 2006 and DMARC only became a standard in 2015.
| Country | Number of entities | SPF present | DMARC present |
|---|---|---|---|
| Denmark | 53 | 91% | 94% |
| UK | 83 | 88% | 76% |
| Canada | 24 | 96% | 67% |
| USA | 2,881 | 91% | 44% |
| Germany | 39 | 74% | 36% |
| Japan | 90 | 82% | 13% |
This shows us there is quite some room for improvement.
Enter: Email Security DNS Wizard
So what are we doing to increase the adoption of SPF, DKIM, and DMARC and tackle email spoofing and phishing? Enter the new Cloudflare Email Security DNS Wizard.
Starting today, when you’re navigating to the DNS tab of the Cloudflare dashboard, you’ll see two new features:
- A new section called Email Security
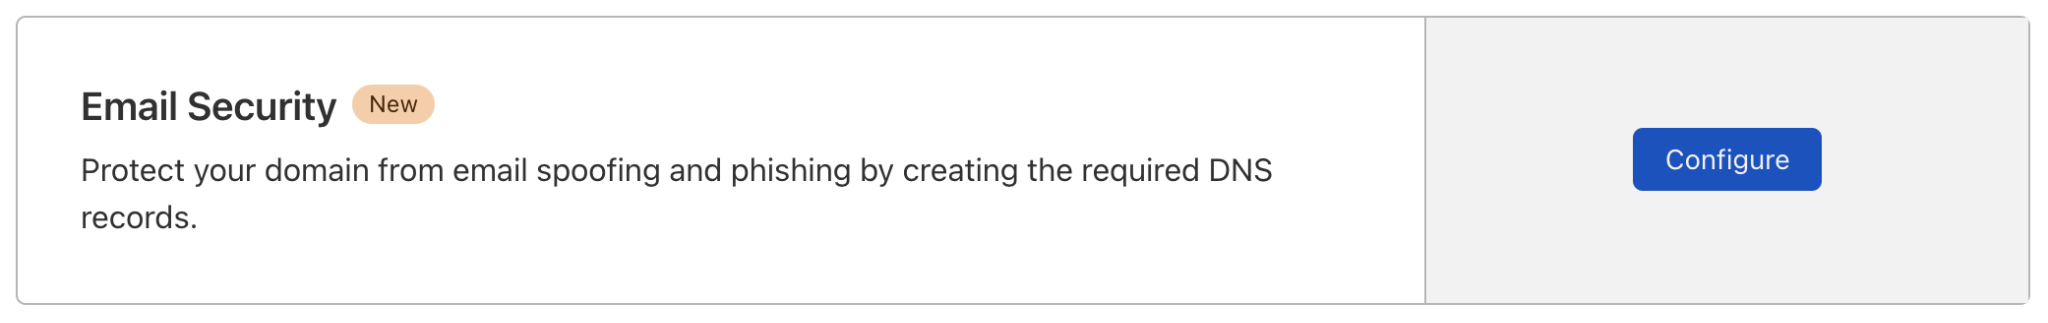
- New warnings about insecure configurations
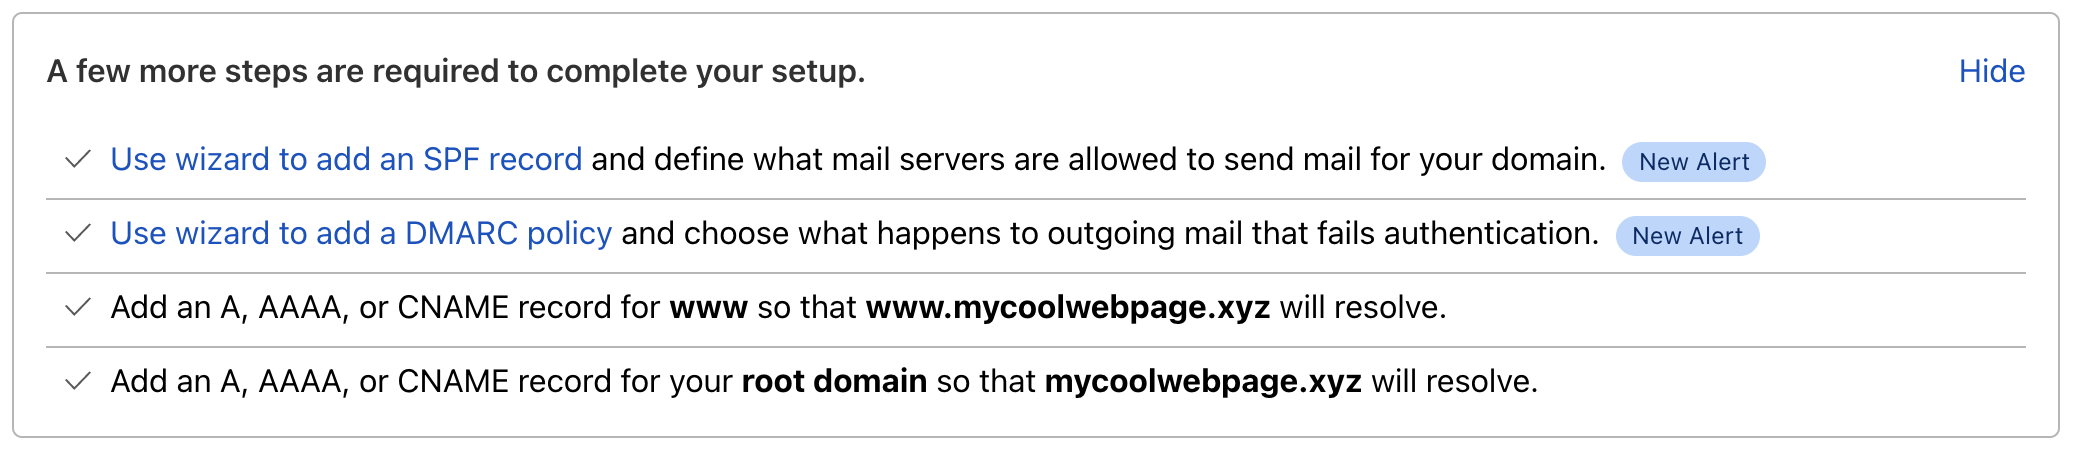
In order to start using the Email Security DNS Wizard, you can either directly click the link in the warning which brings you to the relevant section of the wizard or click Configure in the new Email Security section. The latter will show you the following available options:
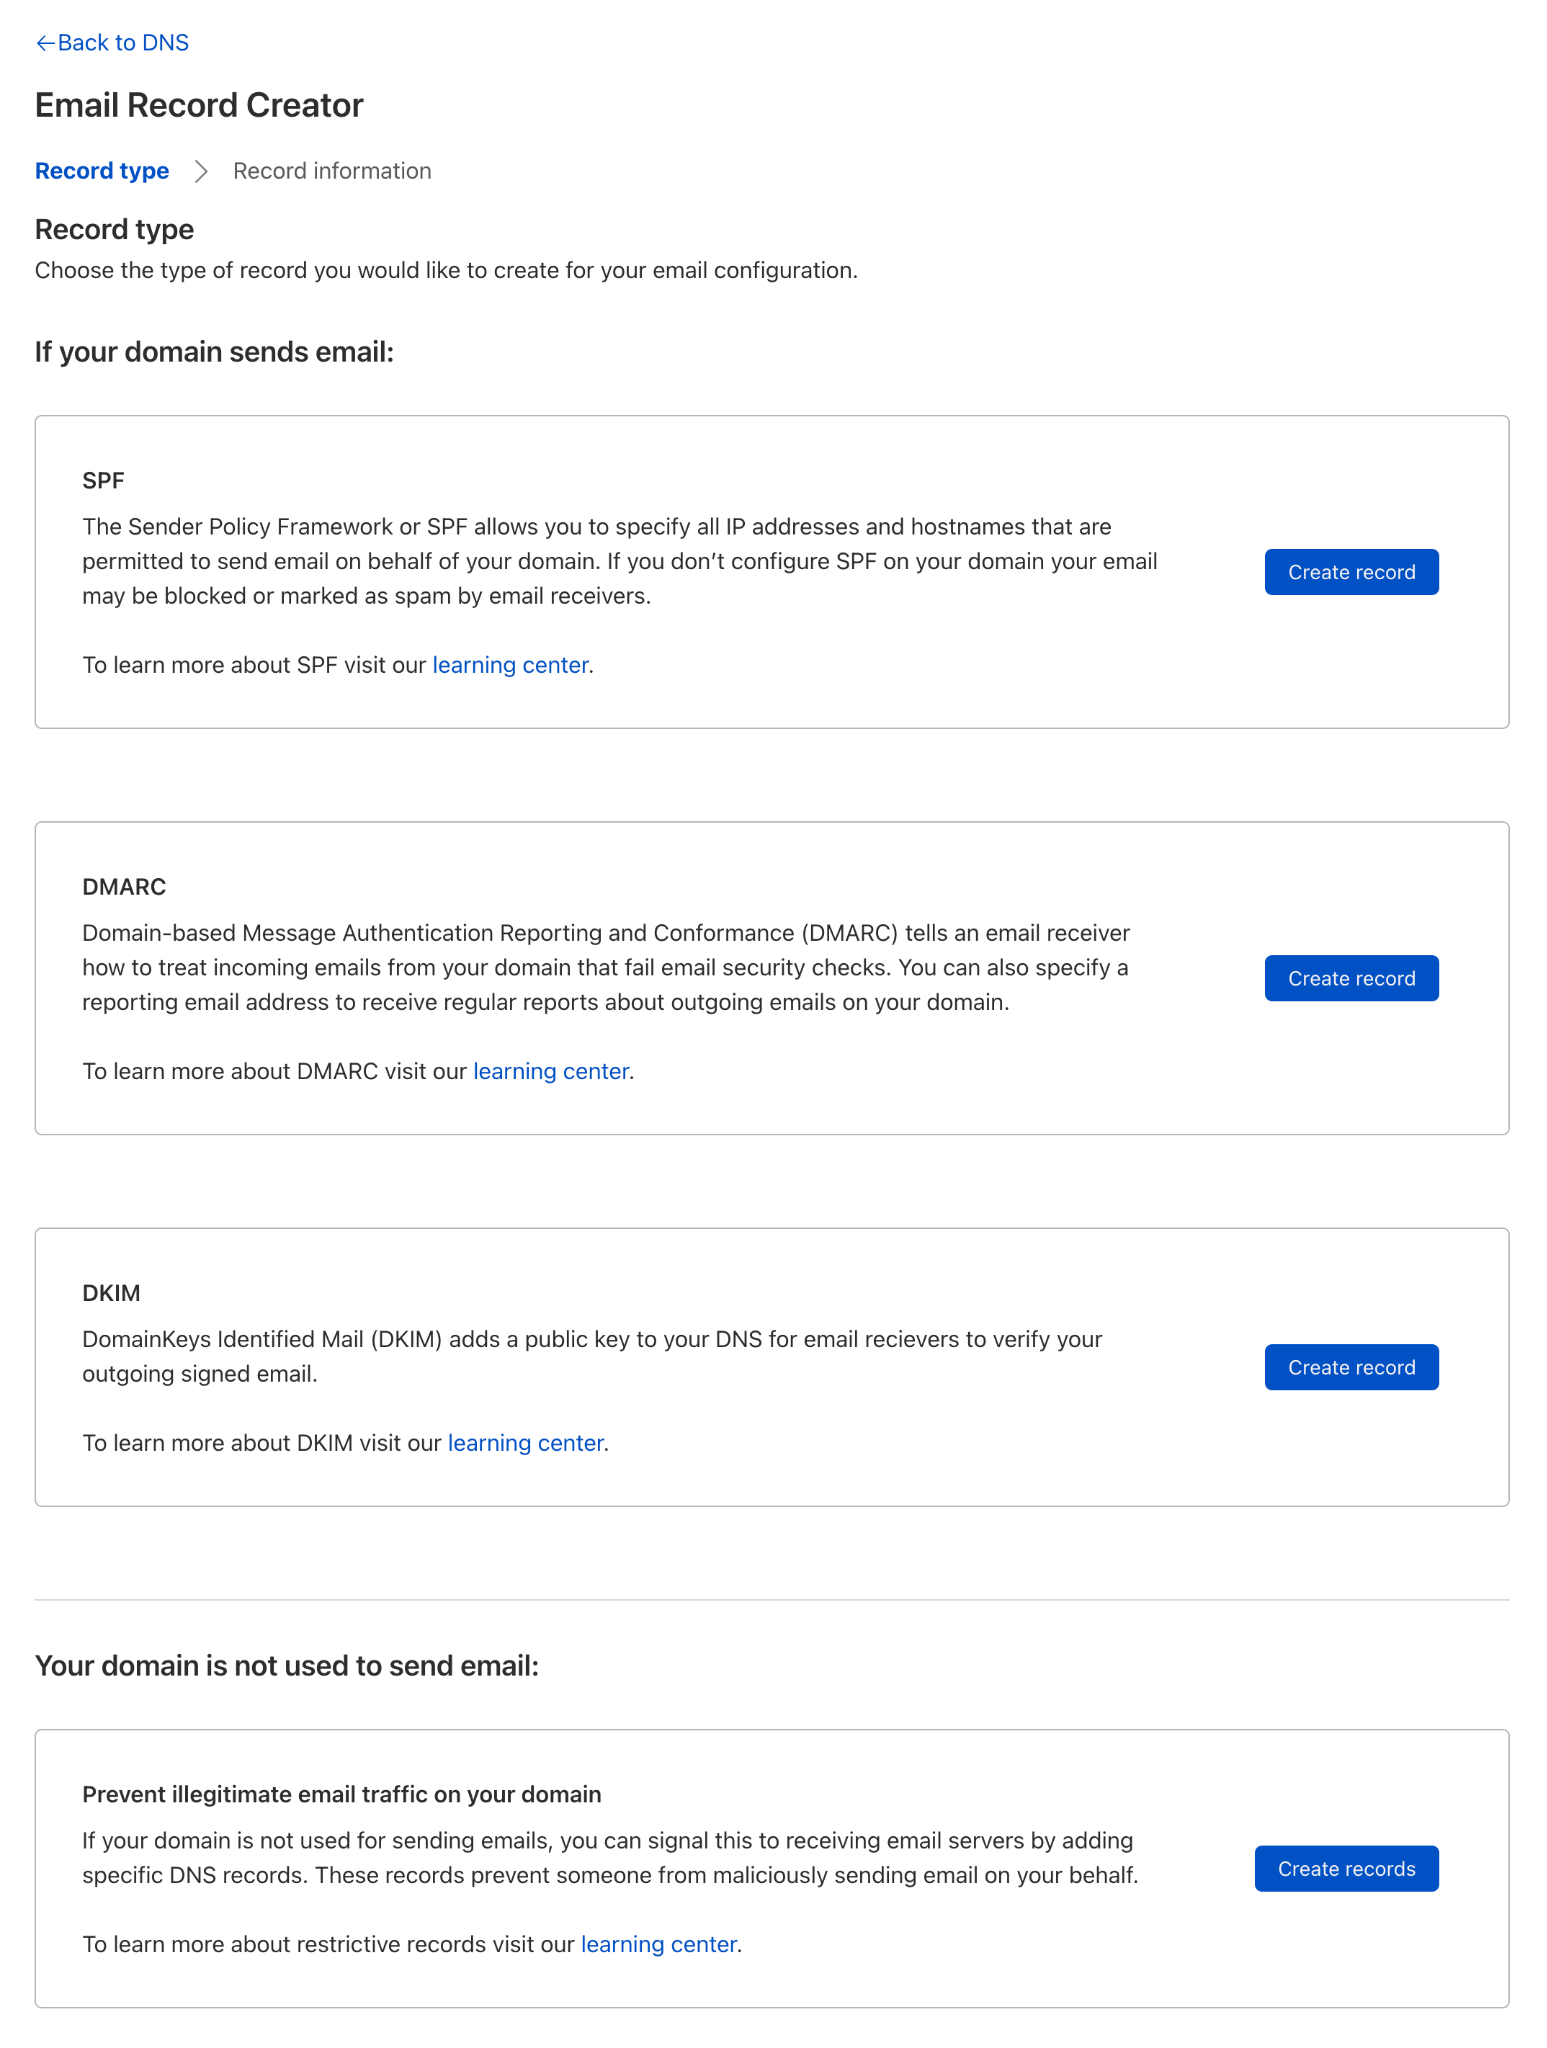
There are two scenarios. You’re using your domain to send email, or you don’t. If you do, you can configure SPF, DKIM, and DMARC records by following a few simple steps. Here you can see the steps for SPF:
If your domain is not sending email, there is an easy way to configure all three records with just one click:
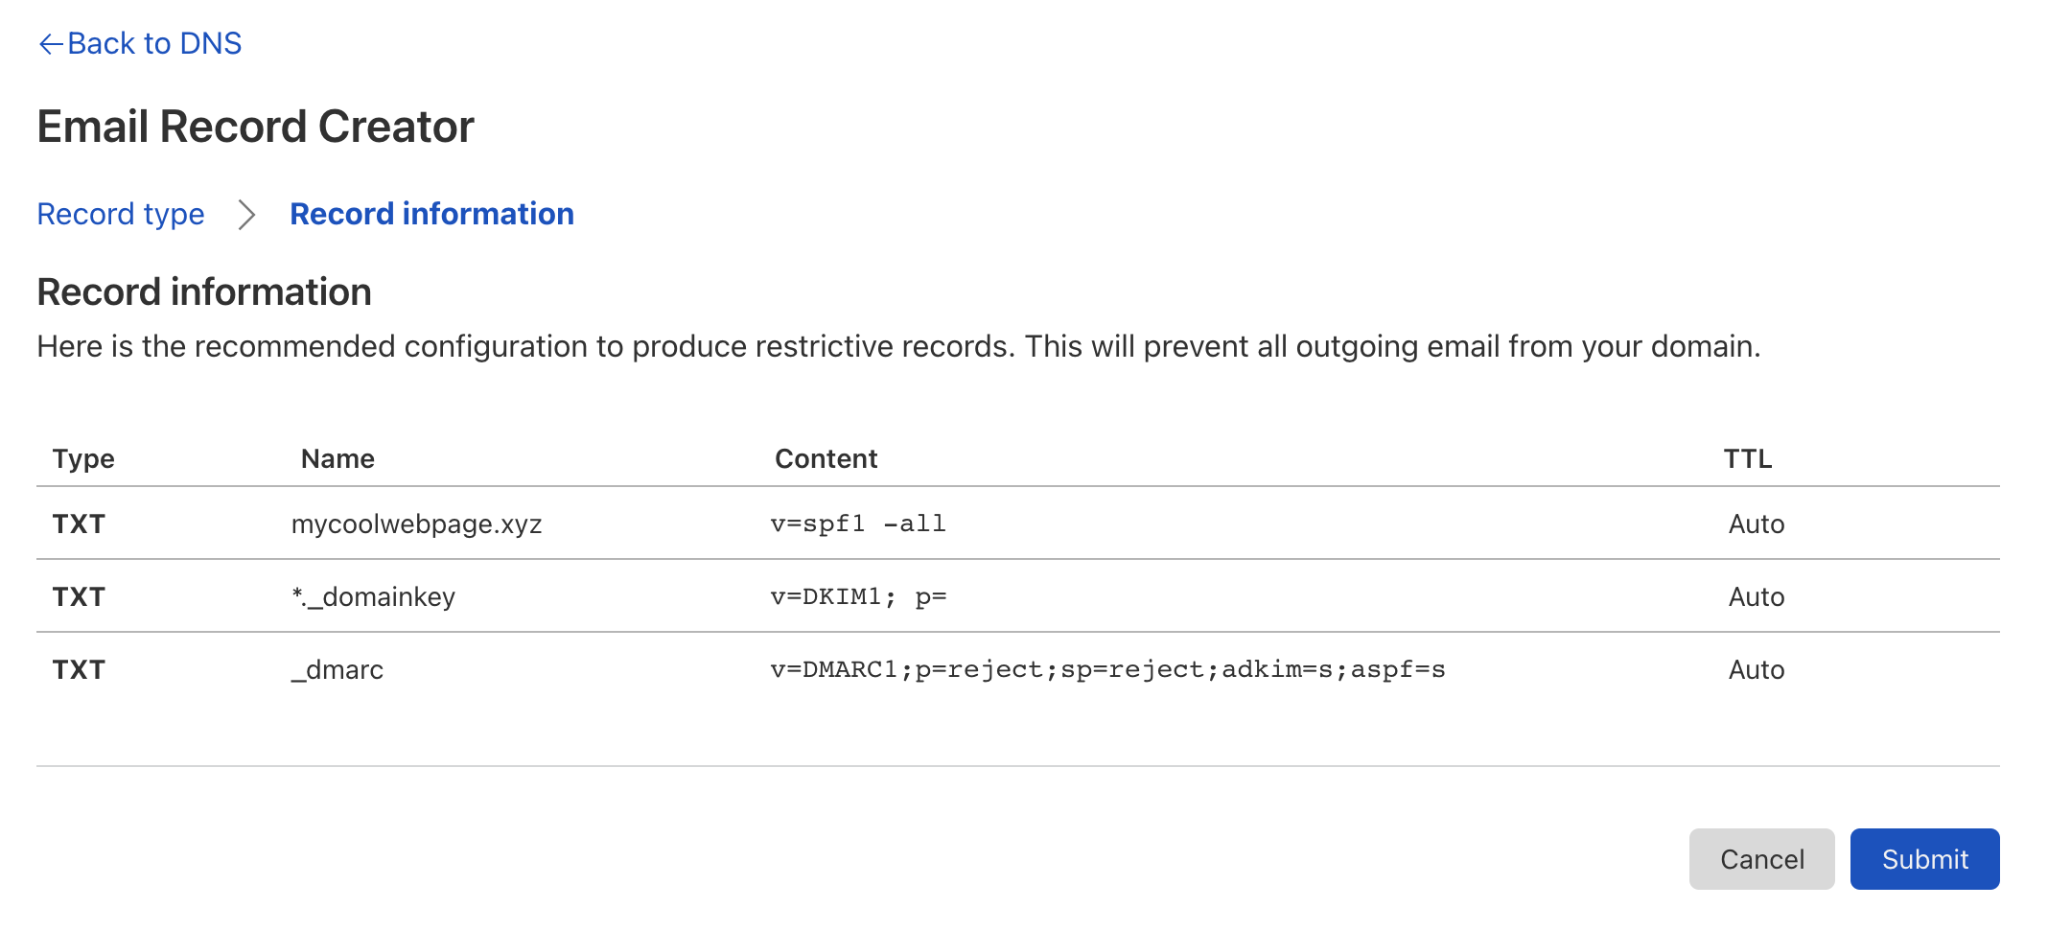
Once you click Submit, this will create all three records configured in such a way that all emails will fail the checks and be rejected by incoming email servers.
example.com			TXT	"v=spf1 -all"
*._domainkey.example.com.	TXT	"v=DKIM1; p="
_dmarc.example.com.		TXT	"v=DMARC1; p=reject; sp=reject; adkim=s; aspf=s;"
Help tackle email spoofing and phishing
Out you go and make sure your domain is secured against email spoofing and phishing. Just head over to the DNS tab in the Cloudflare dashboard or if you are not yet using Cloudflare DNS, sign up for free in just a few minutes on cloudflare.com.
If you want to read more about SPF, DKIM and DMARC, go check out our new learning pages about email related DNS records.
New for Amazon Connect: Voice ID, Wisdom, and Outbound Communications
Post Syndicated from Sébastien Stormacq original https://aws.amazon.com/blogs/aws/three-new-capabilities-for-amazon-connect/
During the AWS re:Invent conference last year, I wrote about new capabilities added to Amazon Connect. Today, I am happy to announce the general availability of two of these capabilities, Voice ID and Wisdom, and the launch of a new one. High-volume outbound communications allows, as the name implies, the initiation and management of outbound communications over voice, SMS, or email.
Amazon Connect is an easy-to-use omnichannel cloud contact center that helps you provide customer service at a lower cost. In just a few clicks, you can set up and make changes to your contact center, so agents can begin helping customers right away.
Amazon Connect Wisdom
Wisdom reduces the time agents spend searching for answers. Today, when agents require access to information to help a customer, they lose time trying to navigate different data sources in siloes: FAQ, files, wiki pages, customer call history, knowledge bases, etc.
When using Wisdom, agents simply enter a question or phrase in their agent desktop application, such as “what is the pet policy in hotel rooms”, and Wisdom searches connected repositories and returns the most relevant information and best answer to handle the customer issue.
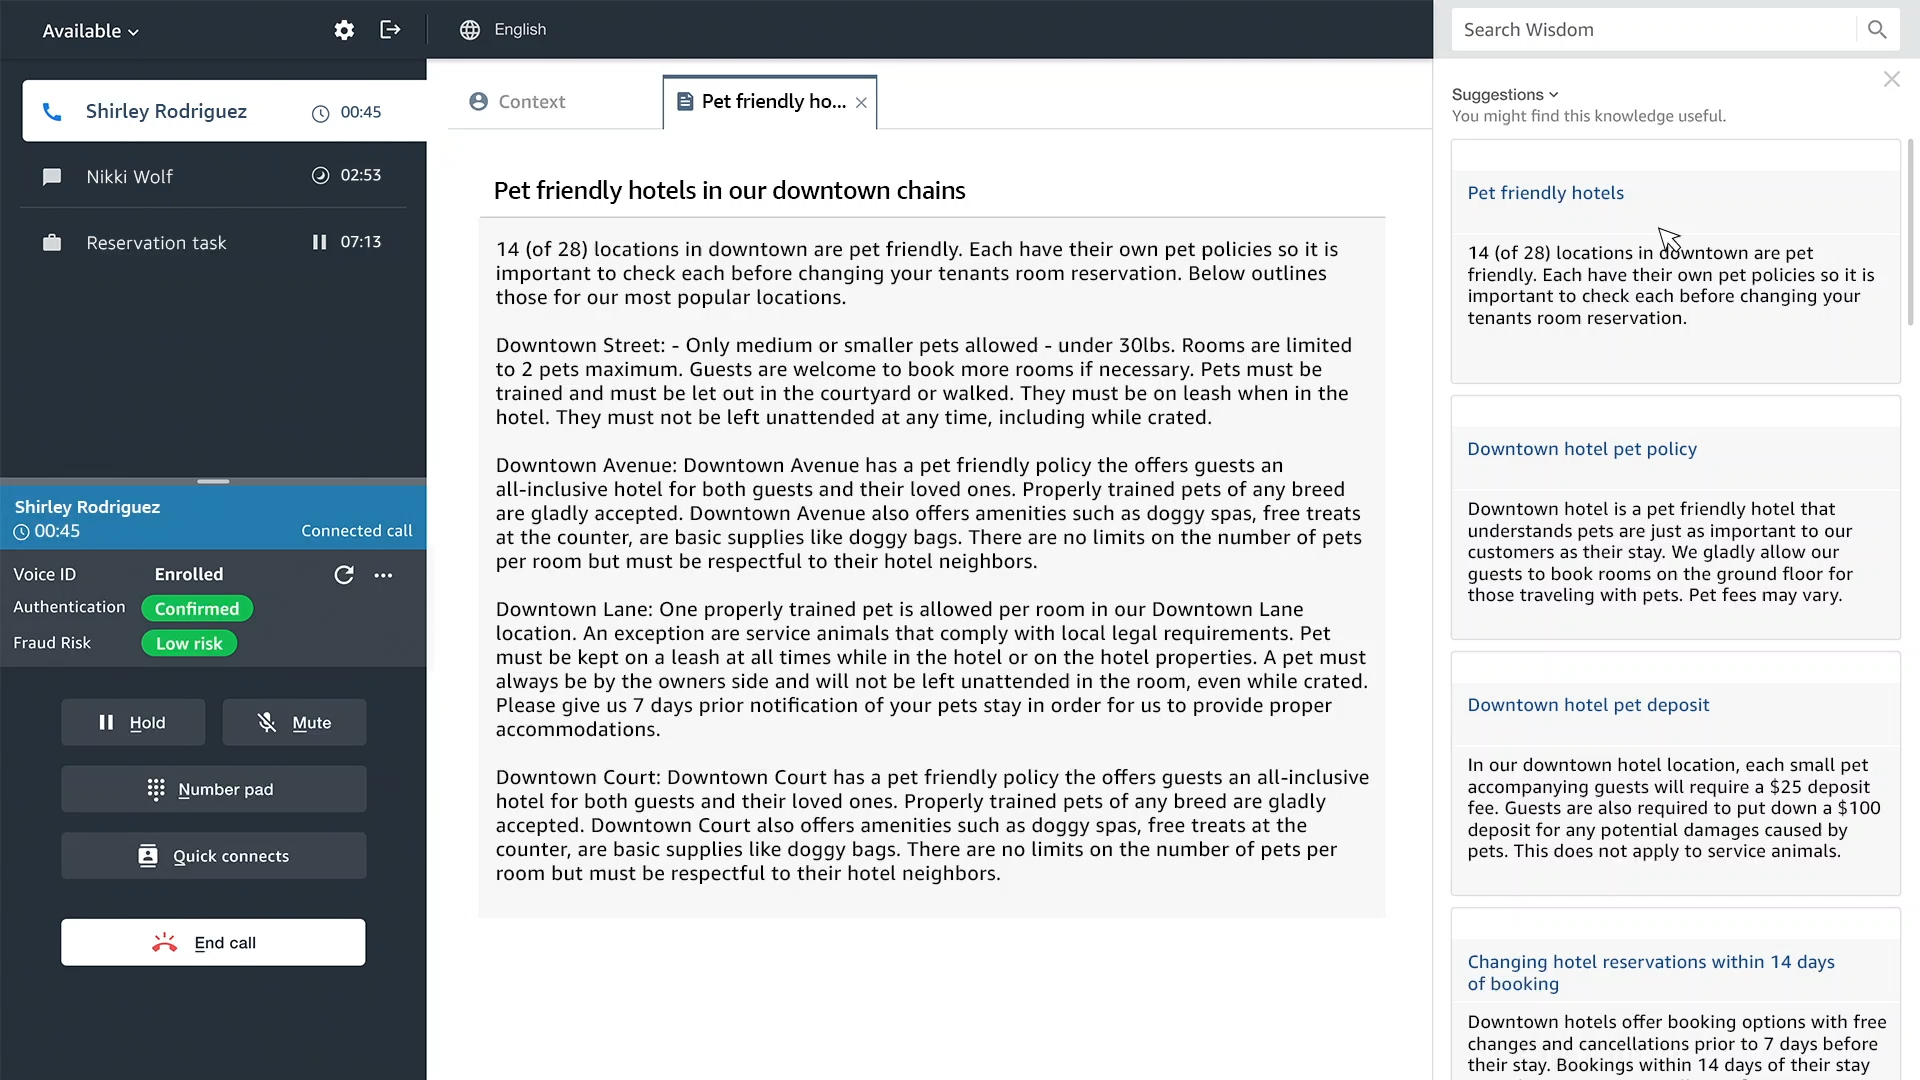
Wisdom also uses real-time call transcripts from Contact Lens for Amazon Connect to automatically detect customer issues during calls and to recommend relevant content stored across connected knowledge repositories, without requiring agents to even enter a question.
Wisdom connects to knowledge repositories with built-in connectors for third-party applications including Salesforce and ServiceNow. You can also ingest content from other knowledge stores using the Wisdom ingestion APIs.

Amazon Connect Voice ID
How many times have you been through an authentication procedure when calling a contact center? Voice ID simplifies this to make voice interactions faster and more secure. It uses machine learning to provide real-time caller authentication based on the caller’s voice.
To effectively recognize me as “Sébastien”, Voice ID must learn how I talk. This is the enrollment phase. It only requires 30 seconds of voice recording to enroll a caller.
When I call the same contact center again, Voice ID compares the sound of my voice with the one enrolled earlier. This is the verification phase. It only requires between 5 and 10 seconds of my voice to authenticate me. The verification phase generates a confidence score and a status displayed in the agent desktop app.
Contact Center administrators can use this result to configure different flows depending on the verification outcome. The routing is configured with a simple configuration panel such as this one: To meet with personal data protection laws, contact center agents capture my consent to use Voice ID.
High-Volume Outbound Communications
Typical contact centers are designed to receive customer calls. However, there is a growing set of use cases where contact centers send outbound communications as well. For example, to call customers back,to inform them about the progress of a case, to confirm an appointment, to renew a subscription, or for telemarketing, just to name a few.
The majority of these outbound communications are phone calls. When doing so, traditional contact center agents dial the number provided by a customer management system and wait for someone to answer. Typically, only 10% of the calls are answered. This process is highly inefficient.
In the Amazon Connect administration console, I select High volume outbound communication, then I select Create Campaign.

I then configure the details. I give the campaign a name, then I select one of my outbound contact flow and a contact queue associated with an outbound phone number.

The predictive dialer makes more calls than available agents. It uses metrics such as campaign performance, expected pick-up rates, and the number of available agents to adjust the number of calls. When a call is answered, it detects when a human is on the line (vs. an automatic machine, a fax line, etc.). Only calls answered by humans are routed to an available agent. The Amazon Connect agent application shows the call script that was specified during setup, along with relevant customer information.
The progressive dialer is more conservative, it uses a 1:1 ratio between calls and available agents.
Amazon Connect not only adds high-volume outbound communication capabilities for voice, but also for SMS, and email. Amazon Connect comes with pre-built connectors for importing customer contact lists from external systems, such as Salesforce, Zendesk, Marketo, and Amazon Pinpoint. No coding required.
Contact center managers have access to real-time metrics such as contact volume, abandonment rates, average connection times, and minimum ring times to optimize agent efficiency. These metrics help to understand the status of their campaigns and ensure compliance with applicable regulations, such as maximum call abandonment rates. Contact center managers use historical reports of these metrics to understand the effectiveness of all their communications campaigns over time.
To ensure a fair usage of the high-volume outbound communication capability, you must apply for production access to use the predictive dialer as well as SMS and email. You may submit a service request detailing your use cases and business context, which will be used to validate your legitimacy as a sender. Once access is granted, Amazon Connect continuously monitors your usage and the team might revoke access when fraud is suspected.
If you want to try it out yourself, you may apply to the preview by filling out this form.
Pricing and Availability
As usual, there are no upfront costs or minimum usage fees. You pay only what you use: a price per minute of outbound calls and per email or SMS message. The details are up-to-date on the Amazon Connect pricing page.
Regional availability slightly differ for each of these three new capabilities, here is a the list of AWS Regions where they are available:
- Wisdom: US West (Oregon), US East (N. Virginia), Europe (London), Europe (Frankfurt), Asia Pacific (Tokyo), and Asia Pacific (Sydney).
- Voice ID: US West (Oregon), US East (N. Virginia), Europe (London), Europe (Frankfurt), Asia Pacific (Tokyo), Asia Pacific (Singapore), and Asia Pacific (Sydney)
- High volume outbound communication (preview): US East (N. Virginia), Europe (London), and US West (Oregon). More Regions will be added when it will be generally available.
As usual, let us know what you think about these new capabilities and how you use them. Go build your own contact center in the cloud today.