Announcing Cloudflare TV as a Service

Post Syndicated from Fallon Blossom original https://blog.cloudflare.com/cloudflare-tv-as-a-service/

Announcing Cloudflare TV as a Service

Announcing Cloudflare TV as a Service

In June 2020, Cloudflare TV made its debut: a 24/7 streaming video channel, focused on topics related to building a better Internet (and the people working toward that goal). Today, over 1,000 live shows later, we’re excited to announce that we’re making the technology we used to build Cloudflare TV available to any other business that wants to run their own 24×7 streaming network. But, before we get to that, it’s worth reflecting on what it’s been like for us to run one ourselves.

Let’s take it from the top.

Cloudflare TV began as an experiment in every way you could think of, one we hoped would help capture the serendipity of in-person events in a world where those were few and far between. It didn’t take long before we realized we had something special on our hands. Not only was the Cloudflare team thriving on-screen, showcasing an amazing array of talent and expertise — they were having a great time doing it. Cloudflare TV became a virtual watercooler, spiked with the adrenaline rush of live TV.

One of the amazing things about Cloudflare TV has been the breadth of content it’s inspired. Since launching, CFTV has hosted over 1,000 live sessions, featuring everything from marquee customer events with VIP speakers to game shows and DJ sets. Cloudflare’s employee resource groups have hosted hundreds of sessions speaking to their unique experiences, sharing a wealth of advice with the next generation of technology leaders. All told, we’ve welcomed over 650 Cloudflare employees and interns — and over 500 external guests, including the likes of Intel CEO Pat Gelsinger, Gradient Ventures board partner Bonita Stewart, Broadcom CTO Andy Nallappan, and Zendesk SVP Christina Liu.

Tune In, Geek Out: A CFTV Montage

This is Cloudflare TV, so of course we put an emphasis on technical content for viewers of all stripes. When we announce a new product or protocol on the Cloudflare Blog, we often host live sessions on CFTV the same day, featuring the engineers who wrote the code that just shipped. Every week, we broadcast episodes on cryptography, on learning how to code, and on the hardware that powers Cloudflare’s network in over 250 cities around the world.

Whether you’re new to Cloudflare TV or a longtime viewer, we encourage you to pay a visit to the just-launched Discover page, where you’ll find many of our most-loved shows on demand, ranging from Latest from Product and Engineering, to perennial favorite Silicon Valley Squares, to Yes We Can, featuring women leaders from across the tech industry. You can also browse upcoming Live segments and easily add them to your calendar.

One of the most promising indicators that we’re on the right track has been the feedback we’ve gotten, not just from viewers — but from companies eager to know which platform we were using to power CFTV. To date we haven’t had much to offer them other than our sincere thanks, but as of today we’re able to share something much more exciting.

But first: a look behind the scenes.

The Production Stack

We didn’t initially set out to build Cloudflare TV from scratch. But as we explored our available options, we quickly realized that few solutions were designed for 24/7 linear streaming, and fewer still were optimized to be managed by a globally-distributed team. Thankfully, at Cloudflare, we like to build.

Our engineers worked at a blazing pace to build our own homegrown system, tapping open-source projects where we could, and inventing the things that didn’t yet exist. Among the starring components:

  • Brave (BBC) — Brave is an open-source project named for a highly descriptive acronym: Basic Real-Time Audio Video Editor. It serves as the Cloudflare TV switchboard, allowing us to jump from live content to commercial to a pre-recorded session and back automatically, based on our broadcast schedule. The only issue with Brave is that, as the BBC put it: it’s a prototype. One that hasn’t been updated since 2018…
Announcing Cloudflare TV as a Service
The CFTV Switchboard (Now streaming: Latest from Product & Engineering)
  • Zoom — When we first designed Cloudflare TV, there was one directive that stood above the others: it had to be easy. If presenters had to deal with installing a browser plugin or unfamiliar app, we knew we’d lose many of them — especially external guests. Zoom emerged as the clear answer, and thanks to its RTMP broadcast feature, it’s worked seamlessly to facilitate live content on Cloudflare TV. In most cases, participating in a CFTV session is as simple as joining a Zoom meeting.
  • Cloudflare Workers — Put simply, Cloudflare TV wouldn’t exist were it not for Cloudflare Workers. Workers is the glue that brings together each of the disparate components of the platform — handling authentication, application logic, securely relaying data from our backend to our frontend, and sprinkling SEO optimizations across the site. It’s the first tool we reach for, and often the only one we need.
  • Cloudflare Stream — With over 1,000 episodes in our content library, we have a lot of assets to manage. Thankfully Stream makes it easy: episodes are uploaded and automatically transcoded to the appropriate bitrate, and we use Stream embeds to power Video on Demand across the entire platform. We also use the Stream API to deliver recordings to our backend switchboard so that they can be seamlessly rebroadcast alongside our Live sessions.
  • Cloudflare for Teams — Cloudflare TV is obviously public-facing, but there are an array of dashboards and admin interfaces that are only accessible to select members of the Cloudflare team. Thankfully the Cloudflare for Teams suite, including Cloudflare Access, makes it easy for us to set up custom rulesets that keep everything secure, without any cumbersome VPNs or authentication hurdles.

We Get By With a Little Help from Our Engs

We knew from the beginning that it wasn’t enough for Cloudflare TV to be easy for presenters — we needed to be able to run it with a relatively small team, working remotely, most of whom were juggling other responsibilities.

A special shoutout goes to the members of Cloudflare’s office and executive admin teams, whose roles were dramatically impacted by the pandemic. Each of them has stepped up and taken on the mantle of Cloudflare TV Producer, providing technical support, calming nerves, and facilitating each one of our live sessions. We couldn’t do it without them, nor would we want to.

Even so, running a TV station is a lot of work, and we had little choice but to make the platform as efficient as possible — automating away our pain points, and developing intuitive admin tools to empower our team. Here are some of the key contributors to the system’s efficiency:

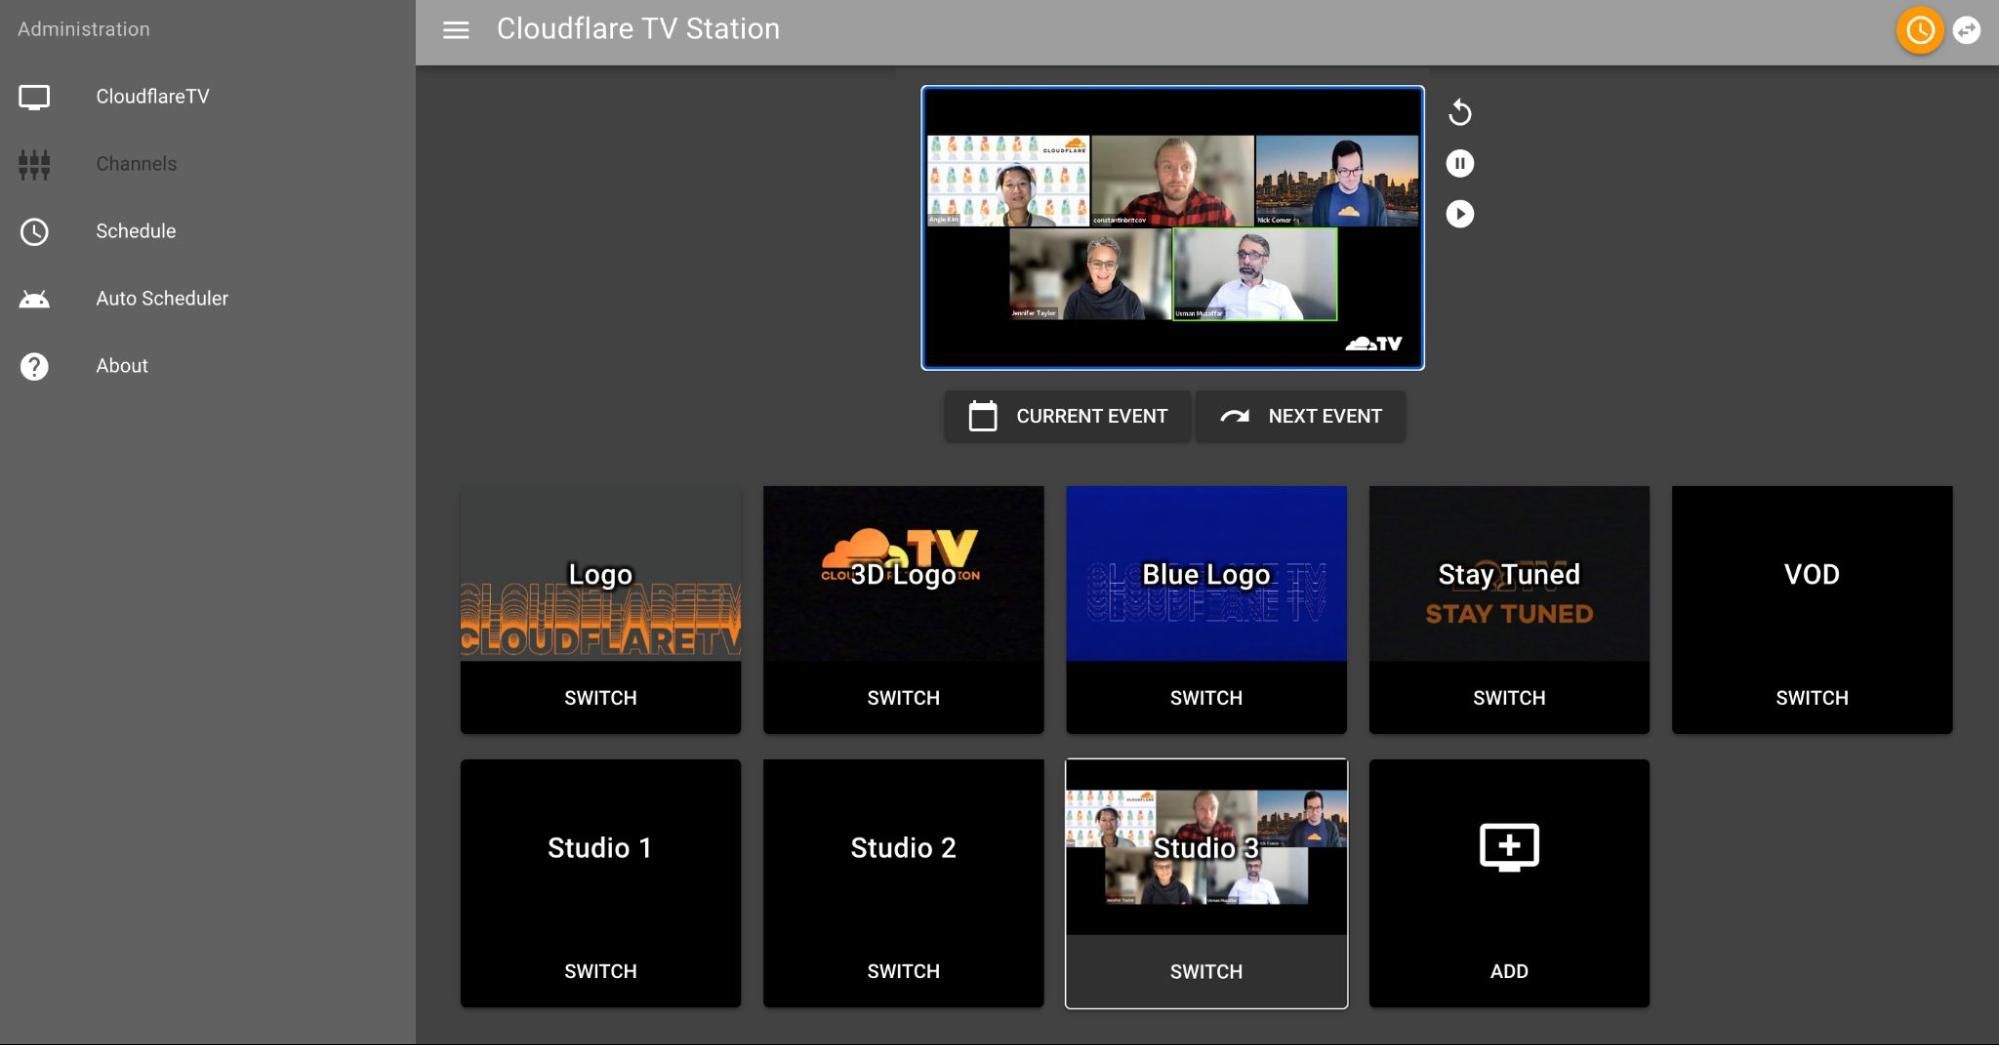
The Auto-Switcher — CFTV’s schedule features hundreds of sessions every week, including weekends, which would be prohibitive if any manual switching were involved. Thankfully the system operates essentially on auto-pilot. This is no simple playlist: every minute, a program running on Cloudflare Workers syncs with the CFTV backend to queue up recordings and inputs for upcoming sessions, deleting those belonging to sessions that have already aired. If we take a week off over the holidays, Cloudflare TV will keep on humming.

The Auto-Scheduler — Scheduling CFTV content by hand (well over 250 segments per week) quickly went from a meaningful exercise to a perverse task. By week two we knew we had to figure something else out. And so the auto-scheduler was born, allowing us to select an arbitrary window of time and populate it with recordings from our content library, filling in any time slots between live segments.

Segments can be dragged, dropped, added, and removed in a couple of clicks; one person can schedule the entire week in less than an hour. The auto-scheduler intelligently rotates through each episode in the catalog to ensure they all get airtime — and we see plenty of opportunities for it to get smarter.

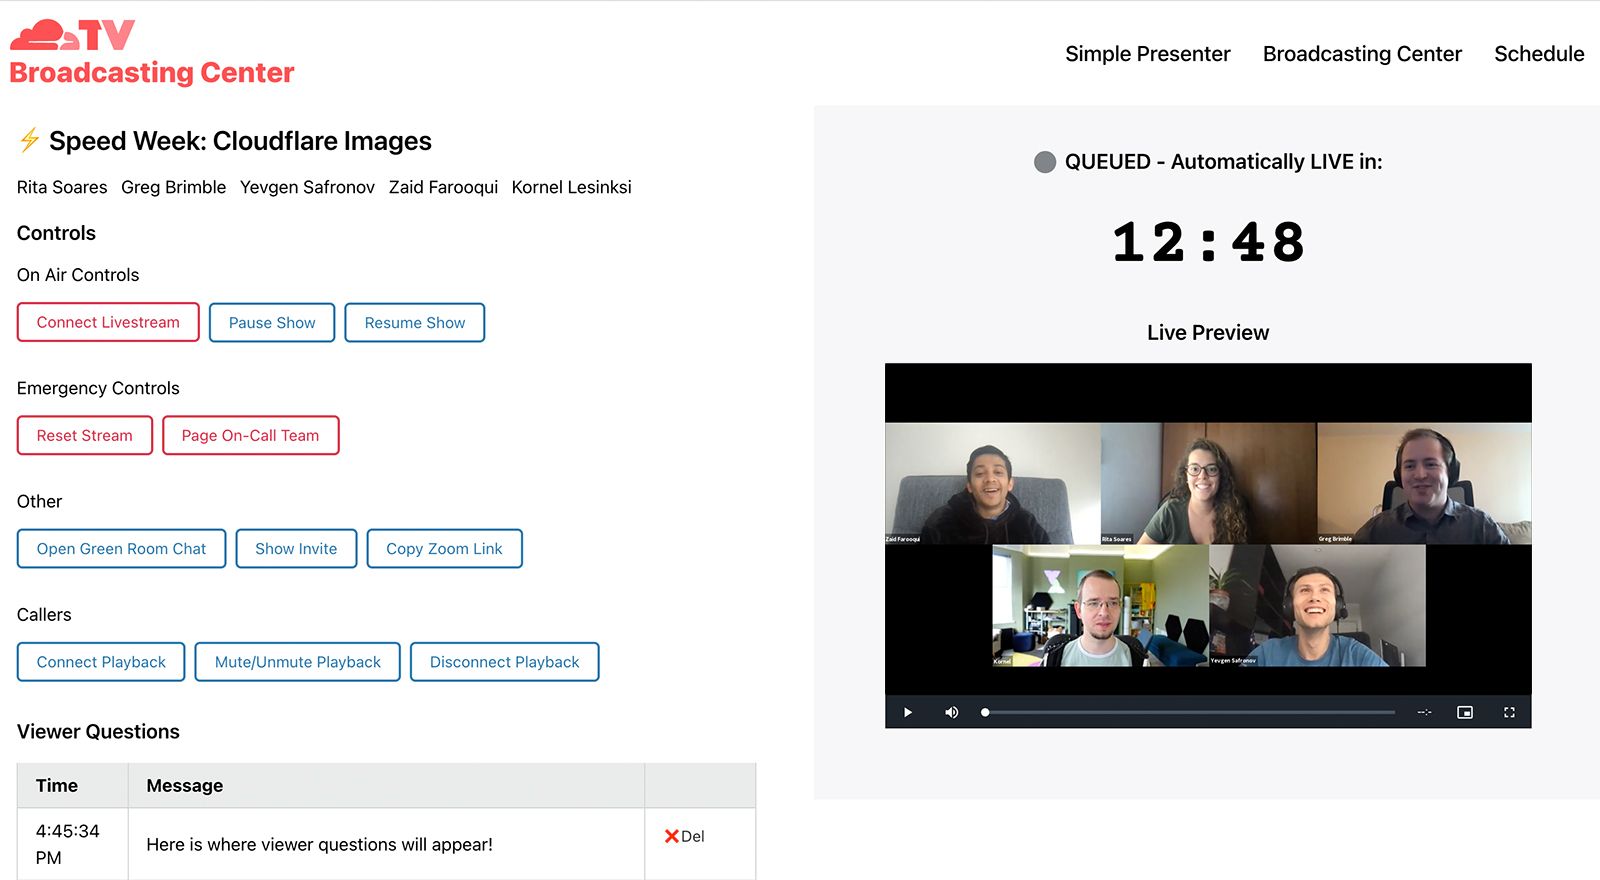
The Broadcasting Center — The lifeblood of Cloudflare TV is our live segments, so we naturally spend a lot of time trying to improve the experience for presenters. The Broadcasting Center is their home base: a page that loads automatically for each session’s host, providing them a countdown timer and other essentials. And because viewer engagement is a crucial part of what makes live programming special, it features a section for viewer questions — including a call-in feature, which records and automatically transcribes questions phoned in by viewers.

Announcing Cloudflare TV as a Service
Broadcasting Center — Presenter View

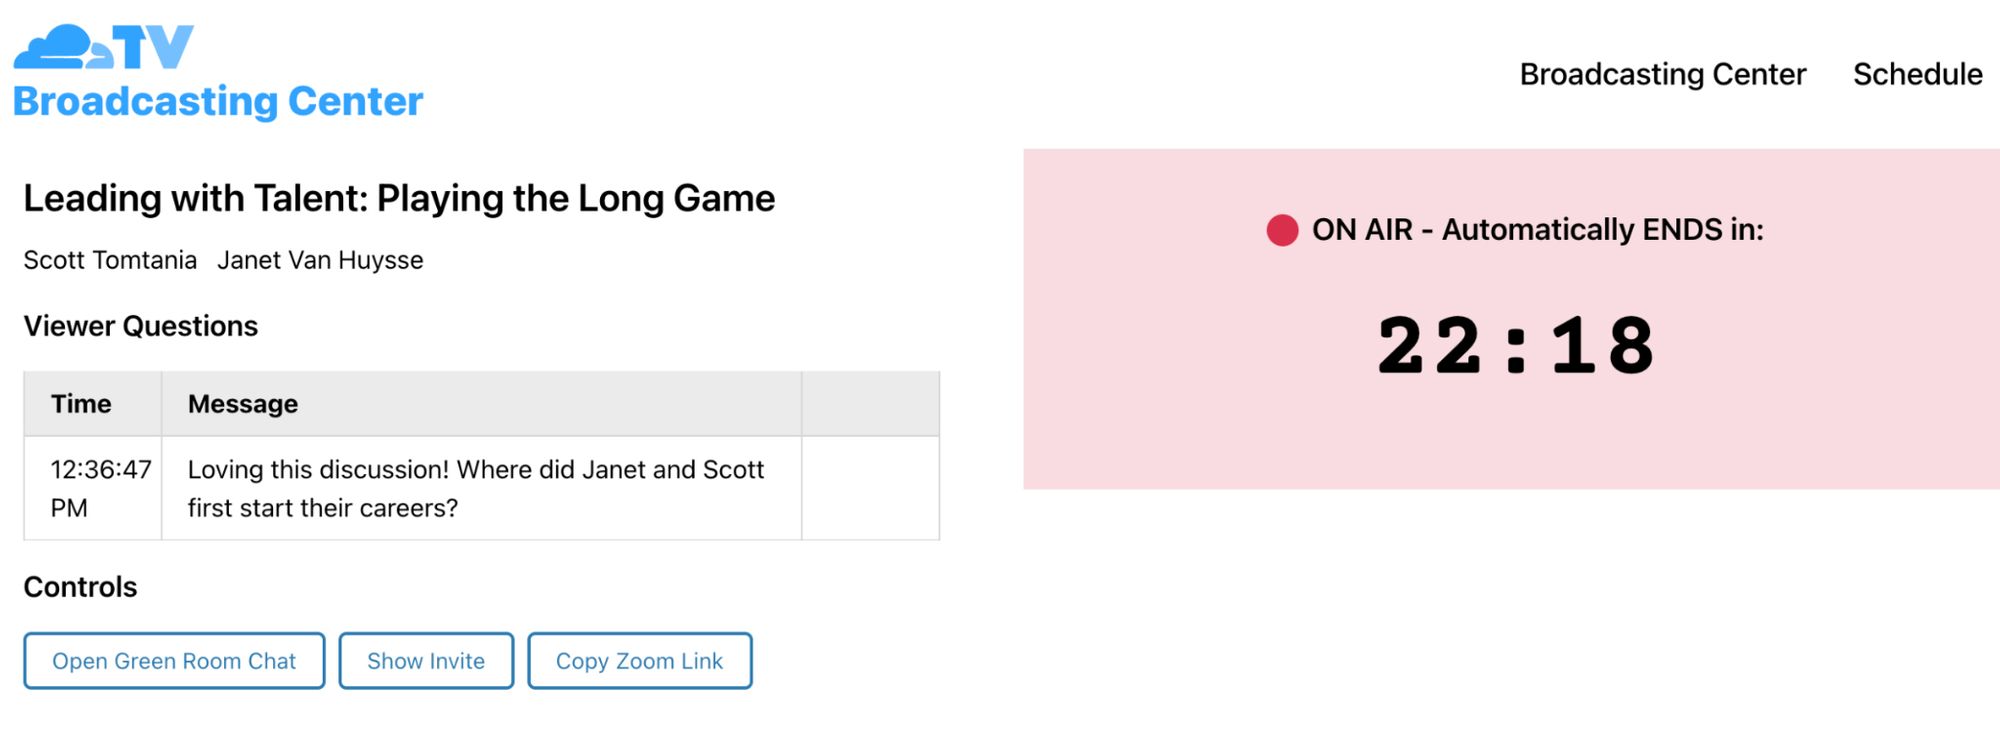
Meanwhile, our CFTV Producers use an administrative view of the same tool, where they check to make sure the stream is coming through clearly before each session begins. A set of admin controls allow them to troubleshoot if needed, and they can moderate viewer questions as well.

For both producers and presenters, the Broadcasting Center provides a single control plane to manage a live session. This ease-of-use goes a long way toward keeping the system running smoothly with a lean team.

Announcing Cloudflare TV as a Service
Broadcasting Center — Admin View

There’s a sequel? There’s a sequel.

One reason we’ve invested in Cloudflare TV is that it serves as fantastic platform for dogfooding — not only are we leveraging a broad array of Cloudflare’s media products, but our 24/7 linear content makes us a particularly demanding customer, with no appetite for arbitrary constraints like time limits or maintenance downtime.

With that in mind, we’re excited to integrate many of the new technologies Cloudflare is introducing this week, which will combine to power an overhauled version of the CFTV platform that we’re calling Cloudflare TV 2.0. Namely:

  • Real Time Communications Platform — Today, Cloudflare announced its new Real Time Communications Platform, powered by WebRTC. In the near future, Cloudflare TV will leverage this platform to handle many of our live sessions. CFTV will continue to support Zoom, OBS, and any other application capable of outputting a RTMP stream, because convenience is one of the essential pillars in helping our presenters engage with the platform. But we see opportunities to push our creativity to new heights with custom, programmatically-controlled media streams — powered by Cloudflare’s Real-Time Communications Platform.
  • Stream Live — CFTV’s backend server currently handles video encoding for our live broadcast, generating a stream that is relayed to a video.js embed. Replacing this setup with Stream Live will yield several key benefits: first, we will offload video encoding to Cloudflare’s global network, resulting in improved speed, reliability, and redundancy. It also means we’ll be able to generate multiple renditions of the broadcast at different bitrates, allowing us to offer streams that are optimized for mobile devices with limited bandwidth, and to dynamically switch between bitrates as a user’s network conditions change.
  • Stream Connect — Today, the only way to watch Cloudflare TV is from the platform’s homepage — but there’s no reason we can’t syndicate it to other popular video platforms like YouTube. Stream Connect will become the primary endpoint for our backend mixer, and will in turn generate multiple copies of that stream, outputting to YouTube, the main broadcast, and any number of additional platforms.

We’re also actively working on a fresh implementation of our switchboard — one that is designed to be more reliable, scalable, and customizable. This switchboard will power the core of Cloudflare TV 2.0.

Announcing Cloudflare TV as a Service

It’s not TV. It’s Cloudflare TV.

Cloudflare TV 2.0 will represent a major step forward for the platform, one that leverages over a year of insights as we rearchitect the system from its core to take full advantage of the Cloudflare network. And we’re doing it with you in mind: the same technology will be used to power Cloudflare TV as a Service.

Most products at Cloudflare are designed to scale from individuals up to the largest businesses. This is not one of those. Running a 24×7 streaming network takes a lot of time and effort. While we’ve made it easier than ever before, this is a product really designed for businesses that are willing to make a commitment similar to what we have at Cloudflare. But, if you are, we’re here to tell you that running a streaming service is incredibly rewarding, and we want to enable more companies to do it.

Interested? Fill out this form and, if it looks like you’d be a good fit, we’ll reach out and work with you to help build your own streaming service.

In the meantime, don’t miss out on Stream Live and the new Real Time Communications Platform. There’s no reason you can’t start building today.

Machine Learning Prosthetic Arm | The MagPi #110

Post Syndicated from Phil King original https://www.raspberrypi.org/blog/machine-learning-prosthetic-arm-the-magpi-110/

This intelligent arm learns how to move naturally, based on what the wearer is doing, as Phil King discovers in the latest issue of The MagPi, out now.

Known for his robotic creations, popular YouTuber James Bruton is also a keen Iron Man cosplayer, and his latest invention would surely impress Tony Stark: an intelligent prosthetic arm that can move naturally and autonomously, depending on the wearer’s body posture and limb movements.

Equipped with three heavy-duty servos, the prosthetic arm moves naturally based on the data from IMU sensors on the wearer’s other limbs

“It’s a project I’ve been thinking about for a while, but I’ve never actually attempted properly,” James tells us. “I thought it would be good to have a work stream of something that could be useful.”

Motion capture suit

To obtain the body movement data on which to base the arm’s movements, James considered using a brain computer, but this would be unreliable without embedding electrodes in his head! So, he instead opted to train it with machine learning.

For this he created a motion capture suit from 3D-printed parts to gather all the data from his body motions: arms, legs, and head. The suit measures joint movements using rotating pieces with magnetic encoders, along with limb and head positions – via a special headband – using MPU-6050 inertial measurement units and Teensy LC boards.

Part of the motion capture suit, the headband is equipped with an IMU to gather movement data

Collected by a Teensy 4.1, this data is then fed into a machine learning model running on the suit’s Raspberry Pi Zero using AOgmaNeo, a lightweight C++ software library designed to run on low-power devices such a microcontrollers.

“AOgmaNeo is a reinforcement machine learning system which learns what all of the data is doing in relation to itself,” James explains. “This means that you can remove any piece of data and, after training, the software will do its best to replace the missing piece with a learned output. In my case, I’m removing the right arm and using the learned output to drive the prosthetic arm, but it could be any limb.”

While James notes that AOgmaNeo is actually meant for reinforcement learning,“in this case we know what the output should be rather than it being unknown and learning through binary reinforcement.”

The motion capture suit comprises 3D-printed parts, each equipped with a magnetic rotary encoder, MPU-6050 IMU, and Teensy LC

To train the model, James used distinctive repeated motions, such as walking, so that the prosthetic arm would later be able to predict what it should do from incoming sensor data. He also spent some time standing still so that the arm would know what to do in that situation.

New model arm

With the machine learning model trained, Raspberry Pi Zero can be put into playback mode to control the backpack-mounted arm’s movements intelligently. It can then duplicate what the wearer’s real right arm was doing during training depending on the positions and movements of other body parts.

So, as he demonstrates in his YouTube video, if James starts walking on the spot, the prosthetic arm swings the opposite way to his left arm as he strides along, and moves forward as raises his left leg. If he stands still, the arm will hang down by his side. The 3D-printed hand was added purely for aesthetic reasons and the fingers don’t move.

Subscribe to James’ YouTube channel

James admits that the project is highly experimental and currently an early work in progress. “I’d like to develop this concept further,” he says, “although the current setup is slightly overambitious and impractical. I think the next step will be to have a simpler set of inputs and outputs.”

While he generally publishes his CAD designs and code, the arm “doesn’t work all that well, so I haven’t this time. AOgmaNeo is open-source, though (free for personal use), so you can make something similar if you wished.” What would you do with an extra arm? 

Get The MagPi #110 NOW!

MagPi 110 Halloween cover

You can grab the brand-new issue right now from the Raspberry Pi Press store, or via our app on Android or iOS. You can also pick it up from supermarkets and newsagents. There’s also a free PDF you can download.

The post Machine Learning Prosthetic Arm | The MagPi #110 appeared first on Raspberry Pi.

Еврофондове вместо евроинтеграцията Медиите в Молдова за битката на „Биволъ“ с корупцията и цензурата

Post Syndicated from Николай Марченко original https://bivol.bg/%D0%BC%D0%B5%D0%B4%D0%B8%D0%B8%D1%82%D0%B5-%D0%B2-%D0%BC%D0%BE%D0%BB%D0%B4%D0%BE%D0%B2%D0%B0-%D0%B7%D0%B0-%D0%B1%D0%B8%D1%82%D0%BA%D0%B0%D1%82%D0%B0-%D0%BD%D0%B0-%D0%B1%D0%B8%D0%B2%D0%BE.html

четвъртък 30 септември 2021


През август 2021 г. сайтът за разследваща журналистика „Биволъ“ заедно с Асоциацията на европейските журналисти (АЕЖ) – България се срещна с група журналисти от Република Молдова. Представителите на водещите молдовски…

How Cloudflare provides tools to help keep IPFS users safe

Post Syndicated from Thibault Meunier original https://blog.cloudflare.com/cloudflare-ipfs-safe-mode/

How Cloudflare provides tools to help keep IPFS users safe

How Cloudflare provides tools to help keep IPFS users safe

Cloudflare’s journey with IPFS started in 2018 when we announced a public gateway for the distributed web. Since then, the number of infrastructure providers for the InterPlanetary FileSystem (IPFS) has grown and matured substantially. This is a huge benefit for users and application developers as they have the ability to choose their infrastructure providers.

Today, we’re excited to announce new secure filtering capabilities in IPFS. The Cloudflare IPFS module is a tool to protect users from threats like phishing and ransomware. We believe that other participants in the network should have the same ability. We are releasing that software as open source, for the benefit of the entire community.

Its code is available on github.com/cloudflare/go-ipfs. To understand how we built it and how to use it, read on.

A brief introduction on IPFS content retrieval

Before we get to understand how IPFS filtering works, we need to dive a little deeper into the operation of an IPFS node.

The InterPlanetary FileSystem (IPFS) is a peer-to-peer network for storing content on a distributed file system. It is composed of a set of computers called nodes that store and relay content using a common addressing system.

Nodes communicate with each other over the Internet using a Peer-to-Peer (P2P) architecture, preventing one node from becoming a single point of failure. This is even more true given that anyone can operate a node with limited resources. This can be light hardware such as a Raspberry Pi, a server at a cloud provider, or even your web browser.

How Cloudflare provides tools to help keep IPFS users safe

This creates a challenge since not all nodes may support the same protocols, and networks may block some types of connections. For instance, your web browser does not expose a TCP API and your home router likely doesn’t allow inbound connections. This is where libp2p comes to help.

libp2p is a modular system of protocols, specifications, and libraries that enable the development of peer-to-peer network applications – libp2p documentation

That’s exactly what four IPFS nodes need to connect to the IPFS network. From a node point of view, the architecture is the following:

How Cloudflare provides tools to help keep IPFS users safe

Any node that we maintain a connection with is a peer. A peer that does not have 🐱 content can ask their peers, including you, they WANT🐱. If you do have it, you will provide the 🐱 to them. If you don’t have it, you can give them information about the network to help them find someone who might have it. As each node chooses the resources they store, it means some might be stored on a limited number of nodes.

For instance, everyone likes 🐱, so many nodes will dedicate resources to store it. However, 🐶 is less popular. Therefore, only a few nodes will provide it.

How Cloudflare provides tools to help keep IPFS users safe

This assumption does not hold for public gateways like Cloudflare. A gateway is an HTTP interface to an IPFS node. On our gateway, we allow a user of the Internet to retrieve arbitrary content from IPFS. If a user asks for 🐱, we provide 🐱. If they ask for 🐶, we’ll find 🐶 for them.

How Cloudflare provides tools to help keep IPFS users safe

Cloudflare’s IPFS gateway is simply a cache in front of IPFS. Cloudflare does not have the ability to modify or remove content from the IPFS network. However, IPFS is a decentralized and open network, so there is the possibility of users sharing threats like phishing or malware. This is content we do not want to provide to the P2P network or to our HTTP users.

In the next section, we describe how an IPFS node can protect its users from such threats.

If you would like to learn more about the inner workings of libp2p, you can go to ProtoSchool which has a great tutorial about it.

How IPFS filtering works

As we described earlier, an IPFS node provides content in two ways: to its peers through the IPFS P2P network and to its users via an HTTP gateway.

Filtering content of the HTTP interface is no different from the current protection Cloudflare already has in place. If 🐶 is considered malicious and is available at cloudflare-ipfs.com/ipfs/🐶, we can filter these requests, so the end user is kept safe.

The P2P layer is different. We cannot filter URLs because that’s not how the content is requested. IPFS is content-addressed. This means that instead of asking for a specific location such as cloudflare-ipfs.com/ipfs/🐶, peers request the content directly using its Content IDentifiers (CID), 🐶.

More precisely, 🐶 is an abstraction of the content address. A CID looks like QmXnnyufdzAWL5CqZ2RnSNgPbvCc1ALT73s6epPrRnZ1Xy (QmXnnyufdzAWL5CqZ2RnSNgPbvCc1ALT73s6epPrRnZ1Xy happens to be the hash of a .txt file containing the string “I’m trying out IPFS”). CID is a convenient way to refer to content in a cryptographically verifiable manner.

This is great, because it means that when peers ask for malicious 🐶 content, we can prevent our node from serving it. This includes both the P2P layer and the HTTP gateway.

In addition, the working of IPFS makes it, so content can easily be reused. On directories for instance, the address is a CID based on the CID of its files. This way, a file can be shared across multiple directories, and still be referred to by the same CID. It allows IPFS nodes to efficiently store content without duplicating it. This can be used to share docker container layers for example.

In the filtering use case, it means that if 🐶 content is included in other IPFS content, our node can also prevent content linking to malicious 🐶 content from being served. This results in 😿, a mix of valid and malicious content.

How Cloudflare provides tools to help keep IPFS users safe

This cryptographic method of linking content together is known as MerkleDAG. You can learn more about it on ProtoSchool, and Consensys did an article explaining the basic cryptographic construction with bananas 🍌.

How to use IPFS secure filtering

By now, you should have an understanding of how an IPFS node retrieves and provides content, as well as how we can protect peers and users from shared nodes accessing threats. Using this knowledge, Cloudflare went on to implement IPFS Safemode, a node protection layer on top of go-ipfs. It is up to every node operator to build their own list of threats to be blocked based on their policy.

To use it, we are going to follow the instructions available on cloudflare/go-ipfs repository.

First, you need to clone the git repository

git clone https://github.com/cloudflare/go-ipfs.git
cd go-ipfs/

Then, you have to check out the commit where IPFS safemode is implemented. This version is based on v0.9.1 of go-ipfs.

git checkout v0.9.1-safemode

Now that you have the source code on your machine, we need to build the IPFS client from source.

make build

Et voilà. You are ready to use your IPFS node, with safemode capabilities.

# alias ipfs command to make it easier to use
alias ipfs=’./cmd/ipfs/ipfs’
# run an ipfs daemon
ipfs daemon &
# understand how to use IPFS safemode
ipfs safemode --help
USAGE
ipfs safemode - Interact with IPFS Safemode to prevent certain CIDs from being provided.
...

Going further

IPFS nodes are running in a diverse set of environments and operated by parties at various scales. The same software has to accommodate configuration in which it is accessed by a single-user, and others where it is shared by thousands of participants.

At Cloudflare, we believe that decentralization is going to be the next major step for content networks, but there is still work to be done to get these technologies in the hands of everyone. Content filtering is part of this story. If the community aims at embedding a P2P node in every computer, there needs to be ways to prevent nodes from serving harmful content. Users need to be able to give consent on the content they are willing to serve, and the one they aren’t.

By providing an IPFS safemode tool, we hope to make this protection more widely available.

AWS Lambda Functions Powered by AWS Graviton2 Processor – Run Your Functions on Arm and Get Up to 34% Better Price Performance

Post Syndicated from Danilo Poccia original https://aws.amazon.com/blogs/aws/aws-lambda-functions-powered-by-aws-graviton2-processor-run-your-functions-on-arm-and-get-up-to-34-better-price-performance/

Many of our customers (such as Formula One, Honeycomb, Intuit, SmugMug, and Snap Inc.) use the Arm-based AWS Graviton2 processor for their workloads and enjoy better price performance. Starting today, you can get the same benefits for your AWS Lambda functions. You can now configure new and existing functions to run on x86 or Arm/Graviton2 processors.

With this choice, you can save money in two ways. First, your functions run more efficiently due to the Graviton2 architecture. Second, you pay less for the time that they run. In fact, Lambda functions powered by Graviton2 are designed to deliver up to 19 percent better performance at 20 percent lower cost.

With Lambda, you are charged based on the number of requests for your functions and the duration (the time it takes for your code to execute) with millisecond granularity. For functions using the Arm/Graviton2 architecture, duration charges are 20 percent lower than the current pricing for x86. The same 20 percent reduction also applies to duration charges for functions using Provisioned Concurrency.

In addition to the price reduction, functions using the Arm architecture benefit from the performance and security built into the Graviton2 processor. Workloads using multithreading and multiprocessing, or performing many I/O operations, can experience lower execution time and, as a consequence, even lower costs. This is particularly useful now that you can use Lambda functions with up to 10 GB of memory and 6 vCPUs. For example, you can get better performance for web and mobile backends, microservices, and data processing systems.

If your functions don’t use architecture-specific binaries, including in their dependencies, you can switch from one architecture to the other. This is often the case for many functions using interpreted languages such as Node.js and Python or functions compiled to Java bytecode.

All Lambda runtimes built on top of Amazon Linux 2, including the custom runtime, are supported on Arm, with the exception of Node.js 10 that has reached end of support. If you have binaries in your function packages, you need to rebuild the function code for the architecture you want to use. Functions packaged as container images need to be built for the architecture (x86 or Arm) they are going to use.

To measure the difference between architectures, you can create two versions of a function, one for x86 and one for Arm. You can then send traffic to the function via an alias using weights to distribute traffic between the two versions. In Amazon CloudWatch, performance metrics are collected by function versions, and you can look at key indicators (such as duration) using statistics. You can then compare, for example, average and p99 duration between the two architectures.

You can also use function versions and weighted aliases to control the rollout in production. For example, you can deploy the new version to a small amount of invocations (such as 1 percent) and then increase up to 100 percent for a complete deployment. During rollout, you can lower the weight or set it to zero if your metrics show something suspicious (such as an increase in errors).

Let’s see how this new capability works in practice with a few examples.

Changing Architecture for Functions with No Binary Dependencies
When there are no binary dependencies, changing the architecture of a Lambda function is like flipping a switch. For example, some time ago, I built a quiz app with a Lambda function. With this app, you can ask and answer questions using a web API. I use an Amazon API Gateway HTTP API to trigger the function. Here’s the Node.js code including a few sample questions at the beginning:

const questions = [
  {
    question:
      "Are there more synapses (nerve connections) in your brain or stars in our galaxy?",
    answers: [
      "More stars in our galaxy.",
      "More synapses (nerve connections) in your brain.",
      "They are about the same.",
    ],
    correctAnswer: 1,
  },
  {
    question:
      "Did Cleopatra live closer in time to the launch of the iPhone or to the building of the Giza pyramids?",
    answers: [
      "To the launch of the iPhone.",
      "To the building of the Giza pyramids.",
      "Cleopatra lived right in between those events.",
    ],
    correctAnswer: 0,
  },
  {
    question:
      "Did mammoths still roam the earth while the pyramids were being built?",
    answers: [
      "No, they were all exctint long before.",
      "Mammooths exctinction is estimated right about that time.",
      "Yes, some still survived at the time.",
    ],
    correctAnswer: 2,
  },
];

exports.handler = async (event) => {
  console.log(event);

  const method = event.requestContext.http.method;
  const path = event.requestContext.http.path;
  const splitPath = path.replace(/^\/+|\/+$/g, "").split("/");

  console.log(method, path, splitPath);

  var response = {
    statusCode: 200,
    body: "",
  };

  if (splitPath[0] == "questions") {
    if (splitPath.length == 1) {
      console.log(Object.keys(questions));
      response.body = JSON.stringify(Object.keys(questions));
    } else {
      const questionId = splitPath[1];
      const question = questions[questionId];
      if (question === undefined) {
        response = {
          statusCode: 404,
          body: JSON.stringify({ message: "Question not found" }),
        };
      } else {
        if (splitPath.length == 2) {
          const publicQuestion = {
            question: question.question,
            answers: question.answers.slice(),
          };
          response.body = JSON.stringify(publicQuestion);
        } else {
          const answerId = splitPath[2];
          if (answerId == question.correctAnswer) {
            response.body = JSON.stringify({ correct: true });
          } else {
            response.body = JSON.stringify({ correct: false });
          }
        }
      }
    }
  }

  return response;
};

To start my quiz, I ask for the list of question IDs. To do so, I use curl with an HTTP GET on the /questions endpoint:

$ curl https://<api-id>.execute-api.us-east-1.amazonaws.com/questions
[
  "0",
  "1",
  "2"
]

Then, I ask more information on a question by adding the ID to the endpoint:

$ curl https://<api-id>.execute-api.us-east-1.amazonaws.com/questions/1
{
  "question": "Did Cleopatra live closer in time to the launch of the iPhone or to the building of the Giza pyramids?",
  "answers": [
    "To the launch of the iPhone.",
    "To the building of the Giza pyramids.",
    "Cleopatra lived right in between those events."
  ]
}

I plan to use this function in production. I expect many invocations and look for options to optimize my costs. In the Lambda console, I see that this function is using the x86_64 architecture.

Console screenshot.

Because this function is not using any binaries, I switch architecture to arm64 and benefit from the lower pricing.

Console screenshot.

The change in architecture doesn’t change the way the function is invoked or communicates its response back. This means that the integration with the API Gateway, as well as integrations with other applications or tools, are not affected by this change and continue to work as before.

I continue my quiz with no hint that the architecture used to run the code has changed in the backend. I answer back to the previous question by adding the number of the answer (starting from zero) to the question endpoint:

$ curl https://<api-id>.execute-api.us-east-1.amazonaws.com/questions/1/0
{
  "correct": true
}

That’s correct! Cleopatra lived closer in time to the launch of the iPhone than the building of the Giza pyramids. While I am digesting this piece of information, I realize that I completed the migration of the function to Arm and optimized my costs.

Changing Architecture for Functions Packaged Using Container Images
When we introduced the capability to package and deploy Lambda functions using container images, I did a demo with a Node.js function generating a PDF file with the PDFKit module. Let’s see how to migrate this function to Arm.

Each time it is invoked, the function creates a new PDF mail containing random data generated by the faker.js module. The output of the function is using the syntax of the Amazon API Gateway to return the PDF file using Base64 encoding. For convenience, I replicate the code (app.js) of the function here:

const PDFDocument = require('pdfkit');
const faker = require('faker');
const getStream = require('get-stream');

exports.lambdaHandler = async (event) => {

    const doc = new PDFDocument();

    const randomName = faker.name.findName();

    doc.text(randomName, { align: 'right' });
    doc.text(faker.address.streetAddress(), { align: 'right' });
    doc.text(faker.address.secondaryAddress(), { align: 'right' });
    doc.text(faker.address.zipCode() + ' ' + faker.address.city(), { align: 'right' });
    doc.moveDown();
    doc.text('Dear ' + randomName + ',');
    doc.moveDown();
    for(let i = 0; i < 3; i++) {
        doc.text(faker.lorem.paragraph());
        doc.moveDown();
    }
    doc.text(faker.name.findName(), { align: 'right' });
    doc.end();

    pdfBuffer = await getStream.buffer(doc);
    pdfBase64 = pdfBuffer.toString('base64');

    const response = {
        statusCode: 200,
        headers: {
            'Content-Length': Buffer.byteLength(pdfBase64),
            'Content-Type': 'application/pdf',
            'Content-disposition': 'attachment;filename=test.pdf'
        },
        isBase64Encoded: true,
        body: pdfBase64
    };
    return response;
};

To run this code, I need the pdfkit, faker, and get-stream npm modules. These packages and their versions are described in the package.json and package-lock.json files.

I update the FROM line in the Dockerfile to use an AWS base image for Lambda for the Arm architecture. Given the chance, I also update the image to use Node.js 14 (I was using Node.js 12 at the time). This is the only change I need to switch architecture.

FROM public.ecr.aws/lambda/nodejs:14-arm64
COPY app.js package*.json ./
RUN npm install
CMD [ "app.lambdaHandler" ]

For the next steps, I follow the post I mentioned previously. This time I use random-letter-arm for the name of the container image and for the name of the Lambda function. First, I build the image:

$ docker build -t random-letter-arm .

Then, I inspect the image to check that it is using the right architecture:

$ docker inspect random-letter-arm | grep Architecture

"Architecture": "arm64",

To be sure the function works with the new architecture, I run the container locally.

$ docker run -p 9000:8080 random-letter-arm:latest

Because the container image includes the Lambda Runtime Interface Emulator, I can test the function locally:

$ curl -XPOST "http://localhost:9000/2015-03-31/functions/function/invocations" -d '{}'

It works! The response is a JSON document containing a base64-encoded response for the API Gateway:

{
    "statusCode": 200,
    "headers": {
        "Content-Length": 2580,
        "Content-Type": "application/pdf",
        "Content-disposition": "attachment;filename=test.pdf"
    },
    "isBase64Encoded": true,
    "body": "..."
}

Confident that my Lambda function works with the arm64 architecture, I create a new Amazon Elastic Container Registry repository using the AWS Command Line Interface (CLI):

$ aws ecr create-repository --repository-name random-letter-arm --image-scanning-configuration scanOnPush=true

I tag the image and push it to the repo:

$ docker tag random-letter-arm:latest 123412341234.dkr.ecr.us-east-1.amazonaws.com/random-letter-arm:latest
$ aws ecr get-login-password | docker login --username AWS --password-stdin 123412341234.dkr.ecr.us-east-1.amazonaws.com
$ docker push 123412341234.dkr.ecr.us-east-1.amazonaws.com/random-letter-arm:latest

In the Lambda console, I create the random-letter-arm function and select the option to create the function from a container image.

Console screenshot.

I enter the function name, browse my ECR repositories to select the random-letter-arm container image, and choose the arm64 architecture.

Console screenshot.

I complete the creation of the function. Then, I add the API Gateway as a trigger. For simplicity, I leave the authentication of the API open.

Console screenshot.

Now, I click on the API endpoint a few times and download some PDF mails generated with random data:

Screenshot of some PDF files.

The migration of this Lambda function to Arm is complete. The process will differ if you have specific dependencies that do not support the target architecture. The ability to test your container image locally helps you find and fix issues early in the process.

Comparing Different Architectures with Function Versions and Aliases
To have a function that makes some meaningful use of the CPU, I use the following Python code. It computes all prime numbers up to a limit passed as a parameter. I am not using the best possible algorithm here, that would be the sieve of Eratosthenes, but it’s a good compromise for an efficient use of memory. To have more visibility, I add the architecture used by the function to the response of the function.

import json
import math
import platform
import timeit

def primes_up_to(n):
    primes = []
    for i in range(2, n+1):
        is_prime = True
        sqrt_i = math.isqrt(i)
        for p in primes:
            if p > sqrt_i:
                break
            if i % p == 0:
                is_prime = False
                break
        if is_prime:
            primes.append(i)
    return primes

def lambda_handler(event, context):
    start_time = timeit.default_timer()
    N = int(event['queryStringParameters']['max'])
    primes = primes_up_to(N)
    stop_time = timeit.default_timer()
    elapsed_time = stop_time - start_time

    response = {
        'machine': platform.machine(),
        'elapsed': elapsed_time,
        'message': 'There are {} prime numbers <= {}'.format(len(primes), N)
    }
    
    return {
        'statusCode': 200,
        'body': json.dumps(response)
    }

I create two function versions using different architectures.

Console screenshot.

I use a weighted alias with 50% weight on the x86 version and 50% weight on the Arm version to distribute invocations evenly. When invoking the function through this alias, the two versions running on the two different architectures are executed with the same probability.

Console screenshot.

I create an API Gateway trigger for the function alias and then generate some load using a few terminals on my laptop. Each invocation computes prime numbers up to one million. You can see in the output how two different architectures are used to run the function.

$ while True
  do
    curl https://<api-id>.execute-api.us-east-1.amazonaws.com/default/prime-numbers\?max\=1000000
  done

{"machine": "aarch64", "elapsed": 1.2595275060011772, "message": "There are 78498 prime numbers <= 1000000"}
{"machine": "aarch64", "elapsed": 1.2591725109996332, "message": "There are 78498 prime numbers <= 1000000"}
{"machine": "x86_64", "elapsed": 1.7200910530000328, "message": "There are 78498 prime numbers <= 1000000"}
{"machine": "x86_64", "elapsed": 1.6874686619994463, "message": "There are 78498 prime numbers <= 1000000"}
{"machine": "x86_64", "elapsed": 1.6865161940004327, "message": "There are 78498 prime numbers <= 1000000"}
{"machine": "aarch64", "elapsed": 1.2583248640003148, "message": "There are 78498 prime numbers <= 1000000"}
...

During these executions, Lambda sends metrics to CloudWatch and the function version (ExecutedVersion) is stored as one of the dimensions.

To better understand what is happening, I create a CloudWatch dashboard to monitor the p99 duration for the two architectures. In this way, I can compare the performance of the two environments for this function and make an informed decision on which architecture to use in production.

Console screenshot.

For this particular workload, functions are running much faster on the Graviton2 processor, providing a better user experience and much lower costs.

Comparing Different Architectures with Lambda Power Tuning
The AWS Lambda Power Tuning open-source project, created by my friend Alex Casalboni, runs your functions using different settings and suggests a configuration to minimize costs and/or maximize performance. The project has recently been updated to let you compare two results on the same chart. This comes in handy to compare two versions of the same function, one using x86 and the other Arm.

For example, this chart compares x86 and Arm/Graviton2 results for the function computing prime numbers I used earlier in the post:

Chart.

The function is using a single thread. In fact, the lowest duration for both architectures is reported when memory is configured with 1.8 GB. Above that, Lambda functions have access to more than 1 vCPU, but in this case, the function can’t use the additional power. For the same reason, costs are stable with memory up to 1.8 GB. With more memory, costs increase because there are no additional performance benefits for this workload.

I look at the chart and configure the function to use 1.8 GB of memory and the Arm architecture. The Graviton2 processor is clearly providing better performance and lower costs for this compute-intensive function.

Availability and Pricing
You can use Lambda Functions powered by Graviton2 processor today in US East (N. Virginia), US East (Ohio), US West (Oregon), Europe (Frankfurt), Europe (Ireland), EU (London), Asia Pacific (Mumbai), Asia Pacific (Singapore), Asia Pacific (Sydney), Asia Pacific (Tokyo).

The following runtimes running on top of Amazon Linux 2 are supported on Arm:

  • Node.js 12 and 14
  • Python 3.8 and 3.9
  • Java 8 (java8.al2) and 11
  • .NET Core 3.1
  • Ruby 2.7
  • Custom Runtime (provided.al2)

You can manage Lambda Functions powered by Graviton2 processor using AWS Serverless Application Model (SAM) and AWS Cloud Development Kit (AWS CDK). Support is also available through many AWS Lambda Partners such as AntStack, Check Point, Cloudwiry, Contino, Coralogix, Datadog, Lumigo, Pulumi, Slalom, Sumo Logic, Thundra, and Xerris.

Lambda functions using the Arm/Graviton2 architecture provide up to 34 percent price performance improvement. The 20 percent reduction in duration costs also applies when using Provisioned Concurrency. You can further reduce your costs by up to 17 percent with Compute Savings Plans. Lambda functions powered by Graviton2 are included in the AWS Free Tier up to the existing limits. For more information, see the AWS Lambda pricing page.

You can find help to optimize your workloads for the AWS Graviton2 processor in the Getting started with AWS Graviton repository.

Start running your Lambda functions on Arm today.

Danilo

Amazon Managed Service for Prometheus Is Now Generally Available with Alert Manager and Ruler

Post Syndicated from Channy Yun original https://aws.amazon.com/blogs/aws/amazon-managed-service-for-prometheus-is-now-generally-available-with-alert-manager-and-ruler/

At AWS re:Invent 2020, we introduced the preview of Amazon Managed Service for Prometheus, an open source Prometheus-compatible monitoring service that makes it easy to monitor containerized applications at scale. With Amazon Managed Service for Prometheus, you can use the Prometheus query language (PromQL) to monitor the performance of containerized workloads without having to manage the underlying infrastructure required to scale and secure the ingestion, storage, alert, and querying of operational metrics.

Amazon Managed Service for Prometheus automatically scales as your monitoring needs grow. It is a highly available service deployed across multiple Availability Zones (AZs) that integrates AWS security and compliance capabilities. The service offers native support for PromQL as well as the ability to ingest Prometheus metrics from over 150 Prometheus exporters maintained by the open source community.

With Amazon Managed Service for Prometheus, you can collect Prometheus metrics from Amazon Elastic Compute Cloud (Amazon EC2), Amazon Elastic Container Service (Amazon ECS), and Amazon Elastic Kubernetes Service (Amazon EKS) environments using AWS Distro for OpenTelemetry (ADOT) or Prometheus servers as collection agents.

During the preview, we contributed the high-availability alert manager to the open source Cortex project, a project providing horizontally scalable, highly available, multi-tenant, long-term store for Prometheus. Also, we reduced the price of metric samples ingested by up to 84 percent, and supported collection of metrics for AWS Lambda applications by ADOT.

Today, I am happy to announce the general availability of Amazon Managed Service for Prometheus with new features such as alert manager and ruler that support Amazon Simple Notification Service (Amazon SNS) as a receiver destination for notifications from Alert Manager. You can integrate Amazon SNS with destinations such as email, webhook, Slack, PagerDuty, OpsGenie, or VictorOps with Amazon SNS.

Getting Started with Alert Manager and Ruler
To get started in the AWS Management Console, you can simply create a workspace, a logical space dedicated to the storage, alerting, and querying of metrics from one or more Prometheus servers. You can set up the ingestion of Prometheus metrics to this workspace using Helm and query those metrics. To learn more, see Getting started in the Amazon Managed Service for Prometheus User Guide.

At general availability, we added new alert manager and rules management features. The service supports two types of rules: recording rules and alerting rules. These rules files are the same YAML format as standalone Prometheus, which may be configured and then evaluated at regular intervals.

To configure your workspace with a set of rules, choose Add namespace in Rules management and select a YAML format rules file.

An example rules file would record CPU usage metrics in container workloads and triggers an alert if CPU usage is high for five minutes.

Next, you can create a new Amazon SNS topic or reuse an existing SNS topic where it will route the alerts. The alertmanager routes the alerts to SNS and SNS routes to downstream locations. Configured alerting rules will fire alerts to the Alert Manager, which deduplicate, group, and route alerts to Amazon SNS via the SNS receiver. If you’d like to receive email notifications for your alerts, configure an email subscription for the SNS topic you had.

To give Amazon Managed Service for Prometheus permission to send messages to your SNS topic, select the topic you plan to send to, and add the access policy block:

{
    "Sid": "Allow_Publish_Alarms",
    "Effect": "Allow",
    "Principal": {
        "Service": "aps.amazonaws.com"
    },
    "Action": [
        "sns:Publish",
        "sns:GetTopicAttributes"
    ],
    "Resource": "arn:aws:sns:us-east-1:123456789012:Notifyme"
}

If you have a topic to get alerts, you can configure this SNS receiver in the alert manager configuration. An example config file is the same format as Prometheus, but you have to provide the config underneath an alertmanager_config: block in for the service’s Alert Manager. For more information about the Alert Manager config, visit Alerting Configuration in Prometheus guide.

alertmanager_config:
  route:
    receiver: default
    repeat_interval: 5m
  receivers:
    name: default
    sns_configs:
      topic_arn: "arn:aws:sns:us-east-1:123456789012:Notifyme"
      sigv4:
        region: us-west-2
      attributes:
        key: severity
        value: "warning"

You can replace the topic_arn for the topic that you create while setting up the SNS connection. To learn more about the SNS receiver in the alert manager config, visit Prometheus SNS receiver on the Prometheus Github page.

To configure the Alert Manager, open the Alert Manager and choose Add definition, then select a YAML format alert config file.

When an alert is created by Prometheus and sent to the Alert Manager, it can be queried by hitting the ListAlerts endpoint to see all the active alerts in the system. After hitting the endpoint, you can see alerts in the list of actively firing alerts.

$ curl https://aps-workspaces.us-east-1.amazonaws.com/workspaces/ws-0123456/alertmanager/api/v2/alerts
GET /workspaces/ws-0123456/alertmanager/api/v2/alerts HTTP/1.1
Host: aps-workspaces.us-east-1.amazonaws.com
X-Amz-Date: 20210628T171924Z
...
[
    "receivers": [
      {
        "name": "default"
      }
    ],
    "startsAt": "2021-09-24T01:37:42.393Z",
    "updatedAt": "2021-09-24T01:37:42.393Z",
    "endsAt": "2021-09-24T01:37:42.393Z",
    "status": {
      "state": "unprocessed",
    },
    "labels": {
      "severity": "warning"
    }
  }
]

A successful notification will result in an email received from your SNS topic with the alert details. Also, you can output messages in JSON format to be easily processed downstream of SNS by AWS Lambda or other APIs and webhook receiving endpoints. For example, you can connect SNS with a Lambda function for message transformation or triggering automation. To learn more, visit Configuring Alertmanager to output JSON to SNS in the Amazon Managed Service for Prometheus User Guide.

Sending from Amazon SNS to Other Notification Destinations
You can connect Amazon SNS to a variety of outbound destinations such as email, webhook (HTTP), Slack, PageDuty, and OpsGenie.

  • Webhook – To configure a preexisting SNS topic to output messages to a webhook endpoint, first create a subscription to an existing topic. Once active, your HTTP endpoint should receive SNS notifications.
  • Slack – You can either integrate with Slack’s email-to-channel integration where Slack has the ability to accept an email and forward it to a Slack channel, or you can utilize a Lambda function to rewrite the SNS notification to Slack. To learn more, see forwarding emails to Slack channels and AWS Lambda function to convert SNS messages to Slack.
  • PagerDuty – To customize the payload sent to PagerDuty, customize the template that is used in generating the message sent to SNS by adjusting or updating template_files block in your alertmanager definition.

Available Now
Amazon Managed Service for Prometheus is available today in nine AWS Regions: US East (N. Virginia), US East (Ohio), US West (Oregon), Europe (Frankfurt), Europe (Ireland), Europe (Stockholm), Asia Pacific (Singapore), Asia Pacific (Sydney), and Asia Pacific (Tokyo).

You pay only for what you use, based on metrics ingested, queried, and stored. As part of the AWS Free Tier, you can get started with Amazon Managed Service for Prometheus for 40 million metric samples ingested and 10 GB metrics stored per month. To learn more, visit the pricing page.

If you want to learn about AWS observability on AWS, visit One Observability Workshop which provides a hands-on experience for you on the wide variety of toolsets AWS offers to set up monitoring and observability on your applications.

Please send feedback to the AWS forum for Amazon Managed Service for Prometheus or through your usual AWS support contacts.

Channy

Validate IAM policies in CloudFormation templates using IAM Access Analyzer

Post Syndicated from Matt Luttrell original https://aws.amazon.com/blogs/security/validate-iam-policies-in-cloudformation-templates-using-iam-access-analyzer/

In this blog post, I introduce IAM Policy Validator for AWS CloudFormation (cfn-policy-validator), an open source tool that extracts AWS Identity and Access Management (IAM) policies from an AWS CloudFormation template, and allows you to run existing IAM Access Analyzer policy validation APIs against the template. I also show you how to run the tool in a continuous integration and continuous delivery (CI/CD) pipeline to validate IAM policies in a CloudFormation template before they are deployed to your AWS environment.

Embedding this validation in a CI/CD pipeline can help prevent IAM policies that have IAM Access Analyzer findings from being deployed to your AWS environment. This tool acts as a guardrail that can allow you to delegate the creation of IAM policies to the developers in your organization. You can also use the tool to provide additional confidence in your existing policy authoring process, enabling you to catch mistakes prior to IAM policy deployment.

What is IAM Access Analyzer?

IAM Access Analyzer mathematically analyzes access control policies that are attached to resources, and determines which resources can be accessed publicly or from other accounts. IAM Access Analyzer can also validate both identity and resource policies against over 100 checks, each designed to improve your security posture and to help you to simplify policy management at scale.

The IAM Policy Validator for AWS CloudFormation tool

IAM Policy Validator for AWS CloudFormation (cfn-policy-validator) is a new command-line tool that parses resource-based and identity-based IAM policies from your CloudFormation template, and runs the policies through IAM Access Analyzer checks. The tool is designed to run in the CI/CD pipeline that deploys your CloudFormation templates, and to prevent a deployment when an IAM Access Analyzer finding is detected. This ensures that changes made to IAM policies are validated before they can be deployed.

The cfn-policy-validator tool looks for all identity-based policies, and a subset of resource-based policies, from your templates. For the full list of supported resource-based policies, see the cfn-policy-validator GitHub repository.

Parsing IAM policies from a CloudFormation template

One of the challenges you can face when parsing IAM policies from a CloudFormation template is that these policies often contain CloudFormation intrinsic functions (such as Ref and Fn::GetAtt) and pseudo parameters (such as AWS::AccountId and AWS::Region). As an example, it’s common for least privileged IAM policies to reference the Amazon Resource Name (ARN) of another CloudFormation resource. Take a look at the following example CloudFormation resources that create an Amazon Simple Queue Service (Amazon SQS) queue, and an IAM role with a policy that grants access to perform the sqs:SendMessage action on the SQS queue.
 

Figure 1- Example policy in CloudFormation template

Figure 1- Example policy in CloudFormation template

As you can see in Figure 1, line 21 uses the function Fn::Sub to restrict this policy to MySQSQueue created earlier in the template.

In this example, if you were to pass the root policy (lines 15-21) as written to IAM Access Analyzer, you would get an error because !Sub ${MySQSQueue.Arn} is syntax that is specific to CloudFormation. The cfn-policy-validator tool takes the policy and translates the CloudFormation syntax to valid IAM policy syntax that Access Analyzer can parse.

The cfn-policy-validator tool recognizes when an intrinsic function such as !Sub ${MySQSQueue.Arn} evaluates to a resource’s ARN, and generates a valid ARN for the resource. The tool creates the ARN by mapping the type of CloudFormation resource (in this example AWS::SQS::Queue) to a pattern that represents what the ARN of the resource will look like when it is deployed. For example, the following is what the mapping looks like for the SQS queue referenced previously:

AWS::SQS::Queue.Arn -> arn:${Partition}:sqs:${Region}:${Account}:${QueueName}

For some CloudFormation resources, the Ref intrinsic function also returns an ARN. The cfn-policy-validator tool handles these cases as well.

Cfn-policy-validator walks through each of the six parts of an ARN and substitutes values for variables in the ARN pattern (any text contained within ${}). The values of ${Partition} and ${Account} are taken from the identity of the role that runs the cfn-policy-validator tool, and the value for ${Region} is provided as an input flag. The cfn-policy-validator tool performs a best-effort resolution of the QueueName, but typically defaults it to the name of the CloudFormation resource (in the previous example, MySQSQueue). Validation of policies with IAM Access Analyzer does not rely on the name of the resource, so the cfn-policy-validator tool is able to substitute a replacement name without affecting the policy checks.

The final ARN generated for the MySQSQueue resource looks like the following (for an account with ID of 111111111111):

arn:aws:sqs:us-east-1:111111111111:MySQSQueue

The cfn-policy-validator tool substitutes this generated ARN for !Sub ${MySQSQueue.Arn}, which allows the cfn-policy-validator tool to parse a policy from the template that can be fed into IAM Access Analyzer for validation. The cfn-policy-validator tool walks through your entire CloudFormation template and performs this ARN substitution until it has generated ARNs for all policies in your template.

Validating the policies with IAM Access Analyzer

After the cfn-policy-validator tool has your IAM policies in a valid format (with no CloudFormation intrinsic functions or pseudo parameters), it can take those policies and feed them into IAM Access Analyzer for validation. The cfn-policy-validator tool runs resource-based and identity-based policies in your CloudFormation template through the ValidatePolicy action of the IAM Access Analyzer. ValidatePolicy is what ensures that your policies have correct grammar and follow IAM policy best practices (for example, not allowing iam:PassRole to all resources). The cfn-policy-validator tool also makes a call to the CreateAccessPreview action for supported resource policies to determine if the policy would grant unintended public or cross-account access to your resource.

The cfn-policy-validator tool categorizes findings from IAM Access Analyzer into the categories blocking or non-blocking. Findings categorized as blocking cause the tool to exit with a non-zero exit code, thereby causing your deployment to fail and preventing your CI/CD pipeline from continuing. If there are no findings, or only non-blocking findings detected, the tool will exit with an exit code of zero (0) and your pipeline can to continue to the next stage. For more information about how the cfn-policy-validator tool decides what findings to categorize as blocking and non-blocking, as well as how to customize the categorization, see the cfn-policy-validator GitHub repository.

Example of running the cfn-policy-validator tool

This section guides you through an example of what happens when you run a CloudFormation template that has some policy violations through the cfn-policy-validator tool.

The following template has two CloudFormation resources with policy findings: an SQS queue policy that grants account 111122223333 access to the SQS queue, and an IAM role with a policy that allows the role to perform a misspelled sqs:ReceiveMessages action. These issues are highlighted in the policy below.

Important: The policy in Figure 2 is written to illustrate a CloudFormation template with potentially undesirable IAM policies. You should be careful when setting the Principal element to an account that is not your own.

Figure 2: CloudFormation template with undesirable IAM policies

Figure 2: CloudFormation template with undesirable IAM policies

When you pass this template as a parameter to the cfn-policy-validator tool, you specify the AWS Region that you want to deploy the template to, as follows:

cfn-policy-validator validate --template-path ./template.json --region us-east-1

After the cfn-policy-validator tool runs, it returns the validation results, which includes the actual response from IAM Access Analyzer:

{
    "BlockingFindings": [
        {
            "findingType": "ERROR",
            "code": "INVALID_ACTION",
            "message": "The action sqs:ReceiveMessages does not exist.",
            "resourceName": "MyRole",
            "policyName": "root",
            "details": …
        },
        {
            "findingType": "SECURITY_WARNING",
            "code": "EXTERNAL_PRINCIPAL",
            "message": "Resource policy allows access from external principals.",
            "resourceName": "MyQueue",
            "policyName": "QueuePolicy",
            "details": …
        }
    ],
    "NonBlockingFindings": []
}

The output from the cfn-policy-validator tool includes the type of finding, the code for the finding, and a message that explains the finding. It also includes the resource and policy name from the CloudFormation template, to allow you to quickly track down and resolve the finding in your template. In the previous example, you can see that IAM Access Analyzer has detected two findings, one security warning and one error, which the cfn-policy-validator tool has classified as blocking. The actual response from IAM Access Analyzer is returned under details, but is excluded above for brevity.

If account 111122223333 is an account that you trust and you are certain that it should have access to the SQS queue, then you can suppress the finding for external access from the 111122223333 account in this example. Modify the call to the cfn-policy-validator tool to ignore this specific finding by using the –-allow-external-principals flag, as follows:

cfn-policy-validator validate --template-path ./template.json --region us-east-1 --allow-external-principals 111122223333

When you look at the output that follows, you’re left with only the blocking finding that states that sqs:ReceiveMessages does not exist.

{
    "BlockingFindings": [
        {
            "findingType": "ERROR",
            "code": "INVALID_ACTION",
            "message": "The action sqs:ReceiveMessages does not exist.",
            "resourceName": "MyRole",
            "policyName": "root",
            "details": …
    ],
    "NonBlockingFindings": []
}

To resolve this finding, update the template to have the correct spelling, sqs:ReceiveMessage (without trailing s).

For the full list of available flags and commands supported, see the cfn-policy-validator GitHub repository.

Now that you’ve seen an example of how you can run the cfn-policy-validator tool to validate policies that are on your local machine, you will take it a step further and see how you can embed the cfn-policy-validator tool in a CI/CD pipeline. By embedding the cfn-policy-validator tool in your CI/CD pipeline, you can ensure that your IAM policies are validated each time a commit is made to your repository.

Embedding the cfn-policy-validator tool in a CI/CD pipeline

The CI/CD pipeline you will create in this post uses AWS CodePipeline and AWS CodeBuild. AWS CodePipeline is a continuous delivery service that enables you to model, visualize, and automate the steps required to release your software. AWS CodeBuild is a fully-managed continuous integration service that compiles source code, runs tests, and produces software packages that are ready to deploy. You will also use AWS CodeCommit as the source repository where your CloudFormation template is stored. AWS CodeCommit is a fully managed source-control service that hosts secure Git-based repositories.

To deploy the pipeline

  1. To deploy the CloudFormation template that builds the source repository and AWS CodePipeline pipeline, select the following Launch Stack button.
    Select the Launch Stack button to launch the template
  2. In the CloudFormation console, choose Next until you reach the Review page.
  3. Select I acknowledge that AWS CloudFormation might create IAM resources and choose Create stack.
  4. Open the AWS CodeCommit console and choose Repositories.
  5. Select cfn-policy-validator-source-repository.
  6. Download the template.json and template-configuration.json files to your machine.
  7. In the cfn-policy-validator-source-repository, on the right side, select Add file and choose Upload file.
  8. Choose Choose File and select the template.json file that you downloaded previously.
  9. Enter an Author name and an E-mail address and choose Commit changes.
  10. In the cfn-policy-validator-source-repository, repeat steps 7-9 for the template-configuration.json file.

To view validation in the pipeline

  1. In the AWS CodePipeline console choose the IAMPolicyValidatorPipeline.
  2. Watch as your commit travels through the pipeline. If you followed the previous instructions and made two separate commits, you can ignore the failed results of the first pipeline execution. As shown in Figure 3, you will see that the pipeline fails in the Validation stage on the CfnPolicyValidator action, because it detected a blocking finding in the template you committed, which prevents the invalid policy from reaching your AWS environment.
     
    Figure 3: Validation failed on the CfnPolicyValidator action

    Figure 3: Validation failed on the CfnPolicyValidator action

  3. Under CfnPolicyValidator, choose Details, as shown in Figure 3.
  4. In the Action execution failed pop-up, choose Link to execution details to view the cfn-policy-validator tool output in AWS CodeBuild.

Architectural overview of deploying cfn-policy-validator in your pipeline

You can see the architecture diagram for the CI/CD pipeline you deployed in Figure 4.
 
Figure 4: CI/CD pipeline that performs IAM policy validation using the AWS CloudFormation Policy Validator and IAM Access Analyzer

Figure 4 shows the following steps, starting with the CodeCommit source action on the left:

  1. The pipeline starts when you commit to your AWS CodeCommit source code repository. The AWS CodeCommit repository is what contains the CloudFormation template that has the IAM policies that you would like to deploy to your AWS environment.
  2. AWS CodePipeline detects the change in your source code repository and begins the Validation stage. The first step it takes is to start an AWS CodeBuild project that runs the CloudFormation template through the AWS CloudFormation Linter (cfn-lint). The cfn-lint tool validates your template against the CloudFormation resource specification. Taking this initial step ensures that you have a valid CloudFormation template before validating your IAM policies. This is an optional step, but a recommended one. Early schema validation provides fast feedback for any typos or mistakes in your template. There’s little benefit to running additional static analysis tools if your template has an invalid schema.
  3. If the cfn-lint tool completes successfully, you then call a separate AWS CodeBuild project that invokes the IAM Policy Validator for AWS CloudFormation (cfn-policy-validator). The cfn-policy-validator tool then extracts the identity-based and resource-based policies from your template, as described earlier, and runs the policies through IAM Access Analyzer.

    Note: if your template has parameters, then you need to provide them to the cfn-policy-validator tool. You can provide parameters as command-line arguments, or use a template configuration file. It is recommended to use a template configuration file when running validation with an AWS CodePipeline pipeline. The same file can also be used in the deploy stage to deploy the CloudFormation template. By using the template configuration file, you can ensure that you use the same parameters to validate and deploy your template. The CloudFormation template for the pipeline provided with this blog post defaults to using a template configuration file.

    If there are no blocking findings found in the policy validation, the cfn-policy-validator tool exits with an exit code of zero (0) and the pipeline moves to the next stage. If any blocking findings are detected, the cfn-policy-validator tool will exit with a non-zero exit code and the pipeline stops, to prevent the deployment of undesired IAM policies.

  4. The final stage of the pipeline uses the AWS CloudFormation action in AWS CodePipeline to deploy the template to your environment. Your template will only make it to this stage if it passes all static analysis checks run in the Validation Stage.

Cleaning Up

To avoid incurring future charges, in the AWS CloudFormation console delete the validate-iam-policy-pipeline stack. This will remove the validation pipeline from your AWS account.

Summary

In this blog post, I introduced the IAM Policy Validator for AWS CloudFormation (cfn-policy-validator). The cfn-policy-validator tool automates the parsing of identity-based and resource-based IAM policies from your CloudFormation templates and runs those policies through IAM Access Analyzer. This enables you to validate that the policies in your templates follow IAM best practices and do not allow unintended external access to your AWS resources.

I showed you how the IAM Policy Validator for AWS CloudFormation can be included in a CI/CD pipeline. This allows you to run validation on your IAM policies on every commit to your repository and only deploy the template if validation succeeds.

For more information, or to provide feedback and feature requests, see the cfn-policy-validator GitHub repository.

If you have feedback about this post, submit comments in the Comments section below.

Want more AWS Security how-to content, news, and feature announcements? Follow us on Twitter.

Author

Matt Luttrell

Matt is a Sr. Solutions Architect on the AWS Identity Solutions team. When he’s not spending time chasing his kids around, he enjoys skiing, cycling, and the occasional video game.

[$] Taming the BPF superpowers

Post Syndicated from original https://lwn.net/Articles/870269/rss

Work toward the signing of BPF programs has
been finding its way into recent mainline kernel releases; it is intended
to improve security by limiting the BPF programs that can be successfully
loaded into the kernel. As John Fastabend described in his “Watching
the super powers” session
at the 2021 Linux Plumbers Conference,
this new feature has the potential to completely break his tools. But
rather than just complain, he decided to investigate solutions; the result
is an outline for an auditing mechanism that brings greater flexibility to
the problem of controlling which programs can be run.

[Security Nation] Rob Graham on Mike Lindell’s Cyber Symposium

Post Syndicated from Rapid7 original https://blog.rapid7.com/2021/09/29/security-nation-rob-graham-on-mike-lindells-cyber-symposium/

[Security Nation] Rob Graham on Mike Lindell's Cyber Symposium

In this episode of Security Nation, Jen and Tod chat with Rob Graham of Errata Security about his experience attending pillow magnate Mike Lindell’s Cyber Symposium, where he claimed packet captures would reveal incontrovertible evidence of widespread fraud in the 2020 US presidential election. (Spoiler alert: Nothing resembling that description actually occurred at Lindell’s event.) An expert on packet captures, Graham recounts the Kafkaesque forensic logic behind the Cyber Symposium data — some of which was presented in a file type only known to a single living person — as well as the value of having real experts attend highly dubious events like this one.

Stick around for the Rapid Rundown, where Tod and Jen discuss Microsoft’s plan to turn off Basic Auth in Exchange Online next year and the Autodiscover bug that may have prompted the change.

Robert Graham

[Security Nation] Rob Graham on Mike Lindell's Cyber Symposium

Rob Graham is a well-known cybersecurity expert. He created the BlackICE personal firewall, the first IPS, sidejacking, and masscan. He frequently speaks at conferences and blogs.

Show notes

Interview links

magnet:?xt=urn:btih:39a9590de21e77687fdf7eacee4dd743f2683d72&dn=cyber-symposium&tr=udp://9.rarbg.me:2780/announce

Rapid Rundown links

  • The original Bleeping Computer story on Microsoft shutting off Basic Auth
  • The related story about Amit’s Autodiscover bug finding that may have prompted the above
  • A somewhat early reference to some WPAD bugs
  • The earliest reference Tod could find about WPAD exploits… which happened to be written by the very same Tod back in 2009.

Like the show? Want to keep Jen and Tod in the podcasting business? Feel free to rate and review with your favorite podcast purveyor, like Apple Podcasts.

Want More Inspiring Stories From the Security Community?

Subscribe to Security Nation Today

Improving Performance and Reducing Cost Using Availability Zone Affinity

Post Syndicated from Michael Haken original https://aws.amazon.com/blogs/architecture/improving-performance-and-reducing-cost-using-availability-zone-affinity/

One of the best practices for building resilient systems in Amazon Virtual Private Cloud (VPC) networks is using multiple Availability Zones (AZ). An AZ is one or more discrete data centers with redundant power, networking, and connectivity. Using multiple AZs allows you to operate workloads that are more highly available, fault tolerant, and scalable than would be possible from a single data center. However, transferring data across AZs adds latency and cost.

This blog post demonstrates an architectural pattern called “Availability Zone Affinity” that improves performance and reduces costs while still maintaining the benefits of Multi-AZ architectures.

Cross Availability Zone effects

AZs are physically separated by a meaningful distance from other AZs in the same AWS Region. Although they all are within 60 miles (100 kilometers) of each other. This produces roundtrip latencies usually under 1-2 milliseconds (ms) between AZs in the same Region. Roundtrip latency between two instances in the same AZ is closer to 100-300 microseconds (µs) when using enhanced networking.1 This can be even lower when the instances use cluster placement groups. Additionally, when data is transferred between two AZs, data transfer charges apply in both directions.

To better understand these effects, we’ll analyze a fictitious workload, the “foo service,” shown in Figure 1. The foo service provides a storage platform for other workloads in AWS to redundantly store data. Requests are first processed by an Application Load Balancer (ALB). ALBs always use cross-zone load balancing to evenly distribute requests to all targets. Next, the request is sent from the load balancer to a request router. The request router performs a few operations, like authorization checks and input validation, before sending it to the storage tier. The storage tier replicates the data sequentially from the lead node, to the middle node, and finally the tail node. Once the data has been written to all three nodes, it is considered committed. The response is sent from the tail node back to the request router, back through the load balancer, and finally returned to the client.

An example system that transfers data across AZs

Figure 1. An example system that transfers data across AZs

We can see in Figure 1 that, in the worst case, the request traversed an AZ boundary eight times. Let’s calculate the fastest possible, zeroth percentile (p0), latency. We’ll assume the best time for non-network processing of the request in the load balancer, request router, and storage tier is 4 ms. If we consider 1 ms as the minimum network latency added for each AZ traversal, in the worst-case scenario of eight AZ traversals, the total processing time can be no faster than 12 ms. At the 50th percentile (p50), meaning the median, let’s assume the cross-AZ latency is 1.5 ms and non-network processing is 8 ms, resulting in a total of 20 ms for overall processing. Additionally, if this system is processing millions of requests, the data transfer charges could become substantial over time. Now, let’s imagine that a workload using the foo service must operate with p50 latency under 20 ms. How can the foo service change their system design to meet this goal?

Availability Zone affinity

The AZ Affinity architectural pattern reduces the number of times an AZ boundary is crossed. In the example system we looked at in Figure 1, AZ Affinity can be implemented with two changes.

  1. First, the ALB is replaced with a Network Load Balancer (NLB). NLBs provide an elastic network interface per AZ that is configured with a static IP. NLBs also have cross-zone load balancing disabled by default. This ensures that requests are only sent to targets that are in the same AZ as the elastic network interface that receives the request.
  2. Second, DNS entries are created for each elastic network interface to provide an AZ-specific record using the AZ ID, which is consistent across accounts. Clients use that DNS record to communicate with a load balancer in the AZ they select. So instead of interacting with a Region-wide service using a DNS name like foo.com, they would instead use use1-az1.foo.com.

Figure 2 shows the system with AZ Affinity. We can see that each request, in the worst case, only traverses an AZ boundary four times. Data transfer costs are reduced by approximately 40 percent compared to the previous implementation. If we use 300 μs as the p50 latency for intra-AZ communication, we now get (4×300μs)+(4×1.5ms)=7.2ms. Using the median 8 ms processing time, this brings the overall median latency to 15.2 ms. This represents a 40 percent reduction in median network latency. When thinking about p90, p99, or even p99.9 latencies, this reduction could be even more significant.

The system now implements AZ Affinity

Figure 2. The system now implements AZ Affinity

Figure 3 shows how you could take this approach one step farther using service discovery. Instead of requiring the client to remember AZ-specific DNS names for load balancers, we can use AWS Cloud Map for service discovery. AWS Cloud Map is a fully managed service that allows clients to look up IP address and port combinations of service instances using DNS and dynamically retrieve abstract endpoints, like URLs, over the HTTP-based service Discovery API. Service discovery can reduce the need for load balancers, removing their cost and added latency.

The client first retrieves details about the service instances in their AZ from the AWS Cloud Map registry. The results are filtered to the client’s AZ by specifying an optional parameter in the request. Then they use that information to send requests to the discovered request routers.

AZ Affinity implemented using AWS Cloud Map for service discovery

Figure 3. AZ Affinity implemented using AWS Cloud Map for service discovery

Workload resiliency

In the new architecture using AZ Affinity, the client has to select which AZ they communicate with. Since they are “pinned” to a single AZ and not load balanced across multiple AZs, they may see impact during an event affecting the AWS infrastructure or foo service in that AZ.

During this kind of event, clients can choose to use retries with exponential backoff or send requests to the other AZs that aren’t impacted. Alternatively, they could implement a circuit breaker to stop making requests from the client in the affected AZ and only use clients in the others. Both approaches allow them to use the resiliency of Multi-AZ systems while taking advantage of AZ Affinity during normal operation.

Client libraries

The easiest way to achieve the process of service discovery, retries with exponential backoff, circuit breakers, and failover is to provide a client library/SDK. The library handles all of this logic for users and makes the process transparent, like what the AWS SDK or CLI does. Users then get two options, the low-level API and the high-level library.

Conclusion

This blog demonstrated how the AZ Affinity pattern helps reduce latency and data transfer costs for Multi-AZ systems while providing high availability. If you want to investigate your data transfer costs, check out the Using AWS Cost Explorer to analyze data transfer costs blog for an approach using AWS Cost Explorer.

For investigating latency in your workload, consider using AWS X-Ray and Amazon CloudWatch for tracing and observability in your system. AZ Affinity isn’t the right solution for every workload, but if you need to reduce inter-AZ data transfer costs or improve latency, it’s definitely an approach to consider.


  1. This estimate was made using t4g.small instances sending ping requests across AZs. The tests were conducted in the us-east-1, us-west-2, and eu-west-1 Regions. These results represent the p0 (fastest) and p50 (median) intra-AZ latency in those Regions at the time they were gathered, but are not a guarantee of the latency between two instances in any location. You should perform your own tests to calculate the performance enhancements AZ Affinity offers.

The collective thoughts of the interwebz