Cloudflare blocks 15M rps HTTPS DDoS attack

Post Syndicated from Omer Yoachimik original https://blog.cloudflare.com/15m-rps-ddos-attack/

Cloudflare blocks 15M rps HTTPS DDoS attack

Cloudflare blocks 15M rps HTTPS DDoS attack

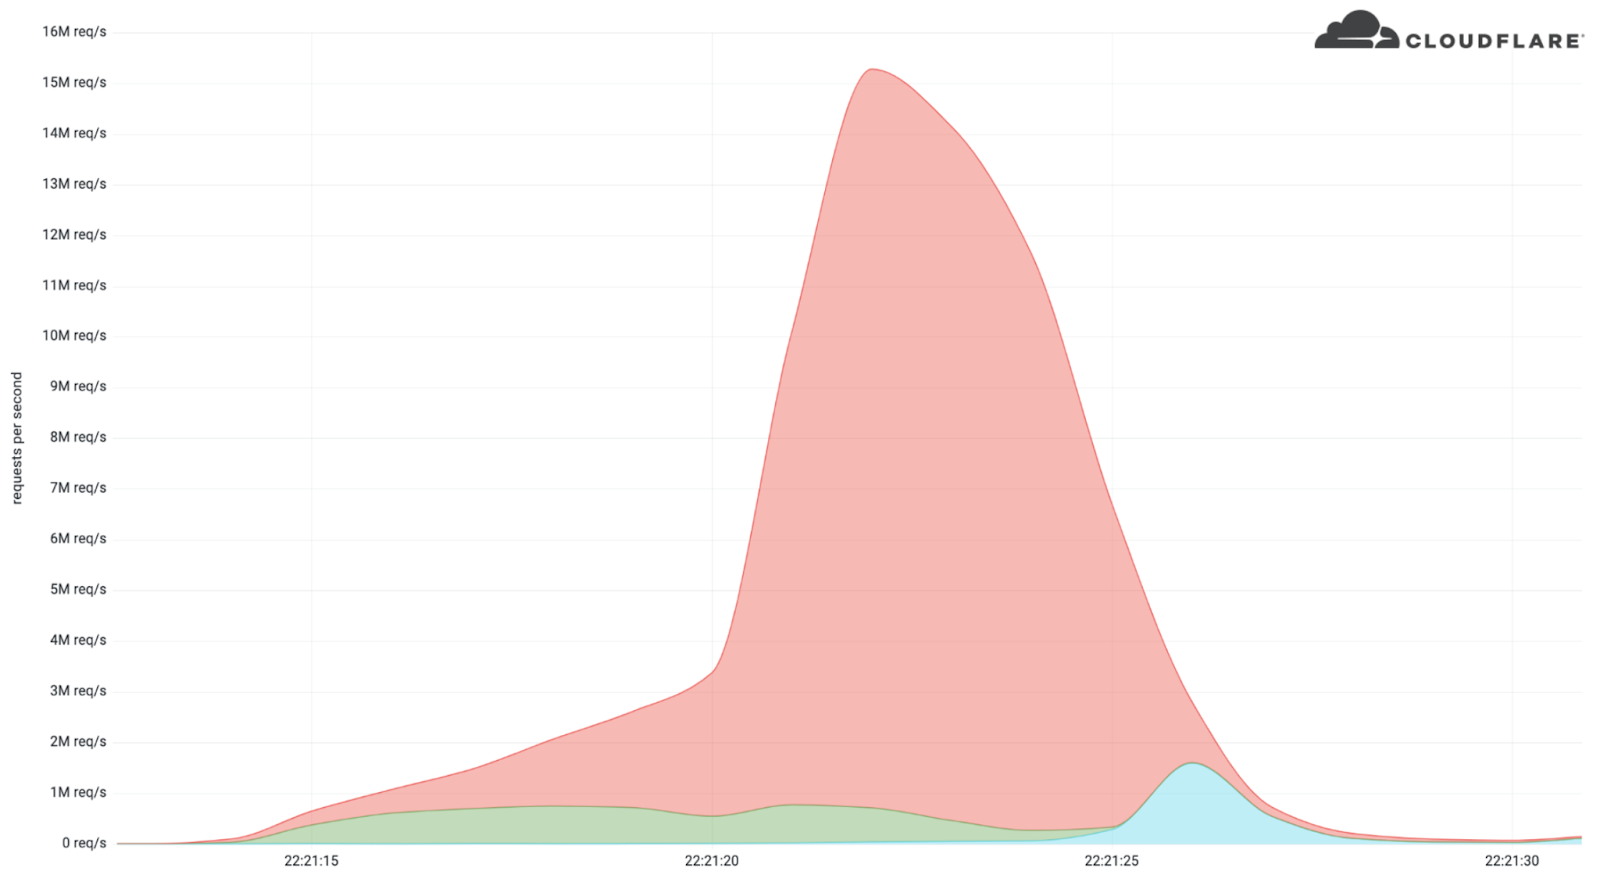
Earlier this month, Cloudflare’s systems automatically detected and mitigated a 15.3 million request-per-second (rps) DDoS attack — one of the largest HTTPS DDoS attacks on record.

While this isn’t the largest application-layer attack we’ve seen, it is the largest we’ve seen over HTTPS. HTTPS DDoS attacks are more expensive in terms of required computational resources because of the higher cost of establishing a secure TLS encrypted connection. Therefore it costs the attacker more to launch the attack, and for the victim to mitigate it. We’ve seen very large attacks in the past over (unencrypted) HTTP, but this attack stands out because of the resources it required at its scale.

The attack, lasting less than 15 seconds, targeted a Cloudflare customer on the Professional (Pro) plan operating a crypto launchpad. Crypto launchpads are used to surface Decentralized Finance projects to potential investors. The attack was launched by a botnet that we’ve been observing — we’ve already seen large attacks as high as 10M rps matching the same attack fingerprint.

Cloudflare customers are protected against this botnet and do not need to take any action.

Cloudflare blocks 15M rps HTTPS DDoS attack

The attack

What’s interesting is that the attack mostly came from data centers. We’re seeing a big move from residential network Internet Service Providers (ISPs) to cloud compute ISPs.

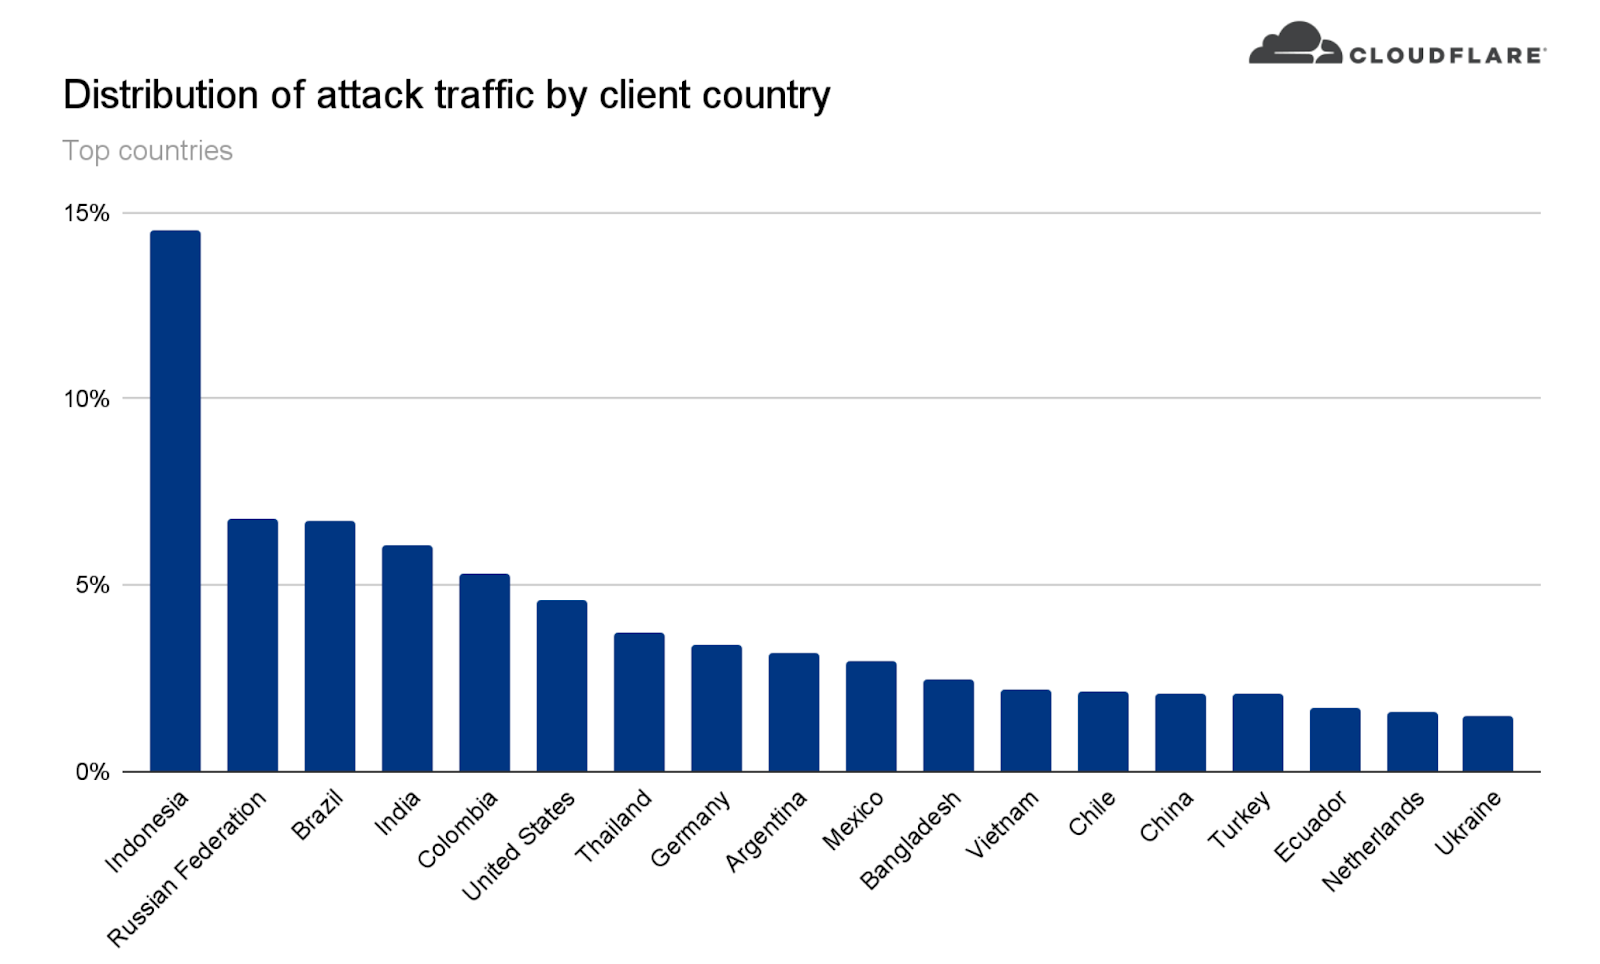
This attack was launched from a botnet of approximately 6,000 unique bots. It originated from 112 countries around the world. Almost 15% of the attack traffic originated from Indonesia, followed by Russia, Brazil, India, Colombia, and the United States.

Cloudflare blocks 15M rps HTTPS DDoS attack

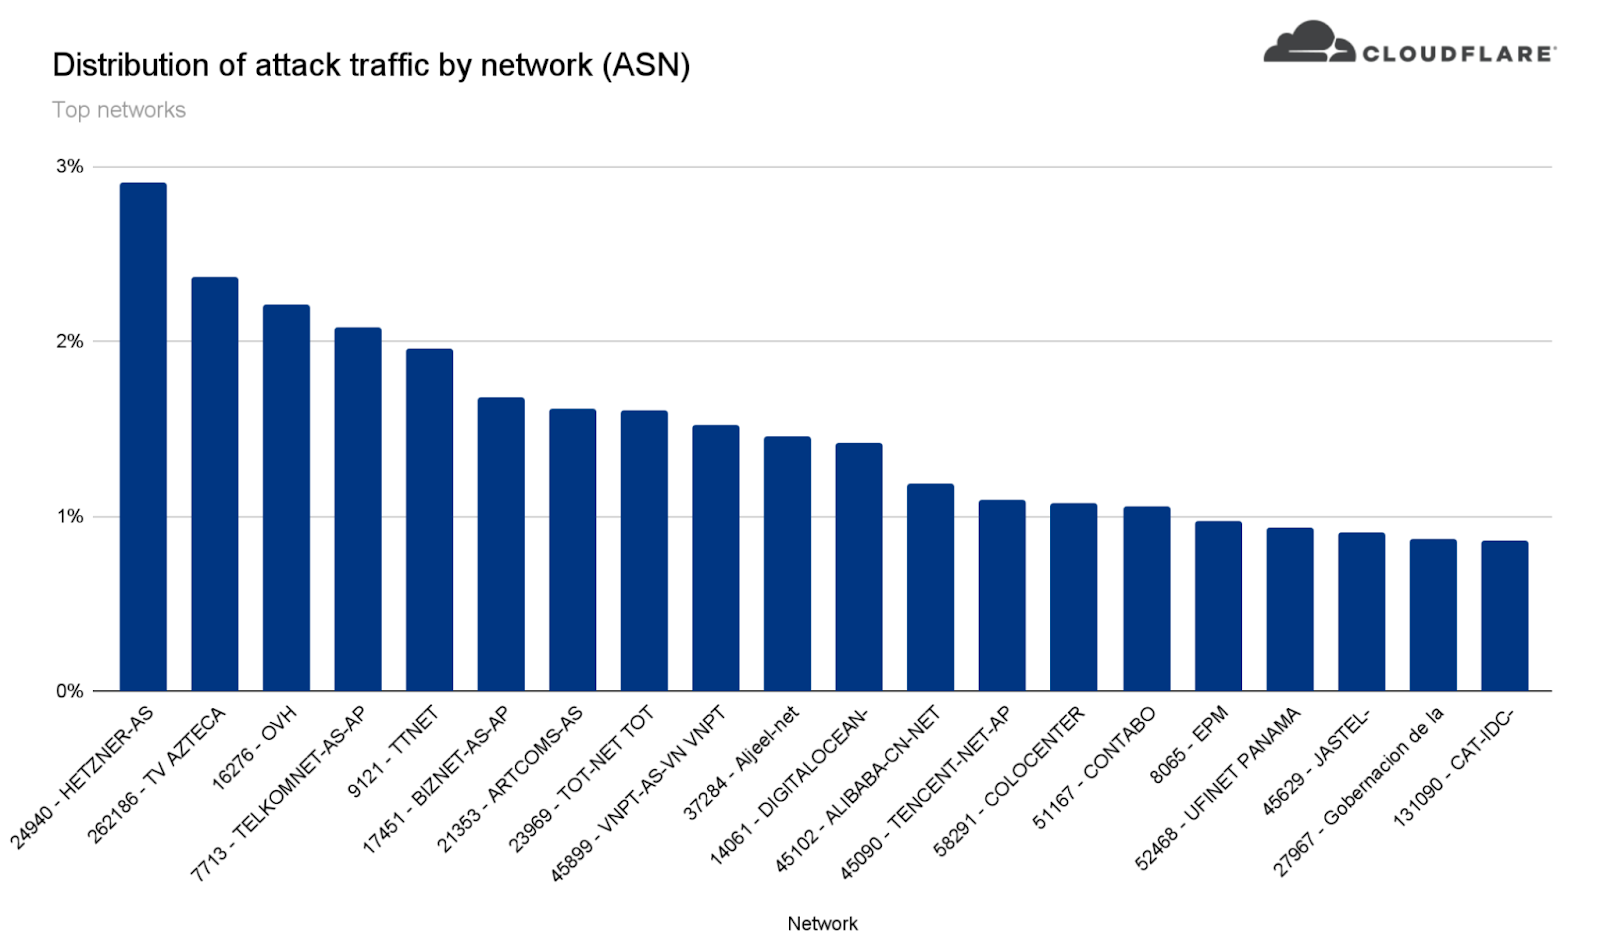
Within those countries, the attack originated from over 1,300 different networks. The top networks included the German provider Hetzner Online GmbH (Autonomous System Number 24940), Azteca Comunicaciones Colombia (ASN 262186), OVH in France (ASN 16276), as well as other cloud providers.

Cloudflare blocks 15M rps HTTPS DDoS attack

How this attack was automatically detected and mitigated

To defend organizations against DDoS attacks, we built and operate software-defined systems that run autonomously. They automatically detect and mitigate DDoS attacks across our entire network — and just as in this case, the attack was automatically detected and mitigated without any human intervention.

Our system starts by sampling traffic asynchronously; it then analyzes the samples and applies mitigations when needed.

Sampling

Initially, traffic is routed through the Internet via BGP Anycast to the nearest Cloudflare data centers that are located in over 250 cities around the world. Once the traffic reaches our data center, our DDoS systems sample it asynchronously allowing for out-of-path analysis of traffic without introducing latency penalties.

Analysis and mitigation

The analysis is done using data streaming algorithms. HTTP request samples are compared to conditional fingerprints, and multiple real-time signatures are created based on dynamic masking of various request fields and metadata. Each time another request matches one of the signatures, a counter is increased. When the activation threshold is reached for a given signature, a mitigation rule is compiled and pushed inline. The mitigation rule includes the real-time signature and the mitigation action, e.g. block.

Cloudflare customers can also customize the settings of the DDoS protection systems by tweaking the HTTP DDoS Managed Rules.

You can read more about our autonomous DDoS protection systems and how they work in our deep-dive technical blog post.

Helping build a better Internet

At Cloudflare, everything we do is guided by our mission to help build a better Internet. The DDoS team’s vision is derived from this mission: our goal is to make the impact of DDoS attacks a thing of the past. The level of protection that we offer is unmetered and unlimited — It is not bounded by the size of the attack, the number of the attacks, or the duration of the attacks. This is especially important these days because as we’ve recently seen, attacks are getting larger and more frequent.

Not using Cloudflare yet? Start now with our Free and Pro plans to protect your websites, or contact us for comprehensive DDoS protection for your entire network using Magic Transit.

Security updates for Wednesday

Post Syndicated from original https://lwn.net/Articles/892802/

Security updates have been issued by Mageia (virtualbox), Red Hat (container-tools:2.0, container-tools:3.0, gzip, kernel, kernel-rt, kpatch-patch, mariadb:10.3, mariadb:10.5, maven-shared-utils, polkit, vim, xmlrpc-c, and zlib), Scientific Linux (maven-shared-utils), SUSE (ant, go1.17, go1.18, kernel, and xen), and Ubuntu (fribidi, git, libcroco, libsepol, linux, linux-gcp, linux-ibm, linux-lowlatency, openjdk-17, and openjdk-lts).

Registering SMS Sender IDs in Singapore

Post Syndicated from Brent Meyer original https://aws.amazon.com/blogs/messaging-and-targeting/registering-sms-sender-ids-in-singapore/

A few weeks ago, we published a blog post about the process of registering alphanumeric Sender IDs. Today, we’re announcing support for registering Sender IDs in Singapore.

About Sender ID registration in Singapore

Singapore’s Infocomm Media Development Authority (IMDA) has created a Sender ID registry to protect consumers from fraudulent and malicious SMS messages. This registry is called the Singapore SMS Sender ID Registry (SSIR).

The government of Singapore encourages all government agencies and financial institutions to register with SSIR. Organizations and businesses outside of these industries can also register with SSIR.

Currently, there is no requirement to register your Sender ID. However, when you register with the SSIR, your Sender ID becomes a “Protected Sender ID.” Protected Sender IDs help to protect you and your customers by preventing other senders from using your Sender ID.

Note that in order to complete this registration process, your business or organization must have a Unique Entity Number (UEN). Businesses and other organizations receive a UEN when they register with Singapore’s Accounting and Corporate Regulatory Authority.

Registering your Sender ID

The first step in the registration process is to create a Protected Sender ID through the Singapore Network Information Centre (SGNIC). To initiate the registration process, send an email to [email protected]. In your message, include the name of your business, the Sender IDs that you want to register, and a description of your use case. SGNIC may contact you for additional information.

After you register with SGNIC, open a ticket in the AWS Support Center. You can find the procedure for opening a case in the Amazon Pinpoint User Guide. The AWS Support team will respond to your case within 24 hours. Their response includes a template for a letter that shows your intent to register a Sender ID.

The next step is to modify the contents of this letter. The regulatory groups in Singapore require a copy of this letter in order to allow AWS to send messages using your Sender ID. Begin by placing the contents of the letter on your company’s letterhead. Next, modify the fields that are highlighted in yellow. These fields include the following:

  • <Place>: The address of your company or organization.
  • <Brand Owner Company Name>: The name of your company or organization.
  • <Number>: Your Unique Entity Number.
  • <Signature>, <Name>, <Title>: The personal signature, name, and job title of the person who is submitting the request on behalf of your company or organization.
  • <ExampleSenderId1>, <ExampleSenderId2>: The Sender IDs that you intend to register with SGNIC. You can add or remove lines here depending on how many Sender IDs you plan to register.

Once you finish modifying the letter, submit it by attaching it to your existing case in the AWS Support Center.

What happens next?

IMDA regularly sends us lists of new Sender ID registrations. When we receive confirmation that your Sender ID has been registered, we update your account to allow it to send SMS messages through your Sender ID. We will also comment on your Support case to indicate that the process is complete.

Wrapping up

We continue to monitor changes to Sender ID registration requirements around the world. We’re working closely with carriers and organizations around the world to make the registration processes as straightforward as possible for our customers. Check in on this blog regularly to learn more about future regulatory changes.

For more information about registering Sender IDs in Singapore, see Special requirements for Singapore in the Amazon Pinpoint User Guide.

[$] Super Python (part 2)

Post Syndicated from original https://lwn.net/Articles/892080/

Python’s super()
built-in function
can be somewhat confusing, as highlighted by a huge
python-ideas thread that we started looking
at
last week. It is used by methods in class hierarchies to access
methods and attributes in a parent class, but exactly which class
that super() resolves to is perhaps a bit unclear in multiple-inheritance hierarchies.
The discussion in the second “half” of the thread further highlighted some
lesser-known parts of the language.

Testing my System Code in /usr/ Without Modifying /usr/

Post Syndicated from original https://0pointer.net/blog/testing-my-system-code-in-usr-without-modifying-usr.html

I recently
blogged

about how to run a volatile systemd-nspawn container from your
host’s /usr/ tree, for quickly testing stuff in your host
environment, sharing your home drectory, but all that without making a
single modification to your host, and on an isolated node.

The one-liner discussed in that blog story is great for testing during
system software development. Let’s have a look at another systemd
tool that I regularly use to test things during systemd development,
in a relatively safe environment, but still taking full benefit of my
host’s setup.

Since a while now, systemd has been shipping with a simple component
called
systemd-sysext. It’s
primary usecase goes something like this: on one hand OS systems with
immutable /usr/ hierarchies are fantastic for security, robustness,
updating and simplicity, but on the other hand not being able to
quickly add stuff to /usr/ is just annoying.

systemd-sysext is supposed to bridge this contradiction: when
invoked it will merge a bunch of “system extension” images into
/usr/ (and /opt/ as a matter of fact) through the use of read-only
overlayfs, making all files shipped in the image instantly and
atomically appear in /usr/ during runtime — as if they always had
been there. Now, let’s say you are building your locked down OS, with
an immutable /usr/ tree, and it comes without ability to log into,
without debugging tools, without anything you want and need when
trying to debug and fix something in the system. With systemd-sysext
you could use a system extension image that contains all this, drop it
into the system, and activate it with systemd-sysext so that it
genuinely extends the host system.

(There are many other usecases for this tool, for example, you could
build systems that way that at their base use a generic image, but by
installing one or more system extensions get extended to with
additional more specific functionality, or drivers, or similar. The
tool is generic, use it for whatever you want, but for now let’s not
get lost in listing all the possibilites.)

What’s particularly nice about the tool is that it supports
automatically discovered dm-verity images, with signatures and
everything. So you can even do this in a fully authenticated,
measured, safe way. But I am digressing…

Now that we (hopefully) have a rough understanding what
systemd-sysext is and does, let’s discuss how specficially we can
use this in the context of system software development, to safely use
and test bleeding edge development code — built freshly from your
project’s build tree – in your host OS without having to risk that the
host OS is corrupted or becomes unbootable by stuff that didn’t quite
yet work the way it was envisioned:

The images systemd-sysext merges into /usr/ can be of two kinds:
disk images with a file system/verity/signature, or simple, plain
directory trees. To make these images available to the tool, they can
be placed or symlinked into /usr/lib/extensions/,
/var/lib/extensions/, /run/lib/extensions/ (and a bunch of
others). So if we now install our freshly built development software
into a subdirectory of those paths, then that’s entirely sufficient to
make them valid system extension images in the sense of
systemd-sysext, and thus can be merged into /usr/ to try them out.

To be more specific: when I develop systemd itself, here’s what I do
regularly, to see how my new development version would behave on my
host system. As preparation I checked out the systemd development git
tree first of course, hacked around in it a bit, then built it with
meson/ninja. And now I want to test what I just built:

sudo DESTDIR=/run/extensions/systemd-test ninja -C build install &&
        sudo systemd-sysext refresh --force

Explanation: first, we’ll install my current build tree as a system
extension into /run/extensions/systemd-test/. And then we apply it
to the host via the systemd-sysext refresh command. This command
will search for all installed system extension images in the
aforementioned directories, then unmount (i.e. “unmerge”) any
previously merged dirs from /usr/ and then freshly mount
(i.e. “merge”) the new set of system extensions on top of /usr/. And
just like that, I have installed my development tree of systemd into
the host OS, and all that without actually modifying/replacing even a
single file on the host at all. Nothing here actually hit the disk!

Note that all this works on any system really, it is not necessary
that the underlying OS even is designed with immutability in
mind. Just because the tool was developed with immutable systems in
mind it doesn’t mean you couldn’t use it on traditional systems where
/usr/ is mutable as well. In fact, my development box actually runs
regular Fedora, i.e. is RPM-based and thus has a mutable /usr/
tree. As long as system extensions are applied the whole of /usr/
becomes read-only though.

Once I am done testing, when I want to revert to how things were without the image installed, it is sufficient to call:

sudo systemd-sysext unmerge

And there you go, all files my development tree generated are gone
again, and the host system is as it was before (and /usr/ mutable
again, in case one is on a traditional Linux distribution).

Also note that a reboot (regardless if a clean one or an abnormal
shutdown) will undo the whole thing automatically, since we installed
our build tree into /run/ after all, i.e. a tmpfs instance that is
flushed on boot. And given that the overlayfs merge is a runtime
thing, too, the whole operation was executed without any
persistence. Isn’t that great?

(You might wonder why I specified --force on the systemd-sysext
refresh
line earlier. That’s because systemd-sysext actually does
some minimal version compatibility checks when applying system
extension images. For that it will look at the host’s
/etc/os-release file with
/usr/lib/extension-release.d/extension-release.<name>, and refuse
operaton if the image is not actually built for the host OS
version. Here we don’t want to bother with dropping that file in
there, we know already that the extension image is compatible with
the host, as we just built it on it. --force allows us to skip the
version check.)

You might wonder: what about the combination of the idea from the
previous blog story (regarding running container’s off the host
/usr/ tree) with system extensions? Glad you asked. Right now we
have no support for this, but it’s high on our TODO list (patches
welcome, of course!). i.e. a new switch for systemd-nspawn called
--system-extension= that would allow merging one or more such
extensions into the container tree booted would be stellar. With that,
with a single command I could run a container off my host OS but with
a development version of systemd dropped in, all without any
persistence. How awesome would that be?

(Oh, and in case you wonder, all of this only works with distributions
that have completed the /usr/ merge. On legacy distributions that
didn’t do that and still place parts of /usr/ all over the hierarchy
the above won’t work, since merging /usr/ trees via overlayfs is
pretty pointess if the OS is not hermetic in /usr/.)

And that’s all for now. Happy hacking!

Evolution of ML Fact Store

Post Syndicated from Netflix Technology Blog original https://netflixtechblog.com/evolution-of-ml-fact-store-5941d3231762

by Vivek Kaushal

At Netflix, we aim to provide recommendations that match our members’ interests. To achieve this, we rely on Machine Learning (ML) algorithms. ML algorithms can be only as good as the data that we provide to it. This post will focus on the large volume of high-quality data stored in Axion — our fact store that is leveraged to compute ML features offline. We built Axion primarily to remove any training-serving skew and make offline experimentation faster. We will share how its design has evolved over the years and the lessons learned while building it.

Terminology

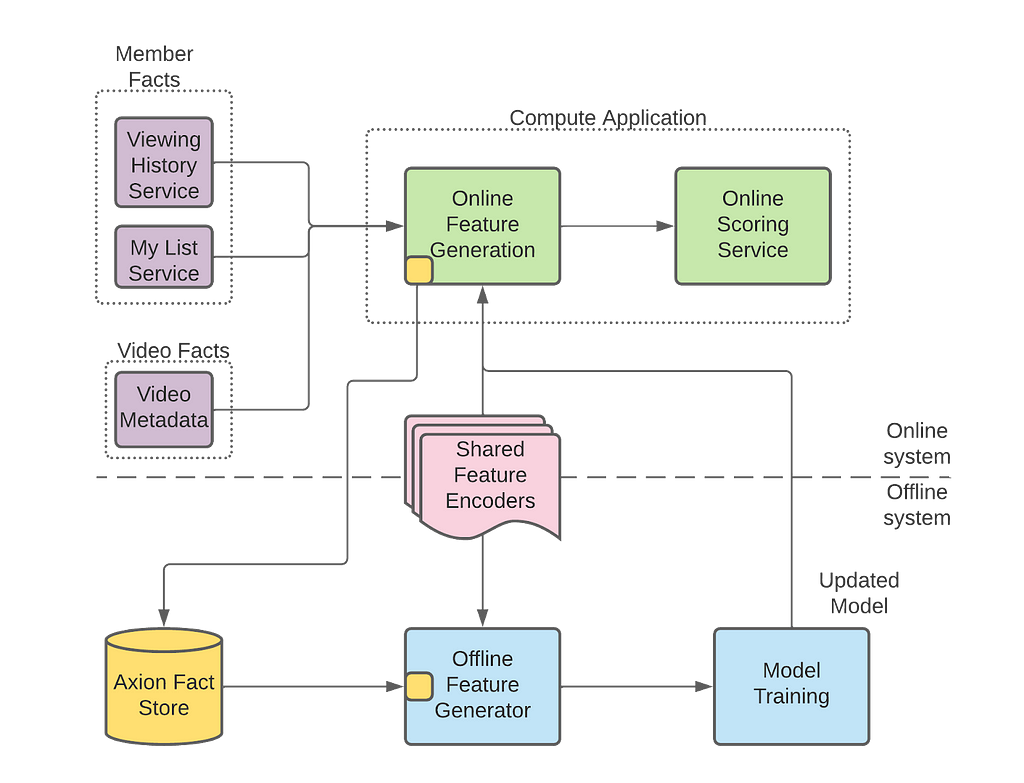
Axion fact store is part of our Machine Learning Platform, the platform that serves machine learning needs across Netflix. Figure 1 below shows how Axion interacts with Netflix’s ML platform. The overall ML platform has tens of components, and the diagram below only shows the ones that are relevant to this post. To understand Axion’s design, we need to know the various components that interact with it.

Figure 1: Netflix ML Architecture
  • Fact: A fact is data about our members or videos. An example of data about members is the video they had watched or added to their My List. An example of video data is video metadata, like the length of a video. Time is a critical component of Axion — When we talk about facts, we talk about facts at a moment in time. These facts are managed and made available by services like viewing history or video metadata services outside of Axion.
  • Compute application: These applications generate recommendations for our members. They fetch facts from respective data services, run feature encoders to generate features and score the ML models to eventually generate recommendations.
  • Offline feature generator: We regenerate the values of the features that were generated for inferencing in the compute application. Offline Feature Generator is a spark application that enables on-demand generation of features using new, existing, or updated feature encoders.
  • Shared feature encoders: Feature encoders are shared between compute applications and offline feature generators. We make sure there is no training/serving skew by using the same data and the code for online and offline feature generation.

Motivation

Five years ago, we posted and talked about the need for a ML fact store. The motivation has not changed since then; the design has. This post focuses on the new design, but here is a summary of why we built this fact store.

Our machine learning models train on several weeks of data. Thus, if we want to run an experiment with a new or modified feature encoder, we need to build several weeks of feature data with this new or modified feature encoder. We have two options to collect features using this updated feature encoder.

The first is to log features from the compute applications, popularly known as feature logging. We can deploy updated feature encoders in our compute applications and then wait for them to log the feature values. Since we train our models on several weeks of data, this method is slow for us as we will have to wait for several weeks for the data collection.

An alternative to feature logging is to regenerate the features with updated feature encoders. If we can access the historical facts, we can regenerate the features using updated feature encoders. Regeneration takes hours compared to weeks taken by the feature logging. Thus, we decided to go this route and started storing facts to reduce the time it takes to run an experiment with new or modified features.

Design evolution

Axion fact store has four components — fact logging client, ETL, query client, and data quality infrastructure. We will describe how the design evolved in these components.

Evolution of Fact Logging Client

Compute applications access facts (members’ viewing history, their likes and my list information, etc.) from various grpc services that power the whole Netflix experience. These facts are used to generate features using shared feature encoders, which in turn are used by ML models to generate recommendations. After generating the recommendations, compute applications use Axion’s fact logging client to log these facts.

At a later stage in the offline pipelines, the offline feature generator uses these logged facts to regenerate temporally accurate features. Temporal accuracy, in this context, is the ability to regenerate the exact set of features that were generated for the recommendations. This temporal accuracy of features is key to removing the training-serving skew.

The first version of our logger library optimized for storage by deduplicating facts and optimized for network i/o using different compression methods for each fact. Then we started hitting roadblocks while optimizing the query performance. Since we were optimizing at the logging level for storage and performance, we had less data and metadata to play with to optimize the query performance.

Eventually, we decided to simplify the logger. Now we asynchronously collect all the facts and metadata into a protobuf, compress it, and send it to the keystone messaging service.

Evolution of ETL and Query Client

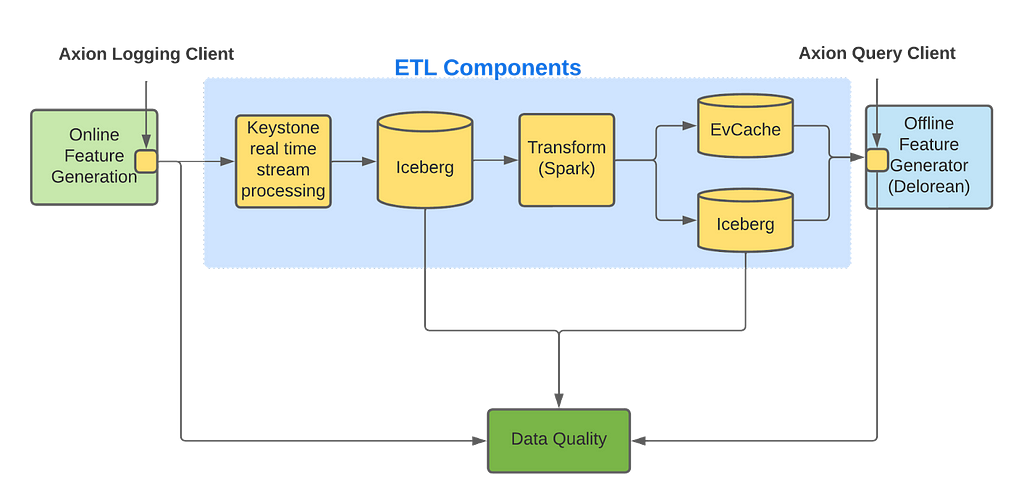
ETL and Query Client are intertwined, as any ETL changes could directly impact the query performance. ETL is the component where we experiment for query performance, improving data quality, and storage optimization. Figure 2 shows components of Axion’s ETL and its interaction with the query client.

Fig 2: Internal components of Axion

Axion’s fact logging client logs facts to the keystone real-time stream processing platform, which outputs data to an Iceberg table. We use Keystone as it is easy to use, reliable, scalable, and provides aggregation of facts from different cloud regions into a single AWS region. Having all data in a single AWS region exposes us to a single point of failure but it significantly reduces the operational overhead of our ETL pipelines which we believe makes it a worthwhile trade-off. We currently send all the facts into a single Keystone stream which we have configured to write to a single Iceberg table. We plan to split these Keystone streams into multiple streams for horizontal scalability.

The Iceberg table created by Keystone contains large blobs of unstructured data. These large unstructured blogs are not efficient for querying, so we need to transform and store this data in a different format to allow efficient queries. One might think that normalizing it would make storage and querying more efficient, albeit at the cost of writing more complex queries. Hence, our first approach was to normalize the incoming data and store it in multiple tables. We soon realized that, while space-optimized, it made querying very inefficient for the scale of data we needed to handle. We ran into various shuffle issues in Spark as we were joining several big tables at query time.

We then decided to denormalize the data and store all facts and metadata in one Iceberg table using nested Parquet format. While storing in one Iceberg table was not as space-optimized, Parquet did provide us with significant savings in storage costs, and most importantly, it made our Spark queries succeed. However, Spark query execution remained slow. Further attempts to optimize query performance, like using bloom filters and predicate pushdown, were successful but still far away from where we wanted it to be.

Why was querying the single Iceberg table slow?

What’s our end goal? We want to train our ML models to personalize the member experience. We have a plethora of ML models that drive personalization. Each of these models are trained with different datasets and features along with different stratification and objectives. Given that Axion is used as the defacto Fact store for assembling the training dataset for all these models, it is important for Axion to log and store enough facts that would be sufficient for all these models. However, for a given ML model, we only require a subset of the data stored in Axion for its training needs. We saw queries filtering down an input dataset of several hundred million rows to less than a million in extreme cases. Even with bloom filters, the query performance was slow because the query was downloading all of the data from s3 and then dropping it. As our label dataset was also random, presorting facts data also did not help.

We realized that our options with Iceberg were limited if we only needed data for a million rows — out of several hundred million — and we had no additional information to optimize our queries. So we decided not to further optimize joins with the Iceberg data and instead move to an alternate approach.

Low-latency Queries

To avoid downloading all of the fact data from s3 in a spark executor and then dropping it, we analyzed our query patterns and figured out that there is a way to only access the data that we are interested in. This was achieved by introducing an EVCache, a key-value store, which stores facts and indices optimized for these particular query patterns.

Let’s see how the solution works for one of these query patterns — querying by member id. We first query the index by member id to find the keys for the facts of that member and query those facts from EVCache in parallel. So, we make multiple calls to the key-value store for each row in our training set. Even when accounting for these multiple calls, the query performance is an order of magnitude faster than scanning several hundred times more data stored in the Iceberg table. Depending on the use case, EVCache queries can be 3x-50x faster than Iceberg.

The only problem with this approach is that EVCache is more expensive than Iceberg storage, so we need to limit the amount of data stored. So, for the queries that request data not available in EVCache, our only option is to query Iceberg. In the future, we want to store all facts in EVCache by optimizing how we store data in EVCache.

How do we monitor the quality of data?

Over the years, we learned the importance of having comprehensive data quality checks for our datasets. Corruption in data can significantly impact production model performance and A/B test results. From the ML researchers’ perspective, it doesn’t matter if Axion or a component outside of Axion corrupted the data. When they read the data from Axion, if it is bad, it is a loss of trust in Axion. For Axion to become the defacto fact store for all Personalization ML models, the research teams needed to trust the quality of data stored. Hence, we designed a comprehensive system that monitors the quality of data flowing through Axion to detect corruptions, whether introduced by Axion or outside Axion.

We bucketed data corruptions observed when reading data from Axion on three dimensions:

  • The impact on a value in data: Was the value missing? Did a new value appear (unintentionally)? Was the value replaced with a different value?
  • The spread of data corruption: Did data corruption have a row or columnar impact? Did the corruption impact one pipeline or multiple ML pipelines?
  • The source of data corruption: Was data corrupted by components outside of Axion? Did Axion components corrupt data? Was data corrupted at rest?

We came up with three different approaches to detect data corruption, wherein each approach can detect corruption along multiple dimensions described above.

Aggregations

Data volume logged to Axion datastore is predictable. Compute applications follow daily trends. Some log consistently every hour, others log for a few hours every day. We aggregate the counts on dimensions like total records, compute application, fact counts etc. Then we use a rule-based approach to validate the counts are within a certain threshold of past trends. Alerts are triggered when counts vary outside these thresholds. These trend-based alerts are helpful with missing or new data; row-level impact, and pipelines impact. They help with column-level impact only on rare occasions.

Consistent sampling

We sample a small percentage of the data based on a predictable member id hash and store it in separate tables. By consistent sampling across different data stores and pipelines, we can run canaries on this smaller subset and get output quickly. We also compare the output of these canaries against production to detect unintended changes in data during new code deployment. One downside of consistent sampling is that it may not catch rare issues, especially if the rate of data corruption is significantly lower than our sampling rate. Consistent sampling checks help detect attribute impact — new, missing, or replacement; columnar impact, and single pipeline issues.

Random sampling

While the above two strategies combined can detect most data corruptions, they do occasionally miss. For those rare occasions, we rely on random sampling. We randomly query a subset of the data multiple times every hour. Both hot and cold data, i.e., recently logged data and data logged a while ago, are randomly sampled. We expect these queries to pass without issues. When they fail, it is either due to bad data or issues with the underlying infrastructure. While we think of it as an “I’m feeling lucky” strategy, it does work as long as we read significantly more data than the rate of corrupted data.

Another advantage to random sampling is maintaining the quality of unused facts. Axion users do not read a significant percentage of facts logged to Axion, and we need to make sure that these unused facts are of good quality as they can be used in the future. We have pipelines that randomly read these unused facts and alert when the query does not get the expected output. In terms of impact, these random checks are like winning a lottery — you win occasionally, and you never know how big it is.

Results from monitoring data quality

We deployed the above three monitoring approaches more than two years ago, and since then, we have identified more than 95% of data issues early. We have also significantly improved the stability of our customer pipelines. If you want to know more about how we monitor data quality in Axion, you can check our spark summit talk and this podcast.

Learnings from Axion’s evolution

We learned from designing this fact store to start with a simple design and avoid premature optimizations that add complexity. Pay the storage, network, and compute cost. As the product becomes available to the customers, new use cases will pop up that will be harder to support with a complex design. Once the customers have adopted the product, start looking into optimizations.

While “keep the design simple” is a frequently shared learning in software engineering, it is not always easy to achieve. For example, we learned that our fact logging client can be simple with minimal business logic, but our query client needs to be functionality-rich. Our learning is that if we need to add complexity, add it in the least number of components instead of spreading it out.

Another learning is that we should have invested early into a robust testing framework. Unit tests and integration tests only took us so far. We needed scalability testing and performance testing as well. This scalability and performance testing framework helped stabilize the system because, without it, we ran into issues that took us weeks to clean up.

Lastly, we learned that we should run data migrations and push the breaking API changes as soon as possible. As more customers adopt Axion, running data migrations and making breaking API changes are becoming harder and harder.

Conclusion and future work

Axion is our primary data source that is used extensively by all our Personalization ML models for offline feature generation. Given that it ensures that there is no training/serving skew and that it has significantly reduced offline feature generation latencies we are now starting to make it the defacto Fact store for other ML use cases within Netflix.

We do have use cases that are not served well with the current design, like bandits, because our current design limits storing a map per row creating a limitation when a compute application needs to log multiple values for the same key. Also, as described in the design, we want to optimize how we store data in EVCache to enable us to store more data.

If you are interested in working on similar challenges, join us.


Evolution of ML Fact Store was originally published in Netflix TechBlog on Medium, where people are continuing the conversation by highlighting and responding to this story.

Two voting days, a debate and a polling rule in France impacts the Internet

Post Syndicated from João Tomé original https://blog.cloudflare.com/french-elections-2022-runoff/

Two voting days, a debate and a polling rule in France impacts the Internet

Two voting days, a debate and a polling rule in France impacts the Internet

We blogged previously about some trends concerning the first round of the 2022 French presidential election, held on April 10. Here we take a look at the run-off election this Sunday, April 24, that ended up re-electing Emmanuel Macron as President of France.

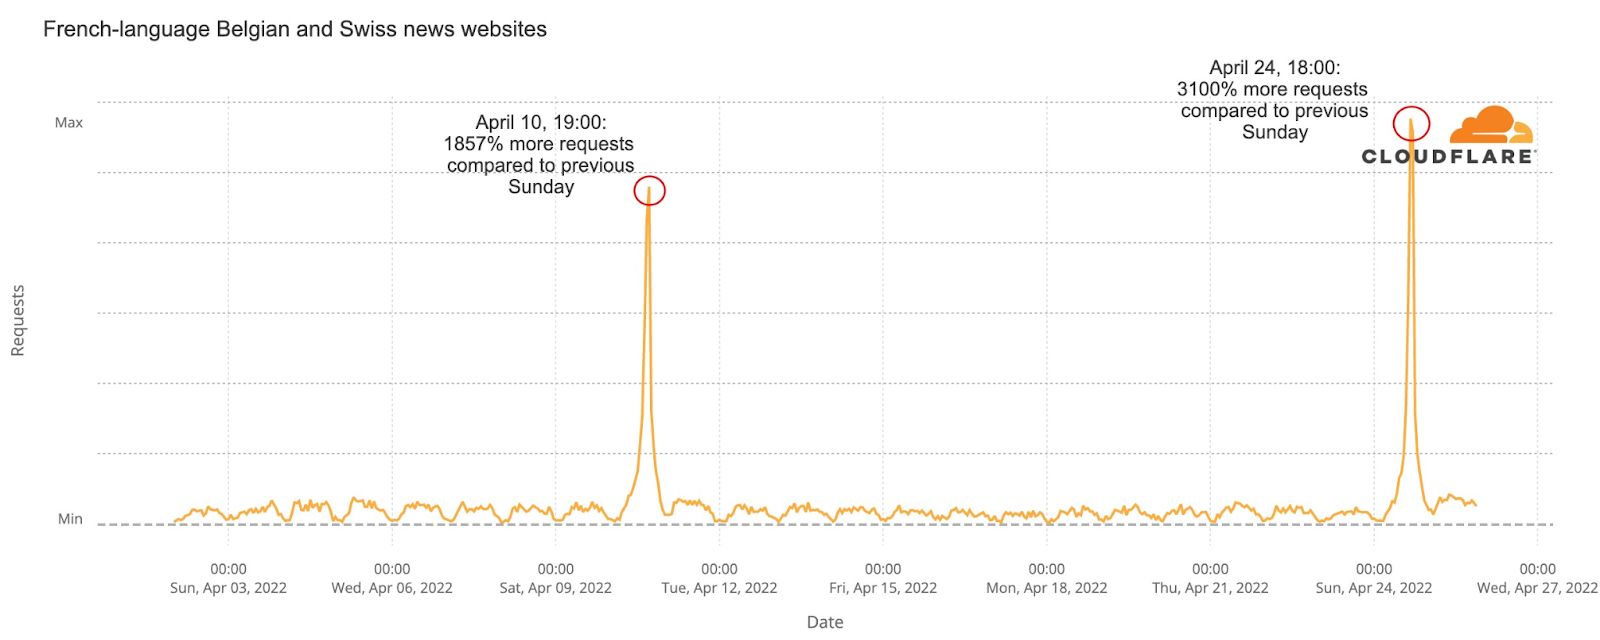
First, the two main trends: French-language news sites outside France were clearly impacted by the local rule that states that exit polls can only be published after 20:00.

And Internet traffic was similar on both the election days (April 10 and 24) and that includes the increase in use of mobile devices and interest in news websites — there we also saw a clear interest in the Macron-Le Pen debate on April 20.

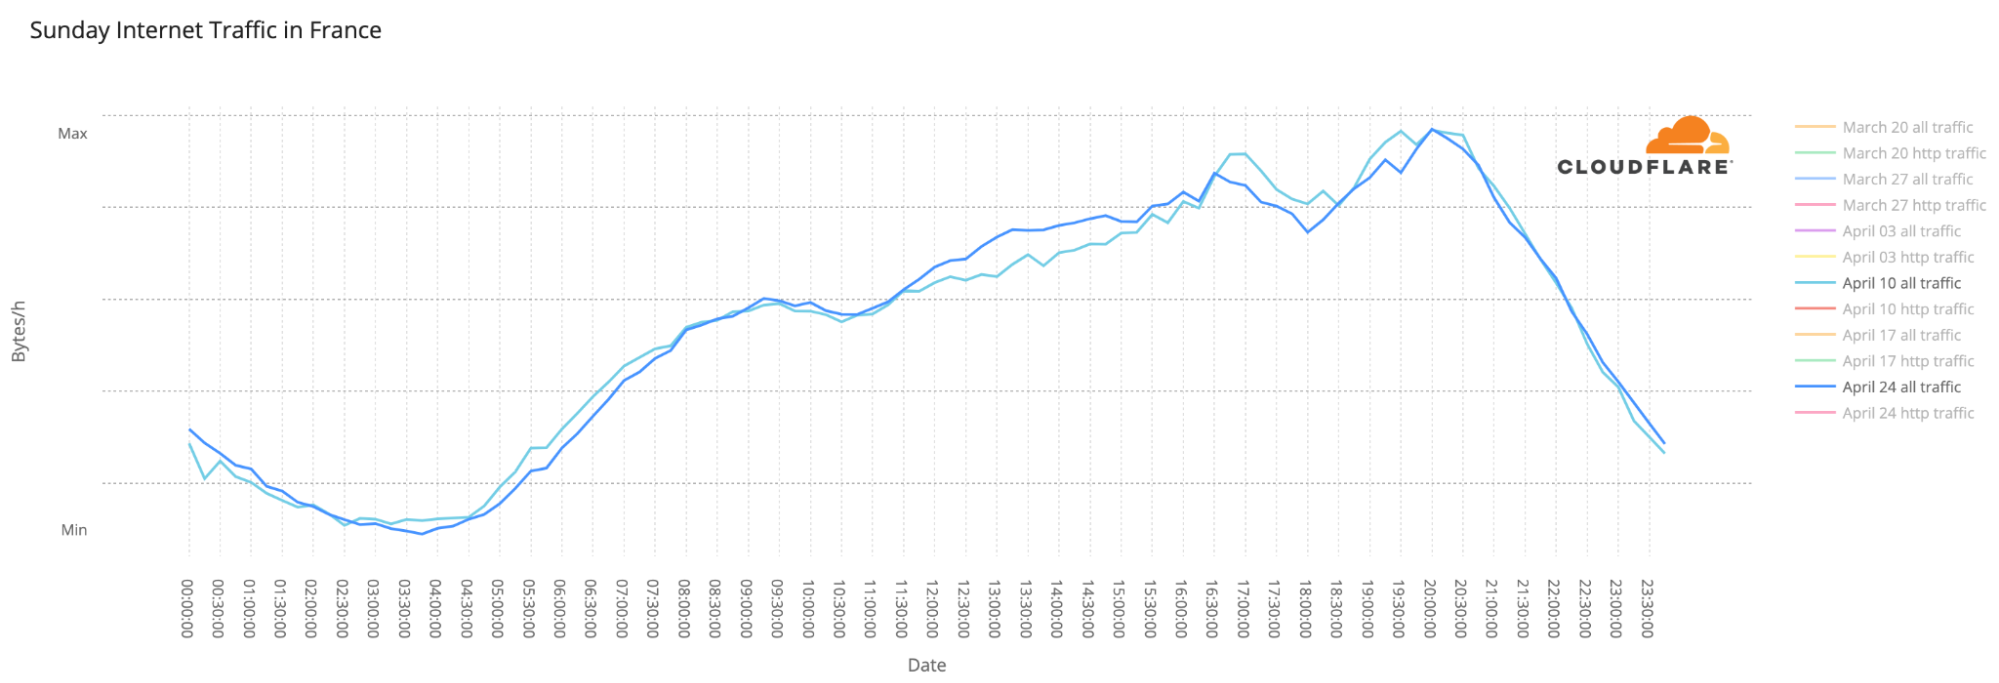
We have discussed before that election days usually don’t have a major impact on overall Internet traffic. Let’s compare April 10 with 24, the two Sundays when the elections were held. The trends throughout the day are incredibly similar (with a slight increase in traffic on April 24), even with a two-week gap between them.

Two voting days, a debate and a polling rule in France impacts the Internet

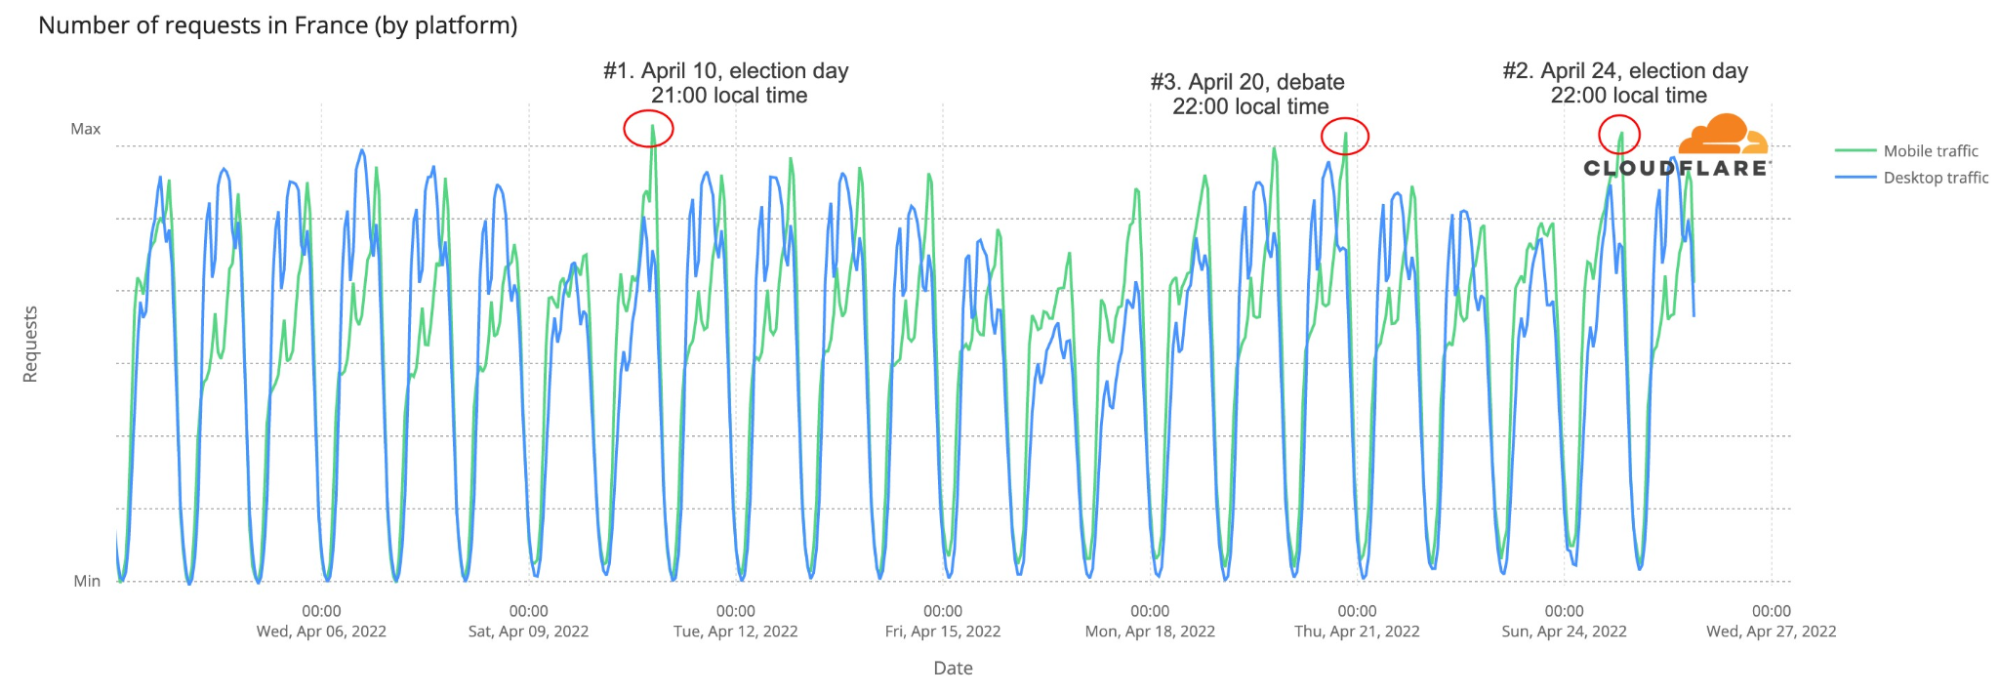
Another election-day trend is the use of mobile devices to access the Internet, mainly at night. The largest spikes in number of requests made using mobile devices in France during April seemed to be all election-related:

Two voting days, a debate and a polling rule in France impacts the Internet

#1. April 10 (first round of the election), 21:00 local time. 58% of traffic by mobile devices.

#2. April 24 (second round of the  election), 22:00. 57% mobile traffic.

#3. April 20 (presidential debate), 22:00. 56% mobile traffic.

Not only did both the election Sundays (after the polling stations were closed) have an impact on mobile traffic in France, but the presidential debate (Wednesday, April 20) had the same type of impact, increasing requests from mobile devices.

The TV debate was seen by 15.6 million viewers in France and lasted between 21:00 and 22:45, local time; at the same time mobile traffic was higher than in any other Wednesday and was the #3 spike of April, with 10% more mobile requests than in the previous Wednesday at the same time.

The special case of French-language news sites

For the elections, local rules state that French media is barred from publishing partial results or polls of any kind until 20:00, the time when voting stations in metropolitan France officially close. So, that means that French news outlets have to wait for the allotted hour to give official projections.

Given that, we looked at French-language news websites from French-speaking countries like Switzerland and Belgium. They aren’t bound by French law and can show information about exit polls earlier (bear in mind that in most French cities polling stations close at 19:00 and only in the bigger cities does it go on until 20:00).

For example, the Swiss Le Temps published exit polls at 19:30.

Two voting days, a debate and a polling rule in France impacts the Internet

We can clearly see that requests to French-language news sites outside France clearly spiked earlier than those in France. News websites in France had spikes after 20:00 local time on both elections days, but Belgian and Swiss news sites had major increases in traffic at 19:00 on April 10 (1857% more than the previous Sunday!). For the runoff elections on April 24, the biggest spike of the month was at 18:00 (3100% more requests than the previous Sunday), but it was also higher than on previous days one hour later, at 19:00 (3080% higher).

There are no spikes at all related to the French debate (April 20), so that seems to show that those Belgian and Swiss news sites had a huge increase of French citizens eager to see the polls before 20:00.

Election results change online patterns

We saw two weeks ago that official election websites had a clear spike in requests on April 10, the first round of the elections. Here we’re looking at DNS request trends to get a sense of traffic to Internet properties.

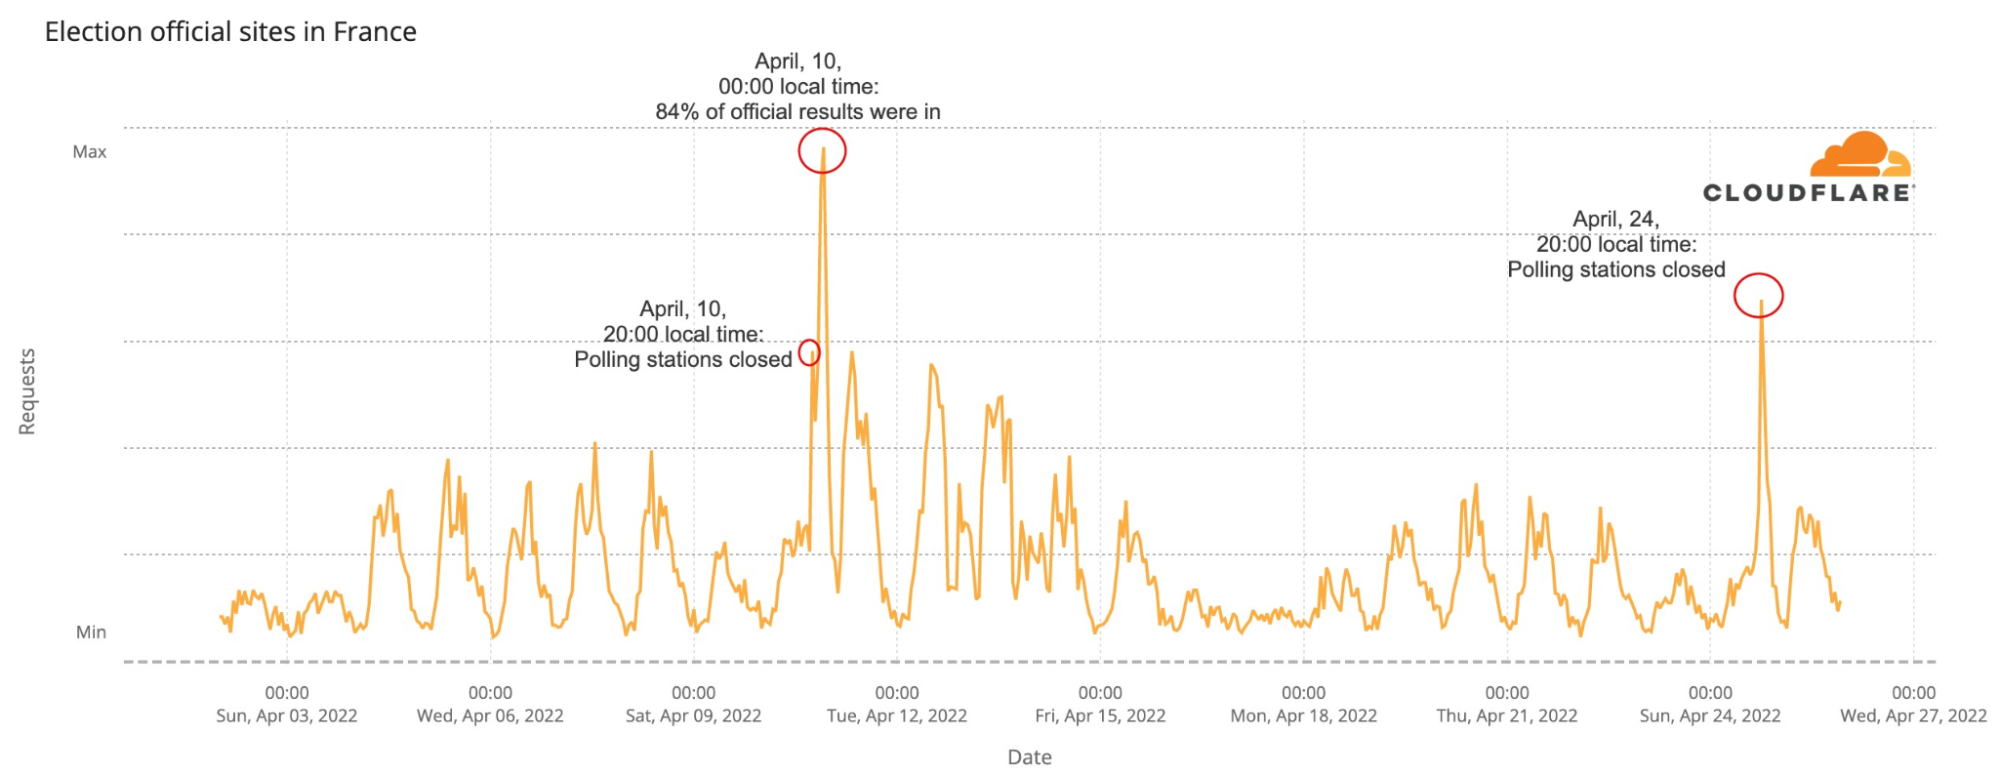
Official French election-related websites had an increase in traffic throughout the week prior to the first round, after Monday, April 4, but it’s no surprise that the two major spikes were on both the elections’ day. How much? Here is the breakdown by bigger spikes in traffic:

Two voting days, a debate and a polling rule in France impacts the Internet

#1. April 10 (first round of the election), 00:00 local time. 925% more requests than the previous Sunday (at the same time).

#2. April 24  (second round of the election), 20:00. 707% more requests.

#3. April 10 (first round of the election), 20:00. 370% more requests.

#3. April 11, 10:00. 115% more requests than the previous Monday.

(there’s a draw at these last two spikes)

News sites go up after polling stations close

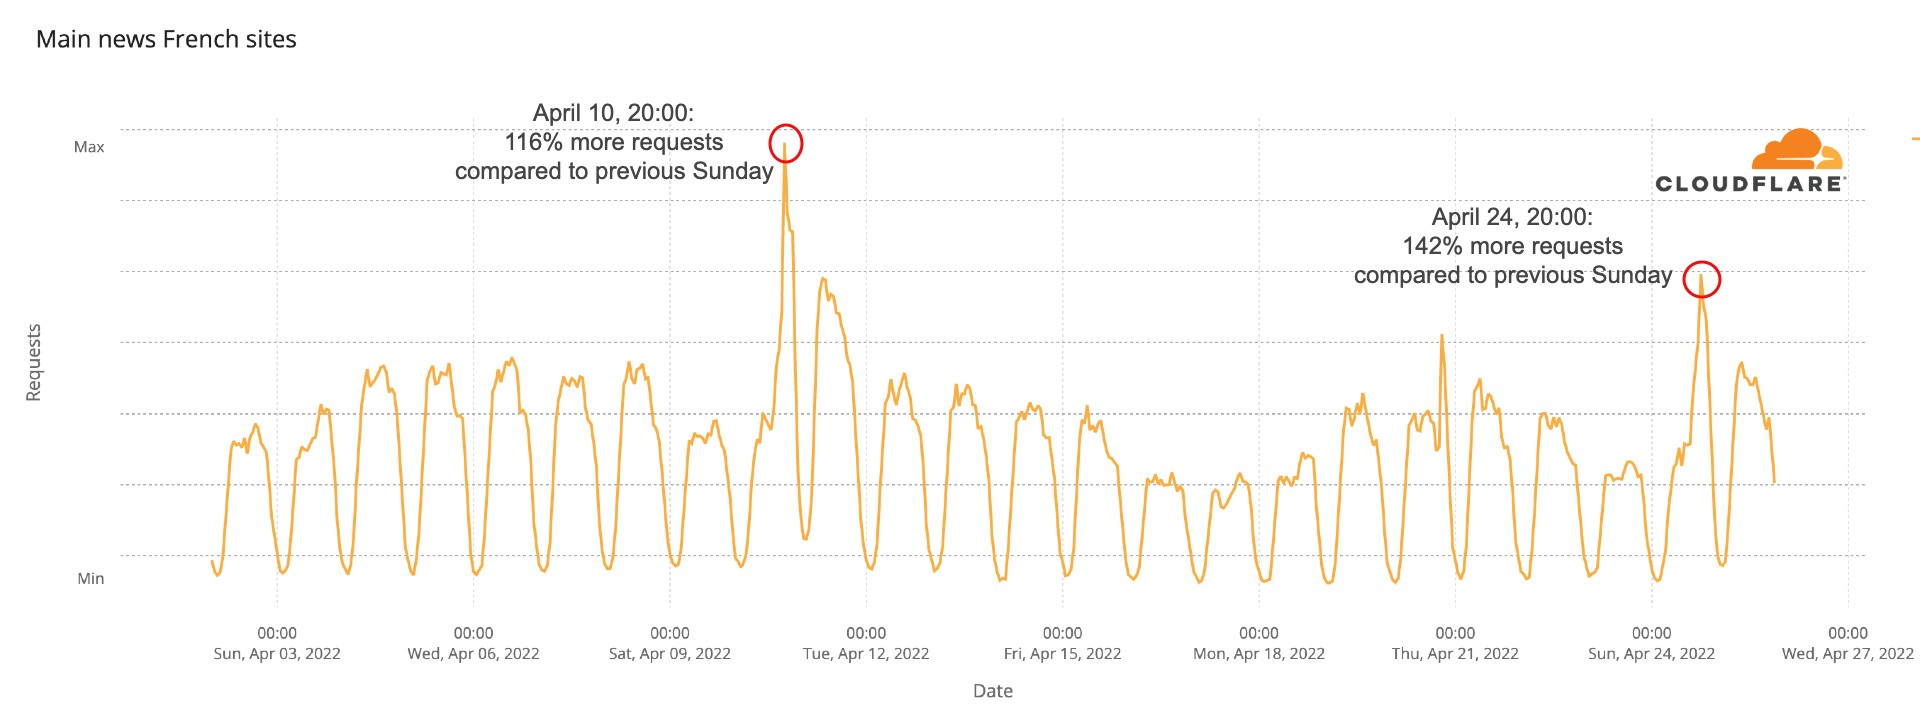
Regarding the main French news websites, as we saw two weeks ago, 20:00 local time, after the polling stations are all closed, and the first major polls are revealed continues to be the time of the biggest spikes of the whole month.

The biggest spike of the month in our aggregate DNS chart, that shows trends from 12 news websites, was definitely on April 10, the first round election day, around 20:00 local time, when those domains had 116% more traffic than at the same time on the previous Sunday. And the second-biggest spike was the runoff election day, on April 24, at the same time (20:00 local time), with an increase of 142% in traffic compared to the previous Sunday at the same time.

Two voting days, a debate and a polling rule in France impacts the Internet

Very close to those two spikes is Monday morning, April 11, after the first round of the elections. At 10:00 local time requests were 45% higher than in the previous Monday. The Macron-Le Pen debate on Wednesday, April 20, also had a spike. At 21:00, when it was starting, requests were 56% higher than on the previous Wednesday.

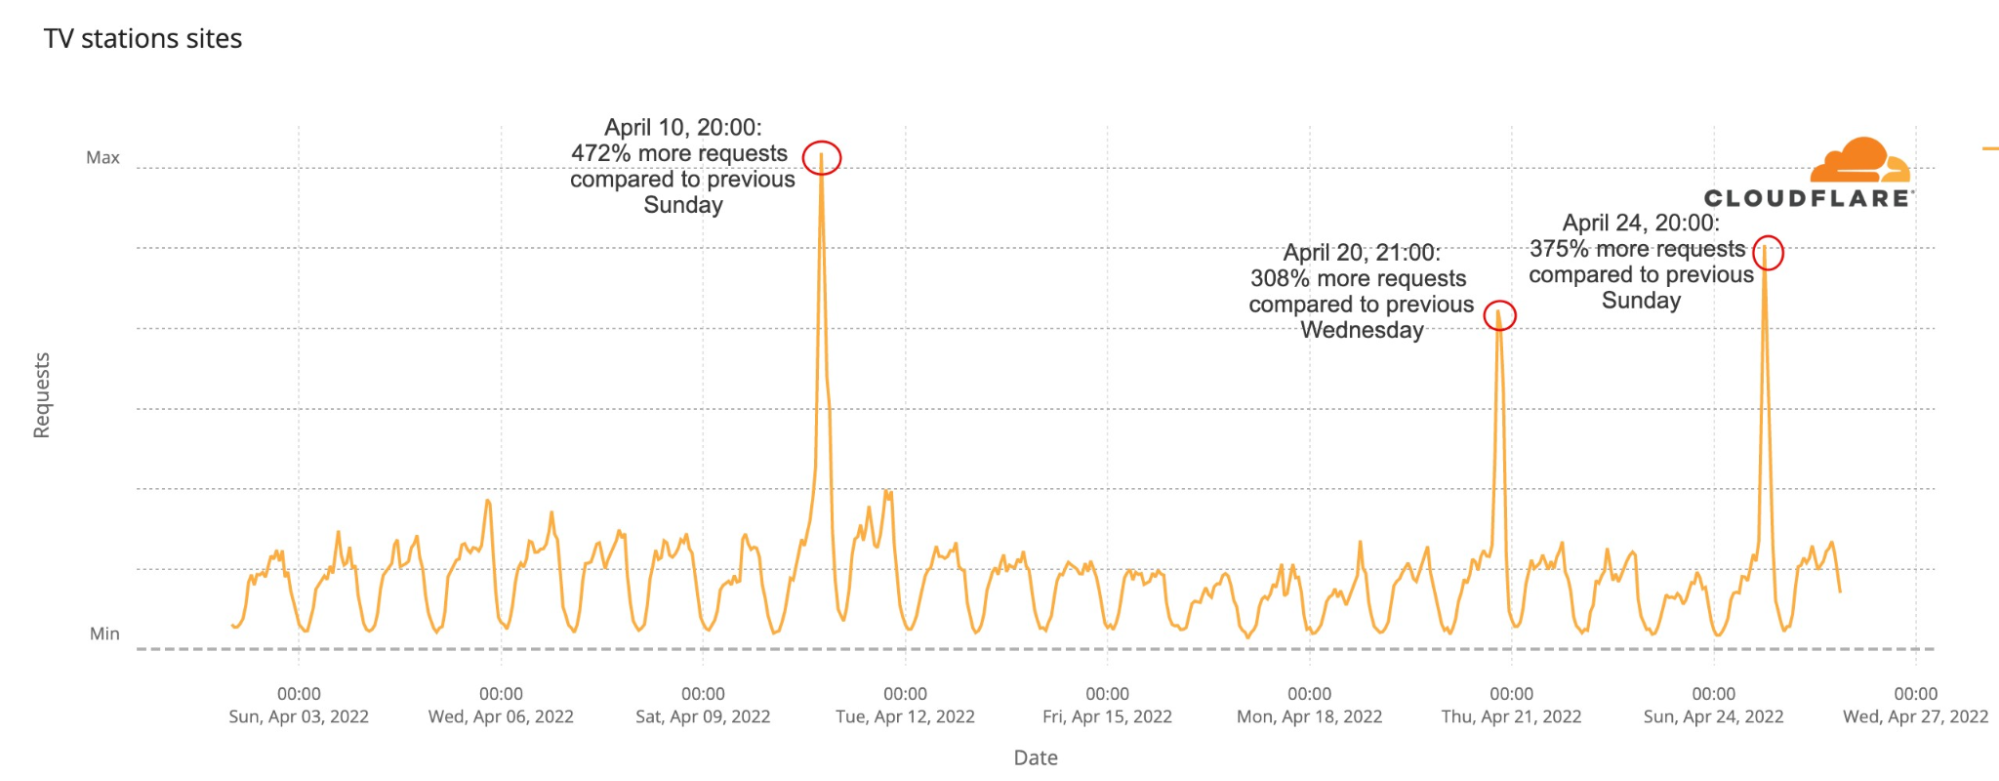
The same trend is seen on the major French TV station websites, with a clear isolated spike on April 10 (the first round election day) at 20:00 local time, with a 472% increase in traffic compared to the previous Sunday, when the main exit polls were announced. Something similar, at the same time (20:00), on April 24, with a 375% increase in requests compared to the previous Sunday.

Two voting days, a debate and a polling rule in France impacts the Internet

That’s only matched, again, by the April 20 debate. At 21:00 traffic was 308% higher than the previous Wednesday, so people were clearly taking notice of the debate and checking news outlets and TV station websites — there were French sites like france.tv that transmitted via streaming.

Conclusion

When people are really eager to see something as important as election results, they go and search where the first polls are (in this case, before 20:00 local time, they are outside France).

Also, in two different election moments in France separated by two weeks, there are clear similarities in Internet trends that show the way people use the Internet during election periods. That’s more clear when results start to arrive, but also a debate as important for a presidential election as the Le Pen-Macron one, also impacts not only the Internet traffic but also the attention to news and TV websites.

You can keep an eye on these trends using Cloudflare Radar.

Deux jours de vote, un débat et une réglementation concernant les élections en France impactent l’Internet

Post Syndicated from João Tomé original https://blog.cloudflare.com/french-elections-2022-runoff-fr-fr/

Deux jours de vote, un débat et une réglementation concernant les élections en France impactent l'Internet

Deux jours de vote, un débat et une réglementation concernant les élections en France impactent l'Internet

Nous avons publié un article de blog consacré à certaines tendances concernant le premier tour de l’élection présidentielle française de 2022, qui s’est déroulé le 10 avril. Nous nous intéressons ici au second tour de l’élection, qui a eu lieu le dimanche 24 avril et a abouti à la réélection d’Emmanuel Macron à la présidence de la France.

Tout d’abord, les deux principales tendances : les sites d’information francophones situés hors de France ont été clairement impactés par la réglementation locale, qui stipule que les estimations ne peuvent être publiées qu’après 20 heures.

Le trafic Internet a été similaire les deux jours de l’élection (les 10 et 24 avril), et cela inclut l’augmentation de l’utilisation des appareils mobiles et l’intérêt pour les sites d’actualités – – là aussi, nous avons constaté un net intérêt pour le débat Macron-Le Pen du 20 avril.

Nous avons déjà évoqué le fait que les jours d’élections n’ont généralement pas un impact majeur sur le trafic Internet global. Comparons les journées des 10 et 24 avril, les deux dimanches où ont eu lieu les élections. Les tendances tout au long de la journée sont incroyablement similaires (avec une légère augmentation du trafic le 24 avril), même à deux semaines d’intervalle.

Deux jours de vote, un débat et une réglementation concernant les élections en France impactent l'Internet

Une autre tendance des jours d’élection est l’utilisation d’appareils mobiles pour accéder à l’internet, principalement la nuit. Les plus importants pics du nombre de requêtes transmises depuis des appareils mobiles en France au mois d’avril semblent être tous liés aux élections :

Deux jours de vote, un débat et une réglementation concernant les élections en France impactent l'Internet

N°1. 10 avril (premier tour de l’élection), 21 heures, heure locale. 58 % du trafic provenait d’appareils mobiles.

N°2. 24 avril (deuxième tour de l’élection), 22 heures. 57 % de trafic mobile.

N°3. 20 avril (débat présidentiel), 22 heures. 56 % de trafic mobile.

Les deux dimanches de l’élection (après la fermeture des bureaux de vote) ont eu un impact sur le trafic mobile en France, et le débat présidentiel (mercredi 20 avril) a eu un impact semblable, entraînant une augmentation des requêtes provenant d’appareils mobiles.

Le débat télévisé a été regardé par 15,6 millions de téléspectateurs en France et a été diffusé de 21 heures à 22h45, heure locale ; au même moment, le trafic mobile a été plus élevé que tout autre mercredi et a constitué le pic n°3 du mois d’avril, avec une augmentation de 10 % des requêtes mobiles par rapport au mercredi précédent à la même heure.

Le cas particulier des sites d’actualités en langue française

Pour les élections, la réglementation locale stipule que les médias français ne peuvent pas publier de résultats partiels ou de sondages de quelque nature que ce soit avant 20 heures, heure de fermeture officielle des bureaux de vote en France métropolitaine. Cela signifie donc que les médias français doivent attendre l’heure prévue pour annoncer les estimations officielles.

Nous avons donc consulté les sites web d’actualités en langue française de pays francophones tels que la Suisse et la Belgique. Ces sites ne sont pas liés par la loi française et peuvent diffuser plus tôt des informations concernant les estimations (n’oubliez pas que dans la plupart des villes françaises, les bureaux de vote ferment à 19 heures, et qu’ils ne restent ouverts jusqu’à 20 heures que dans les grandes villes).

Par exemple, le site suisse Le Temps a publié les estimations à 19h30.

Deux jours de vote, un débat et une réglementation concernant les élections en France impactent l'Internet

Nous voyons clairement que les requêtes transmises aux sites d’actualités francophones situés hors de France ont connu un pic plus tôt dans la journée que celles transmises aux sites situés en France. Les sites d’actualités situés en France ont connu des pics après 20 heures, heure locale, lors des deux jours des élections, mais les sites d’information belges et suisses ont connu des hausses de trafic importantes à 19 heures le 10 avril (1857 % de plus que le dimanche précédent !). Pour le second tour des élections le 24 avril, le pic le plus important du mois a été enregistré à 18 heures (3100 % de requêtes en plus par rapport au dimanche précédent), mais il était également plus élevé que les jours précédents une heure plus tard, à 19 heures (3080 % de plus).

Aucun pic n’est lié au débat français (20 avril), ce qui semble indiquer que les sites d’actualités belges et suisses ont connu une forte augmentation de la fréquentation due au nombre de citoyens français désireux de consulter les sondages avant 20 heures.

Les résultats des élections modifient les modèles en ligne

Nous avons constaté, il y a deux semaines, que les sites web officiels des élections ont connu un pic de requêtes clairement visible le 10 avril, date du premier tour des élections. Nous examinons ici les tendances des requêtes DNS pour évaluer le trafic circulant vers les propriétés Internet.

Les sites officiels français dédiés aux élections ont connu une augmentation du trafic tout au long de la semaine précédant le premier tour, après le lundi 4 avril, mais c’est sans surprise que les deux pics majeurs ont été observés le jour des élections. Quel volume ? Voici la répartition en fonction des plus grands pics de trafic :

Deux jours de vote, un débat et une réglementation concernant les élections en France impactent l'Internet

N°1. 10 avril (premier tour de l’élection), minuit, heure locale. 925 % de requêtes en plus par rapport au dimanche précédent (à la même heure).

N°2. 24 avril (deuxième tour de l’élection), 20 heures. 707 % de requêtes en plus.

N°3. 10 avril (premier tour de l’élection), 20 heures. 370 % de requêtes en plus.

N°3. 11 avril 10 heures. 115 % de requêtes en plus par rapport au lundi précédent.

(Ces deux derniers pics sont égaux)

La fréquentation des sites d’actualités augmente après la fermeture des bureaux de vote

En ce qui concerne les principaux sites d’actualités français, comme nous l’avons vu il y a deux semaines, c’est à 20 heures, heure locale, après la fermeture de tous les bureaux de vote et la révélation des premiers grands sondages que les plus importants pics mensuels continuent d’être observés.

Le plus important pic du mois sur notre graphique DNS agrégé, qui présente les tendances de 12 sites d’actualités, a sans conteste été observé le 10 avril, jour du premier tour des élections, vers 20 heures, heure locale, lorsque ces domaines ont enregistré un trafic 116 % supérieur au dimanche précédent à la même heure. Le deuxième pic le plus important a été enregistré le jour du second tour des élections, le 24 avril, à la même heure (20 heures, heure locale), avec une augmentation de 142 % du trafic par rapport au dimanche précédent à la même heure.

Deux jours de vote, un débat et une réglementation concernant les élections en France impactent l'Internet

Très proche de ces deux pics se trouve le lundi matin du 11 avril, après le premier tour des élections. À 10 heures, heure locale, le nombre de requêtes était supérieur de 45 % à celui enregistré le lundi précédent. Le débat Macron-Le Pen, le mercredi 20 avril, a également provoqué un pic. À 21 heures, heure de début du débat, le nombre de requêtes était 56 % plus élevé que le mercredi précédent.

On observe la même tendance sur les sites des grandes chaînes de télévision françaises, avec un pic clair et isolé à 20 h, heure locale, le 10 avril (jour du premier tour des élections) et une augmentation de 472 % du trafic par rapport au dimanche précédent, lors de l’annonce des principales estimations. Un pic semblable est constaté à la même heure (20 heures), le 24 avril, avec une augmentation de 375 % des demandes par rapport au dimanche précédent.

Deux jours de vote, un débat et une réglementation concernant les élections en France impactent l'Internet

Ce pic n’est égalé, une fois encore, que par le débat du 20 avril. À 21 heures, le trafic était 308 % plus élevé que le mercredi précédent, ce qui signifie que le public était clairement attentif au débat et consultait les sites des médias et des chaînes de télévision. Certains sites français, comme france.tv, diffusaient en streaming.

Conclusion

Lorsque les personnes sont vraiment impatientes de consulter une information aussi importante que les résultats d’une élection, ils cherchent les sites sur lesquels sont diffusées les premiers estimations (dans ce cas, avant 20 heures, heure locale, ils sont situés hors de France).

Par ailleurs, lors de deux échéances électorales différentes en France, à deux semaines d’intervalle, on observe de nettes similitudes dans les tendances Internet qui montrent de quelle façon les personnes utilisent l’Internet en période électorale. Cela devient plus clair lorsque les résultats commencent à arriver, mais un débat aussi important pour une élection présidentielle que le débat Le Pen-Macron a également un impact non seulement sur le trafic Internet, mais également sur l’attention portée aux sites d’information et de télévision.

Vous pouvez garder un œil sur ces tendances grâce à Cloudflare Radar.

Extend your pre-commit hooks with AWS CloudFormation Guard

Post Syndicated from Joaquin Manuel Rinaudo original https://aws.amazon.com/blogs/security/extend-your-pre-commit-hooks-with-aws-cloudformation-guard/

Git hooks are scripts that extend Git functionality when certain events and actions occur during code development. Developer teams often use Git hooks to perform quality checks before they commit their code changes. For example, see the blog post Use Git pre-commit hooks to avoid AWS CloudFormation errors for a description of how the AWS Integration and Automation team uses various pre-commit hooks to help reduce effort and errors when they build AWS Quick Starts.

This blog post shows you how to extend your Git hooks to validate your AWS CloudFormation templates against policy-as-code rules by using AWS CloudFormation Guard. This can help you verify that your code follows organizational best practices for security, compliance, and more by preventing you from commit changes that fail validation rules.

We will also provide patterns you can use to centrally maintain a list of rules that security teams can use to roll out new security best practices across an organization. You will learn how to configure a pre-commit framework by using an example repository while you store Guard rules in both a central Amazon Simple Storage Service (Amazon S3) bucket or in versioned code repositories (such as AWS CodeCommit, GitHub, Bitbucket, or GitLab).

Prerequisites

To complete the steps in this blog post, first perform the following installations.

  1. Install AWS Command Line Interface (AWS CLI).
  2. Install the Git CLI.
  3. Install the pre-commit framework by running the following command.
    pip install pre-commit
  4. Install the Rust programming language by following these instructions.
  5. (Windows only) Install the version of Microsoft Visual C++ Build Tools 2019 that provides just the Visual C++ build tools. 

Solution walkthrough

In this section, we walk you through an exercise to extend a Java service on an Amazon EKS example repository with Git hooks by using AWS CloudFormation Guard. You can choose to upload your Guard rules in either a separate GitHub repository or your own S3 bucket.

First, download the sample repository that you will add the pre-commit framework to.

To clone the test repository

  • Clone the repo to a local directory by running the following command in your local terminal.

    git clone https://github.com/aws-samples/amazon-eks-example-for-stateful-java-service.git

Next, create Guard rules that reflect the organization’s policy-as-code best practices and store them in an S3 bucket.

To set up an S3 bucket with your Guard rules

  1. Create an S3 bucket by running the following command in the AWS CLI.

    aws s3 mb s3://<account-id>-cfn-guard-rules --region <aws-region>

    where <account-id> is the ID of the AWS account you’re using and <aws-region> is the AWS Region you want to use.

  2. (Optional) Alternatively, you can follow the Getting started with Amazon S3 tutorial to create the bucket and upload the object (as described in step 4 that follows) by using the AWS Management Console.

    When you store your Guard rules in an S3 bucket, you can make the rules accessible to other member accounts in your organization by using the aws:PrincipalOrgID condition and setting the value to your organization ID in the bucket policy.

  3. Create a file that contains a Guard rule named rules.guard, with the following content.
    let eks_cluster = Resources.* [ Type == 'AWS::EKS::Cluster' ]
    rule eks_public_disallowed when %eks_cluster !empty {
          %eks_cluster.Properties.ResourcesVpcConfig.EndpointPublicAccess == false
    }

    This rule will verify that public endpoints are disabled by checking that resources that are created by using the AWS::EKS::Cluster resource type have the EndpointPublicAccess property set to false. For more information about authoring your own rules using Guard domain-specific language (DSL), see Introducing AWS CloudFormation Guard 2.0.

  4. Upload the rule set to your S3 bucket by running the following command in the AWS CLI.

    aws s3 cp rules.guard s3://<account-id>-cfn-guard-rules/rules/rules.guard

In the next step, you will set up the pre-commit framework in the repository to run CloudFormation Guard against code changes.

To configure your pre-commit hook to use Guard

  1. Run the following command to create a new branch where you will test your changes.
    git checkout -b feature/guard-hook
  2. Navigate to the root directory of the project that you cloned earlier and create a .pre-commit-config.yaml file with the following configuration.
    repos:
      - repo: local
        hooks:
          -   id: cfn-guard-rules
              name: Rules for AWS
              description: Download Organization rules
              entry: aws s3 cp --recursive s3://<account-id>-cfn-guard-rules/rules  guard-rules/org-rules/
              language: system
              pass_filenames: false
          -   id: cfn-guard
              name: AWS CloudFormation Guard
              description: Validate code against your Guard rules
              entry: bash -c 'for template in "$@"; do cfn-guard validate -r guard-rules -d "$template" || SCAN_RESULT="FAILED"; done; if [[ "$SCAN_RESULT" = "FAILED" ]]; then exit 1; fi'
              language: rust
              files: \.(json|yaml|yml|template\.json|template)$
              additional_dependencies:
                - cli:cfn-guard

    You will need to replace the <account-id> placeholder value with the AWS account ID you entered in the To set up an S3 bucket with your Guard rules procedure.

    This hook configuration uses local pre-commit hooks to download the latest version of Guard rules from the bucket you created previously. This allows you to set up a centralized set of Guard rules across your organization.

    Alternatively, you can create and use a code repository such as GitHub, AWS CodeCommit, or Bitbucket to keep your rules in version control. To do so, replace the command in the Download Organization rules step of the .pre-commit-config.yaml file with:

    bash -c ‘if [ -d guard-rules/org-rules ]; then cd guard-rules/org-rules && git pull; else git clone <guard-rules-repository-target> guard-rules/org-rules; fi’

    Where <guard-rules-repository-target> is the HTTPS or SSH URL of your repository. This command will clone or pull the latest rules from your Git repo by using your Git credentials.

    The hook will also install Guard as an additional dependency by using a Rust hook. Using Guard, it will run the code changes in the repository directory against the downloaded rule set. When misconfigurations are detected, the hook stops the commit.

    You can further extend your organization rules with your own Guard rules by adding them to the cfn-guard-rules folder. You should commit these rules in your repository and add cfn-guard-rules/org-rules/* to your .gitignore file.

  3. Run a pre-commit install command to install the hooks you just created.

Finally, test that the pre-commit’s Guard hook fails commits of code changes that do not follow organizational best practices.

To test pre-commit hooks

  1. Add EndpointPublicAccess: true in cloudformation/eks.template.yaml, as shown following. This describes the test-only intent (meaning that you want to detect and flag errors in your rule) of adding public access to the Amazon Elastic Kubernetes Service (Amazon EKS) cluster.
      EKSCluster:
        Type: AWS::EKS::Cluster
        Properties:
          Name: java-app-demo-cluster
          ResourcesVpcConfig:
            EndpointPublicAccess: true
            SecurityGroupIds:
              - !Ref EKSControlPlaneSecurityGroup

  2. Add your changes with the git add command.

    git add .pre-commit-config.yaml

    git add cloudformation/eks.template.yaml

  3. Commit changes with the following command.

    git commit -m “bad config”

    You should see the following error that disallows the commit to the local repository and shows which one of your Guard rules failed.

    amazon-eks-controlplane.template.yaml Status = FAIL
    		
    FAILED rules
    		
    rules.guard/eks_public_disallowed    FAIL
    		
    ---
    		
    Evaluation of rules rules.guard against data amazon-eks-controlplane.template.yaml
    		
    ---
    		
    Property
    [/Resources/EKS/Properties/ResourcesVpcConfig/EndpointPublicAccess] in data
    [eks.template.yaml] is not compliant with [rules.guard/eks_public_disallowed] 
    because provided value [true] did not match expected value [false]. 
    Error Message []

  4. (Optional) You can also test hooks before committing by using the pre-commit run command to see similar output.

Cleanup

To avoid incurring ongoing charges, follow these cleanup steps to delete the resources and files you created as you followed along with this blog post.

To clean up resources and files

  1. Remove your local repository.
    rm -rf /path/to/repository
  2. Delete the S3 bucket you created by running the following command.
    aws s3 rb s3://<account-id>-cfn-guard-rules --force
  3. (Optional) Remove the pre-commit hooks framework by running this command.
    pip uninstall pre-commit

Conclusion

In this post, you learned how to use AWS CloudFormation Guard with the pre-commit framework locally to validate your infrastructure-as-code solutions before you push remote changes to your repositories.

You also learned how to extend the solution to use a centralized list of security rules that is stored in versioned code repositories (GitHub, Bitbucket, or GitLab) or an S3 bucket. And you learned how to further extend the solution with your own rules. You can find examples of rules to use in Guard’s Github repository or refer to write preventative compliance rules for AWS CloudFormation templates the cfn-guard way. You can then further configure other repositories to prevent misconfigurations by using the same Guard rules.

 
If you have feedback about this post, submit comments in the Comments section below. If you have questions about this post, start a new thread on the KMS re:Post or contact AWS Support.

Want more AWS Security news? Follow us on Twitter.

Author

Joaquin Manuel Rinaudo

Joaquin is a Senior Security Architect with AWS Professional Services. He is passionate about building solutions that help developers improve their software quality. Prior to AWS, he worked across multiple domains in the security industry, from mobile security to cloud and compliance related topics. In his free time, Joaquin enjoys spending time with family and reading science-fiction novels.

Build a modern data architecture and data mesh pattern at scale using AWS Lake Formation tag-based access control

Post Syndicated from Nivas Shankar original https://aws.amazon.com/blogs/big-data/build-a-modern-data-architecture-and-data-mesh-pattern-at-scale-using-aws-lake-formation-tag-based-access-control/

Customers are exploring building a data mesh on their AWS platform using AWS Lake Formation and sharing their data lakes across the organization. A data mesh architecture empowers business units (organized into domains) to have high ownership and autonomy for the technologies they use, while providing technology that enforces data security policies both within and between domains through data sharing. Data consumers request access to these data products, which are approved by producer owners within a framework that provides decentralized governance, but centralized monitoring and auditing of the data sharing process. As the number of tables and users increase, data stewards and administrators are looking for ways to manage permissions on data lakes easily at scale. Customers are struggling with “role explosion” and need to manage hundreds or even thousands of user permissions to control data access. For example, for an account with 1,000 resources and 100 principals, the data steward would have to create and manage up to 100,000 policy statements. As new principals and resources get added or deleted, these policies have to be updated to keep the permissions current.

Lake Formation tag-based access control (TBAC) solves this problem by allowing data stewards to create LF-tags (based on their business needs) that are attached to resources. You can create policies on a smaller number of logical tags instead of specifying policies on named resources. LF-tags enable you to categorize and explore data based on taxonomies, which reduces policy complexity and scales permissions management. You can create and manage policies with tens of logical tags instead of the thousands of resources. Lake Formation TBAC decouples policy creation from resource creation, which helps data stewards manage permissions on many databases, tables, and columns by removing the need to update policies every time a new resource is added to the data lake. Finally, TBAC allows you to create policies even before the resources come into existence. All you have to do is tag the resource with the right LF-tag to make sure existing policies manage it.

This post focuses on managing permissions on data lakes at scale using LF-tags in Lake Formation for cross accounts. For managing data lake catalog tables from AWS Glue and administering permission to Lake Formation, data stewards within the producing accounts have functional ownership based on the functions they support, and can grant access to various consumers, external organizations, and accounts. You can now define LF-tags; associate at the database, table, or column level; and then share controlled access across analytic, machine learning (ML), and extract, transform, and load (ETL) services for consumption. LF-tags make sure that governance can be scaled easily by replacing the policy definitions of thousands of resources with a few logical tags.

Solution overview

LF-tag access has three key components:

  • Tag ontology and classification – Data stewards can define an LF-tag ontology based on their business needs and grant access based on LF-tags to AWS Identity and Access Management (IAM) principals and SAML principals or groups
  • Tagging resources – Data engineers can easily create, automate, implement, and track all LF-tags and permissions against AWS Glue catalogs through the Lake Formation API
  • Policy evaluation – Lake Formation evaluates the effective permissions based on LF-tags at query time and allows access to data through consuming services such as Amazon Athena, AWS Glue, Amazon Redshift Spectrum, Amazon SageMaker Data Wrangler, and Amazon EMR Studio, based on the effective permissions granted across multiple accounts or organization-level data shares

The following diagram illustrates the relationship between the data producer, data consumer, and central governance accounts.

In the above diagram, the central governance account box shows the tagging ontology that will be used with the associated tag colors. These will be shared with both the producers and consumers, to be used to tag resources.

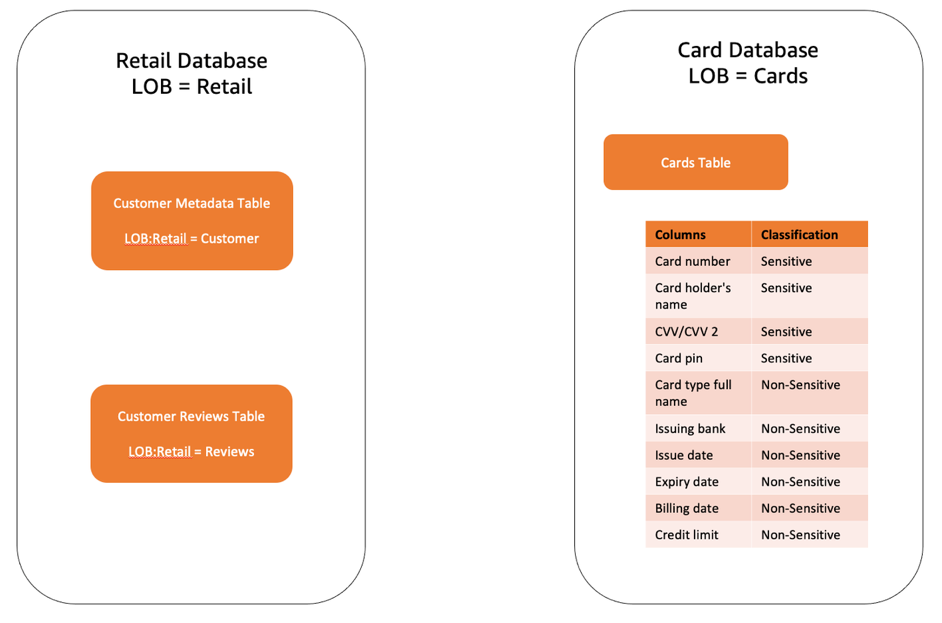
In this post, we considered two databases, as shown in the following figure, and show how you can set up a Lake Formation table and create Lake Formation tag-based policies.

The solution includes the following high-level steps:

  1. The data mesh owner defines the central tag ontology with LF-tags:
    1. LOB – Classified at the line of business (LOB) level (database)
    2. LOB:Function – Classified at the business function level (table)
    3. Classification – Classification of the functional data level (columns)
  2. The data mesh owner assigns respective permission levels to the product data steward to use centrally defined tags and associates permission to their database and tables with different LF-tags.
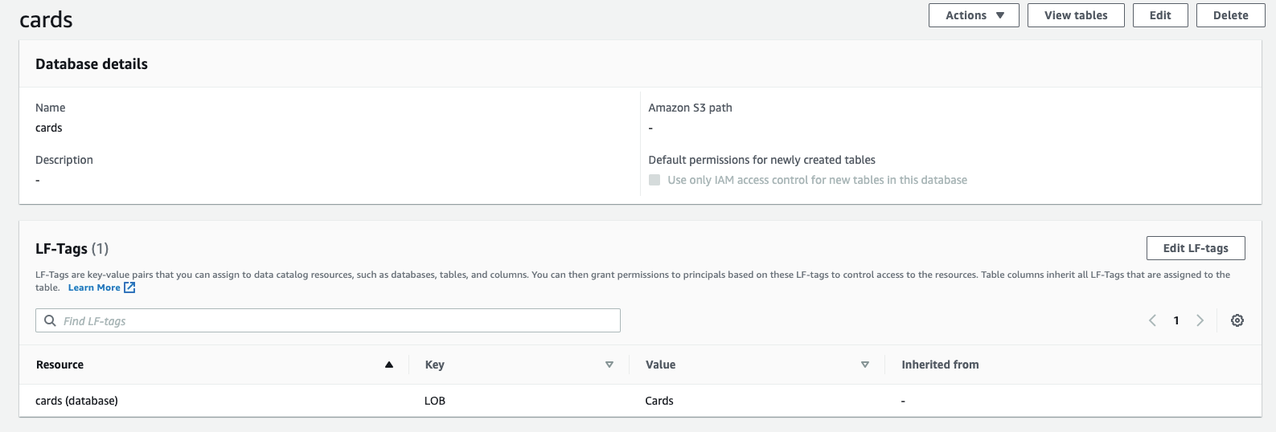
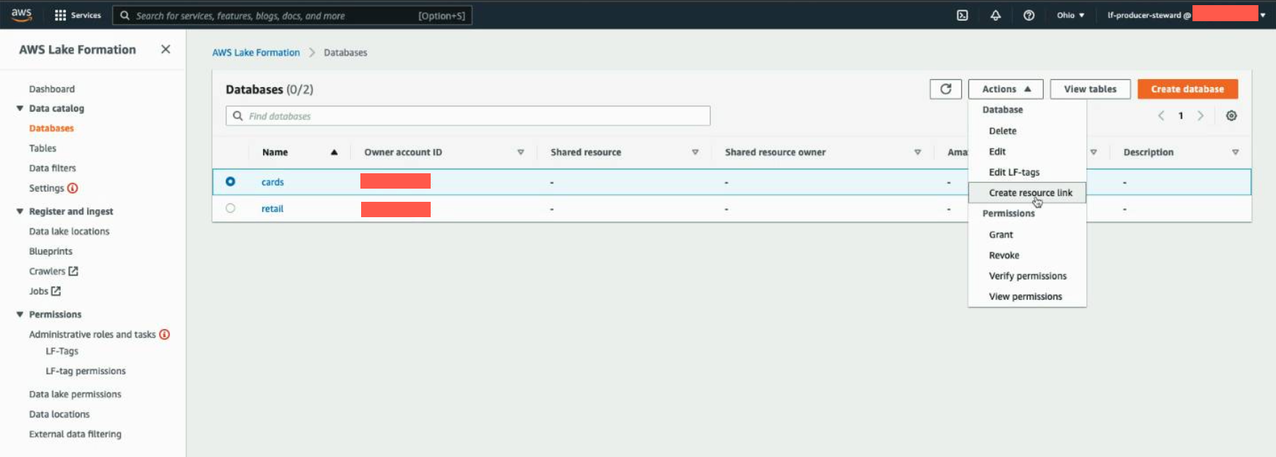
  3. The producer steward in the central account owns two databases: lob = card and lob = retail.
  4. The producer steward switches to the data producer account to add table metadata using an AWS Glue crawler.
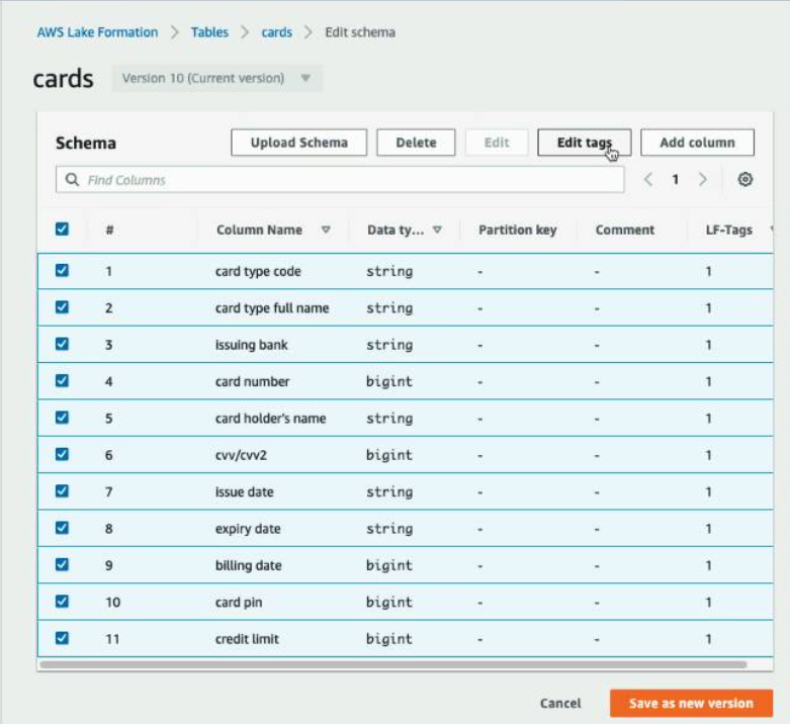
  5. The producer steward associates column-level classifications Classification = Sensitive or Classification = Non-Sensitive to tables under the Card database in the central account.
  6. The producer steward associates table-level tags lob:retail = Customer and lob:retail = Reviews to tables under the Retail database in the central account.
  7. The consumer admin grants fine-grained access control to different data analysts.

With this configuration, the consumer analyst can focus on performing analysis with the right data.

Set up resources with AWS CloudFormation

We provide three AWS CloudFormation templates in this post: for the producer account, central account, and consumer account. Deploy the CloudFormation templates in the order of producer, central, and consumer, because there are dependencies between the templates.

The CloudFormation template for the central account generates the following resources:

  • Two IAM users:
    • DataMeshOwner
    • ProducerSteward
  • Grant DataMeshOwner as the LakeFormation Admin
  • One IAM role:
    • LFRegisterLocationServiceRole
  • Two IAM policies:
    • ProducerStewardPolicy
    • S3DataLakePolicy
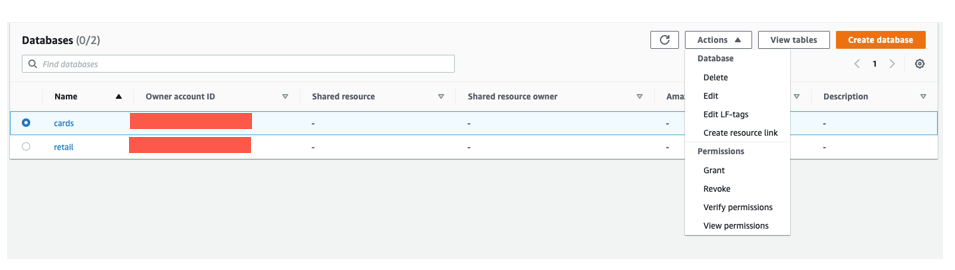
  • Create databases “retail” and “cards” for ProducerSteward to manage Data Catalog
  • Share the data location permission for producer account to manage Data Catalog

The CloudFormation template for the producer account generates the following resources:

  • Two Amazon Simple Storage Service (Amazon S3) buckets:
    • RetailBucket, which holds two tables:
      • Customer_Info
      • Customer_Review
    • CardsBucket, which holds one table:
      • Credit_Card
  • Allow Amazon S3 bucket access for the central account Lake Formation service role.
  • Two AWS Glue crawlers
  • One AWS Glue crawler service role
  • Grant permissions on the S3 bucket locations tbac-cards-<ProducerAccountID>-<aws-region> and tbac-retail-<ProducerAccountID>-<aws-region> to the AWS Glue crawler role
  • One producer steward IAM user

The CloudFormation template for the consumer account generates the following resources:

  • One S3 bucket:
    • <AWS Account ID>-<aws-region>-athena-logs
  • One Athena workgroup:
    • consumer-workgroup
  • Three IAM users:
    • ConsumerAdmin
    • ConsumerAnalyst1
    • ConsumerAnalyst2

Launch the CloudFormation stack in the central account

To create resources in the central account, complete the following steps:

  1. Sign in to the central account’s AWS CloudFormation console in the target Region.
  2. Choose Launch Stack:   
    Launch Stack
  3. Choose Next.
  4. For Stack name, enter stack-central.
  5. For DataMeshOwnerUserPassword, enter the password you want for the data lake admin IAM user in the central account.
  6. For ProducerStewardUserPassword, enter the password you want for the producer steward IAM user in the producer account.
  7. For ProducerAWSAccount, enter the AWS <ProducerAccountID>.
  8. Choose Next.
  9. On the next page, choose Next.
  10. Review the details on the final page and select I acknowledge that AWS CloudFormation might create IAM resources.
  11. Choose Create stack.
  12. Collect the value for LFRegisterLocationServiceRole on the stack’s Outputs tab.

Launch the CloudFormation stack in the producer account

To set up resources in the producer account, complete the following steps:

  1. Sign in to the producer account’s AWS CloudFormation console in the target Region.
  2. Choose Launch Stack:
  3. Choose Next.
  4. For Stack name, enter stack-producer.
  5. For CentralAccountID, copy and paste the value of the <CentralAccountID> .
  6. For CentralAccountLFServiceRole, copy and paste the value of the LFRegisterLocationServiceRole collected from the stack-central.
  7. For LFDatabaseName, keep the default value of the tbac database name.
  8. For ProducerStewardUserPassword, enter the password you want for the data lake admin IAM user on the producer account.
  9. Choose Next.
  10. On the next page, choose Next.
  11. Review the details on the final page and select I acknowledge that AWS CloudFormation might create IAM resources.
  12. Choose Create stack.

Launch the CloudFormation stack in the consumer account

To create resources in the consumer account, complete the following steps:

  1. Sign in to the consumer account’s AWS CloudFormation console in the target Region.
  2. Choose Launch Stack:
  3. Choose Next.
  4. For Stack name, enter stack-consumer.
  5. For ConsumerAdminUserName and ConsumerAdminUserPassword, enter the user name and password you want for the data lake admin IAM user.
  6. For ConsumerAnalyst1UserName and ConsumerAnalyst1UserPassword, enter the user name and password you want for the consumeranalyst1 IAM user.
  7. For ConsumerAnalyst2UserName and ConsumerAnalyst2UserPassword, enter the user name and password you want for the consumeranalyst2 IAM user.
  8. Choose Next.
  9. On the next page, choose Next.
  10. Review the details on the final page and select I acknowledge that AWS CloudFormation might create IAM resources.
  11. Choose Create stack.

Configure Lake Formation cross-account sharing

After you create your resources with AWS CloudFormation, you perform the following steps in the producer and central account to set up Lake Formation cross-account sharing.

Central governance account

In the central account, complete the following steps:

  1. Sign in to the Lake Formation console as admin.
  2. In the navigation pane, choose Permissions, then choose Administrative roles and tasks.

The CloudFormation template added the data mesh owner as the data lake administrator.

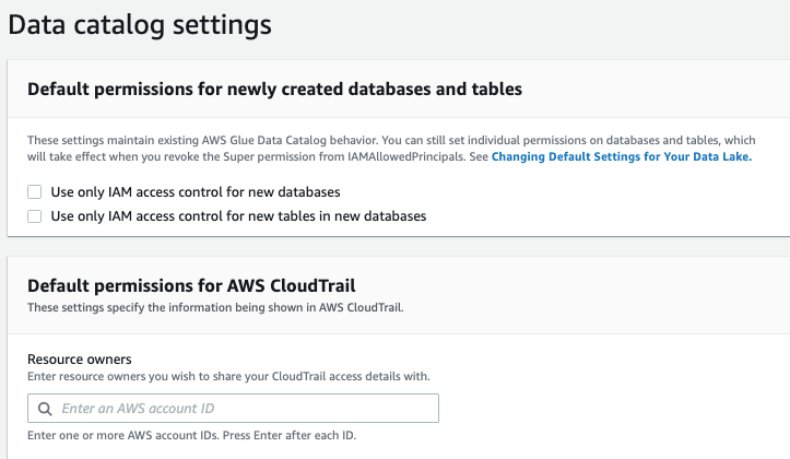
Next, we update the Data Catalog settings to use Lake Formation permissions to control catalog resources instead of IAM-based access control.

  1. In the navigation pane, under Data catalog¸ choose Settings.
  2. Uncheck Use only IAM access control for new databases.
  3. Uncheck Use only IAM access control for new tables in new databases.
  4. Choose Save.

Next, we need to set up the AWS Glue Data Catalog resource policy to grant cross-account access to Data Catalog resources.

  1. Use the following policy, and replace the account number and Region with your own values:
  2. As described in Lake Formation Tag-Based Access Control Cross-Account Prerequisites, before you can use the tag-based access control method to grant cross-account access to resources, you must add the following JSON permissions object to the AWS Glue Data Catalog resource policy in the producer account. This gives the consumer account permission to access the Data Catalog when glue:EvaluatedByLakeFormationTagsis true. Also, this condition becomes true for resources on which you granted permission using Lake Formation permission Tags to the consumer’s account. This policy is required for every AWS account that you’re granting permissions to. We discuss the full IAM policy later in this post.
    {
       "PolicyInJson": "{\"Version\" : \"2012-10-17\",\"Statement\" : [ {\"Effect\" : \"Allow\",\"Principal\" : {\"AWS\" : [\"arn:aws:iam::<ProducerAccountID>:root\",\"arn:aws:iam::<ConsumerAccountID>:root\"]},\"Action\" : \"glue:*\",\"Resource\" : [ \"arn:aws:glue:<aws-region>:<CentralAccountID>:table/*\", \"arn:aws:glue:<aws-region>:<CentralAccountID>:database/*\", \"arn:aws:glue:<aws-region>:<CentralAccountID>:catalog\" ],\"Condition\" : {\"Bool\" : {\"glue:EvaluatedByLakeFormationTags\" : \"true\"}}}, {\"Effect\" : \"Allow\",\"Principal\" : {\"Service\" : \"ram.amazonaws.com\"},\"Action\" : \"glue:ShareResource\",\"Resource\" : [ \"arn:aws:glue:<aws-region>:<CentralAccountID>:table/*\", \"arn:aws:glue:<aws-region>:<CentralAccountID>:database/*\", \"arn:aws:glue:<aws-region>:<CentralAccountID>:catalog\" ]} ]}",
       "EnableHybrid": "TRUE"
    }

Replace the <aws-region>, <ProducerAccountID>, <ConsumerAccountID> and <CentralAccountID> values in the above policy as appropriate and save it in a file called policy.json.

  1. Next, run the following AWS Command Line Interface (AWS CLI) command on AWS CloudShell.
aws glue put-resource-policy --region <aws-region> --cli-input-json file://policy.json

For more information about this policy, see put-resource-policy.

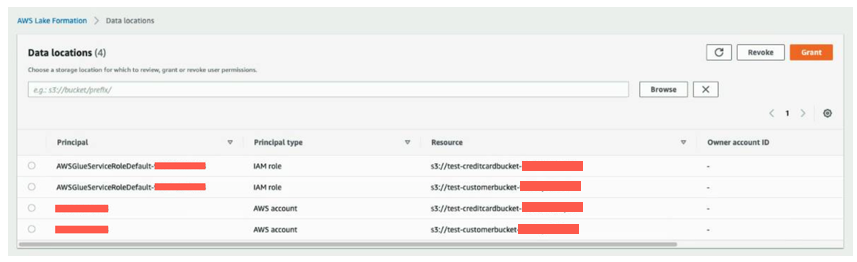
  1. Next, we verify the two source data S3 buckets are registered as data lake locations in the central account. This is completed by the CloudFormation template.
  2. Under Register and ingest in the navigation pane, choose Data lake locations.

You should see the two S3 buckets registered under the data lake locations.

Configure Lake Formation Data Catalog settings in the central account

After we complete all the prerequisites, we start the data mesh configuration. We log in as DataMeshOwner in the central account.

Define LF-tags

DataMeshOwner creates the tag ontology by defining LF-tags. Complete the following steps:

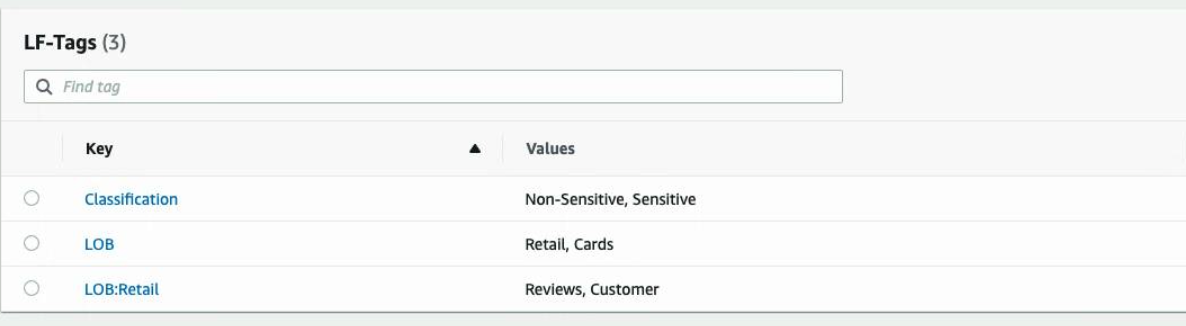
  1. On the Lake Formation console, under Permissions in the navigation pane, under Administrative roles and tasks, choose LF-Tags.
  2. Choose Add LF-tags.
  3. For Key, enter LOB and for Values, choose Retail and Cards.
  4. Choose Add LF-tag.
  5. Repeat these steps to add the key LOB:Retail and values Customer and Reviews, and the key Classification with values Sensitive and Non-Sensitive.

Now we complete the configuration of the tag ontology.

Grant permissions

We grant ProducerSteward in the central accounts describe and associate permissions on the preceding tag ontology. This enables ProducerSteward to view the LF-tags and assign them to Data Catalog resources (databases, tables, and columns). ProducerSteward in the central account can further grant the permission to ProducerSteward in the producer account. For more information, see Granting, Revoking, and Listing LF-Tag Permissions. When you have multiple producers, grant the relevant tags to each steward.

  1. Under Permissions in the navigation pane, under Administrative roles and tasks, choose LF-tag permissions.
  2. Choose Grant.
  3. For IAM users and roles, choose the ProducerSteward user.
  4. In the LF-Tags section, add all three key-values:
    1. Key LOB with values Retail and Cards.
    2. Key LOB:Retail with values Customer and Reviews.
    3. Key Classification with values Sensitive and Non-Sensitive.
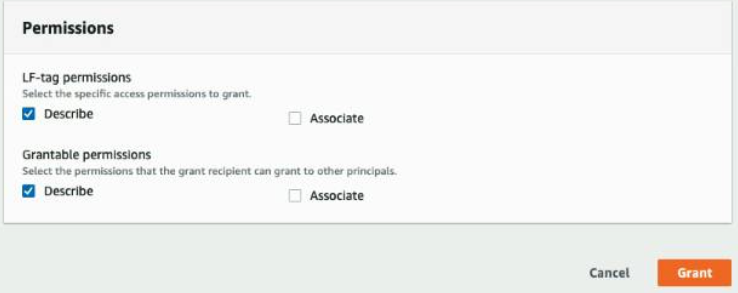
  5. For Permissions, select Describe and Associate for both LF-tag permissions and Grantable permissions.
  6. Choose Grant.

Next, we grant ProducerSteward tag-based data lake permissions. This enables ProducerSteward to create, alter, and drop tables in the databases with corresponding tags. ProducerSteward in the producer account can further grant the permission across accounts.

  1. In the navigation pane, under Permissions, Data lake permissions, choose Grant.
  2. For Principals, choose IAM users and roles, and choose ProducerSteward.
  3. For LF-tags or catalog resources, select Resources matched by LF-Tags (recommended).
  4. Choose Add LF-Tag.
  5. For Key, choose LOB and for Values, choose Cards.
  6. For Database permissions, select the Super permission because ProducerSteward owns the producer databases.

This permission allows a principal to perform every supported Lake Formation operation on the database. Use this admin permission when a principal is trusted with all operations.

  1. Select Super under Grantable permissions so the ProducerSteward user can grant database-level permissions to the producer and consumer accounts.
  2. For Table permissions, select Super.
  3. Select Super permission under Grantable permissions.
  4. Choose Grant.
  5. Repeat these steps for key LOB and value Retail.
  6. In the navigation pane, under Permissions, Data lake permissions, choose Grant.
  7. For Principals, choose IAM users and roles, and choose ProducerSteward.
  8. For LF-tags or catalog resources, select Resources matched by LF-Tags (recommended).
  9. Add the key LOB with value Cards, and the key Classification with values Sensitive and Non-Sensitive.
  10. For Database permissions, select Super.
  11. Select Super permission under Grantable permissions.
  12. For Table permissions, select Super.
  13. Select Super under Grantable permissions.
  14. Choose Grant.

This gives ProducerSteward fine-grained permission expression on columns with either Sensitive or Non-sensitive tags.

  1. Repeat these steps for key LOB and value Retails, and key LOB:Retails and value Reviews or Customer.

This gives ProducerSteward fine-grained permission expression on tables with either Reviews or Customers tags.

Producer data steward actions in the central account

Next, we log in as the ProducerSteward user in the central account and create skeleton databases.

  1. Sign in to the Lake Formation console as ProducerSteward.
  2. In the navigation pane, under Data catalog, select Databases.
  3. Choose the cards database.
  4. On the Actions menu, choose Edit LF-tags.
  5. Choose Assign new LF-tag.
  6. For Assigned Keys, enter LOB and for Values, choose Cards.
  7. Choose Save.

This assigns the LOB=Cards tag to the Cards database.

  1. Repeat these steps for Retail database and assign the LOB=Retail tag to the Retail database.

Next, we share the LF-tags and data lake permissions with the producer account so that ProducerSteward in the producer account can run AWS Glue crawlers and generate tables in the preceding skeleton databases.

  1. Under Permissions in the navigation pane, under Administrative roles and tasks, choose LF-tag permissions.
  2. Choose Grant.
  3. For Principals, select External accounts.
  4. For AWS account or AWS organization, enter the account ID for the producer account.
  5. In the LF-Tags section, we only need to add database-level tags.
  6. For Key, enter LOB and for Values, choose Retail and Cards.
  7. For Permissions, choose Describe and Associate for both LF-tag permissions and Grantable permissions.
  8. Choose Grant.
  9. In the navigation pane, under Permissions, Data lake permissions, choose Grant.
  10. For Principals, select External accounts.
  11. For AWS account or AWS organization, enter the account ID for the producer account.
  12. For LF-tags or catalog resources, select Resources matched by LF-Tags (recommended).
  13. Choose Add LF-Tag.
  14. Choose the key LOB and value Cards.
  15. For Database permissions, select Create table and Describe because the ProducerSteward user in the producer account will add tables in the database.
  16. Select Create table and Describe under Grantable permissions so the ProducerSteward user can further grant the permission to the AWS Glue crawler.
  17. For Table permissions, select all the permissions.
  18. Select all the permissions under Grantable permissions.
  19. Choose Grant.
  20. Repeat these steps for LOB=Retail.

Now the Lake Formation administrators on the producer account side has the right permissions to add tables.

Crawl source tables in the producer account

Next, we log in as the ProducerSteward user in the producer account to crawl the source tables for the Cards and Retail databases.

  1. Sign in to the Lake Formation console as ProducerSteward.
  2. In the navigation pane, under Administrative Roles and Tasks, verify that ProducerSteward is configured as the data lake administrator.
  3. In the navigation pane, under Permissions, then choose Administrative roles and tasks, choose LF-Tags.

You can verify the root-level LOB tags that were shared with the producer account.

  1. In the navigation pane, under Data catalog, select Databases.

You can verify the two databases cards and retail that were shared with the producer account from the previous step.

Now, we create resource links in the producer account for these two databases. These links point at the shared databases and are used by AWS Glue crawler to create the tables. First, we create a resource link for the cards database.

  1. Select the cards database and on the Actions menu, choose Create resource link.
  2. For Resource link name, enter rl_cards.
  3. Choose Create.
  4. Repeat these steps to create a resource link for the retail database.

After the resource link creation, you should see both the resource link databases as shown in the following screenshot.

Next, we need to grant permissions to the AWS Glue crawler role so that the crawler can crawl the source bucket and create the tables.

  1. Select the rl_cards database and on the Actions menu, choose Grant.
  2. In the Grant data permissions section, select IAM users and roles, and choose the AWS Glue crawler role that was created by the CloudFormation template (for example, stack-producer-AWSGlueServiceRoleDefault-xxxxxx).
  3. For Databases, choose rl_cards.
  4. For Resource link permissions, select Describe.
  5. Choose Grant.
  6. Repeat these steps for rl_retail.
  7. Next, in the navigation pane, choose Data lake Permissions and choose Grant.
  8. For IAM users and roles, choose the role stack-producer-AWSGlueServiceRoleDefault-XXXX.
  9. For LF-Tags or catalog resources, select Resources matched by LF-Tags.
  10. Enter the key LOB and values Retail and Cards.
  11. For Database permissions, select Create table and Describe.
  12. For Table permissions, choose Select, Describe, and Alter.
  13. Choose Grant.

Next, we will verify grant permissions on the S3 bucket locations corresponding to cards and retail producers to the AWS Glue crawler role. This is completed by the CloudFormation template.

In the navigation pane, under Permissions, on the Data Locations, you should see the locations.

Now we’re ready to run the crawlers. We configure the crawlers that the CloudFormation template created, to point to these resource link databases.

  1. On the AWS Glue console, under Data catalog in the navigation pane, choose Crawlers.

The two crawlers you created should be listed.

  1. Select the crawler for the cards database CardsCrawler-xxxxxxxxxxxx and on the Action menu, choose Edit crawler.
  2. For the input data store, choose the S3 bucket for the cards producer.
  3. For IAM role, choose the AWS Glue service role created by the CloudFormation template.
  4. For Schedule, choose Run on demand.
  5. For the output database, choose the resource link database rl_cards corresponding to the cards database.
  6. Verify all the information and choose Save.
  7. Repeat these steps for the crawler corresponding to the retail producer.
  8. Select both crawlers and choose Run crawler.

When the crawlers finish, they create tables corresponding to each producer in their respective resource link databases. The table schemas are present in the shared database in the central account.

Configure Lake Formation tags in the central account

Next, we perform fine-grained access control for the tables that the crawlers created to support different consumption use cases using Lake Formation tags.

Tag columns

First, we tag sensitive columns in the cards table corresponding to the cards database, first using the Classification tag that we created earlier.

  1. Log in to central account as IAM user ProducerSteward.
  2. On the Lake Formation console, in the navigation pane, choose Data catalog and then choose Tables.

You should see three tables: the cards table corresponding to cards database, and the reviews and customers tables corresponding to the retail database.

  1. Choose the cards table.
  2. Navigate to the Schema section and choose Edit schema.
  3. Select all the columns and choose Edit tags.
  4. Choose Assign new LF-Tag.
  5. For Assigned keys, enter Classification and for Values, choose Non-Sensitive.
  6. Choose Save.

Next, we selectively tag the sensitive columns.

  1. In the Edit schema section, select columns card number, card holder’s name, cvv/cvv2, and card pin.
  2. Choose Edit tags.
  3. For Assigned keys, enter Classification and for Values, choose Sensitive.
  4. Choose Save.
  5. Choose Save as new version to save the schema.

Tag tables

Next, we tag the reviews and customer tables under the retail database using the LOB:retail tag that we created earlier.

  1. On the Tables page, select the reviews table and on the Actions menu, choose Edit LF-tags.
  2. Choose Assign new LF-Tag.
  3. For Assigned keys, choose LOB:Retail and for Values, choose Reviews.
  4. Choose Save.
  5. Repeat the steps for the customer table. Choose LOB:Retail for the key and Customer for the value.

Grant tag permissions

Next, grant LF-tag permissions to the external consumer account.

  1. On the Lake Formation console, in the navigation pane, choose Permissions, then choose Administrative roles and tasks and choose LF-tag permissions.
  2. Choose Grant.
  3. For Principals, select External accounts.
  4. For AWS account or AWS organization, enter the AWS account number corresponding to the consumer account.
  5. For LF-Tags, choose Add LF-Tag.
  6. For Key, choose LOB and for Values, choose Retail and Cards.
  7. Repeat these steps for key Classification with values Non-Sensitive and Sensitive, and key LOB:Retail with values Reviews and Customer.
  8. For Permissions, choose Describe.
  9. For Grantable permissions, choose Describe.
  10. Choose Grant.

Next, we grant Lake Formation policy tag expression permissions to the external consumer account.

  1. In the navigation pane, choose Data lake permissions and choose Grant.
  2. In the Principals section, select External accounts.
  3. For AWS account or AWS organization, enter the AWS account number corresponding to the consumer account.
  4. For LF-Tags or catalog resources, select Resources matched by LF-Tags.
  5. Choose Add LF-Tag.
  6. For Key, choose LOB and for Values¸ choose Retail.
  7. For Database permissions, select Describe.
  8. For Grantable permissions, select Describe.
  9. Choose Grant.
  10. Repeat these steps to grant permissions on the policy tag expression LOB=Cards.

Next, we grant table permissions.

  1. In the navigation pane, choose Data lake permissions and choose Grant.
  2. For Principals, select External accounts.
  3. For AWS account or AWS organization, enter the AWS account number corresponding to the consumer account.
  4. For LF-Tags or catalog resources, select Resources matched by LF-Tags.
  5. Add key LOB with value Retail, and key LOB:Retail with values Reviews and Customer.
  6. For Table Permissions, select Select and Describe.
  7. For Grantable permissions, select Select and Describe.
  8. Choose Grant.
  9. Repeat these steps to grant permissions on the policy tag expressions LOB=Cards and Classification = (Non-Sensitive or Sensitive).

Share and consume tables in the consumer account

When you sign in to the Lake Formation console in the consumer account as ConsumerAdmin, you can see all the tags and the corresponding values that were shared by the producer.

In these next steps, we share and consume tables in the consumer account.

Create a resource link to the shared database

On the Databases page on the Lake Formation console, you can see all the databases that were shared to the consumer account. To create a resource link, complete the following steps:

  1. On the Databases page, select the cards database and on the Actions menu, choose Create resource link.
  2. Enter the resource link name as rl_cards.
  3. Leave the shared database and shared database’s owner ID as default.
  4. Choose Create.
  5. Follow the same process to create the rl_retail resource link.

Grant Describe permission to ConsumerAnalyst1

To grant Describe permissions on resource link databases to ConsumerAnalyst1, complete the following steps:

  1. On the Databases page, select the resource database rl_retail and on the Actions menu, choose Grant.
  2. In the Grant data permissions section, select IAM users and roles.
  3. Choose the role ConsumerAnalyst1.
  4. In the Resource link permissions section, select Describe.
  5. Choose Grant.
  6. Follow the same steps to grant rl_cards access to ConsumerAnalyst2.

Grant Tag permissions to ConsumerAnalyst1

To grant Tag permissions on the LOB:Retail Customer tag to ConsumerAnalyst1 to access the sales table, complete the following steps:

  1. On the Lake Formation console, on the Data permission page, choose Grant.
  2. In the Grant data permissions section, select IAM users and roles.
  3. Choose the role ConsumerAnalyst1.
  4. For LF-Tags or catalog resources, select Resources matched by LF-Tags.
  5. Add the key LOB with value Retail, and the key LOB:Retail with value Customer.
  6. For Table permissions, select Select and Describe.
  7. Choose Grant.

Access to the customers table inside the rl_retail database is granted to ConsumerAnalyst1.

Grant Tag permissions to ConsumerAnalyst2

To grant Tag permissions on the Classification:Sensitive tag to l to access attributes tagged as Sensitive in the cards table, complete the following steps:

  1. On the Lake Formation console, on the Data permission page, choose Grant.
  2. In the Grant data permissions section, select IAM users and roles.
  3. Choose the role ConsumerAnalyst2.
  4. For LF-Tags or catalog resources, select Resources matched by LF-Tags.
  5. Add the key LOB with value Cards, and the key Classification with value Sensitive.
  6. For Table permissions, select Select and Describe.
  7. Choose Grant.

Access to attributes tagged as sensitive in the cards table inside the rl_cards database is granted to ConsumerAnalyst2.

Validate the access to ConsumerAnalyst1

To confirm ConsumerAnalyst1 access, complete the following steps:

  1. On the Athena console, for Workgroup, choose consumer-workgroup.
  2. Choose Acknowledge.
  3. Choose the database rl_retail.

You should be able to see the customers table and be able to query.

Validate the access to ConsumerAnalyst2

To confirm ConsumerAnalyst2 access, complete the following steps:

  1. On the Athena console, for Workgroup, choose consumer-workgroup.
  2. Choose Acknowledge.
  3. Choose the database rl_cards.

You should be able to see only the sensitive attributes from the cards table.

As a thought experiment, you can also check to see the Lake Formation Tag-based access policy behavior on columns to which the user doesn’t have policy grants.

When an untagged column is selected from the table rl_cards.cards, Athena returns an error. For example, you can run the following query to choose the untagged column “issuing_bank” which is non-sensitive.

SELECT issuing_bank FROM "rl_cards"."cards" limit 10;

Conclusion

In this post, we explained how to create a Lake Formation tag-based access control policy in Lake Formation using an AWS public dataset. In addition, we explained how to query tables, databases, and columns that have Lake Formation tag-based access policies associated with them.

You can generalize these steps to share resources across accounts. You can also use these steps to grant permissions to SAML identities.

A data mesh approach provides a method by which organizations can share data across business units. Each domain is responsible for the ingestion, processing, and serving of their data. They are data owners and domain experts, and are responsible for data quality and accuracy. This is similar to how microservices turn a set of technical capabilities into a product that can be consumed by other microservices. Implementing a data mesh on AWS is made simple by using managed and serverless services such as AWS Glue, Lake Formation, Athena, and Redshift Spectrum to provide a well-understood, performant, scalable, and cost-effective solution to integrate, prepare, and serve data.


About the Authors

Nivas Shankar is a Principal Data Architect at Amazon Web Services. He helps and works closely with enterprise customers building data lakes and analytical applications on the AWS platform. He holds a master’s degree in physics and is highly passionate about theoretical physics concepts.

Dylan Qu is an AWS solutions architect responsible for providing architectural guidance across the full AWS stack with a focus on Data Analytics, AI/ML and DevOps.

Pavan Emani is a Data Lake Architect at AWS, specialized in big data and analytics solutions. He helps customers modernize their data platforms on the cloud. Outside of work, he likes reading about space and watching sports.

Prasanna Sridharan is a Senior Data & Analytics Architect with AWS. He is passionate about building the right big data solution for the AWS customers. He is specialized in the design and implementation of Analytics, Data Management and Big Data systems, mainly for Enterprise and FSI customers.


Modernize your healthcare clinical quality data repositories with Amazon Redshift Data Vault

Post Syndicated from Sarathi Balakrishnan original https://aws.amazon.com/blogs/big-data/modernize-your-healthcare-clinical-quality-data-repositories-with-amazon-redshift-data-vault/

With the shift to value-based care, tapping data to its fullest to improve patient satisfaction tops the priority of healthcare executives everywhere. To achieve this, reliance on key technology relevant to their sphere is a must. This is where data lakes can help. A data lake is an architecture that can assist providers in storing, sharing, and utilizing electronic health records and other patient data. Healthcare organizations are already utilizing data lakes to unite heterogeneous data from across hospital systems. The use of data lakes has aided in the effective transformation of the organizational culture, resulting in a data-driven approach to resolving issues. Healthcare clinical quality metric systems stream massive amounts of structured and semi-structured data into a data lake in real time from various sources. However, storing structured data in a data lake and applying schema-on-read leads to quality issues and adds complexity to the simple structured data process.

In this post, we demonstrate how to modernize your clinical quality data repositories with Amazon Redshift Data Vault.

How healthcare systems use data lakes

Data lakes are popular in healthcare systems because they allow the integration and exploratory analysis of diverse data. Data lakes comprise multiple data assets stored within a Hadoop ecosystem with minimal alterations to the original data format (or file). Because of this, the data lake lacks schema-on-write functionality. In data lakes, information is accessed using a methodology called schema-on-read. On the other hand, a data warehouse is a subject-oriented, time-variant, and centrally controlled database system designed for the management of mixed workloads and large queries. The schema of the data warehouse is predefined, the data written to it must conform to its schema (schema-on-write). It’s perfect for structured data storage.

Because the healthcare industry wants to preserve the data in raw format for compliance and regulatory requirements, data lakes are widely used in clinical quality tracking systems even though the incoming data are structured and semi-structured. For business and analytical use cases, the data in a data lake is further converted into a dimensional schema and loaded into a data warehouse. Data warehouses require several months of modeling, mapping, ETL (extract, transform, and load) planning and creation, and testing. The result is consistent, validated data for reporting and analytics.

The following diagram shows a typical clinical quality repository in a current healthcare system.

Data lakes offer information in its raw form, as well as a specialized means to obtaining data that applies the schema-on-read. In general, data lake users are experienced analysts familiar with data wrangling techniques that apply schema-on-read or understand data content from unstructured formats. Business users and data visualization builders struggle in the absence of powerful purpose-built search capabilities and data extraction algorithms. That isn’t to say data lakes are devoid of metadata or rules controlling their use, security, or administration. It’s the exact opposite. A successful data lake structures its data in such a way that it promotes better and more efficient access, and reuses data management methods or provides new tools that increase search and general knowledge of the data content.

Challenges in the data lake

However, data modeling shouldn’t be disregarded while employing the schema-on-read approach to handle data. A lack of meaningful data structure might lead to data quality problems, integration issues, performance issues, and deviations from organizational goals. Storing structured data in a data lake and then applying schema-on-read generates problems with data quality and complicates a basic structured data operation. You can also keep these structured datasets in data warehouses by skipping the data lake, but this increases the complexity of scaling, data transformation, and loading (ETL). But data warehouse ETL jobs apply a large number of business rules and heavily transform the data from its raw form to make the data fit one or more business purposes.

Dimensional representation data warehouses are located close to business applications but away from the source. This brings new challenges, like reverse tracking the data to its source to identify potential data errors and keep the original source for regulatory validation. In clinical quality reporting and regulatory reporting, accuracy is key. To provide high accuracy and data quality, developers often reverse track the data to its original source. This is very complex and sometimes not possible in a data warehouse model because the data loses its raw form. Compared to data warehouses, data lakes perform poorly in terms of dataset identification, processing, and catalog management. It’s complex to securely share data in a data lake between accounts. Cloud data lakes show improvement in this area, but some human intervention is still needed to make sure the data catalogs and security match healthcare requirements and standards.

Design and build a Data Vault model in Amazon Redshift

Amazon Redshift is a relational database system based on the PostgreSQL standard. It’s designed to efficiently run online analytical processing (OLAP) queries on petabyte-scale data. It also offers other query-handling efficiencies such as parallel processing, columnar database design, column data compression, a query optimizer, and compiled query code. A cluster is at the heart of every Amazon Redshift deployment. Each cluster consists of a leader node and one or more compute nodes, all of which are linked by high-speed networks.

Amazon Redshift RA3 instances with managed storage allow you to choose the number of nodes based on your performance requirements. The RA3 instance type can scale your data warehouse storage capacity automatically without manual intervention, and without needing to add additional compute resources. The number of nodes you choose is determined by the quantity of your data and the query processing performance you want.

The following diagram illustrates the Amazon Redshift RA3 instance architecture.

The interface to your business intelligence application is provided by a leader node. It provides conventional PostgreSQL JDBC/ODBC query and response interfaces. It acts as a traffic cop, routing requests from client applications to the proper compute nodes and managing the results that are delivered. It also distributes ingested data to computing nodes so that your databases may be built.

Amazon Redshift features like streaming, RA3’s near-limitless storage, Amazon Redshift ML, the SUPER data type, automatic table optimization, materialized views, and Amazon Redshift Spectrum open up the possibility of modernizing healthcare clinical quality data repositories and standardizing the data model for fast access and high accuracy. These features make RA3 instances the perfect candidate for your clinical quality repository. Additionally, the data sharing capability in Amazon Redshift keeps a single source for truth across the organization and removes the need for data silos. It’s tightly coupled with other AWS services, which allows you to take advantage of the AWS Cloud ecosystem and get the most out of your data with less effort.

Standardizing data modeling has two benefits: it allows you to reuse technical and organizational procedures (for example, ETL and project management), and you can readily merge data from diverse contexts without much complication. Because storage is separated from the computing, the Amazon Redshift RA3 instance retains the classic data lake feature of storing huge amounts of data. On the data side, to keep the data close to its raw form, a Data Vault model is the ideal solution to this problem.

Data Vault is a methodology to speed up the development of data warehouse initiatives and keep the data close to its sources. The Data Vault 2.0 data modeling standards are popular because they stress the business keys by hashing the keys across entities. This eliminates the need for strong relationships between entities and their linkages within the delivery of business processes. Data Vault makes it easy to integrate with versatile data sources for completely different use cases than it’s originally designed for, due to the following features:

  • Entities can stand alone and be built on patterns, each with a well-defined purpose.
  • Because the data represents the source system and delivers business value, data silos are eliminated.
  • You can load data in parallel with the least number of dependencies.
  • Historized data is kept at the coarsest level of granularity possible.
  • You can implement flexible business rules independently of data loading. This reduces the time taken to load the data by 25%.
  • You can add new data sources without affecting the current model.

The following diagram shows a simple clinical quality data repository with the Data Vault model with Amazon Redshift.

The following shows a simple clinical quality business Data Vault model using Amazon Redshift materialized views.

The Data Vault architecture is divided into four stages:

  • Staging – A copy of the most recent modifications to data from the source systems is created. This layer doesn’t save history, and you can perform numerous alterations to the staged data while populating, such as data type changes or scaling, character set conversion, and the inclusion of metadata columns to enable subsequent processing.
  • Raw vault – This stores a history of all data from numerous source systems. Except for putting the data into source system independent targets, no filters or business transformations happen here.
  • Business vault – This is an optional offering that is frequently developed. It includes business computations and denormalizations with the goal of enhancing the speed and ease of access inside the consumption layer, known as the information mart layer.
  • Data mart layer – This is where data is most typically accessible by users, such as reporting dashboards or extracts. You can build multiple marts from a single Data Vault integration layer, and the most frequent data modeling choice for these marts is Star/Kimball schemas.

The Amazon Redshift RA3 instance capabilities we discussed enable the development of highly performant and cost-effective Data Vault solutions. The staging and raw layers, for example, are populated in micro-batches by one Amazon Redshift cluster 24 hours a day. You can build the business Data Vault layer once a day and pause it to save costs when completed, and any number of consumer Amazon Redshift clusters can access the results.

The following diagram shows the complete architecture of the clinical quality Data Vault.

The architecture has the following components:

  • Batched raw data is loaded into the staging database raw schema.
  • The data quality validated structured data is delivered immediately to the staging database curated schema.
  • Data from devices, EHR systems, and vendor medical systems are also sent directly into the Amazon Redshift staging database.
  • The Data Vault 2.0 approach is used in the Amazon Redshift producer cluster to standardize data structure and assure data integrity.
  • Materialized views make a business Data Vault.
  • The Amazon Redshift SUPER data type allows you to store and query semi-structured data.
  • Amazon Redshift data share capabilities securely exchange the Data Vault tables and views between departments.
  • Support for streaming ingestion in Amazon Redshift eliminates the need to stage data in Amazon S3 before ingesting it into Amazon Redshift.
  • Amazon Redshift allows you to offload the historical data to Amazon S3. Healthcare clinical quality tracking systems usually offload data older than 6–7 years old for archival.
  • Amazon S3 and Amazon Redshift are HIPAA eligible.

Advantages of the Amazon Redshift clinical data repository

A clinical data repository in Amazon Redshift has the following benefits:

  • Data Vault enables the preservation of data as raw in its native form.
  • Amazon Redshift RA3 provides limitless storage, a real-time data feed, structured and semi-structured data, and more.
  • The new streaming functionality and analytics capacity in Amazon Redshift provide near-real-time analysis without the need for extra services.
  • Data quality is assured while maintaining data close to the business and source. You can reduce storage costs while maintaining data fidelity.
  • It’s compatible with business applications and allows for easy adoption when merging or expanding a variety of businesses without complexity.
  • The decoupled storage and compute option in Amazon Redshift allows for cost savings and offers ML capabilities within Amazon Redshift for quicker prediction, forecasting, and anomaly detection.

Conclusion

Data Vault is a one-of-a-kind database platform that promotes openness. It’s quick to adopt, infinitely configurable, and ready to overcome the most demanding data difficulties in current clinical quality metric tracking systems. Combined with the advantages of Amazon Redshift RA3 instances, Data Vault can outperform and deliver more value for cost and time.

To get started,

  • Create Amazon Redshift RA3 instance for the primary “Clinical Data Repository” and the data marts.
  • Build a Data vault schema for the raw vault an create materialized views for the business vault.
  • Enable Amazon Redshift data share to share data between producer cluster and consumer cluster.
  • Load the structed and unstructured data in to the producer cluster data vault for the business use.

About the Authors

Sarathi Balakrishnan is the Global Partner Solutions Architect, specializing in Data, Analytics and AI/ML at AWS. He works closely with AWS partner globally to build solutions and platforms on AWS to accelerate customers’ business outcomes with state-of-the-art cloud technologies and achieve more in their cloud explorations. He helps with solution architecture, technical guidance, and best practices to build cloud-native solutions. He joined AWS with over 20 years of large enterprise experience in agriculture, insurance, health care and life science, marketing and advertisement industries to develop and implement data and AI strategies.

Kasi Muthu is a Senior Partner Solutions Architect based in Houston, TX. He is a trusted advisor in Data, Analytics, AI/ML space. He also helps customers migrate their workloads to AWS with focus on scalability, resiliency, performance and sustainability. Outside of work, he enjoys spending time with his family and spending quite a bit of his free time on YouTube.

Learn About Women in History With Us!

Post Syndicated from Lora Maslenitsyna original https://www.backblaze.com/blog/learn-about-women-in-history-with-us/

March was Women’s History Month, and throughout the month, Backblaze’s employee-led, internal Diversity, Equity, and Inclusion (DEI) committee educated our team on the contributions of women throughout history. In a company-wide Slack channel, DEI committee leaders shared facts and resources about women who were pioneers in a range of fields.

Many of our team members found these facts useful to inform and expand their own worldviews. Team members shared articles they found themselves, and some even used the content as part of their homeschooling curriculum. (As a bonus, the DEI Committee also surveyed employees to generate a word cloud that describes the women of Backblaze, which you can see in the image above.)

The initiative was so popular with our team, we thought we would share some of the content with you even though we are well on our way into April, because any day is a good day to recognize the diverse range of women who have made contributions to our everyday lives, whether it’s still Women’s History Month or not.

Keep reading to learn about important figures and events in the history of technology, Hollywood, politics, and more!

Women in History

In 1756, long before the women’s suffrage movement gained any traction, Lydia Chapin Taft was legally allowed to vote.
Lydia Chapin Taft’s husband, Josiah Taft, was a prominent member of their community in Uxbridge, Massachusetts; he served several terms as a legislator and presided over town hall meetings. When he died, the townspeople agreed to permit Lydia Chapin Taft to vote in her husband’s place. The decision was made in keeping with the slogan of “no taxation without representation,” since Josiah Taft was the town’s largest taxpayer. Lydia Chapin Taft went on to cast several more votes, contributing to the town’s stance on important matters like financial contribution to the French and Indian War.
Read more about Lydia Chapin Taft here.

The 1900s brought significant milestones for women and money in the United States.
In 1938, the federal minimum wage was established as a result of the passage of the Fair Labor Standards Act, eliminating many pay differences between men and women for hourly jobs. In the 1960s, women gained the right to open a bank account. Shortly after, in 1974, the Equal Credit Opportunity Act passed, which aimed to prohibit credit discrimination on the basis of gender. Before it passed, many banks granted credit cards to women only with their husbands’ signatures and outright refused to issue them to unmarried women.
Read more about economic rights for women in the U.S. here.

Wyoming refused to join the United States without a guarantee that women would be allowed to vote.
In 1869, the territory of Wyoming made history when it passed a law granting women aged 21 and older the right to vote. That law was threatened two decades later when Wyoming applied for statehood. Congress stated that it wouldn’t allow the territory to join the Union unless women were disenfranchised. Wyoming called Congress out on its bluff, replying via telegram, “We will remain out of the Union one hundred years rather than come in without the women.” Congress relented and Wyoming became a state in 1890, with women’s right to vote intact. True to its past, Wyoming’s state motto today is simply, “Equal Rights.”
Read more about Wyoming and women’s right to vote here.

Source: Jet City Comics/Joao Vieira.

The British suffragettes learned jiujitsu to defend themselves and evade arrest.
Campaigning for women’s enfranchisement was a dangerous act back in the early 20th century. Many suffragettes in the UK were incarcerated, and some were even force fed in jail as punishment for their self-imposed hunger strikes. To protect women from going to jail and facing this abuse, which could have disastrous health consequences, one suffragette had the bright idea to teach her fellow protesters jiujitsu. Edith Margaret Garrud used her martial arts background to secretly train a unit of 30 members of the Women’s Social and Political Union in self defense. The group was alternately known as “The Bodyguard” and “The Amazons,” and was highly effective at resisting arrest.
Read more about how suffragettes in the UK used martial arts to defend themselves here.

Arabella Mansfield became the first female lawyer in the United States in 1869.
Admitted to the Iowa bar, Mansfield made her career as a college educator and administrator. Despite an Iowa state law restricting the bar exam to males, Mansfield had taken it and earned high scores. Shortly after her court challenge, Iowa amended its licensing statute and became the first state to accept women and minorities into its bar.
Read more about Arabella Mansfield here.

In 1964, Patsy Mink became the first woman of color elected to the U.S. House of Representatives.
Mink’s Congressional career spanned decades (1964–1977; 1990–2002). She was a key author for Title IX, a law that advanced gender equity within federal funding policies for education. This law was later renamed the Patsy T. Mink Equal Opportunity in Education Act in her honor.
Read more about Patsy Mink here.

No list of formidable Irish women would be complete without tomboy icon Gráinne Ní Mháille, aka Grace O’Malley, the notorious “Pirate Queen” of western Ireland.
Born on Clare Island in 1530, O’Malley famously cut off her hair after her father refused to take her on a voyage in case her locks got caught in the ropes. In her prime, O’Malley commanded three galleys, 20 ships, and over 200 men against her perpetual nemesis—the English—and even met with Elizabeth I before living to the ripe old age of 73.
Find out more about Grace O’Malley here.

Cork, Ireland native Annie Moore became the first immigrant to be processed through the newly-opened Ellis Island in New York on January 1, 1892.
Just 17 years old at the time, Moore looked after her two brothers on the ship voyage from Ireland to America, before going on to have 11 children of her own with German Catholic salesman Joseph Augustus Schayer. Moore died in 1924. Her previously unmarked grave was identified over eight decades later in 2006, and a Celtic Cross made from Irish Blue Limestone was later unveiled at her final resting place.
You can read more about Annie Moore here.

Source: Chicago Tribune.

Tammy Duckworth, the Illinois senator and retired National Guard lieutenant colonel, is responsible for an impressive list of firsts.
Duckworth is the first Congress member to be born in Thailand, the first to give birth while in office, the first Asian-American woman to represent Illinois in Congress, and the first woman with a disability to be elected to Congress. She lost both of her legs following a helicopter attack in the Iraq War. “People always want me to hide it in pictures,” she told Vogue in 2018. “I say no! I earned this wheelchair. It’s no different from a medal I wear on my chest. Why would I hide it?”
Find out more about her here.

In 1985, Wilma Mankiller became the first woman to be Principal Chief of the Cherokee Nation, leading the largest tribe in the United States.
During Mankiller’s decade-long chiefdom from 1985 to 1995, “tribal enrollment grew, infant mortality dropped, and employment rates doubled,” according to Time. In 1998, she was awarded the Presidential Medal of Freedom by Bill Clinton.
Learn more about Wilma Mankiller here.

Women in Art

Toshiko Takaezu was a trailblazer in ceramic art making during the 1970s.
Takaezu is best known for creating large, closed-vessel sculptures. At the time, fellow artists expressed shock that a woman could make such large pieces, some taller than the artist herself. Takaezu merged aspects of Japanese tea ceremony, calligraphy, and American Abstract Expressionism to create a new style from these diverse art traditions. She had a long career as an artist and teacher at the Cleveland Institute of Art and Princeton University.
Learn more about Toshiko Takaezu here.

Emily Kauʻiomakaweliokauaionalaniokamanookalanipo Kukahiwa Zuttermeister, also known as Aunty Kauʻi, is a revered Kumu Hula (master hula teacher) from Hawaiʻi.
Zuttermeister trained in the hula pahu tradition of Samuel Pua Haʻaheo before becoming a teacher in 1935. Zuttermeister helped revitalize ʻŌlelo Hawaiʻi (the Hawaiian language) and culture by teaching hula. She was part of a community of leaders who raised awareness about hula as a storytelling art form created by the Hawaiian people to recall and share their knowledge.
Learn more about her here.

No one did sultry better than Anna May Wong.
The Los Angeles-born screen siren landed her breakthrough role at age 17 in 1922’s “The Toll of the Sea.” Wong was also quite the trend setter—in 1934, the Mayfair Mannequin Society of New York voted her the “world’s best-dressed woman,” a massive fashion world honor at the time. Success in Hollywood came, but certainly not equal to her talent. As her Turner Classic Movie biography sums it up, stateside audiences considered Wong either “too Chinese” or “too American.” In Europe, the actress received a wider range of roles and due critical acclaim.
Learn more about Anna May Wong here.

Best known as the frontwoman of 4 Non Blondes, Linda Perry’s prolific behind-the-scenes work—as both a songwriter and producer—helped define modern pop music.
Perry worked on hit songs with P!nk, Christina Aguilera, and Alicia Keys. While a woman has never won a Grammy for Producer of the Year (Non-classical), in 2019, Perry received a nomination for the award from the Recording Academy. The singer-songwriter is one of a handful of women to achieve success in production and with her own music.
Learn more about Linda Perry here.

Delia Derbyshire was an innovator in electronic music who pushed the boundaries of technology and composition.
Derbyshire is most well-known for her electronic arrangement of the theme for “Doctor Who,” an important example of Musique Concrète. Each note was individually crafted by cutting, splicing, and stretching, or compressing, segments of analogue tape which contained recordings of a plucked string, oscillators, and white noise.
Learn more about Delia Derbyshire here.

During a two-decade career that began in the mid-1960s, Sonia Pottinger held the distinction of being Jamaica’s first female record producer.
Cutting tracks with the likes of Joe White & Chuck and Culture, her production spanned a variety of Jamaican genres, from rock-steady to ska to reggae.
Read more about Sonia Pottinger here.

Geena Davis starred in two movies about female empowerment: “Thelma & Louise” and “A League of Their Own.”
As Davis got older, she realized how unempowered women were in Hollywood. In 2004, she founded the Geena Davis Institute on Gender in Media to collect data comparing the number and types of male and female roles and to use that data to convince the industry of the need for change.
Listen to her speak about her career here.

Rita Moreno has influenced the entertainment industry for over 70 years as an actress, singer, and dancer.
Moreno became the first Latine woman to earn the vaunted EGOT: an Emmy, Grammy, Oscar, and Tony. In 2004, she was honored with the Presidential Medal of Freedom for her many contributions to the arts.
Learn more about Rita Moreno here.

Women in Technology

Hedy Lamarr was much more than “the most beautiful woman in the world” during Hollywood’s Golden Age.
The Austrian-American actress was also a mathematically-minded inventor who learned about military technology from dinner party conversations between her arms-manufacturer husband and Nazi German generals, before escaping to America where she eventually invented a new torpedo guidance system for the U.S. Navy.
Read more about Hedy Lamarr’s inventions here.

Source: “The Legacy of Grace Hopper.”

Rear Admiral Grace Brewster Murray Hopper was a STEM pioneer.
Grace Brewster Murray Hopper brought the research and career interests of women in computing to the forefront. The history of computer hardware invention is mostly a male-oriented affair. This isn’t unexpected given that early computers had more to do with heavy engineering than logic. However, when it comes to software, the picture is a little different. Hopper was responsible not only for the development of the Cobol language, but also for continuous advocacy within the industry to make computers and computing more accessible.
Find out more about Grace Hopper here.

Ada, Countess of Lovelace was born 200 years ago, but her name lives on.
There is often an unfairness in the reporting of the history of computing. The software people are nearly always passed over in preference for the hardware people. Ada, Countess of Lovelace worked with Charles Babbage on his Analytical Engine and is generally accepted as the first programmer. Later, in the 1970s, the Ada language was named in recognition of her status as the first computer programmer. In 2009, Ada Lovelace Day was inaugurated to celebrate the achievements of women in science, technology, engineering, and math.
Read more about her here.

In 1996, after being named a mission specialist on the Space Shuttle Columbia by NASA, Kalpana Chawla became the first woman of Indian descent to fly in space.
The shuttle orbited around earth 252 times in a little over two weeks. Chawla’s second—and last—trip to space came in 2003 when she and six other astronauts completed more than 80 experiments over the course of 16 days. She and the entire crew died when the ship disintegrated upon reentering the Earth’s atmosphere. In 2020, Northrop Grumman named a spacecraft after Chawla in her memory.
Read more about her here.

Share More Information on Women in History

Did you learn something new that you didn’t know before? Or, do you have a fact to share about a woman in history? Comment below and help us expand this list!

The post Learn About Women in History With Us! appeared first on Backblaze Blog | Cloud Storage & Cloud Backup.

How SailPoint solved scaling issues by migrating legacy big data applications to Amazon EMR on Amazon EKS

Post Syndicated from Richard Li original https://aws.amazon.com/blogs/big-data/how-sailpoint-solved-scaling-issues-by-migrating-legacy-big-data-applications-to-amazon-emr-on-amazon-eks/

This post is co-written with Richard Li from SailPoint.

SailPoint Technologies is an identity security company based in Austin, TX. Its software as a service (SaaS) solutions support identity governance operations in regulated industries such as healthcare, government, and higher education. SailPoint distinguishes multiple aspects of identity as individual identity security services, including cloud governance, SaaS management, access risk governance, file access management, password management, provisioning, recommendations, and separation of duties, as well as access certification, access insights, access modeling, and access requests.

In this post, we share how SailPoint updated its platform for big data operations, and solved scaling issues by migrating legacy big data applications to Amazon EMR on Amazon EKS.

The challenge with the legacy data environment

SailPoint acquired a SaaS software platform that processes and analyzes identity, resource, and usage data from multiple cloud providers, and provides access insights, usage analysis, and access risk analysis. The original design criteria of the platform was focused on serving small to medium-sized companies. To quickly process these analytics insights, many of these processing workloads were done inside many microservices through streaming connections.

After acquisition, we set a goal to expand the platform’s capability to handle customers with large cloud footprints over multiple cloud providers, sometime over hundreds or even thousands of accounts producing large amount of cloud event data.

The legacy architecture has a simplistic approach for data processing, as shown in the following diagram. We were processing the vast majority of event data in-service and directly ingested into Amazon Relational Database Service (Amazon RDS), which we then merged with a graph database to form the final view..

We needed to convert this into a scalable process that could handle customers of any size. To address this challenge, we had to quickly introduce a big data processing engine in the platform.

How migrating to Amazon EMR on EKS helped solve this challenge

When evaluating the platform for our big data operations, several factors made Amazon EMR on EKS a top choice.

The amount of event data we receive at any given time is generally unpredictable. To stay cost-effective and efficient, we need a platform that is capable of scaling up automatically when the workload increases to reduce wait time, and can scale down when the capacity is no longer needed to save cost. Because our existing application workloads are already running on an Amazon Elastic Kubernetes Service (Amazon EKS) cluster with the cluster autoscaler enabled, running Amazon EMR on EKS on top of our existing EKS cluster fits this need.

Amazon EMR on EKS can safely coexist on an EKS cluster that is already hosting other workloads, be contained within a specified namespace, and have controlled access through use of Kubernetes role-based access control and AWS Identity and Access Management (IAM) roles for service accounts. Therefore, we didn’t have to build new infrastructures just for Amazon EMR. We simply linked up Amazon EMR on EKS with our existing EKS cluster running our application workloads. This reduced the amount of DevOps support needed, and significantly sped up our implementation and deployment timeline.

Unlike Amazon EMR on Amazon Elastic Compute Cloud (Amazon EC2), because our EKS cluster spans over multiple Availability Zones, we can control Spark pods placements using Kubernetes’s pod scheduling and placement strategy to achieve higher fault tolerance.

With the ability to create and use custom images in Amazon EMR on EKS, we could also utilize our existing container-based application build and deployment pipeline for our Amazon EMR on EKS workload without any modifications. This also gave us additional benefit in reducing job startup time because we package all job scripts as well as all dependencies with the image, without having to fetch them at runtime.

We also utilize AWS Step Functions as our core workflow engine. The native integration of Amazon EMR on EKS with Step Functions is another bonus where we didn’t have to build custom code for job dispatch. Instead, we could utilize the Step Functions native integration to seamlessly integrate Amazon EMR jobs with our existing workflow, with very little effort.

In merely 5 months, we were able to go from design, to proof of concept, to rolling out phase 1 of the event analytics processing. This vastly improved our event analytics processing capability by extending horizontal scalability, which gave us the ability to take customers with significantly larger cloud footprints than the legacy platform was designed for.

During the development and rollout of the platform, we also found that the Spark History Server provided by Amazon EMR on EKS was very useful in terms of helping us identify performance issues and tune the performance of our jobs.

As of this writing, the phase 1 rollout, which includes the event processing component of the core analytics processing, is complete. We’re now expanding the platform to migrate additional components onto Amazon EMR on EKS. The following diagram depicts our future architecture with Amazon EMR on EKS when all phases are complete.

In addition, to improve performances and reduce costs, we’re currently testing the Spark dynamic resource allocation support of Amazon EMR on EKS. This would automatically scale up and down the job executors based on load, and therefore boost performance when needed and reduce cost when the workload is low. Furthermore, we’re investigating the possibility to reduce the overall cost and increase performance by utilizing the pod template feature that would allow us to seamlessly transition our Amazon EMR job workload to AWS Graviton based instances.

Conclusion

With Amazon EMR on EKS, we can now onboard new customers and process vast amounts of data in a cost-effective manner, which we couldn’t do with our legacy environment. We plan to expand our Amazon EMR on EKS footprint to handle all our transform and load data analytics processes.


About the Authors

Richard Li is a senior staff software engineer on the SailPoint Technologies Cloud Access Management team.

Janak Agarwal is a product manager for Amazon EMR on Amazon EKS at AWS.

Kiran Guduguntla is a WW Go-to-Market Specialist for Amazon EMR at AWS. He works with AWS customers across the globe to strategize, build, develop, and deploy modern data analytics solutions.

New AWS Wavelength Zone in Toronto – The First in Canada

Post Syndicated from Danilo Poccia original https://aws.amazon.com/blogs/aws/new-aws-wavelength-zone-in-toronto-the-first-in-canada/

Wireless communication has put us closer to each other. 5G networks increase the reach of what we can achieve to new use cases that need end-to-end low latency. With AWS Wavelength, you can deploy AWS compute and storage services within telecommunications providers’ data centers at the edge of the 5G networks. Your applications can then deliver single-digit millisecond latencies to mobile devices and end users and, at the same time, seamlessly access AWS services in the closest AWS Region.

For example, low latency enables new use cases such as:

  • Delivery of high-resolution and high-fidelity live video streaming.
  • Improved experience for augmented/virtual reality (AR/VR) applications.
  • Running machine learning (ML) inference at the edge for applications in medical diagnostics, retail, and factories.
  • Connected vehicle applications with near real-time connectivity with the cloud to improve driver assistance, autonomous driving, and in-vehicle entertainment experiences.

We opened the first AWS Wavelength Zones in 2020 in the US, and then we expanded to new countries, such as Japan, South Korea, the United Kingdom, and Germany. Today, I am happy to share that, in partnership with Bell Canada, we are expanding in a new country with a Wavelength Zone in Toronto.

What You Can Do with AWS Wavelength
As an example of what is possible with Wavelength, let’s look at food deliveries in Toronto. Most deliveries are made within 2 km, and a significant number are for just one item, such as a cup of coffee. Using a car for these deliveries is slow, expensive, and has a large carbon footprint. A better solution is provided by Tiny Mile: they use small remote-controlled robots to deliver small food orders such as coffees and sandwiches at one-tenth the cost of conventional delivery services.

Tiny Mile robot image.

Their remote staff uses the camera feed from the robots to understand the environment, read signage, and drive the robots. To scale up more efficiently, Tiny Mile can now use Bell’s public Multi-access Edge Computing (MEC) solution, delivered through AWS Wavelength, to process data and analyze the video feed in almost real time to detect obstacles and avoid collisions without manual intervention. Having computation at the edge also reduces the weight and the costs of the robots (they don’t need expensive computers onboard) and increases the amount of cargo they can carry.

Using a Wavelength Zone
I follow the instructions in Get started with AWS Wavelength in the documentation. First, I opt in to use the new Wavelength Zone. In the EC2 console for the Canada (Central) Region, I enable New EC2 Experience in the upper-left corner. In the navigation pane, I choose EC2 Dashboard. In the Account attributes section, I choose Zones. There, I enable the Canada (BELL) Wavelength Zone.

Console screenshot.

Now, I can configure networking to use the Wavelength Zone. I can either create an Amazon Virtual Private Cloud (VPC) or extend an existing VPC to include a subnet in a Wavelength Zone. In this case, I want to use a new VPC. In the VPC console, I choose Your VPCs and then Create VPC. I select the VPC only option to create subnets later. I write a name for the VPC and choose the IPv4 CIDR block that will be used for the private addresses of the resources in this VPC. Then, I complete the creation of the VPC.

Console screenshot.

In the navigation pane, I choose Carrier Gateways and then Create carrier gateway. I write a name and select the VPC I just created. I enable Route subnet traffic to the carrier gateway to automatically route traffic from subnets to the carrier gateway.

Console screenshot.

In the Subnets to route section, I configure a subnet residing in the Canada (BELL) – Toronto Wavelength Zone. For the subnet IPv4 CIDR Block, I use a block within the VPC range. Then, I complete the creation of the carrier gateway.

Console screenshot.

Now that networking is configured, I can deploy the portions of my application that require ultra-low latency in the Wavelength Zone and then connect that back to the rest of the application and the cloud services running in the Canada (Central) Region.

To run an EC2 instance in the Wavelength Zone, I use the AWS Command Line Interface (CLI) run-instances command. In this way, I can pass an option to automatically allocate and associate the Carrier IP address with the network interface of the EC2 instance. Another option is to allocate the carrier address and associate it with the network interface after I create the instance. The Carrier IP address is only valid within the telecommunications provider’s network. The carrier gateway uses NAT to translate the Carrier IP address and send traffic to the internet or to mobile devices.

aws ec2 --region ca-central-1 run-instances
--network-interfaces '[{"DeviceIndex":0, "AssociateCarrierIpAddress": true, "SubnetId": "subnet-0d753f7203c2cfd42"}]'
--image-id ami-01d29fca5bdf8f4b4 --instance-type t3.medium

To discover the IP associated with the EC2 instance in the carrier network, I use the describe-instances command:

aws ec2 --region ca-central-1 describe-instances

In the NetworkInterfaces section of the output, I find the Association and the CarrierIP:

"Association": {
  "CarrierIp": "207.61.170.56",
  "IpOwnerId": "amazon",
  "PublicDnsName": ""
}

Now that the EC2 instance is running in the Wavelength Zone, I can deploy a portion of my application in the EC2 instance so that application traffic can be processed at very low latency without leaving the mobile network.

Architectural diagram.

For my next steps, I look at Deploying your first 5G enabled application with AWS Wavelength and follow the walkthrough for a common Wavelength use case: implementing machine learning inference at the edge.

Availability and Pricing
The new Wavelength Zone in Toronto, Canada, is embedded in Bell Canada’s 5G network and is available today. EC2 instances and other AWS resources in Wavelength Zones have different prices than in the parent Region. See the Wavelength pricing page for more information.

AWS Wavelength is part of AWS for the Edge services that help you deliver data processing, analysis, and storage outside AWS data centers and closer to your endpoints. These capabilities allow you to process and store data close to where it’s generated, enabling low-latency, intelligent, and real-time responsiveness.

Start using AWS Wavelength to deliver ultra-low-latency applications for 5G devices.

— Danilo

The collective thoughts of the interwebz