Post Syndicated from Crosstalk Solutions original https://www.youtube.com/watch?v=UiPIcG2jvTM
Introducing Protocol buffers (protobuf) schema support in Amazon Glue Schema Registry
Post Syndicated from Vikas Bajaj original https://aws.amazon.com/blogs/big-data/introducing-protocol-buffers-protobuf-schema-support-in-amazon-glue-schema-registry/
AWS Glue Schema Registry now supports Protocol buffers (protobuf) schemas in addition to JSON and Avro schemas. This allows application teams to use protobuf schemas to govern the evolution of streaming data and centrally control data quality from data streams to data lake. AWS Glue Schema Registry provides an open-source library that includes Apache-licensed serializers and deserializers for protobuf that integrate with Java applications developed for Apache Kafka, Amazon Managed Streaming for Apache Kafka (Amazon MSK), Amazon Kinesis Data Streams, and Kafka Streams. Similar to Avro and JSON schemas, Protocol buffers schemas also support compatibility modes, schema sourcing via metadata, auto-registration of schemas, and AWS Identity and Access Management (IAM) compatibility.
In this post, we focus on Protocol buffers schema support in AWS Glue Schema Registry and how to use Protocol buffers schemas in stream processing Java applications that integrate with Apache Kafka, Amazon Managed Streaming for Apache Kafka and Amazon Kinesis Data Streams
Introduction to Protocol buffers
Protocol buffers is a language and platform-neutral, extensible mechanism for serializing and deserializing structured data for use in communications protocols and data storage. A protobuf message format is defined in the .proto file. Protobuf is recommended over other data formats when you need language interoperability, faster serialization and deserialization, type safety, schema adherence between data producer and consumer applications, and reduced coding effort. With protobuf, you can use generated code from the schema using the protobuf compiler (protoc) to easily write and read your data to and from data streams using a variety of languages. You can also use build tools plugins such as Maven and Gradle to generate code from protobuf schemas as part of your CI/CD pipelines. We use the following schema for code examples in this post, which defines an employee with a gRPC service definition to find an employee by ID:
Employee.proto
AWS Glue Schema Registry supports both proto2 and proto3 syntax. The preceding protobuf schema using version 2 contains three message types: Employee, Team, and Project using scalar, composite, and enumeration data types. Each field in the message definitions has a unique number, which is used to identify fields in the message binary format, and should not be changed once your message type is in use. In a proto2 message, a field can be required, optional, or repeated; in proto3, the options are repeated and optional. The package declaration makes sure generated code is namespaced to avoid any collisions. In addition to scalar, composite, and enumeration types, AWS Glue Schema Registry also supports protobuf schemas with common types such as Money, PhoneNumber,Timestamp, Duration, and nullable types such as BoolValue and Int32Value. It also supports protobuf schemas with gRPC service definitions with compatibility rules, such as EmployeeSearch, in the preceding schema. To learn more about the Protocol buffers, refer to its documentation.
Supported Protocol buffers specification and features
AWS Glue Schema Registry supports all the features of Protocol buffers for versions 2 and 3 except for groups, extensions, and importing definitions. AWS Glue Schema Registry APIs and its open-source library supports the latest protobuf runtime version. The protobuf schema operations in AWS Glue Schema Registry are supported via the AWS Management Console, AWS Command Line Interface (AWS CLI), AWS Glue Schema Registry API, AWS SDK, and AWS CloudFormation.
How AWS Glue Schema Registry works
The following diagram illustrates a high-level view of how AWS Glue Schema Registry works. AWS Glue Schema Registry allows you to register and evolve JSON, Apache Avro, and Protocol buffers schemas with compatibility modes. You can register multiple versions of each schema as the business needs or stream processing application’s requirements evolve. The AWS Glue Schema Registry open-source library provides JSON, Avro, and protobuf serializers and deserializers that you configure in producer and consumer stream processing applications, as shown in the following diagram. The open-source library also supports optional compression and caching configuration to save on data transfers.

To accommodate various business use cases, AWS Glue Schema Registry supports multiple compatibility modes. For example, if a consumer application is updated to a new schema version but is still able to consume and process messages based on the previous version of the same schema, then the schema is backward-compatible. However, if a schema version has bumped up in the producer application and the consumer application is not updated yet but can still consume and process the old and new message, then the schema is configured as forward-compatible. For more information, refer to How the Schema Registry Works.
Create a Protocol buffers schema in AWS Glue Schema Registry
In this section, we create a protobuf schema in AWS Glue Schema Registry via the console and AWS CLI.
Create a schema via the console
Make sure you have the required AWS Glue Schema Registry IAM permissions.
- On the AWS Glue console, choose Schema registries in the navigation pane.
- Click Add registry.

- For Registry name, enter
employee-schema-registry. - Click Add Registry.

- After the registry is created, click Add schema to register a new schema.

- For Schema name, enter
Employee.proto.


The schema must be either Employee.proto or Employee if the protobuf schema doesn’t have the options option java_multiple_files = true; and option java_outer_classname = "<Outer class name>"; and if you decide to use protobuf schema generated code (POJOs) in your stream processing applications. We cover this with an example in a subsequent section of this post. For more information on protobuf options, refer to Options.
- For Registry, choose the
registry employee-schema-registry. - For Data format, choose Protocol buffers.
- For Compatibility mode, choose Backward.
You can choose other compatibility modes as per your use case.

- For First schema version, enter the preceding protobuf schema, then click Create schema and version.


After the schema is registered successfully, its status will be Available, as shown in the following screenshot.

Create a schema via the AWS CLI
Make sure you have IAM credentials with AWS Glue Schema Registry permissions.
- Run the following AWS CLI command to create a schema registry
employee-schema-registry(for this post, we use the Regionus-east-2):
The AWS CLI command returns the newly created schema registry ARN in response.
- Copy the
RegistryArnvalue from the response to use in the following AWS CLI command. - In the following command, use the preceding protobuf schema and schema name
Employee.proto:
You can also use AWS CloudFormation to create schemas in AWS Glue Schema Registry.
Using a Protocol buffers schema with Amazon MSK and Kinesis Data Streams
Like Apache Avro’s SpecificRecord and GenericRecord, protobuf also supports working with POJOs to ensure type safety and DynamicMessage to create generic data producer and consumer applications. The following examples showcase the use of a protobuf schema registered in AWS Glue Schema Registry with Kafka and Kinesis Data Streams producer and consumer applications.
Use a protobuf schema with Amazon MSK
Create an Amazon MSK or Apache Kafka cluster with a topic called protobuf-demo-topic. If creating an Amazon MSK cluster, you can use the console. For instructions, refer to Getting Started Using Amazon MSK.
Use protobuf schema-generated POJOs
To use protobuf schema-generated POJOs, complete the following steps:
- Install the protobuf compiler (
protoc) on your local machine from GitHub and add it in the PATH variable. - Add the following plugin configuration to your application’s pom.xml file. We use the xolstice protobuf Maven plugin for this post to generate code from the protobuf schema.
- Add the following dependencies to your application’s pom.xml file:
- Create a schema
registry employee-schema-registryin AWS Glue Schema Registry and register theEmployee.protoprotobuf schema with it. Name your schemaEmployee.proto(orEmployee). - Run the following command to generate the code from
Employee.proto. Make sure you have the schema file in the${basedir}/src/main/resources/protodirectory or change it as per your application directory structure in the application’s pom.xml<protoSourceRoot>tag value:
Next, we configure the Kafka producer publishing protobuf messages to the Kafka topic on Amazon MSK.
- Configure the Kafka producer properties:
The VALUE_SERIALIZER_CLASS_CONFIG configuration specifies the AWS Glue Schema Registry serializer, which serializes the protobuf message.
- Use the schema-generated code (POJOs) to create a protobuf message:
- Publish the protobuf messages to the
protobuf-demo-topictopic on Amazon MSK: - Start the Kafka producer:
- In the Kafka consumer application’s pom.xml, add the same plugin and dependencies as the Kafka producer’s pom.xml.
Next, we configure the Kafka consumer consuming protobuf messages from the Kafka topic on Amazon MSK.
- Configure the Kafka consumer properties:
The VALUE_DESERIALIZER_CLASS_CONFIG config specifies the AWS Glue Schema Registry deserializer that deserializes the protobuf messages.
- Consume the protobuf message (as a POJO) from the
protobuf-demo-topictopic on Amazon MSK: - Start the Kafka consumer:
Use protobuf’s DynamicMessage
You can use DynamicMessage to create generic producer and consumer applications without generating the code from the protobuf schema. To use DynamicMessage, you first need to create a protobuf schema file descriptor.
- Generate a file descriptor from the protobuf schema using the following command:
The option --descritor_set_out has the descriptor file name that this command generates. The protobuf schema Employee.proto is in the proto directory.
- Make sure you have created a schema registry and registered the preceding protobuf schema with it.
Now we configure the Kafka producer publishing DynamicMessage to the Kafka topic on Amazon MSK.
- Create the Kafka producer configuration. The
PROTOBUF_MESSAGE_TYPEconfiguration isDYNAMIC_MESSAGEinstead of POJO. - Create protobuf dynamic messages and publish them to the Kafka topic on Amazon MSK:
- Create a descriptor using the
Employeeproto.descfile that we generated from theEmployee.protoschema file in the previous steps: - Start the Kafka producer:
Now we configure the Kafka consumer consuming dynamic messages from the Kaka topic on Amazon MSK.
- Enter the following Kafka consumer configuration:
- Consume protobuf dynamic messages from the Kafka topic
protobuf-demo-topic. Because we’re usingDYNAMIC_MESSAGE, the retrieved objects are of typeDynamicMessage. - Start the Kafka consumer:
Use a protobuf schema with Kinesis Data Streams
You can use the protobuf schema-generated POJOs with the Kinesis Producer Library (KPL) and Kinesis Client Library (KCL).
- Install the protobuf compiler (
protoc) on your local machine from GitHub and add it in thePATHvariable. - Add the following plugin configuration to your application’s pom.xml file. We’re using the xolstice protobuf Maven plugin for this post to generate code from the protobuf schema.
- Because the KPL and KCL latest versions have the AWS Glue Schema Registry open-source library (
schema-registry-serde) and protobuf runtime (protobuf-java) included, you only need to add the following dependencies to your application’s pom.xml: - Create a schema registry
employee-schema-registryand register theEmployee.protoprotobuf schema with it. Name your schemaEmployee.proto(orEmployee). - Run the following command to generate the code from
Employee.proto. Make sure you have the schema file in the${basedir}/src/main/resources/protodirectory or change it as per your application directory structure in the application’s pom.xml<protoSourceRoot>tag value.
The following Kinesis producer code with the KPL uses the Schema Registry open-source library to publish protobuf messages to Kinesis Data Streams.
- Start the Kinesis Data Streams producer:
- Configure the Kinesis producer:
- Create a protobuf message using schema-generated code (POJOs):
- Create the schema definition from
Employee.proto:
The following is the Kinesis consumer code with the KCL using the Schema Registry open-source library to consume protobuf messages from the Kinesis Data Streams.
- Initialize the application:
- Consume protobuf messages from Kinesis Data Streams:
- Start the Kinesis Data Streams consumer:
Enhance your protobuf schema
We covered examples of data producer and consumer applications integrating with Amazon MSK, Apache Kafka, and Kinesis Data Streams, and using a Protocol buffers schema registered with AWS Glue Schema Registry. You can further enhance these examples with schema evolution using the following rules, which are supported by AWS Glue Schema Registry. For example, the following protobuf schema shown is a backward-compatible updated version of Employee.proto. We have added another gRPC service definition CreateEmployee under EmployeeSearch and added an Optional field in the Employee message type. If you upgrade the consumer application with this version of the protobuf schema, the consumer application can still consume old and new protobuf messages.
Employee.proto (version-2)
Conclusion
In this post, we introduced Protocol buffers schema support in AWS Glue Schema Registry. AWS Glue Schema Registry now supports Apache Avro, JSON, and Protocol buffers schemas with different compatible modes. The examples in this post demonstrated how to use Protocol buffers schemas registered with AWS Glue Schema Registry in stream processing applications integrated with Apache Kafka, Amazon MSK, and Kinesis Data Streams. We used the schema-generated POJOs for type safety and protobuf’s DynamicMessage to create generic producer and consumer applications. The examples in this post contain the basic components of the stream processing pattern; you can adapt these examples to your use case needs.
To learn more, refer to the following resources:
- How the Glue Schema Registry works
- Validate, evolve, and control schemas in Amazon MSK and Amazon Kinesis Data Streams with AWS Glue Schema Registry
- Validate streaming data over Amazon MSK using schemas in cross-account AWS Glue Schema Registry
- Evolve JSON Schemas in Amazon MSK and Amazon Kinesis Data Streams with the AWS Glue Schema Registry
- Protocol buffers
About the Author
 Vikas Bajaj is a Principal Solutions Architect at AWS. Vikas works with digital native customers and advises them on technology architecture and solutions to meet strategic business objectives.
Run AWS Glue crawlers using Amazon S3 event notifications
Post Syndicated from Pradeep Patel original https://aws.amazon.com/blogs/big-data/run-aws-glue-crawlers-using-amazon-s3-event-notifications/
The AWS Well-Architected Data Analytics Lens provides a set of guiding principles for analytics applications on AWS. One of the best practices it talks about is build a central Data Catalog to store, share, and track metadata changes. AWS Glue provides a Data Catalog to fulfill this requirement. AWS Glue also provides crawlers that automatically discover datasets stored in multiple source systems, including Amazon Redshift, Amazon DynamoDB, Amazon Simple Storage Service (Amazon S3), MongoDB, Amazon DocumentDB (with MongoDB compatibility), and various other data stores using JDBC. A crawler extracts schemas of tables from these sources and stores the information in the AWS Glue Data Catalog. You can run a crawler on-demand or on a schedule.
When you schedule a crawler to discover data in Amazon S3, you can choose to crawl all folders or crawl new folders only. In the first mode, every time the crawler runs, it scans data in every folder under the root path it was configured to crawl. This can be slow for large tables because on every run, the crawler must list all objects and then compare metadata to identify new objects. In the second mode, commonly referred as incremental crawls, every time the crawler runs, it processes only S3 folders that were added since the last crawl. Incremental crawls can reduce runtime and cost when used with datasets that append new objects with consistent schema on a regular basis.
AWS Glue also supports incremental crawls using Amazon S3 Event Notifications. You can configure Amazon S3 Event Notifications to be sent to an Amazon Simple Queue Service (Amazon SQS) queue, which the crawler uses to identify the newly added or deleted objects. With each run of the crawler, the SQS queue is inspected for new events; if none are found, the crawler stops. If events are found in the queue, the crawler inspects their respective folders and processes the new objects. This new mode reduces cost and crawler runtime to update large and frequently changing tables.
In this post, we present two design patterns to create a crawler pipeline using this new feature. A crawler pipeline refers to components required to implement incremental crawling using Amazon S3 Event Notifications.
Crawler pipeline design patterns
We define design patterns for the crawler pipeline based on a simple question: do I have any applications other than the crawler that consume S3 event notifications?
If the answer is no, you can send event notifications directly to an SQS queue that has no other consumers. The crawler consumes events from the queue.
If you have multiple applications that want to consume the event notifications, send the notifications directly to an Amazon Simple Notification Service (Amazon SNS) topic, and then broadcast them to an SQS queue. If you have an application or microservice that consumes notifications, you can subscribe it to the SNS topic. This way, you can populate metadata in the Data Catalog while still supporting use cases around the files ingested into the S3 bucket.
The following are some considerations for these options:
- S3 event notifications can only be sent to standard Amazon SNS; Amazon SNS FIFO is not supported. Refer to Amazon S3 Event Notifications for more details.
- Similarly, S3 event notifications sent to Amazon SNS can only be forwarded to standard SQS queues and not Amazon SQS FIFO queues. For more information, see FIFO topics example use case.
- The AWS Identity and Access Management (IAM) role used by the crawler needs to include an IAM policy for Amazon SQS. We provide an example policy later in this post.
Let’s take a deeper look into each design pattern to understand the architecture and its pros and cons.
Option 1: Publish events to an SQS queue
The following diagram represents a design pattern where S3 event notifications are published directly to a standard SQS queue. First, you need to configure an SQS queue as a target for S3 event notification on the S3 bucket where the table you want to crawl is stored. Next, attach an IAM policy to the queue including permissions for Amazon S3 to send messages to Amazon SQS, and permissions for the crawler IAM role to read and delete messages from Amazon SQS. This approach is useful when the SQS queue is used only for incremental crawling and no other application or service is depending on it. The crawler removes events from the queue after they are processed, so they’re not available for other applications. The following diagram illustrates this architecture.

Figure 1: Crawler pipeline using Amazon SQS queue
Option 2: Publish events to an SNS topic and forward to an SQS queue
The following diagram represents a design pattern where S3 event notifications are sent to an SNS topic, which are then forwarded to an SQS queue for the crawler to consume. First, you need to configure an SNS topic as a target for S3 event notification on the S3 bucket where the table you want to crawl is stored. Next, attach an IAM policy to the topic including permissions for Amazon S3 to send messages to Amazon SNS. Then, create an SQS queue and subscribe it to the SNS topic to receives S3 events. Finally, attach an IAM policy to the queue that includes permissions for Amazon SNS to publish messages to Amazon SQS and permissions for the crawler IAM role to read and delete messages from Amazon SQS. This approach is useful when other applications depend on the S3 event notifications. For more information about fanout capabilities in Amazon SNS, see Fanout S3 Event Notifications to Multiple Endpoints.

Figure 2: Crawler pipeline using Amazon SNS topic and Amazon SQS queue
Solution overview
It’s common to have multiple applications consuming S3 event notifications, so in this post we demonstrate how to implement the second design pattern using Amazon SNS and Amazon SQS.
We create the following AWS resources:
- S3 bucket – The location where table data is stored. Event notifications are enabled.
- SNS topic and access policy – Amazon S3 sends event notifications to the SNS topic. The topic must have a policy that gives permissions to Amazon S3.
- SQS queue and access policy – The SNS topic publishes messages to SQS queue. The queue must have a policy that gives the SNS topic permission to write messages.
- Three IAM policies – The policies are as follows:
- SQS queue policy – Lets the crawler consume messages from the SQS queue.
- S3 policy – Lets the crawler read files from the S3 bucket.
- AWS Glue crawler policy – Lets the crawler make changes to the AWS Glue Data Catalog.
- IAM role – The IAM role used by the crawler. This role uses the three preceding policies.
- AWS Glue crawler – Crawls the table’s objects and updates the AWS Glue Data Catalog.
- AWS Glue database – The database in the Data Catalog.
- AWS Glue table – The crawler creates a table in the Data Catalog.
In the following sections, we walk you through the steps to create your resources and test the solution.
Create an S3 bucket and set up a folder
To create your Amazon S3 resources, complete the following steps:
- On the Amazon S3 console, choose Buckets in the navigation pane.
- Choose Create bucket.
- For Bucket name, enter
s3-event-notifications-bucket-<random-number>. - Select Block all public access.
- Choose Create bucket.
- In the buckets list, select the bucket and choose Create a folder.
- For Folder name, enter
nyc_data. - Choose Create folder.
Create an IAM policy with permissions on Amazon S3
To create your IAM policy with Amazon S3 permissions, complete the following steps:
- On the IAM console, choose Policies.
- Choose Create policy.
- On the JSON tab, enter the policy code from s3_event_notifications_iam_policy_s3.json.
- Update the S3 bucket name.
- Choose Next: Tags.
- Choose Next: Review.
- For Name, enter
s3_event_notifications_iam_policy_s3. - Choose Create policy.
Create an IAM policy with permissions on Amazon SQS
To create your IAM policy with Amazon SQS permissions, complete the following steps:
- On the IAM console, choose Policies.
- Choose Create policy.
- On the JSON tab, enter the policy code from s3_event_notifications_iam_policy_sqs.json.
- Update the AWS account number.
- Choose Next: Tags.
- Choose Next: Review.
- For Name, enter
s3_event_notifications_iam_policy_sqs. - Choose Create policy.
Create an IAM role for the crawler
To create your IAM policy with for the AWS Glue crawler, complete the following steps:
- On the IAM console, choose Roles.
- Choose Create role.
- For Choose a use case, choose Glue.
- Choose Next: Permissions.
- Attach the two policies you just created:
s3_event_notifications_iam_policy_s3ands3_event_notifications_iam_policy_sqs. - Attach the AWS managed policy
AWSGlueServiceRole. - Choose Next: Tags.
- Choose Next: Review.
- For Role name, enter
s3_event_notifications_crawler_iam_role. - Review to confirm that all three policies are attached.
- Choose Create role.
Create an SNS topic
To create your SNS topic, complete the following steps:
- On the Amazon SNS console, choose Topics.
- Choose Create topic.
- For Type, choose Standard (FIFO isn’t supported).
- For Name, enter
s3_event_notifications_topic. - Choose Create topic.
- On the Access policy tab, choose Advanced.
- Enter the policy contents from s3_event_notifications_sns_topic_access_policy.json.
- Update the account number and S3 bucket.
- Choose Create topic.
Create an SQS queue
To create your SQS queue, complete the following steps.
- On the Amazon SQS console, choose Create a queue.
- For Type, choose Standard.
- For Name, enter
s3_event_notifications_queue. - Keep the remaining settings at their default.
- On the Access policy tab, choose Advanced.
- Enter the policy contents from s3_event_notifications_sqs_queue_policy.json.
- Update the account number.
- Choose Create queue.
- On the SNS subscription tab, choose Subscribe to SNS topic.
- Choose the topic you created,
s3_event_notifications_topic. - Choose Save.
Create event notifications on the S3 bucket
To create event notifications for your S3 bucket, complete the following steps:
- Navigate to the Properties tab of the S3 bucket you created.
- In the Event notifications section, choose Create event notification.
- For Event name, enter
crawler_event. - For Prefix, enter
nyc_data/. - For Event Types, choose All Object Create Event.
- For Destination, choose SNS topic and the topic
s3_event_notifications_topic.
Create a crawler
To create your AWS Glue crawler, complete the following steps:
- On the AWS Glue console, choose Crawlers.
- Choose Add crawler.
- For Crawler name, enter
s3_event_notifications_crawler. - Choose Next.
- For Crawler source type, choose data stores.
- For Repeat crawls of S3 data stores, choose Crawl changes identified by Amazon S3 events.
- Choose Next.
- For Include path, enter an S3 path.
- For Include SQS ARN, add your Amazon SQS ARN.
Including a dead-letter queue is optional; we skip it for this post. Dead-letter queues help you isolate problematic event notifications a crawler can’t process successfully. To understand general benefits of dead-letter queues and how it gets messages from the main SQS queue, refer to Amazon SQS dead-letter queues.
- Choose Next.

- When asked to add another data store, choose No.
- For IAM role, select “Choose an existing role” and enter the IAM role created above.
- Choose Next.

- For Frequency, choose Run on demand.
- Choose Next.
- Under Database, choose Add database.
- For Database name, enter
s3_event_notifications_database. - Choose Create.
- Choose Next.
- Choose Finish to create your crawler.


Test the solution
The following steps show how adding new objects triggers an event notification that propagates to Amazon SQS, which the crawler uses on subsequent runs. For sample data, we use NYC taxi records from January and February, 2020.
- Download the following datasets:
- On the Amazon S3 console, navigate to the bucket you created earlier.
- Create a folder called
nyc_data. - Create a subfolder called
dt=202001.
This sends a notification to the SNS topic, and a message is sent to the SQS queue.
- In the folder
dt=202001, upload the filegreen_tripdata_2020-01.csv. - To validate that this step generated an S3 event notification, navigate to the queue on the Amazon SQS console.
- Choose Send and receive messages.
- Under Receive messages, Messages available should show as
1. - Return to the Crawlers page on the AWS Glue console and select the crawler
s3_event_notifications_crawler. - Choose Run crawler. After a few seconds, the crawler status changes to
Startingand then toRunning. The crawler should complete in 1–2 minutes and display a success message. - Confirm that a new table,
nyc_data, is in your database.

- Choose the table to verify its schema.

The dt column is marked as a partition key.
- Choose View partitions to see partition details.

- To validate that the crawler consumed this event, navigate to the queue on the Amazon SQS console and choose Send and receive messages.
- Under Receive messages, Messages available should show as
0.

Now upload another file and see how the S3 event triggers a crawler to run.
- On the Amazon S3 console, in your
nyc_datafolder, create the subfolderdt=202002. - Upload the file
green_tripdata_2020-02.csvto this subfolder. - Run the crawler again and wait for the success message.

- Return to the AWS Glue table and choose View partitions to see a new partition added.


Additional notes
Keep in mind the following when using this solution:
- You can update existing crawlers with a single Amazon S3 target to use this new feature. You can do this either via the AWS Glue console or by calling the update_crawler API.
- As the table schema evolves with newly added files, the crawler updates the AWS Glue Data Catalog accordingly.
- To try this feature programmatically, refer to GitHub repo AWS Glue Crawler Utilities, where we’ve provided you with a AWS SDK for Python (Boto3) script. We will add samples for AWS CloudFormation and AWS Cloud Development Kit (AWS CDK) in coming weeks.
Clean up
When you’re finished evaluating this feature, you should delete the SNS topic and SQS queue, AWS Glue crawler, and S3 bucket and objects to avoid any further charges.
Conclusion
In this post, we discussed a new way for AWS Glue crawlers to use S3 Event Notifications to reduce the time and cost needed to incrementally process table data updates in the AWS Glue Data Catalog. We discussed two design patterns to implement this approach. The first pattern publishes events directly to an SQS queue, which is useful when only the crawler needs these events. The second pattern publishes events to an SNS topic, which are forwarded to an SQS queue for the crawler to process. This is useful when other applications also depend on these events. We also discussed how to implement the second design pattern to incrementally crawl your data. Incremental crawlers using S3 event notifications reduces the runtime and cost of your crawlers for large and frequently changing tables.
Let us know your feedback in the comments section. Happy crawling!
About the Authors
 Pradeep Patel is a Sr. Software Engineer at AWS Glue. He is passionate about helping customers solve their problems by using the power of the AWS Cloud to deliver highly scalable and robust solutions. In his spare time, he loves to hike and play with web applications.
 Vivek Shrivastava is a Principal Data Architect, Data Lake in AWS Professional Services. He is a Bigdata enthusiast and holds 13 AWS Certifications. He is passionate about helping customers build scalable and high-performance data analytics solutions in the cloud. In his spare time, he loves reading and finds areas for home automation.
 Ravi Itha is a Sr. Data Architect at AWS. He works with customers to design and implement data lakes, analytics, and microservices on AWS. He is an open-source committer and has published more than a dozen solutions using AWS CDK, AWS Glue, AWS Lambda, AWS Step Functions, Amazon ECS, Amazon MQ, Amazon SQS, Amazon Kinesis Data Streams, and Amazon Kinesis Data Analytics for Apache Flink. His solutions can be found at his GitHub handle. Outside of work, he is passionate about books, cooking, movies, and yoga.
Camera Gear Matters & Can Improve your Photos!
Post Syndicated from Matt Granger original https://www.youtube.com/watch?v=cQ8SuTtRdm8
4 ways we use GitHub Actions to build GitHub
Post Syndicated from Brian Douglas original https://github.blog/2022-04-05-4-ways-we-use-github-actions-to-build-github/
From planning and tracking our work on GitHub Issues to using GitHub Discussions to gather your feedback and running our developer environments in Codespaces, we pride ourselves on using GitHub to build GitHub, and we love sharing how we use our own products in the hopes it’ll inspire new ways for you and your teams to use them.
Even before we officially released GitHub Actions in 2018, we were already using it to automate all kinds of things behind the scenes at GitHub. If you don’t already know, GitHub Actions brings platform-native automation and CI/CD that responds to any webhook event on GitHub (you can learn more in this article). We’ve seen some incredible GitHub Actions from open source communities and enterprise companies alike with more than 12,000 community-built actions in the GitHub Marketplace.
Now, we want to share a few ways we use GitHub Actions to build GitHub. Let’s dive in.
1. Tracking security reports and vulnerabilities
In 2019, we announced the creation of the GitHub Security Lab as a way to bring security researchers, open source maintainers, and companies together to secure open source software. Since then, we’ve been busy doing everything from giving advice on how to write secure code, to explaining vulnerabilities in important open source projects, to keeping our GitHub Advisory Database up-to-date.
In short, it’s fair to say our Security Lab team is busy. And it shouldn’t surprise you to know that they’re using GitHub Actions to automate their workflows, tests, and project management processes.
One particularly interesting way our Security Lab team uses GitHub Actions is to automate a number of processes related to reporting vulnerabilities to open source projects. They also use actions to automate processes related to the CodeQL bug bounty program, but I’ll focus on the vulnerability reporting here.
Any GitHub employee who discovers a vulnerability in an open source project can report it via the Security Lab. We help them to create a vulnerability report, take care of reporting it to the project maintainer, and track the fix and the disclosure.
To start this process, we created an issue form template that GitHub employees can use to report a vulnerability:

A screenshot of an Issue template GitHub employees use to report vulnerabilities.
The issue form triggers an action that automatically generates a report template (with details such as the reporter’s name that is filled out automatically). We ask the vulnerability reporter to enter the URL of a private repository, which is where the report template will be created (as an issue), so that the details of the vulnerability can be discussed confidentially.
Every vulnerability report is assigned a unique ID, such as GHSL-2021-1001. The action generates these unique IDs automatically and adds them to the report template. We generate the unique IDs by creating empty issues in a special-purpose repository and use the issue numbers as the IDs. This is a great improvement over our previous system, which involved using a shared spreadsheet to generate GHSL IDs and introduced a lot more potential for error due to having to manually fill out the template.
For most people, reporting a vulnerability is not something that they do every day. The issue form and automatically-generated report template help to guide the reporter, so that they give the Security Lab all the information they need when they report the issue to the maintainer.
2. Automating large-scale regression testing of CodeQL implementation changes
CodeQL plays a big part in keeping the software ecosystem secure—both as a tool we use internally to bolster our own platform security and as a freely available tool for open source communities, companies, and developers to use.
If you’re not familiar, CodeQL is a semantic code analysis engine that enables developers to query code as if it were data. This makes it easier to find vulnerabilities across a codebase and create reusable queries (or leverage queries that others have developed).
The CodeQL Team at GitHub leverages a lot of automation in their day-to-day workflows. Yet one of the most interesting applications they use GitHub Actions for is large-scale regression testing of CodeQL implementation changes. In addition to recurring nightly experiments, most CodeQL pull requests also use custom experiments for investigating the CodeQL performance and output changes a merge would result in.
The typical experiment runs the standard github/codeql-action queries on a curated set of open source projects, recording performance and output metrics to perform comparisons that answers questions such as “how much faster does my optimization make the queries?” and “does my query improvement produce new security alerts?”
Let me repeat that for emphasis: They’ve built an entire regression testing system on GitHub Actions. To do this, they use two kinds of GitHub Actions workflows:
- One-off, dynamically-generated workflows that run the github/codeql-action on individual open source projects. These workflows are similar to what codeql-action users would write manually, but also contain additional code that collects data for the experiments.
- Periodically run workflows that generate and trigger the above workflows for any ongoing experiments and later compose the resulting data into digestible reports.
The elasticity of GitHub Actions is crucial for making the entire system work, both in terms of compute and storage. Experiments on hundreds of projects trivially parallelize to hundreds of on-demand action runners, causing even large experiments to finish quickly, while the storage of large experiment outputs is handled transparently through workflow artifacts.
Several other GitHub features are used to make the experiments accessible to the engineers through a single platform with the two most visible being:
- Issues: The status of every experiment is tracked through an ordinary GitHub issue that is updated automatically by a workflow. Upon completion of the experiment, the relevant engineers are notified. This enables easy discussions of experiment outcomes, and also enables cross-referencing experiments and any associated pull requests.
- Rich content: Detailed reports for the changes observed in an experiment are presented as ordinary markdown files in a GitHub repository that can easily be viewed through a browser.
And while this isn’t exactly a typical use case for GitHub Actions, it illustrates how flexible it is—and how much you can do with it. After all, most organizations have dedicated infrastructure to perform regression testing at the scale we do. At GitHub, we’re able to use our own products to solve the problem in a non-standard way.
3. Bringing CI/CD to the GitHub Mobile Team
Every week, the GitHub Mobile Team updates our mobile app with new features, bug fixes, and improvements. Additionally, GitHub Actions plays an integral role in their release process, helping to deliver release candidates to our more than 8,000 beta testers.
Our Mobile team is comparatively small compared to other teams at GitHub, so automating any number of processes is incredibly impactful. It lets them focus more on building code and new features, and removes repetitive tasks that otherwise would take hours to manually process each week.
That means they’ve thought a good deal about how to best leverage GitHub Actions to save the most amount of time possible when building and releasing GitHub Mobile updates.
This chart below shows all the steps included in building and delivering a mobile app update. The gray steps are automated, while the blue steps are manually orchestrated. The automated steps include running a shell command, creating a branch, opening a pull request, creating an issue and GitHub release, and assigning a developer.
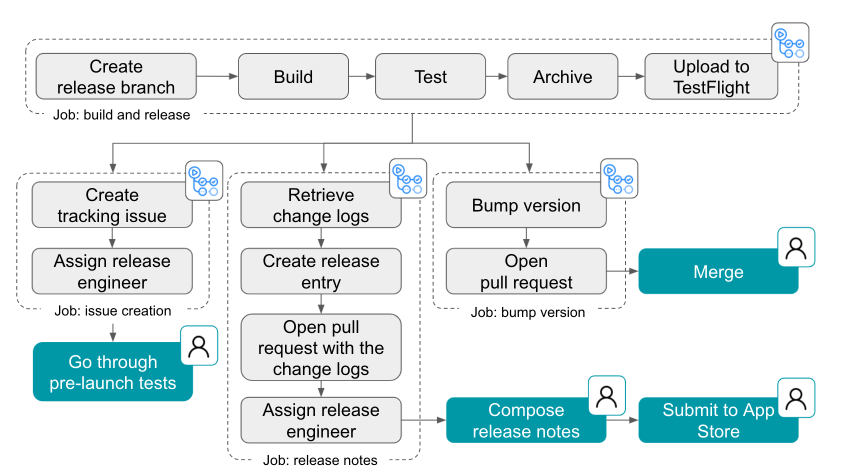
A workflow diagram of GitHub’s release process with automated steps represented in gray and manual steps represented in green.
Another thing our team focused on was to make it possible for anyone to be a release captain. By making a computer do things that a human might have to learn or be trained on, makes it easier for any of our engineers to know what to do to get a new version of GitHub Mobile out to users.
This is a great example of CI/CD in action at GitHub. It also shows firsthand what GitHub Actions does best: automating workflows to let developers focus more on coding and less on repetitive tasks.
You can learn more about how the GitHub Mobile team uses GitHub Actions here >
4. Handling the day-to-day tasks
Of course, we also use GitHub Actions to automate a bunch of non-technical tasks, like spinning up status updates and sending automated notifications on chat applications.
After talking with some of our internal teams, I wanted to showcase some of my favorite internal examples I’ve seen of Hubbers using GitHub Actions to streamline their workflows (and have a bit of fun, too).
 Share company updates to GitHub’s intranet
 Share company updates to GitHub’s intranet
Our Intranet team uses GitHub Actions to add updates to our intranet whenever changes are made to a specified directory. In practice, this means that anyone at GitHub with the right permissions can share messages with the company by adding a file to a repository. This then triggers a GitHub Actions workflow that turns that file into a public-facing message that’s shared to our intranet and automatically to a Slack channel.
Create weekly reports on program status updates
 Create weekly reports on program status updates
At GitHub, we have technical program management teams that are responsible for making sure the trains arrive on time and things get built and shipped. Part of their job includes building out weekly status reports for visibility into development projects, including progress, anticipated timelines, and potential blockers. To speed up this process, our technical program teams use GitHub Actions to automate the compilation of all of their individual reports into an all-up program status dashboard.
Turn weekly team photos into GIFs and upload to README
 Turn weekly team photos into GIFs and upload to README
Here’s a fun one for you: Our Ecosystem Applications team built a custom GitHub Actions workflow that combines team photos they take at their weekly meetings and turns it into a GIF. And if that wasn’t enough, that same workflow also automatically uploads that GIF to their team README. In the words of our Senior Engineer, Jake Wilkins, “I’m not sure when or why we started taking team photos, but when we got access to GitHub Actions it was an obvious thing to do.”
Start automating your workflows with GitHub Actions
Whether you need to build a CI/CD pipeline or want to step up your Twitter game, GitHub Actions offers powerful automation across GitHub (and outside of it, too). With more than 12,000 pre-built community actions in the GitHub Marketplace, it’s easy to start bringing simple and complex automations to your workflows so you can focus on what matters most: building great code.
Additional resources
Backup Solutions for Medical Offices
Post Syndicated from Molly Clancy original https://www.backblaze.com/blog/backup-solutions-for-medical-offices/

If you are responsible for the day-to-day maintenance of a medical office’s IT systems, including data backups, your job has never been more important. Since offices started shifting to electronic health records, managing IT systems for medical practices has presented a unique set of challenges—the amount of data you have to manage has grown, data is subject to HIPAA regulations, and recently, your data became even more of a target for cybercriminals as they zeroed in on health facilities over the course of the COVID-19 pandemic.
In 2020, 560 healthcare facilities were affected by ransomware according to a report by Emsisoft, a cybersecurity firm. Medical offices manage high volumes of personally identifiable information like social security numbers and patient data, and, as IT managers of medical offices can probably attest, they may not have the resources to afford dedicated cybersecurity staff, making them attractive to cybercriminals looking for vulnerable targets.
But, HIPAA requirements and cybersecurity aren’t the only reason to back up your medical practice’s data—your data is one of your most important assets and making sure it’s safe and accessible keeps your practice running smoothly.
Whether you outsource some of your IT tasks, like backups, to a managed service provider (MSP) or you manage everything in house with network attached storage (NAS) or other hardware, understanding backup best practices and the different cloud options available can help you make the best decisions to protect your important data.
In this guide for backing up medical offices, learn more about:
- Records retention.
- Backup strategies.
- Backing up NAS devices.
- Working with MSPs.
How Long Should a Medical Office Keep Records?
One of the first pieces of the puzzle to understand when planning your data backup strategy is how long you’ll need to keep medical records and the regulatory requirements that govern retention.
Unfortunately, there’s no standard timeline, and there are a lot of factors to consider. Each state has different rules and statute limitations. Some federal regulations apply as well. And different patients will fall under different guidelines—namely, you’ll probably want to retain records longer for minors. The easiest answer is to retain records for as long as the strictest rule applies.
Start to develop your retention policy by checking the state and federal regulations that may apply to your practice. The American Health Information Management Association provides a comprehensive guide on all of the state, federal, accreditation agency, and other regulations that apply to retention requirements here.
With all of these moving parts and an ever-growing data set, managing data storage for medical offices within budget can be a notorious balancing act. But, today, affordable cloud storage is making it easier for medical practices to establish much simpler and more robust retention strategies rather than fine-tuning and calibrating their strategies to manage data with limited on-premises resources.
What Is the HIPAA Regulation for Storage of Medical Records?
A common misconception is that HIPAA stipulates retention requirements for medical records. HIPAA does not govern how long medical records must be retained, but it does govern how long HIPAA-related documentation must be retained. Any HIPAA-related documentation, including things like policies, procedures, authorization forms, etc., must be retained for six years according to guidance in HIPAA policy § 164.316(b)(2)(i) on time limits. Some states may have longer or shorter retention periods. If your state’s period is shorter, HIPAA supersedes state regulations.
How Long Does a Medical Office Need to Keep Insurance EOBs?
Explanations of benefits, or EOBs, are documents from insurance providers that explain the amounts insurance providers will pay for services. Retention periods for these documents vary by state as well. Additionally, insurance providers may stipulate how long records must be kept.
The 3-2-1 Backup Strategy
If understanding how long you need to keep records is the first step in structuring your medical practice’s backup plan, the second is understanding what a good backup strategy looks like.
The 3-2-1 backup strategy is a tried and true method for protecting data. It means keeping at least three copies of your data on two different media (i.e. devices) with at least one off-site, generally in the cloud. For a medical office, we can use a simple X-ray file as an example. That file should live on two different devices on-premises, let’s say a machine reserved for storing X-rays which backs up to a NAS device. That’s two copies. If you then back up your NAS device to cloud storage, that’s your third, off-site copy.
The Benefits of Backing Up Your Medical Office
You might wonder why you need three copies. There are some compelling benefits that make a strong case for using a 3-2-1 strategy rather than hoping for the best with fewer copies of your data.
- Fast access to files. When you accidentally delete a file, you can restore it quickly from either your on-site or cloud backup. And if you need a file while you’re away from your desk, you can simply log in to your cloud backup and access it immediately.
- Quick recoveries from computer crashes. Keeping one copy on-site means you can quickly restore files if one of your machines crashes. You can start up another computer and get immediate access, or you can restore all of the files to a replacement computer.
- Reliable recoveries from damage and disaster. Floods, fires, and other disasters do happen. With a copy off-site, your data is one less thing you have to worry about in that unfortunate event. You can access your files remotely if needed and restore them completely when you are able.
- Safe recoveries from ransomware attacks. Keeping an off-site copy in the cloud, especially if you take advantage of features like Object Lock, can better prepare you to recover from a ransomware attack.
- Compliance with regulatory requirements. As mentioned above, medical practices are subject to retention regulations. Using a cloud backup solution that offers AES encryption helps your practice achieve compliance.
What Are the HIPAA Regulations for Backups and Disaster Recovery?
The HIPAA Security Final Rule, which went into full effect in 2005, and the HITECH Act of 2009 outline specific requirements for how medical practices protect the privacy and security of patient information. The HIPAA text that applies to backups and disaster recovery can be found here and the HITECH Act can be found here. There are three main requirements:
- Medical offices must have a data backup plan. The rule states that you must “maintain retrievable exact copies of electronic protected health information.”
- Data at rest must be encrypted.
- Medical offices must have a disaster recovery plan where data can be restored in a loss event.
You also need to document these procedures and test them regularly. Cloud backups help you achieve compliance with HIPAA and HITECH by keeping a copy of your data off-site while still retrievable.
Using NAS for Medical Offices
Many medical offices rely on NAS to manage their data on-site. NAS is essentially a computer connected to a network that provides file-based data storage services to other devices on the network. The primary strength of NAS is how simple it is to set up and deploy.
NAS is frequently the next step up for a small practice that is using external hard drives or direct attached storage, which can be especially vulnerable to drive failure. Moving up to NAS offers medical offices and independent practitioners a number of benefits, including:
- The ability to share files locally and remotely.
- 24/7 file availability.
- Data redundancy.
- Integrations with cloud storage that provides a location for necessary, automatic data backups.
If you’re interested in upgrading to NAS, check out our Complete NAS Guide for advice on provisioning the right NAS for your needs and getting the most out of it after you buy it.

Hybrid Cloud Strategy for Medical Practices: NAS + Cloud Storage
Most NAS devices come with cloud storage integrations that enable businesses to adopt a hybrid cloud strategy for their data. A hybrid cloud strategy uses a private cloud and public cloud in combination. To expand on that a bit, a hybrid cloud refers to a cloud environment made up of a mixture of typically on-premises, private cloud resources combined with third-party public cloud resources that use some kind of orchestration between them. In this case, your NAS device serves as the on-premises private cloud, as it’s dedicated to only you or your practice, and then you connect it to the public cloud.
Some cloud providers are already integrated with NAS systems. (Backblaze B2 Cloud Storage is integrated with NAS systems from Synology and QNAP, for example.) Check if your preferred NAS system is already integrated with a cloud storage provider to ensure setting up cloud backup, storage, and sync is as easy as possible.
Your NAS should come with a built-in backup manager, like Hyper Backup from Synology or Hybrid Backup Sync from QNAP. Once you download and install the appropriate backup manager app, you can configure it to send backups to your preferred cloud provider. You can also fine-tune the behavior of the backup jobs, including what gets backed up and how often.
Now, you can send backups to the cloud as a third, off-site backup and use your cloud instance to access files anywhere in the world with an internet connection.
Using an MSP for Medical Practices
Many medical practices choose to outsource some or all IT services to an MSP. Making the decision of whether or not to hire an MSP will depend on your individual circumstances and comfort level. Either way, coming to the conversation with an understanding of your backup needs and the cloud backup landscape can help.
When seeking out an MSP, make sure to ask about the cloud provider they’re using and how they charge for storage and data transfer. And if you’re not using an MSP, compare costs from different cloud providers to make sure you’re getting the most for your investment in backing up your data.
Cloud Storage and Your Medical Practice
Whether you’re managing your data infrastructure in house with NAS or other hardware, or you’re planning to outsource your IT needs to an MSP, cloud storage should be part of your backup strategy. To recap, having a third copy of your data off-site in the cloud gives you a number of benefits, including:
- Fast access to your files.
- Quick recoveries from computer crashes.
- Reliable recoveries from natural disasters and theft.
- Protection from ransomware.
- Compliance with HIPAA requirements and other federal and state regulations.
Have questions about choosing a cloud storage provider to back up your medical practice? Let us know in the comments. Ready to get started? Click here to get your first 10GB free with Backblaze B2.
The post Backup Solutions for Medical Offices appeared first on Backblaze Blog | Cloud Storage & Cloud Backup.
What’s New in InsightIDR: Q1 2022 in Review
Post Syndicated from Margaret Wei original https://blog.rapid7.com/2022/04/05/whats-new-in-insightidr-q1-2022-in-review/
Introducing new InsightIDR capabilities to accelerate your detection and response program

When we talk to customers and security professionals about what they need more of in their security operations center (SOC), there is one consistent theme: time. InsightIDR — Rapid7’s leading cloud SIEM and XDR — helps teams cut through the noise and accelerate their detection and response, without sacrificing comprehensive coverage across modern environments and advanced attacks. This Q1 2022 recap post digs into some of the latest investments we’ve made to drive tangible time savings for customers, while still leveling up your detection and response program with InsightIDR.
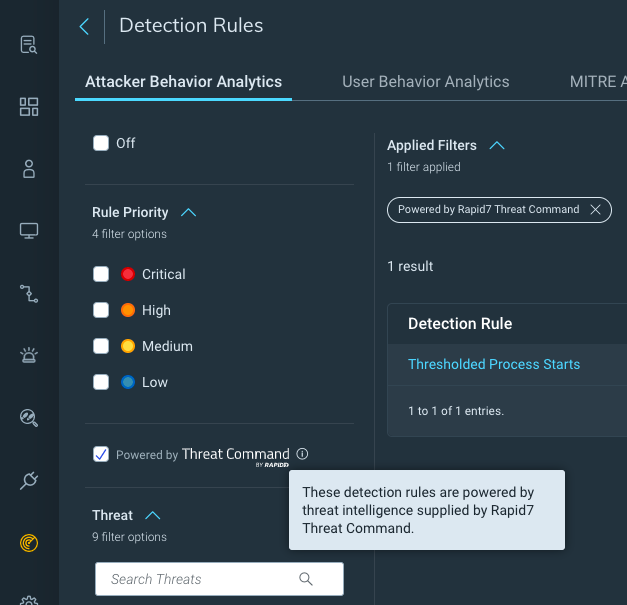
New InsightIDR Detections powered by Threat Command by Rapid7’s TIP Threat Library
Following Rapid7’s 2021 acquisition of IntSights and their leading external threat intelligence solution, Threat Command, we are excited to provide InsightIDR customers with new built-in threat intelligence via Threat Command’s threat intelligence platform (TIP).
We have integrated Threat Command’s TIP ThreatLibrary into InsightIDR, bringing its threat intelligence content into our detection library to ensure Rapid7 InsightIDR and Managed Detection and Response (MDR) customers have the most up-to-date and comprehensive detection coverage, more visibility into new IOCs, and continued strength around signal-to-noise.
Using the combined threat intelligence research teams across Rapid7 Threat Command and our services organization, this content will be maintained and updated across the platform – ensuring our customers get real-time protection from evolving threats.
InsightIDR delivers superior signal-to-noise in latest MITRE Engenuity ATT&CK evaluation
We’re excited to share that InsightIDR has successfully completed the 2022 MITRE Engenuity ATT&CK Evaluation, which focused on how adversaries abuse data encryption for exploitation and/or ransomware. This evaluation tested InsightIDR’s EDR capabilities (powered by our native endpoint agent, the Insight Agent) and our ability to detect these advanced attacks. A few key takeaways and result highlights:
- InsightIDR demonstrated solid visibility across the cyber kill chain – with visibility across 18 of the 19 phases covered across both simulations.
- Consistently identified threats early, with alerts firing in the first phase – Initial Compromise – for both the Wizard Spider and Sandworm attacks.
- Showcased our commitment to signal-to-noise – with targeted and focused detections across each phase of the attack (versus firing loads of alerts for every minute substep).
As our customers know, EDR is just one component of the detection coverage unlocked with InsightIDR. While beyond the scope of this evaluation, beyond endpoint coverage, InsightIDR delivers defense in depth across users and log activity, network, and cloud. Learn more about InsightIDR’s MITRE evaluation results in our recent blog post.
Investigate in seconds with Quick Actions powered by InsightConnect
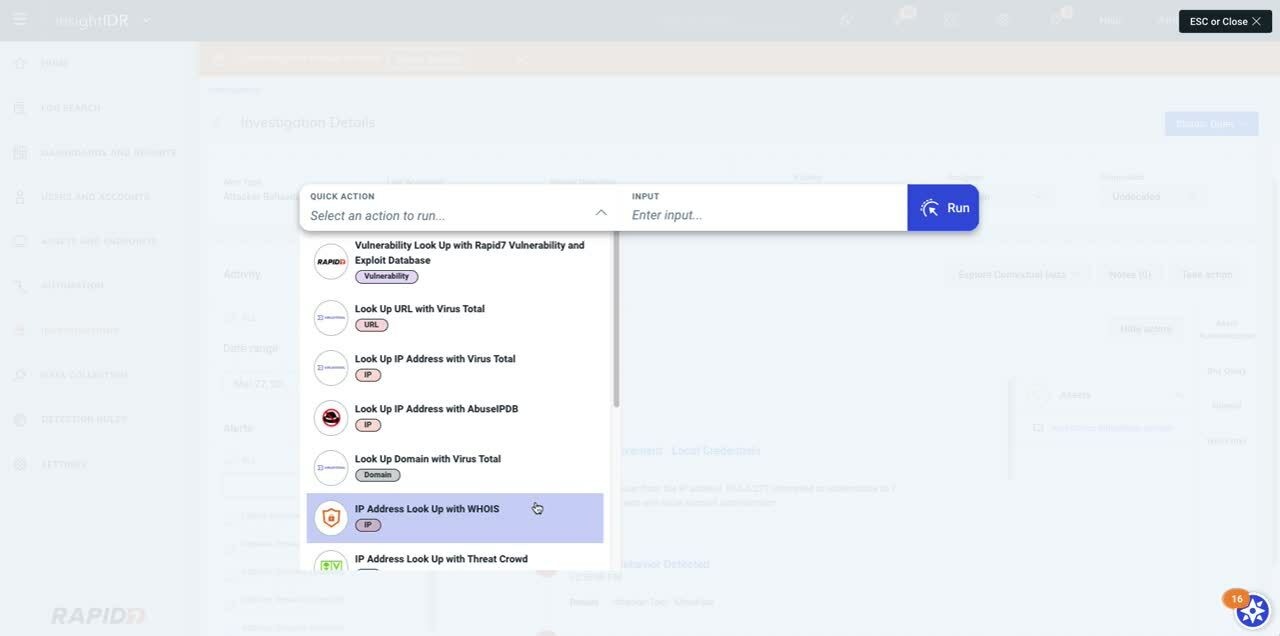
InsightIDR and InsightConnect teamed up to create Quick Actions, a new feature that provides instant automation within InsightIDR to reduce time to respond to investigations, all with the click of a button.
Quick Actions are pre-configured automation actions that customers can run within their InsightIDR instance to get the answers they need fast and make the investigative process more efficient, and there’s no configuration required. Some Quick Actions use cases include:
- Threat hunting within log search. Use the “Look Up File Hash with Threat Crowd” quick action to learn more about a hash within an endpoint log. If the output of the quick action finds the file hash is malicious, you can choose to investigate further.
- More context around alerts in Investigations. Use the “Look Up Domain with WHOIS” quick action to receive more context around an IP associated with an alert in an investigation.
More customizability with AWS GuardDuty detection rules
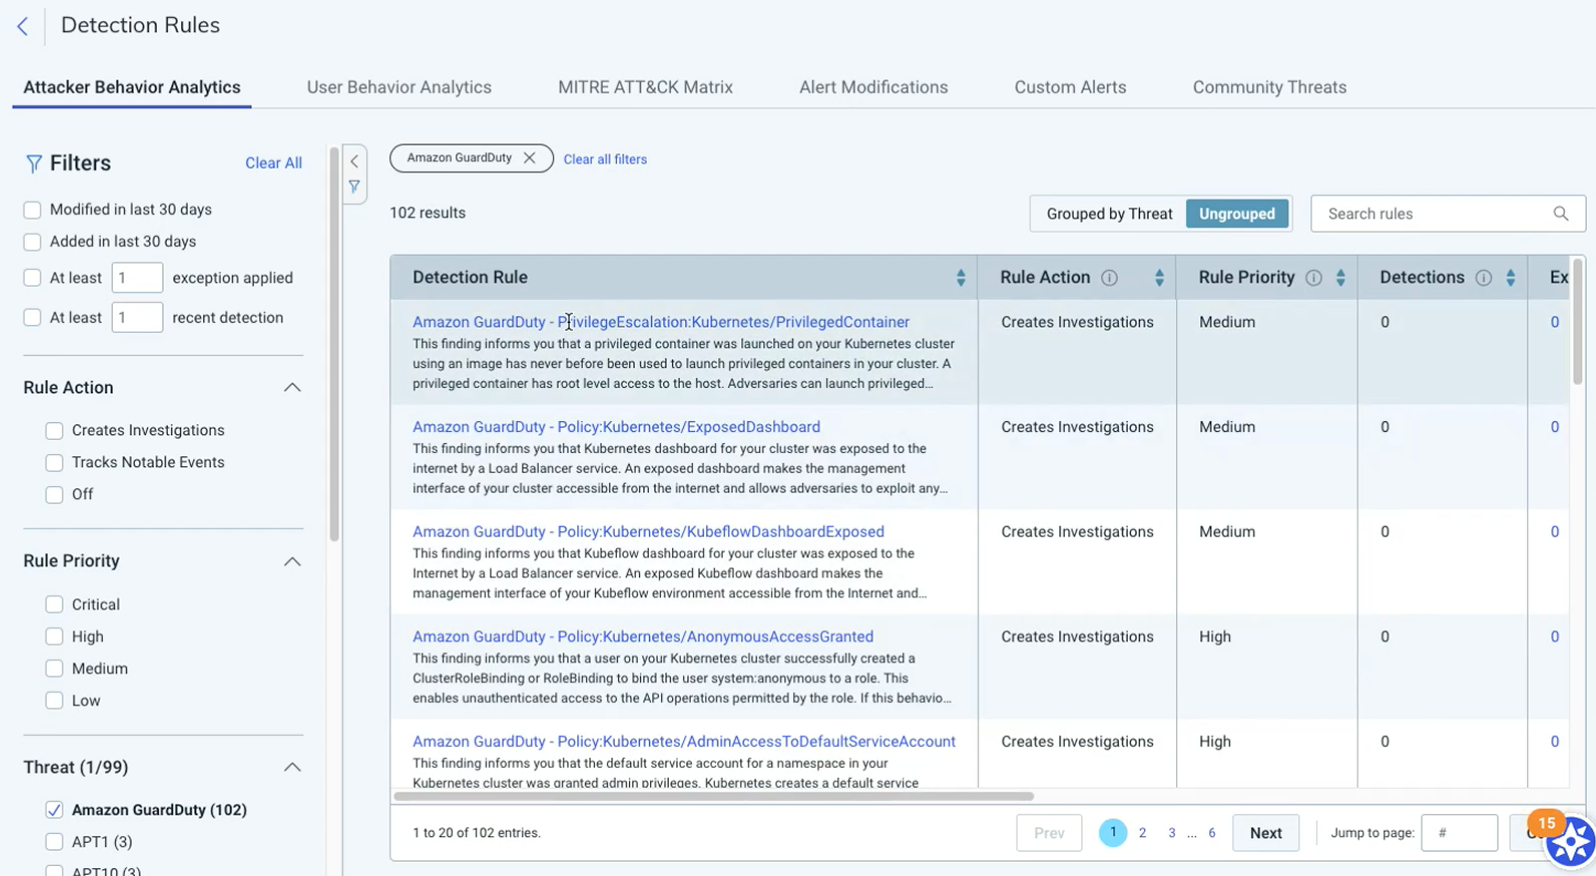
We now have over 100 new AWS GuardDuty Attacker Behavior Analytics (ABA) detection rules to provide significantly more customization and tuning ability for customers compared to our previous singular third-party AWS GuardDuty UBA detection rule. With these new ABA alerts, it’s possible to set rule actions, tune rule priorities, or add an exception on each individual GuardDuty detection rule.
New pre-built CIS control dashboards and overall dashboard improvements
We’re continually expanding our pre-built dashboard library to allow users to easily visualize their data within the context of common frameworks.
The CIS Critical Security Controls are a recommended set of actions for cyber defense that provide specific and actionable ways to thwart the most pervasive attacks. We know CIS is one of the most common security frameworks our customers consider, so we’ve recently added 3 new CIS control dashboards that cover CIS Control 5: Account Management, CIS Control 9: Email and Web Browser Protections, and CIS Control 10: Malware Defenses.
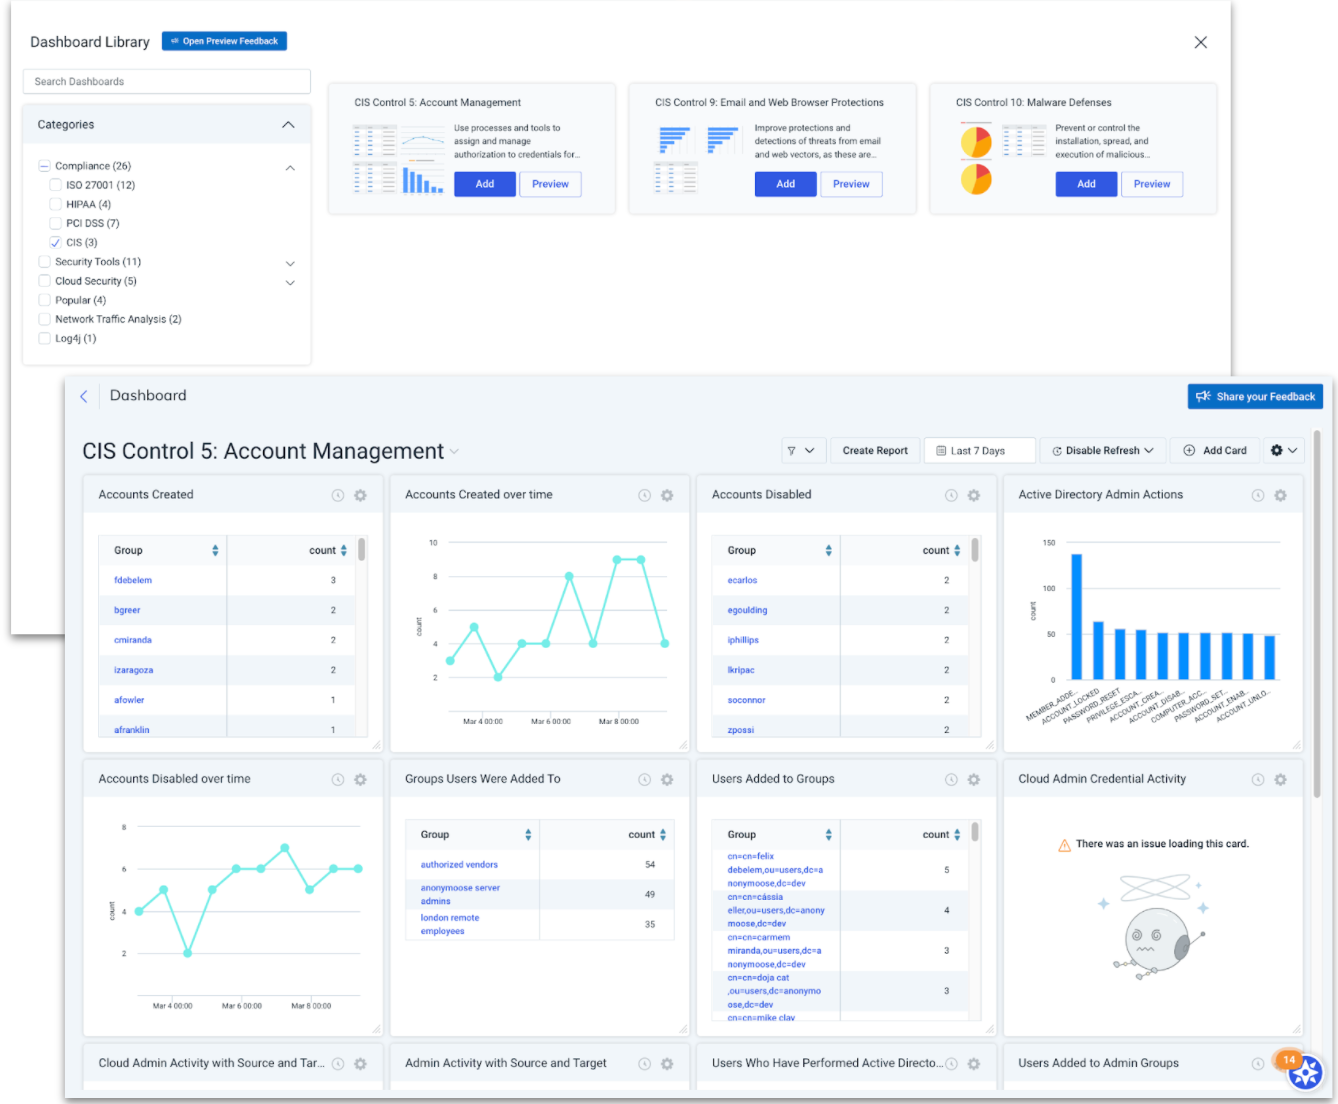
We also continue to make changes and additions to our overall Dashboard capabilities. Within the card builder, we’ve added the ability to:
- Change chart colors
- Add a chart caption
- Swap between linear and logarithmic scale for charts
- Add data labels on top of dashboard charts
Continuous improvements to Investigation Management
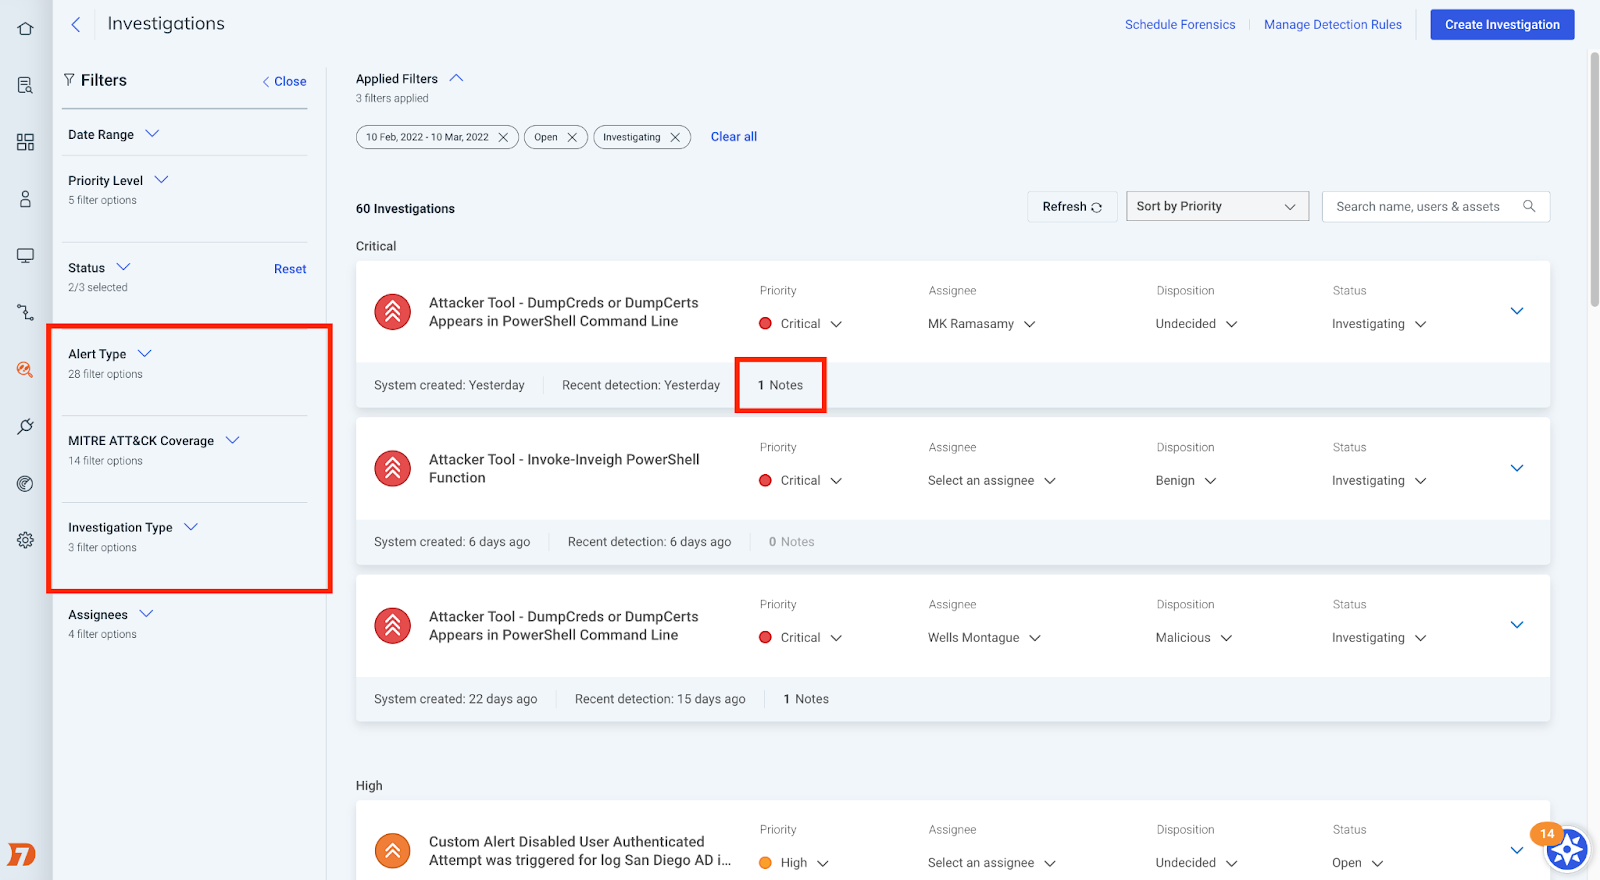
Another area we are continuously making improvements in is Investigation Management. A huge part of this ongoing development is customer feedback, and over the last quarter, we’ve made some additions to the experience based on just that. We’ve added:
- New filters for alert type, MITRE ATT&CK tactic, and investigation type to provide more options when it comes to tailoring the list view of investigations
- The new “notes count” feature, which allows customers to save time and track the status of an ongoing collaboration within an investigation
- Improvements to the bulk-close feature within Investigation Management, and new progress banners so you can easily track the status of each bulk-close request
Other updates
- New CATO Networks event source can now be configured to send InsightIDR WAN firewall and internet firewall data.
- Log Search Syntax Highlighting applies different colors and formatting to the distinct components of a LEQL query (such as the search logic and values) to improve overall readability and provide an easy way to identify potential errors within queries.
- New curated IDS Rules powered by the Insight Network Sensor help you detect activity associated with thousands of common pieces of malware.
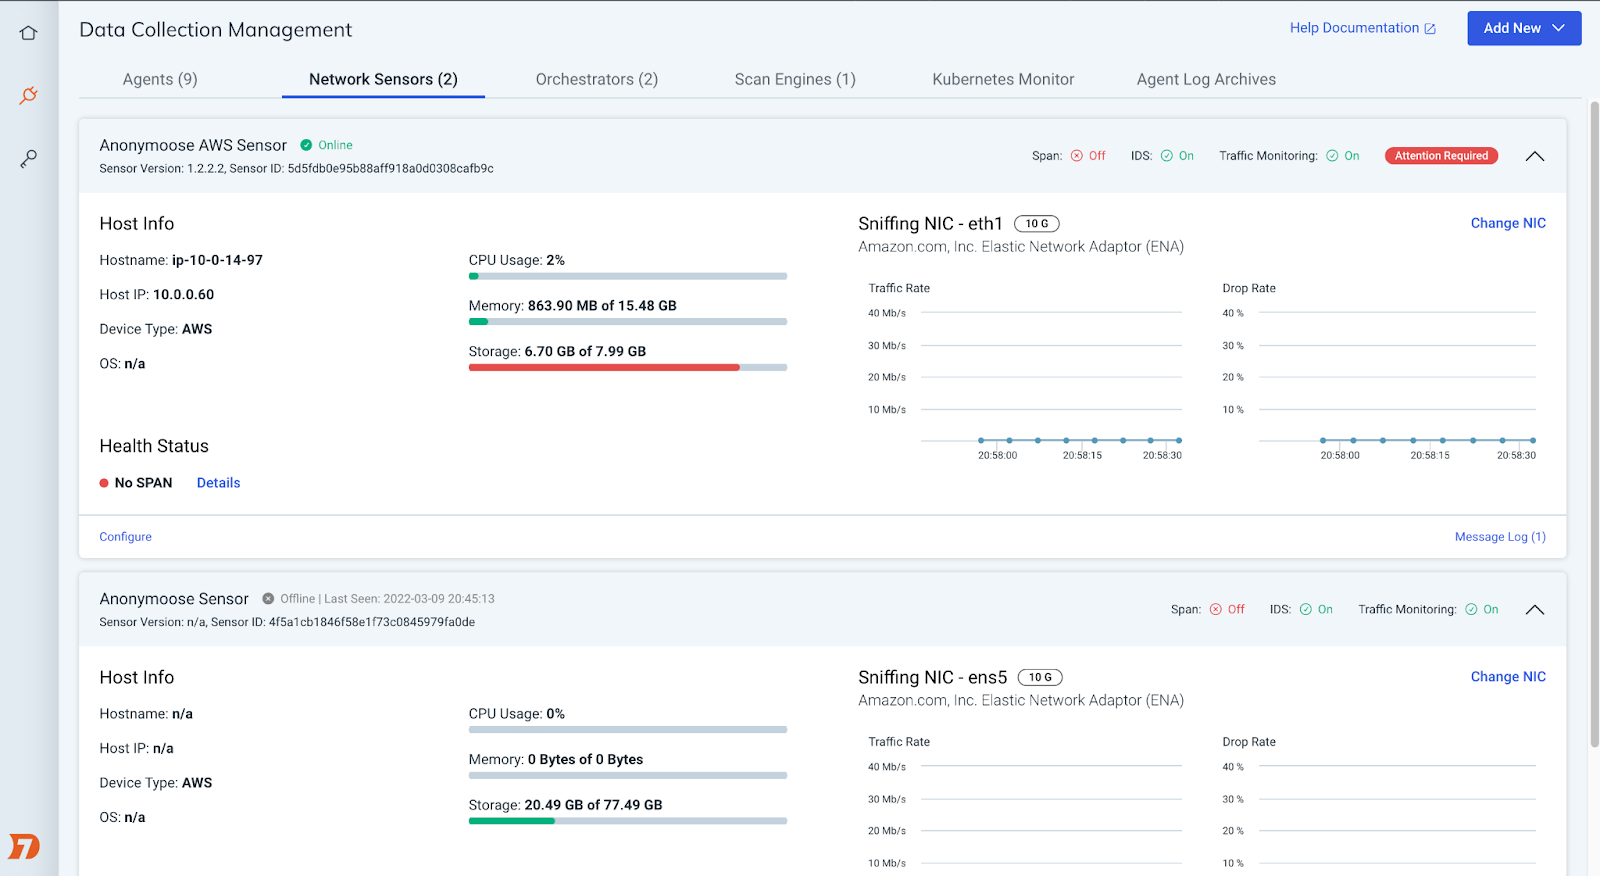
- Insight Network Sensor management page updates make it easier to deploy and maintain your fleet of Network Sensors. We’ve rebuilt the sensor management page to better surface critical configuration statuses, diagnostic information, and links to support documentation.
Stay tuned!
As always, we’re continuing to work on exciting product enhancements and releases throughout the year. Keep an eye on our blog and release notes as we continue to highlight the latest in detection and response at Rapid7.
Additional reading:
Firefox 99.0 released
Post Syndicated from original https://lwn.net/Articles/890268/
Version
99.0 of the Firefox browser has been released. “The Linux
sandbox has been strengthened: processes exposed to web content no longer
have access to the X Window system (X11)“.
Cook: Security things in Linux v5.10
Post Syndicated from original https://lwn.net/Articles/890261/
Kees Cook catches
up with the security-related changes in the 5.10 kernel, released at
the end of 2020.
With static branches, an if/else choice can be hard-coded, instead
of being run-time evaluated every time. Such branches can be
updated too (the kernel just rewrites the code to switch around the
“branch”). All these principles apply to static calls as well, but
they’re for replacing indirect function calls (i.e. a call through
a function pointer) with a direct call (i.e. a hard-coded call
address). This eliminates the need for Spectre mitigations
(e.g. RETPOLINE) for these indirect calls, and avoids a memory
lookup for the pointer. For hot-path code (like the scheduler),
this has a measurable performance impact. It also serves as a kind
of Control Flow Integrity implementation: an indirect call got
removed, and the potential destinations have been explicitly
identified at compile-time.
#Догансарай след сигнала ни към Комисията “Росенец” Проверката на МВР за Росенец и кея на Ахмед Доган е по данни на Биволъ
Post Syndicated from Николай Марченко original https://bivol.bg/%D0%BF%D1%80%D0%BE%D0%B2%D0%B5%D1%80%D0%BA%D0%B0%D1%82%D0%B0-%D0%BD%D0%B0-%D0%BC%D0%B2%D1%80-%D0%B7%D0%B0-%D1%80%D0%BE%D1%81%D0%B5%D0%BD%D0%B5%D1%86-%D0%B8-%D0%BA%D0%B5%D1%8F-%D0%BD%D0%B0-%D0%B0%D1%85.html
вторник 5 април 2022

Главна дирекция „Национална полиция“ (ГДНП) е приключила с проверката на казуса с лесопарк „Росенец“ и кея на почетния лидер на „Движение за права и свободи“ (ДПС) Ахмед Доган. ГДНП изпрати…
PIPEFAIL: How a missing shell option slowed Cloudflare down
Post Syndicated from Alex Forster original https://blog.cloudflare.com/pipefail-how-a-missing-shell-option-slowed-cloudflare-down/


At Cloudflare, we’re used to being the fastest in the world. However, for approximately 30 minutes last December, Cloudflare was slow. Between 20:10 and 20:40 UTC on December 16, 2021, web requests served by Cloudflare were artificially delayed by up to five seconds before being processed. This post tells the story of how a missing shell option called “pipefail” slowed Cloudflare down.
Background
Before we can tell this story, we need to introduce you to some of its characters.
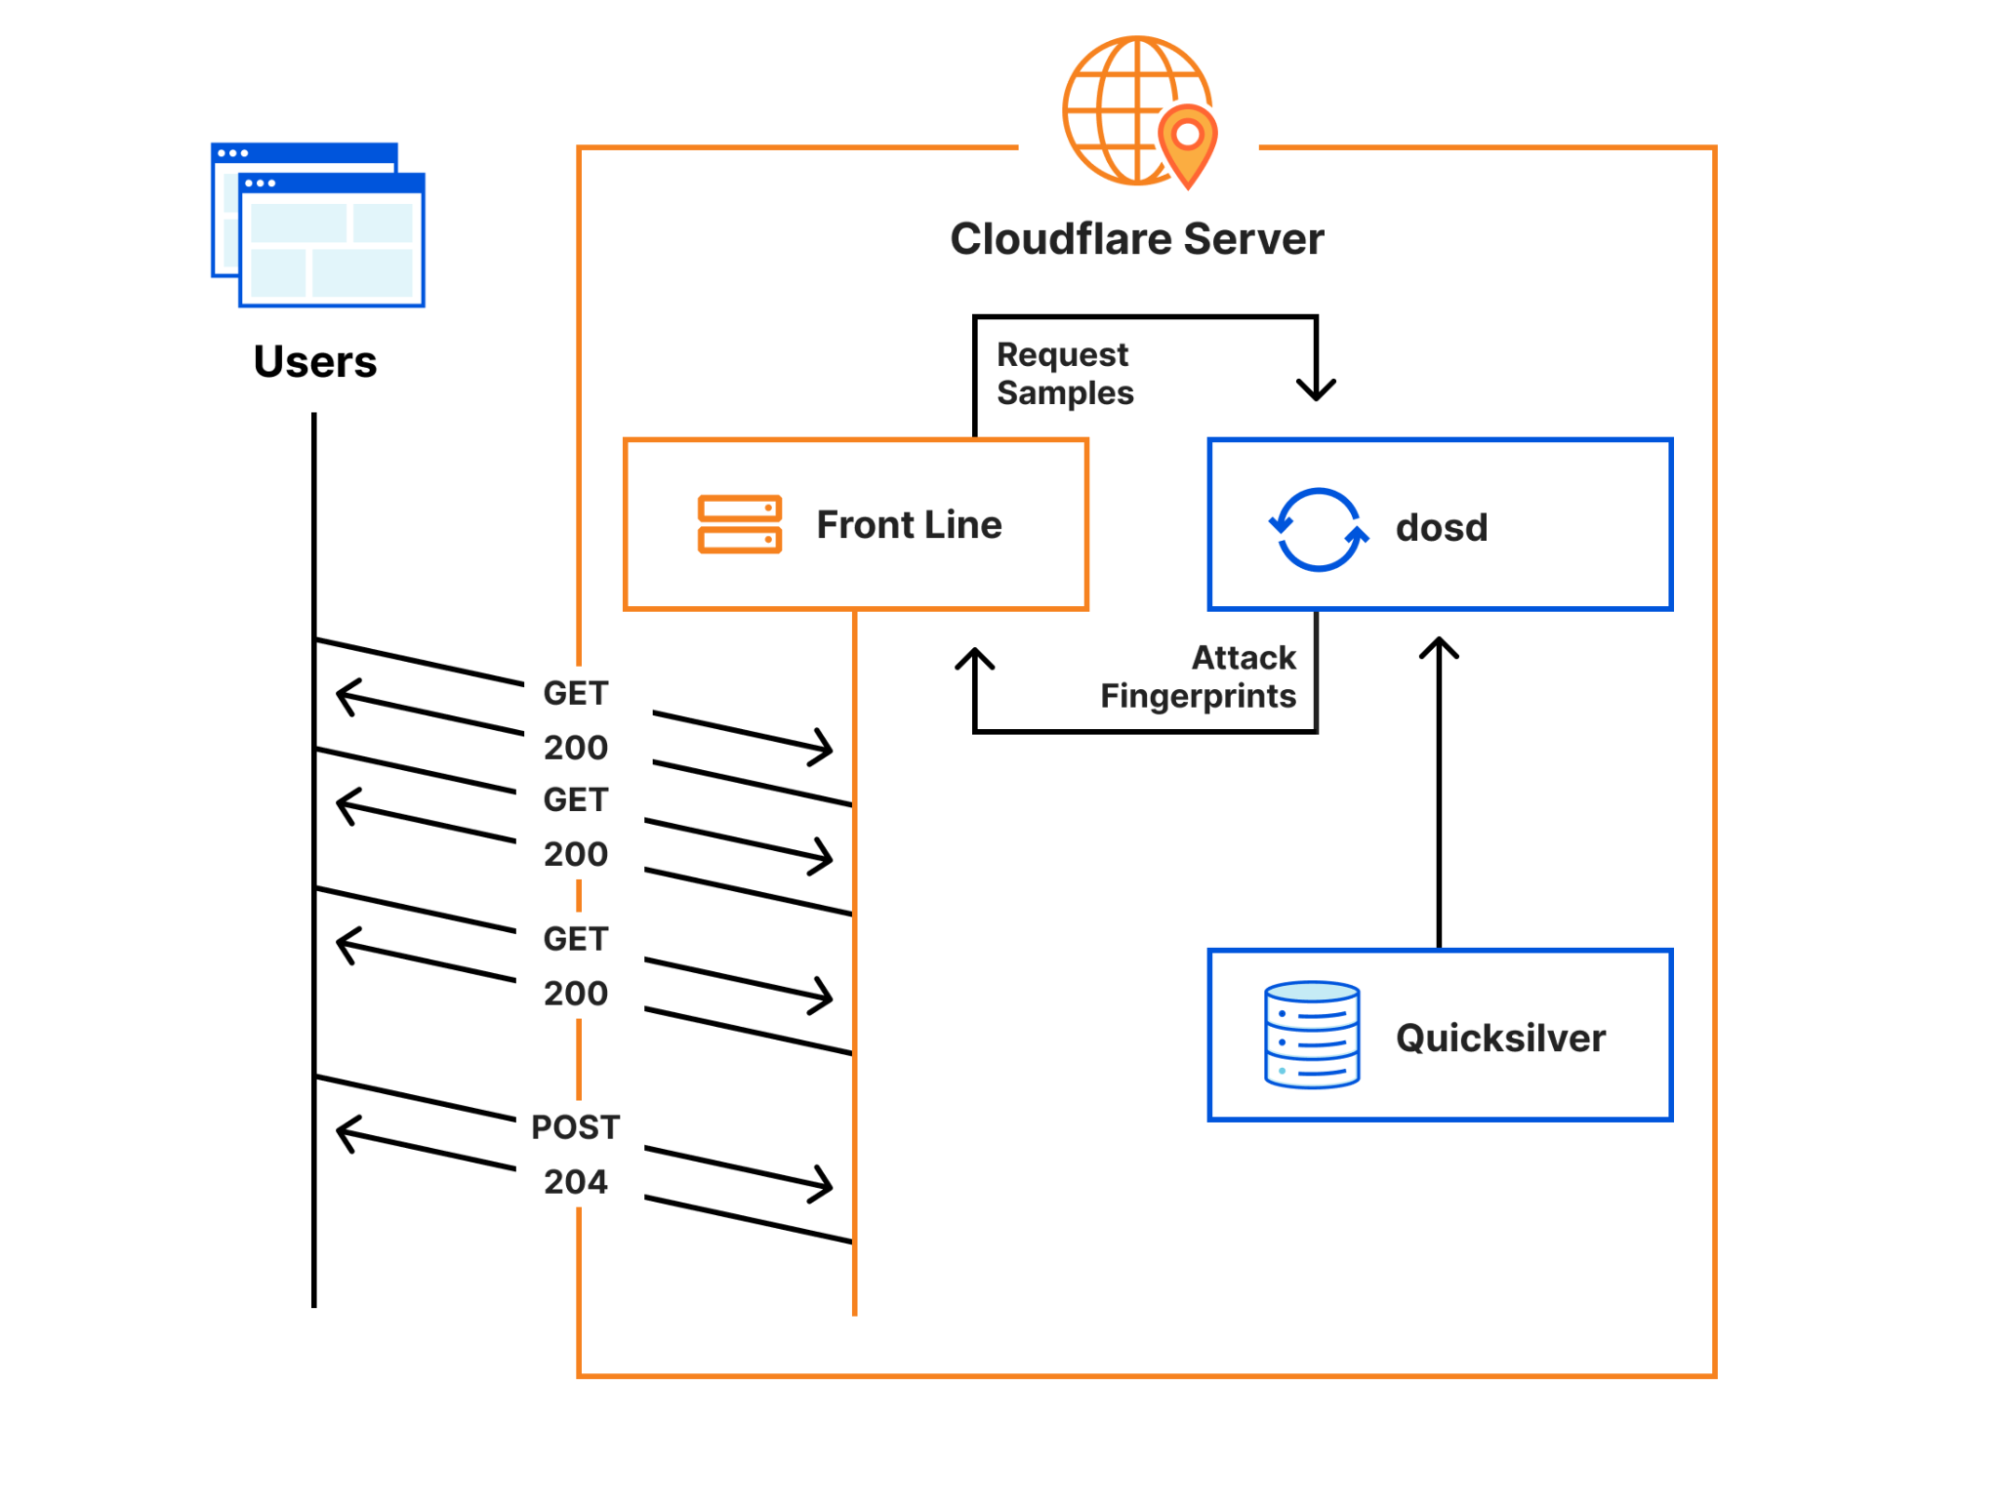
Cloudflare’s Front Line protects millions of users from some of the largest attacks ever recorded. This protection is orchestrated by a sidecar service called dosd, which analyzes traffic and looks for attacks. When dosd detects an attack, it provides Front Line with a list of attack fingerprints that describe how Front Line can match and block the attack traffic.
Instances of dosd run on every Cloudflare server, and they communicate with each other using a peer-to-peer mesh to identify malicious traffic patterns. This decentralized design allows dosd to perform analysis with much higher fidelity than is possible with a centralized system, but its scale also imposes some strict performance requirements. To meet these requirements, we need to provide dosd with very fast access to large amounts of configuration data, which naturally means that dosd depends on Quicksilver. Cloudflare developed Quicksilver to manage configuration data and replicate it around the world in milliseconds, allowing it to be accessed by services like dosd in microseconds.
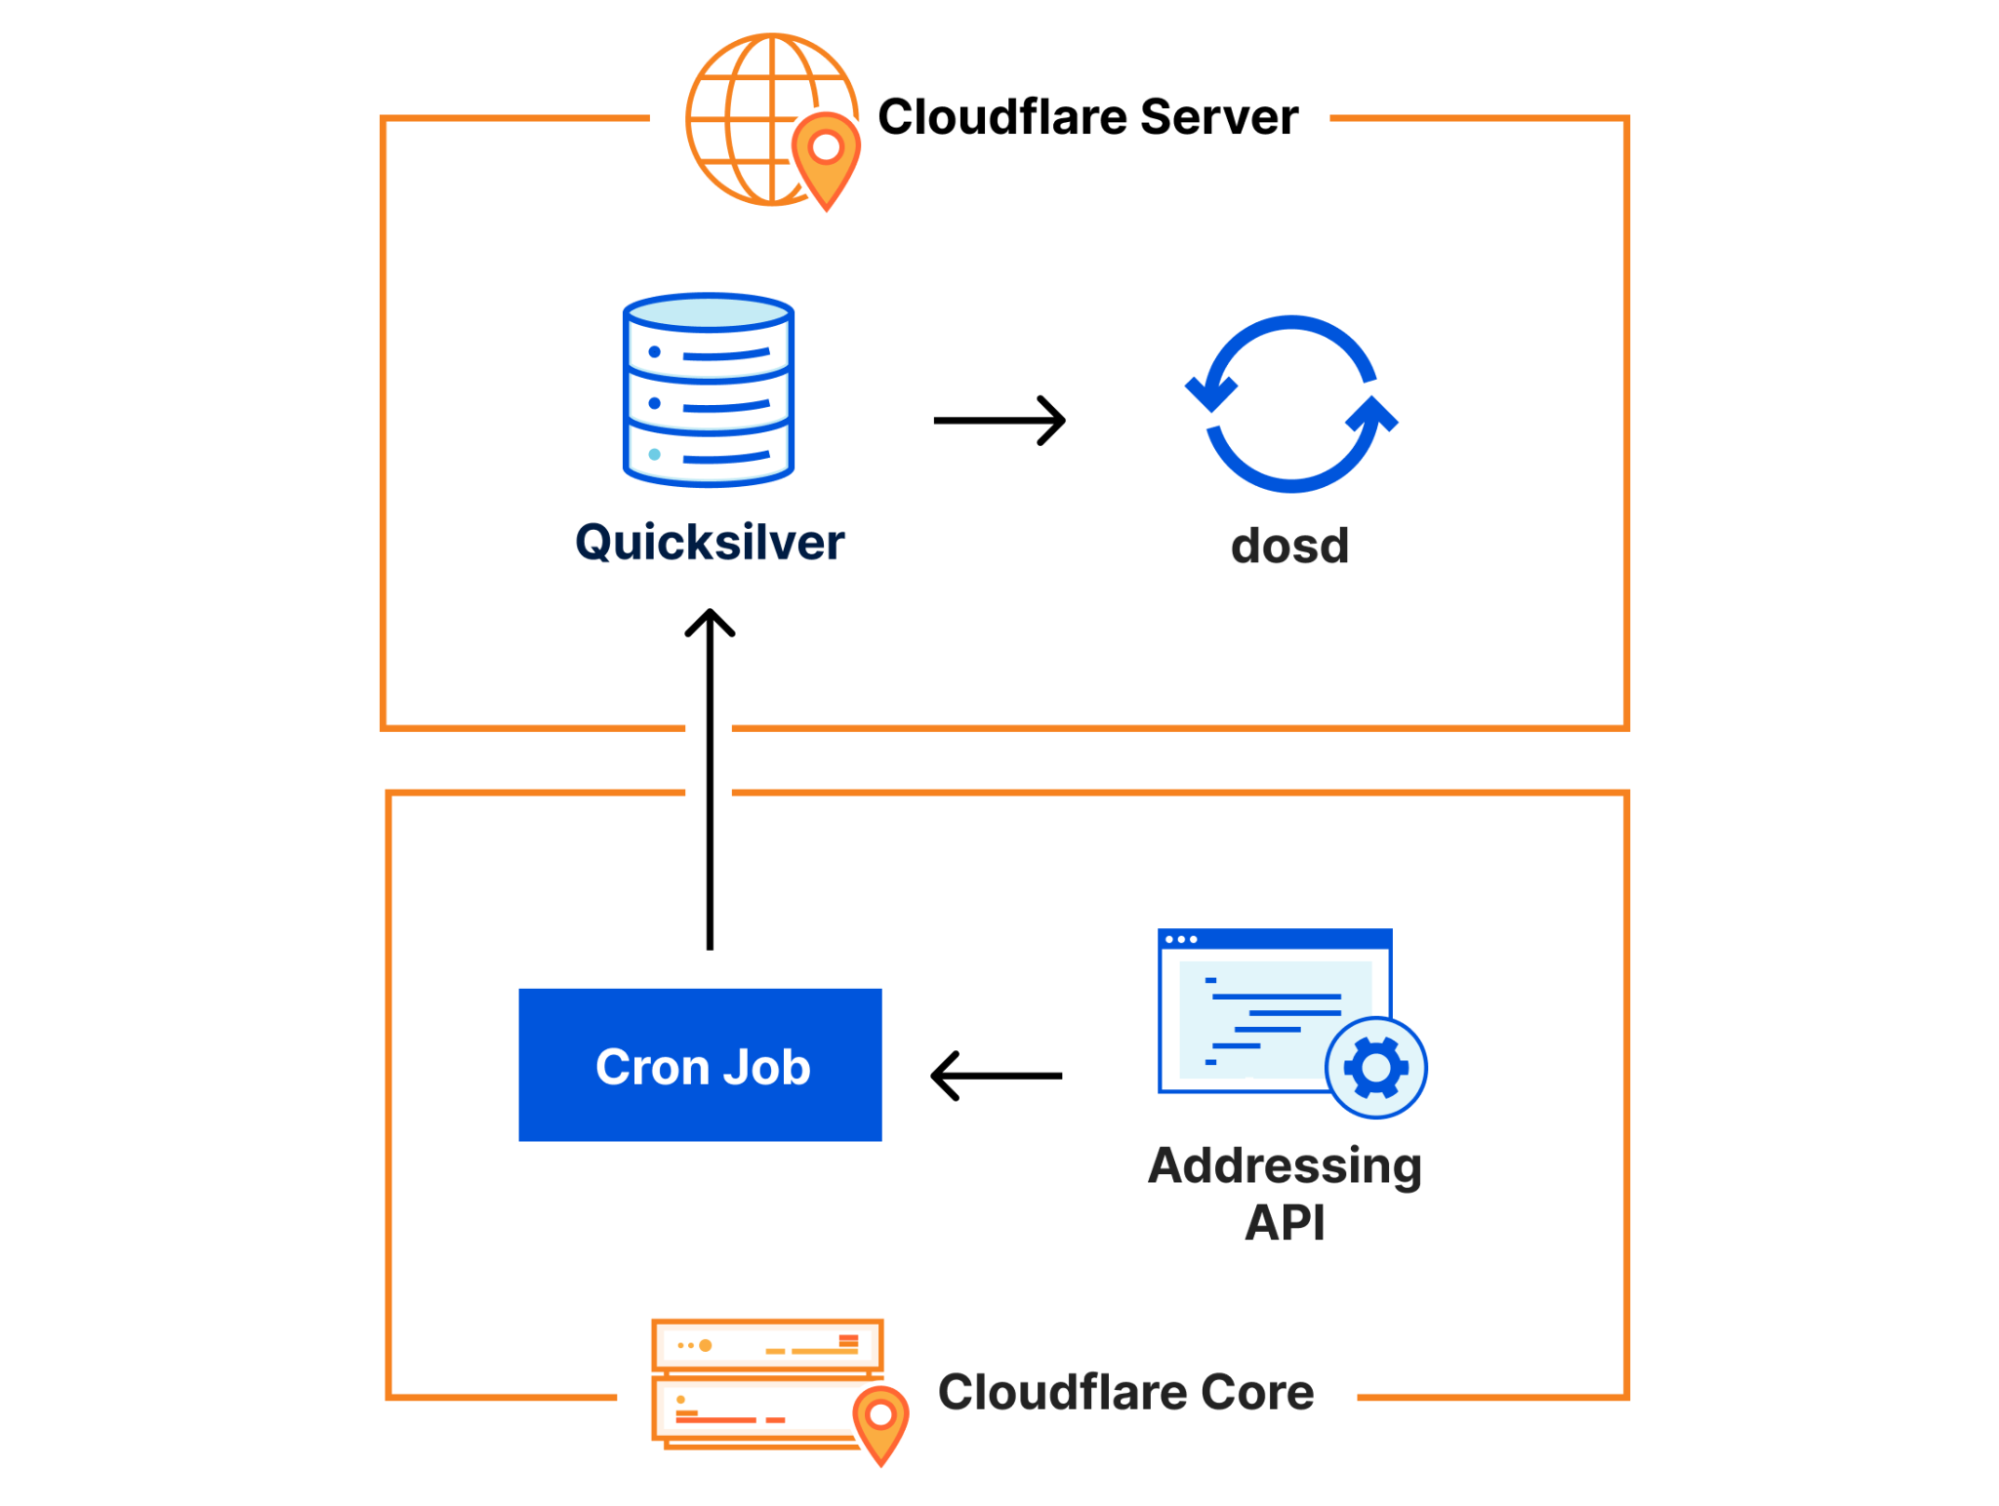
One piece of configuration data that dosd needs comes from the Addressing API, which is our authoritative IP address management service. The addressing data it provides is important because dosd uses it to understand what kind of traffic is expected on particular IPs. Since addressing data doesn’t change very frequently, we use a simple Kubernetes cron job to query it at 10 minutes past each hour and write it into Quicksilver, allowing it to be efficiently accessed by dosd.
With this context, let’s walk through the change we made on December 16 that ultimately led to the slowdown.
The Change
Approximately once a week, all of our Bug Fixes and Performance Improvements to the Front Line codebase are released to the network. On December 16, the Front Line team released a fix for a subtle bug in how the code handled compression in the presence of a Cache-Control: no-transform header. Unfortunately, the team realized pretty quickly that this fix actually broke some customers who had started depending on that buggy behavior, so the team decided to roll back the release and work with those customers to correct the issue.
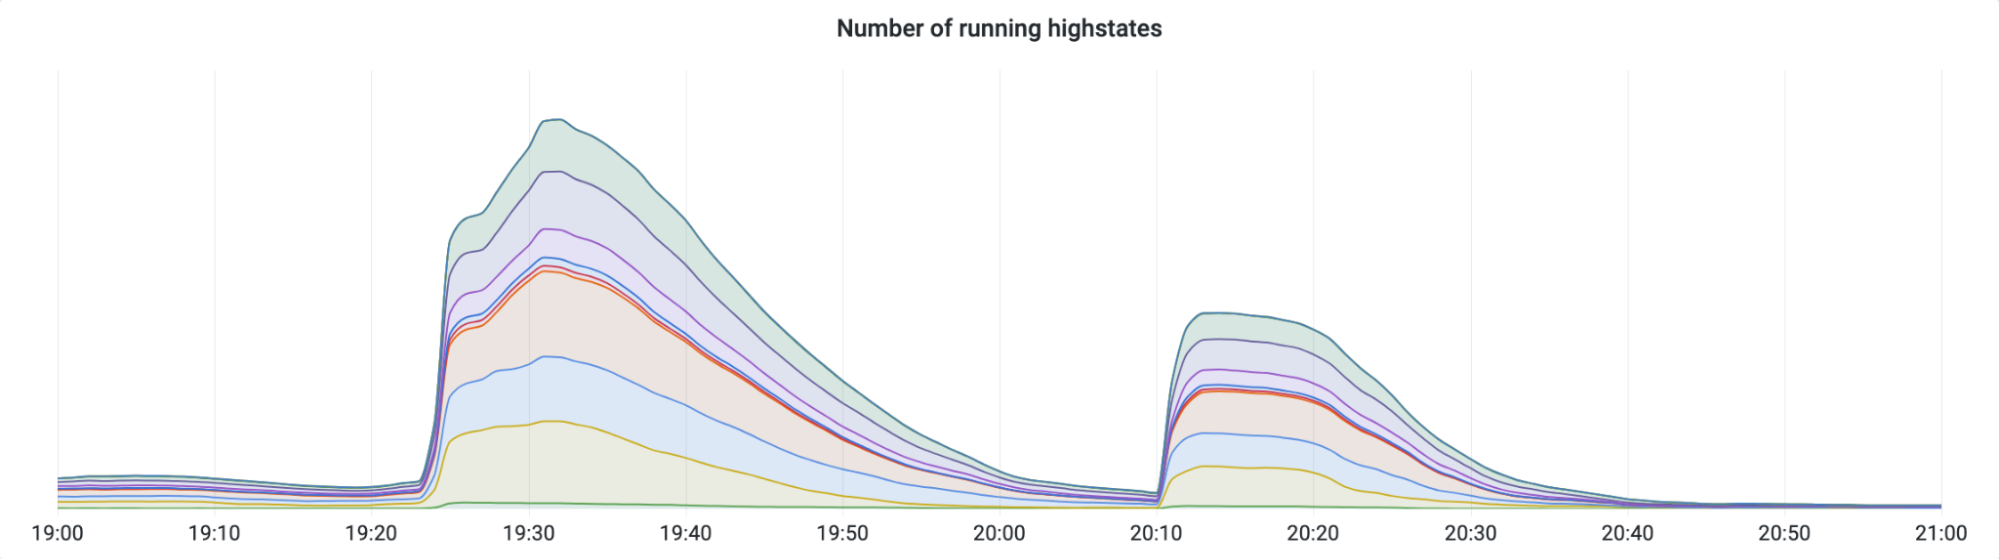
Here’s a graph showing the progression of the rollback. While most releases and rollbacks are fully automated, this particular rollback needed to be performed manually due to its urgency. Since this was a manual rollback, SREs decided to perform it in two batches as a safety measure. The first batch went to our smaller tier 2 and 3 data centers, and the second batch went to our larger tier 1 data centers.
SREs started the first batch at 19:25 UTC, and it completed in about 30 minutes. Then, after verifying that there were no issues, they started the second batch at 20:10. That’s when the slowdown started.
The Slowdown
Within minutes of starting the second batch of rollbacks, alerts started firing. “Traffic levels are dropping.” “CPU utilization is dropping.” “A P0 incident has been automatically declared.” The timing could not be a coincidence. Somehow, a deployment of known-good code, which had been limited to a subset of the network and which had just been successfully performed 40 minutes earlier, appeared to be causing a global problem.
A P0 incident is an “all hands on deck” emergency, so dozens of Cloudflare engineers quickly began to assess impact to their services and test their theories about the root cause. The rollback was paused, but that did not fix the problem. Then, approximately 10 minutes after the start of the incident, my team – the DOS team – received a concerning alert: “dosd is not running on numerous servers.” Before that alert fired we had been investigating whether the slowdown was caused by an unmitigated attack, but this required our immediate attention.
Based on service logs, we were able to see that dosd was panicking because the customer addressing data in Quicksilver was corrupted in some way. Remember: the data in this Quicksilver key is important. Without it, dosd could not make correct choices anymore, so it refused to continue.
Once we realized that the addressing data was corrupted, we had to figure out how it was corrupted so that we could fix it. The answer turned out to be pretty obvious: the Quicksilver key was completely empty.
Following the old adage – “did you try restarting it?” – we decided to manually re-run the Kubernetes cron job that populates this key and see what happened. At 20:40 UTC, the cron job was manually triggered. Seconds after it completed, dosd started running again, and traffic levels began returning to normal. We confirmed that the Quicksilver key was no longer empty, and the incident was over.
The Aftermath
Despite fixing the problem, we still didn’t really understand what had just happened.
Why was the Quicksilver key empty?
It was urgent that we quickly figure out how an empty value was written into that Quicksilver key, because for all we knew, it could happen again at any moment.
We started by looking at the Kubernetes cron job, which turned out to have a bug:
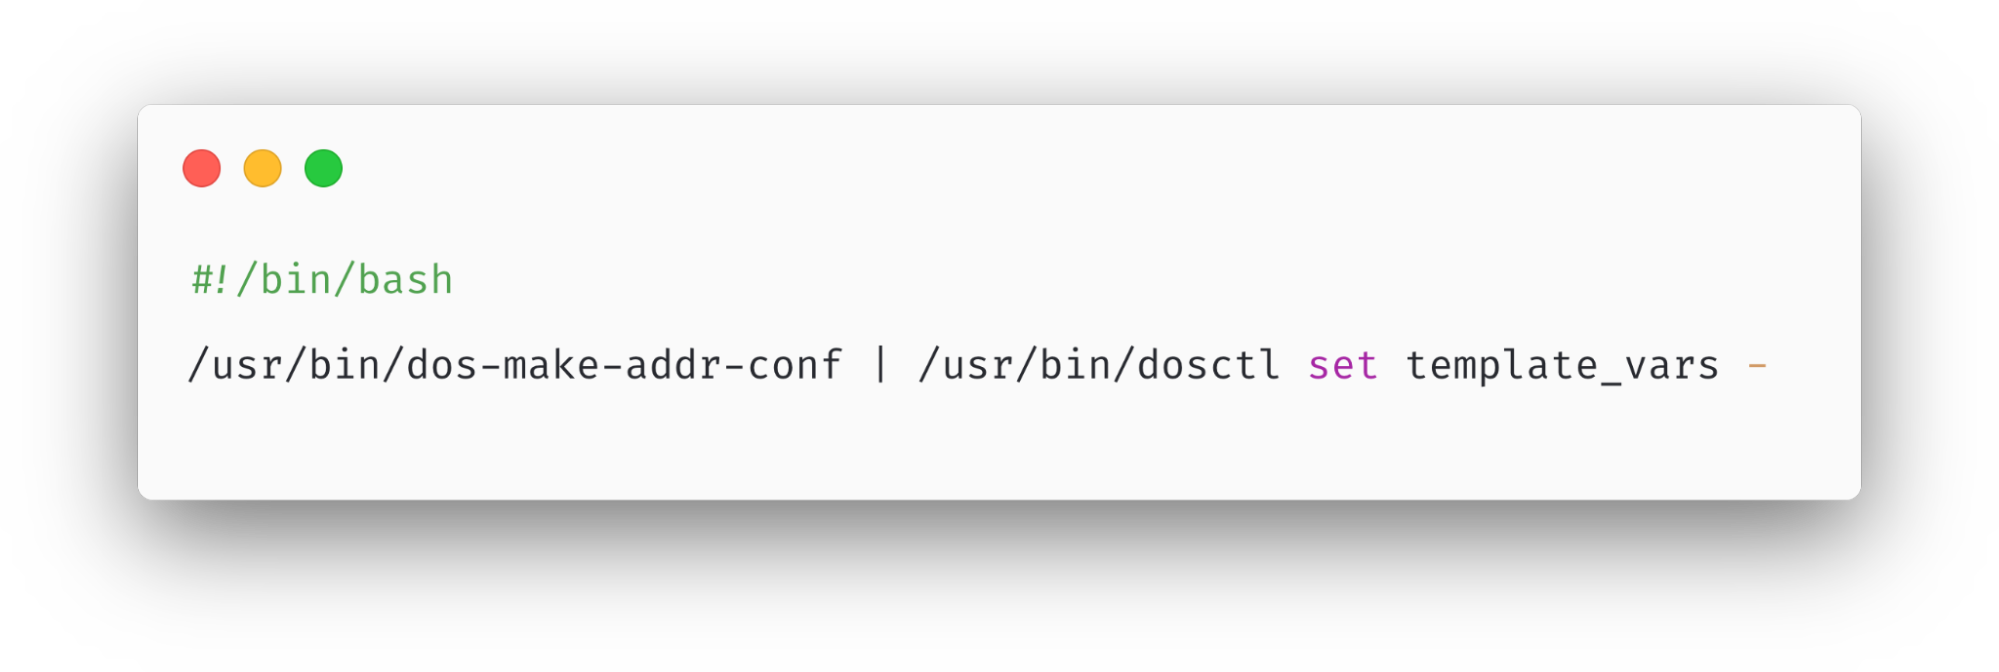
This cron job is implemented using a small Bash script. If you’re unfamiliar with Bash (particularly shell pipelining), here’s what it does:
First, the dos-make-addr-conf executable runs. Its job is to query the Addressing API for various bits of JSON data and serialize it into a Toml document. Afterward, that Toml is “piped” as input into the dosctl executable, whose job is to simply write it into a Quicksilver key called template_vars.
Can you spot the bug? Here’s a hint: what happens if dos-make-addr-conf fails for some reason and exits with a non-zero error code? It turns out that, by default, the shell pipeline ignores the error code and continues executing the next command! This means that the output of dos-make-addr-conf (which could be empty) gets unconditionally piped into dosctl and used as the value of the template_vars key, regardless of whether dos-make-addr-conf succeeded or failed.
30 years ago, when the first users of Bourne shell were burned by this problem, a shell option called “pipefail” was introduced. Enabling this option changes the shell’s behavior so that, when any command in a pipeline series fails, the entire pipeline stops processing. However, this option is not enabled by default, so it’s widely recommended as best practice that all scripts should start by enabling this (and a few other) options.
Here’s the fixed version of that cron job:
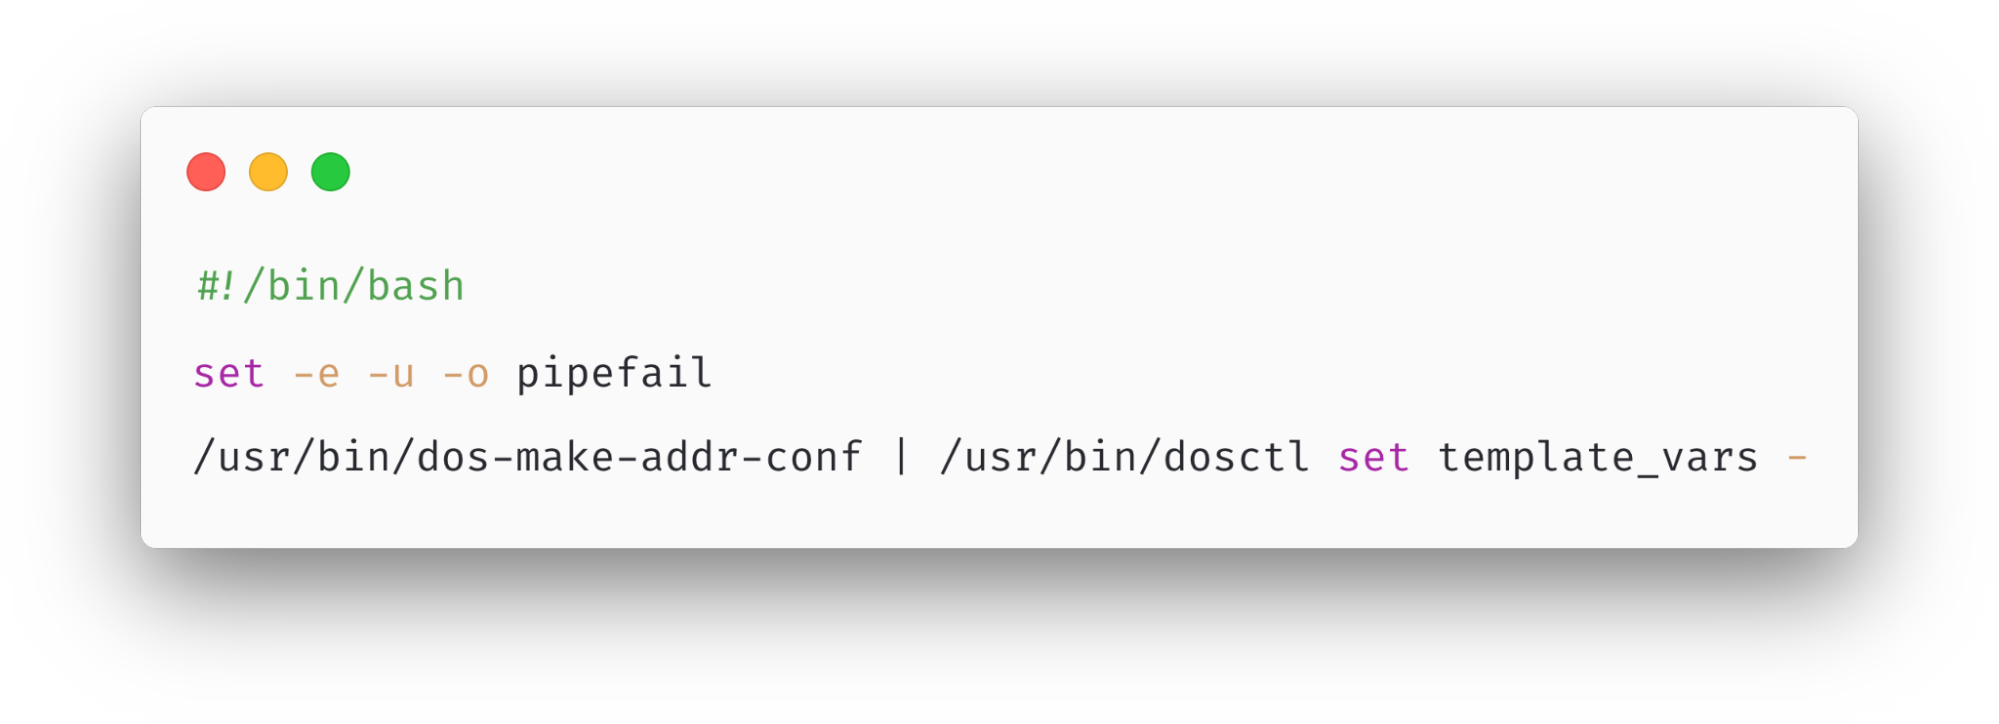
This bug was particularly insidious because dosd actually did attempt to gracefully handle the case where this Quicksilver key contained invalid Toml. However, an empty string is a perfectly valid Toml document. If an error message had been accidentally written into this Quicksilver key instead of an empty string, then dosd would have rejected the update and continued to use the previous value.
Why did that cause the Front Line to slow down?
We had figured out how an empty key could be written into Quicksilver, and we were confident that it wouldn’t happen again. However, we still needed to untangle how that empty key caused such a severe incident.
As I mentioned earlier, the Front Line relies on dosd to tell it how to mitigate attacks, but it doesn’t depend on dosd directly to serve requests. Instead, once every few seconds, the Front Line asynchronously asks dosd for new attack fingerprints and stores them in an in-memory cache. This cache is consulted while serving each request, and if dosd ever fails to provide fresh attack fingerprints, then the stale fingerprints will continue to be used instead. So how could this have caused the impact that we saw?
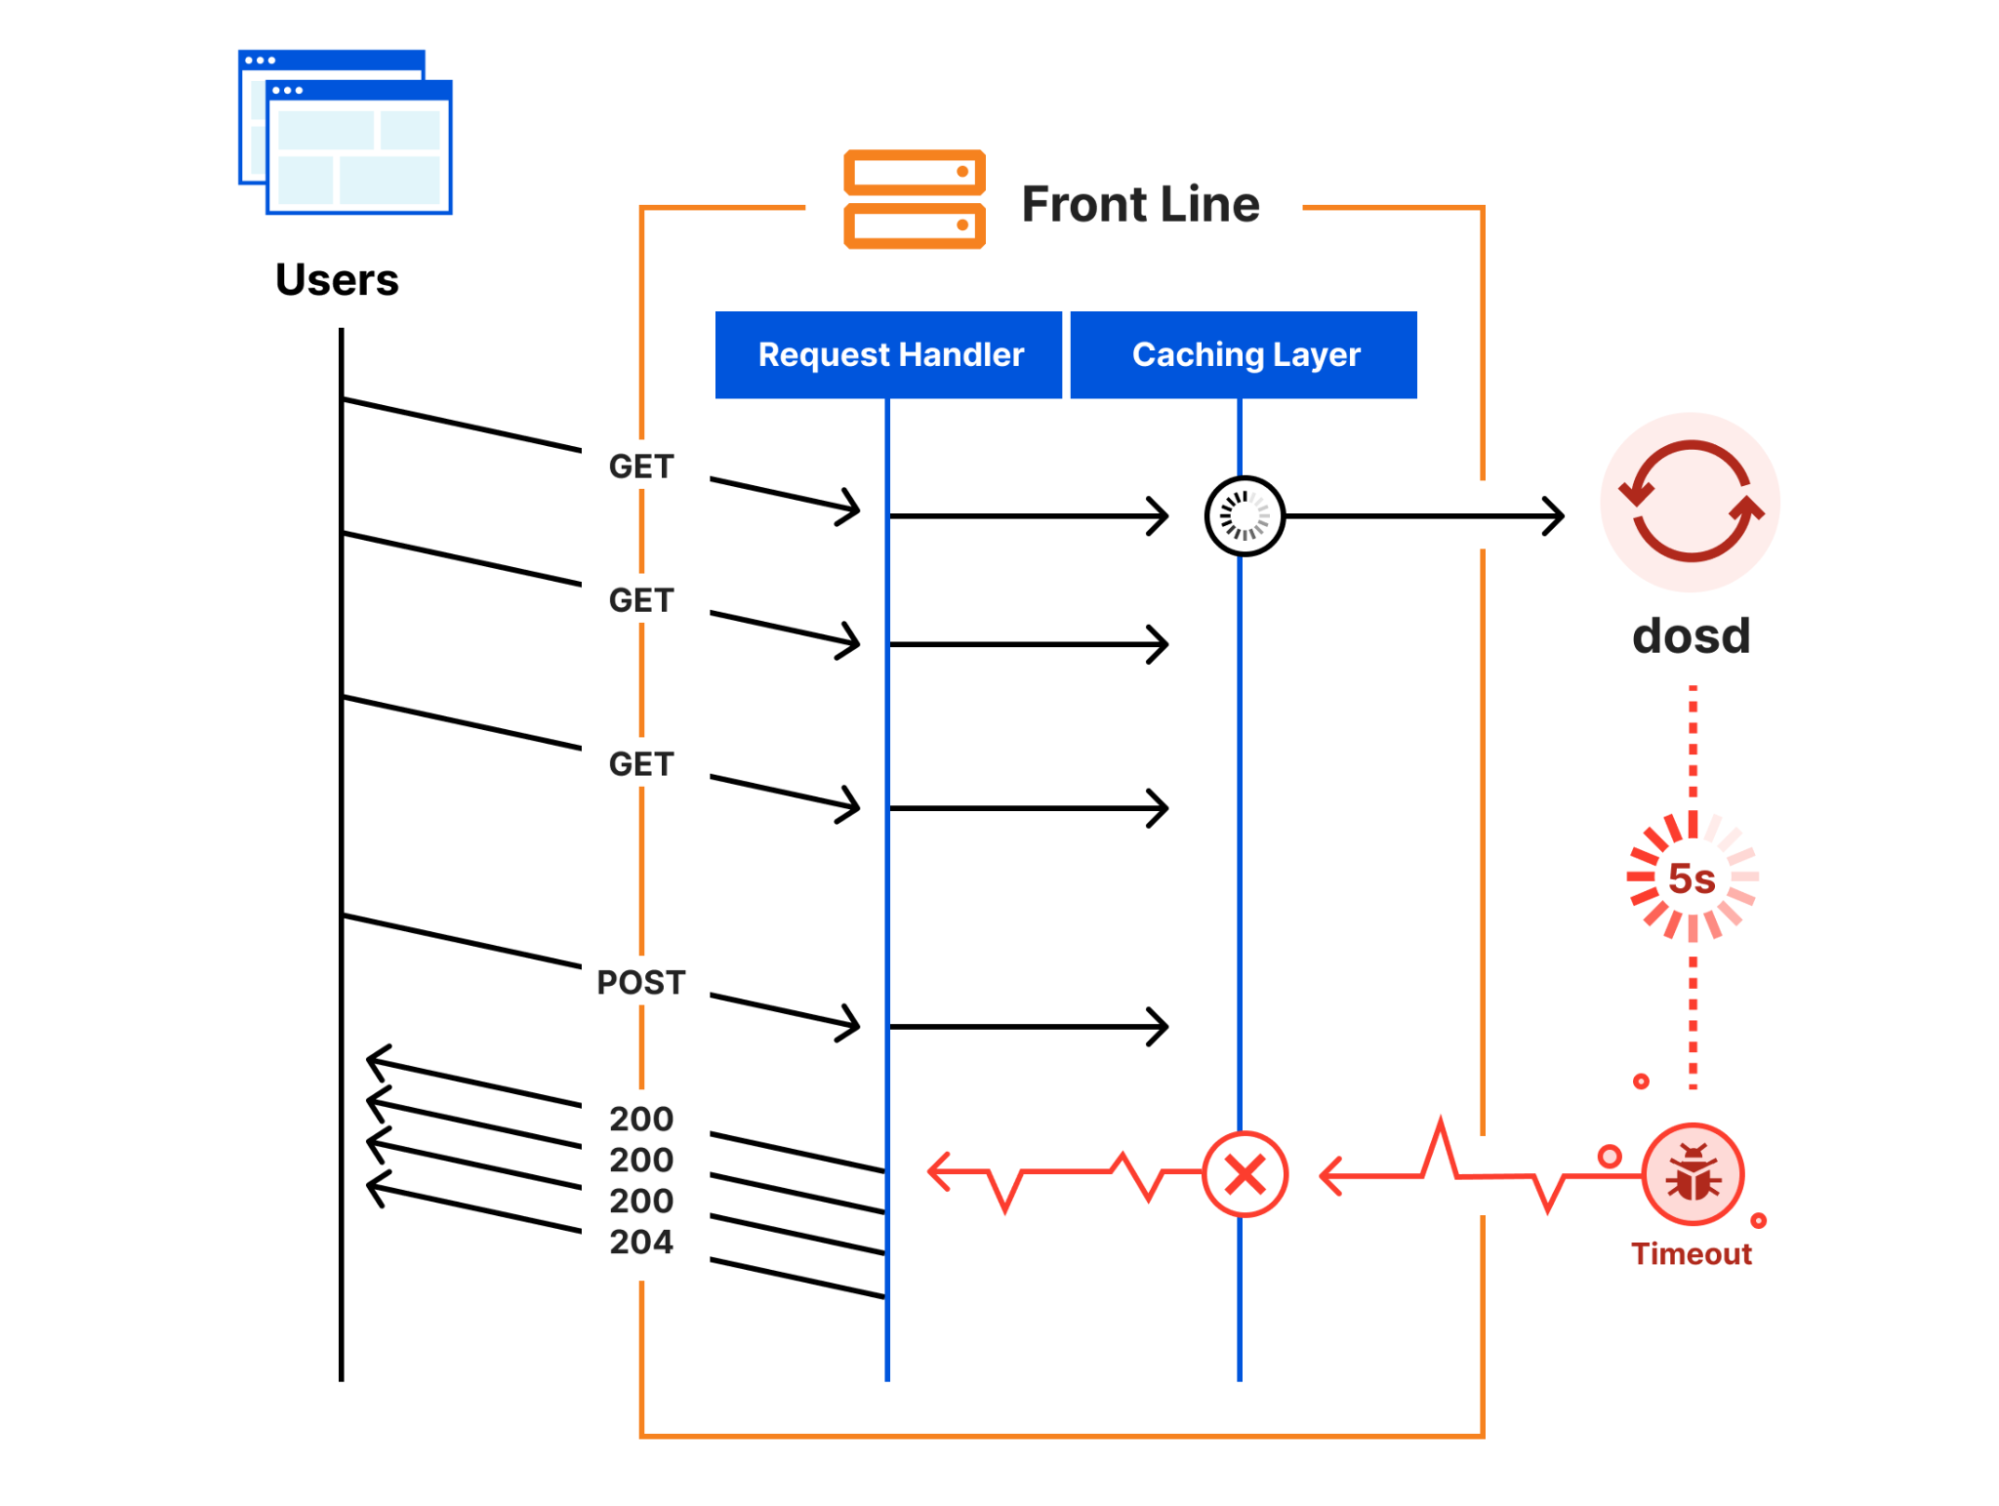
As part of the rollback process, the Front Line’s code needed to be reloaded. Reloading this code implicitly flushed the in-memory caches, including the attack fingerprint data from dosd. The next time that a request tried to consult with the cache, the caching layer realized that it had no attack fingerprints to return and a “cache miss” happened.
To handle a cache miss, the caching layer tried to reach out to dosd, and this is when the slowdown happened. While the caching layer was waiting for dosd to reply, it blocked all pending requests from progressing. Since dosd wasn’t running, the attempt eventually timed out after five seconds when the caching layer gave up. But in the meantime, each pending request was stuck waiting for the timeout to happen. Once it did, all the pending requests that were queued up over the five-second timeout period became unblocked and were finally allowed to progress. This cycle repeated over and over again every five seconds on every server until the dosd failure was resolved.
To trigger this slowdown, not only did dosd have to fail, but the Front Line’s in-memory cache had to also be flushed at the same time. If dosd had failed, but the Front Line’s cache had not been flushed, then the stale attack fingerprints would have remained in the cache and request processing would not have been impacted.
Why didn’t the first rollback cause this problem?
These two batches of rollbacks were performed by forcing servers to run a Salt highstate. When each batch was executed, thousands of servers began running highstates at the same time. The highstate process involves, among other things, contacting the Addressing API in order to retrieve various bits of customer addressing information.
The first rollback started at 19:25 UTC, and the second rollback started 45 minutes later at 20:10. Remember how I mentioned that our Kubernetes cron job only runs on the 10th minute of every hour? At 21:10 – exactly the time that our cron job started executing – thousands of servers also began to highstate, flooding the Addressing API with requests. All of these requests were queued up and eventually served, but it took the Addressing API a few minutes to work through the backlog. This delay was long enough to cause our cron job to time out, and, due to the “pipefail” bug, inadvertently clobber the Quicksilver key that it was responsible for updating.
To trigger the “pipefail” bug, not only did we have to flood the Addressing API with requests, we also had to do it at exactly 10 minutes after the hour. If SREs had started the second batch of rollbacks a few minutes earlier or later, this bug would have continued to lay dormant.
Lessons Learned
This was a unique incident where a chain of small or unlikely failures cascaded into a severe and painful outage that we deeply regret. In response, we have hardened each link in the chain:
- A manual rollback inadvertently triggered the thundering herd problem, which overwhelmed the Addressing API. We have since significantly scaled out the Addressing API, so that it can handle high request rates if it ever again has to.
- An error in a Kubernetes cron job caused invalid data to be written to Quicksilver. We have since made sure that, when this cron job fails, it is no longer possible for that failure to clobber the Quicksilver key.
dosddid not correctly handle all possible error conditions when loading configuration data from Quicksilver, causing it to fail. We have since taken these additional conditions into account where necessary, so thatdosdwill gracefully degrade in the face of corrupt Quicksilver data.- The Front Line had an unexpected dependency on
dosd, which caused it to fail whendosdfailed. We have since removed all such dependencies, and the Front Line will now gracefully survivedosdfailures.
More broadly, this incident has served as an example to us of why code and systems must always be resilient to failure, no matter how unlikely that failure may seem.
LXD 5.0 LTS released
Post Syndicated from original https://lwn.net/Articles/890259/
Version 5.0 LTS of the LXD container-management system has been released.
This is a long-term-support release, which will be supported into 2027.
New features include disk and USB hotplug support, the ability to start
with degraded networking, and more; see this
forum post for more information.
Security updates for Tuesday
Post Syndicated from original https://lwn.net/Articles/890258/
Security updates have been issued by Arch Linux (polkit, postgresql, and zlib), openSUSE (389-ds and opera), Red Hat (kpatch-patch), SUSE (389-ds and util-linux), and Ubuntu (waitress).
Security for All: How the Rapid7 Cybersecurity Foundation Will Expand Access and Inclusion
Post Syndicated from Peter Kaes original https://blog.rapid7.com/2022/04/05/security-for-all-how-the-rapid7-cybersecurity-foundation-will-expand-access-and-inclusion/

Rapid7’s mission is to advance cybersecurity for all — and an essential part of that effort is making the field and its best resources easier to access. That’s why we deliver solutions that meet the needs of large enterprises but can also be deployed and operated by more resource-constrained teams. It’s also why we’ve put so much time, effort, and capital into creating open-source tools and research that help democratize security knowledge.
In keeping with this focus, access and inclusion have also been at the core of our philanthropic and community engagement efforts. Over the years, we’ve launched and supported numerous initiatives to expand diversity by ensuring greater access to careers in cybersecurity. This includes supporting STEM programs that provide opportunities for experiential learning with industry professionals, as well as programs like Hack.Diversity that ensure we’re accessing the full talent landscape as we hire our next thousand employees.
Introducing the Rapid7 Cybersecurity Foundation
As we address the challenges in cybersecurity, we must also remain focused on ensuring the underserved and underrepresented have access to careers and solutions in the field. Over the past 10 years, we’ve allocated millions of dollars in support of organizations that help support this goal. In 2020, Rapid7 established and funded a Donor-Advised Fund with the Tides Foundation, and in 2021, we donated over $300,000 to numerous organizations from our Fund. But we were far from done. A few months ago, we formed the Rapid7 Cybersecurity Foundation and seeded it with $1 million.
The Foundation’s mission is to democratize cybersecurity by focusing on access for the underrepresented and underserved. We do this by promoting a diverse and inclusive cybersecurity workforce, supporting free and open security solutions, and advocating for those who often lack a voice in advancing security.
The Foundation will partner with organizations that work in the following areas in pursuit of creating a secure and prosperous digital future for all:
- STEM education, diversity and inclusion in technology, and efforts by organizations to expand opportunities to historically underrepresented groups and make careers in cybersecurity more accessible for all
- Open-source tools and volunteering to help make effective cybersecurity solutions available to under-resourced organizations, including nonprofits and municipalities
- Research and policy advocacy to strengthen cybersecurity for vulnerable communities, improve cybersecurity awareness, and make achieving effective security outcomes more available to all
Putting purpose into practice
After more than 8 years of having the privilege of being Rapid7’s General Counsel, I’m ecstatic to have the opportunity to serve as Executive Director of the Rapid7 Cybersecurity Foundation and to head up our growing ESG (Environmental, Social & Governance) program. In preparing for this transition, I recently read the excellent 2022 Letter to CEOs written by Larry Fink, CEO and Chairman of Black Rock. In it, he writes that a clear sense of purpose, consistent values, and engaging with and delivering for key stakeholders is what distinguishes truly great companies.
Accelerating digital transformation continues to create new challenges and opportunities for cybersecurity practitioners and the industry. It is also redefining the relationship between a company, its employees, and society. Fink writes:
Putting your company’s purpose at the foundation of your relationships with your stakeholders is critical to long-term success. Employees need to understand and connect with your purpose; and when they do, they can be your staunchest advocates. Customers want to see and hear what you stand for as they increasingly look to do business with companies that share their values. And shareholders need to understand the guiding principle driving your vision and mission.
The Rapid7 Cybersecurity Foundation, with its focus on helping advance cybersecurity for the underserved and underrepresented, is a natural extension of Rapid7’s mission to advance cybersecurity for all. It’s part of our effort to put that guiding purpose at the center of our relationship with our customers, employees, and shareholders.
Later this week, we will be unveiling our first Social Good Report, which highlights our broader work advancing social good, for which the Foundation will be an important complementary vehicle. We are eager to get started and look forward to engaging with members of our community and organizations globally to help build a secure and prosperous digital future for everyone. Please reach out [email protected] to partner with us.
Hackers Using Fake Police Data Requests against Tech Companies
Post Syndicated from Bruce Schneier original https://www.schneier.com/blog/archives/2022/04/hackers-using-fake-police-data-requests-against-tech-companies.html
Brian Krebs has a detailed post about hackers using fake police data requests to trick companies into handing over data.
Virtually all major technology companies serving large numbers of users online have departments that routinely review and process such requests, which are typically granted as long as the proper documents are provided and the request appears to come from an email address connected to an actual police department domain name.
But in certain circumstances – such as a case involving imminent harm or death – an investigating authority may make what’s known as an Emergency Data Request (EDR), which largely bypasses any official review and does not require the requestor to supply any court-approved documents.
It is now clear that some hackers have figured out there is no quick and easy way for a company that receives one of these EDRs to know whether it is legitimate. Using their illicit access to police email systems, the hackers will send a fake EDR along with an attestation that innocent people will likely suffer greatly or die unless the requested data is provided immediately.
In this scenario, the receiving company finds itself caught between two unsavory outcomes: Failing to immediately comply with an EDR -- and potentially having someone’s blood on their hands -- or possibly leaking a customer record to the wrong person.
Another article claims that both Apple and Facebook (or Meta, or whatever they want to be called now) fell for this scam.
We allude to this kind of risk in our 2015 “Keys Under Doormats” paper:
Third, exceptional access would create concentrated targets that could attract bad actors. Security credentials that unlock the data would have to be retained by the platform provider, law enforcement agencies, or some other trusted third party. If law enforcement’s keys guaranteed access to everything, an attacker who gained access to these keys would enjoy the same privilege. Moreover, law enforcement’s stated need for rapid access to data would make it impractical to store keys offline or split keys among multiple keyholders, as security engineers would normally do with extremely high-value credentials.
The “credentials” are even more insecure than we could have imagined: access to an email address. And the data, of course, isn’t very secure. But imagine how this kind of thing could be abused with a law enforcement encryption backdoor.
Bearer tokens are just awful
Post Syndicated from original https://mjg59.dreamwidth.org/59353.html
As I mentioned last time, bearer tokens are not super compatible with a model in which every access is verified to ensure it’s coming from a trusted device. Let’s talk about that in a bit more detail.
First off, what is a bearer token? In its simplest form, it’s simply an opaque blob that you give to a user after an authentication or authorisation challenge, and then they show it to you to prove that they should be allowed access to a resource. In theory you could just hand someone a randomly generated blob, but then you’d need to keep track of which blobs you’ve issued and when they should be expired and who they correspond to, so frequently this is actually done using JWTs which contain some base64 encoded JSON that describes the user and group membership and so on and then have a signature associated with them so whenever the user presents one you can just validate the signature and then assume that the contents of the JSON are trustworthy.
One thing to note here is that the crypto is purely between whoever issued the token and whoever validates the token – as far as the server is concerned, any client who can just show it the token is just fine as long as the signature is verified. There’s no way to verify the client’s state, so one of the core ideas of Zero Trust (that we verify that the client is in a trustworthy state on every access) is already violated.
Can we make things not terrible? Sure! We may not be able to validate the client state on every access, but we can validate the client state when we issue the token in the first place. When the user hits a login page, we do state validation according to whatever policy we want to enforce, and if the client violates that policy we refuse to issue a token to it. If the token has a sufficiently short lifetime then an attacker is only going to have a short period of time to use that token before it expires and then (with luck) they won’t be able to get a new one because the state validation will fail.
Except! This is fine for cases where we control the issuance flow. What if we have a scenario where a third party authenticates the client (by verifying that they have a valid token issued by their ID provider) and then uses that to issue their own token that’s much longer lived? Well, now the client has a long-lived token sitting on it. And if anyone copies that token to another device, they can now pretend to be that client.
This is, sadly, depressingly common. A lot of services will verify the user, and then issue an oauth token that’ll expire some time around the heat death of the universe. If a client system is compromised and an attacker just copies that token to another system, they can continue to pretend to be the legitimate user until someone notices (which, depending on whether or not the service in question has any sort of audit logs, and whether you’re paying any attention to them, may be once screenshots of your data show up on Twitter).
This is a problem! There’s no way to fit a hosted service that behaves this way into a Zero Trust model – the best you can say is that a token was issued to a device that was, around that time, apparently trustworthy, and now it’s some time later and you have literally no idea whether the device is still trustworthy or if the token is still even on that device.
But wait, there’s more! Even if you’re nowhere near doing any sort of Zero Trust stuff, imagine the case of a user having a bunch of tokens from multiple services on their laptop, and then they leave their laptop unlocked in a cafe while they head to the toilet and whoops it’s not there any more, better assume that someone has access to all the data on there. How many services has our opportunistic new laptop owner gained access to as a result? How do we revoke all of the tokens that are sitting there on the local disk? Do you even have a policy for dealing with that?
There isn’t a simple answer to all of these problems. Replacing bearer tokens with some sort of asymmetric cryptographic challenge to the client would at least let us tie the tokens to a TPM or other secure enclave, and then we wouldn’t have to worry about them being copied elsewhere. But that wouldn’t help us if the client is compromised and the attacker simply keeps using the compromised client. The entire model of simply proving knowledge of a secret being sufficient to gain access to a resource is inherently incompatible with a desire for fine-grained trust verification on every access, but I don’t see anything changing until we have a standard for third party services to be able to perform that trust verification against a customer’s policy.
Still, at least this means I can just run weird Android IoT apps through mitmproxy, pull the bearer token out of the request headers and then start poking the remote API with curl. It may all be broken, but it’s also got me a bunch of bug bounty credit, so, it;s impossible to say if its bad or not,
(Addendum: this suggestion that we solve the hardware binding problem by simply passing all the network traffic through some sort of local enclave that could see tokens being set and would then sequester them and reinject them into later requests is OBVIOUSLY HORRIFYING and is also probably going to be at least three startup pitches by the end of next week)
 comments
Behnel: Cython is 20!
Post Syndicated from original https://lwn.net/Articles/890231/
On his blog, Stefan Behnel writes about the 20th anniversary of Cython, which is a compiler for Python extensions written in C, for wrapping C libraries in order to provide Python bindings for them, and for embedding Python into other applications. It is used by NumPy, scikit-learn (and other scikit-* extensions), pandas, and more.
On April 4th, 2002, Greg Ewing published the first release of Pyrex 0.1.
Already at the time, it was invented and designed as a compiler that extended the Python language with C data types to build extension modules for CPython. A design that survived the last 20 years, and that made Pyrex, and then Cython, a major corner stone of the Python data ecosystem. And way beyond that.
Now, on April 4th, 2022, its heir Cython is still very much alive and serves easily hundreds of thousands of developers worldwide, day to day.
Linguistics Degree
Post Syndicated from original https://xkcd.com/2602/

Home Assistant 2022.4 Release Party
Post Syndicated from Home Assistant original https://www.youtube.com/watch?v=wOrJUWYYWdY
AWS Week in Review – April 4, 2022
Post Syndicated from Sébastien Stormacq original https://aws.amazon.com/blogs/aws/aws-week-in-review-april-4-2022/
Welcome to the April 4 edition of the AWS Week in Review. This week, alongside the main launches, I also captured a couple of new capabilities, such as a new API to manage your AWS accounts within AWS Organizations, an easier process to update your AWS Lambda layers, and a new behavior of Amazon Elastic Compute Cloud (Amazon EC2).
Last Week’s Launches
Here are some launches that caught my attention last week:
Sustainability Pillar is now available in the Well Architect Tool – The Well Architected Tool is a central place for cloud architecture best practices and guidance. The Sustainability Pillar was announced at the re:Invent 2021 conference. It helps you to learn, measure, and improve your workloads using environmental best practices for cloud computing.
Close an AWS Member Account with an API Call – This feature was launched with little fanfare, but it is a big deal for those of you managing large numbers of AWS accounts through Organizations. The Twitter community first spotted the change, noticing a commit in the AWS SDK for Go. See the official blog post announcement for more information!
The Lambda Console Now Allows Updates a Lambda Layer in All or a Subset of Functions – Lambda layers provide a convenient way to package libraries and other dependencies that you can use with your Lambda functions. Using layers reduces the size of uploaded deployment archives and makes it faster to deploy your code. Previously, it was challenging to identify and update all the functions that used a specific layer version. With this release, the Lambda console displays a list of all the functions using a given layer and allows you to select multiple functions to be updated with a newer layer version. It eliminates the need to update one function at a time or utilize an external script to perform the update on multiple functions.
Amazon EC2 Launched Automatic Recovery on Hardware Failure by Default – This new feature makes it easier to recover your instance when it becomes unreachable. Automatic recovery improves instance availability by recovering the instance if it becomes impaired due to an underlying hardware issue. Automatic recovery migrates the instance to another hardware during an instance reboot while retaining its instance ID, private IP addresses, Elastic IP addresses, and all instance metadata. You can choose to disable automatic recovery for your instance if you wish.
For a full list of AWS announcements, be sure to keep an eye on the What’s New at AWS page.
Other AWS News
Beside launches, here are other news worthy items and a blog that caught my attention:
New AWS podcast for Sub-Saharan AWS communities – There are AWS podcasts in many different languages: English, French, Italian, German, three in Spanish, and Russian just to name a few. This week, my colleague Veliswa launched an English podcast aimed at highlighting the Sub-Saharian AWS communities and customers. You can listen to it using any good podcast application (including but not only Spotify and Apple).
100th episode of Le Podcast AWS en Français – This week also marked the publication of the 100th episode of the AWS French Podcast. Since its start in 2019, the podcast has seen 250k downloads. Thank you for listening.
AWS Open Source News and Updates – My colleague Ricardo writes this weekly open-source newsletter. In the 106th edition, I noticed two pieces of information important for the Java community:
First, we released Amazon Corretto 18. This version supports the latest Java feature release OpenJDK 18, and is available on Linux, Windows, and macOS. OpenJDK 18 offers a new internet-address resolution capability, a Simple Web Server, an updated Vector API, a new @snippet Tag for JavaDoc, a new implementation of Core Reflection, a change to UTF-8 as the default character set (charset) of the standard Java APIs, a second iteration of the foreign memory API, advancements in pattern matching for switch statements, and the deprecation of finalization.
Second, we published a blog post showing how to reduce Lambda cold start time by deploying your Java-based Lambda function on Quarkus. Quarkus was created by Java Champion Emmanuel Bernard. It is an open-source native Java stack tailored for GraalVM and OpenJDK HotSpot, crafted from the best of breed Java libraries and standards. It is designed to have an extremely low memory footprint and fast startup time. And yes, Quarkus runs on Corretto too.
A Cloud Guru Answers a Common Question – Nearly every week, people ask me what AWS certification they should take. A Cloud Guru walks through the decision in Which AWS certification is right for me?
Upcoming AWS Events
Check your calendars and sign up for these AWS events:
The AWS Summit season has started – The Brussels Summit was last week, and the next ones are Paris, San Francisco, and London, in that order. I will be delivering the closing keynote at the Paris Summit and will be around the Formula1 GameDay area in London. Be sure to stop by and say “Hi!” if you’re around. You can sign up to receive a notification when registration opens for a Summit in your area. If you can’t attend a Summit in person this year, we will have an online Summit for EMEA in June (at European time, but all sessions will stay available on-demand until September).
.NET Enterprise Developer Day EMEA registrations are open – .NET Enterprise Developer Day EMEA 2022 is a free, one-day virtual conference providing enterprise developers with the most relevant information to swiftly and efficiently migrate and modernize their .NET applications and workloads on AWS. It will happen online on April 26, 2022.
re:Mars conference registrations are open – Mars stands for Machine learning, Automation, Robotics, and Space. You will learn from recognized thought leaders and technical experts who are building the future of AI/ML. It will happen in Las Vegas, Nevada, between June 21 and 24, 2022.
re:Inforce conference registrations are open – Security is our first priority at AWS, and it deserves its own two-day conference to reinforce your AWS security posture. You’ll hear the latest from industry-leading speakers in security, compliance, identity, and privacy. It will happen in Boston, Massachusetts, on July 26 and 27, 2022.
That’s all for this week. Come back next Monday for another Week in Review!