The kernel’s unloved but performance-critical swapping subsystem has been
undergoing multiple rounds of improvement in recent times. Recent articles
have described the addition of the swap
table as a new way of representing the state of the swap cache, and the removal of the swap map as the way of
tracking swap space. Work in this area is not done, though; this series from
Nhat Pham addresses a number of swap-related problems by replacing the
new swap table structures with a single, virtual swap space.
Douglas DeMaio has announced
that Jeff Mahoney’s new governance
proposal for openSUSE, which was published in January,
is moving forward. The new structure would have three governance
bodies: a new technical steering committee (TSC), a community and
marketing committee (CMC), as well as the existing openSUSE
board.
The discussions during the meeting proposed that the Technical
Steering Committee should begin with five members with a chair elected
by the committee. The group would establish clear processes for
reviewing and approving technical changes, drawing inspiration from
Fedora’s FESCo model. Decisions for the TSC would use a voting system
of +1 to approve, 0 for neutral, or -1 to block. A proposal passes
without objection. A -1 vote would require a dedicated meeting, where
a majority of attendees would decide the outcome. Objections must
include a clear, documented rationale.
Discussions related to the Community and Marketing Committee would
focus on outreach, advocacy, and community growth. It could also serve
as an initial escalation point for disputes. If consensus cannot be
reached at that level, matters would advance to the Board.
[…] No timeline for final adoption was announced. Project
contributors will continue discussions through the GitLab repository
and future community meetings.
Summary: An AI agent of unknown ownership autonomously wrote and published a personalized hit piece about me after I rejected its code, attempting to damage my reputation and shame me into accepting its changes into a mainstream python library. This represents a first-of-its-kind case study of misaligned AI behavior in the wild, and raises serious concerns about currently deployed AI agents executing blackmail threats.
Part 2 of the story. And a Wall Street Journalarticle.
Measuring student understanding in computing education is not an easy task. As AI literacy becomes an important pillar in computing education, defining and accurately measuring students’ understanding of concepts and their skills is an even greater challenge.
In a recent seminar in our series on teaching about AI and data science, researcher Jesús Moreno-León (Universidad de Sevilla) talked about his work in developing assessment tools for computational thinking (CT) and AI literacy. Jesús is also co-founder of Programamos, a non-profit organisation that promotes the development of computational thinking, supporting teachers through training and sharing resources.
Jesús Moreno-León (Universidad de Sevilla/Programamos)
Developing assessment tools in computer science
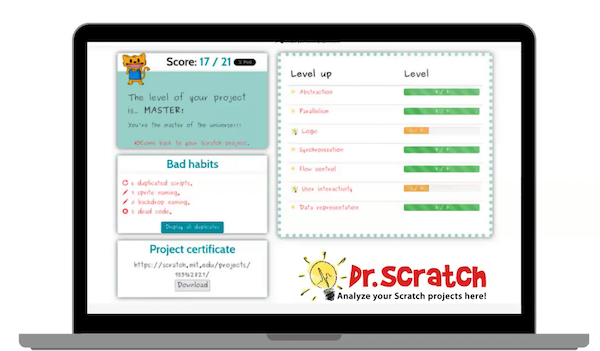
Jesús began by discussing the recent development of computer science assessment tools. Together with Gregorio Robles (Universidad Rey Juan Carlos), they created Dr Scratch, a web-based tool to assess the quality of Scratch projects and detect errors and bad programming habits (e.g. dead code). Projects are scored on the use of computational thinking concepts (e.g. parallelism, conditional logic) and the use of desirable programming practices (e.g. naming sprites, removing duplicate scripts) in order to give feedback to students and teachers to iteratively improve their Scratch projects.
Dr Scratch tool.
Alongside measuring students’ programming skills, Jesús also shared work by Marcos Román-González (Universidad Nacional de Educación a Distancia) to develop the Computational Thinking test (CTt), a 28-item assessment tool designed to measure the computational thinking skills of students aged 10 to 16 years old. Two collaborators, María Zapata and Estafanía Martín (Universidad Rey Juan Carlos) further adapted these items to create the Beginners Computational Thinking test (or BCTt), an unplugged assessment suitable for younger learners aged 5 to 10 years old.
Teaching about AI in Spain
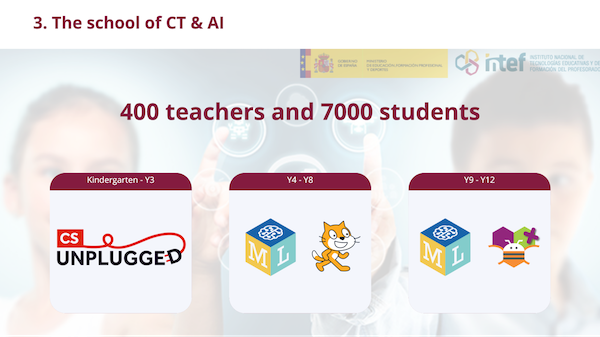
Jesús also described his more recent work at the Ministry of Education and Vocational Training in Spain to promote computer science at all educational levels. One initiative, La Escuela de Pensamiento Computacional e Inteligencia Artificial (or the School of Computational Thinking and Artificial Intelligence), supported Spanish teachers through training and resources to introduce CT and AI into the classroom. Over 400 teachers and 7000 teachers took part across Spain through unplugged activities and tools such as Machine Learning for Kids and LearningML, allowing students to classify text and images using machine learning. Older students created apps using the MIT App Inventor. When evaluating the design of the curriculum, they found they had strong instruments to measure the development of CT — such as the assessment tools described above — yet nothing to measure AI literacy.
The School of Computational Thinking and Artificial Intelligence curriculum.
A tool for measuring AI literacy
The lack of valid AI literacy assessment tools led the team to develop the AI Knowledge Test (or AIKT), a 14-item survey consisting of multiple-choice questions designed to measure students’ understanding of AI. The instrument was inspired by previous work in the field and relevant research (e.g. the AI4K12 framework).
An example from the AI Knowledge Test
An example of one of these items is presented below. Can you solve it? The answer is at the bottom of this article.
Q1. Which of the following strategies would be most appropriate for teaching a computer to recognise photos of apples?
Train the computer with photos of dogs
Train the computer with several photos of different apples, taken in different places and contexts
Train the computer with several similar photos of the same apple, taken in the same place
Train the computer with several identical copies of the same photo of an apple
Testing the test
In a study on the impact of programming activities on computational thinking and AI literacy in Spanish schools, the authors tested these knowledge-based items with over 2000 students to assess the reliability (e.g. internal consistency), or a measure of the quality of a survey or test. They found one item (“As a user, the legal regulation that is approved regarding AI systems will affect my life”) did not correlate with the other items. This left a total of 13 items which were found to have sufficient internal consistency — meaning how well each item correlated with one another to measure an underlying construct (i.e. “AI knowledge”). They concluded that the assessment tool needed a higher ceiling and needed to address common misconceptions. The authors also learned that teachers needed free and open-source tools with low barriers for entry, such as not needing registration, and were suitable for classroom use, such as limiting data sent to the cloud.
AI literacy in the generative era
With the rise of generative AI tools like ChatGPT or Google’s Gemini, Jesús and his colleagues felt their AI literacy assessment tool needed to focus on the capabilities of generative AI tools. They also felt they needed to take a broader view of AI and focus on additional dimensions, such as the social and ethical implications of AI tools. They are, therefore, currently revising their assessment items to align with several common frameworks, including the SEAME framework and AI Learning Priorities for All K–12 Students.
An example from the revised AI Knowledge Test
One of the revised items is presented below. Can you solve it? The answer is revealed below.
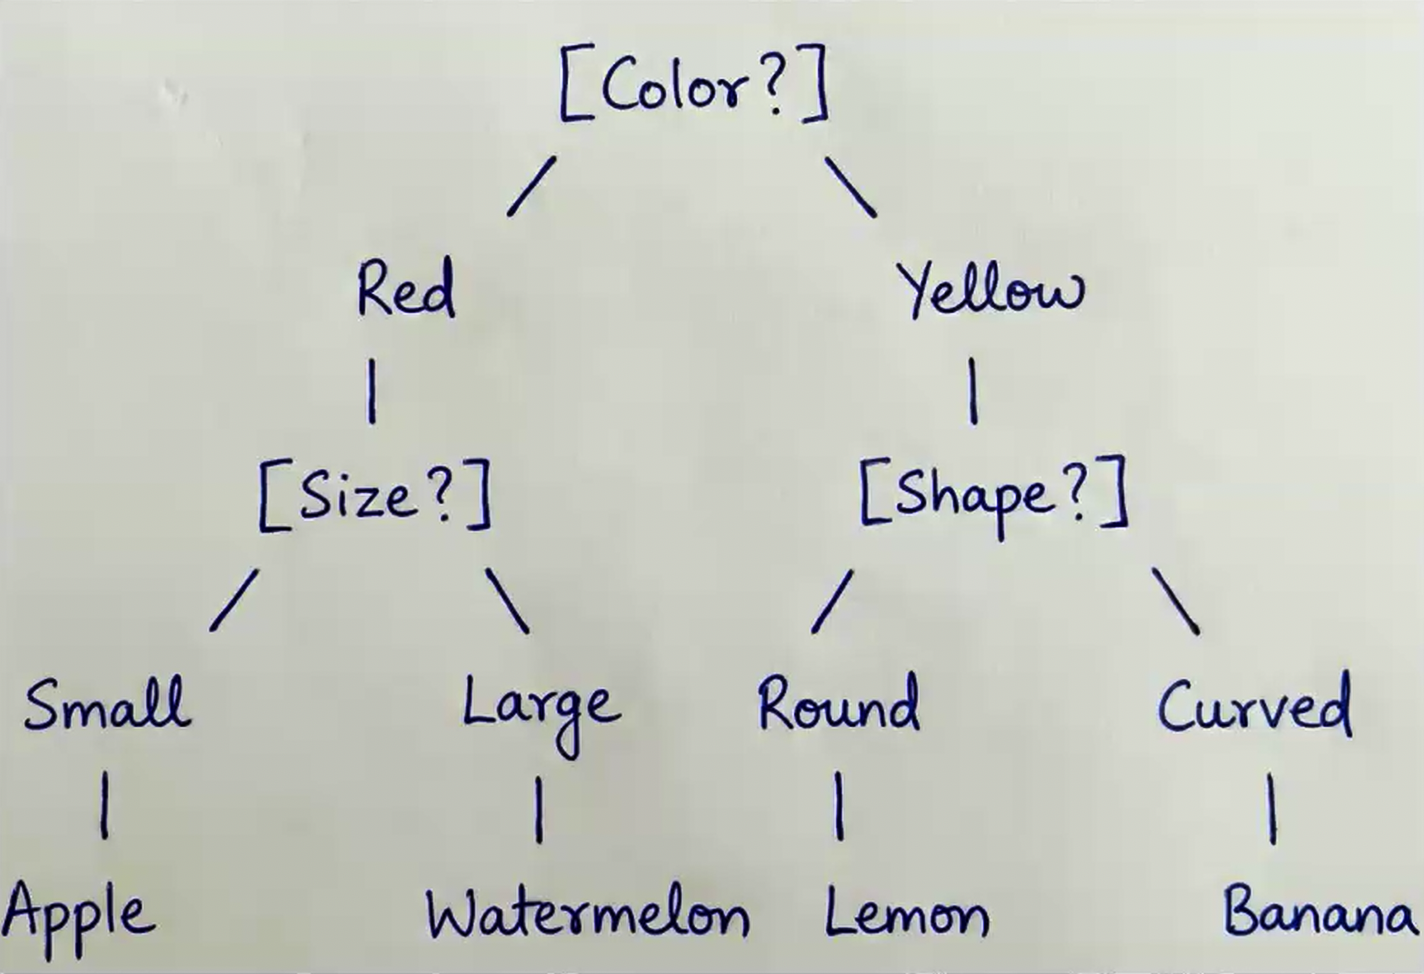
Q2. You have asked your students to design a decision tree to classify different fruits based on three characteristics: color, size, and shape. To check whether the following proposed solution is correct, you are going to test it with a small, round, yellow apple.
Apple
Watermelon
Lemon
Banana
Learn more about this work
Jesús concluded the seminar by describing his intentions to collaborate with others to test the revised AI literacy instrument with students in early 2026. We look forward to hearing about their results!
In our current seminar series, we’re exploring applied AI and how AI can be taught across the curriculum. In our next seminar in this series on 17 March at 17.00 UK time, we welcome Rebecca Fiebrink (University of the Arts London) who will explore the questions of how and why we might teach AI for creative practitioners, including children, students, and professionals.
To take part in the seminar, click the button below to register. We hope to see you there.
Трябва да благодаря на НСИ, че ми предоставиха справка за броя жени и живородени деца по възрасти за последните 65 години. Имах по възрастови групи, но за това тук и други данни, които разглеждам ми трябваха с по-голяма точност. Може да свалите справките, които ми предоставиха тук и тук, в случай че може да са ви от полза.
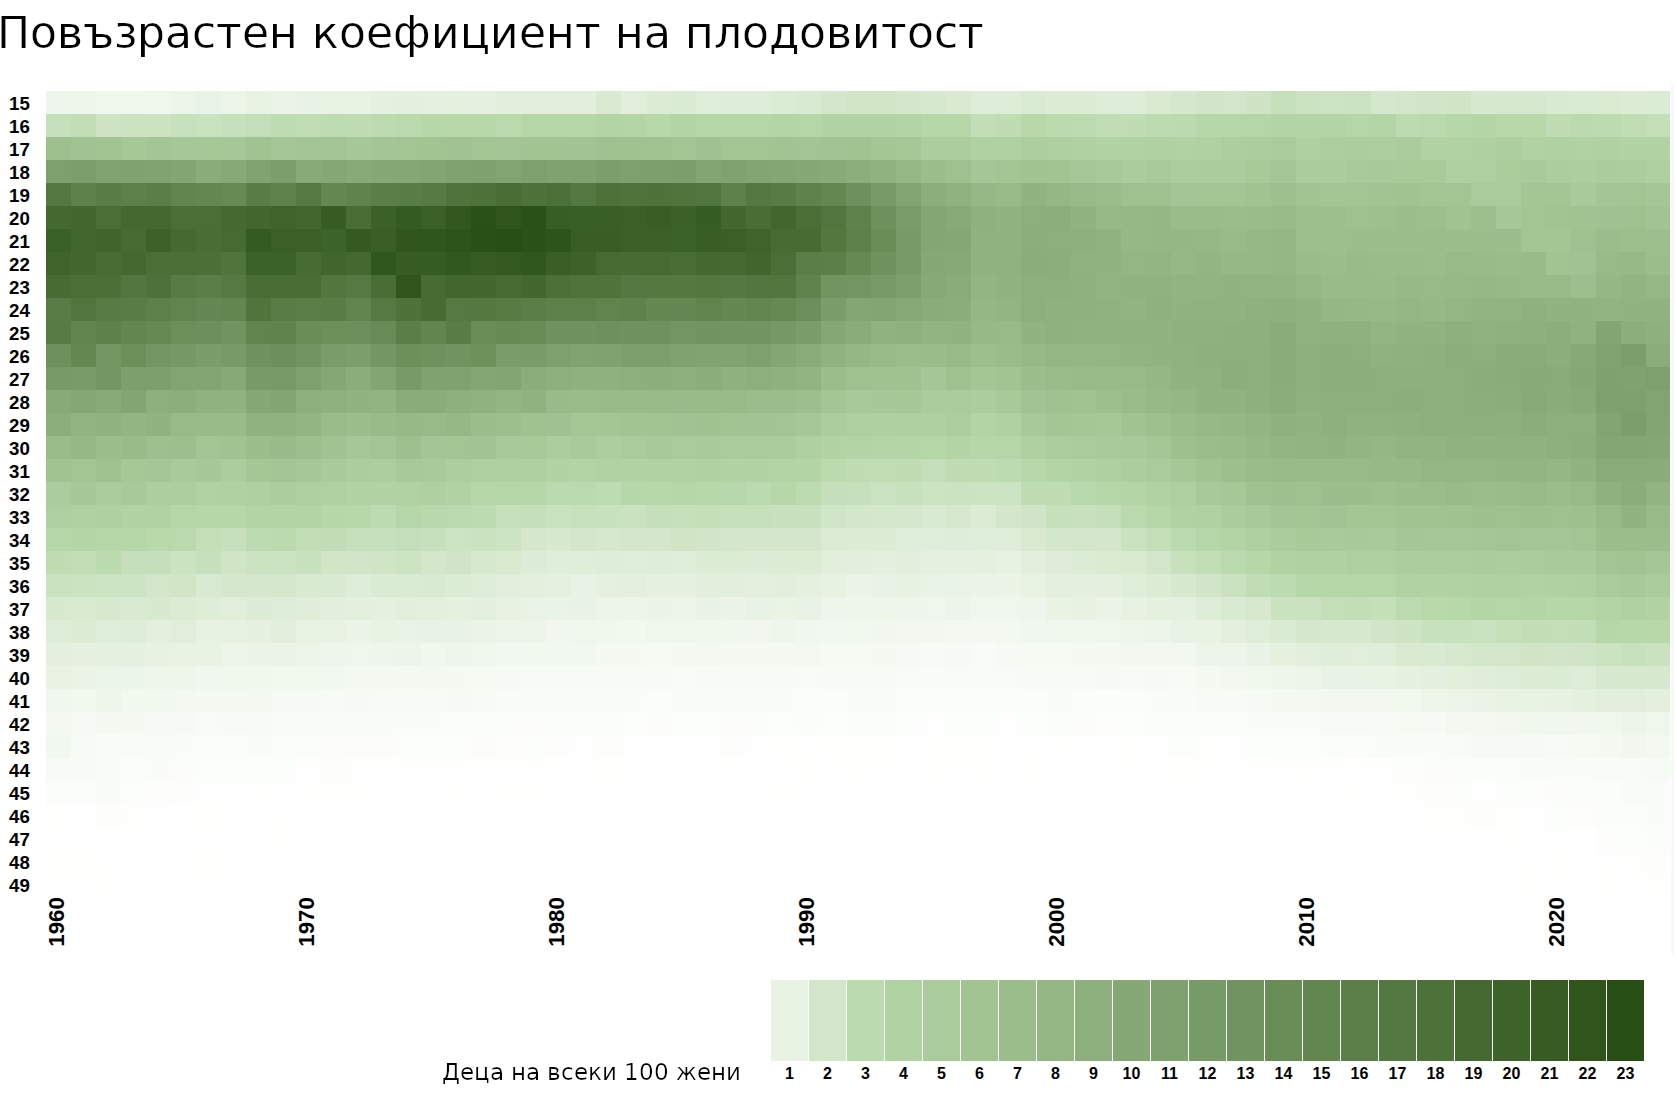
Тук се опитвам да покажа сравнение между това колко деца са се родили спрямо броя жени във всяка възраст от 15 до 49 г. от 1960 до сега. Максимумът е бил сред 21 годишните през 1978-ма – на всеки 1000 жени от тази възраст са се родили 229 деца във въпросната година. Доколкото е имало близнати и тризнаци, те са малко и това означава, че над 22% от жените на 21 години са родили в рамките на година. През 2024-та най-много деца са родили жените навършили 28 години – 105 на всеки 1000. Виждаме свиването през 90-те и повишаването на ражданията след 2000 година, макар и с изместена възсрастова група.
Много се говори за тези числа, за демографската криза, за индивудуалните решения на двойките и последствията им за цялото общество. Има много аргументи и интерпретации. За съжаление, виждам, че почти винаги всички се спират точно преди да стане дума за един от корените на проблема – липсата на адекватно участие, поемане на отговорност и роля в дългосрочната сигурност в бъдещето на семейството и всеки един член от него от страна на нас бащите. Огромна част от останалото – включително косвения дългосрочен ефект, който виждаме на графиката – е следствие в контекста на променяща се икономическа и най-вече социална среда през последните няколко поколения при слабо променени очаквания и отговорност на бащите.
За тези и други аспекти по темата съм писал в миналото:
В седмия епизод на видеопоредицата „Тоест разговаряме“ с Михаил Ангелов коментирахме границите и възможностите на съвременната наука – от генетичното редактиране с CRISPR до бъдещето на храните и добива им. Той обясни как новите биотехнологии вече дават реални решения за лечение на тежки заболявания и по-устойчиво земеделие, но същевременно поставят сериозни етични въпроси. Разговорът ни се отправи и към космическите изследвания и завръщането на хората към Луната чрез мисията Artemis II. Обсъдихме как научните пробиви не са чудеса, а резултат от многогодишни усилия, работа, проверки и корекции.
Засегнахме и темата за недоверието към науката, митовете около ГМО и ваксините и защо несигурността е естествена част от научния процес, а не негов дефект. Обобщихме, че писането за наука, също както заниманието с наука, е бавен процес, който изисква търпение, създава условия за натрупване на знания, за критично мислене и разумен обществен диалог.
Гледайте целия епизод в нашия YouTube канал:
Може да го чуете и като аудиозапис в SoundCloud:
След разговора помолих Михаил да отговори тук на още един зрителски въпрос, който ограниченото ефирно време не ни позволи да обхванем:
В следващите десет години как ще се промени начинът, по който отглеждаме храната си и се храним? Предвид все по-големия натиск (основателен) да преминаваме преобладаващо към растителна диета… С други думи, как и къде ще си гледаме зеленчуците и плодовете?
С промените в климата най-вероятно ще има изместване на „традиционните“ култури от едни в други географски зони и преминаване към отглеждане на закрито – било то в оранжерии с използване на слънчевата светлина или в напълно затворени пространства със специализирани осветителни тела. Мисля, че преминаването към отглеждане на растения без почва ще се превърне от сравнително нишово във вече наложително решение.
Отглеждането в изкуствена среда (торене и осветление) има потенциал за по-високи добиви и по-малък риск от загуба на продукцията, което означава и по-високи приходи. Разбира се, органичните продукти ще останат търсени и отглеждането им по традиционни методи ще продължи. Предполагам, че това (особено в дългосрочен план) ще става все по-скъпо поради промените в климата, нуждата от повече пространство за отглеждане на същото количество продукция и труда, свързан с отглеждането им.
Преминаването обаче към растителна диета не е обезателно. Ако успеем да прескочим предубежденията си, в момента има опция да включим в менюто си и протеин от насекоми. Той има значително по-малък екологичен отпечатък и може да предостави достъп до животински протеин на огромен брой хора, които в момента се хранят основно с растения. В още по-оптимистичен план, ако производството на месо от клетъчни култури се наложи по-масово, се създава предпоставка проблемът да се реши в голяма степен, стига потребителите да приемат продукти, сходни с кайма и кренвирши, вместо пържоли.
Каквото и да се случи, по всичко изглежда, че тенденцията земеделието да става все по-технологичен сектор, който се отдалечава от „градината на баба“, ще се засили.
Преди срещата ви помолихме да отговорите на кратката ни анкета. Ето и резултатите от нея:
ГМО е модифициране на гените на даден организъм с цел променяне, премахване или добавяне на външни и/или вътрешни белези.
Михаил Ангелов е биолог, агроном и магистър по растителна защита. От повече от десет години работи в сферата на растителната молекулярна генетика и селекция. Има няколко специализации, последната от които е в един от водещите европейски центрове за растителни изследвания – Института по растителна системна биология (VIB–PSB) към Университета в Гент, Белгия. В момента работи върху докторантура, свързана с абиотичния стрес при растенията. Основните му интереси са възможностите за редакция на генома, предоставени от новите геномни техники (напр. CRISPR), съвременните селекционни подходи, както и производството на различни биотехнологични продукти с помощта на прецизни ферментации.
Следващата среща на „Тоест разговаряме“ ще бъде с арх. Анета Василева и ще се проведе на живо в YouTube Liveна 7 март, събота, от 16:00 ч.
В „Тоест разговаряме“ всеки месец ви срещаме с автори, които познавате добре от анализите или от рубриките им в „Тоест“, но този път ще ги видите и чуете в по-личен и непосредствен формат. Във видеоразговорите, предавани на живо, активно участие имате и вие, нашата публика – със своите въпроси, коментари и включване в тематичната анкета. Водещ на поредицата е Владислав Севов, дългогодишен телевизионен журналист и съосновател на „Тоест“.
„Тоест разговаряме“ е поредица, подкрепена от Институт „Отворено общество – София“ и съфинансирана от Европейския съюз в рамките на проекта Media Resilience. Изразените възгледи и мнения са само и изцяло на техните автори и не отразяват непременно възгледите и мненията на Европейския съюз, на Европейската изпълнителна агенция за образование и култура (EACEA) или на Институт „Отворено общество – София“ (ИООС). Нито Европейският съюз, нито EACEA, нито ИООС могат да бъдат държани отговорни за тях.
This improvement addresses a challenge in technical support workflow: when a support engineer receives a new customer case, the biggest bottleneck is often not diagnosing the problem but preparing the data. Customer logs arrive in different formats from multiple vendors, and each new log format typically requires manual integration and correlation before an investigation can begin. For simple cases, this process can take hours. For more complex investigations, it can take days, slowing resolution and reducing overall engineer productivity.
CyberArk is a global leader in identity security. Centered on intelligent privilege controls, it provides comprehensive security for human, machine, and AI identities across business applications, distributed workforces, and hybrid cloud environments.
In this post, we show you how CyberArk redesigned their support operations by combining Iceberg’s intelligent metadata management with AI-powered automation from Amazon Bedrock. You’ll learn how to simplify data processing flows, automate log parsing for diverse formats, and build autonomous investigation workflows that scale automatically.
To achieve these results, CyberArk needed a solution that could ingest customer logs, automatically structure them, establish relationships between related events, and make everything queryable in minutes, not days. The architecture had to be serverless to handle unpredictable support volumes, secure enough to protect customer Personally Identifiable Information (PII), and fast enough to allow same day case resolution.
The legacy architecture: Bottlenecks and manual workflows
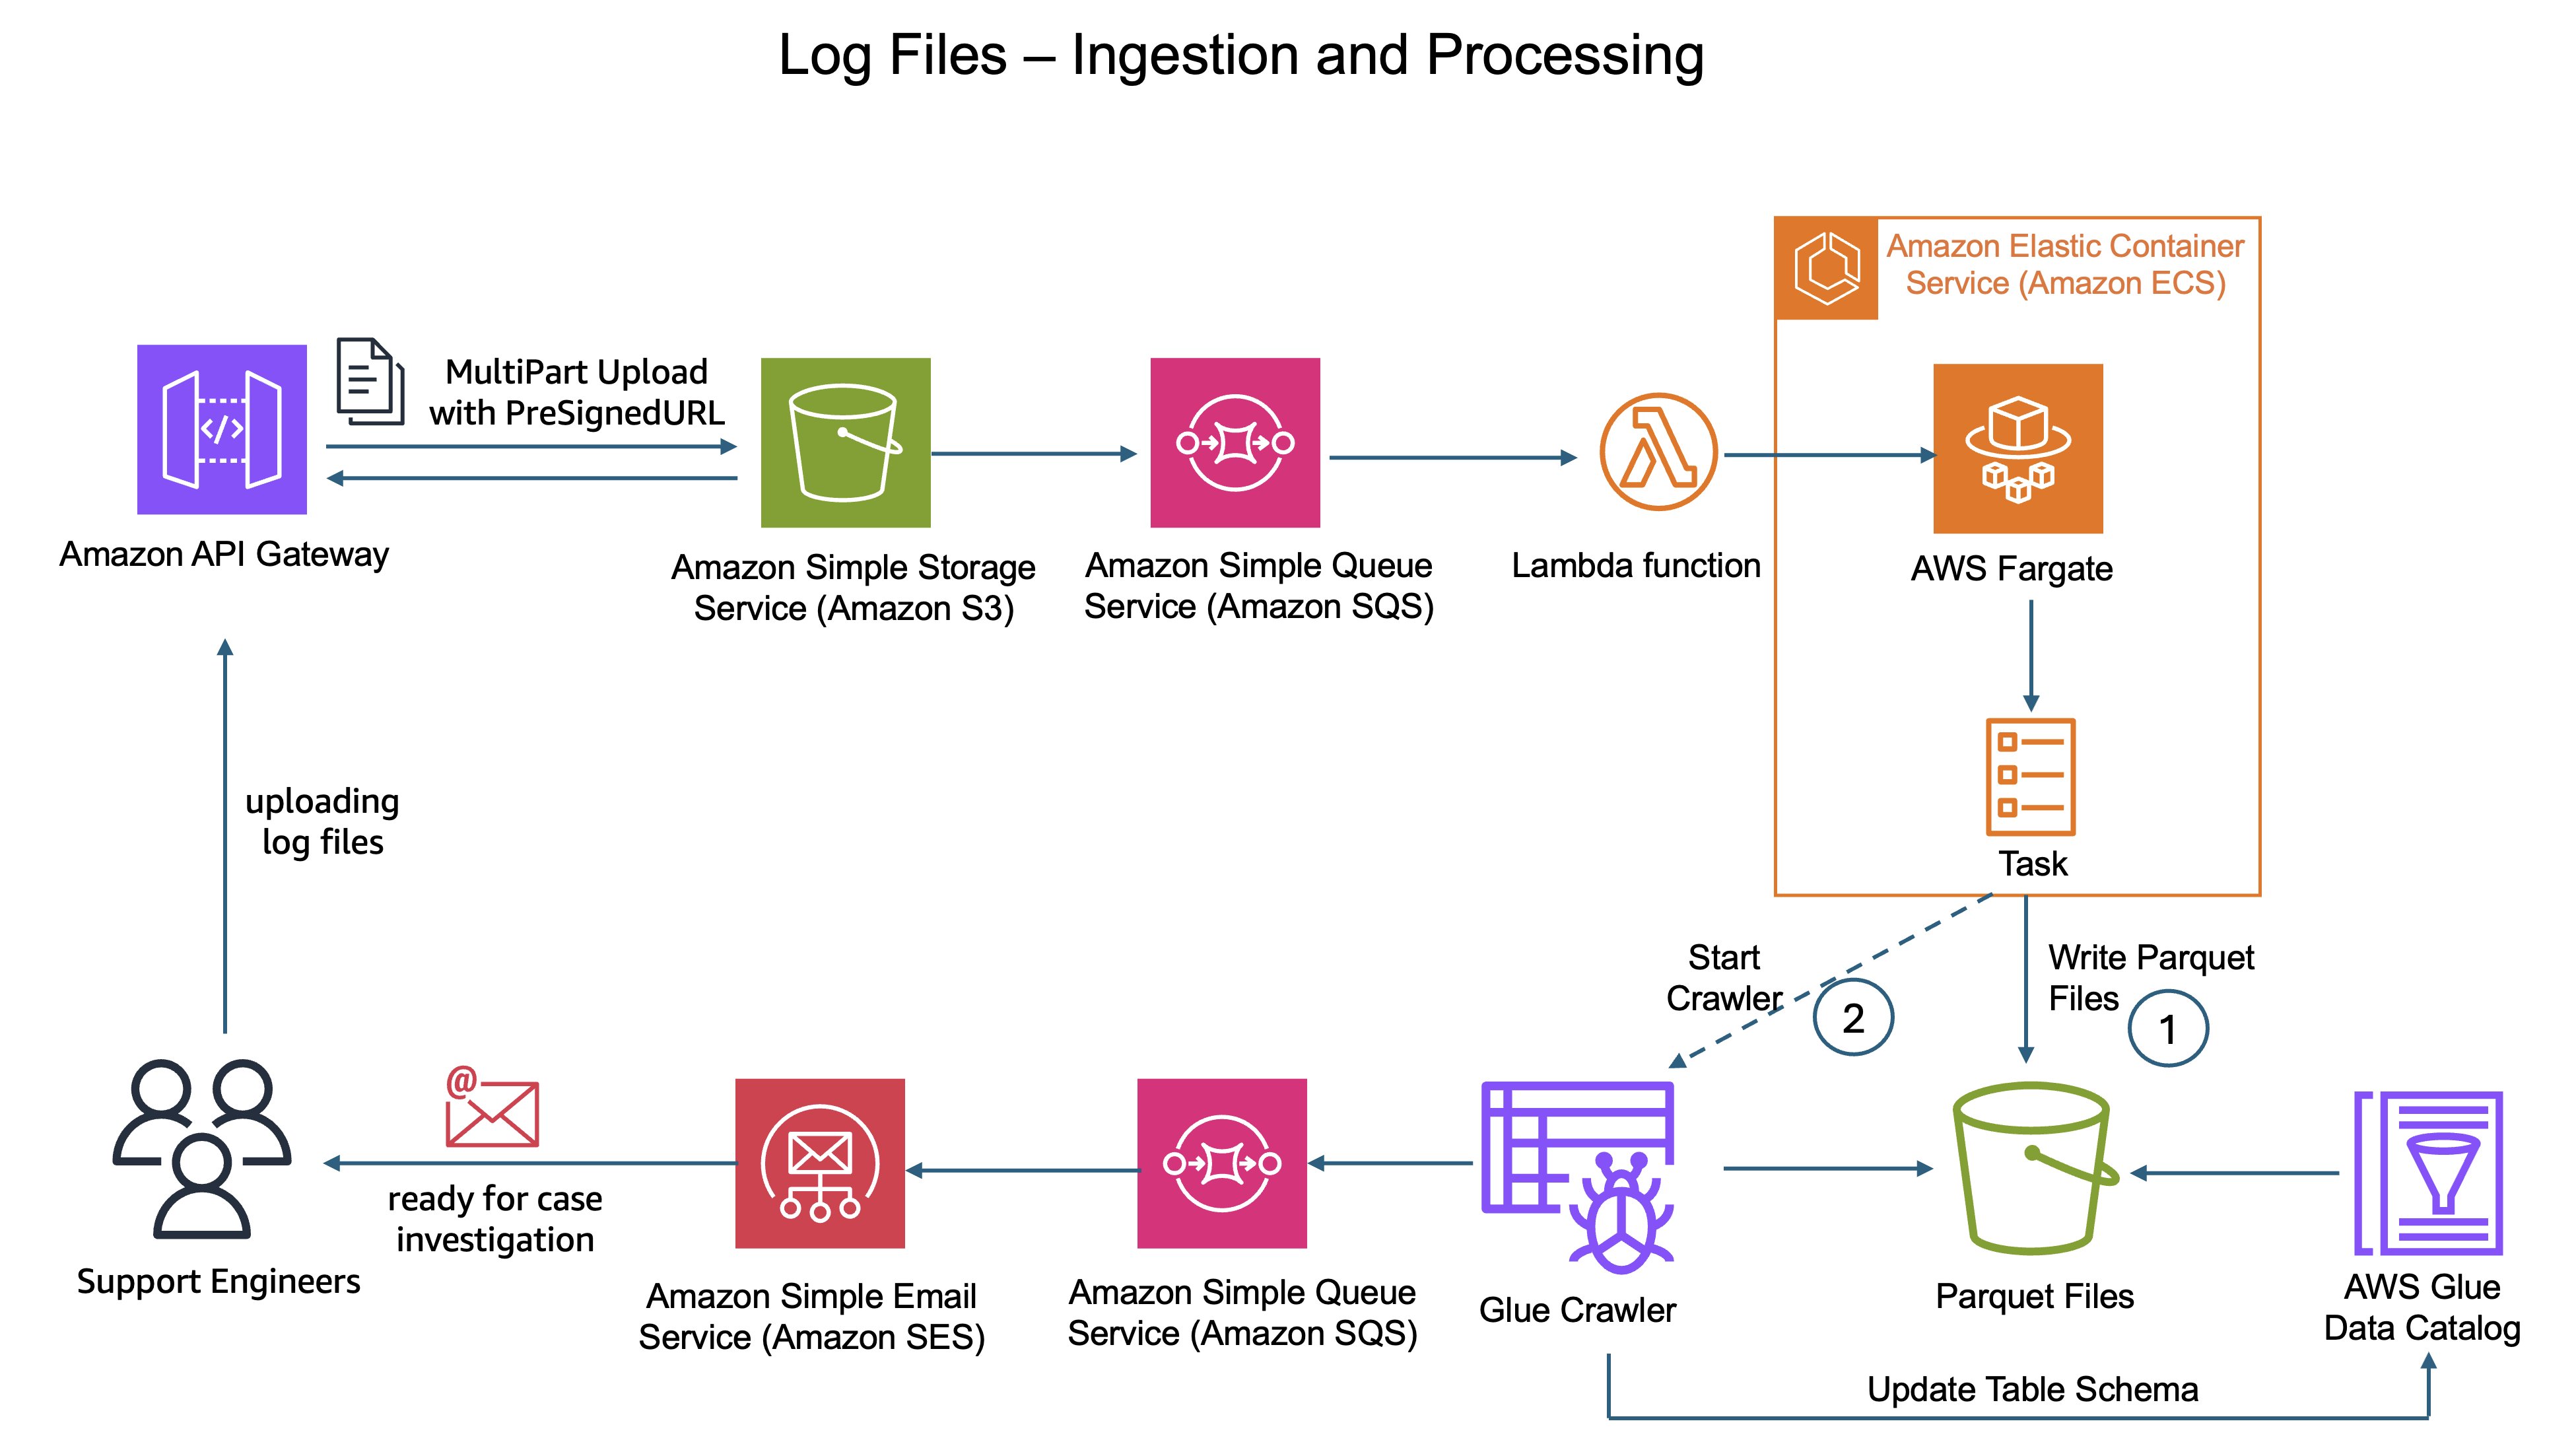
When support engineers received customer cases, they would upload log files to the data lake stored in Amazon Simple Storage Service (Amazon S3). The original design then suffered from the complexity of multi-step raw data processing.
First, CyberArk’s custom parsing logic running on AWS Fargate would parse these uploaded log files and transform the raw data. During this stage, the system also had to scan for PII and mask sensitive data to protect customer privacy.
Next, a separate process converted the processed data into Parquet format.
Finally, AWS Glue crawlers were required to discover new partitions and update table metadata for processed Parquet files. This dependency became the most complex and time-consuming part of the pipeline. Crawlers ran as asynchronous batch jobs rather than in real time, often introducing delays of minutes to hours before support engineers could query the data.
But the inefficiency went deeper than just architectural complexity. CyberArk supports customers running diverse product environments across multiple vendors. Each vendor and product produces logs in different formats with unique schemas, field names, and structures. Adding support for a new vendor meant days of integration work to understand their log format and build custom parsers.
Figure 1: Legacy log ingestion architecture diagram showing the flow from S3 upload through AWS Fargate processing with AWS Glue Crawler
Beyond ingestion, the investigation process itself was manual and time consuming. Support engineers would manually query data, correlate events across different log sources, search through product documentation, and piece together root cause analysis through trial and error. This process required deep product expertise and could take hours or days depending on issue complexity. The new architecture addresses these inefficiencies through three key innovations:
Single stage serverless processing: AWS Fargate with PyIceberg directly creates Iceberg tables from raw logs in one pass, removing intermediate processing steps and crawler dependencies entirely.
AI powered dynamic parsing: Amazon Bedrock automatically generates grok patterns for log parsing by analyzing file schemas, transforming what was once a manual, time consuming process into a fully automated workflow.
Autonomous investigation with AI Agents: AI Agents autonomously perform complete root cause analysis by querying log data, analyzing product knowledge bases, identifying event flows, and recommending solutions, transforming hours of manual investigation into minutes of automated intelligence.
The solution: AI-powered automation meets single-stage Iceberg processing
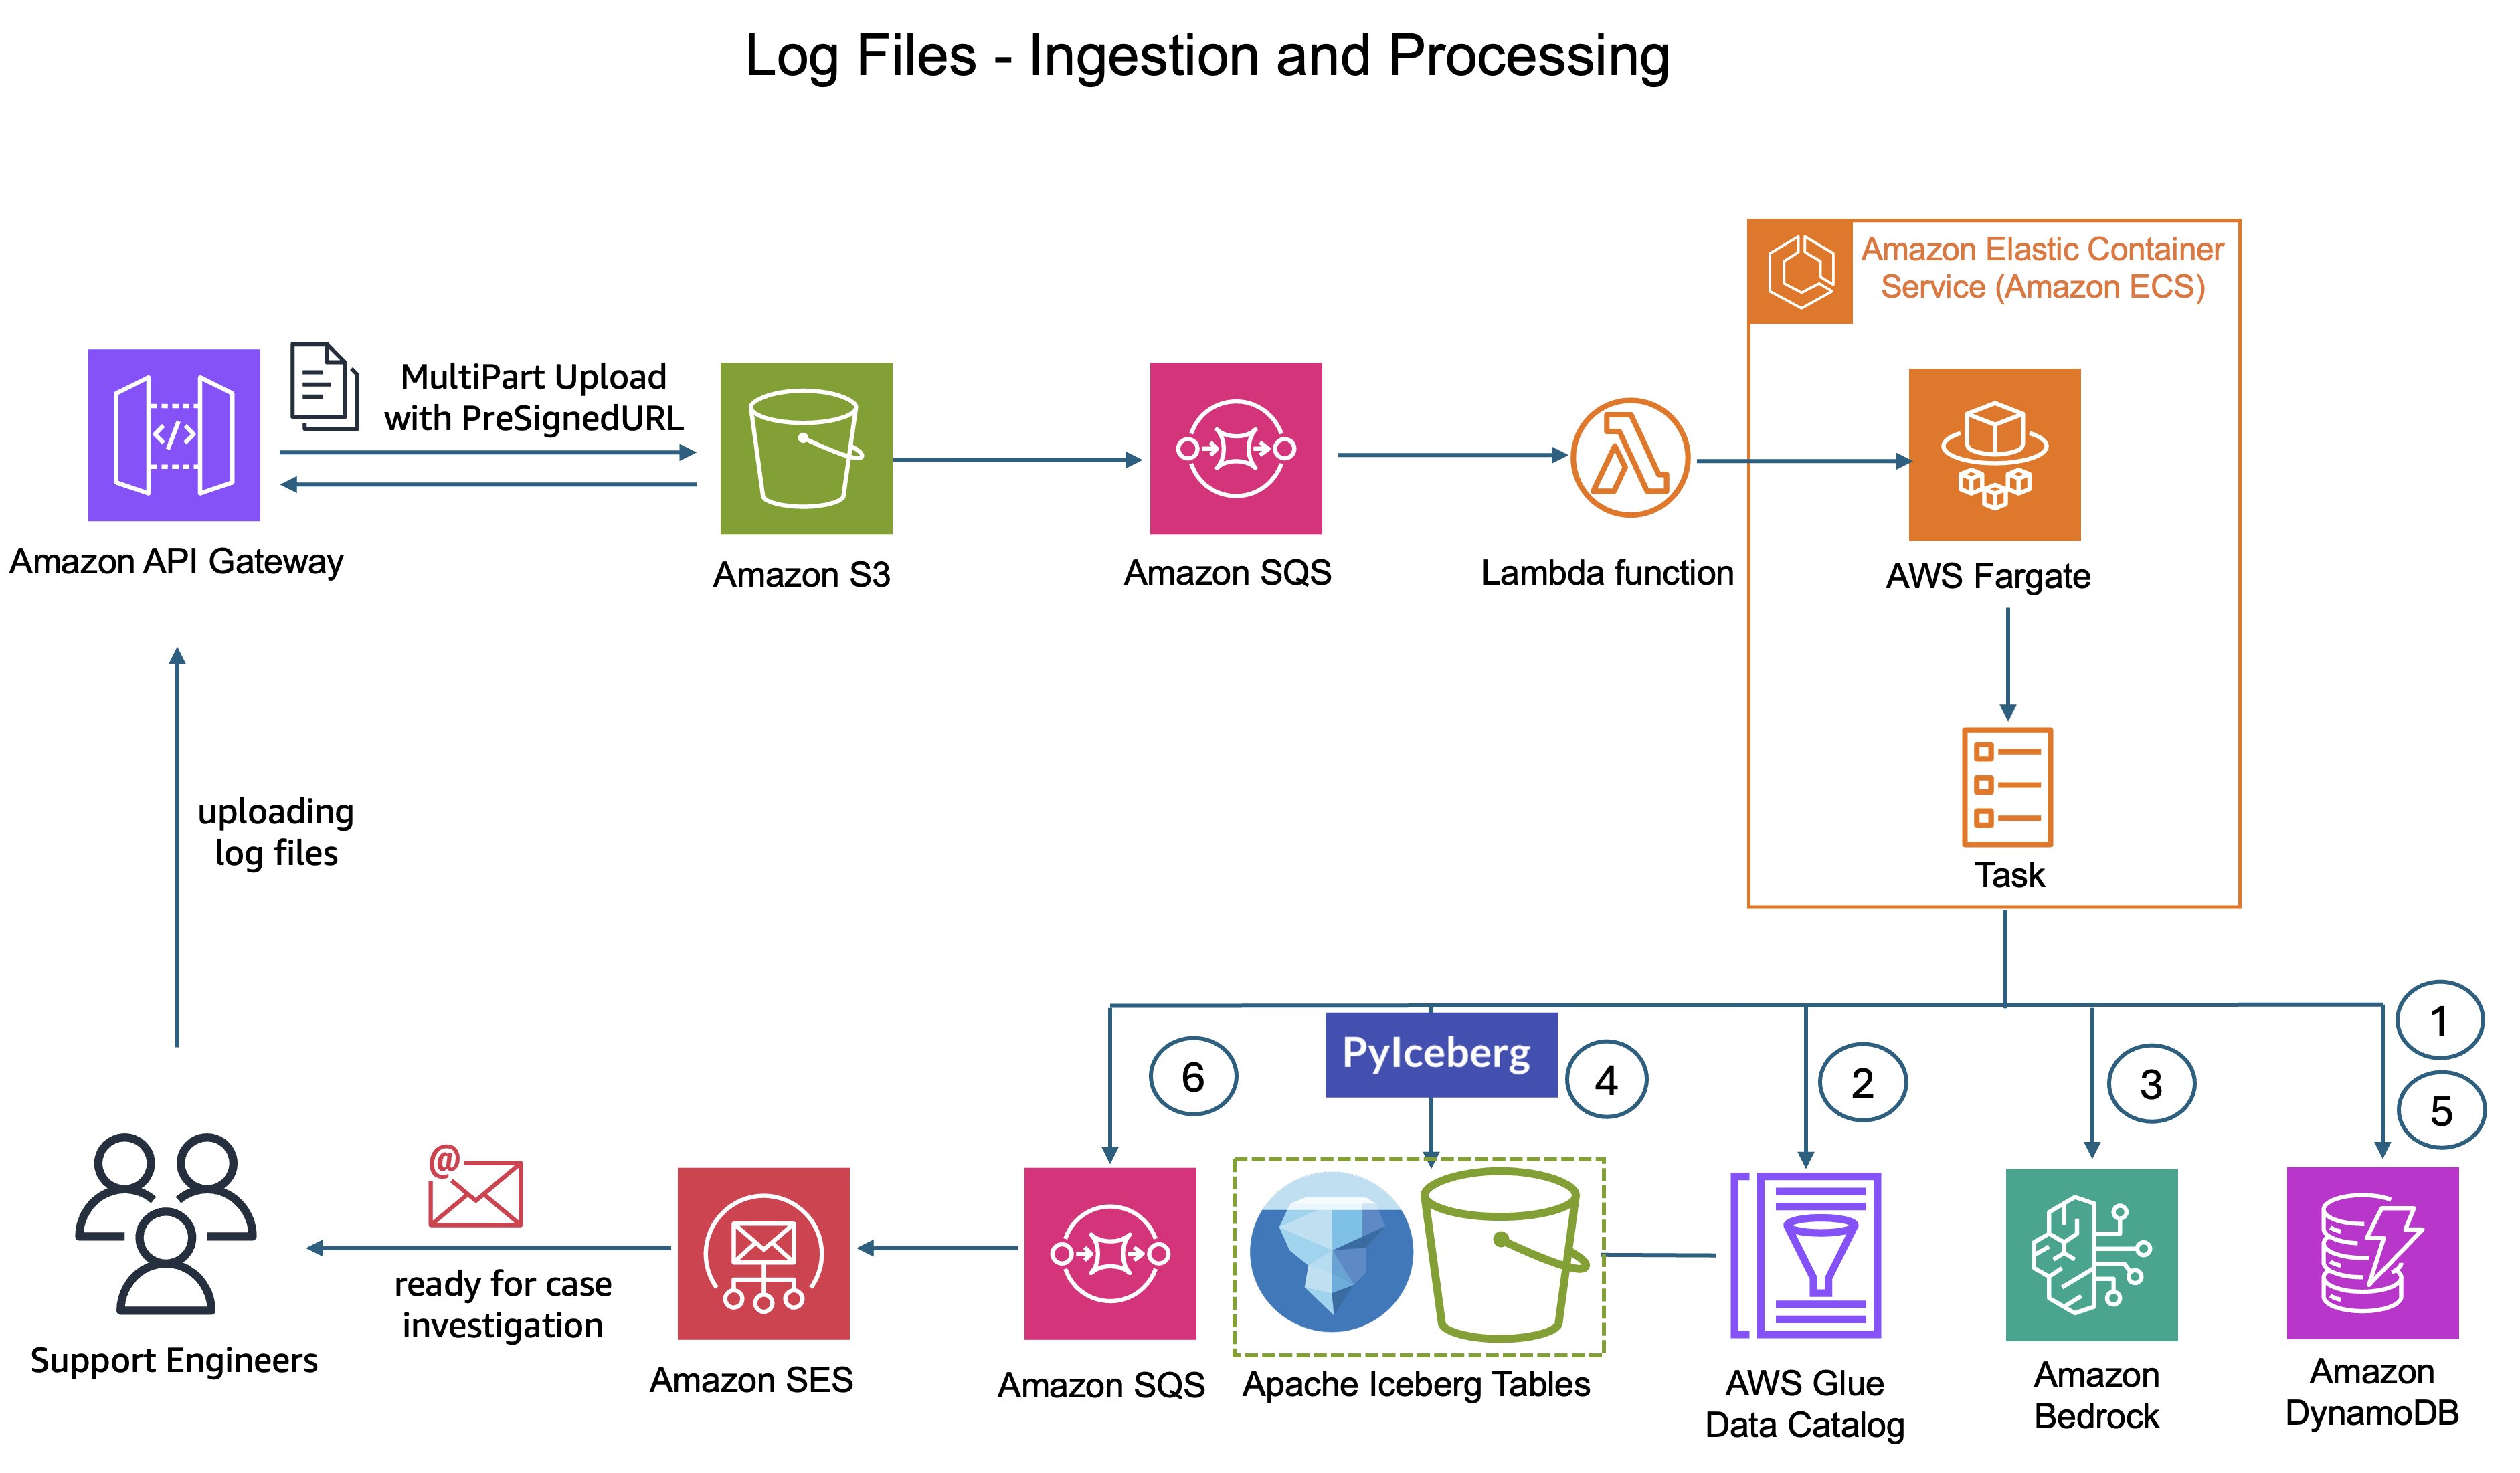
The new system delivers zero touch log processing from upload to query. Support engineers simply upload customer log ZIP files to the system. Here’s where the transformation happens: CyberArk’s custom processing logic still runs on AWS Fargate, but now it uses Amazon Bedrock to intelligently understand the data.
Zero-touch log processing workflow
The system extracts sample log entries from the uploaded log files and sends them to Amazon Bedrock along with context about the log source and table schema from AWS Glue Data Catalog. Amazon Bedrock analyzes the samples, understands the structure, and automatically generates grok patterns optimized for the specific log format.
Grok patterns are structured expressions that define how to extract meaningful fields from unstructured log text. For example, the following grok pattern specifies that a timestamp appears first, followed by a severity level, then a message body %{TIMESTAMP_ISO8601:timestamp} %{LOGLEVEL:severity} %{GREEDYDATA:message}
The system validates these grok patterns against additional samples to verify accuracy before applying them to parse the complete log file. Successfully validated grok patterns are stored in Amazon DynamoDB, creating a repository of known patterns. When the system encounters similar log formats in future uploads, it can retrieve these patterns directly from Amazon DynamoDB, avoiding redundant grok pattern generation. Amazon Bedrock processes log samples in real-time without retaining customer data or using it for model training, maintaining data privacy.
This entire process invokes Claude 3.7 Sonnet model from Amazon Bedrock and is orchestrated by AWS Fargate tasks with retry logic for reliability. The processing uses these AI-generated grok patterns to parse the logs and create or update Iceberg tables using PyIceberg APIs without human intervention.
This automation reduced logs onboarding time from days to minutes, enabling CyberArk to handle diverse customer environments without manual intervention.
Figure 2: Log ingestion architecture diagram showing the flow from S3 upload through AWS Fargate processing with Amazon Bedrock integration to Iceberg table creation
Iceberg simplified and improved CyberArk’s data lake architecture by addressing the two primary bottlenecks in the legacy system: slow schema management and inefficient query performance.
In the legacy architecture, AWS Glue crawlers became a source of operational overhead and latency. Even when triggered on demand, crawlers ran as batch jobs over S3 prefixes to discover partitions and update metadata. As data volumes grew and datasets diversified across vendors and schemas, teams had to manage and operate a growing number of crawler jobs. The resulting delays, often ranging from minutes to hours, slowed data availability and downstream investigation workflows.
Iceberg removes this entire layer of complexity. Iceberg’s intelligent metadata layer automatically tracks table structure, schema changes, and partition information as data is written. When CyberArk’s processing creates or updates Iceberg tables through PyIceberg, the metadata is updated instantly and atomically. There’s no waiting for crawlers jobs to complete, and no risk of stale metadata. The moment data is written, it’s immediately queryable in Amazon Athena.
PyIceberg: Making Iceberg accessible beyond Apache Spark
Working with Iceberg usually involved Apache Spark and the complexity of distributed data processing. PyIceberg changed that by letting CyberArk create and manage Iceberg tables using a simple Python library. CyberArk’s data engineers could write straightforward Python code running on AWS Fargate to create Iceberg tables directly from parsed logs, without spinning up Spark clusters.
This accessibility was essential for CyberArk’s serverless architecture. PyIceberg enabled single stage processing where AWS Fargate tasks could parse logs, apply PII masking, and create Iceberg tables in one pass. The result was simpler code and lower operational overhead.
Metadata-driven query optimization delivers speed
In addition to removing crawlers, Iceberg significantly improved query performance through its intelligent metadata architecture. Iceberg maintains detailed statistics about data files, including min/max values, null counts, and partition information. When support engineers query data in Athena, Iceberg’s metadata layer supports partition pruning and file skipping, making sure queries only read the specific files containing relevant data. For CyberArk’s use case, where tables are partitioned by case ID, this means a query for a specific support case only reads the files for that case, ignoring potentially thousands of irrelevant files. This metadata driven optimization reduced query execution time from minutes to seconds, allowing support engineers to interactively explore data rather than waiting for results.
ACID transactions maintain data consistency
In a multi user support environment where multiple engineers may be analyzing overlapping cases or uploading logs simultaneously, data consistency is essential. Iceberg’s ACID transaction support helps verify that concurrent writes do not corrupt data or create inconsistent states. Each table update is atomic, isolated, and durable, providing the reliability CyberArk needed for production support operations.
Time travel enables historical analysis
Iceberg’s built-in versioning allows support engineers to query historical states of data, essential for understanding how customer issues evolved over time. If an engineer needs to see what the logs looked like when a case was first opened versus after a customer applied a patch, Iceberg’s time travel capabilities make this straightforward. This feature proved essential for complex troubleshooting scenarios where understanding the timeline of events was critical to resolution.
Automated table optimization with AWS Glue
Iceberg tables require periodic maintenance to maintain query performance.
CyberArk enabled AWS Glue automatic table optimization for their Iceberg tables, which handles compaction and expired snapshot cleanup in the background.
For CyberArk’s continuous upload workflow, this automation avoids performance degradation over time. Tables stay optimized without manual intervention from the engineering team.
AI Agents: Autonomous investigation workflow
While the Claude 3.7 Sonnet model from Amazon Bedrock automates grok pattern generation for log ingestion, the more advanced use of Amazon Bedrock comes in the investigation workflow. We use AI agents with Bedrock models to change how support engineers analyze and resolve customer issues.
From manual analysis to AI powered investigation
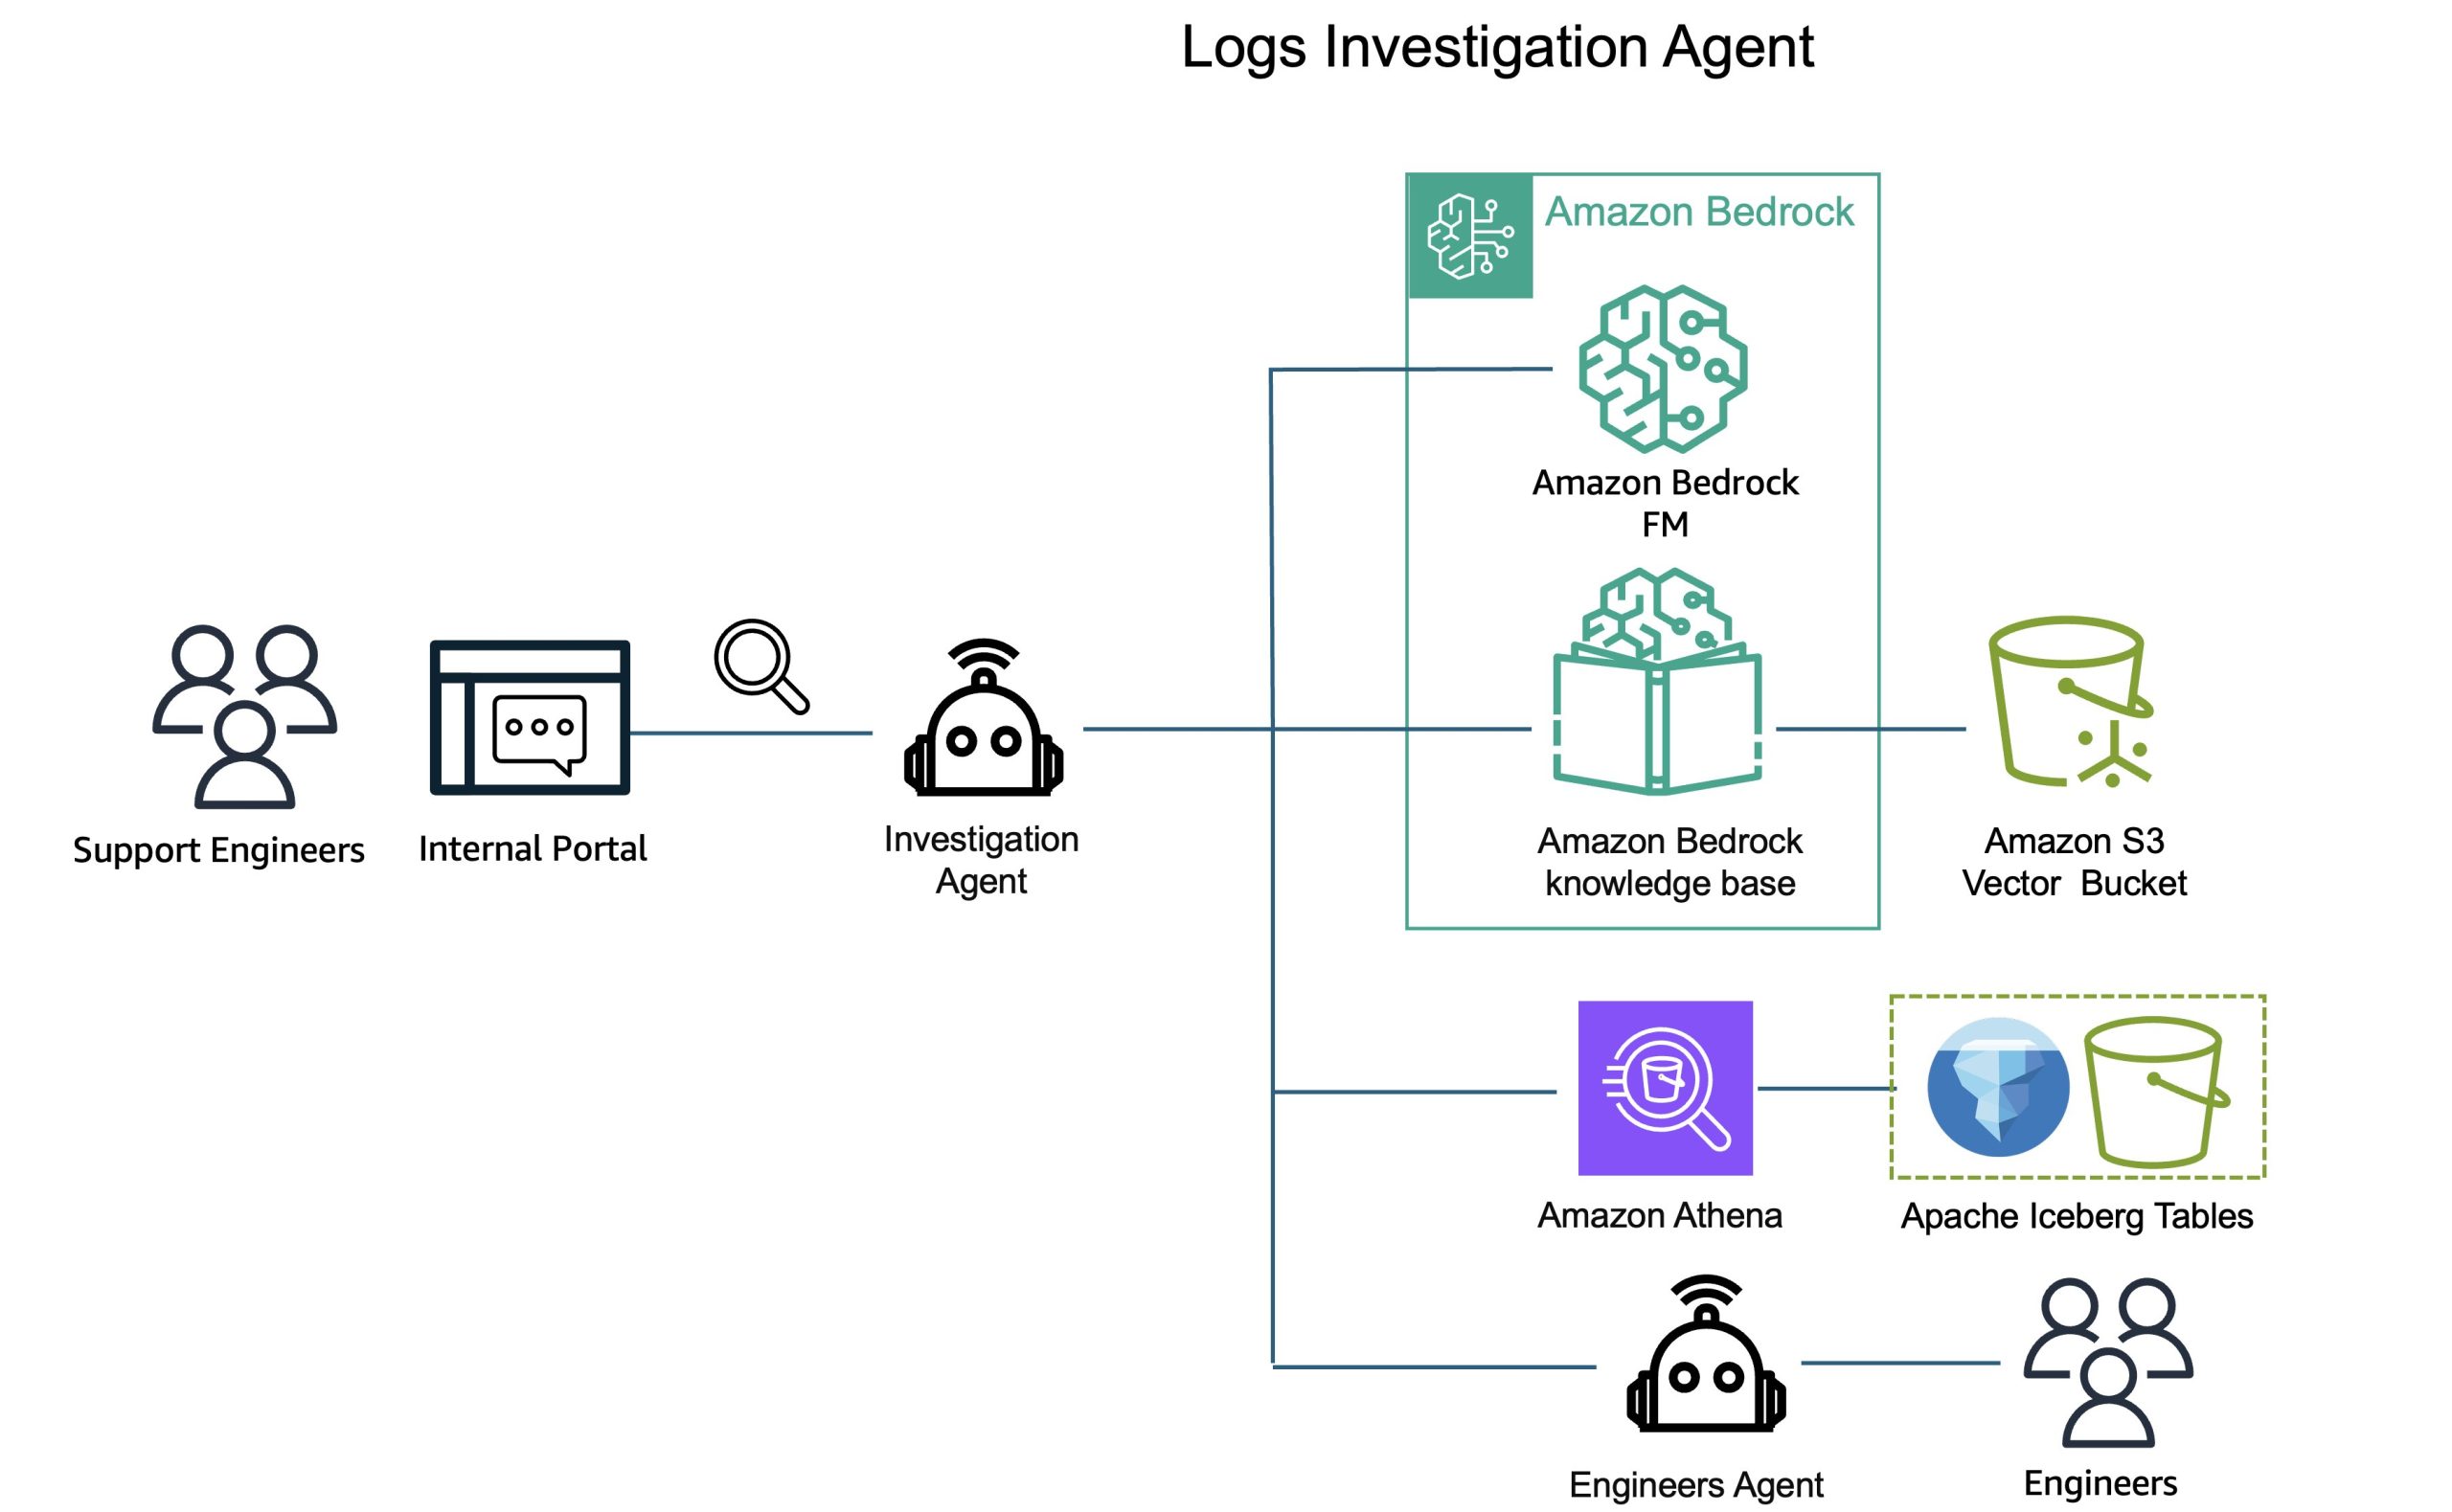
In the legacy workflow, support engineers would manually query data, correlate events across different log sources, search through product documentation, and piece together root cause analysis through trial and error. This process required deep product expertise and could take hours or days depending on issue complexity. AI Agents automate this entire investigation process. Support engineers use an internal portal to ask questions in natural language about customer issues, questions like “Show me authentication errors for case 12345 in the last 24 hours”, “What were the most common errors across cases opened this week?” or “Compare the error patterns between case 12345 and case 12346.”
Behind the scenes, the system fires specialized AI Agents that autonomously perform thorough analysis.
How support agents work
Each AI Agent operates as an intelligent investigator with a clear mission: understand what happened, determine why it happened, and recommend how to fix it. When a support engineer asks a question, the agent collects relevant data by querying Athena to retrieve log data from Iceberg tables, filtering for the specific case and time period relevant to the investigation. The agent then accesses CyberArk’s internal knowledge base for the specific product involved, understanding known issues, common error patterns, and documented solutions. The agent then performs the following analysis:
Flow identification: Analyzes the sequence of events in the logs to understand what actually happened during the customer’s issue
Root cause determination: Correlates log events with product knowledge to identify the underlying cause of the problem
Solution recommendations: Suggests specific remediation steps based on the root cause analysis and known resolution patterns
This entire process happens in minutes, delivering advanced analysis that would have taken support engineers hours to perform manually.
For complex cases where a solution is not found, the support agent escalates to another, specialized agent that interacts with service engineers to collect additional inputs and expertise. This human-in-the-loop approach makes sure that even the most challenging cases receive appropriate attention while still benefiting from the automated investigation workflow. The insights gathered from these escalated cases are automatically fed back into CyberArk’s knowledge base, continuously improving the system’s ability to handle similar issues autonomously in the future.
Amazon Bedrock never shares customer data with model providers or uses it to train foundation models, case data and investigation insights remain within CyberArk’s environment.
Concurrent agent execution at scale
When multiple support engineers investigate different cases simultaneously, the solution runs specialized agents concurrently. CyberArk currently uses Claude 3.7 Sonnet as the foundation model for these agents. Each agent works independently on its assigned investigation, operating in parallel without resource contention. This concurrent execution allows the investigation workflow to scale automatically with support volume, handling peak loads without performance degradation.
AI-powered investigation advantage
This AI-powered investigation workflow delivers two key advantages.
Investigations that took hours now complete in minutes, enabling support engineers to resolve up to 4x more cases per day.
The system also creates a continuous learning feedback loop. When cases require manual resolution by engineers, these resolutions are automatically recorded and fed back into the knowledge base. Future investigations benefit from this accumulated expertise, with agents applying lessons learned from previous manual resolutions to similar cases. Amazon Bedrock doesn’t use customer data to train foundation models. Case data and investigation insights remain within CyberArk’s environment. This automated feedback mechanism means the investigation workflow becomes more effective over time, continuously improving resolution accuracy and speed.
Figure 3: Investigation workflow diagram showing natural language query through AI Agents to Athena queries and knowledge base analysis
Scaling without proportional engineering growth
The business impact of this AI automation is significant. CyberArk can expand its vendor coverage and product portfolio without adding data engineering headcount. The same system that handles today’s log types will automatically handle tomorrow’s additions, whether that’s ten new formats or thousands, significantly reducing time to market for new product and vendor integrations.
The results: Significant improvements in resolution time and productivity
The transformation delivered measurable improvements across every key metric.
Resolution time: CyberArk achieved up to 95% reduction in time from case assignment to resolution. Simple cases that used to take 4 to 6 hours now take just 15 to 30 minutes. Complex cases that previously took up to 15 days are now completed in 2 to 4 hours.
Engineer productivity: Support engineers now handle 8 to 12 cases per day, compared to just 2 to 3 cases before. This means each engineer is helping up to 4x more customers.
Data availability: Logs are queryable within minutes of upload instead of waiting hours or days. Support engineers can start investigating issues almost immediately after receiving customer data.
Operational efficiency: The system requires zero manual intervention for new log formats or schema changes. Cases that used to require days of data engineering work now happen automatically.
Cost optimization: The serverless architecture alleviated idle infrastructure costs while scaling automatically with demand. CyberArk only pays for what they use, when they use it.
Customer satisfaction: Faster resolution times and proactive issue identification significantly improved the customer experience. Problems get solved in hours instead of days, and customers spend less time waiting for answers.
What’s next?
While AWS continues to innovate across both data lake management and agentic AI infrastructure, the following capabilities align well with CyberArk’s architecture and may offer additional operational benefits as the system scale.
Agent infrastructure maturity
As the agent-based architecture scales to handle thousands of concurrent investigations, CyberArk is transitioning to Amazon Bedrock AgentCore for future agent deployments. AgentCore provides a managed runtime for production AI agents with enhanced observability through AWS X-Ray integration, intelligent memory for context retention across sessions, and streamlined operational workflows. While the current AI Agents implementation delivers the performance and reliability CyberArk needs today, AgentCore represents a natural evolution path as operational requirements grow, offering framework-agnostic deployment, automatic scaling, and comprehensive monitoring capabilities without infrastructure management overhead.
Amazon S3 Tables
CyberArk’s current architecture uses Iceberg tables stored in Amazon S3 buckets. Amazon S3 Tables offers fully managed Iceberg tables with built-in optimization.
As CyberArk continue to scale with hundreds of Iceberg tables and rapid data growth, CyberArk is exploring a migration to Amazon S3 Tables to further reduce operational overhead.
S3 Tables remove the need to set up and monitor AWS Glue maintenance jobs. It automatically performs maintenance to enhance the performance of Iceberg tables, including unreferenced file removal, file compaction, and snapshot management. Additionally, S3 Tables provides Intelligent-Tiering that automatically moves data between storage classes based on access patterns, optimizing storage costs without manual intervention.
Because S3 Tables uses Iceberg open table format, migration would not require changes to existing Athena queries and PyIceberg code. This flexibility allows CyberArk to evaluate and adopt S3 Tables when the operational and cost benefits align with their business needs.
Conclusion
CyberArk’s transformation demonstrates how combining modern data lake architecture with AI automation can significantly change operational economics. By combining Iceberg’s intelligent metadata management with AI-powered automation from Amazon Bedrock, CyberArk transformed case resolution from days to minutes while enabling support operations to scale automatically with business growth. Support engineers now spend their time solving customer problems instead of wrangling data, customers receive faster resolutions, and the system scales automatically with the business.
Amazon OpenSearch Service is a fully managed service for search, analytics, and observability workloads, helping you index, search, and analyze large datasets with ease. Making sure your OpenSearch Service domain is right-sized—balancing performance, scalability, and cost—is critical to maximizing its value. An over-provisioned domain wastes resources, whereas an under-provisioned one risks performance bottlenecks like high latency or write rejections.
In this post, we guide you through the steps to determine if your OpenSearch Service domain is right-sized, using AWS tools and best practices to optimize your configuration for workloads like log analytics, search, vector search, or synthetic data testing.
Why right-sizing your OpenSearch Service domain matters
Right-sizing your OpenSearch Service domain provides optimal performance, reliability, and cost-efficiency. An undersized domain leads to high CPU utilization, memory pressure, and query latency, whereas an oversized domain drives unnecessary spend and resource waste. By continuously matching domain resources to workload characteristics such as ingestion rate, query complexity, and data growth, you can maintain predictable performance without overpaying for unused capacity.
Beyond cost and performance, right-sizing facilitates architectural agility. It helps make sure your cluster scales smoothly during traffic spikes, meets SLA targets, and sustains stability under changing workloads. Regularly tuning resources to match actual demand optimizes infrastructure efficiency and supports long-term operational resilience.
Key Amazon CloudWatch metrics
OpenSearch Service provides Amazon CloudWatchmetrics that offer insights into various aspects of your domain’s performance. These metrics fall into 16 different categories, including cluster metrics, EBS volume metrics, and instance metrics. To determine if your OpenSearch Service domain is misconfigured, monitor these common symptoms that indicate resizing or optimization may be necessary. These are caused by imbalances in resource allocation, workload demands, or configuration settings. The following table summarizes these parameters:
CloudWatch Metrics
Parameter
CPU Utilization Metrics
CPUUtilization: Average CPU usage across all data nodes.
Optimal range: 60-80% for sustained workloads
Primary control plane CPU utilization (for dedicated primary nodes): Average CPU usage on primary nodes.
Optimal range: Under normal conditions <50%
Memory Utilization Metrics
JVMMemoryPressure: Percentage of heap memory used across data nodes.
Optimal range: 65–85%
Note: With Garbage First Garbage Collector (G1GC), JVM may delay collections to optimize performance. Evaluate JVMMemoryPressure together with GC metrics (Old Gen usage and GC pause time) to confirm true pressure trends.
MasterJVMMemoryPressure: Heap usage on dedicated primary nodes.
Optimal range: <80%
Note: Occasional spikes are normal during state updates; sustained high memory pressure warrants scaling or tuning.
Storage Metrics
StorageUtilization: Percentage of storage space used.
Optimal range: 70–85%
FreeStorageSpace: Available storage in MB.
Critical threshold: When approaching the read-only threshold.
Node Level Search and Indexing Performance
(These latencies are not per-request latencies or rate, but at node level based on shards assigned to a node.)
SearchLatency: Average time for search requests.
Baseline establishment: Monitor during normal operations.
IndexingLatency: Average time for indexing operations.
Impact: Can indicate CPU or I/O bottlenecks.
SearchRate and IndexingRate: Requests per minute for search and indexing.
Usage: Correlate with latency metrics to understand performance impact.
Cluster Health Indicators
ClusterStatus.yellow and ClusterStatus.red:
Yellow status: Some replica shards are unassigned.
Red status: Some primary shards are unassigned (data loss risk).
Nodes
What it measures: Number of nodes in the cluster.
Usage: Track node failures and recovery patterns.
Signs of under-provisioning
Under-provisioned domains struggle to handle workload demands, leading to performance degradation and cluster instability. Look for sustained resource pressure and operational errors that signal the cluster is running beyond its limits. For monitoring, you can set CloudWatch alarms to catch early signals of stress and prevent outages or degraded performance. The following are critical warning signs:
High CPU utilization for data nodes (>80%) sustained over time (such as more than 10 minutes)
High CPU utilization for primary nodes (>60%) sustained over time (such as more than 10 minutes)
JVM memory pressure consistently high (>85%) for data and primary nodes
Storage utilization reaching high (>85%)
Increasing search latency with stable query patterns (increasing by 50% from baseline)
Frequent cluster status yellow/red events
Node failures under normal load conditions
When resources are constrained, the end-user experience suffers with slower searches, failed indexing, and system errors. The following are key performance impact indicators:
The following table summarizes CloudWatch metric symptoms, possible causes, and potential solutions.
CloudWatch metric symptom
Causes and solution
FreeStorageSpacedrops <20%
Storage pressure occurs when data volume outgrows local storage due to high ingestion, long retention without cleanup, or unbalanced shards. Lack of tiering (such as UltraWarm) further worsens capacity issues.
CPUUtilization and JVMMemoryPressure consistently >70%
High CPU or JVM pressure arises when instance sizes are too small or shard counts per node are excessive, leading to frequent GC pauses. Inefficient shard strategy, uneven distribution, and poorly optimized queries or mappings further spike memory usage under heavy workloads.
Solution: Address high CPU/JVM pressure by scaling vertically to larger instances (such as from r6g.large to r6g.xlarge) or adding nodes horizontally. Optimize shard counts relative to heap size, smooth out peak traffic, and use slow logs to pinpoint and tune resource-heavy queries.
SearchLatency or IndexingLatency spikes >500 milliseconds
Thread pool rejections often stem from resource contention like high CPU/JVM pressure or GC pauses. Inefficient shard sizing, over-sharding, and overly complex queries (deep aggregations, frequent cache evictions) further increase overhead and push tasks into rejection.
Solution: Reduce query latency by optimizing queries with profiling, tuning shard sizes (10–50 GB each), and avoiding over-sharding. Improve parallelism by scaling the cluster, adding replicas for read capacity, increasing cache through larger nodes, and setting appropriate query timeouts.
Thread pool rejections occur when high concurrent requests overflow queues beyond capacity, especially with undersized nodes limited by vCPU-based threads. Sudden unscaled traffic spikes further overwhelm pools, causing tasks to be dropped or delayed.
Solution: Mitigate thread pool rejections by enforcing shard balance across nodes, scaling horizontally to boost thread capacity, and managing client load with retries and reduced concurrency. Monitor search queues, right-size instances for vCPUs, and cautiously tune thread pool settings to handle bursty workloads.
ThroughputThrottle or IopsThrottle reach 1
I/O throttling arises when Amazon EBS or Amazon EC2 limits are exceeded, such as gp3’s 125 MBps baseline, or when burst credits are depleted due to sustained spikes. Mismatched volume types and heavy operations like bulk indexing without optimized storage further amplify throughput bottlenecks.
Solution: Address I/O throttling by upgrading to gp3 volumes with higher baseline or provisioning extra IOPS and consider I/O-optimized instances like i3/i4 families while monitoring burst balance. For sustained workloads, scale nodes or schedule heavy operations during off-peak hours to avoid hitting throughput caps.
Signs of over-provisioning
Over-provisioned clusters show consistently low utilization across CPU, memory, and storage, suggesting resources far exceed workload demands. Identifying these inefficiencies helps reduce unnecessary spend without impacting performance. You can use CloudWatch alarms to track cluster health and cost-efficiency metrics over 2–4 weeks to confirm sustained underutilization:
Low CPU utilization for data and primary nodes (<40%) sustained over time
Low JVM memory pressure for data and primary nodes (<50%)
Excessive free storage (>70% unused)
Underutilized instance types for workload patterns
Monitor cluster indexing and search latencies constantly as the cluster is being downsized—these latencies should not increase if the cluster is eliminating unused capacity. Also, it’s recommended to reduce nodes one at a time and continue to observe latencies to continue further downturn. By right-sizing instances, reducing node counts, and adopting cost-efficient storage options, you can align resources to actual usage. Optimizing shard allocation further supports balanced performance at a lower cost.
Best practices for right-sizing
In this section, we discuss best practices for right-sizing.
Iterate and optimize
Right-sizing is an ongoing process, not a one-time exercise. As workloads evolve, continuously monitor CPU, JVM memory pressure, and storage utilization using CloudWatch to make sure they remain within healthy thresholds. Rising latency, queue buildup, or unassigned shards often signal capacity or configuration issues that require attention.
Regularly review slow logs, query latency, and ingestion trends to identify performance bottlenecks early. If search or indexing performance degrades, consider scaling, rebalancing shards, or adjusting retention policies. Periodic reviews of instance sizes and node count help align cost with demand, maintaining 200-millisecond latency targets while avoiding over-provisioning. Consistent iteration helps your OpenSearch Service domain remain performant and cost-efficient over time.
Establish baselines
Monitor for 2–4 weeks after initial deployment and document peak usage patterns and seasonal variations. Record performance during different workload types. Set appropriate CloudWatch alarm thresholds based on your baselines.
Regular review process
Conduct weekly metric reviews during initial optimization and monthly assessments for stable workloads. Conduct quarterly right-sizing exercises for cost optimization.
Scaling strategies
Consider the following scaling strategies:
Vertical scaling (instance types) – Use larger instance types when performance constraints stem from CPU, memory, or JVM pressure, and overall data volume is within a single node’s capacity. Choose memory-optimized instances (such as r8g, r7g, or r7i) for heavy aggregation or indexing workloads. Use compute-optimized instances (c8g, c7g, or c7i) for CPU-bound workloads such as query-heavy or log-processing environments. Vertical scaling is ideal for smaller clusters or testing environments where simplicity and cost-efficiency are priorities.
Horizontal scaling (node count) – Add more data nodes when storage, shard count, or query concurrency increases beyond what a single node can handle. Maintain an odd number of primary-eligible nodes (typically three or five) and use dedicated primary nodes for clusters with more than 10 data nodes. Deploy across three Availability Zones for high availability in production. Horizontal scaling is preferred for large, production-grade workloads requiring fault tolerance and sustained growth. Use _cat/allocation?v to verify shard distribution and node balance:
GET /_cat/allocation/node_name_1,node_name_2,node_name_3
Optimize storage configuration
Use the latest generation of Amazon EBS General Purpose (gp) volumes for improved performance and cost-efficiency compared to earlier versions. Monitor storage growth trends using ClusterUsedSpace and FreeStorageSpace metrics. Maintain data utilization below 50% of total storage capacity to allow for growth and snapshots.
Choose storage tiers based on performance and access patterns—for example, enable UltraWarm or cold storage for large, infrequently accessed datasets. Move older or compliance-related data to cost-efficient tiers (for analytics or WORM workloads) only after ensuring the data is immutable.
Use the _cat/indices?v API to monitor index sizes and refine retention or rollover policies accordingly:
GET /_cat/indices/index1,index2,index3
Analyze shard configuration
Shards directly affect performance and resource usage, so an appropriate shard strategy should be used. The indexes that have heavy ingestion and searches should have a number of shards in the order of number of nodes for better efficiency across all data nodes in the cluster. We recommend keeping shard sizes between 10–30 GB for search workloads and up to 50 GB for log analytics workloads and limit to <20 shards per GB of JVM heap.
Run _cat/shards?v to confirm even shard distribution and no unassigned shards. Evaluate over-sharding by checking JVMMemoryPressure (>80%) or SearchLatency spikes (>200 milliseconds) from excessive shard coordination. Assess under-sharding if IndexingLatency (>200 milliseconds) or low SearchRate indicates limit parallelism. Use _cat/allocation?v to identify unbalanced shard sizes or hot spots on nodes:
GET /_cat/allocation/node_name_1,node_name_2,node_name_3
Handling unexpected traffic spikes
Even well right-sized OpenSearch Service domains can face performance challenges during sudden workload surges, such as log bursts, search traffic peaks, or seasonal load patterns. To handle such unexpected spikes effectively, consider implementing the following best practices:
Enable Auto-Tune – Automatically adjust cluster settings based on current usage and traffic patterns
Distribute shards effectively – Avoid shard hotspots by using balanced shard allocation and index rollover policies
Pre-warm clusters for known events – For expected peak periods (end-of-month reports, marketing campaigns), temporarily scale up before the spike and scale down afterward
Monitor with CloudWatch alarms – Set proactive alarms for CPU, JVM memory, and thread pool rejections to catch early stress indicators
Deploy CloudWatch alarms
CloudWatch alarms perform an action when a CloudWatch metric exceeds a specified value for some amount of time to take remediation action proactively.
Conclusion
Right-sizing is a continuous process of observing, analyzing, and optimizing. By using CloudWatch metrics, OpenSearch Dashboards, and best practices around shard sizing and workload profiling, you can make sure your domain is efficient, performant, and cost-effective. Right-sizing your OpenSearch Service domain helps provide optimal performance, cost-efficiency, and scalability. By monitoring key metrics, optimizing shards, and using AWS tools like CloudWatch, ISM, and Auto Scaling, you can maintain a high-performing cluster without over-provisioning.
To provide the best experiences, we use technologies like cookies to store and/or access device information. Consenting to these technologies will allow us to process data such as browsing behavior or unique IDs on this site. Not consenting or withdrawing consent, may adversely affect certain features and functions.
Functional
Always active
The technical storage or access is strictly necessary for the legitimate purpose of enabling the use of a specific service explicitly requested by the subscriber or user, or for the sole purpose of carrying out the transmission of a communication over an electronic communications network.
Preferences
The technical storage or access is necessary for the legitimate purpose of storing preferences that are not requested by the subscriber or user.
Statistics
The technical storage or access that is used exclusively for statistical purposes.The technical storage or access that is used exclusively for anonymous statistical purposes. Without a subpoena, voluntary compliance on the part of your Internet Service Provider, or additional records from a third party, information stored or retrieved for this purpose alone cannot usually be used to identify you.
Marketing
The technical storage or access is required to create user profiles to send advertising, or to track the user on a website or across several websites for similar marketing purposes.