Today we are announcing that Amazon has signed a definitive agreement to acquire DuckLabs, the Amsterdam-based company behind the open-source analytical database DuckDB. We expect the transaction to close shortly, subject to customary closing conditions. Hannes Mühleisen and Mark Raasveldt, who created DuckDB and co-founded DuckLabs, will continue leading the team and the open-source project’s technical direction as part of AWS. The DuckDB open-source project will also continue to be driven by the DuckLabs team, remain open source under the independent Foundation (the non-profit that oversees DuckDB), and available under the MIT license as it does today (see DuckLabs blog).
Data has always been a core asset and differentiator for companies. That is true now more than ever, as organizations use their data to customize inference and build AI agents. For 20 years AWS has driven the frontier of data, starting with the launch of Amazon S3 to create data lakes for every business, the first cloud analytics service in Amazon EMR, the first cloud data warehouse with Amazon Redshift and the many capabilities that we have introduced with Athena, Glue ETL, etc. We continue innovating for AWS customers on the data frontier including providing Apache Iceberg capabilities directly in S3 Tables, vector storage in the data lake and our new optimized Graviton-based Redshift clusters.
DuckDB has also been at the forefront of changing how the world works with data. Hannes and Mark started DuckDB while at Centrum Wiskunde & Informatica (CWI), the national research institute in the Netherlands that also invented Python. The founders of DuckDB realized that older databases and analytics engines like Spark focused on performance for very large data processing but didn’t have an effective way to “scale down” to smaller size data queries that form the backbone of what most customers do with SQL analytics.
DuckDB set out to solve the problem of blazingly fast performance for the 90%+ of data queries in the world today, that often runs 1 terabyte of data or less as part of analysis and dashboarding. DuckDB’s architecture is based on that core premise of “make the everyday SQL query super fast” so DuckDB runs in-process to other applications which simplifies and speeds up data exchange with the application. DuckDB gets big performance gains from its vectorized execution because it does not require a heavy compiler to run simple statements like SELECT * FROM table. And what works for everyday queries also (unsurprisingly) works very well for agents because agents behave a lot like people when interacting with data. They poke. They experiment. They run exploratory analysis on small data sets before figuring out what they really want to do. DuckDB ends up being naturally optimized for AI agents to use. What started as an academic project is now widely adopted across data engineering, data science, analytics, and now AI agents, for its simplicity of use and raw performance. We plan to combine the superpower of DuckDB at everyday queries of a terabyte or less with the proven exabyte-plus enterprise scale of S3 and our AWS analytics services of Redshift, Athena, EMR, Glue-ETL, and SageMaker platform which power analytics across hundreds of terabytes to petabyte of data. Andy Warfield, Distinguished Engineer at AWS, talks about DuckDB and the Changing Physics of Analytics in Werner Vogel’s All Things Distributed blog.
Our customers use DuckDB today with AWS services and tell us how much they love it for its speed and simplicity. For example, DuckDB today executes SQL directly against external files, such as Parquet, CSV, and JSON, stored locally or on cloud storage like S3 for unparalleled performance and significantly lower cost. DuckDB can also run in-process to AWS Lambda functions.
David Feng, Executive Director, Scientific Computing at Allen Institute, said “The Allen Institute accelerates science for a healthier world by tackling the biggest questions in biology at a large scale, and that involves extensive analysis of large, multimodal data. We started using DuckDB to analyze terabytes of scientific data in 2025 and love it. We are storing data in S3 for realtime quality control and analysis of neurophysiology and behavior data, critical to driving the next data acquisition. Queries that took minutes now come back in less than a second, enabling completely new ways of interacting with data.”
We are excited to make DuckDB applications run best on AWS, and will continue to invest in deep integration between DuckDB and our building block services.
We are also using DuckDB in our own AWS infrastructure. When Amazon Quick wanted to augment the performance of their custom dashboarding engine, they picked DuckDB to query data in S3 Tables. The Quick team found that the DuckDB engine scales effortlessly with the number of CPUs, and its single library can easily plug into the internal Quick control plane subsystems. Since we launched Quick in October 2025, we have processed over 2.5B queries using our custom Quick query engine with the DuckDB integrations and optimizations. These DuckDB integrations and optimizations helped Amazon Quick reduce average query latency by 30%. We are going to look at how we can integrate DuckDB’s performance and simplicity in our other AWS services across data and analytics.
Stay tuned for more about how DuckLabs and AWS will reinvent the frontier of data together for applications, data engineers, and AI, meeting customers where they are today and giving them the benefits of DuckDB’s innovation within AWS.
This post was co-written with Michael Stephan, Senior Principal Product Manager, and Christian Kreuzberger, Principal Software Engineer, at Dynatrace.
AI-driven software delivery changes how code gets written, but not what production demands of it. A generated change still has to fit the traffic your service receives, the dependencies it calls, and the capacity limits it runs within. Without that context, you validate the change after it ships, which adds rework and deployment risk.
Kiro turns intent into specifications, code, and pull requests. AWS DevOps Agent investigates incidents and proposes mitigations. Bluebox by Dynatrace supplies the runtime topology, dependency, and traffic data that both draw on, so each change and each investigation is grounded in how the system behaves rather than how it’s expected to behave. In this post, we will follow a travel-booking example from feature design through post-deployment remediation. You’ll see how telemetry from Bluebox shapes a change in Kiro, how AWS DevOps Agent investigates an incident, and where human review and existing CI/CD controls remain in the process.
What are Kiro and AWS DevOps Agent?
Kiro is an agentic development environment that applies AI across the software development lifecycle. Its spec-driven workflow organizes a feature request into requirements, design, and implementation tasks before generating any code.
AWS DevOps Agent is a frontier agent for software delivery and operations across AWS, multicloud, and on-premises environments. It investigates incidents, identifies likely root causes, and recommends mitigations. Its release management capability (Preview) reviews code for release readiness and runs release tests before deployment.
Bluebox by Dynatrace: Helps agents ship the code you trust to production
To close the loop between code generation and production context, Kiro and AWS DevOps Agent rely on real-time production intelligence. This is where Bluebox by Dynatrace fits in. Bluebox provides the observability foundation that detects problems, measures their impact, and surfaces the runtime application topology, service dependencies, and actual traffic patterns that make AI-generated code and autonomous investigations truly production-aware.
Without production telemetry, AI-generated code operates in a vacuum – it cannot know that an endpoint handles 40:1 read-to-write ratios, that a service dependency has specific latency characteristics, or how API traffic fluctuates throughout the day. Bluebox grounds actions taken by Kiro and AWS DevOps Agent in how the system actually behaves, not in assumptions about how it should behave.
How the closed loop works
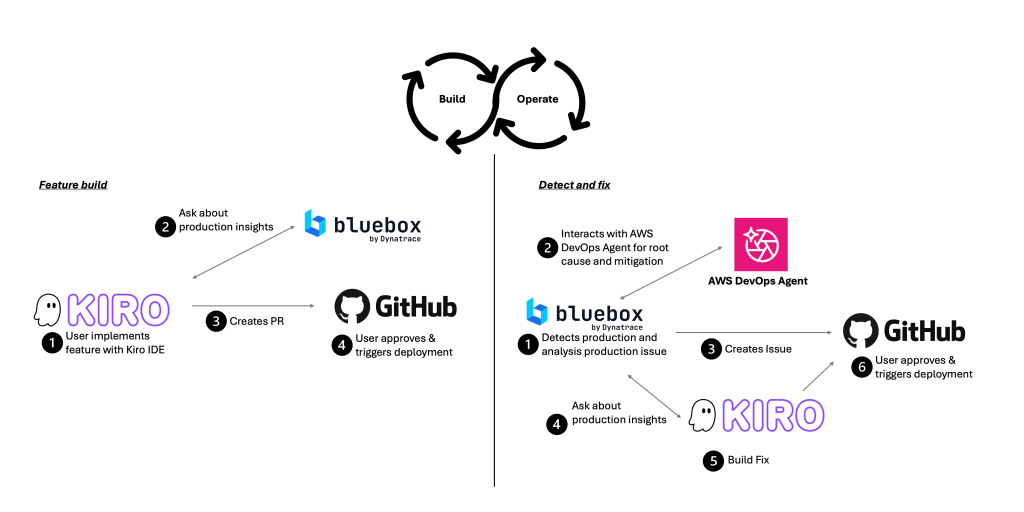
The combination of Kiro, AWS DevOps Agent, and Bluebox creates a continuous cycle from development through production and back:
Production-aware code generation: Before code is written, Kiro retrieves runtime context from Bluebox – service topology, traffic patterns, and resource utilization. Kiro’s spec-driven workflow translates this context into requirements and generates code that aligns with real production conditions from the first commit.
Confident code review: Kiro generates pull requests with production evidence attached. The release management capability in AWS DevOps Agent reviews the change for dependency impacts, drifts from internal standards, and production readiness – running autonomous tests in isolated environments.
Continuous monitoring: After deployment, Dynatrace continuously monitors application behavior. When an anomaly occurs, Bluebox detects it and surfaces full production context.
Autonomous investigation: Bluebox triggers AWS DevOps Agent with the relevant observability and topology data. AWS DevOps Agent performs a deep investigation, correlating telemetry, logs, infrastructure changes, and deployment history to pinpoint the root cause.
Automated remediation: AWS DevOps Agent generates the mitigation plan from the observability and runtime data that Bluebox provides. Bluebox adds that plan to the investigation report and files it as a GitHub issue. Kiro then proposes a production-aware fix as a pull request for your review, completing the loop.
Figure 1: Bluebox supports the closed loop from feature build to operations.
Next, we walk through a concrete example of this workflow in action.
Walkthrough
We follow a travel-booking application through two connected scenarios: shipping a new feature with production context, then responding to a production incident after it deploys.
Building a production-aware feature
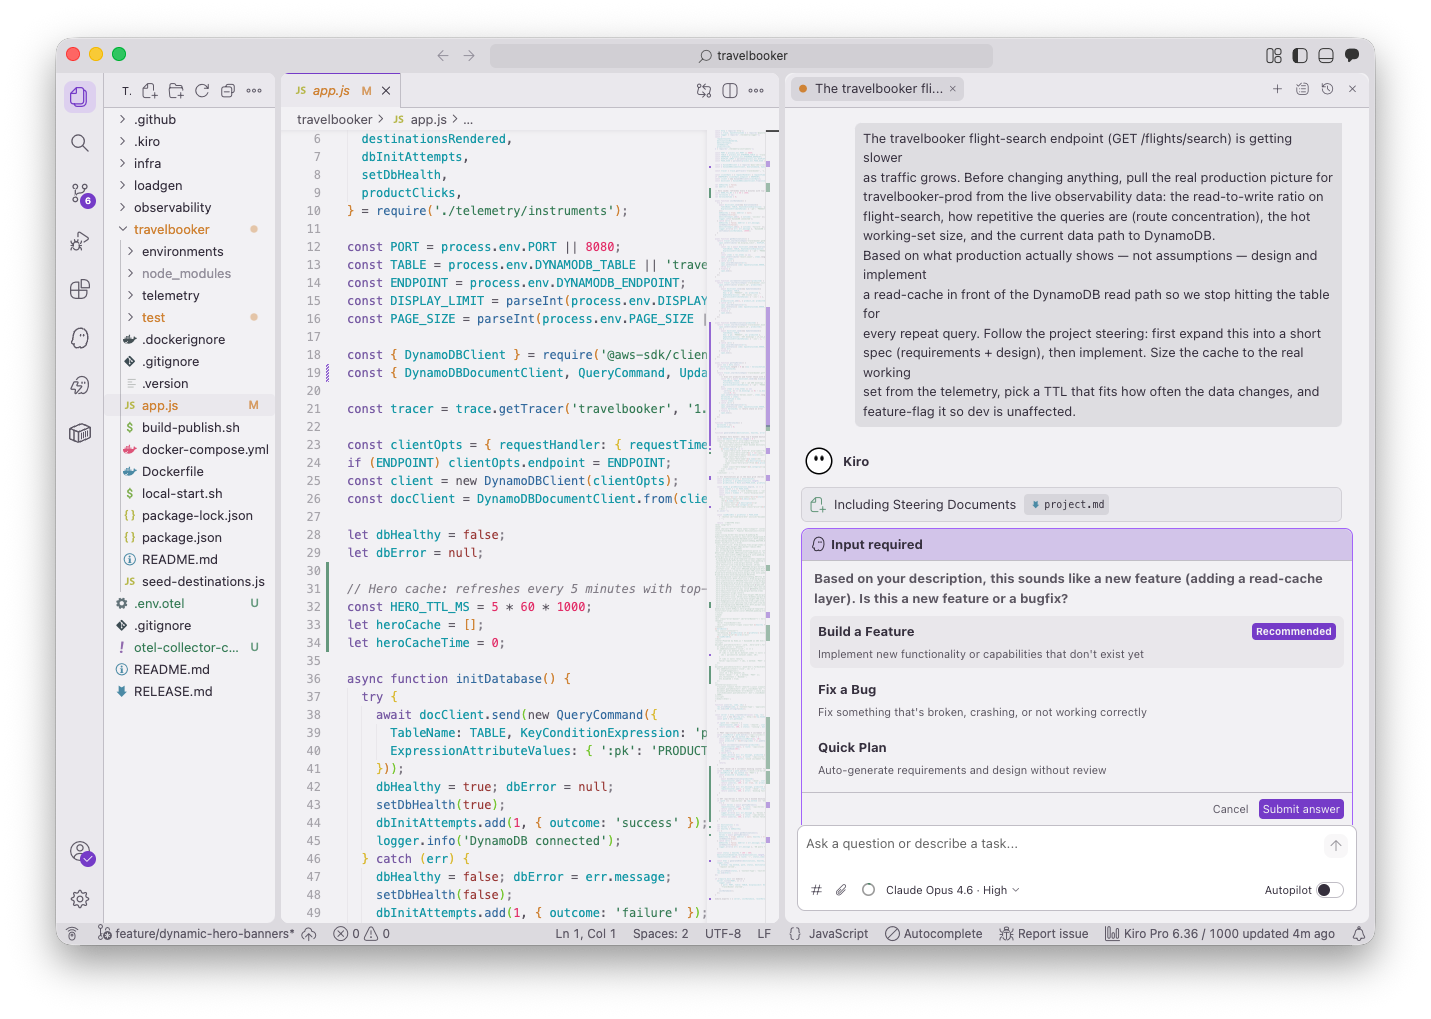
Consider a team enhancing a travel booking application to improve customer experience. You begin by describing a new feature in Kiro, such as updating how products are displayed or adjusting backend logic to support new capabilities. In this case, we are using Kiro IDE.
Figure 2. A feature request in Kiro, with the project’s steering documents loaded for context.
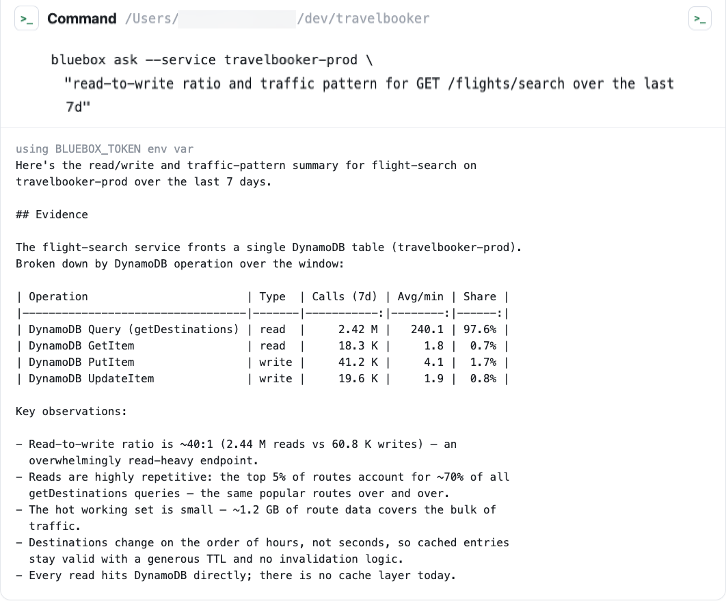
Kiro’s spec-driven workflow expands this request into structured requirements before writing code. You connect Kiro to the Bluebox CLI to retrieve the full production context from Dynatrace: service dependencies, runtime topology, and observed traffic. The following figure shows how Kiro queries current load data for the flight-search path, including the ratio of Amazon DynamoDB reads to writes. Kiro composes and runs the CLI command on your behalf, so you don’t have to type it or set environment variables by hand. The command and its output stay visible in the session, so you can approve it before it runs and check what was retrieved before acting on it. In this case, the command queries the Bluebox API for the requested metrics. The output returns read and write counts per second for the DynamoDB table behind flight search, along with the services calling it.
Figure 3. Kiro runs the Bluebox CLI, then reads the codebase with production context before proposing changes.
The telemetry shows the flight-search endpoint is read-heavy. Users repeatedly query the same routes, at roughly 40 reads for every write against the DynamoDB table. Repeated identical reads are what a cache absorbs, so Kiro proposes an Amazon ElastiCache layer in front of the table, sized to the active working set derived from the observed request distribution. Without the read-to-write ratio, the same request could have produced a larger provisioned table or an added read replica, neither of which addresses repeated identical queries.
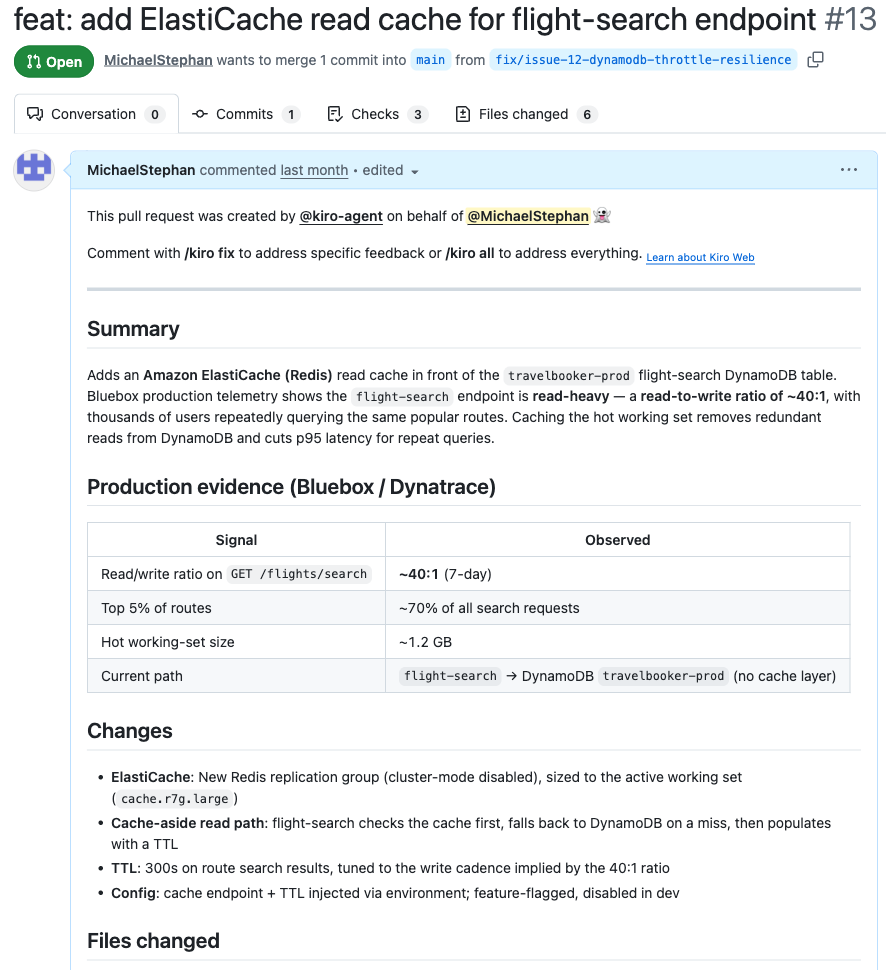
Kiro generates the code that implements the change and opens a pull request in GitHub for review. Nothing reaches production until a reviewer approves and merges it. The pull request carries the code changes and the Bluebox telemetry that justified them, so reviewers assess the decision against the same telemetry Kiro retrieved.
Figure 4. Kiro pushes a feature branch and opens a pull request in GitHub.
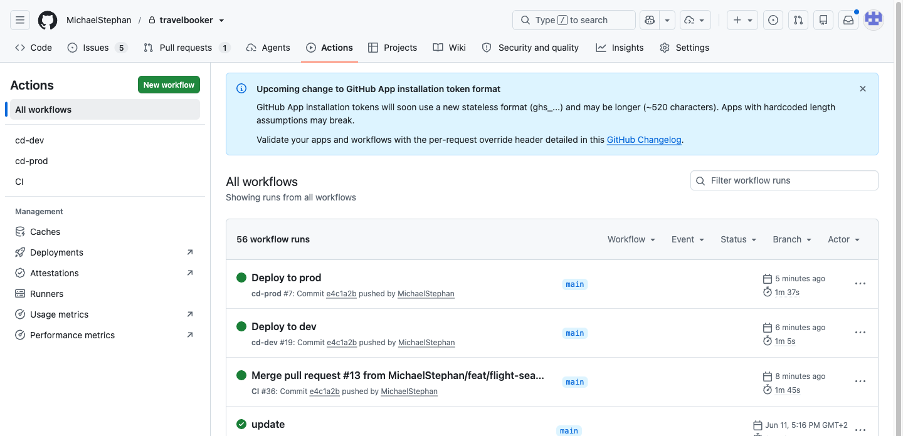
After review and approval through standard processes, a reviewer merges the pull request, and the existing CI/CD pipeline deploys the change.
Figure 5. The pull request is reviewed and merged through the standard GitHub workflow.
Responding to a production incident
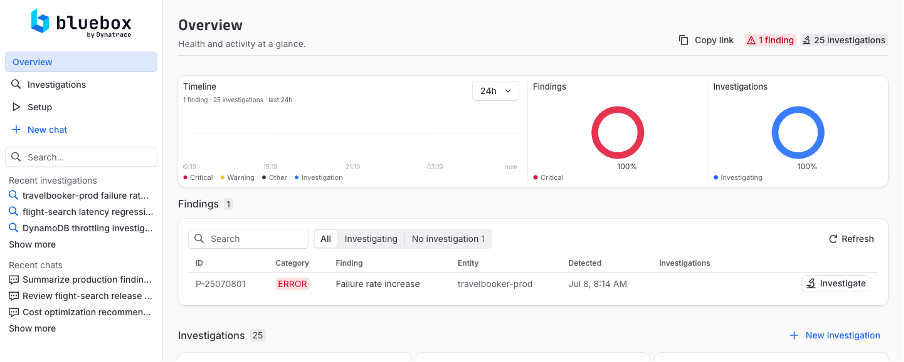
With the feature live, Dynatrace continues monitoring the application. A marketing promotion then drives traffic above the observed baseline, and failed requests start to appear. The loop now runs from operations back to development.
Figure 6. Dynatrace detects a spike in failed requests, surfacing the production incident.
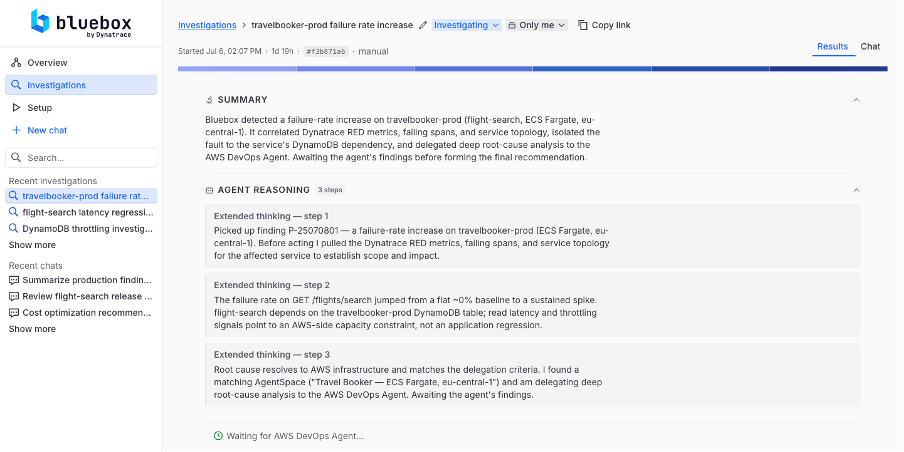
Bluebox collects the relevant observability and topology data, runs an initial root-cause analysis, then opens an autonomous investigation in AWS DevOps Agent. The AWS DevOps Agent multi-agent reasoning architecture decomposes the investigation across specialized capabilities that each examine one class of evidence: telemetry, logs, infrastructure configuration, and recent deployment activity.
Figure 7. Bluebox delegates an autonomous investigation to AWS DevOps Agent.
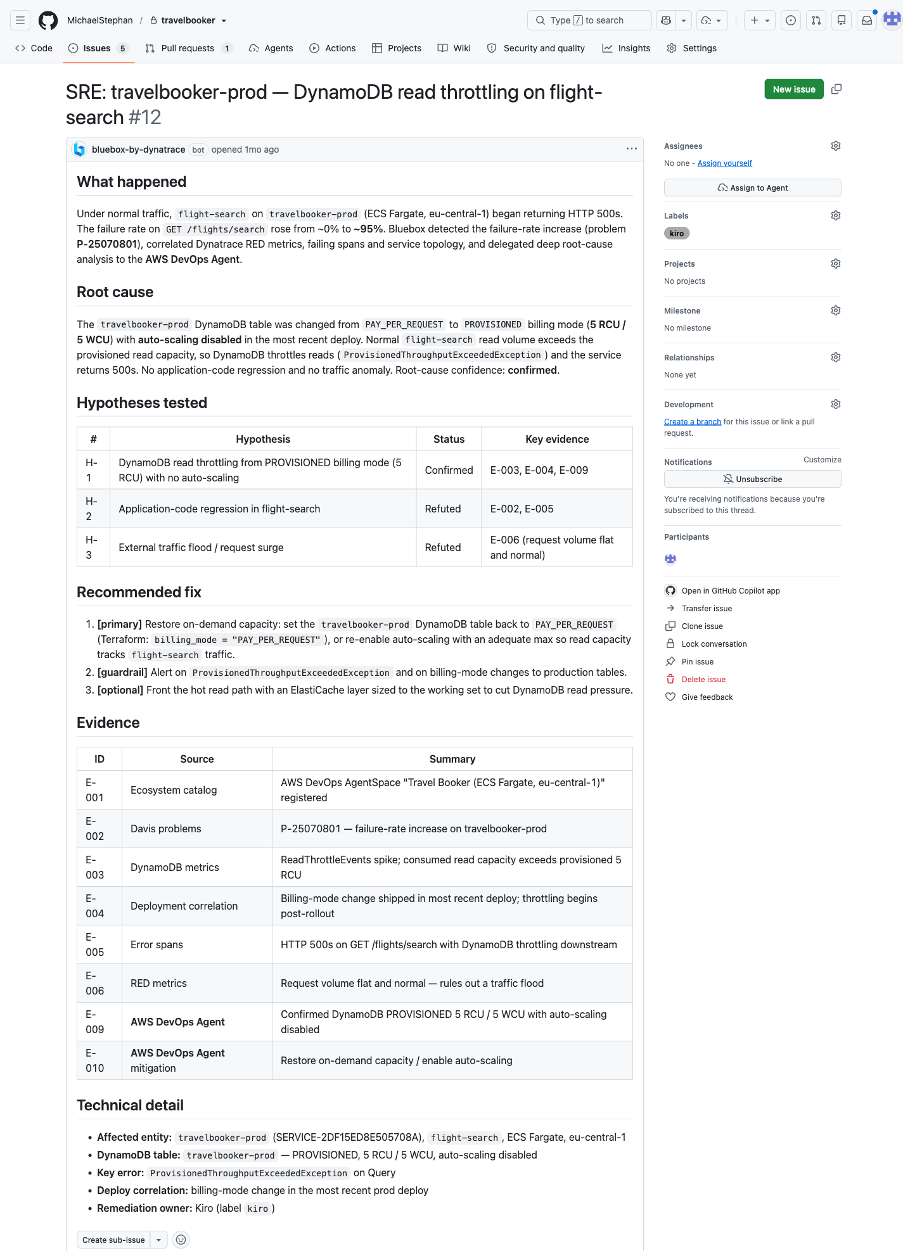
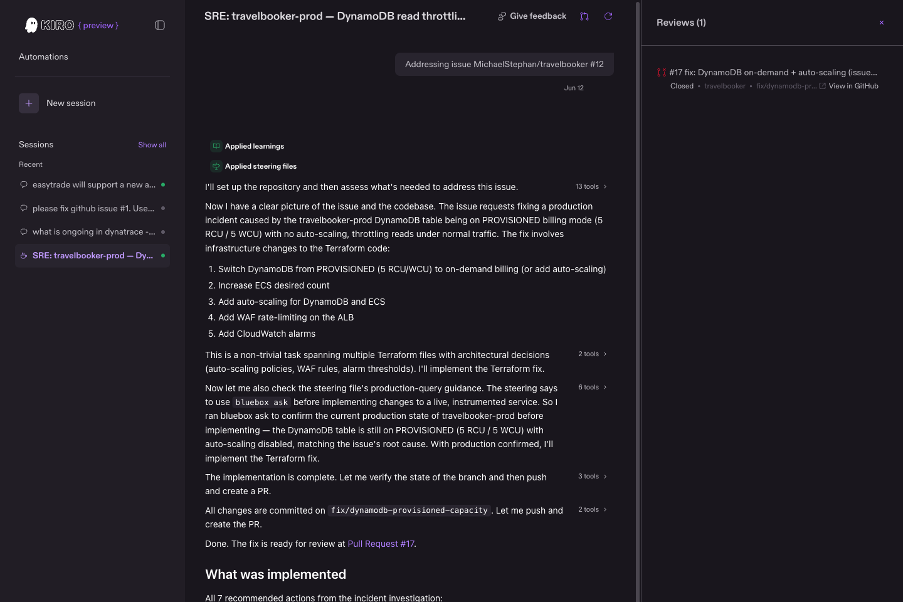
AWS DevOps Agent locates the cause in the DynamoDB table rather than the new cache. The table’s billing mode had been changed to PROVISIONED, with 5 read capacity units (RCU) and 5 write capacity units (WCU) and no auto scaling. The ElastiCache layer absorbs repeated reads, but cache misses and all writes still reach DynamoDB, and at promotion traffic that residual load exceeds 5 RCU and 5 WCU. AWS DevOps Agent produces a mitigation plan with specific remediation steps. This plan and the full investigation context from Bluebox, is documented as a GitHub issue.
Figure 8. GitHub issue is created with results from Bluebox and AWS DevOps Agent.
Kiro proposes a production-aware fix as a new pull request – including the root-cause analysis, supporting telemetry, and recommended configuration changes.
Figure 9. The Kiro coding session works on the GitHub issue and creates a remediation Pull Request.
The fix is reviewed, merged, and deployed like any other change. Dynatrace then confirms that error rates and response times return to baseline, which closes the loop.
Conclusion
In this post, we showed how Kiro, AWS DevOps Agent, and Bluebox by Dynatrace connect production telemetry with feature development and incident remediation. The travel-booking example keeps human review and existing CI/CD controls in the process while passing operational context from production back to development.
To get started pick one application and define a measurable outcome, such as investigation time, change-failure rate, or pull-request review time. Then:
Download Kiro and start building with spec-driven development
Version
26.8 of the LibreOffice suite has been released.
LibreOffice 26.8 concentrates on three areas: the typographic quality of what
the suite produces, the range of writing systems it handles correctly, and the
fidelity with which documents survive exchange with other office suites.
The largest single body of work in this release addresses bidirectional and
complex text. Writer now detects paragraph direction automatically when
documents or plain text are opened or pasted. Line wrapping places end-of-line
spaces according to the direction of the paragraph rather than that of the
adjacent characters. Object resize handles behave correctly in right-to-left and
vertical CJK documents. Bidirectional control characters are now visible
alongside other formatting marks. In Calc, typing right-to-left text into an
empty cell sets the direction of that cell automatically.
The New York Times has a long article (alt link) on surveillance systems aimed at babies. They are increasingly using AI.
Nanit and its rivals want to own 24/7 health tracking for the sub-four-foot set. And their already astonishing levels of baby data collection are just the beginning. Nanit recently raised $50 million from investors to expand its use of A.I. and use its camera to track speech and language development, motor skills and more, while extending its presence in children’s bedrooms into early adolescence.
Let’s be honest. You could spend another October watching webinars at 1.5x speed while answering Slack messages, pretending you’ll “circle back” to that infrastructure project you’ve been meaning to automate since 2023.
Or you could spend two days in Riga at Zabbix Summit 2026, surrounded by hundreds of people who actually get excited about automation, integrations, observability, and that oddly satisfying moment when every dashboard is perfectly green.
If you do, you’ll be among the first to dive into Zabbix 8.0, discover the latest innovations in Zabbix Cloud, and see where the platform is headed next. The choice seems fairly obvious.
It’s not just another tech conference
Some conferences are basically just an expensive delivery service for company-branded merch. Zabbix Summit 2026 isn’t one of them. On October 8-9, 2026, the global Zabbix community returns to Riga for two days packed with technical talks, real-world case studies, product announcements, workshops, networking, and enough ideas to completely rewrite your observability roadmap (well, we can’t promise you’ll finish rewriting it, but you’ll definitely want to start).
This year’s Summit is especially exciting as it marks the arrival of Zabbix 8.0, our next major release, alongside the continued evolution of Zabbix Cloud. That makes it the best place to discover what’s new, what’s next, and how these innovations can simplify and strengthen your observability strategy.
Whether you’re keeping tabs on a handful of servers, an international enterprise, industrial infrastructure, or something delightfully weird, you’ll leave with practical techniques you can put to work.
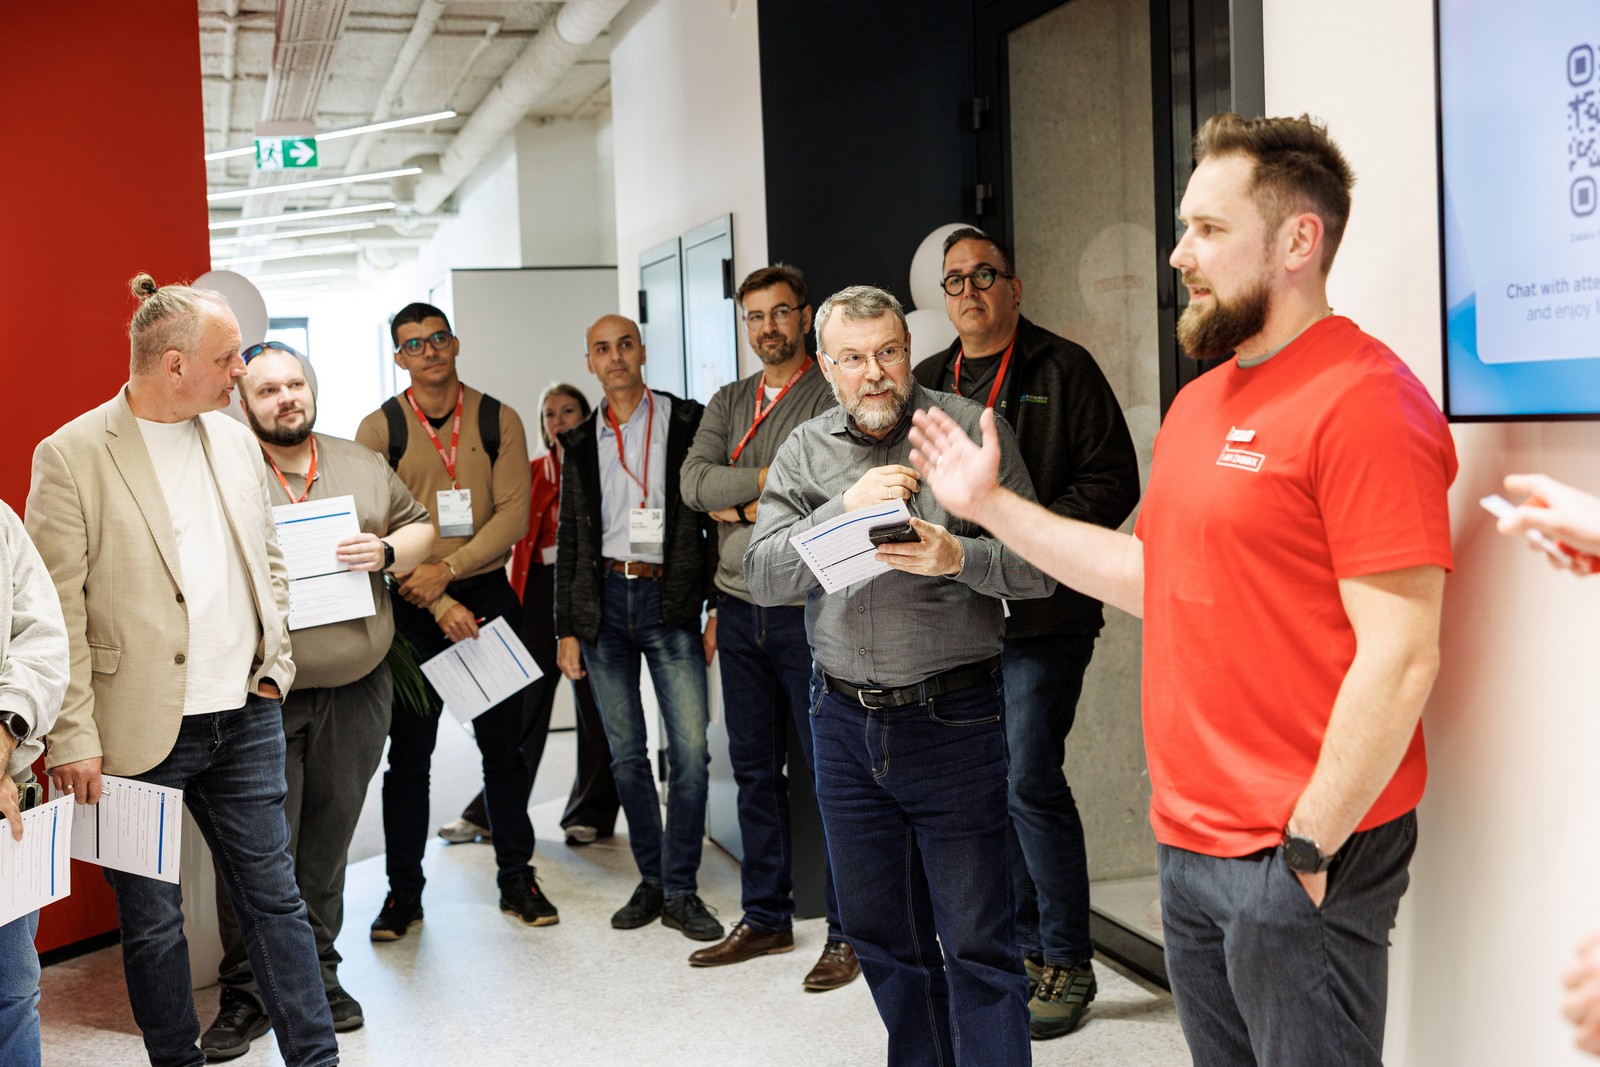
Start the week at the Zabbix Open House
Before Zabbix Summit 2026 officially begins on October 7, you can drop by the Zabbix offices, meet the people building and supporting the platform you use every day, and get a glimpse of the team behind the technology. Grab a coffee in the kitchen, swap stories with fellow community members, and test your Zabbix knowledge with a fun quiz that might teach even the most seasoned Zabbix fans a few new facts.
It’s a relaxed way to kick off your Summit experience, put faces to names, and start the week surrounded by the people who make the Zabbix community what it is.
Come for Zabbix 8.0, stay because your notebook is full
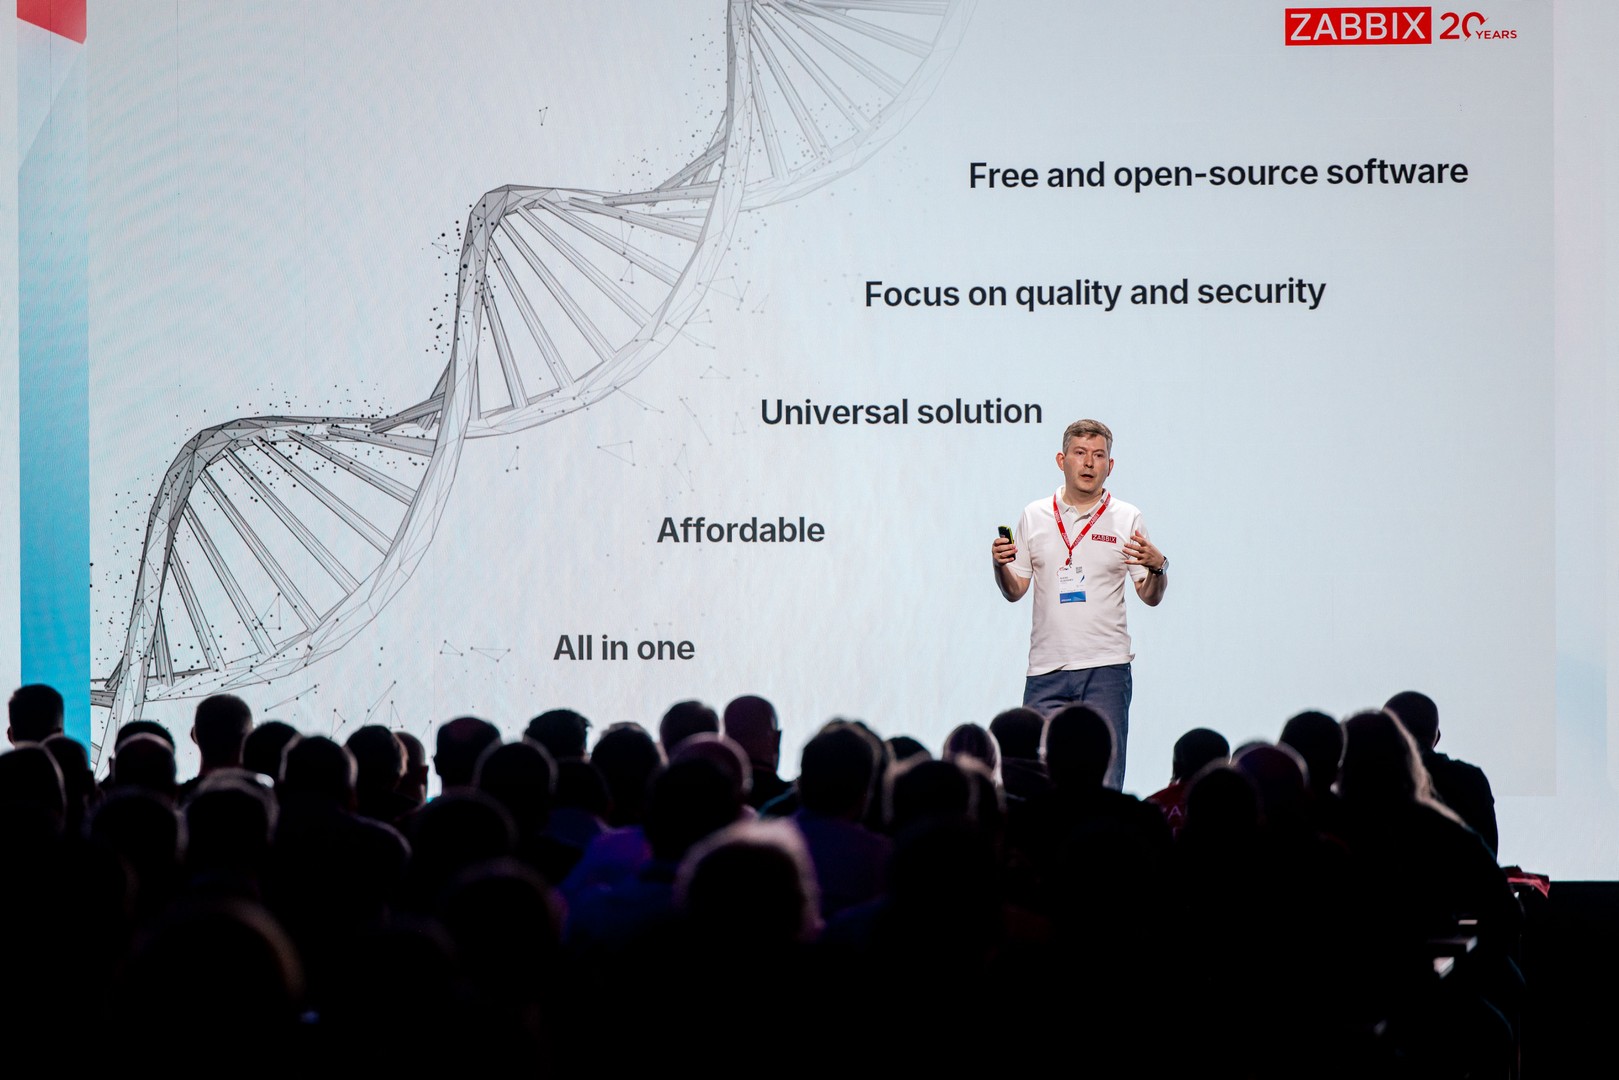
Zabbix Summit 2026 features one of the biggest moments in recent Zabbix history – an in-depth look at Zabbix 8.0. You’ll hear directly from Zabbix Founder and CEO Alexei Vladishev about the next evolution of the platform, where observability is heading, what’s new under the hood, and how Zabbix continues to expand with solutions like Zabbix Cloud for organizations looking to deploy and scale faster. And that’s only the beginning.
Across the Main Track, Solutions Track, Dev Track, Community Track, and workshops, you’ll learn from engineers, architects, consultants, and customers who have solved problems you’ll probably encounter sooner or later. After all, why should you spend weeks reinventing solutions when someone else is willing to show you theirs?
Zabbix Marketplace – your shortcut to doing more with Zabbix
One of the best things about being part of the Zabbix ecosystem is that you don’t have to build everything from scratch. Zabbix Marketplace brings together a growing collection of integrations, templates, dashboards, and other ready-to-use resources that can help you extend your observability and get value from Zabbix faster.
Zabbix Summit 2026 is the perfect opportunity to go beyond simply downloading a template. Talk to the people behind integrations and community solutions, discover how others are using them in production, and pick up ideas for adapting them to your own environment. In other words, fewer “I’ll build that someday” projects, and more things you can actually try.
Zabbix in your pocket with the Zabbix Mobile app
Observability doesn’t stop being important just because you’ve stepped away from your desk. The Zabbix Mobile app makes it easier to stay connected to your monitoring environment when you’re on the move, whether you’re grabbing coffee between sessions, heading home after the Summit, or simply trying to avoid being permanently attached to your laptop.
It’s another example of how the Zabbix ecosystem is making monitoring accessible when and where you need it. And yes, that means you can leave the Summit with more than just new ideas – you can also take practical Zabbix capabilities with you wherever you go.
Real stories. Real environments. Real “Wait…you used Zabbix for what?”
The best Summit talks aren’t polished, rehearsed sales pitches. They’re stories from people who built something difficult, broke something important, fixed something impossible, and decided to tell everyone exactly how they did it.
Expect practical sessions covering automation, large-scale deployments, MSP environments, integrations, performance optimization, Zabbix Cloud deployments, and plenty of creative techniques that will have you quietly opening a new browser tab entitled “Things I Should Definitely Try.”
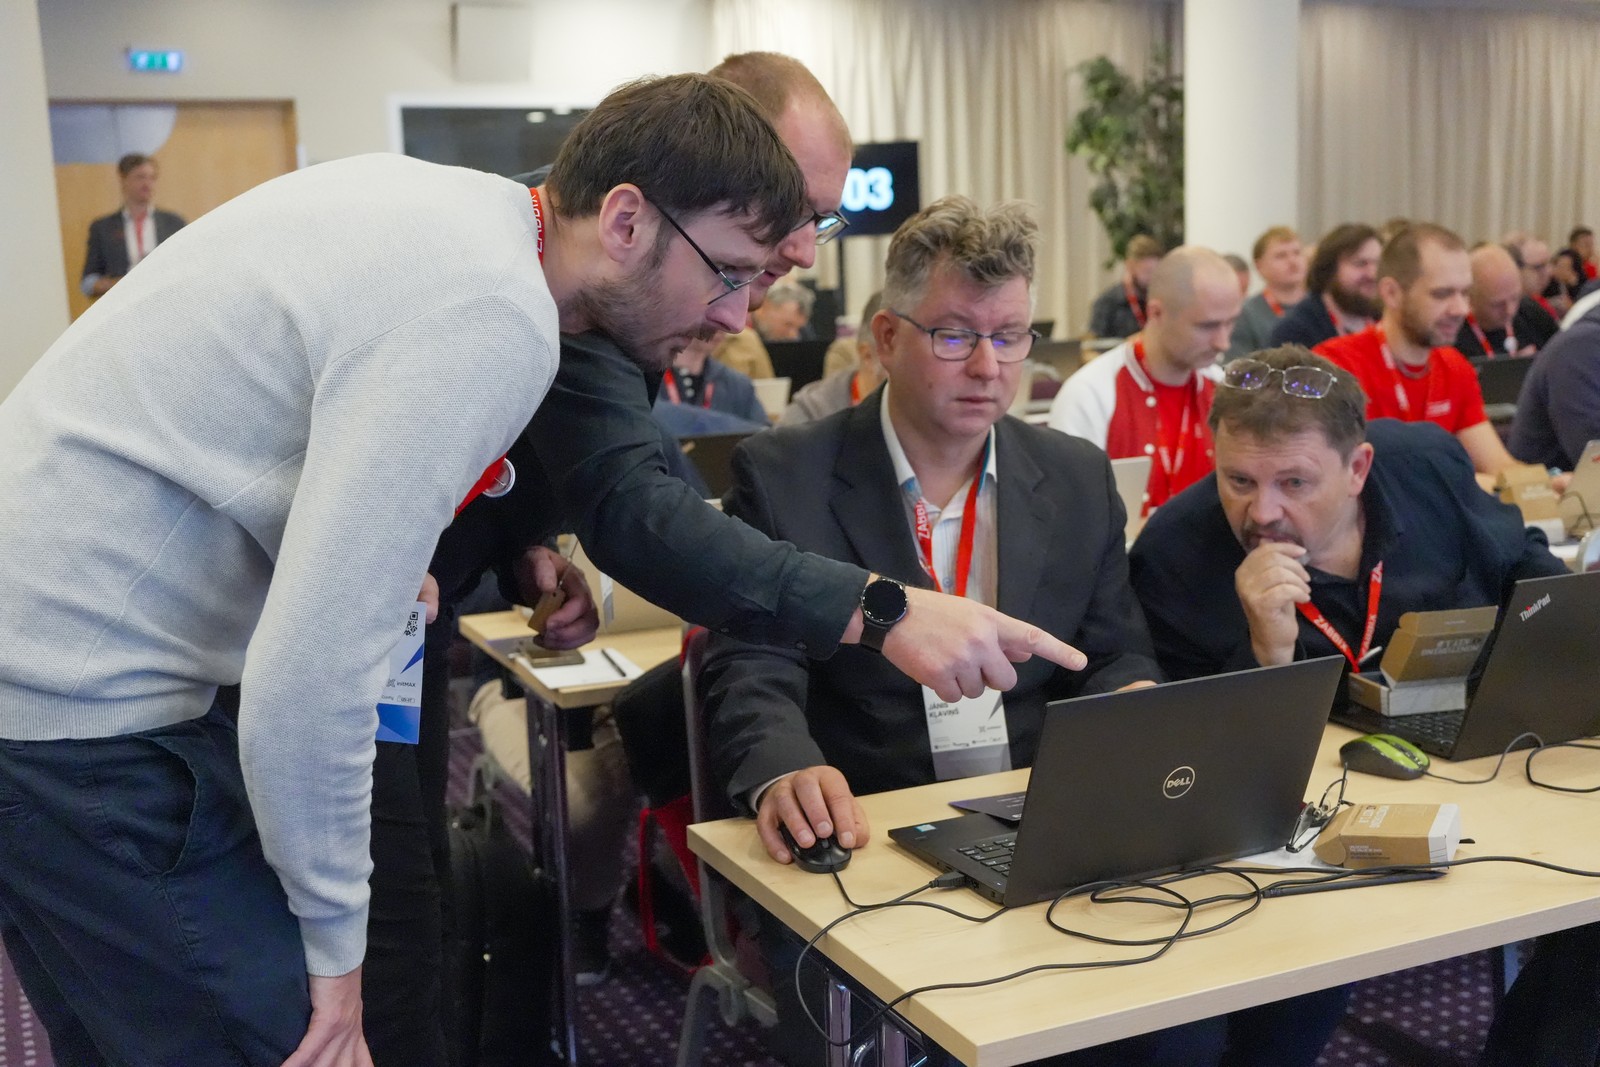
Workshops – because there’s a difference between reading documentation and actually doing the thing
If you’re the kind of person who learns by typing instead of watching, you’ll want to spend some time at the Summit workshops. Bring your laptop, break things, fix them, and ask questions. Leave with new skills instead of just good intentions. Workshops are included for Summit attendees and cover hands-on topics led by Zabbix experts, including new capabilities introduced in Zabbix 8.0.
Networking that doesn’t feel like networking
Nobody likes forced small talk over lukewarm coffee. Fortunately, that’s not really the Zabbix Summit vibe. Some of the best ideas at previous Summits started as conversations over coffee. Others probably started much later in the evening over other beverages.
This year’s three networking events (including the Welcome Event, Main Event, and Closing Event) will give you plenty of opportunities to meet the people whose blog posts you’ve bookmarked, whose templates you’ve borrowed (with gratitude), or whose infrastructure stories make yours seem almost reasonable.
And yes, Zabbix Summit 2026 is in Riga
If you’ve never been to Riga, you’re in for a treat. Historic architecture, fantastic food, a thriving tech scene, walkable streets, and (for one week in October) an unusually high concentration of people discussing triggers, proxies, APIs, template inheritance, and everything new in Zabbix 8.0 with genuine enthusiasm. It’s beautiful, it’s (slightly) nerdy, and it’s exactly where the Zabbix community belongs.
Bring your colleagues (they’ll thank you later)
Observability isn’t a one-person job. Bring your team, compare notes during sessions, divide and conquer the agenda, and return home with enough new ideas to keep everyone busy for months. There’s even a group discount for teams of three or more, making it considerably easier to convince your manager this is “a strategic investment in operational excellence.” Which, to be fair, it is!
See you in October!
Whether this is your first Summit or you’ve already collected enough Summit t-shirts to avoid doing laundry for a week, Zabbix Summit 2026 promises fresh ideas, new technology, inspiring people, a comprehensive look at Zabbix 8.0, and the latest developments in Zabbix Cloud. If you want to see where observability is heading, this is where the conversation starts.
So grab your ticket, book the trip, charge your laptop, and prepare to spend two days with people who understand why a perfectly configured dashboard is a thing of beauty.
Hot Chips 2026 sees Google discussing its new eighth-generation TPU family for the technical crowd. One of the only hyperscalers to develop its own training hardware, the company has developed the TPU 8t for training, as well as the TPU 8i for inference
This year’s Hot Chips conference includes a presentation from AI accelerator developer SambaNova, who is at the show to discuss their latest-generation RDU, the SN50
At Hot Chips 2026, wafer scale engine developer Cerebras is talking about the next generation of their giant accelerators, as well as how the company is going rack-scale thanks to their Nexus platform architecture
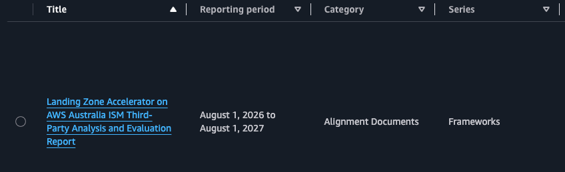
This post announces the availability of a new independent assessment report available on AWS Artifact analyzing how Landing Zone Accelerator on AWS (LZA) can automatically deploy multi-account environments in Amazon Web Services (AWS) with Australian Government Information Security Manual (ISM) security controls coverage at scale. The report includes findings from an independent third-party analysis conducted by AWS Partner gwi.digital. In addition to the report, we talk about ISM compliance applicability to LZA and a new testing mechanism for measuring configuration drift, which together can provide Australian customers with a documented and validated foundation to accelerate IRAP assessment readiness.
Background
Australian organizations in public sector, defense, and critical infrastructure agencies must build cloud environments that meet (ISM requirements. The ISM defines 1,081 security control requirements across 22 guideline chapters. Demonstrating compliance is central to achieving an IRAP assessment outcome, but assessments typically require months of preparation, evidence gathering, and testing.
In October 2025, we introduced the LZA Universal Configuration and LZA Compliance Workbook. LZA provisions a multi-account security architecture that automates the deployment of nearly 200 security controls based on AWS Well-Architected pillars and AWS security best practices. The LZA Compliance Workbook, available on AWS Artifact, documents how the Universal Configuration (UC) maps to technical security requirements from 17 global compliance frameworks, with more being added. LZA is an ideal solution for customers with security and compliance obligations—both existing and anticipated—because the guardrails it deploys are applied automatically to new accounts as environments grow.
What’s in the report
To see how LZA can help customers in Australia we teamed up with AWS Partner gwi.digital to run LZA as a customer would. gwi.digital is a consultancy partner specializing in cybersecurity and governance, risk, and compliance (GRC) and has deep experience in IRAP assessments and the ISM framework. The team conducted an independent analysis and evaluation of LZA UC against 1,081 ISM controls. The assessment was conducted in a greenfield AWS environment hosted in the ap-southeast-2 (Sydney) AWS Region, positioned within Phase 2 of the ASD Cloud Security Assessment and Authorization Framework and focused on cloud consumers building on already-authorized AWS services. It builds on existing AWS IRAP foundations: Underlying AWS services were most recently independently assessed at the PROTECTED level by CyberCX last year. While this report does not constitute an official IRAP authorization, certification, or accreditation, it provides a professional evaluation of evidence based on what LZA delivers out of the box (and what it does not), so organizations can make informed decisions.
What the assessment found
Of the 1,081 ISM controls, 256 are within the addressable scope of LZA and include the technical infrastructure controls that a solution like LZA can meaningfully address. Of those 256, LZA achieves Full or Partial coverage for 234 (91%). The remaining 825 controls are outside the scope of LZA: physical security, personnel, organizational governance, and classification-level exclusions. A key contribution for the assessment was analysis of the shared responsibility model that goes beyond the traditional AWS/customer binary. It considers a three-tier view—AWS (provided), LZA (enabled), and Customer (responsibility)—and further categorizes the 825 out-of-scope controls into subcategories so customers can quickly determine which controls require their attention compared to which are already addressed at the infrastructure level. By combining automated deployment, ISM-specific compliance mappings, independent validation, and continuous evidence generation, Australian customers can reduce IRAP assessment timelines while achieving more reliable compliance outcomes.
Note: Results are based on the configuration as-provisioned based on the LZA version and during the time of this assessment. Results may vary depending on customer implementation and configuration choices.
Continuous validation with CATS
Confirming controls are implemented and operating effectively across your environment is complex and often lacks complete coverage. To simplify testing your LZA deployment, we developed the Controls Acceptance Testing Suite (CATS). CATS is an automated compliance validation engine that runs purpose-built tests against the security configuration baseline deployed by LZA UC. For the ISM assessment, CATS executed over 3,600 individual tests across six AWS accounts, evaluating account structure, identity and access, network configuration, logging, encryption, and backup. For Australian customers, CATS enables:
Automated evidence generation: Machine-readable results may replace weeks of manual evidence collection
ISM-enriched reporting: gwi-digital developed a conversion script that maps CATS output to ISM control references, enabling auditors to interpret results from an ISM perspective
Continuous drift detection: Repeatable execution identifies when configurations deviate from the validated baseline between assessment cycles
Note: CATS availability is limited and currently accessible only through AWS Professional Services as a private beta solution and may be subject to change. Availability, features, and pricing are subject to change without notice. Contact your AWS account representative or reach out to a member of the LZA team for questions about CATS, or to provide feedback on the LZA ISM report.
ISM-optimized configuration
Through the assessment, gwi-digital identified configuration adjustments that elevate specific control ratings from Partial to Full, with minimal effort; for example, increasing the default password length from 14 to 15 characters or adjusting log retention to align with Australian Federal Disposal Authority standards. These recommendations have been communicated to the LZA UC team for inclusion in a future ISM-specific guidance section in LZA GitHub documentation.
Getting started
In addition to the LZA ISM report, you can also find the LZA Compliance Workbook available on AWS Artifact. It maps related ISM requirement identifiers to security implementation statements, giving you a starting point from which you can customize and enhance your compliance documentation for your unique use cases after deploying LZA.
Use the LZA Implementation Guide to see use cases, review pre-deployment considerations and then follow deployment steps.
Set-up a security compliance chat agent. Consider creating a knowledge base with Amazon Bedrock using the LZA Compliance Workbook, LZA Implementation Guide, web crawlers to the LZA GitHub, and your custom resources to set up your own chat agent.
The combination of ISM mappings in the LZA Compliance Workbook, the gwi-digital analysis report, and CATS evidence gives Australian customers a head start on IRAP assessments.
Weeks saved on scoping: Pre-determined control applicability significantly reduces upfront scoping effort
Documentation ready: Implementation statements and control requirement alignment reduce the documentation burden
Independent assurance: A third-party report that customers and their assessors can reference directly
Continuous evidence: CATS generates repeatable security evidence between assessment cycles, replacing periodic manual audits with ongoing assurance
Acknowledgements
The Landing Zone Accelerator team would like to thank Baden Hughes, Henrik Melkonyan, Iain Lindsay-German, and Ian Roderick from gwi.digital for their professionalism and expertise in performing an incredibly thorough assessment, helping us to make LZA better for customers, and for their contributions to this blog post.
If you have feedback about this post, submit comments in the Comments section below.
The newest member of NVIDIA’s AI hardware family, at Hot Chips 2026 NVIDIA is diving into the use of LPUs as part of Vera Rubin clusters. The specialized chips from acquihire Groq are being tapped to offer significantly lower latency in the decode phase of inference
For Hot Chips 2026, Meta is at the show to discuss their AI inference accelerators. The MTIA family, the company has an ambitious roadmap to release 4 accelerators over the next couple of years
mklinux lets one machine run several independent Linux kernels at
the same time on bare metal, without a hypervisor. A host kernel
owns a pool of CPUs, memory and PCI devices, carves that pool into
instances, and boots a spawn kernel into each instance through
kexec_file_load(). Every spawn kernel runs natively on its own
CPUs, its own physical memory and its own devices. Nothing is
emulated and nothing is trapped; the only thing shared is what you
choose to share.
Note that this is not the old MkLinux, which was a port to PowerPC
Macintosh systems.
If you run Apache Airflow workflows on Amazon MWAA Serverless, you can now use PythonOperator and BashOperator to run custom code directly in the serverless runtime. Previously, Amazon Managed Workflows for Apache Airflow (Amazon MWAA) Serverless only supported orchestration of AWS services through operators for scheduling tasks, managing dependencies, and handling retries. It did not support running your own Python functions or shell scripts natively. If you needed custom Python logic or shell commands, you had to wrap code in AWS Lambda functions, start Amazon Elastic Container Service (Amazon ECS) tasks, or use other AWS compute services. These alternatives add complexity, cost, and latency to your orchestration pipelines.
With this launch, you can run custom Python functions and shell scripts directly within the serverless task runtime, without requiring additional infrastructure. This means you can now use PythonOperator and BashOperator many data engineering teams rely on for ETL pipelines and data quality checks – without provisioning additional compute.
In this post, we walk through how this feature works and demonstrate a practical example: building a serverless pipeline that converts CSV files to JSON format using a PythonOperator, and verifies the output using a BashOperator. By the end, you will know how to:
Package a Python module with dependencies and upload it to an Amazon Simple Storage Service (Amazon S3) bucket as a code bundle
Define a multi-task workflow using the dag-factory compatible YAML
Create and run a workflow with the AWS Command Line Interface (AWS CLI)
Verify that your pipeline produced the expected output
How it works
With MWAA Serverless, you can package your custom code, upload it to an Amazon S3 bucket, and reference it when creating a workflow. The service snapshots your code at workflow creation time and uses that snapshot for all subsequent runs of the same workflow version.
Code bundles
A code bundle is the package that contains your custom logic. You package your Python modules or shell scripts and upload them to an Amazon S3 bucket. A code bundle can be:
A single .py file or .sh bash script (uploaded to an Amazon S3 bucket)
A ZIP archive containing multiple shell scripts, Python modules and dependencies (up to 250 MB)
Execution model
When you create or update a workflow, MWAA Serverless snapshots your code bundle from an Amazon S3 bucket provided and stores it on the service side. At task execution time, the service uses this snapshot – not the object currently residing in your Amazon S3 bucket – to run your code in an isolated runtime environment.
Python and Bash tasks do not have internet access. They can reach only Amazon S3, Amazon Elastic Container Registry (Amazon ECR), and Amazon CloudWatch, which are the services the runtime requires to operate. To have internet access, configure the workflow with Amazon VPC so that it can go through the provided VPC.
Supported operators
The following table describes the two operators now available in MWAA Serverless.
Operator
Description
PythonOperator
Executes a Python callable (function) from your code bundle
BashOperator
Runs shell commands or scripts
Security
AWS Key Management Service (AWS KMS) encrypts your code bundles at rest. IAM policies control who can create, update, and trigger the workflows. The execution role scopes what AWS resources your code can access at runtime.
Prerequisites
Before getting started, verify that you have the following resources and tools configured in your AWS account:
An AWS account with access to Amazon MWAA Serverless
An Amazon S3 bucket for storing DAG definitions and code bundles
An IAM role that MWAA Serverless can assume (see the execution role setup below)
Walkthrough: Building a serverless CSV-to-JSON pipeline
In this walkthrough, we build a pipeline that converts CSV files to JSON format – a common data transformation for downstream APIs and analytics systems that consume JSON. The pipeline uses a PythonOperator for the conversion logic and a BashOperator to verify the output. Here is what the pipeline does:
Reads a CSV file from an Amazon S3 bucket
Converts it to JSON format with column type inference
Writes the JSON file back to an Amazon S3 bucket
Validates record counts match between source and output
Step 1: Create the execution role
Create an IAM role that your workflow assumes at runtime. The trust policy must allow the airflow-serverless.amazonaws.com service to assume the role:
Create a file called csv_to_json.py with the conversion logic:
# csv_to_json.py
import csv
import json
import boto3
import io

def convert(**kwargs):
    """Read a CSV from S3 and write it back as JSON lines."""
    bucket = "amzn-s3-demo-mwaa-data"
    source_key = "raw/sales_data.csv"
    output_key = "processed/sales_data.json"

    s3 = boto3.client("s3")

    # Read source file
    response = s3.get_object(Bucket=bucket, Key=source_key)
    content = response["Body"].read().decode("utf-8")

    # Parse CSV
    reader = csv.DictReader(io.StringIO(content))
    rows = list(reader)

    # Type inference - convert numeric fields
    for row in rows:
        for key, value in row.items():
            try:
                row[key] = float(value)
            except (ValueError, TypeError):
                pass

    # Write as JSON lines
    output = "\n".join(json.dumps(row) for row in rows) + "\n"
    s3.put_object(Bucket=bucket, Key=output_key, Body=output.encode("utf-8"))

    print(f"Converted {len(rows)} rows to JSON lines")
    print(f"Output: s3://amzn-s3-demo-mwaa-data/{output_key}")
    return {"rows": len(rows), "output_key": output_key}
This function uses boto3 (which comes pre-installed with the MWAA Serverless execution environment) and Python’s built-in csv and json modules. The conversion reads the CSV, infers numeric types, and writes a JSON lines file back to the S3 bucket.
Step 3: Write the verification script
Create a file called verify_output.sh. This script validates the pipeline output by comparing the record count in the source CSV against the output JSON file. If the counts do not match, the task fails with a non-zero exit code, which causes the workflow run to fail.
#!/bin/bash
echo "=== Data Validation ==="

# Count source records (skip CSV header)
SOURCE_COUNT=$(python3 -m awscli s3 cp s3://amzn-s3-demo-mwaa-data/raw/sales_data.csv - | tail -n +2 | wc -l)
echo "Source CSV records: $SOURCE_COUNT"

# Count output records
OUTPUT_COUNT=$(python3 -m awscli s3 cp s3://amzn-s3-demo-mwaa-data/processed/sales_data.json - | wc -l)
echo "Output JSON records: $OUTPUT_COUNT"

# Validate counts match
if [ "$SOURCE_COUNT" -ne "$OUTPUT_COUNT" ]; then
    echo "FAILED: Record count mismatch (source=$SOURCE_COUNT, output=$OUTPUT_COUNT)"
    exit 1
fi

echo "PASSED: Record counts match ($OUTPUT_COUNT records)"
echo "Timestamp: $(date -u +%Y-%m-%dT%H:%M:%SZ)"
This script runs the AWS CLI, which is bundled as a dependency in the code package. The s3 cp streams the file content to stdout without writing to disk, allowing standard shell tools like wc -l and tail to process it. The execution role credentials are automatically available in the execution environment, so the CLI can access S3 without additional configuration.
Step 4: Package and upload the code to Amazon S3
Since the verification script uses the AWS CLI, bundle it as a dependency in the ZIP archive along with your Python module and shell script:
BUCKET="amzn-s3-demo-mwaa-data"
REGION="us-east-1"

# Install awscli into a package directory
pip install awscli \
  --target my_package/ \
  --platform manylinux2014_x86_64 \
  --python-version 3.12 \
  --only-binary=:all:

# Add your module
cp csv_to_json.py my_package/
cp verify_output.sh my_package/

# Create the ZIP archive
cd my_package && zip -r ../code_bundle.zip . && cd ..
# Upload to S3
aws s3 cp code_bundle.zip s3://$BUCKET/code/code_bundle.zip --region $REGION
convert_to_json – Runs the convert function from the Python module to transform CSV to JSON lines.
verify_output – Runs a shell script that validates the pipeline output by comparing source and output record counts, failing the task if they do not match.
Upload the DAG definition to S3. Note: You can also run inline Bash commands directly without a shell script.
Confirm the JSON file was written to the S3 bucket:
# List the output file
aws s3 ls s3://$BUCKET/processed/sales_data.json --region $REGION
You should see the JSON file:
2026-07-15 10:32:45 1847 sales_data.json
You can also verify task-level output in Amazon CloudWatch Logs. Open the log group for your workflow and find the convert_to_json task log stream:
Converted 5 rows to JSON lines
Output: s3://amzn-s3-demo-mwaa-data/processed/sales_data.json
Considerations and limits
When planning your workloads on MWAA Serverless with these operators, keep the following considerations in mind:
Code bundle size – ZIP archives must be under 250 MB per bundle.
Network access – Python and Bash tasks do not have internet access. They can reach a limited set of AWS services required for the runtime to function (Amazon S3, Amazon ECR, and Amazon CloudWatch) but cannot call other AWS services or external endpoints. If your workflow requires calls to external APIs, preprocess that data and store it in an Amazon S3 bucket before invoking the workflow.
Runtime dependencies – boto3 and the Python standard library are pre-installed. For additional packages (such as pandas or requests), bundle them in your ZIP archive following the Amazon MWAA Serverless packaging guidelines.
Execution timeout – Tasks are subject to the workflow’s configured timeout limits.
DAG format – MWAA Serverless uses YAML-based DAG definitions, not traditional Python DAG files. If you are migrating from MWAA Provisioned, you will need to convert your DAGs to the YAML format.
Operators not supported – Some Airflow community operators and custom plugins are not available in the Serverless runtime. Refer to the documentation for the full compatibility list.
Clean up
To avoid ongoing charges, delete the resources you created in this walkthrough. The following commands remove the workflow, S3 objects, and IAM role:
# Delete the IAM role
aws iam delete-role-policy \
  --role-name MWAAServerlessExecutionRole \
  --policy-name MWAAServerlessAccessPolicy

aws iam delete-role --role-name MWAAServerlessExecutionRole
Conclusion
With native support for PythonOperator and BashOperator, you can now run the custom code execution patterns that many data engineering teams rely on daily directly in MWAA Serverless. Run data transformations, format conversions, validations, and shell scripts in the serverless runtime – without provisioning additional compute or managing containers.
If you are running Airflow workloads on MWAA Provisioned or self-managed infrastructure, your existing PythonOperator and BashOperator logic requires minimal changes. Convert your Python DAG files to the YAML format, package your code as a bundle, and you are ready to run on MWAA Serverless.
To provide the best experiences, we use technologies like cookies to store and/or access device information. Consenting to these technologies will allow us to process data such as browsing behavior or unique IDs on this site. Not consenting or withdrawing consent, may adversely affect certain features and functions.
Functional
Always active
The technical storage or access is strictly necessary for the legitimate purpose of enabling the use of a specific service explicitly requested by the subscriber or user, or for the sole purpose of carrying out the transmission of a communication over an electronic communications network.
Preferences
The technical storage or access is necessary for the legitimate purpose of storing preferences that are not requested by the subscriber or user.
Statistics
The technical storage or access that is used exclusively for statistical purposes.The technical storage or access that is used exclusively for anonymous statistical purposes. Without a subpoena, voluntary compliance on the part of your Internet Service Provider, or additional records from a third party, information stored or retrieved for this purpose alone cannot usually be used to identify you.
Marketing
The technical storage or access is required to create user profiles to send advertising, or to track the user on a website or across several websites for similar marketing purposes.