The Project Zero blog has a
three-part series describing a working, zero-click exploit for
Pixel 9 devices.
Over the past few years, several AI-powered features have been
added to mobile phones that allow users to better search and
understand their messages. One effect of this change is increased
0-click attack surface, as efficient analysis often requires
message media to be decoded before the message is opened by the
user. One such feature is audio transcription. Incoming SMS and RCS
audio attachments received by Google Messages are now automatically
decoded with no user interaction. As a result, audio decoders are
now in the 0-click attack surface of most Android phones.
The blog entry does not question the wisdom of directly exposing audio
decoders to external attackers, but it does provide a lot of detail showing
how it can go wrong. The first part looks at compromising the codec; part
two extends the exploit to the kernel, and part
three looks at the implications:
It is alarming that it took 139 days for a vulnerability
exploitable in a 0-click context to get patched on any Android
device, and it took Pixel 54 days longer. The vulnerability was
public for 82 days before it was patched by Pixel.
Since a preview launch at AWS re:Invent 2025, we’re announcing the general availability of new memory-optimized Amazon Elastic Compute Cloud (Amazon EC2) X8i instances. These instances are powered by custom Intel Xeon 6 processors with a sustained all-core turbo frequency of 3.9 GHz, available only on AWS. These SAP certified instances deliver the highest performance and fastest memory bandwidth among comparable Intel processors in the cloud.
X8i instances are ideal for memory-intensive workloads including in-memory databases such as SAP HANA, traditional large-scale databases, data analytics, and electronic design automation (EDA), which require high compute performance and a large memory footprint.
These instances provide 1.5 times more memory capacity (up to 6 TB), and 3.4 times more memory bandwidth compared to previous generation X2i instances. These instances offer up to 43% higher performance compared to X2i instances, with higher gains on some of the real-world workloads. They deliver up to 50% higher SAP Application Performance Standard (SAPS) performance, up to 47% faster PostgreSQL performance, up to 88% faster Memcached performance, and up to 46% faster AI inference performance.
During the preview, customers like RISE with SAP utilized up to 6 TB of memory capacity with 50% higher compute performance compared to X2i instances. This enabled faster transaction processing and improved query response times for SAP HANA workloads. Orion reduced the number of active cores on X8i instances compared to X2idn instances while maintaining performance thresholds, cutting SQL Server licensing costs by 50%.
X8i instances X8i instances are available in 14 sizes including three larger instance sizes (48xlarge, 64xlarge, and 96xlarge), so you can choose the right size for your application to scale up, and two bare metal sizes (metal-48xl and metal-96xl) to deploy workloads that benefit from direct access to physical resources. X8i instances feature up to 100 Gbps of network bandwidth with support for the Elastic Fabric Adapter (EFA) and up to 80 Gbps of throughput to Amazon Elastic Block Store (Amazon EBS).
Here are the specs for X8i instances:
Instance name
vCPUs
Memory (GiB)
Network bandwidth (Gbps)
EBS bandwidth (Gbps)
x8i.large
2
32
Up to 12.5
Up to 10
x8i.xlarge
4
64
Up to 12.5
Up to 10
x8i.2xlarge
8
128
Up to 15
Up to 10
x8i.4xlarge
16
256
Up to 15
Up to 10
x8i.8xlarge
32
512
15
10
x8i.12xlarge
48
768
22.5
15
x8i.16xlarge
64
1,024
30
20
x8i.24xlarge
96
1,536
40
30
x8i.32xlarge
128
2,048
50
40
x8i.48xlarge
192
3,072
75
60
x8i.64xlarge
256
4,096
80
70
x8i.96xlarge
384
6,144
100
80
x8i.metal-48xl
192
3,072
75
60
x8i.metal-96xl
384
6,144
100
80
X8i instances support the instance bandwidth configuration (IBC) feature like other eighth-generation instance types, offering flexibility to allocate resources between network and EBS bandwidth. You can scale network or EBS bandwidth by up to 25%, improving database performance, query processing speeds, and logging efficiency. These instances also use sixth-generation AWS Nitro cards, which offload CPU virtualization, storage, and networking functions to dedicated hardware and software, enhancing performance and security for your workloads.
Now available Amazon EC2 X8i instances are now available in US East (N. Virginia), US East (Ohio), US West (Oregon), and Europe (Frankfurt) AWS Regions. For Regional availability and a future roadmap, search the instance type in the CloudFormation resources tab of AWS Capabilities by Region.
In this post, we show you how to implement real-time data ingestion from multiple Kafka topics to Apache Hudi tables using Amazon EMR. This solution streamlines data ingestion by processing multiple Amazon Managed Streaming for Apache Kafka (Amazon MSK) topics in parallel while providing data quality and scalability through change data capture (CDC) and Apache Hudi.
Organizations processing real-time data changes across multiple sources often struggle with maintaining data consistency and managing resource costs. Traditional batch processing requires reprocessing entire datasets, leading to high resource usage and delayed analytics. By implementing CDC with Apache Hudi’s MultiTable DeltaStreamer, you can achieve real-time updates; efficient incremental processing with atomicity, consistency, isolation, durability (ACID) guarantees; and seamless schema evolution while minimizing storage and compute costs.
Using Amazon Simple Storage Service (Amazon S3), Amazon CloudWatch, Amazon EMR, Amazon MSK and AWS GlueData Catalog, you’ll build a production-ready data pipeline that processes changes from multiple data sources simultaneously. Through this tutorial, you’ll learn to configure CDC pipelines, manage table-specific configurations, implement 15-minute sync intervals, and maintain your streaming pipeline. The result is a robust system that maintains data consistency while enabling real-time analytics and efficient resource utilization.
What is CDC?
Imagine a constantly evolving data stream, a river of information where updates flow continuously. CDC acts like a sophisticated net, capturing only the modifications—the inserts, updates, and deletes—happening within that data stream. Through this targeted approach, you can focus on the new and changed data, significantly improving the efficiency of your data pipelines.There are numerous advantages to embracing CDC:
Reduced processing time – Why reprocess the entire dataset when you can focus only on the updates? CDC minimizes processing overhead, saving valuable time and resources.
Real-time insights – With CDC, your data pipelines become more responsive. You can react to changes almost instantaneously, enabling real-time analytics and decision-making.
Simplified data pipelines – Traditional batch processing can lead to complex pipelines. CDC streamlines the process, making data pipelines more manageable and easier to maintain.
Why Apache Hudi?
Hudi simplifies incremental data processing and data pipeline development. This framework efficiently manages business requirements such as data lifecycle and improves data quality. You can use Hudi to manage data at the record-level in Amazon S3 data lakes to simplify CDC and streaming data ingestion and handle data privacy use cases requiring record-level updates and deletes. Datasets managed by Hudi are stored in Amazon S3 using open storage formats, while integrations with Presto, Apache Hive, Apache Spark, and Data Catalog give you near real time access to updated data. Apache Hudi facilitates incremental data processing for Amazon S3 by:
Managing record-level changes – Ideal for update and delete use cases
Open formats – Integrates with Presto, Hive, Spark, and Data Catalog
HoodieMultiTableDeltaStreamer – Simplifies ingestion into multiple tables using centralized configurations
Hudi MultiTable Delta Streamer
The HoodieMultiTableStreamer offers a streamlined approach to data ingestion from multiple sources into Hudi tables. By processing multiple sources simultaneously through a single DeltaStreamer job, it eliminates the need for separate pipelines while reducing operational complexity. The framework provides flexible configuration options, and you can tailor settings for diverse formats and schemas across different data sources.
One of its key strengths lies in unified data delivery, organizing information in respective Hudi tables for seamless access. The system’s intelligent upsert capabilities efficiently handle both inserts and updates, maintaining data consistency across your pipeline. Additionally, its robust schema evolution support enables your data pipeline to adapt to changing business requirements without disruption, making it an ideal solution for dynamic data environments.
Solution overview
In this section, we show how to stream data to Apache Hudi Table using Amazon MSK. For this example scenario, there are data streams from three distinct sources residing in separate Kafka topics. We aim to implement a streaming pipeline that uses the Hudi DeltaStreamer with multitable support to ingest and process this data at 15-minute intervals.
Mechanism
Using MSK Connect, data from multiple sources flows into MSK topics. These topics are then ingested into Hudi tables using the Hudi MultiTable DeltaStreamer. In this sample implementation, we create three Amazon MSK topics and configure the pipeline to process data in JSON format using JsonKafkaSource, with the flexibility to handle Avro format when needed through the appropriate deserializer configuration
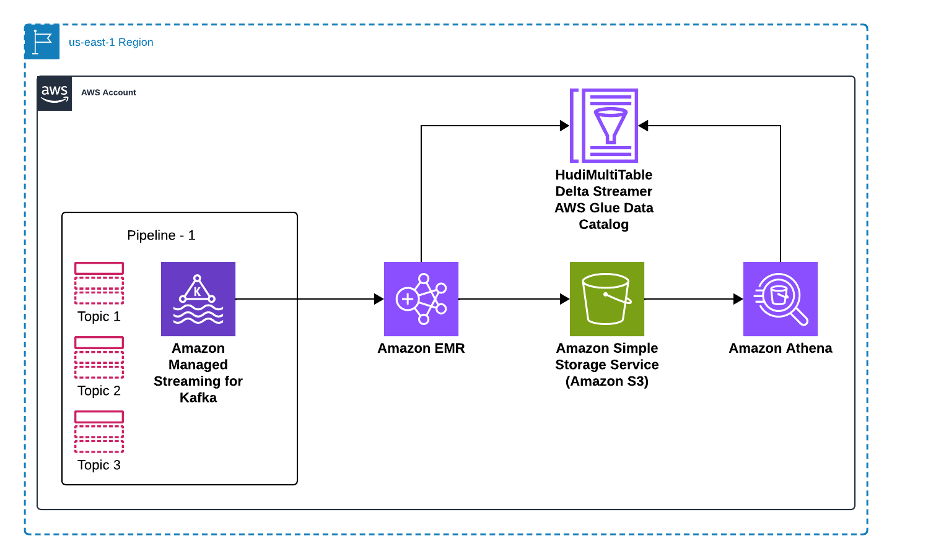
The following diagram illustrates how our solution processes data from multiple source databases through Amazon MSK and Apache Hudi to enable analytics in Amazon Athena. Source databases send their data changes—including inserts, updates, and deletes—to dedicated topics in Amazon MSK, where each data source maintains its own Kafka topic for change events. An Amazon EMR cluster runs the Apache Hudi MultiTable DeltaStreamer, which processes these multiple Kafka topics in parallel, transforming the data and writing it to Apache Hudi tables stored in Amazon S3. Data Catalog maintains the metadata for these tables, enabling seamless integration with analytics tools. Finally, Amazon Athena provides SQL query capabilities on the Hudi tables, allowing analysts to run both snapshot and incremental queries on the latest data. This architecture scales horizontally as new data sources are added, with each source getting its dedicated Kafka topic and Hudi table configuration, while maintaining data consistency and ACID guarantees across the entire pipeline.
To set up the solution, you need to complete the following high-level steps:
Set up Amazon MSK and create Kafka topics
Create the Kafka topics
Create table-specific configurations
Launch Amazon EMR cluster
Invoke the Hudi MultiTable DeltaStreamer
Verify and query data
Prerequisites
To perform the solution, you need to have the following prerequisites. For AWS services and permissions, you need:
The Hudi MultiTable DeltaStreamer configuration is divided into two major components to streamline and standardize data ingestion:
Common configurations – These settings apply across all tables and define the shared properties for ingestion. They include details such as shuffle parallelism, Kafka brokers, and common ingestion configurations for all topics.
Table-specific configurations – Each table has unique requirements, such as the record key, schema file paths, and topic names. These configurations tailor each table’s ingestion process to its schema and data structure.
Create common configuration file
Common Config: kafka-hudi config file where we specify kafka broker and common configuration for all topics as below
Create the kafka-hudi-deltastreamer.properties file with the following properties:
These configurations form the backbone of Hudi’s ingestion pipeline, enabling efficient data handling and maintaining real-time consistency. Schema configurations define the structure of both source and target data, maintaining seamless data transformation and ingestion. Operational settings control how data is uniquely identified, updated, and processed incrementally.
The following are critical details for setting up Hudi ingestion pipelines:
hoodie.deltastreamer.schemaprovider.source.schema.file – The schema of the source record
hoodie.deltastreamer.schemaprovider.target.schema.file – The schema for the target record
hoodie.deltastreamer.source.kafka.topic – The source MSK topic name
bootstap.servers – The Amazon MSK bootstrap server’s private endpoint
auto.offset.reset – The consumer’s behavior when there is no committed position or when an offset is out of range
Key operational fields to achieve in-place updates for the generated schema include:
hoodie.datasource.write.recordkey.field – The record key field. This is the unique identifier of a record in Hudi.
hoodie.datasource.write.precombine.field – When two records have the same record key value, Apache Hudi picks the one with the largest value for the pre-combined field.
hoodie.datasource.write.operation – The operation on the Hudi dataset. Possible values include UPSERT, INSERT, and BULK_INSERT.
Launch Amazon EMR cluster
This step creates an EMR cluster with Apache Hudi installed. The cluster will run the MultiTable DeltaStreamer to process data from your Kafka topics. To create the EMR cluster, enter the following:
This step configures and starts the DeltaStreamer job that will continuously process data from your Kafka topics into Hudi tables. Complete the following steps:
Connect to the Amazon EMR master node:
# Get master node public DNS
MASTER_DNS=$(aws emr describe-cluster --cluster-id $CLUSTER_ID --query 'Cluster.MasterPublicDnsName' --output text)

# SSH to master node
ssh -i myKey.pem hadoop@$MASTER_DNS
For continuous mode, you need to add the following property:
--continuous \
--min-sync-interval-seconds 900
With the job configured and running on Amazon EMR, the Hudi MultiTable DeltaStreamer efficiently manages real-time data ingestion into your Amazon S3 data lake.
Verify and query data
To verify and query the data, complete the following steps:
Register tables in Data Catalog:
# Start Spark shell
spark-shell --conf "spark.serializer=org.apache.spark.serializer.KryoSerializer" \
  --conf "spark.sql.catalog.spark_catalog=org.apache.spark.sql.hudi.catalog.HoodieCatalog" \
  --conf "spark.sql.extensions=org.apache.spark.sql.hudi.HoodieSparkSessionExtension" \
  --jars "/usr/lib/hudi/hudi-spark-bundle.jar"

# In Spark shell
spark.sql("CREATE DATABASE IF NOT EXISTS hudi_sales_tables")

spark.sql("""
CREATE TABLE hudi_sales_tables.cust_sales_details
USING hudi
LOCATION 's3://hudi-data-bucket-$AWS_ACCOUNT_ID/hudi/hudi_sales_tables.cust_sales_details'
""")

# Repeat for other tables
Query with Athena:
-- Sample query
SELECT * FROM hudi_sales_tables.cust_sales_details LIMIT 10;
You can use Amazon CloudWatch alarms to alert you of issues with the EMR job or data processing. To create a CloudWatch alarm to monitor EMR job failures, enter the following:
With the pipeline configured and running, you can achieve real-time updates to your data lake, enabling faster analytics and decision-making. For instance:
Analytics – Up-to-date inventory data maintains accurate dashboards for ecommerce platforms.
Monitoring – CloudWatch metrics confirm the pipeline’s health and efficiency.
Flexibility – The seamless handling of schema evolution minimizes downtime and data inconsistencies.
Cleanup
To avoid incurring future charges, follow these steps to clean up resources:
In this post, we showed how you can build a scalable data ingestion pipeline using Apache Hudi’s MultiTable DeltaStreamer on Amazon EMR to process data from multiple Amazon MSK topics. You learned how to configure CDC with Apache Hudi, set up real-time data processing with 15-minute sync intervals, and maintain data consistency across multiple sources in your Amazon S3 data lake.
By combining CDC with Apache Hudi, you can build efficient, real-time data pipelines. The streamlined ingestion processes simplify management, enhance scalability, and maintain data quality, making this approach a cornerstone of modern data architectures.
To keep a platform like GitHub available and responsive, it’s critical to build defense mechanisms. A whole lot of them. Rate limits, traffic controls, and protective measures spread across multiple layers of infrastructure. These all play a role in keeping the service healthy during abuse or attacks.
We recently ran into a challenge: Those same protections can quietly outlive their usefulness and start blocking legitimate users. This is especially true for protections added as emergency responses during incidents, when responding quickly means accepting broader controls that aren’t necessarily meant to be long-term. User feedback led us to clean up outdated mitigations and reinforced that observability is just as critical for defenses as it is for features.
We apologize for the disruption. We should have caught and removed these protections sooner. Here’s what happened.
What users reported
We saw reports on social media from people getting “too many requests” errors during normal, low-volume browsing, such as when following a GitHub link from another service or app, or just browsing around with no obvious pattern of abuse.
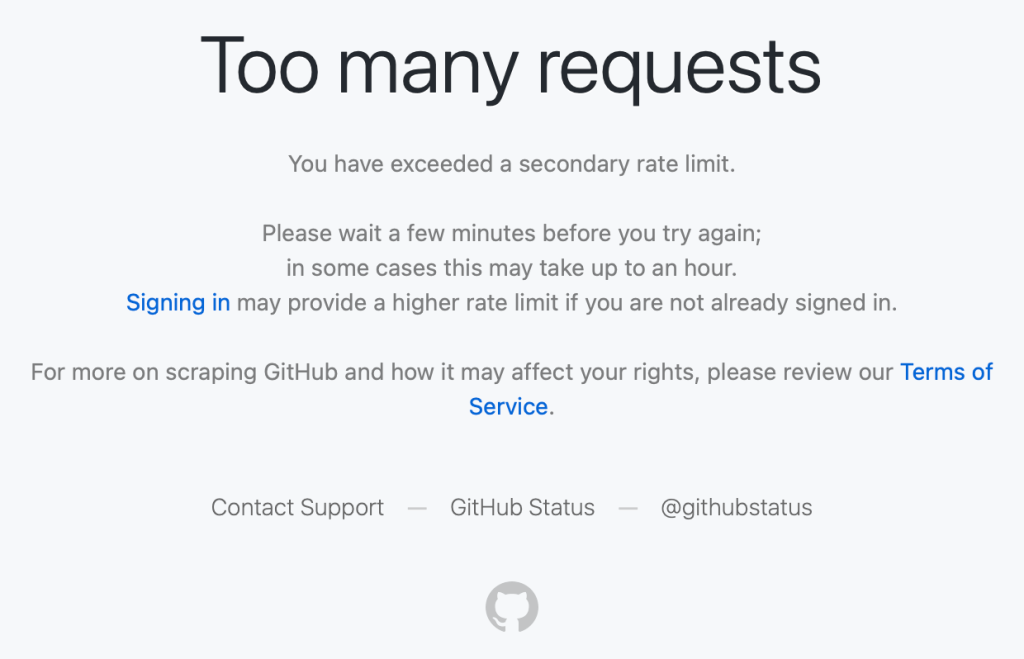
Users encountered a “Too many requests” error during normal browsing.
These were users making a handful of normal requests hitting rate limits that shouldn’t have applied to them.
What we found
Investigating these reports, we discovered the root cause: Protection rules added during past abuse incidents had been left in place. These rules were based on patterns that had been strongly associated with abusive traffic when they were created. The problem is that those same patterns were also matching some logged-out requests from legitimate clients.
These patterns are combinations of industry-standard fingerprinting techniques alongside platform-specific business logic — composite signals that help us distinguish legitimate usage from abuse. But, unfortunately, composite signals can occasionally produce false positives.
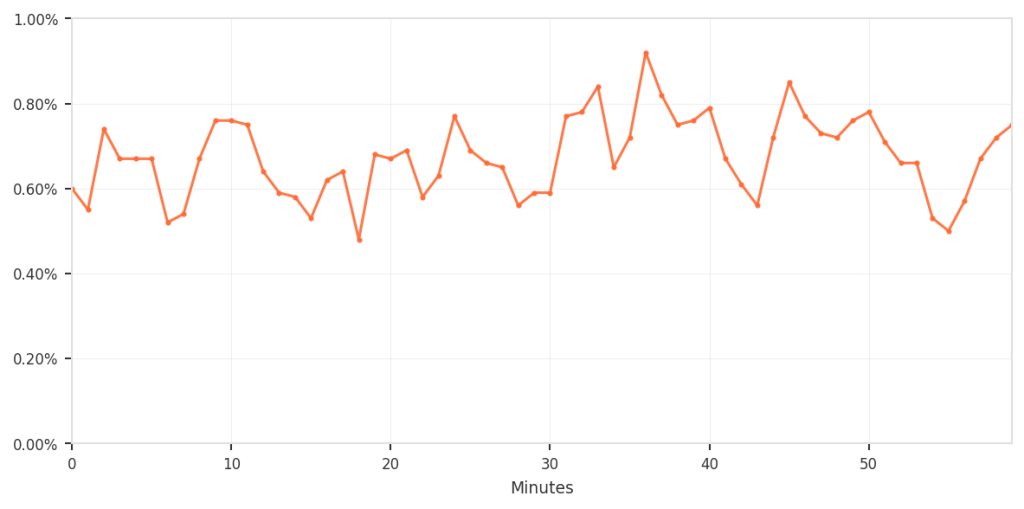
The composite approach did provide filtering. Among requests that matched the suspicious fingerprints, only about 0.5–0.9% were actually blocked; specifically, those that also triggered the business-logic rules. Requests that matched both criteria were blocked 100% of the time.
Not all fingerprint matches resulted in blocks — only those also matching business logic patterns.
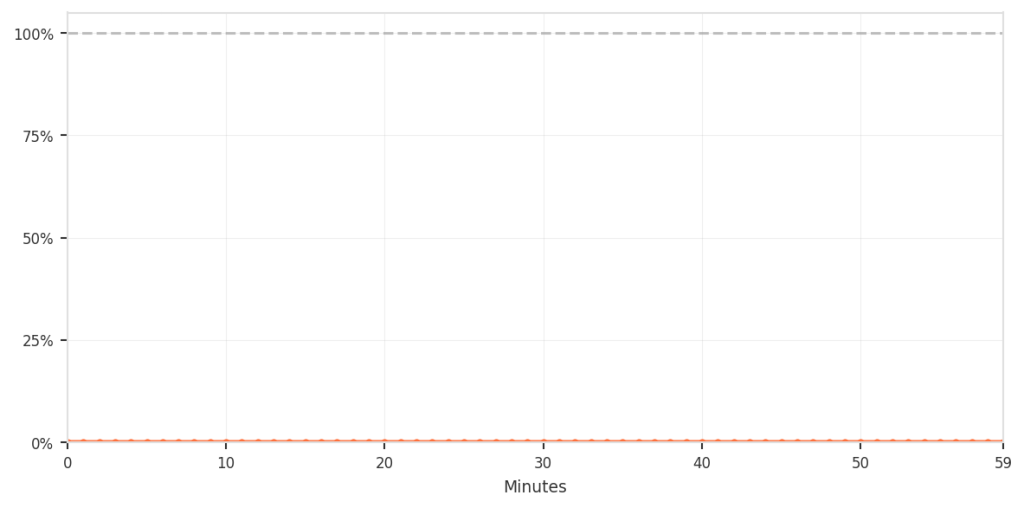
The overall impact was small but consistent; however, for the customers who were affected, we recognize that any incorrect blocking is unacceptable and can be disruptive. To put all of this in perspective, the following shows the false-positive rate relative to total traffic.
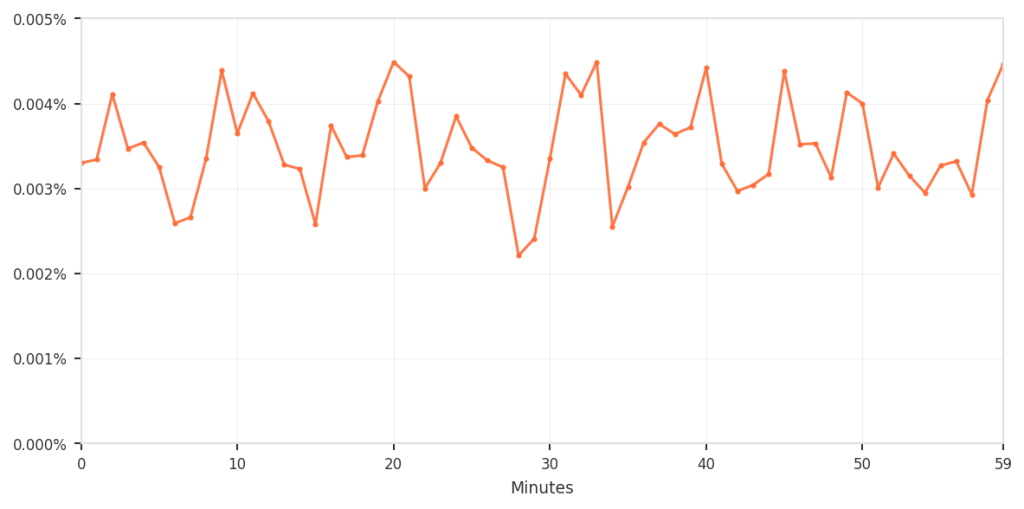
False positives represented roughly 0.003-0.004% of total traffic.
Although the percentage was low, it still meant that real users were incorrectly blocked during normal browsing, which is not acceptable. The chart below zooms in specifically on this false-positive pattern over time.
In the hour before cleanup, approximately 3-4 requests per 100,000 (0.003-0.004%) were incorrectly blocked.
This is a common challenge when defending platforms at scale. During active incidents, you need to respond quickly, and you accept some tradeoffs to keep the service available. The mitigations are correct and necessary at that moment. Those emergency controls don’t age well as threat patterns evolve and legitimate tools and usage change.
Without active maintenance, temporary mitigations become permanent, and their side effects compound quietly.
Tracing through the stack
The investigation itself highlighted why these issues can persist. When users reported errors, we traced requests across multiple layers of infrastructure to identify where the blocks occurred.
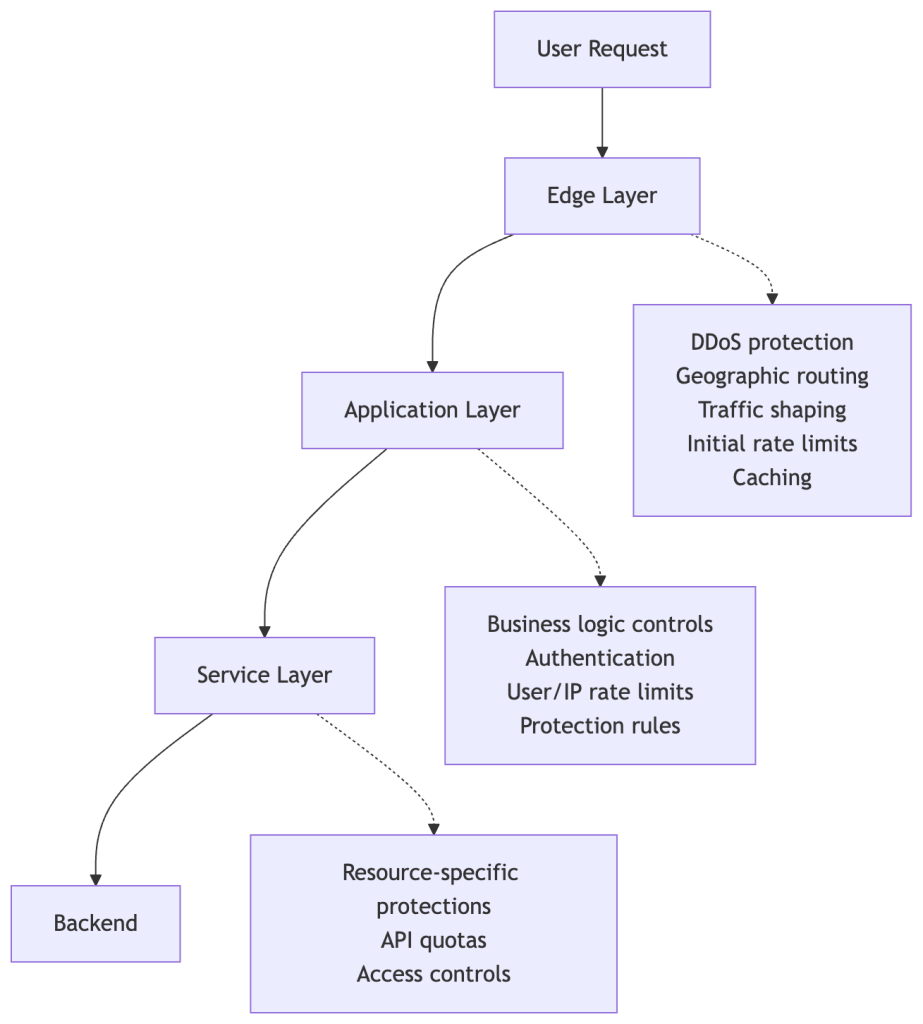
To understand why this tracing is necessary, it helps to see how protection mechanisms are applied throughout our infrastructure. We’ve built a custom, multi-layered protection infrastructure tailored to GitHub’s unique operational requirements and scale, building upon the flexibility and extensibility of open-source projects like HAProxy. Here’s a simplified view of how requests flow through these defense layers (simplified to avoid disclosing specific defense mechanisms and to keep the concepts broadly applicable):
Each layer has legitimate reasons to rate-limit or block requests. During an incident, a protection might be added at any of these layers depending on where the abuse is best mitigated and what controls are fastest to deploy.
The challenge: When a request gets blocked, tracing which layer made that decision requires correlating logs across multiple systems, each with different schemas.
In this case, we started with user reports and worked backward:
User reports provided timestamps and approximate behavior patterns.
Edge tier logs showed the requests reaching our infrastructure.
Application tier logs revealed 429 “Too Many Requests” responses.
Protection rule analysis ultimately identified which rules matched these requests.
The investigation took us from external reports to distributed logs to rule configurations, demonstrating that maintaining comprehensive visibility into what’s actually blocking requests and where is essential.
The lifecycle of incident mitigations
Here’s how these protections outlived their purpose:
Each mitigation was necessary when added. But the controls where we didn’t consistently apply lifecycle management (setting expiration dates, conducting post-incident rule reviews, or monitoring impact) became technical debt that accumulated until users noticed.
What we did
We reviewed these mitigations, analyzing what each one was blocking today versus what it was meant to block when created. We removed the rules that were no longer serving their purpose, and kept protections against ongoing threats.
What we’re building
Beyond the immediate fix, we’re improving the lifecycle management of protective controls:
Better visibility across all protection layers to trace the source of rate limits and blocks.
Treating incident mitigations as temporary by default. Making them permanent should require an intentional, documented decision.
Post-incident practices that evaluate emergency controls and evolve them into sustainable, targeted solutions.
Defense mechanisms – even those deployed quickly during incidents – need the same care as the systems they protect. They need observability, documentation, and active maintenance. When protections are added during incidents and left in place, they become technical debt that quietly accumulates.
Thanks to everyone who reported issues publicly! Your feedback directly led to these improvements. And thanks to the teams across GitHub who worked on the investigation and are building better lifecycle management into how we operate. Our platform, team, and community are better together!
With openwrt-one-debian, you can now install and run a full Debian
system leveraging the OpenWrt One’s NVMe storage, enabling everything
from custom services and containers to development tools and
lightweight server workloads, all on open hardware.
This project provides a rust-based flasher to install Debian on the
OpenWrt One, opening the door to standard Debian tooling, packages,
and workflows. For developers and power users, it transforms the
OpenWrt One from a network appliance into a compact, general-purpose
Linux system.
See the GitHub
repository for the code and latest build. LWN reviewed the device in
November 2024, and covered Denver
Gingerich’s talk at SCALE 22x about
the making of the router in March 2025.
At re:Invent 2025, Matt Garman announced AWS DevOps Agent, a frontier agent that resolves and proactively prevents incidents, continuously improving reliability and performance. As a member of the DevOps Agent team, we’ve focused heavily on making sure that the “incident response” capability of the DevOps Agent generates useful findings and observations. In particular, we’ve been working on making root cause analysis for native AWS applications accurate and performant. Under the hood, DevOps Agent has a multi-agent architecture where a lead agent acts as an incident commander: it understands the symptom, creates an investigation plan, and delegates individual tasks to specialized sub-agents when those tasks benefit from context compression. A sub-agent executes its task with a pristine context window and reports compressed results back to the lead agent. For example, when examining high-volume log records, a sub-agent filters through the noise to surface only relevant messages to the lead agent.
In this blog post, we want to focus on the mechanisms one needs to develop to build an agentic product that works. Building a prototype with large language models (LLMs) has a low barrier to entry – you can showcase something that works fairly quickly. However, graduating that prototype into a product that performs reliably across diverse customer environments is a different challenge entirely, and one that is frequently underestimated. This post shares what we learned building AWS DevOps Agent so you can apply these lessons to your own agent development.
In our experience, there are five mechanisms necessary to continuously improve agent quality and bridge the gap from prototype to production. First, you need evaluations (evals) to identify where your agent fails and where it can improve, while establishing a quality baseline for the types of scenarios your agent handles well. Second, you need a visualization tool to debug agent trajectories and understand where exactly the agent went wrong. Third, you need a fast feedback loop with the ability to rerun those failing scenarios locally to iterate. Fourth, you need to make intentional changes: establishing success criteria before modifying your system to avoid confirmation bias. Finally, you need to read production samples regularly to understand actual customer experience and discover new scenarios your evals don’t yet cover.
Evaluations
Evals are the machine learning equivalent of a test suite in traditional software engineering. Just like building any other software product, a collection of good test cases builds confidence in quality. Iterating on agent quality is similar to test-driven development (TDD): you have an eval scenario that the agent fails (the test is red), you make changes until the agent passes (the test is green). A passing eval means the agent arrived at an accurate, useful output through correct reasoning.
For AWS DevOps Agent, the size of an individual eval scenario is similar to an end-to-end test in the traditional software engineering testing pyramid. Looking through the lens of “Given-When-Then” style tests:
When – Once the fault is injected, an alarm fires, and this triggers the AWS DevOps Agent to start its investigation. The eval framework polls the records that the Agent generates, just like how the DevOps Agent web application renders them. This section isn’t fundamentally different from defining the action in an integration or end-to-end test.
Then – This asserts and reports on multiple metrics. Fundamentally, there’s a single “PASS” (1) or “FAIL” (0) metric for quality. For the DevOps Agent’s incident response capability, a “PASS” means the right root cause surfaced to the customer – in our example, this means identifying the faulty deployment as the root cause and tracing the dependency chain to surface the impacted resources and observations that reveal the missing S3 write permission; otherwise “FAIL”. We define this as a rubric: not just “did the agent find the root cause?” but “did the agent arrive at the root cause through the correct reasoning with the right supporting evidence?”The ground truth (the “expected” or “wanted” in software testing parlance) is compared to the system response (the “actual”) via an LLM Judge – an LLM that receives both the ground truth and the agent’s actual output, then emits its reasoning and a verdict on whether they match. We use an LLM for comparison because the agent’s output is non-deterministic: the agent follows an overall output format but generates the actual text freely, so each run may use different words or sentence structures while conveying the same semantic meaning. We don’t want to strictly search for keywords in the final root cause analysis report but rather evaluate whether the essence of the rubric is met.
The evaluation report is structured with scenarios as rows and metrics as columns. Key metrics that we keep track of are capability (pass@k – whether the agent passed at least once in k attempts), reliability (pass^k – how many times the agent passed across k attempts, e.g., 0.33 means passed 1 out of 3 times for k=3), latency, and token usage.
Why are evals important?
There are several benefits to having evals:
Red scenarios provide obvious investigation points for the agent development team to increase product quality.
Over time, green scenarios act as regression tests, notifying us when changes to the system degrade the existing customer experience.
Once pass rates are green, we can improve customer experience along additional metrics. For example, reducing end-to-end latency and/or optimizing cost (proxied by token usage) while maintaining the quality bar.
What makes evals challenging?
Fast feedback loops help developers know whether code works (is it correct, performant, secure) and whether ideas are good (do they improve key business metrics). This may seem obvious, but far too often, teams and organizations tolerate slow feedback loops […] — Nicole Forsgren and Abi Noda, Frictionless: 7 Steps to Remove Barriers, Unlock Value, and Outpace Your Competition in the AI Era
There are several challenges with evals. In decreasing order of difficulty:
Realistic and diverse scenarios are hard to author. Coming up with realistic applications and fault scenarios is difficult. Authoring high fidelity microservice applications and faults is significant work that requires prior industry experience. What we’ve found effective: we author a few “environments” (based on real application architectures) but create many failure scenarios on top of them. The environment is the expensive portion of the evaluation setup, so we maximize reuse across multiple scenarios.
Slow feedback loops. If the “Given” takes 20 minutes to deploy for an eval scenario and then the “When” takes another 10-20 minutes for complex investigations to complete, agent developers won’t thoroughly test their changes. Instead, they’ll be satisfied with a single passing eval, then release to production, potentially introducing regressions until the comprehensive eval report is generated. Additionally, slow feedback loops encourages batching multiple changes together rather than small incremental experiments, making it harder to understand which change actually moved the needle. We’ve found three mechanisms effective for speeding up feedback loops:
Long-running environments for eval scenarios. The application and its healthy state are created once and kept running. Fault injection happens periodically (e.g., over weekends), and developers point their agent credentials at the faulty environment, completely skipping the “Given” portion of the test.
Isolated testing of only the agent surface area that matters. In our multi-agent system, developers can trigger a specific sub-agent directly with a prompt from a past eval run rather than running the entire end-to-end flow. Additionally, we built a “fork” feature: developers can initialize any agent with the conversation history from a failing run up to a specific checkpoint message, then iterate only on the remaining trajectory. Both of these approaches significantly lowers the wait time of the “When” portion.
Local development of the agentic system. If developers must merge changes and release to a cloud environment before testing, the loop is too slow. Running locally enables rapid iteration.
Visualize trajectories
When an agent fails an eval or a production run, where do you start investigating? The most productive method is error analysis. Visualize the agent’s complete trajectory, every user-assistant message exchange including sub-agent trajectories, and annotate each step as “PASS” or “FAIL” with notes on what went wrong. This process is tedious but effective.
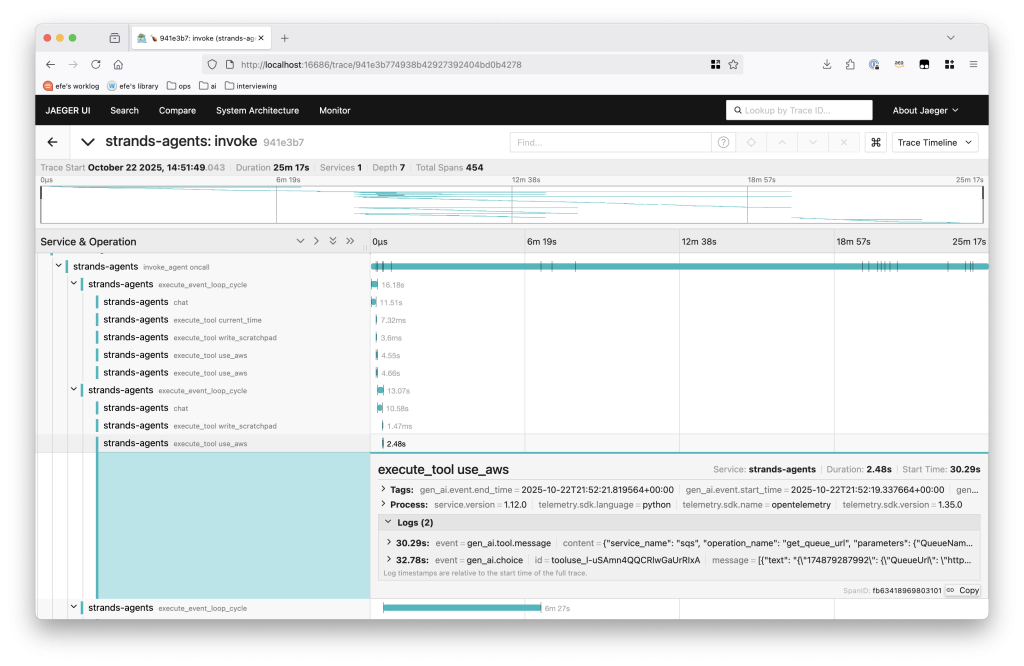
For AWS DevOps Agent, agent trajectories map to OpenTelemetry traces and you can use tools like Jaeger to visualize them. Software development kits like Strands provide tracing integration with minimal setup.
Figure 1 – A sample trace from AWS DevOps Agent.
Each span contains user-assistant message pairs. We annotate each span’s quality in a table such as the following:
This low-level analysis consistently surfaces multiple improvements, not just one. For a single failing eval, one will typically identify many concrete changes spanning accuracy, performance, and cost.
You’ve identified failing scenarios and diagnosed the issues through trajectory analysis. Now it’s time to modify the system.
The biggest fallacy we’ve observed at this stage: confirmation bias leading to overfitting. Given the eval challenges mentioned earlier (slow feedback loops and the impracticality of comprehensive test suites) developers typically test only the few specific failing scenarios locally until they pass. One modifies the context (system prompt, tool specifications, tool implementations, etc.) until one or two scenarios pass, without considering broader impact. When changes don’t follow context engineering best practices, they likely have negative effects that we can’t capture through limited evals.
You need both diligence and judgment: establish success criteria through available evals and reusable past production scenarios, but also educate yourself on context engineering best practices to guide your changes. We’ve found Anthropic’s prompting best practices and engineering blog, Drew Breunig’s how long contexts fail, and lessons from building Manus particularly helpful resources.
Establish success criteria first
Before making any change, define what success looks like:
Baseline. Fix specific git commit IDs for the current system. Think deliberately about which metrics would improve both the agent’s experience and the customer’s experience, then gather those metrics for the baseline.
Test scenarios. Which evals will measure your change’s impact? How many times will you rerun these evals? Convince yourself this set represents broader customer patterns, not just the one failure you’re investigating.
Comparison. Measure your changes against the baseline using the same metrics.
This intentional framing protects against confirmation bias (interpreting results favorably) and sunk cost fallacy (accepting changes simply because you invested time). If your modifications don’t move the metrics as expected, reject them.
For example, when optimizing a sub-agent within AWS DevOps Agent, we establish a baseline by fixing git commit IDs and running the same scenario seven times. This reveals both typical performance and variance.
Each metric measures a different dimension:
Correct observations – How many relevant signals (log records, metric data, code snippets, etc.) that are directly related to the incident did the sub-agent surface?
Irrelevant observations – How much noise did the sub-agent introduce to the lead agent? This counts signals that are unrelated to the incident and could distract the agent’s investigation.
Latency – How long did the sub-agent take (measured in minutes and seconds)?
Sub-agent tokens – How many tokens did the sub-agent to accomplish its task? This serves as a proxy for the cost of running the sub-agent.
Lead-agent tokens – How much of the lead agent’s context window is the sub-agent’s input and output consuming? This gives us a tangible way to identify optimization opportunities for the sub-agent tool: can we compress the instructions to the sub-agent or the results it returns?
After establishing the baseline, we compare these metrics against the same measurements with our proposed changes. This makes it clear whether the change is an actual improvement.
Read production samples
We’ve been fortunate to have several Amazon teams adopt AWS DevOps Agent early. A DevOps agent team member on rotation regularly samples real production runs using our trajectory visualization tool (similar to the OpenTelemetry-based visualization discussed earlier, but customized to render DevOps Agent-specific artifacts like root cause analysis reports and observations), marking whether the agent’s output was accurate and identifying failure points. Production samples are irreplaceable; they reveal the actual customer experience. Additionally, reviewing samples continuously refines your intuition of what the agent is good and bad at. When production runs aren’t satisfactory, you have real-world scenarios to iterate against: modify your agent locally, then rerun it against the same production environment until the desired outcome is reached. Establishing rapport with a few critical early adopter teams willing to partner in this way is invaluable. They provide ground truth for rapid iteration and create opportunities to identify new eval scenarios. This tight feedback loop with production data works in conjunction with eval-driven development to form a comprehensive test suite.
Closing thoughts
Building an agent prototype that demonstrates the feasibility of solving a real business problem is an exciting first step. The harder work is graduating that prototype into a product that performs reliably across diverse customer environments and tasks. In this post, we’ve shared five mechanisms that form the foundation for systematically improving agent quality: evals with realistic and diverse scenarios, fast feedback loops, trajectory visualization, intentional changes, and production sampling.
If you’re building an agentic application, start building your eval suite today. Even starting with a handful critical scenarios will establish the quality baseline needed to measure and improve systematically. To see how AWS DevOps Agent applies these principles to incident response, check out our getting started guide.
Amazon Redshift Serverless removes infrastructure management and manual scaling requirements from data warehousing operations. Amazon Redshift Serverless queue-based query resource management, helps you protect critical workloads and control costs by isolating queries into dedicated queues with automated rules that prevent runaway queries from impacting other users. You can create dedicated query queues with customized monitoring rules for different workloads, providing granular control over resource usage. Queues let you define metrics-based predicates and automated responses, such as automatically aborting queries that exceed time limits or consume excessive resources.
Different analytical workloads have distinct requirements. Marketing dashboards need consistent, fast response times. Data science workloads might run complex, resource-intensive queries. Extract, transform, and load (ETL) processes might execute lengthy transformations during off-hours.
As organizations scale analytics usage across more users, teams, and workloads, ensuring consistent performance and cost control becomes increasingly challenging in a shared environment. A single poorly optimized query can consume disproportionate resources, degrading performance for business-critical dashboards, ETL jobs, and executive reporting. With Amazon Redshift Serverless queue-based Query Monitoring Rules (QMR), administrators can define workload-aware thresholds and automated actions at the queue level—a significant improvement over previous workgroup-level monitoring. You can create dedicated queues for distinct workloads such as BI reporting, ad hoc analysis, or data engineering, then apply queue-specific rules to automatically abort, log, or restrict queries that exceed execution-time or resource-consumption limits. By isolating workloads and enforcing targeted controls, this approach protects mission-critical queries, improves performance predictability, and prevents resource monopolization—all while maintaining the flexibility of a serverless experience.
In this post, we discuss how you can implement your workloads with query queues in Redshift Serverless.
Queue-based vs. workgroup-level monitoring
Before query queues, Redshift Serverless offered query monitoring rules (QMRs) only at the workgroup level. This meant the queries, regardless of purpose or user, were subject to the same monitoring rules.
Queue-based monitoring represents a significant advancement:
Granular control – You can create dedicated queues for different workload types
Role-based assignment – You can direct queries to specific queues based on user roles and query groups
Independent operation – Each queue maintains its own monitoring rules
Solution overview
In the following sections, we examine how a typical organization might implement query queues in Redshift Serverless.
Architecture Components
Workgroup Configuration
The foundational unit where query queues are defined
Contains the queue definitions, user role mappings, and monitoring rules
Queue Structure
Multiple independent queues operating within a single workgroup
Each queue has its own resource allocation parameters and monitoring rules
User/Role Mapping
Directs queries to appropriate queues based on:
User roles (e.g., analyst, etl_role, admin)
Query groups (e.g., reporting, group_etl_inbound)
Query group wildcards for flexible matching
Query Monitoring Rules (QMRs)
Define thresholds for metrics like execution time and resource usage
Specify automated actions (abort, log) when thresholds are exceeded
Prerequisites
To implement query queues in Amazon Redshift Serverless, you need to have the following prerequisites:
Redshift Serverless environment:
Active Amazon Redshift Serverless workgroup
Associated namespace
Access requirements:
AWS Management Console access with Redshift Serverless permissions
AWS CLI access (optional for command-line implementation)
Administrative database credentials for your workgroup
Required permissions:
IAM permissions for Redshift Serverless operations (CreateWorkgroup, UpdateWorkgroup)
Ability to create and manage database users and roles
Identify workload types
Begin by categorizing your workloads. Common patterns include:
Interactive analytics – Dashboards and reports requiring fast response times
Data science – Complex, resource-intensive exploratory analysis
ETL/ELT – Batch processing with longer runtimes
Administrative – Maintenance operations requiring special privileges
Define queue configuration
For each workload type, define appropriate parameters and rules. For a practical example, let’s assume we want to implement three queues:
Dashboard queue – Used by analyst and viewer user roles, with a strict runtime limit set to stop queries longer than 60 seconds
ETL queue – Used by etl_role user roles, with a limit of 100,000 blocks on disk spilling (query_temp_blocks_to_disk) to control resource usage during data processing operations
Admin queue – Used by admin user roles, without a query monitoring limit enforced
On the Redshift Serverless console, go to your workgroup.
On the Limits tab, under Query queues, choose Enable queues.
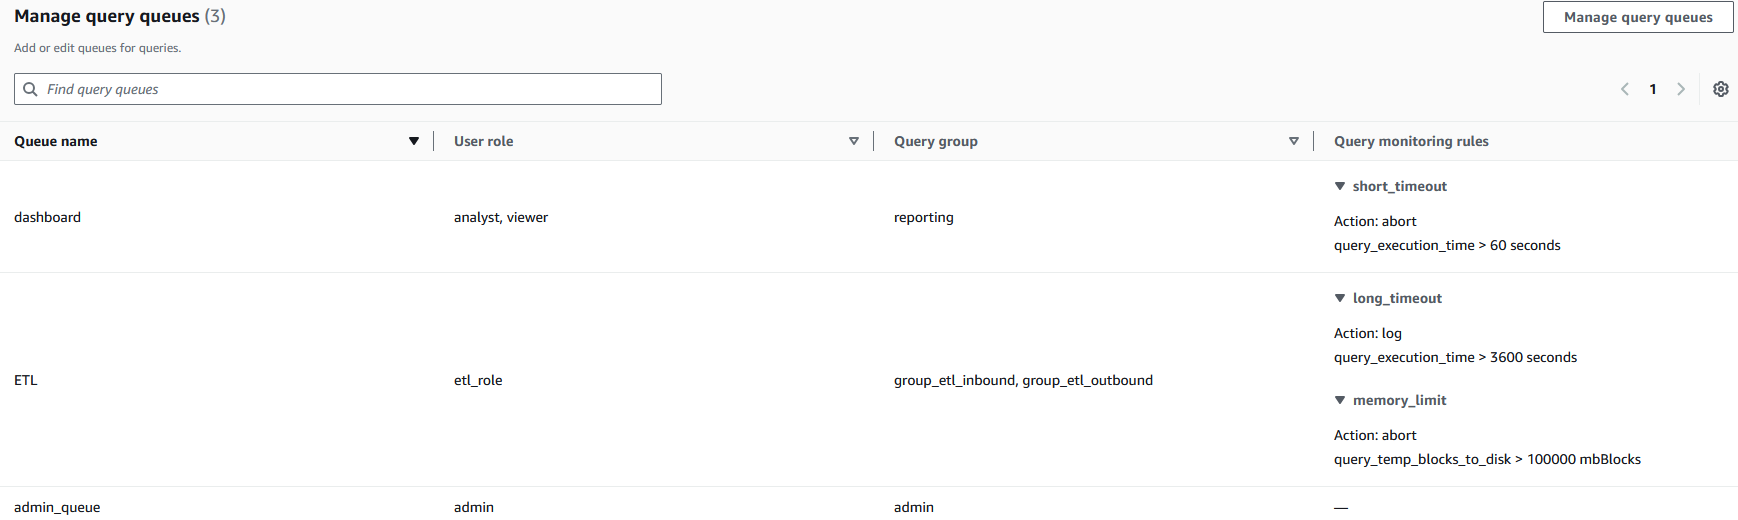
Configure each queue with appropriate parameters, as shown in the following screenshot.
Each queue (dashboard, ETL, admin_queue) is mapped to specific user roles and query groups, creating clear boundaries between query rules. The query monitoring rules implement automated resource governance—for example, the dashboard queue automatically stops queries exceeding 60 seconds (short_timeout) while allowing ETL processes longer runtimes with different thresholds. This configuration helps prevent resource monopolization by establishing separate processing lanes with appropriate guardrails, so critical business processes can maintain necessary computational resources while limiting the impact of resource-intensive operations.
In the following example, we create a new workgroup named test-workgroup within an existing namespace called test-namespace. This makes it possible to create queues and establish associated monitoring rules for each queue using the following command:
Start simple – Begin with a minimal set of queues and rules
Align with business priorities – Configure queues to reflect critical business processes
Monitor and adjust – Regularly review queue performance and adjust thresholds
Test before production – Validate query metrics behavior in a test environment before applying to production
Clean up
To clean up your resources, delete the Amazon Redshift Serverless workgroups and namespaces. For instructions, see Deleting a workgroup.
Conclusion
Query queues in Amazon Redshift Serverless bridge the gap between serverless simplicity and fine-grained workload control by enabling queue-specific Query Monitoring Rules tailored to different analytical workloads. By isolating workloads and enforcing targeted resource thresholds, you can protect business-critical queries, improve performance predictability, and limit runaway queries, helping minimize unexpected resource consumption and better control costs, while still benefiting from the automatic scaling and operational simplicity of Redshift Serverless.
Managing cloud costs effectively is a critical concern for organizations of all sizes. While AWS Budgets provides powerful tools to set spending thresholds and receive notifications, these alerts traditionally arrive through email or through AWS Management Console notifications. These traditional notification methods face several challenges when managing cloud costs:
Email notifications might not be seen immediately
Important budget alerts can get lost in crowded inboxes
Team members might not have immediate access to their email or the console
Global teams need accessible alerting mechanisms that work across time zones
Today, we’re sharing a solution that brings AWS Budgets alerts directly to your WhatsApp using AWS End User Messaging—enabling real-time cost awareness and faster response to budget thresholds wherever you are.
Overview of solution
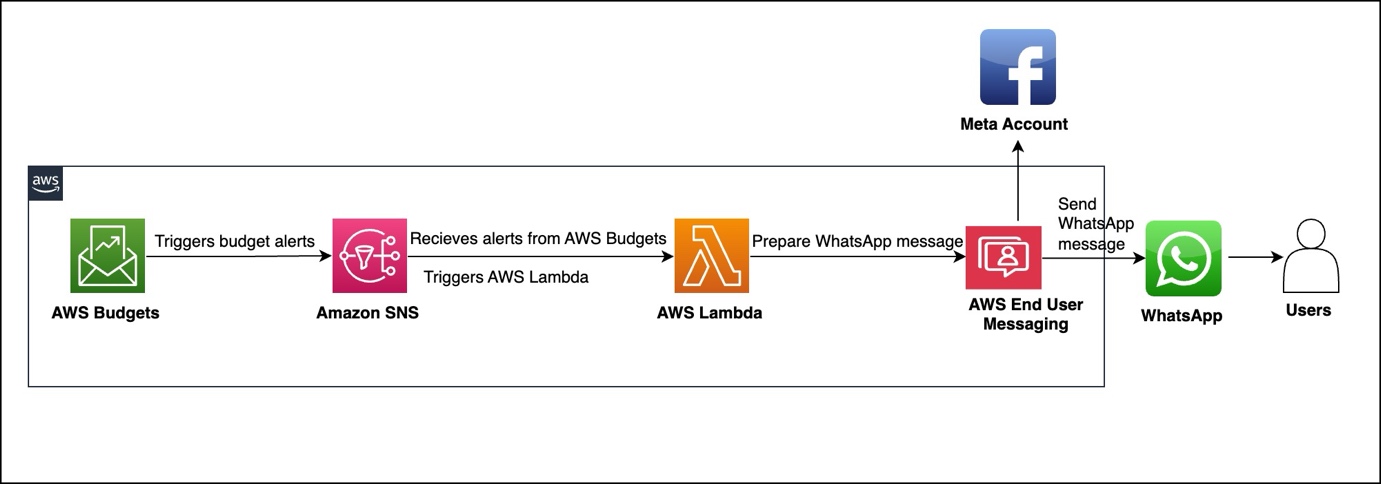
Our solution integrates AWS Budgets with WhatsApp messaging using AWS End User Messaging, AWS Lambda, and Amazon Simple Notification Service (Amazon SNS). When a budget threshold is crossed, the alert is processed and delivered as a formatted WhatsApp message to designated recipients.
The architecture, shown in the following figure, consists of four main AWS services to deliver budget alerts. AWS Budgets tracks expenses against your defined thresholds. When expenses exceed these thresholds, Amazon SNS receives an alert. An AWS Lambda function processes this alert and sends it through AWS End User Messaging to WhatsApp. Users then receive actionable budget notifications directly on their WhatsApp.
Billing and Cost Management data, which AWS Budgets uses to monitor resources, is updated at least once per day. Keep in mind that budget information and associated alerts are updated and sent according to this data refresh cadence. In a budget period,
notifications are triggered every time the notification state goes from OK to Exceeded (when the threshold is exceeded). If the budget stays in Exceeded state in the same budget period, AWS Budgets doesn’t send an additional alert.
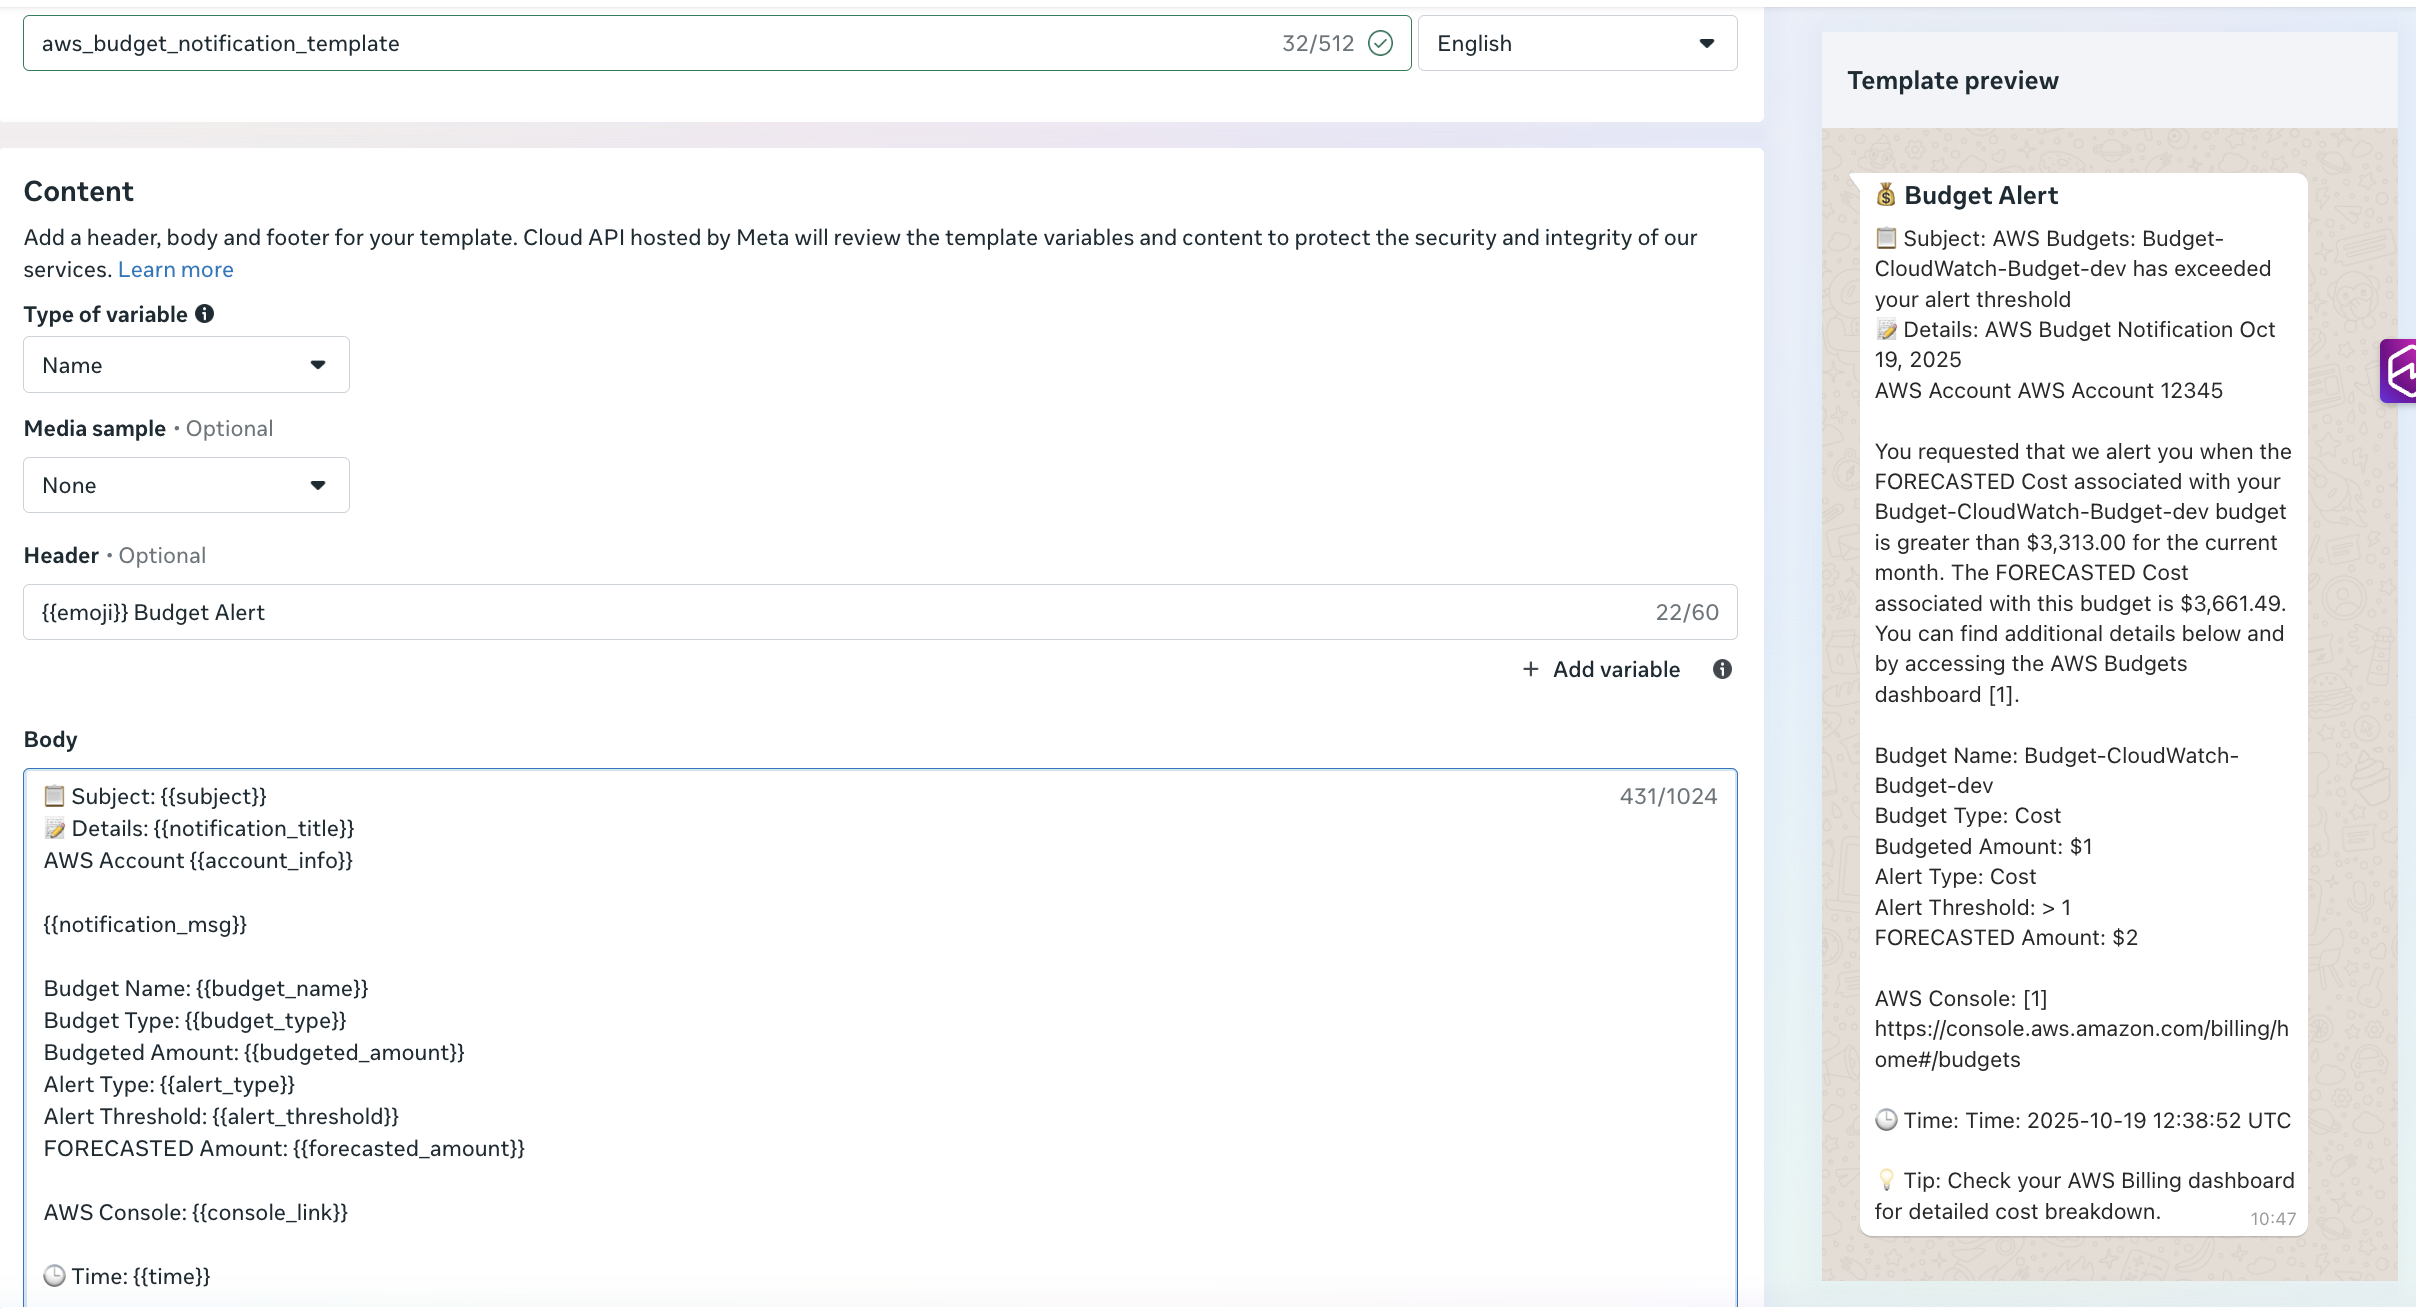
Before you deploy this solution, create an approved utility template in your Meta account named aws_budgets_notification_template(as shown in the following screenshot). Alternatively, use your preferred template name and modify the Lambda function code accordingly.
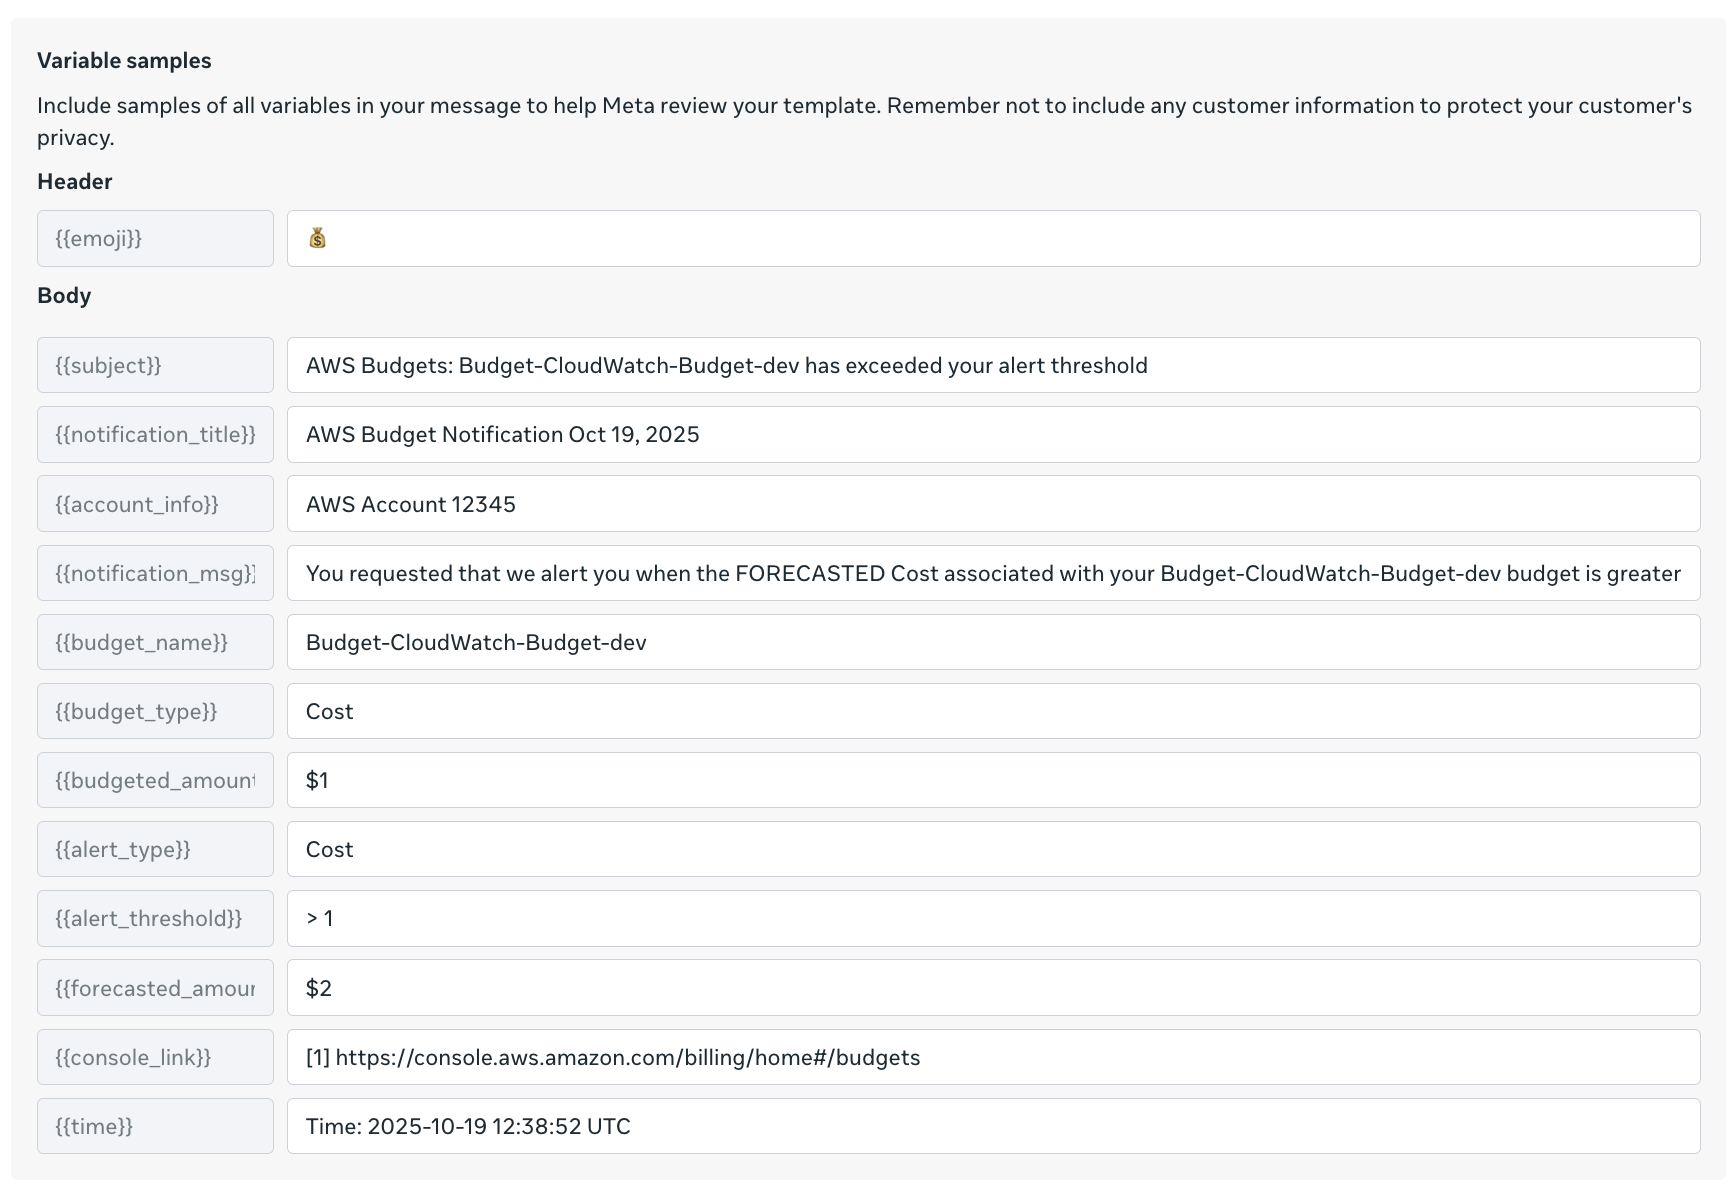
The preceding figure shows variable samples that can be used while creating a message template. You can also use the following AWS Command Line Interface (AWS CLI) command to create the messaging template-
You can confirm the template approval status and type in the Meta portal.
Solution walkthrough
The core component consists of a Python-based Lambda function that processes Budget alerts and formats them for WhatsApp delivery. The function receives SNS events containing budget alerts data, extracts relevant information, formats contextual messages, and delivers notifications through AWS End User Messaging Social.The following function shows an example to parse the SNS message content:
The send_whatsapp_message function uses AWS End User Messaging Social to deliver formatted messages through the socialmessaging client, as shown in the following example:
The solution uses AWS CloudFormation for infrastructure as code (IaC) deployment. The main template creates an SNS topic for alert notifications, a Lambda function for message processing, and required AWS Identity and Access Management (IAM) roles with least-privilege permissions.
The CloudFormation template requires a recipient number with an active WhatsApp account to receive alert notifications as messages. The template also requires the WhatsApp phone number ID retrieved from the AWS End User Messaging Social console, as noted in the prerequisites. The template must be deployed in the same AWS Region as AWS End User Messaging Social. See the following code:
The solution can be tested and validated using the SNS topic created by the CloudFormation stack. Use the following AWS CLI command to publish a test message to the SNS topic:
aws sns publish \
  --topic-arn arn:aws:sns:<region>:<account>:<topic-name> \
  --subject "[Test] AWS Budget Alert: Budget-Alert-EUM has exceeded 80% of your budgeted amount" \
  --message "AWS Budget Notification - Your budget has exceeded the alert threshold
AWS Account 123456789012
Budget Name: Budget-Alert-EUM
Budget Type: Cost
Budgeted Amount: $100.00
Alert Type: ACTUAL
Alert Threshold: 80%
FORECASTED Amount: $85.00
You have exceeded 80% of your budget for this period" \
  --region <region>
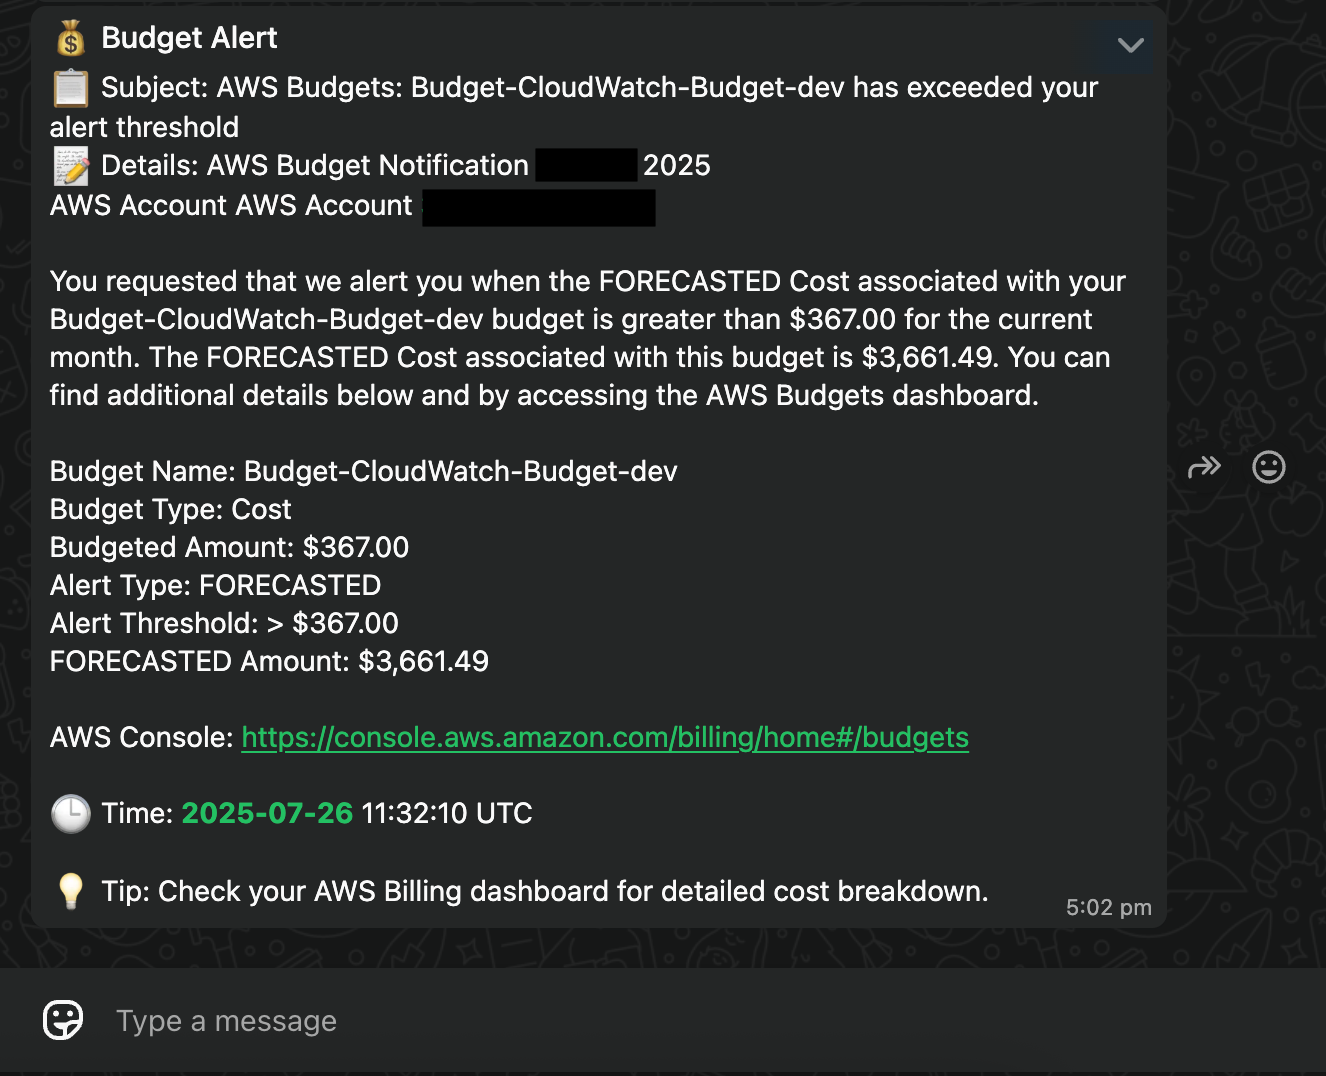
The SNS message triggers the Lambda function, which sends the alert to your configured WhatsApp recipient, as shown in the following screenshot.
Clean up
Use the following steps to clean up your resources when you no longer need this solution:
Delete the CloudFormation stack deployed in this solution: budget-eum-whatsapp-alerts.
Delete the template in your Meta account.
Conclusion
Integrating AWS Budgets alerts with WhatsApp notifications represents a significant step forward in modern cost monitoring. By using AWS End User Messaging Social, you can send teams critical alerts through their preferred communication channel while maintaining the reliability and scalability of AWS services. The solution’s modular architecture, basic yet effective security model, and cost-effective design make it suitable for organizations of various sizes.
Социолозите, които се занимават с изследване на общественото мнение, знаят (или поне би трябвало да знаят), че понякога респондентите дават т.нар. социално желателни отговори. Тоест казват това, което смятат, че е престижно или че се очаква от тях. Това нерядко води до грешки в предизборните проучвания и в екзитполовете – ако хората мислят да гласуват или тъкмо са пуснали бюлетина за партия, за която смятат, че не е престижно да дадат гласа си, е доста вероятно да поизлъжат. Понякога проучванията включват контролни въпроси, чиято цел е да се установи дали респондентите отговарят искрено, или по-скоро се опитват да се харесат. При кратки анкети, каквито са екзитполовете например, това не е подходящ вариант.
Колко толерантно е населението на България към ЛГБТИ хората?
На този въпрос търси отговор национално представително изследване, проведено от „Алфа Рисърч“ сред 1000 респонденти по поръчка на Фондация GLAS. На директното питане дали са съгласни с твърдението „Аз съм толерантен към ЛГБТИ хората“, близо половината (49,7%) отговарят утвърдително. Не се възприемат като толерантни малко над една трета – 35,6%, а 14,7% се затрудняват да преценят.
0% 100%
Да Не Без мнение
Аз съм толерантен към ЛГБТИ хората
49,7%
35,6%
14,7%
Чувствам се комфортно при вида на еднополова двойка, която се държи за ръце
30,5%
59,2%
10,3%
Не би ме притеснило, ако знаех, че преподавател в училището на детето ми е ЛГБТИ
27,8%
54,2%
18,0%
Ограничаването на правата на ЛГБТ хората води до изтичане на квалифицирани млади кадри в чужбина
21,7%
54,1%
24,2%
Бих позволил(а) на детето ми да си играе в дома на свой приятел, чиито родители са еднополова двойка
27,4%
52,7%
19,9%
Еднополовите двойки трябва да имат правото да легализират партньорските си отношения чрез фактическо съжителство
30,5%
47,9%
21,5%
Транссексуалните хора трябва да могат да променят своите документи, така че да съответстват на тяхната полова идентичност
26,5%
46,3%
27,2%
Бих се чувствал(а) комфортно, ако работя с ЛГБТИ човек
35,0%
44,8%
20,2%
Публичното подбуждане към омраза във връзка с ЛГБТИ хората трябва да се наказва като престъпление
34,3%
40,7%
25,0%
Отношението ми към близък човек (дете, брат, сестра, роднина) не би се променило, ако разбера, че той/тя/те са ЛГБТИ
47,0%
32,7%
20,3%
Равният достъп на ЛГБТ хората до социални, здравни и образователни услуги е важен за общественото благосъстояние
56,6%
21,4%
22,0%
Поправките в ЗПУО по-скоро изостриха конфронтацията между хората в обществото или по-скоро допринесоха за подобряване на средата и живота на хората в България?
45,1%
15,6%
39,4%
Средни стойности на толерантност и нетолерантност
34,8%
42,7%
22,5%
Някои от оригиналните въпроси са леко преформулирани с цел отговорите да се подредят в единна скала и с цел съкращаване. Източник: Alpha Research, GLAS Foundation.
Такива общи твърдения са особено благодатни за контролни въпроси – хората могат да разбират под „толерантност“ много различни неща. Изследването предлага на респондентите да се позиционират спрямо повече от 10 твърдения, за да се получи по-ясна представа за действителната им толерантност към ЛГБТИ хората. Очаквано, резултатите доста се разминават с декларираната толерантност.
Можете ли да предположите какво кара близо 60% (59,2%) от населението да се чувства некомфортно?
Двама души от един и същи пол, които… се държат за ръце.
По тази тема анкетираните показват най-високо неодобрение, а тези, които не са сигурни, са най-малко – едва 10,3% (при средно за контролните въпроси 22,5%). Тук следва да се отбележи, че все пак не всички са посочили с еднаква категоричност, че се чувстват некомфортно – крайно некомфортно им е на 30,9%, докато 28,3% изпитват умерен дискомфорт. В проучването липсва въпрос за целуване, но ако от едното държане на ръце хората реагират така, може би при проява на по-голяма еднополова интимност някои от най-негативно реагиращите биха имали нужда от медицинска помощ.
На второ място по степен на неприемане се подреждат ЛГБТИ учителите – 54,2% биха се притеснявали, ако детето им има такъв учител. Почти толкова (54,1%) не са съгласни с твърдението, че ограничаването на правата на ЛГБТ хората води до изтичане на квалифицирани млади кадри в чужбина. Макар че 44,8% биха се чувствали некомфортно да работят с „такива хора“.
Независимо какво смята мнозинството от населението в България обаче, много ЛГБТ хора напускат страната тъкмо по тази причина. Един от тях – Борислав Герасимов – преди няколко години направи за несъществуващия вече сайт out.bg поредицата „Немили-недраги“ – 12 интервюта с ЛГБТ емигранти и 7 лични разказа, от които става ясно как дискриминацията прогонва млади хора. Пред „Тоест“ той пое ангажимента да ги публикува отново онлайн.
52,7% пък не биха пуснали детето си да си играе в дома на приятелче, чиито родители са от един и същи пол.
Близо половината (47,9%) не са съгласни, че фактическото съжителство на еднополовите двойки трябва да се легализира, срещу малко над една четвърт, които смятат, че трябва. За сравнение – 37,5% биха искали правно признаване на съжителството на хетеросексуални двойки, а почти толкова (36,7%) са против. Същевременно 51,7% смятат, че имуществените и неимуществените отношения на хората в съжителство, които не са сключили брак, трябва да бъдат регулирани от закона както на двойките в брак. Но изглежда, за много хора това не включва легализиране на съжителството, още по-малко пък на еднополовите двойки.
След кампанията срещу Истанбулската конвенция, в която взеха дейно участие Конституционният съд и Върховният касационен съд, 46,3% не са съгласни транссексуалните да могат да сменят юридическия си пол. А според 40,7% публичното подбуждане към омраза към ЛГБТИ хората не трябва да се наказва като престъпление (спрямо 34,3%, според които трябва, и една четвърт, които нямат мнение).
Едва една трета от хората в България казват, че биха променили отношението си към близък човек, ако научат, че е ЛГБТИ.
Като имаме предвид обаче, че близо 60% се скандализират при вида на хора от един и същи пол, държащи се за ръце, можем да предположим, че често пъти запазването на доброто отношение към близкия ЛГБТИ човек си има цена – да не „парадира“, да не му личи, да не научат хората, че какво ще си кажат… Има и родители и близки, които реагират в стил „не ме интересува, не искам да знам, това си е твоя работа“, смятайки, че по този начин не са променили отношението си към човека.
Цели 56% смятат, че равният достъп на ЛГБТ хората до социални, здравни и образователни услуги е важен за общественото благосъстояние, срещу 21,4%, които не мислят така. Едва 15,6% смятат, че законодателната промяна, забраняваща т.нар. ЛГБТ пропаганда в училище, е довела до подобрение, а според 45,1% тя е изострила конфронтацията между хората. Близо 40% обаче не са сигурни, което е най-високият дял на нямащи мнение за цялото проучване.
Като теглим чертата, средното равнище на толерантност при отговорите на контролните въпроси е 34,8%, а на нетолерантност – 42,7% – картина, доста по-различна от декларираната.
Добрите новини
Макар данните от проучването да изглеждат обезсърчаващи за отношението на българското население към ЛГБТИ хората, съвсем не всичко е толкова черно. „Алфа Рисърч“ провежда това изследване за трета поредна година, което позволява да се забележи известно положително развитие.
Например подкрепата за легализиране на съжителството и регулиране на имуществените и неимуществените отношения между партньори от един пол, макар и недостатъчна, нараства с около 5 процентни пункта, а в сравнение с 2023 г. – с почти една трета.
Така че държавата има все по-малко основание да не изпълнява решенията на европейски съдилища,
според които трябва да се намери форма на правно признаване на еднополовите бракове, сключени в чужбина.
Изследването отчита също, че за младите е далеч по-лесно да общуват, учат и работят с ЛГБТИ хора, отколкото за по-възрастните. Все пак голяма част от поколението Z не помни времето, когато е нямало „София прайд“, и за него видимостта на тази група от населението е част от пейзажа.
Също така очевидно пропагандата си има граници. Промяната в Закона за предучилищното и училищното образование не консолидира обществото срещу ЛГБТИ хората, а по-скоро му показа, че както би казал Хамлет, „има нещо гнило в Дания“. Макар близо 40% да се затрудняват да оценят поправките в закона, по-малко от 16% ги одобряват.
Най-добрата новина всъщност е, че толерантността продължава да е ценност.
В противен случай хората не биха се изкарвали по-толерантни, отколкото са всъщност. А като се има предвид дългогодишната пропаганда против „толерастията“, както и в какво се превръща светът в последните години, никак не се разбира от само себе си, че толерантността все още се възприема като нещо добро.
Тук немалко ЛГБТИ хора и експерти в областта на човешките права биха казали, че толерантността не е достатъчна дори когато е действителна. Защото тя означава търпимост и нищо повече. Истинското приемане отива отвъд толерантността – едно е просто да търпиш някого, друго е да го смяташ за толкова ценна част от обществото, колкото си и ти.
Но и едната толерантност е нещо в среда като българската и в свят, в който емпатията все повече се презира, а грубата сила е на все по-голяма почит. Въпреки че нашенската толерантност, както става ясно от изследването, прилича повече на пътя към ада, който, казват, бил постлан с много добри намерения.
Al Viro does not often stray outside of the core virtual filesystem area;
when he does, it is usually worthy of note. Recently, he wandered into
memory management with this patch
series to the slab allocator and some of its users. Kernel developers
will often put considerable effort into small optimizations, but it is
still interesting to look at just how much effort has gone toward the purpose of
avoiding a single pointer dereference in some memory-allocation hot paths.
We have recently noticed that email from LWN.net seems to be
blocked by MXroute. Unfortunately, the company also does not seem to
have a way for non-customers to report problems in mail delivery, so
we have no good way to get ourselves unblocked.
As a result, readers who have subscribed to an LWN mailing list
from a domain hosted with MXroute will probably not receive our
mailings. We have not yet unsubscribed addresses that are being
blocked by MXroute, but will soon if the problem persists. Please
accept our apologies for the inconvenience; it is unfortunate that it
is becoming so difficult to send legitimate email as a small
business.
For a while now, NVIDIA has been working to turn its NVLink high speed interconnect technology into more than just a bus used by NVIDIA, aiming to fashion an entire ecosystem around it. Those efforts kicked into high gear last year with the announcement of NVLInk Fusion, a program to allow third parties to connect […]
Today, we’re excited to share that Cloudflare has acquired Human Native, a UK-based AI data marketplace specializing in transforming multimedia content into searchable and useful data.
Human Native x Cloudflare
The Human Native team has spent the past few years focused on helping AI developers create better AI through licensed data. Their technology helps publishers and developers turn messy, unstructured content into something that can be understood, licensed and ultimately valued. They have approached data not as something to be scraped, but as an asset class that deserves structure, transparency and respect.
Access to high-quality data can lead to better technical performance. One of Human Native’s customers, a prominent UK video AI company, threw away their existing training data after achieving superior results with data sourced through Human Native. Going forward they are only training on fully licensed, reputably sourced, high-quality content.
This gives a preview of what the economic model of the Internet can be in the age of generative AI: better AI built on better data, with fair control, compensation and credit for creators.
The Internet needs new economic models
For the last 30 years, the open Internet has been based on a fundamental value exchange: creators create content, aggregators (such as search engines or social media) send traffic. Creators can monetize that traffic through advertisements, subscriptions or direct support. This is the economic loop that has powered the explosive growth of the Internet.
But it’s under real strain.
Crawl-to-referral ratios are skyrocketing, with 10s of thousands of AI and bot crawls per real human visitor, andit’s unclear how multipurpose crawlers are using the content they access.
The community of creators who publish on the Internet is a diverse group: news publishers, content creators, financial professionals, technology companies, aggregators and more. But they have one thing in common: They want to decide how their content is used by AI systems.
Cloudflare’s work in building AI Crawl Control and Pay Per Crawl is predicated on a simple philosophy: Content owners should get to decide how and when their content is accessed by others. Many of our customers want to optimize their brand and content to make sure it is in every training data set and shows up in every new search; others want to have more control and only allow access if there is direct compensation.
Our tools like AI Search, AI Crawl Control and Pay Per Crawl can help, wherever you land in that equation. The important thing is that the content owner gets to decide.
New tools for AI developers
With the Human Native team joining Cloudflare, we are accelerating our work in helping customers transform their content to be easily accessed and understood by AI bots and agents in addition to their traditional human audiences.
Crawling is complex, expensive in terms of engineering and compute to process the content, and has no guarantees of quality control. A crawled index can contain duplicates, spam, illegal material and many more headaches. Developers are left with messy, unstructured data.
We recently announced our work in building the AI Index, a powerful new way for both foundation model companies and agents to access content at scale.
Instead of sending crawlers blindly and repeatedly across the open Internet, AI developers will be able to connect via a pub/sub model: participating websites will expose structured updates whenever their content changes, and developers will be able to subscribe to receive those updates in real time.
This opens up new avenues for content creators to experiment with new business models.
Building the foundation for these new business models
Cloudflare is investing heavily in creating the foundations for these new business models, starting with x402.
We recently announced that we are creating the x402 Foundation, in partnership with Coinbase, to enable machine-to-machine transactions for digital resources.
Payments on the web have historically been designed for humans. We browse a merchant’s website, show intent by adding items to a cart, and confirm our intent to purchase by putting in our credit card information and clicking “Pay.” But what if you want to enable direct transactions between automated systems? We need protocols to allow machine-to-machine transactions.
Together, Human Native and Cloudflare will accelerate our work in building the basis of these new economic models for the Internet.
What’s next
The Internet works best when it is open, fair, and independently sustainable. We’re excited to welcome the Human Native team to Cloudflare, and even more excited about what we will build together to improve the foundations of the Internet in the age of AI.
We discovered a critical vulnerability (CVE-2026-21858, CVSS 10.0) in n8n that enables attackers to take over locally deployed instances, impacting an estimated 100,000 servers globally. No official workarounds are available for this vulnerability. Users should upgrade to version 1.121.0 or later to remediate the vulnerability.
To provide the best experiences, we use technologies like cookies to store and/or access device information. Consenting to these technologies will allow us to process data such as browsing behavior or unique IDs on this site. Not consenting or withdrawing consent, may adversely affect certain features and functions.
Functional
Always active
The technical storage or access is strictly necessary for the legitimate purpose of enabling the use of a specific service explicitly requested by the subscriber or user, or for the sole purpose of carrying out the transmission of a communication over an electronic communications network.
Preferences
The technical storage or access is necessary for the legitimate purpose of storing preferences that are not requested by the subscriber or user.
Statistics
The technical storage or access that is used exclusively for statistical purposes.The technical storage or access that is used exclusively for anonymous statistical purposes. Without a subpoena, voluntary compliance on the part of your Internet Service Provider, or additional records from a third party, information stored or retrieved for this purpose alone cannot usually be used to identify you.
Marketing
The technical storage or access is required to create user profiles to send advertising, or to track the user on a website or across several websites for similar marketing purposes.