Tag Archives: Github

Introducing an Interactive Code Review Experience with Amazon Q Developer in GitHub

Post Syndicated from Sundaresh Iyer original https://aws.amazon.com/blogs/devops/introducing-an-interactive-code-review-experience-with-amazon-q-developer-in-github/

Code reviews are one of the most valuable rituals in software development. They help ensure quality, maintain consistency, and foster growth as engineers. But they’re also one of the most time consuming steps in the software development lifecycle. A common pattern I’ve seen is a developer opening a pull request (PR), receiving automated or peer comments, and then needing to search through documentation, Slack threads, or past code just to understand why a change was suggested. That search for missing context creates a friction that slows teams down, adds back-and-forth cycles, and often distracts from the bigger picture of building great products.

In the initial preview experience, teams used Amazon Q Developer in GitHub across issues and PRs for feature work, automated code reviews, and common modernization tasks. This kept work inside GitHub and reduced handoffs. Automatic reviews on new or reopened PRs surfaced findings early, but teams still wanted more context and a tighter loop inside the PR.

Today we’re introducing an interactive code review experience for PRs You can ask Amazon Q Developer questions about any finding using /q, see a concise summary with threaded findings, and apply suggested changes without leaving GitHub. Code reviews by Amazon Q Developer now complete quicker than before, which reduces wait time and shortens the review cycle so teams can merge sooner and spend more time building.

What’s new and why it matters

  • Interactive Conversations in the pull request: Comment with /q to get inline answers, or ask Q Developer to propose a code change you can apply in the PR. For example:/q explain this finding or /q propose a change that replaces class toggles with a data attribute for state.
  • Code review summaries with threaded findings: Each code review begins with a concise summary and findings are threaded underneath. This makes updates easier to follow and reduces noise.
  • Faster execution with clearer notifications: Amazon Q Developer completes its analysis quicker and notifications are organized and easier to scan. This reduces wait time and shortens the review cycle.
    When you create or open a new PR, Amazon Q Developer automatically starts a code review if the code review feature is enabled for your GitHub installation in the Amazon Q Developer console. Subsequent commits do not trigger another automatic review. To run a fresh analysis, post /q review as a new comment on the PR.

Getting Started with Amazon Q Developer in GitHub

To get started, install the Amazon Q Developer GitHub App in your GitHub organization or repository. The app is available through the GitHub Marketplace and can be used without an AWS account during the preview. During installation, you choose whether to provide access to all repositories or only selected repositories in your GitHub organization. You can increase free usage by registering the app installation in the Amazon Q Developer console.
For more details on installation, permissions, and configuration options, see the Amazon Q Developer for GitHub documentation. Once the app is installed, you can begin using Q Developer to review PRs automatically.

Using Amazon Q Developer in Pull Requests

To dive deeper, here’s an end-to-end walk-through of the new interactive code review experience using a simple card game I built with Amazon Q Developer.

  1. Create a new pull request : In this example, I started by creating a feature branch and named it demo, added atailwind.css file to the JavaScript and HTML card game app, pushed the branch, and opened a PR for review.
    • GitHub interface showing the creation of a new pull request for a demo branch, with changes to a tailwind.css file in a card game application
  2. Amazon Q Developer automatically starts a code review, analyzing code quality, potential issues, and adherence to best practices. A concise summary appeared at the top, with individual findings threaded underneath. This gave me the big picture and the specifics in one place.
    •  GitHub pull request interface showing a notification that Amazon Q Developer has automatically initiated a code review and is analyzing the changes, with a progress indicator
    • GitHub interface displaying Amazon Q Developer's completed review with a concise summary at the top and detailed findings organized in threaded comments below, highlighting code quality issues and suggested improvements
  3. Code review the summary and findings: I reviewed the summary and threaded findings to decide which change to take on first. Seeing both the rationale and the exact lines called out meant I knew where to begin, without hunting through files.
    •         GitHub interface showing Amazon Q Developer's threaded findings, where each finding is organized as a separate comment thread with detailed explanations of identified issues in the code
    •        
  4. Ask for Clarification with /q : One of the findings suggested using state property to track the card status in my card game application. so I asked Q Developer for clarification. It responded quickly with concrete context and pointers, which reduced back and forth and improved the quality of the review.
    •         Screenshot showing a conversation thread where a developer uses the /q command to ask Amazon Q Developer for clarification about state property implementation in the card game
    •         GitHub interface displaying Amazon Q Developer's detailed response to the clarification request, providing context and specific explanations about the state property implementation recommendation
  5. Continue the conversation (if needed) : I reviewed Q Developer’s suggestion and responded back stating that I preferred an alternate approach and Q Developer quickly returned a complete implementation I could apply in the PR
    •      GitHub interface showing a follow-up exchange between the developer and Amazon Q Developer, where the developer proposes an alternate approach and receives implementation suggestions
  6. Apply Fixes : After reviewing the implementation suggestion, I clicked on Commit suggestion to create a new commit on the PR branch with my username as the author.
  7. Re-run the review : I didn’t need this for my example, but if you push additional changes, you can run a fresh analysis by posting /q review as a new top-level comment. Q Developer will run the review and post updated findings.

With the code review complete and checks passing, I merged. The new interactive code review experience reduced wait time and review cycles and made the “why” behind each finding and suggested change clear.

Conclusion

Amazon Q Developer for GitHub is available today in preview. Whether you are an individual developer or part of a large engineering team, this update helps you ship cleaner code with fewer cycles and makes code reviews something to look forward to rather than avoid.
Try it out on your next PR. Type /q, ask a question, and see how smarter conversational reviews transform your workflow.

Best practices for rapidly deploying Landing Zone Accelerator on AWS

Post Syndicated from Lei Shi original https://aws.amazon.com/blogs/devops/best-practices-for-rapidly-deploying-landing-zone-accelerator-on-aws/

Landing Zone Accelerator on AWS (LZA) enables customers to deploy a flexible, configuration-driven solution to establish a landing zone while also leveraging AWS Control Tower. At AWS Professional Services, we’ve helped customers deploy and configure LZA hundreds of times. A common request we encounter is integrating LZA configuration into customers’ existing GitOps workflows. GitOps has emerged as a leading model for Infrastructure as Code (IaC), helping organizations automate and manage their cloud infrastructure. The model uses Git repositories as the single source of truth for infrastructure configuration, enabling teams to maintain consistent, version-controlled environments.

In this blog, we will focus on common LZA implementation steps based on our experience, helping customers jump-start their LZA environment and implement GitOps for their AWS infrastructure management. First, we will demonstrate how to leverage LZA while complying with your organization’s policies such as private package repositories. Next, we will guide you through a new installation of LZA that takes advantage of an auto-generated starter set of configuration files. Finally, we will direct you to another blog post that will enable you to leverage GitOps for ongoing management of your LZA configuration.

Architecture overview

The LZA solution leverages two distinct repositories; one for the LZA source code, and another for your organization’s specific configuration files. LZA creates two separate AWS CodePipelines , which are used to install the LZA solution and apply your organization’s specific configuration. Figure 1 illustrates the association between repositories and pipelines. By default, when installing LZA, the solution uses GitHub as the source and pulls the installation files published by AWS from the official LZA GitHub repository.

a diagram with icons illustrating LZA solution components

Figure 1. Landing Zone Accelerator solution components

Deploy LZA as a new install

Step 1: Preparing your enterprise private GitHub to host LZA source code.
Customers may choose to deploy LZA from the official AWS GitHub repository for LZA, but we often we find customers have policies in place that require these types of packages to be deployed from a private repository managed by the organization. For customers using GitHub privately in their enterprise, this can be as easy as cloning the LZA source code repository into your own private GitHub repository, enabling you to take advantage of policies and controls within your organization. Before moving to the next step, take a moment and clone the repository into your own private repository. A GitHub personal access token stored in AWS Secrets Manager is required to enable the stack to access your private repository. Before deploying LZA, follow these instructions to enable stack access to your repository.

Step 2: In the organization management account, install LZA as a CloudFormation Stack.

To get started, we will be going through a new installation of the LZA solution. The following steps provide specific parameter options to the CloudFormation template to support a new installation of LZA.

Specify the following parameters for Source Code Repository Configuration, see Figure 2.

  1. For Stack name, specify a name you like.
  2. For Source Location, choose github.
  3. For Repository Owner, specify your GitHub account owner ID.
  4. For Repository Name, specify your cloned LZA source code repository
  5. For Branch Name, specify the branch name of your LZA source code repository.

a screenshot of a set of parameters setting of LZA source code repo in a cloudformation stack

Figure 2. LZA installer stack parameters – source code repository

Specify the following parameters for Configuration Repository Configuration, see Figure 3.

  1. For Configuration Repository Location, choose s3.
  2. For Use Existing Config Repository, choose No.
  3. For Existing Config Repository Name, Existing Config Repository Branch Name, Existing Config Repository Owner, and Existing Config Repository CodeConnection ARN, leave blank.

We intentionally want to use S3 for the configuration repository because as the LZA solution is installed, it will auto-generate a set of starter configuration YAML files and deploy them for us in S3. This makes it very easy to get started with an initial set of customized YAML files for your environment. We choose “No” in the Use Existing Config Repository field, to have LZA to perform a new LZA installation.

a screenshot of a set of parameters setting of LZA configuration repo in a cloudformation stack

Figure 3. LZA installer stack parameters – configuration repository

  1. Choose Next, and complete the remainder of the stack settings.
  2. Finally, choose Create stack to launch the CloudFormation stack.

The installer stack typically takes minutes to complete (See Figure 4).

a screenshot showing LZA installation cloudformation stack completed successfully

Figure 4. LZA installer stack completion

Step 3: Validate two LZA pipelines are created and successfully completed in AWS CodePipeline console.

After the CloudFormation stack completes, open the AWS CodePipeline console. You’ll see a new pipeline named “AWSAccelerator-Installer” running (See Figure 5). This is the LZA Installer pipeline, and it’s connected to the GitHub source repository you specified in Step 2 above with parameters from 2 to 5. This Installer pipeline automatically generates a set of LZA configuration files stored as a compressed ZIP archive in Amazon S3. It will be designated as configuration repository of the LZA solution.

a screenshot showing LZA installer pipeline created in AWS CodePipeline successfully

Figure 5. AWSAccelerator-Installer pipeline creation

When the AWSAccelerator-Installer pipeline completes, the solution automatically creates and runs a second pipeline named “AWSAccelerator-Pipeline” as shown in Figure 6. This pipeline connects to both the GitHub source repository, and the newly created configuration repository in Amazon S3. The AWSAccelerator-Pipeline is the pipeline that manages your landing zone deployment and customization.

a screenshot showing LZA core pipeline created in AWS CodePipeline successfully

Figure 6. AWSAccelerator-Pipeline created from the AWSAccelerator-Installer pipeline

After the AWSAccelerator-Pipeline completes, your LZA solution is ready for customization.

Step 4: Migrate the LZA configuration repository from S3 to GitHub

With the AWSAccelerator-Pipeline completed, your initial landing zone is now deployed, leveraging the configuration stored in your S3 bucket. For some customers, they may need to ensure that changes to the landing zone configuration are controlled through their existing GitOps processes and tooling. See Figure 7 as an example where the S3 configuration files have been copied to a customer owned GitHub repository. This transition step can be performed in future LZA upgrade window when there is a new release of LZA source code, or right after the initial LZA installation completes in Step 3. For more information on migrating from S3 to GitHub, follow this guide to configure your AWSAccelerator-Pipelines with AWS CodeConnection.

a diagram with icons illustrating LZA solution new components with LZA configuration repo migrated to GitHub

Figure 7. CodeConnection based LZA Configuration Repository

Conclusion

In this post, we explored key steps to streamline your LZA implementation journey. By demonstrating how to work with your private package repositories, providing guidance on leveraging auto-generated configuration files, and introducing GitOps-based management, we’ve outlined a practical path to establish and maintain a robust AWS infrastructure foundation. These approaches can significantly reduce the time and complexity typically associated with LZA deployments while ensuring compliance with organizational policies. We encourage you to try these implementation steps and explore the referenced resources to enhance your AWS cloud operations. For more information about Landing Zone Accelerator, visit the AWS Landing Zone Accelerator on GitHub.

About the authors

author photo of Lei Shi

Lei Shi

Lei Shi is a Delivery Consultant at AWS Professional Services, where he transforms complex cloud challenges into elegant solutions. He focuses on enabling organizations to build secure and scalable cloud environments throughout their AWS journey.

author photo of Adam Spicer

Adam Spicer

Adam Spicer is a Principal Cloud Architect for AWS Professional Services. He works with enterprise customers to design and build their cloud infrastructure and automation to accelerate their migration to AWS. He is an avid FSU Seminole fan who loves to be on outdoor adventures with his family.

Using Semantic Versioning to Simplify Release Management

Post Syndicated from Brandon Kindred original https://aws.amazon.com/blogs/devops/using-semantic-versioning-to-simplify-release-management/

Any organization that manages software libraries and applications needs a standardized way to catalog, reference, import, fix bugs and update the versions of those libraries and applications. Semantic Versioning enables developers, testers, and project managers to have a more standardized process for committing code and managing different versions. It’s benefits also extend beyond development teams to end users by using change logs and transparent feature documentation. This alleviates the operational burden of communicating changes for each release cycle.

In this post, we dive deep into how Semantic Versioning works and how to use the NodeJS package semantic-release/npm in a GitHub Actions continuous integration and continuous delivery (CI/CD) pipeline to automatically version an Amazon Web Services (AWS) Cloud Development Kit (AWS CDK) project. Once we’re done, you’ll be ready to deliver AWS CDK projects that are automatically versioned so your team can focus more on code instead of versioning for each release.

How does Semantic Versioning work?

With Semantic Versioning, version number changes convey a specific meaning about the underlying code change. This helps others to understand what has changed from one version to the next.

Semantic Versioning is defined in a Major.Minor.Patch format, which is a guideline to track the scope and potential impact of changes for feature development, major updates and bug fixes. The Major version number change signifies that this release will have breaking changes and any upgrade to this version should be validated for backward compatibility. The Minor version number change signifies a feature release in a backward-compatible manner. Finally, the Patch version number signifies a small insignificant change or a bug fix and users can upgrade to this version without introducing breaking changes or new features.

Each version number is always incremented by one digit and when a higher digit increments, the lower digits reset to zero. For example, version 1.5.2 means that the software is in its first major version, and has released 5 features with 2 patches implemented. When a new feature is added, it will be released as version 1.6.0. If there are any bugs reported and a fix is release for that bug, the next release version will be 1.6.1. For a version 2.0.0 release there will be breaking changes, and may not be backward compatible with previous 1.x.x versions.

What is semantic-release?

Now that we have covered how Semantic Versioning works, and why it’s useful in software projects, let’s review semantic-release. It is a Node.js tool that simplifies Semantic Versioning management. Semantic-release can do more than just apply Semantic Versioning to your projects. With a variety of plugins available, you can track what sort of changes are being made with commit analysis or by generating a changelog for each release. This automates what would otherwise have been a manual and time-consuming process to create and review roadmaps and documentation tracking the new features and fixes that comprise a release. Semantic-release is also straightforward to integrate with CI tools such as GitHub Actions, GitLab CI, Travis CI, and CircleCI 2.0 workflows.

Unfortunately, if your commit messages don’t match the format semantic-release requires, the automatic versioning won’t work correctly. To verify that commit messages are in the right format, you can integrate tools such as commitizen or commitlint, which can validate that commit messages are in a valid format.

Using semantic-release

Commit message formats

By default, semantic-release uses Angular Commit Message Conventions, however the commit message format can be altered by using config options. Let’s take a quick look at the three different types of commit messages, fixes, features, and breaking changes.

Patches and fixes

For patch or fix commits, you need to start your commit message with “fix(context):”. This tells semantic-release that this is a minor patch—meaning that if your version is 0.0.1, after this commit is merged the version will be incremented to 0.0.2. Following is an example commit message.

fix(printer): inform user when printer is out of paper

Features

Feature commit messages start with “feat(context):” which indicates to semantic-release that this is a feature release, also referred to as a minor release. If your version is 0.1.0, after a feature commit is merged, the version will be incremented to 0.2.0. Following is an example of a feature commit.

feat(printer): add option for printing in color

Breaking changes

Breaking change commits are intended for marking a major breaking change—meaning that the commit introduces changes that are not compatible with existing or previous versions. The way that commit messages are marked as breaking changes is slightly different than the previous commit types. For a breaking change, the commit footer needs to include “BREAKING CHANGE:”. For example, a breaking change commit, might look like the following.

perf(printer): remove color printing option

BREAKING CHANGE: The color printing option has been removed. The default black and white printing option is always used for performance reasons.

Release change log

To generate a release change log, we only need to add the semantic-release/changelog plugin to the package.json file. We’ll demonstrate how to do this in the next section.

Adding Semantic Release to an AWS CDK project

To demonstrate semantic-release in action we will build an example with AWS CDK and the NPM semantic-release library. All code provided in the remainder of this blog can be found in the semantic-versioning demo repository (aws-cdk-semantic-release) on GitHub.

To get started we’ll need to create a Node.js CDK application, add semantic-release and its plugins, commit changes, then build the project. If you don’t have AWS CDK installed yet, check out the Getting Stated with CDK guide.

To begin, navigate to the folder where the project will be saved. Next, we initialize a new AWS CDK project and add semantic-release. Then, we configure the branches that Semantic Versioning should be applied to and add a few NPM plugins to extend the functionality of semantic-release. While there are many plugins available, only a few are needed to get started. Below, we’ll walk through which plugins to install and how to install them.

Initiate a new AWS CDK Typescript project and add semantic-release

In a command terminal, navigate to the folder where you want to store your AWS CDK project and run the following three commands. The first line will create the project and the next two will install the semantic-release NPM and Git plugins in the AWS CDK project.

cd <<PROJECT_FOLDER>>
cdk init app --language typescript
npm install @semantic-release/npm -D
npm install @semantic-release/git -D

Define which branches to apply versioning to

We need to tell NPM which branches can trigger a new release. In the example we’ll use the main branch and the staging branches for release. We will add a new section to the package.json file along with the branches we want to use for releases.

"release": {
  "branches": ["main"]
}

Add supporting plugins to package.json

In order for semantic-release to pick up commits, generate release notes, and be able to perform a release with GitHub we need to add the commit-analyzer, release-notes-generator, changelog, NPM, Git, and GitHub plugins. Add the following plugins section to the package.json file after the “release” section we added in the previous step.

"plugins": [
    "@semantic-release/commit-analyzer",
    "@semantic-release/release-notes-generator",
    "@semantic-release/changelog",
    "@semantic-release/npm",
    [
        "@semantic-release/git",
        {
            "assets": [
                "package.json",
                "CHANGELOG.md"
            ],
            "message": "chore(release): ${nextRelease.version}[skip ci]\n\n${nextRelease.notes}"
        }
    ],
    "@semantic-release/github"
],

Putting it all together, our package.json file should look similar to the following.

{
    "name": "aws-cdk-semantic-release",
    "version": "0.1.0",
    "bin": {
        "aws-cdk-semantic-release": "bin/aws-cdk-semantic-release.js"
    },
    "scripts": {
        "build": "tsc",
        "watch": "tsc -w",
        "test": "jest",
        "cdk": "cdk"
    },
    "plugins": [
        "@semantic-release/commit-analyzer",
        "@semantic-release/release-notes-generator",
        "@semantic-release/changelog",
        "@semantic-release/npm",
        [
            "@semantic-release/git",
            {
                "assets": [
                    "package.json",
                    "CHANGELOG.md"
                ],
                "message": "chore(release): ${nextRelease.version} [skip ci]\n\n${nextRelease.notes}"
            }
        ],
        "@semantic-release/github"
    ],
    "release": {
        "branches": [
            "main"
        ]
    },
    "devDependencies": {
        "@semantic-release/changelog": "^6.0.3",
        "@semantic-release/git": "^10.0.1",
        "@semantic-release/npm": "^11.0.2",
        "@types/jest": "^29.5.12",
        "@types/node": "20.11.16",
        "aws-cdk": "2.127.0",
        "jest": "^29.7.0",
        "ts-jest": "^29.1.2",
        "ts-node": "^10.9.2",
        "typescript": "~5.3.3"
    },
    "dependencies": {
        "aws-cdk-lib": "2.127.0",
        "constructs": "^10.0.0",
        "source-map-support": "^0.5.21"
    }
}

With the necessary package.json changes in place, we can commit our code and build the project again.

git commit -m "feat(semver): added semantic release plugins and set main branch for versioning"
npm run build

Configure GitHub Actions

In the projects root folder, we are going to create folders for .github/workflows so that we can configure GitHub Actions release steps.

mkdir .github
cd .github
mkdir workflows
cd workflows

Create a file called release.yaml in the workflows folder that has the following.

name: Release
on:
  push:
    branches:
      - main
jobs:
  release:
    runs-on: ubuntu-latest
    steps:
      - name: Checkout Code
         uses: actions/checkout@v3
      - name: Setup Node.js
         uses: actions/setup-node@v3
         with:
           node-version: '20.8.1'
      - name: Install Dependencies
         run: npm install
      - name: Semantic Release
         env:
           GITHUB_TOKEN: ${{ secrets.GITHUB_TOKEN }}
           NPM_TOKEN: ${{ secrets.NPM_TOKEN }}
         run: npx semantic-release

The GITHUB_TOKEN is automatically generated and managed by GitHub Actions, so we don’t need to worry about retrieving or defining this value in our GitHub Actions steps. However, NPM_TOKEN is not automatically provided to us, so we need to define the NPM token. To do this we need to login to npmjs.com and create an account. Once we’re logged in, we need to create an access token. Once the NPM access token is created, then we need to add the token to GitHub secrets.

Verify Semantic-Release is setup correctly

Now that we have everything configured, new merges and commits to the main branch will kick off a CI/CD pipeline through GitHub Actions that builds the project and increments the version. To verify that everything is working correctly, we’ll alter the CDK code to include an AWS Lambda function. Afterward, we’ll commit changes to the main branch to verify that semantic-release is working correctly.

Make a change, commit, push and verify

In the AWS CDK project lib/aws-cdk-semantic-release-stack.ts file we’ll update the visibilityTimeout duration to 600, then commit the changes. We want to be sure to use the Semantic Versioning format for the commit message so that our changes are versioned correctly. For this we use the following commit message.

“fix(sqs-visibility): increased visibility timeout to 600”

After committing the changes, we push the changes to the remote GitHub repository to initiate the GitHub Actions build process. Once the build is complete, we see that the build number has been incremented from the previous version. You can review the releases for the sample code to see how it has been versioned. Following are examples of what it should look like before and after executing this. Please note that the version numbers depicted may not match yours.

GitHub releases view with information about release v1.1.0 including features and assets that were updated as part of v1.1.0

Screenshot of GitHub releases page showing release 1.0.0 and the associated features changelog

Figure 1 – Before the new commits

GitHub releases view with information about release v1.1.1 followed by the previous release v1.1.0.

Screenshot of GitHub releases page showing a previous release and the latest release along with their respective versions of 1.1.0 and 1.1.1

Figure 2 – After GitHub Actions generates a new build

Conclusion

Semantic Versioning offers a structured and reliable way to manage software changes. When paired with the significant benefits of using Node.js packages like semantic-release, version management can become effortless. All of this enables automated version management Node.js projects such as AWS CDK pipelines for automated code deployment. It enhances clarity, stability, and collaboration, while also supporting automation and fostering user confidence.

By adopting Semantic Versioning, development teams can achieve more predictable and efficient workflows, ultimately leading to higher quality software. It also builds confidence among users without going into much details with respect to software upgrades and backward compatibility. As a best practice, start incorporating Semantic Versioning for existing and future applications.

Contact an AWS Representative to know how we can help accelerate your business.

Reference

CDK setup and deployment of application with CDK V2 Construct:

Headshot of Brandon Kindred (CAA), a white man with short hair, a beard and wearing a black shirt

Brandon Kindred

Brandon is a Cloud Application Architect at AWS ProServe where he helps companies achieve their cloud goals through tailored strategies and cost-effective solutions. With a passion for teaching, he enjoys empowering others to harness the full potential of cloud technologies while optimizing their cloud spend. Brandon also enjoys providing guidance on development best practices, ensure teams build resilient and scalable applications in the cloud.

Sunita Dubey (Sr CAA)

Sunita Dubey

Sunita Dubey is a senior Cloud Application Architect based out of New Jersey. She focuses on designing, architecting and delivering end to end solutions for customers in financial domain. She has solved multiple customer challenges to move their workload to AWS and saved cost in the migration process. She insists on highest standard in all the deliverables.

Disrupting FlyingYeti’s campaign targeting Ukraine

Post Syndicated from Cloudforce One original https://blog.cloudflare.com/disrupting-flyingyeti-campaign-targeting-ukraine


Cloudforce One is publishing the results of our investigation and real-time effort to detect, deny, degrade, disrupt, and delay threat activity by the Russia-aligned threat actor FlyingYeti during their latest phishing campaign targeting Ukraine. At the onset of Russia’s invasion of Ukraine on February 24, 2022, Ukraine introduced a moratorium on evictions and termination of utility services for unpaid debt. The moratorium ended in January 2024, resulting in significant debt liability and increased financial stress for Ukrainian citizens. The FlyingYeti campaign capitalized on anxiety over the potential loss of access to housing and utilities by enticing targets to open malicious files via debt-themed lures. If opened, the files would result in infection with the PowerShell malware known as COOKBOX, allowing FlyingYeti to support follow-on objectives, such as installation of additional payloads and control over the victim’s system.

Since April 26, 2024, Cloudforce One has taken measures to prevent FlyingYeti from launching their phishing campaign – a campaign involving the use of Cloudflare Workers and GitHub, as well as exploitation of the WinRAR vulnerability CVE-2023-38831. Our countermeasures included internal actions, such as detections and code takedowns, as well as external collaboration with third parties to remove the actor’s cloud-hosted malware. Our effectiveness against this actor prolonged their operational timeline from days to weeks. For example, in a single instance, FlyingYeti spent almost eight hours debugging their code as a result of our mitigations. By employing proactive defense measures, we successfully stopped this determined threat actor from achieving their objectives.

Executive Summary

  • On April 18, 2024, Cloudforce One detected the Russia-aligned threat actor FlyingYeti preparing to launch a phishing espionage campaign targeting individuals in Ukraine.
  • We discovered the actor used similar tactics, techniques, and procedures (TTPs) as those detailed in Ukranian CERT’s article on UAC-0149, a threat group that has primarily targeted Ukrainian defense entities with COOKBOX malware since at least the fall of 2023.
  • From mid-April to mid-May, we observed FlyingYeti conduct reconnaissance activity, create lure content for use in their phishing campaign, and develop various iterations of their malware. We assessed that the threat actor intended to launch their campaign in early May, likely following Orthodox Easter.
  • After several weeks of monitoring actor reconnaissance and weaponization activity (Cyber Kill Chain Stages 1 and 2), we successfully disrupted FlyingYeti’s operation moments after the final COOKBOX payload was built.
  • The payload included an exploit for the WinRAR vulnerability CVE-2023-38831, which FlyingYeti will likely continue to use in their phishing campaigns to infect targets with malware.
  • We offer steps users can take to defend themselves against FlyingYeti phishing operations, and also provide recommendations, detections, and indicators of compromise.

Who is FlyingYeti?

FlyingYeti is the cryptonym given by Cloudforce One to the threat group behind this phishing campaign, which overlaps with UAC-0149 activity tracked by CERT-UA in February and April 2024. The threat actor uses dynamic DNS (DDNS) for their infrastructure and leverages cloud-based platforms for hosting malicious content and for malware command and control (C2). Our investigation of FlyingYeti TTPs suggests this is likely a Russia-aligned threat group. The actor appears to primarily focus on targeting Ukrainian military entities. Additionally, we observed Russian-language comments in FlyingYeti’s code, and the actor’s operational hours falling within the UTC+3 time zone.

Campaign background

In the days leading up to the start of the campaign, Cloudforce One observed FlyingYeti conducting reconnaissance on payment processes for Ukrainian communal housing and utility services:

  • April 22, 2024 – research into changes made in 2016 that introduced the use of QR codes in payment notices
  • April 22, 2024 – research on current developments concerning housing and utility debt in Ukraine
  • April 25, 2024 – research on the legal basis for restructuring housing debt in Ukraine as well as debt involving utilities, such as gas and electricity

Cloudforce One judges that the observed reconnaissance is likely due to the Ukrainian government’s payment moratorium introduced at the start of the full-fledged invasion in February 2022. Under this moratorium, outstanding debt would not lead to evictions or termination of provision of utility services. However, on January 9, 2024, the government lifted this ban, resulting in increased pressure on Ukrainian citizens with outstanding debt. FlyingYeti sought to capitalize on that pressure, leveraging debt restructuring and payment-related lures in an attempt to increase their chances of successfully targeting Ukrainian individuals.

Analysis of the Komunalka-themed phishing site

The disrupted phishing campaign would have directed FlyingYeti targets to an actor-controlled GitHub page at hxxps[:]//komunalka[.]github[.]io, which is a spoofed version of the Kyiv Komunalka communal housing site https://www.komunalka.ua. Komunalka functions as a payment processor for residents in the Kyiv region and allows for payment of utilities, such as gas, electricity, telephone, and Internet. Additionally, users can pay other fees and fines, and even donate to Ukraine’s defense forces.

Based on past FlyingYeti operations, targets may be directed to the actor’s Github page via a link in a phishing email or an encrypted Signal message. If a target accesses the spoofed Komunalka platform at hxxps[:]//komunalka[.]github[.]io, the page displays a large green button with a prompt to download the document “Рахунок.docx” (“Invoice.docx”), as shown in Figure 1. This button masquerades as a link to an overdue payment invoice but actually results in the download of the malicious archive “Заборгованість по ЖКП.rar” (“Debt for housing and utility services.rar”).

Figure 1: Prompt to download malicious archive “Заборгованість по ЖКП.rar”

A series of steps must take place for the download to successfully occur:

  • The target clicks the green button on the actor’s GitHub page hxxps[:]//komunalka.github[.]io
  • The target’s device sends an HTTP POST request to the Cloudflare Worker worker-polished-union-f396[.]vqu89698[.]workers[.]dev with the HTTP request body set to “user=Iahhdr”
  • The Cloudflare Worker processes the request and evaluates the HTTP request body
  • If the request conditions are met, the Worker fetches the RAR file from hxxps[:]//raw[.]githubusercontent[.]com/kudoc8989/project/main/Заборгованість по ЖКП.rar, which is then downloaded on the target’s device

Cloudforce One identified the infrastructure responsible for facilitating the download of the malicious RAR file and remediated the actor-associated Worker, preventing FlyingYeti from delivering its malicious tooling. In an effort to circumvent Cloudforce One’s mitigation measures, FlyingYeti later changed their malware delivery method. Instead of the Workers domain fetching the malicious RAR file, it was loaded directly from GitHub.

Analysis of the malicious RAR file

During remediation, Cloudforce One recovered the RAR file “Заборгованість по ЖКП.rar” and performed analysis of the malicious payload. The downloaded RAR archive contains multiple files, including a file with a name that contains the unicode character “U+201F”. This character appears as whitespace on Windows devices and can be used to “hide” file extensions by adding excessive whitespace between the filename and the file extension. As highlighted in blue in Figure 2, this cleverly named file within the RAR archive appears to be a PDF document but is actually a malicious CMD file (“Рахунок на оплату.pdf[unicode character U+201F].cmd”).

Figure 2: Files contained in the malicious RAR archive “Заборгованість по ЖКП.rar” (“Housing Debt.rar”)

FlyingYeti included a benign PDF in the archive with the same name as the CMD file but without the unicode character, “Рахунок на оплату.pdf” (“Invoice for payment.pdf”). Additionally, the directory name for the archive once decompressed also contained the name “Рахунок на оплату.pdf”. This overlap in names of the benign PDF and the directory allows the actor to exploit the WinRAR vulnerability CVE-2023-38831. More specifically, when an archive includes a benign file with the same name as the directory, the entire contents of the directory are opened by the WinRAR application, resulting in the execution of the malicious CMD. In other words, when the target believes they are opening the benign PDF “Рахунок на оплату.pdf”, the malicious CMD file is executed.

The CMD file contains the FlyingYeti PowerShell malware known as COOKBOX. The malware is designed to persist on a host, serving as a foothold in the infected device. Once installed, this variant of COOKBOX will make requests to the DDNS domain postdock[.]serveftp[.]com for C2, awaiting PowerShell cmdlets that the malware will subsequently run.

Alongside COOKBOX, several decoy documents are opened, which contain hidden tracking links using the Canary Tokens service. The first document, shown in Figure 3 below, poses as an agreement under which debt for housing and utility services will be restructured.

Figure 3: Decoy document Реструктуризація боргу за житлово комунальні послуги.docx

The second document (Figure 4) is a user agreement outlining the terms and conditions for the usage of the payment platform komunalka[.]ua.

Figure 4: Decoy document Угода користувача.docx (User Agreement.docx)

The use of relevant decoy documents as part of the phishing and delivery activity are likely an effort by FlyingYeti operators to increase the appearance of legitimacy of their activities.

The phishing theme we identified in this campaign is likely one of many themes leveraged by this actor in a larger operation to target Ukrainian entities, in particular their defense forces. In fact, the threat activity we detailed in this blog uses many of the same techniques outlined in a recent FlyingYeti campaign disclosed by CERT-UA in mid-April 2024, where the actor leveraged United Nations-themed lures involving Peace Support Operations to target Ukraine’s military. Due to Cloudforce One’s defensive actions covered in the next section, this latest FlyingYeti campaign was prevented as of the time of publication.

Mitigating FlyingYeti activity

Cloudforce One mitigated FlyingYeti’s campaign through a series of actions. Each action was taken to increase the actor’s cost of continuing their operations. When assessing which action to take and why, we carefully weighed the pros and cons in order to provide an effective active defense strategy against this actor. Our general goal was to increase the amount of time the threat actor spent trying to develop and weaponize their campaign.

We were able to successfully extend the timeline of the threat actor’s operations from hours to weeks. At each interdiction point, we assessed the impact of our mitigation to ensure the actor would spend more time attempting to launch their campaign. Our mitigation measures disrupted the actor’s activity, in one instance resulting in eight additional hours spent on debugging code.

Due to our proactive defense efforts, FlyingYeti operators adapted their tactics multiple times in their attempts to launch the campaign. The actor originally intended to have the Cloudflare Worker fetch the malicious RAR file from GitHub. After Cloudforce One interdiction of the Worker, the actor attempted to create additional Workers via a new account. In response, we disabled all Workers, leading the actor to load the RAR file directly from GitHub. Cloudforce One notified GitHub, resulting in the takedown of the RAR file, the GitHub project, and suspension of the account used to host the RAR file. In return, FlyingYeti began testing the option to host the RAR file on the file sharing sites pixeldrain and Filemail, where we observed the actor alternating the link on the Komunalka phishing site between the following:

  • hxxps://pixeldrain[.]com/api/file/ZAJxwFFX?download=one
  • hxxps://1014.filemail[.]com/api/file/get?filekey=e_8S1HEnM5Rzhy_jpN6nL-GF4UAP533VrXzgXjxH1GzbVQZvmpFzrFA&pk_vid=a3d82455433c8ad11715865826cf18f6

We notified GitHub of the actor’s evolving tactics, and in response GitHub removed the Komunalka phishing site. After analyzing the files hosted on pixeldrain and Filemail, we determined the actor uploaded dummy payloads, likely to monitor access to their phishing infrastructure (FileMail logs IP addresses, and both file hosting sites provide view and download counts). At the time of publication, we did not observe FlyingYeti upload the malicious RAR file to either file hosting site, nor did we identify the use of alternative phishing or malware delivery methods.

A timeline of FlyingYeti’s activity and our corresponding mitigations can be found below.

Event timeline

Date Event Description
2024-04-18 12:18 Threat Actor (TA) creates a Worker to handle requests from a phishing site
2024-04-18 14:16 TA creates phishing site komunalka[.]github[.]io on GitHub
2024-04-25 12:25 TA creates a GitHub repo to host a RAR file
2024-04-26 07:46 TA updates the first Worker to handle requests from users visiting komunalka[.]github[.]io
2024-04-26 08:24 TA uploads a benign test RAR to the GitHub repo
2024-04-26 13:38 Cloudforce One identifies a Worker receiving requests from users visiting komunalka[.]github[.]io, observes its use as a phishing page
2024-04-26 13:46 Cloudforce One identifies that the Worker fetches a RAR file from GitHub (the malicious RAR payload is not yet hosted on the site)
2024-04-26 19:22 Cloudforce One creates a detection to identify the Worker that fetches the RAR
2024-04-26 21:13 Cloudforce One deploys real-time monitoring of the RAR file on GitHub
2024-05-02 06:35 TA deploys a weaponized RAR (CVE-2023-38831) to GitHub with their COOKBOX malware packaged in the archive
2024-05-06 10:03 TA attempts to update the Worker with link to weaponized RAR, the Worker is immediately blocked
2024-05-06 10:38 TA creates a new Worker, the Worker is immediately blocked
2024-05-06 11:04 TA creates a new account (#2) on Cloudflare
2024-05-06 11:06 TA creates a new Worker on account #2 (blocked)
2024-05-06 11:50 TA creates a new Worker on account #2 (blocked)
2024-05-06 12:22 TA creates a new modified Worker on account #2
2024-05-06 16:05 Cloudforce One disables the running Worker on account #2
2024-05-07 22:16 TA notices the Worker is blocked, ceases all operations
2024-05-07 22:18 TA deletes original Worker first created to fetch the RAR file from the GitHub phishing page
2024-05-09 19:28 Cloudforce One adds phishing page komunalka[.]github[.]io to real-time monitoring
2024-05-13 07:36 TA updates the github.io phishing site to point directly to the GitHub RAR link
2024-05-13 17:47 Cloudforce One adds COOKBOX C2 postdock[.]serveftp[.]com to real-time monitoring for DNS resolution
2024-05-14 00:04 Cloudforce One notifies GitHub to take down the RAR file
2024-05-15 09:00 GitHub user, project, and link for RAR are no longer accessible
2024-05-21 08:23 TA updates Komunalka phishing site on github.io to link to pixeldrain URL for dummy payload (pixeldrain only tracks view and download counts)
2024-05-21 08:25 TA updates Komunalka phishing site to link to FileMail URL for dummy payload (FileMail tracks not only view and download counts, but also IP addresses)
2024-05-21 12:21 Cloudforce One downloads PixelDrain document to evaluate payload
2024-05-21 12:47 Cloudforce One downloads FileMail document to evaluate payload
2024-05-29 23:59 GitHub takes down Komunalka phishing site
2024-05-30 13:00 Cloudforce One publishes the results of this investigation

Coordinating our FlyingYeti response

Cloudforce One leveraged industry relationships to provide advanced warning and to mitigate the actor’s activity. To further protect the intended targets from this phishing threat, Cloudforce One notified and collaborated closely with GitHub’s Threat Intelligence and Trust and Safety Teams. We also notified CERT-UA and Cloudflare industry partners such as CrowdStrike, Mandiant/Google Threat Intelligence, and Microsoft Threat Intelligence.

Hunting FlyingYeti operations

There are several ways to hunt FlyingYeti in your environment. These include using PowerShell to hunt for WinRAR files, deploying Microsoft Sentinel analytics rules, and running Splunk scripts as detailed below. Note that these detections may identify activity related to this threat, but may also trigger unrelated threat activity.

PowerShell hunting

Consider running a PowerShell script such as this one in your environment to identify exploitation of CVE-2023-38831. This script will interrogate WinRAR files for evidence of the exploit.

CVE-2023-38831
Description:winrar exploit detection 
open suspios (.tar / .zip / .rar) and run this script to check it 

function winrar-exploit-detect(){
$targetExtensions = @(".cmd" , ".ps1" , ".bat")
$tempDir = [System.Environment]::GetEnvironmentVariable("TEMP")
$dirsToCheck = Get-ChildItem -Path $tempDir -Directory -Filter "Rar*"
foreach ($dir in $dirsToCheck) {
    $files = Get-ChildItem -Path $dir.FullName -File
    foreach ($file in $files) {
        $fileName = $file.Name
        $fileExtension = [System.IO.Path]::GetExtension($fileName)
        if ($targetExtensions -contains $fileExtension) {
            $fileWithoutExtension = [System.IO.Path]::GetFileNameWithoutExtension($fileName); $filename.TrimEnd() -replace '\.$'
            $cmdFileName = "$fileWithoutExtension"
            $secondFile = Join-Path -Path $dir.FullName -ChildPath $cmdFileName
            
            if (Test-Path $secondFile -PathType Leaf) {
                Write-Host "[!] Suspicious pair detected "
                Write-Host "[*]  Original File:$($secondFile)" -ForegroundColor Green 
                Write-Host "[*] Suspicious File:$($file.FullName)" -ForegroundColor Red

                # Read and display the content of the command file
                $cmdFileContent = Get-Content -Path $($file.FullName)
                Write-Host "[+] Command File Content:$cmdFileContent"
            }
        }
    }
}
}
winrar-exploit-detect

Microsoft Sentinel

In Microsoft Sentinel, consider deploying the rule provided below, which identifies WinRAR execution via cmd.exe. Results generated by this rule may be indicative of attack activity on the endpoint and should be analyzed.

DeviceProcessEvents
| where InitiatingProcessParentFileName has @"winrar.exe"
| where InitiatingProcessFileName has @"cmd.exe"
| project Timestamp, DeviceName, FileName, FolderPath, ProcessCommandLine, AccountName
| sort by Timestamp desc

Splunk

Consider using this script in your Splunk environment to look for WinRAR CVE-2023-38831 execution on your Microsoft endpoints. Results generated by this script may be indicative of attack activity on the endpoint and should be analyzed.

| tstats `security_content_summariesonly` count min(_time) as firstTime max(_time) as lastTime from datamodel=Endpoint.Processes where Processes.parent_process_name=winrar.exe `windows_shells` OR Processes.process_name IN ("certutil.exe","mshta.exe","bitsadmin.exe") by Processes.dest Processes.user Processes.parent_process_name Processes.parent_process Processes.process_name Processes.process Processes.process_id Processes.parent_process_id 
| `drop_dm_object_name(Processes)` 
| `security_content_ctime(firstTime)` 
| `security_content_ctime(lastTime)` 
| `winrar_spawning_shell_application_filter`

Cloudflare product detections

Cloudflare Email Security

Cloudflare Email Security (CES) customers can identify FlyingYeti threat activity with the following detections.

  • CVE-2023-38831
  • FLYINGYETI.COOKBOX
  • FLYINGYETI.COOKBOX.Launcher
  • FLYINGYETI.Rar

Recommendations

Cloudflare recommends taking the following steps to mitigate this type of activity:

  • Implement Zero Trust architecture foundations:    
  • Deploy Cloud Email Security to ensure that email services are protected against phishing, BEC and other threats
  • Leverage browser isolation to separate messaging applications like LinkedIn, email, and Signal from your main network
  • Scan, monitor and/or enforce controls on specific or sensitive data moving through your network environment with data loss prevention policies
  • Ensure your systems have the latest WinRAR and Microsoft security updates installed
  • Consider preventing WinRAR files from entering your environment, both at your Cloud Email Security solution and your Internet Traffic Gateway
  • Run an Endpoint Detection and Response (EDR) tool such as CrowdStrike or Microsoft Defender for Endpoint to get visibility into binary execution on hosts
  • Search your environment for the FlyingYeti indicators of compromise (IOCs) shown below to identify potential actor activity within your network.

If you’re looking to uncover additional Threat Intelligence insights for your organization or need bespoke Threat Intelligence information for an incident, consider engaging with Cloudforce One by contacting your Customer Success manager or filling out this form.

Indicators of Compromise

Filename SHA256 Hash Description
Заборгованість по ЖКП.rar a0a294f85c8a19be048ffcc05ede6fd5a7ac5e2f0032a3ca0050dc1ae960c314 RAR archive
Рахунок на оплату.pdf
                                                                                 .cmd
0cca8f795c7a81d33d36d5204fcd9bc73bdc2af7de315c1449cbc3551ef4fb59 COOKBOX Sample (contained in RAR archive)
Реструктуризація боргу за житлово комунальні послуги.docx 915721b94e3dffa6cef3664532b586be6cf989fec923b26c62fdaf201ee81d2c Benign Word Document with Tracking Link (contained in RAR archive)
Угода користувача.docx 79a9740f5e5ea4aa2157d9d96df34ee49a32e2d386fe55fedfd1aa33e151c06d Benign Word Document with Tracking Link (contained in RAR archive)
Рахунок на оплату.pdf 19e25456c2996ded3e29577b609de54a2bef90dad8f868cdad795c18df05a79b Random Binary Data (contained in RAR archive)
Заборгованість по ЖКП станом на 26.04.24.docx e0d65e2d36afd3db1b603f10e0488cee3f58ade24d8abc6bee240314d8696708 Random Binary Data (contained in RAR archive)
Domain / URL Description
komunalka[.]github[.]io Phishing page
hxxps[:]//github[.]com/komunalka/komunalka[.]github[.]io Phishing page
hxxps[:]//worker-polished-union-f396[.]vqu89698[.]workers[.]dev Worker that fetches malicious RAR file
hxxps[:]//raw[.]githubusercontent[.]com/kudoc8989/project/main/Заборгованість по ЖКП.rar Delivery of malicious RAR file
hxxps[:]//1014[.]filemail[.]com/api/file/get?filekey=e_8S1HEnM5Rzhy_jpN6nL-GF4UAP533VrXzgXjxH1GzbVQZvmpFzrFA&pk_vid=a3d82455433c8ad11715865826cf18f6 Dummy payload
hxxps[:]//pixeldrain[.]com/api/file/ZAJxwFFX?download= Dummy payload
hxxp[:]//canarytokens[.]com/stuff/tags/ni1cknk2yq3xfcw2al3efs37m/payments.js Tracking link
hxxp[:]//canarytokens[.]com/stuff/terms/images/k22r2dnjrvjsme8680ojf5ccs/index.html Tracking link
postdock[.]serveftp[.]com COOKBOX C2

Integrating with GitHub Actions – Amazon CodeGuru in your DevSecOps Pipeline

Post Syndicated from Mahesh Biradar original https://aws.amazon.com/blogs/devops/integrating-with-github-actions-amazon-codeguru-in-your-devsecops-pipeline/

Many organizations have adopted DevOps practices to streamline and automate software delivery and IT operations. A DevOps model can be adopted without sacrificing security by using automated compliance policies, fine-grained controls, and configuration management techniques. However, one of the key challenges customers face is analyzing code and detecting any vulnerabilities in the code pipeline due to a lack of access to the right tool. Amazon CodeGuru addresses this challenge by using machine learning and automated reasoning to identify critical issues and hard-to-find bugs during application development and deployment, thus improving code quality.

We discussed how you can build a CI/CD pipeline to deploy a web application in our previous post “Integrating with GitHub Actions – CI/CD pipeline to deploy a Web App to Amazon EC2”. In this post, we will use that pipeline to include security checks and integrate it with Amazon CodeGuru Reviewer to analyze and detect potential security vulnerabilities in the code before deploying it.

Amazon CodeGuru Reviewer helps you improve code security and provides recommendations based on common vulnerabilities (OWASP Top 10) and AWS security best practices. CodeGuru analyzes Java and Python code and provides recommendations for remediation. CodeGuru Reviewer detects a deviation from best practices when using AWS APIs and SDKs, and also identifies concurrency issues, resource leaks, security vulnerabilities and validates input parameters. For every workflow run, CodeGuru Reviewer’s GitHub Action copies your code and build artifacts into an S3 bucket and calls CodeGuru Reviewer APIs to analyze the artifacts and provide recommendations. Refer to the code detector library here for more information about CodeGuru Reviewer’s security and code quality detectors.

With GitHub Actions, developers can easily integrate CodeGuru Reviewer into their CI workflows, conducting code quality and security analysis. They can view CodeGuru Reviewer recommendations directly within the GitHub user interface to quickly identify and fix code issues and security vulnerabilities. Any pull request or push to the master branch will trigger a scan of the changed lines of code, and scheduled pipeline runs will trigger a full scan of the entire repository, ensuring comprehensive analysis and continuous improvement.

Solution overview

The solution comprises of the following components:

  1. GitHub Actions – Workflow Orchestration tool that will host the Pipeline.
  2. AWS CodeDeploy – AWS service to manage deployment on Amazon EC2 Autoscaling Group.
  3. AWS Auto Scaling – AWS service to help maintain application availability and elasticity by automatically adding or removing Amazon EC2 instances.
  4. Amazon EC2 – Destination Compute server for the application deployment.
  5. Amazon CodeGuru – AWS Service to detect security vulnerabilities and automate code reviews.
  6. AWS CloudFormation – AWS infrastructure as code (IaC) service used to orchestrate the infrastructure creation on AWS.
  7. AWS Identity and Access Management (IAM) OIDC identity provider – Federated authentication service to establish trust between GitHub and AWS to allow GitHub Actions to deploy on AWS without maintaining AWS Secrets and credentials.
  8. Amazon Simple Storage Service (Amazon S3) – Amazon S3 to store deployment and code scan artifacts.

The following diagram illustrates the architecture:

Figure 1. Architecture Diagram of the proposed solution in the blog.

Figure 1. Architecture Diagram of the proposed solution in the blog

  1. Developer commits code changes from their local repository to the GitHub repository. In this post, the GitHub action is triggered manually, but this can be automated.
  2. GitHub action triggers the build stage.
  3. GitHub’s Open ID Connector (OIDC) uses the tokens to authenticate to AWS and access resources.
  4. GitHub action uploads the deployment artifacts to Amazon S3.
  5. GitHub action invokes Amazon CodeGuru.
  6. The source code gets uploaded into an S3 bucket when the CodeGuru scan starts.
  7. GitHub action invokes CodeDeploy.
  8. CodeDeploy triggers the deployment to Amazon EC2 instances in an Autoscaling group.
  9. CodeDeploy downloads the artifacts from Amazon S3 and deploys to Amazon EC2 instances.

Prerequisites

This blog post is a continuation of our previous post – Integrating with GitHub Actions – CI/CD pipeline to deploy a Web App to Amazon EC2. You will need to setup your pipeline by following instructions in that blog.

After completing the steps, you should have a local repository with the below directory structure, and one completed Actions run.

Figure 2. Directory structure

Figure 2. Directory structure

To enable automated deployment upon git push, you will need to make a change to your .github/workflow/deploy.yml file. Specifically, you can activate the automation by modifying the following line of code in the deploy.yml file:

From:

workflow_dispatch: {}

To:

  #workflow_dispatch: {}
  push:
    branches: [ main ]
  pull_request:

Solution walkthrough

The following steps provide a high-level overview of the walkthrough:

  1. Create an S3 bucket for the Amazon CodeGuru Reviewer.
  2. Update the IAM role to include permissions for Amazon CodeGuru.
  3. Associate the repository in Amazon CodeGuru.
  4. Add Vulnerable code.
  5. Update GitHub Actions Job to run the Amazon CodeGuru Scan.
  6. Push the code to the repository.
  7. Verify the pipeline.
  8. Check the Amazon CodeGuru recommendations in the GitHub user interface.

1. Create an S3 bucket for the Amazon CodeGuru Reviewer

    • When you run a CodeGuru scan, your code is first uploaded to an S3 bucket in your AWS account.

Note that CodeGuru Reviewer expects the S3 bucket name to begin with codeguru-reviewer-.

    • You can create this bucket using the bucket policy outlined in this CloudFormation template (JSON or YAML) or by following these instructions.

2.  Update the IAM role to add permissions for Amazon CodeGuru

  • Locate the role created in the pre-requisite section, named “CodeDeployRoleforGitHub”.
  • Next, create an inline policy by following these steps. Give it a name, such as “codegurupolicy” and add the following permissions to the policy.
{
    “Version”: “2012-10-17",
    “Statement”: [
        {
            “Action”: [
                “codeguru-reviewer:ListRepositoryAssociations”,
                “codeguru-reviewer:AssociateRepository”,
                “codeguru-reviewer:DescribeRepositoryAssociation”,
                “codeguru-reviewer:CreateCodeReview”,
                “codeguru-reviewer:DescribeCodeReview”,
                “codeguru-reviewer:ListRecommendations”,
                “iam:CreateServiceLinkedRole”
            ],
            “Resource”: “*”,
            “Effect”: “Allow”
        },
        {
            “Action”: [
                “s3:CreateBucket”,
                “s3:GetBucket*“,
                “s3:List*“,
                “s3:GetObject”,
                “s3:PutObject”,
                “s3:DeleteObject”
            ],
            “Resource”: [
                “arn:aws:s3:::codeguru-reviewer-*“,
                “arn:aws:s3:::codeguru-reviewer-*/*”
            ],
            “Effect”: “Allow”
        }
    ]
}

3.  Associate the repository in Amazon CodeGuru

Figure 3. associate the repository

Figure 3. Associate the repository

At this point, you will have completed your initial full analysis run. However, since this is a simple “helloWorld” program, you may not receive any recommendations. In the following steps, you will incorporate vulnerable code and trigger the analysis again, allowing CodeGuru to identify and provide recommendations for potential issues.

4.  Add Vulnerable code

  • Create a file application.conf
    at /aws-codedeploy-github-actions-deployment/spring-boot-hello-world-example
  • Add the following content in application.conf file.
db.default.url="postgres://test-ojxarsxivjuyjc:ubKveYbvNjQ5a0CU8vK4YoVIhl@ec2-54-225-223-40.compute-1.amazonaws.com:5432/dcectn1pto16vi?ssl=true&sslfactory=org.postgresql.ssl.NonValidatingFactory"

db.default.url=${?DATABASE_URL}

db.default.port="3000"

db.default.datasource.username="root"

db.default.datasource.password="testsk_live_454kjkj4545FD3434Srere7878"

db.default.jpa.generate-ddl="true"

db.default.jpa.hibernate.ddl-auto="create"

5. Update GitHub Actions Job to run Amazon CodeGuru Scan

  • You will need to add a new job definition in the GitHub Actions’ yaml file. This new section should be inserted between the Build and Deploy sections for optimal workflow.
  • Additionally, you will need to adjust the dependency in the deploy section to reflect the new flow: Build -> CodeScan -> Deploy.
  • Review sample GitHub actions code for running security scan on Amazon CodeGuru Reviewer.
codescan:
    needs: build
    runs-on: ubuntu-latest
    permissions:
      id-token: write
      contents: read
      security-events: write

    steps:
    
    - name: Download an artifact
      uses: actions/download-artifact@v2
      with:
          name: build-file 
    
    - name: Configure AWS credentials
      id: iam-role
      continue-on-error: true
      uses: aws-actions/configure-aws-credentials@v1
      with:
          role-to-assume: ${{ secrets.IAMROLE_GITHUB }}
          role-session-name: GitHub-Action-Role
          aws-region: ${{ env.AWS_REGION }}
    
    - uses: actions/checkout@v2
      if: steps.iam-role.outcome == 'success'
      with:
        fetch-depth: 0 

    - name: CodeGuru Reviewer
      uses: aws-actions/[email protected]
      if: ${{ always() }} 
      continue-on-error: false
      with:          
        s3_bucket: ${{ env.S3bucket_CodeGuru }} 
        build_path: .

    - name: Store SARIF file
      if: steps.iam-role.outcome == 'success'
      uses: actions/upload-artifact@v2
      with:
        name: SARIF_recommendations
        path: ./codeguru-results.sarif.json

    - name: Upload review result
      uses: github/codeql-action/upload-sarif@v2
      with:
        sarif_file: codeguru-results.sarif.json
    

    - run: |
          
          echo "Check for critical volnurability"
          count=$(cat codeguru-results.sarif.json | jq '.runs[].results[] | select(.level == "error") | .level' | wc -l)
          if (( $count > 0 )); then
            echo "There are $count critical findings, hence stopping the pipeline."
            exit 1
          fi
  • Refer to the complete file provided below for your reference. It is important to note that you will need to replace the following environment variables with your specific values.
    • S3bucket_CodeGuru
    • AWS_REGION
    • S3BUCKET
name: Build and Deploy

on:
    #workflow_dispatch: {}
  push:
    branches: [ main ]
  pull_request:

env:
  applicationfolder: spring-boot-hello-world-example
  AWS_REGION: us-east-1 # <replace this with your AWS region>
  S3BUCKET: *<Replace your bucket name here>*
  S3bucket_CodeGuru: codeguru-reviewer-<*replacebucketnameher*> # S3 Bucket with "codeguru-reviewer-*" prefix


jobs:
  build:
    name: Build and Package
    runs-on: ubuntu-latest
    permissions:
      id-token: write
      contents: read
    steps:
      - uses: actions/checkout@v2
        name: Checkout Repository

      - uses: aws-actions/configure-aws-credentials@v1
        with:
          role-to-assume: ${{ secrets.IAMROLE_GITHUB }}
          role-session-name: GitHub-Action-Role
          aws-region: ${{ env.AWS_REGION }}

      - name: Set up JDK 1.8
        uses: actions/setup-java@v1
        with:
          java-version: 1.8

      - name: chmod
        run: chmod -R +x ./.github

      - name: Build and Package Maven
        id: package
        working-directory: ${{ env.applicationfolder }}
        run: $GITHUB_WORKSPACE/.github/scripts/build.sh

      - name: Upload Artifact to s3
        working-directory: ${{ env.applicationfolder }}/target
        run: aws s3 cp *.war s3://${{ env.S3BUCKET }}/
      
      - name: Artifacts for codescan action
        uses: actions/upload-artifact@v2
        with:
          name: build-file
          path: ${{ env.applicationfolder }}/target/*.war           

  codescan:
    needs: build
    runs-on: ubuntu-latest
    permissions:
      id-token: write
      contents: read
      security-events: write

    steps:
    
    - name: Download an artifact
      uses: actions/download-artifact@v2
      with:
          name: build-file 
    
    - name: Configure AWS credentials
      id: iam-role
      continue-on-error: true
      uses: aws-actions/configure-aws-credentials@v1
      with:
          role-to-assume: ${{ secrets.IAMROLE_GITHUB }}
          role-session-name: GitHub-Action-Role
          aws-region: ${{ env.AWS_REGION }}
    
    - uses: actions/checkout@v2
      if: steps.iam-role.outcome == 'success'
      with:
        fetch-depth: 0 

    - name: CodeGuru Reviewer
      uses: aws-actions/[email protected]
      if: ${{ always() }} 
      continue-on-error: false
      with:          
        s3_bucket: ${{ env.S3bucket_CodeGuru }} 
        build_path: .

    - name: Store SARIF file
      if: steps.iam-role.outcome == 'success'
      uses: actions/upload-artifact@v2
      with:
        name: SARIF_recommendations
        path: ./codeguru-results.sarif.json

    - name: Upload review result
      uses: github/codeql-action/upload-sarif@v2
      with:
        sarif_file: codeguru-results.sarif.json
    

    - run: |
          
          echo "Check for critical volnurability"
          count=$(cat codeguru-results.sarif.json | jq '.runs[].results[] | select(.level == "error") | .level' | wc -l)
          if (( $count > 0 )); then
            echo "There are $count critical findings, hence stopping the pipeline."
            exit 1
          fi
  deploy:
    needs: codescan
    runs-on: ubuntu-latest
    environment: Dev
    permissions:
      id-token: write
      contents: read
    steps:
    - uses: actions/checkout@v2
    - uses: aws-actions/configure-aws-credentials@v1
      with:
        role-to-assume: ${{ secrets.IAMROLE_GITHUB }}
        role-session-name: GitHub-Action-Role
        aws-region: ${{ env.AWS_REGION }}
    - run: |
        echo "Deploying branch ${{ env.GITHUB_REF }} to ${{ github.event.inputs.environment }}"
        commit_hash=`git rev-parse HEAD`
        aws deploy create-deployment --application-name CodeDeployAppNameWithASG --deployment-group-name CodeDeployGroupName --github-location repository=$GITHUB_REPOSITORY,commitId=$commit_hash --ignore-application-stop-failures

6.  Push the code to the repository:

  • Remember to save all the files that you have modified.
  • To ensure that you are in your git repository folder, you can run the command:
git remote -v
  • The command should return the remote branch address, which should be similar to the following:
username@3c22fb075f8a GitActionsDeploytoAWS % git remote -v
 origin	[email protected]:<username>/GitActionsDeploytoAWS.git (fetch)
 origin	[email protected]:<username>/GitActionsDeploytoAWS.git (push)
  • To push your code to the remote branch, run the following commands:

git add . 
git commit -m “Adding Security Scan” 
git push

Your code has been pushed to the repository and will trigger the workflow as per the configuration in GitHub Actions.

7.  Verify the pipeline

  • Your pipeline is set up to fail upon the detection of a critical vulnerability. You can also suppress recommendations from CodeGuru Reviewer if you think it is not relevant for setup. In this example, as there are two critical vulnerabilities, the pipeline will not proceed to the next step.
  • To view the status of the pipeline, navigate to the Actions tab on your GitHub console. You can refer to the following image for guidance.
Figure 4. github actions pipeline

Figure 4. GitHub Actions pipeline

  • To view the details of the error, you can expand the “codescan” job in the GitHub Actions console. This will provide you with more information about the specific vulnerabilities that caused the pipeline to fail and help you to address them accordingly.
Figure 5. Codescan actions logs

Figure 5. Codescan actions logs

8. Check the Amazon CodeGuru recommendations in the GitHub user interface

Once you have run the CodeGuru Reviewer Action, any security findings and recommendations will be displayed on the Security tab within the GitHub user interface. This will provide you with a clear and convenient way to view and address any issues that were identified during the analysis.

Figure 6. security tab with results

Figure 6. Security tab with results

Clean up

To avoid incurring future charges, you should clean up the resources that you created.

  1. Empty the Amazon S3 bucket.
  2. Delete the CloudFormation stack (CodeDeployStack) from the AWS console.
  3. Delete codeguru Amazon S3 bucket.
  4. Disassociate the GitHub repository in CodeGuru Reviewer.
  5. Delete the GitHub Secret (‘IAMROLE_GITHUB’)
    1. Go to the repository settings on GitHub Page.
    2. Select Secrets under Actions.
    3. Select IAMROLE_GITHUB, and delete it.

Conclusion

Amazon CodeGuru is a valuable tool for software development teams looking to improve the quality and efficiency of their code. With its advanced AI capabilities, CodeGuru automates the manual parts of code review and helps identify performance, cost, security, and maintainability issues. CodeGuru also integrates with popular development tools and provides customizable recommendations, making it easy to use within existing workflows. By using Amazon CodeGuru, teams can improve code quality, increase development speed, lower costs, and enhance security, ultimately leading to better software and a more successful overall development process.

In this post, we explained how to integrate Amazon CodeGuru Reviewer into your code build pipeline using GitHub actions. This integration serves as a quality gate by performing code analysis and identifying challenges in your code. Now you can access the CodeGuru Reviewer recommendations directly within the GitHub user interface for guidance on resolving identified issues.

About the author:

Mahesh Biradar

Mahesh Biradar is a Solutions Architect at AWS. He is a DevOps enthusiast and enjoys helping customers implement cost-effective architectures that scale.

Suresh Moolya

Suresh Moolya is a Senior Cloud Application Architect with Amazon Web Services. He works with customers to architect, design, and automate business software at scale on AWS cloud.

Shikhar Mishra

Shikhar is a Solutions Architect at Amazon Web Services. He is a cloud security enthusiast and enjoys helping customers design secure, reliable, and cost-effective solutions on AWS.

How to query and visualize Macie sensitive data discovery results with Athena and QuickSight

Post Syndicated from Keith Rozario original https://aws.amazon.com/blogs/security/how-to-query-and-visualize-macie-sensitive-data-discovery-results-with-athena-and-quicksight/

Amazon Macie is a fully managed data security service that uses machine learning and pattern matching to help you discover and protect sensitive data in Amazon Simple Storage Service (Amazon S3). With Macie, you can analyze objects in your S3 buckets to detect occurrences of sensitive data, such as personally identifiable information (PII), financial information, personal health information, and access credentials.

In this post, we walk you through a solution to gain comprehensive and organization-wide visibility into which types of sensitive data are present in your S3 storage, where the data is located, and how much is present. Once enabled, Macie automatically starts discovering sensitive data in your S3 storage and builds a sensitive data profile for each bucket. The profiles are organized in a visual, interactive data map, and you can use the data map to run targeted sensitive data discovery jobs. Both automated data discovery and targeted jobs produce rich, detailed sensitive data discovery results. This solution uses Amazon Athena and Amazon QuickSight to deep-dive on the Macie results, and to help you analyze, visualize, and report on sensitive data discovered by Macie, even when the data is distributed across millions of objects, thousands of S3 buckets, and thousands of AWS accounts. Athena is an interactive query service that makes it simpler to analyze data directly in Amazon S3 using standard SQL. QuickSight is a cloud-scale business intelligence tool that connects to multiple data sources, including Athena databases and tables.

This solution is relevant to data security, data governance, and security operations engineering teams.

The challenge: how to summarize sensitive data discovered in your growing S3 storage

Macie issues findings when an object is found to contain sensitive data. In addition to findings, Macie keeps a record of each S3 object analyzed in a bucket of your choice for long-term storage. These records are known as sensitive data discovery results, and they include additional context about your data in Amazon S3. Due to the large size of the results file, Macie exports the sensitive data discovery results to an S3 bucket, so you need to take additional steps to query and visualize the results. We discuss the differences between findings and results in more detail later in this post.

With the increasing number of data privacy guidelines and compliance mandates, customers need to scale their monitoring to encompass thousands of S3 buckets across their organization. The growing volume of data to assess, and the growing list of findings from discovery jobs, can make it difficult to review and remediate issues in a timely manner. In addition to viewing individual findings for specific objects, customers need a way to comprehensively view, summarize, and monitor sensitive data discovered across their S3 buckets.

To illustrate this point, we ran a Macie sensitive data discovery job on a dataset created by AWS. The dataset contains about 7,500 files that have sensitive information, and Macie generated a finding for each sensitive file analyzed, as shown in Figure 1.

Figure 1: Macie findings from the dataset

Figure 1: Macie findings from the dataset

Your security team could spend days, if not months, analyzing these individual findings manually. Instead, we outline how you can use Athena and QuickSight to query and visualize the Macie sensitive data discovery results to understand your data security posture.

The additional information in the sensitive data discovery results will help you gain comprehensive visibility into your data security posture. With this visibility, you can answer questions such as the following:

  • What are the top 5 most commonly occurring sensitive data types?
  • Which AWS accounts have the most findings?
  • How many S3 buckets are affected by each of the sensitive data types?

Your security team can write their own customized queries to answer questions such as the following:

  • Is there sensitive data in AWS accounts that are used for development purposes?
  • Is sensitive data present in S3 buckets that previously did not contain sensitive information?
  • Was there a change in configuration for S3 buckets containing the greatest amount of sensitive data?

How are findings different from results?

As a Macie job progresses, it produces two key types of output: sensitive data findings (or findings for short), and sensitive data discovery results (or results).

Findings provide a report of potential policy violations with an S3 bucket, or the presence of sensitive data in a specific S3 object. Each finding provides a severity rating, information about the affected resource, and additional details, such as when Macie found the issue. Findings are published to the Macie console, AWS Security Hub, and Amazon EventBridge.

In contrast, results are a collection of records for each S3 object that a Macie job analyzed. These records contain information about objects that do and do not contain sensitive data, including up to 1,000 occurrences of each sensitive data type that Macie found in a given object, and whether Macie was unable to analyze an object because of issues such as permissions settings or use of an unsupported format. If an object contains sensitive data, the results record includes detailed information that isn’t available in the finding for the object.

One of the key benefits of querying results is to uncover gaps in your data protection initiatives—these gaps can occur when data in certain buckets can’t be analyzed because Macie was denied access to those buckets, or was unable to decrypt specific objects. The following table maps some of the key differences between findings and results.

Findings Results
Enabled by default Yes No
Location of published results Macie console, Security Hub, and EventBridge S3 bucket
Details of S3 objects that couldn’t be scanned No Yes
Details of S3 objects in which no sensitive data was found No Yes
Identification of files inside compressed archives that contain sensitive data No Yes
Number of occurrences reported per object Up to 15 Up to 1,000
Retention period 90 days in Macie console Defined by customer

Architecture

As shown in Figure 2, you can build out the solution in three steps:

  1. Enable the results and publish them to an S3 bucket
  2. Build out the Athena table to query the results by using SQL
  3. Visualize the results with QuickSight
Figure 2: Architecture diagram showing the flow of the solution

Figure 2: Architecture diagram showing the flow of the solution

Prerequisites

To implement the solution in this blog post, you must first complete the following prerequisites:

Figure 3: Sample data loaded into three different AWS accounts

Figure 3: Sample data loaded into three different AWS accounts

Note: All data in this blog post has been artificially created by AWS for demonstration purposes and has not been collected from any individual person. Similarly, such data does not, nor is it intended, to relate back to any individual person.

Step 1: Enable the results and publish them to an S3 bucket

Publication of the discovery results to Amazon S3 is not enabled by default. The setup requires that you specify an S3 bucket to store the results (we also refer to this as the discovery results bucket), and use an AWS Key Management Service (AWS KMS) key to encrypt the bucket.

If you are analyzing data across multiple accounts in your organization, then you need to enable the results in your delegated Macie administrator account. You do not need to enable results in individual member accounts. However, if you’re running Macie jobs in a standalone account, then you should enable the Macie results directly in that account.

To enable the results

  1. Open the Macie console.
  2. Select the AWS Region from the upper right of the page.
  3. From the left navigation pane, select Discovery results.
  4. Select Configure now.
  5. Select Create Bucket, and enter a unique bucket name. This will be the discovery results bucket name. Make note of this name because you will use it when you configure the Athena tables later in this post.
  6. Under Encryption settings, select Create new key. This takes you to the AWS KMS console in a new browser tab.
  7. In the AWS KMS console, do the following:
    1. For Key type, choose symmetric, and for Key usage, choose Encrypt and Decrypt.
    2. Enter a meaningful key alias (for example, macie-results-key) and description.
    3. (Optional) For simplicity, set your current user or role as the Key Administrator.
    4. Set your current user/role as a user of this key in the key usage permissions step. This will give you the right permissions to run the Athena queries later.
    5. Review the settings and choose Finish.
  8. Navigate to the browser tab with the Macie console.
  9. From the AWS KMS Key dropdown, select the new key.
  10. To view KMS key policy statements that were automatically generated for your specific key, account, and Region, select View Policy. Copy these statements in their entirety to your clipboard.
  11. Navigate back to the browser tab with the AWS KMS console and then do the following:
    1. Select Customer managed keys.
    2. Choose the KMS key that you created, choose Switch to policy view, and under Key policy, select Edit.
    3. In the key policy, paste the statements that you copied. When you add the statements, do not delete any existing statements and make sure that the syntax is valid. Policies are in JSON format.
  12. Navigate back to the Macie console browser tab.
  13. Review the inputs in the Settings page for Discovery results and then choose Save. Macie will perform a check to make sure that it has the right access to the KMS key, and then it will create a new S3 bucket with the required permissions.
  14. If you haven’t run a Macie discovery job in the last 90 days, you will need to run a new discovery job to publish the results to the bucket.

In this step, you created a new S3 bucket and KMS key that you are using only for Macie. For instructions on how to enable and configure the results using existing resources, see Storing and retaining sensitive data discovery results with Amazon Macie. Make sure to review Macie pricing details before creating and running a sensitive data discovery job.

Step 2: Build out the Athena table to query the results using SQL

Now that you have enabled the discovery results, Macie will begin publishing them into your discovery results bucket in the form of jsonl.gz files. Depending on the amount of data, there could be thousands of individual files, with each file containing multiple records. To identify the top five most commonly occurring sensitive data types in your organization, you would need to query all of these files together.

In this step, you will configure Athena so that it can query the results using SQL syntax. Before you can run an Athena query, you must specify a query result bucket location in Amazon S3. This is different from the Macie discovery results bucket that you created in the previous step.

If you haven’t set up Athena previously, we recommend that you create a separate S3 bucket, and specify a query result location using the Athena console. After you’ve set up the query result location, you can configure Athena.

To create a new Athena database and table for the Macie results

  1. Open the Athena console, and in the query editor, enter the following data definition language (DDL) statement. In the context of SQL, a DDL statement is a syntax for creating and modifying database objects, such as tables. For this example, we named our database macie_results.
    CREATE DATABASE macie_results;
    

    After running this step, you’ll see a new database in the Database dropdown. Make sure that the new macie_results database is selected for the next queries.

    Figure 4: Create database in the Athena console

    Figure 4: Create database in the Athena console

  2. Create a table in the database by using the following DDL statement. Make sure to replace <RESULTS-BUCKET-NAME> with the name of the discovery results bucket that you created previously.
    CREATE EXTERNAL TABLE maciedetail_all_jobs(
    	accountid string,
    	category string,
    	classificationdetails struct<jobArn:string,result:struct<status:struct<code:string,reason:string>,sizeClassified:string,mimeType:string,sensitiveData:array<struct<category:string,totalCount:string,detections:array<struct<type:string,count:string,occurrences:struct<lineRanges:array<struct<start:string,`end`:string,`startColumn`:string>>,pages:array<struct<pageNumber:string>>,records:array<struct<recordIndex:string,jsonPath:string>>,cells:array<struct<row:string,`column`:string,`columnName`:string,cellReference:string>>>>>>>,customDataIdentifiers:struct<totalCount:string,detections:array<struct<arn:string,name:string,count:string,occurrences:struct<lineRanges:array<struct<start:string,`end`:string,`startColumn`:string>>,pages:array<string>,records:array<string>,cells:array<string>>>>>>,detailedResultsLocation:string,jobId:string>,
    	createdat string,
    	description string,
    	id string,
    	partition string,
    	region string,
    	resourcesaffected struct<s3Bucket:struct<arn:string,name:string,createdAt:string,owner:struct<displayName:string,id:string>,tags:array<string>,defaultServerSideEncryption:struct<encryptionType:string,kmsMasterKeyId:string>,publicAccess:struct<permissionConfiguration:struct<bucketLevelPermissions:struct<accessControlList:struct<allowsPublicReadAccess:boolean,allowsPublicWriteAccess:boolean>,bucketPolicy:struct<allowsPublicReadAccess:boolean,allowsPublicWriteAccess:boolean>,blockPublicAccess:struct<ignorePublicAcls:boolean,restrictPublicBuckets:boolean,blockPublicAcls:boolean,blockPublicPolicy:boolean>>,accountLevelPermissions:struct<blockPublicAccess:struct<ignorePublicAcls:boolean,restrictPublicBuckets:boolean,blockPublicAcls:boolean,blockPublicPolicy:boolean>>>,effectivePermission:string>>,s3Object:struct<bucketArn:string,key:string,path:string,extension:string,lastModified:string,eTag:string,serverSideEncryption:struct<encryptionType:string,kmsMasterKeyId:string>,size:string,storageClass:string,tags:array<string>,embeddedFileDetails:struct<filePath:string,fileExtension:string,fileSize:string,fileLastModified:string>,publicAccess:boolean>>,
    	schemaversion string,
    	severity struct<description:string,score:int>,
    	title string,
    	type string,
    	updatedat string)
    ROW FORMAT SERDE
    	'org.openx.data.jsonserde.JsonSerDe'
    WITH SERDEPROPERTIES (
    	'paths'='accountId,category,classificationDetails,createdAt,description,id,partition,region,resourcesAffected,schemaVersion,severity,title,type,updatedAt')
    STORED AS INPUTFORMAT
    	'org.apache.hadoop.mapred.TextInputFormat'
    OUTPUTFORMAT
    	'org.apache.hadoop.hive.ql.io.HiveIgnoreKeyTextOutputFormat'
    LOCATION
    	's3://<RESULTS-BUCKET-NAME>/AWSLogs/'
    

    After you complete this step, you will see a new table named maciedetail_all_jobs in the Tables section of the query editor.

  3. Query the results to start gaining insights. For example, to identify the top five most common sensitive data types, run the following query:
    select sensitive_data.category,
    	detections_data.type,
    	sum(cast(detections_data.count as INT)) total_detections
    from maciedetail_all_jobs,
    	unnest(classificationdetails.result.sensitiveData) as t(sensitive_data),
    	unnest(sensitive_data.detections) as t(detections_data)
    where classificationdetails.result.sensitiveData is not null
    and resourcesaffected.s3object.embeddedfiledetails is null
    group by sensitive_data.category, detections_data.type
    order by total_detections desc
    LIMIT 5
    

    Running this query on the sample dataset gives the following output.

    Results of a query showing the five most common sensitive data types in the dataset

    Figure 5: Results of a query showing the five most common sensitive data types in the dataset

  4. (Optional) The previous query ran on all of the results available for Macie. You can further query which accounts have the greatest amount of sensitive data detected.
    select accountid,
    	sum(cast(detections_data.count as INT)) total_detections
    from maciedetail_all_jobs,
    	unnest(classificationdetails.result.sensitiveData) as t(sensitive_data),
    	unnest(sensitive_data.detections) as t(detections_data)
    where classificationdetails.result.sensitiveData is not null
    and resourcesaffected.s3object.embeddedfiledetails is null
    group by accountid
    order by total_detections desc
    

    To test this query, we distributed the synthetic dataset across three member accounts in our organization, ran the query, and received the following output. If you enable Macie in just a single account, then you will only receive results for that one account.

    Figure 6: Query results for total number of sensitive data detections across all accounts in an organization

    Figure 6: Query results for total number of sensitive data detections across all accounts in an organization

For a list of more example queries, see the amazon-macie-results-analytics GitHub repository.

Step 3: Visualize the results with QuickSight

In the previous step, you used Athena to query your Macie discovery results. Although the queries were powerful, they only produced tabular data as their output. In this step, you will use QuickSight to visualize the results of your Macie jobs.

Before creating the visualizations, you first need to grant QuickSight the right permissions to access Athena, the results bucket, and the KMS key that you used to encrypt the results.

To allow QuickSight access to the KMS key

  1. Open the AWS Identity and Access Management (IAM) console, and then do the following:
    1. In the navigation pane, choose Roles.
    2. In the search pane for roles, search for aws-quicksight-s3-consumers-role-v0. If this role does not exist, search for aws-quicksight-service-role-v0.
    3. Select the role and copy the role ARN. You will need this role ARN to modify the KMS key policy to grant permissions for this role.
  2. Open the AWS KMS console and then do the following:
    1. Select Customer managed keys.
    2. Choose the KMS key that you created.
    3. Paste the following statement in the key policy. When you add the statement, do not delete any existing statements, and make sure that the syntax is valid. Replace <QUICKSIGHT_SERVICE_ROLE_ARN> and <KMS_KEY_ARN> with your own information. Policies are in JSON format.
	{ "Sid": "Allow Quicksight Service Role to use the key",
		"Effect": "Allow",
		"Principal": {
			"AWS": <QUICKSIGHT_SERVICE_ROLE_ARN>
		},
		"Action": "kms:Decrypt",
		"Resource": <KMS_KEY_ARN>
	}

To allow QuickSight access to Athena and the discovery results S3 bucket

  1. In QuickSight, in the upper right, choose your user icon to open the profile menu, and choose US East (N.Virginia). You can only modify permissions in this Region.
  2. In the upper right, open the profile menu again, and select Manage QuickSight.
  3. Select Security & permissions.
  4. Under QuickSight access to AWS services, choose Manage.
  5. Make sure that the S3 checkbox is selected, click on Select S3 buckets, and then do the following:
    1. Choose the discovery results bucket.
    2. You do not need to check the box under Write permissions for Athena workgroup. The write permissions are not required for this post.
    3. Select Finish.
  6. Make sure that the Amazon Athena checkbox is selected.
  7. Review the selections and be careful that you don’t inadvertently disable AWS services and resources that other users might be using.
  8. Select Save.
  9. In QuickSight, in the upper right, open the profile menu, and choose the Region where your results bucket is located.

Now that you’ve granted QuickSight the right permissions, you can begin creating visualizations.

To create a new dataset referencing the Athena table

  1. On the QuickSight start page, choose Datasets.
  2. On the Datasets page, choose New dataset.
  3. From the list of data sources, select Athena.
  4. Enter a meaningful name for the data source (for example, macie_datasource) and choose Create data source.
  5. Select the database that you created in Athena (for example, macie_results).
  6. Select the table that you created in Athena (for example, maciedetail_all_jobs), and choose Select.
  7. You can either import the data into SPICE or query the data directly. We recommend that you use SPICE for improved performance, but the visualizations will still work if you query the data directly.
  8. To create an analysis using the data as-is, choose Visualize.

You can then visualize the Macie results in the QuickSight console. The following example shows a delegated Macie administrator account that is running a visualization, with account IDs on the y axis and the count of affected resources on the x axis.

Figure 7: Visualize query results to identify total number of sensitive data detections across accounts in an organization

Figure 7: Visualize query results to identify total number of sensitive data detections across accounts in an organization

You can also visualize the aggregated data in QuickSight. For example, you can view the number of findings for each sensitive data category in each S3 bucket. The Athena table doesn’t provide aggregated data necessary for visualization. Instead, you need to query the table and then visualize the output of the query.

To query the table and visualize the output in QuickSight

  1. On the Amazon QuickSight start page, choose Datasets.
  2. On the Datasets page, choose New dataset.
  3. Select the data source that you created in Athena (for example, macie_datasource) and then choose Create Dataset.
  4. Select the database that you created in Athena (for example, macie_results).
  5. Choose Use Custom SQL, enter the following query below, and choose Confirm Query.
    	select resourcesaffected.s3bucket.name as bucket_name,
    		sensitive_data.category,
    		detections_data.type,
    		sum(cast(detections_data.count as INT)) total_detections
    	from macie_results.maciedetail_all_jobs,
    		unnest(classificationdetails.result.sensitiveData) as t(sensitive_data),unnest(sensitive_data.detections) as t(detections_data)
    where classificationdetails.result.sensitiveData is not null
    and resourcesaffected.s3object.embeddedfiledetails is null
    group by resourcesaffected.s3bucket.name, sensitive_data.category, detections_data.type
    order by total_detections desc
    	

  6. You can either import the data into SPICE or query the data directly.
  7. To create an analysis using the data as-is, choose Visualize.

Now you can visualize the output of the query that aggregates data across your S3 buckets. For example, we used the name of the S3 bucket to group the results, and then we created a donut chart of the output, as shown in Figure 6.

Figure 8: Visualize query results for total number of sensitive data detections across each S3 bucket in an organization

Figure 8: Visualize query results for total number of sensitive data detections across each S3 bucket in an organization

From the visualizations, we can identify which buckets or accounts in our organizations contain the most sensitive data, for further action. Visualizations can also act as a dashboard to track remediation.

If you encounter permissions issues, see Insufficient permissions when using Athena with Amazon QuickSight and Troubleshooting key access for troubleshooting steps.

You can replicate the preceding steps by using the sample queries from the amazon-macie-results-analytics GitHub repo to view data that is aggregated across S3 buckets, AWS accounts, or individual Macie jobs. Using these queries with the results of your Macie results will help you get started with tracking the security posture of your data in Amazon S3.

Conclusion

In this post, you learned how to enable sensitive data discovery results for Macie, query those results with Athena, and visualize the results in QuickSight.

Because Macie sensitive data discovery results provide more granular data than the findings, you can pursue a more comprehensive incident response when sensitive data is discovered. The sample queries in this post provide answers to some generic questions that you might have. After you become familiar with the structure, you can run other interesting queries on the data.

We hope that you can use this solution to write your own queries to gain further insights into sensitive data discovered in S3 buckets, according to the business needs and regulatory requirements of your organization. You can consider using this solution to better understand and identify data security risks that need immediate attention. For example, you can use this solution to answer questions such as the following:

  • Is financial information present in an AWS account where it shouldn’t be?
  • Are S3 buckets that contain PII properly hardened with access controls and encryption?

You can also use this solution to understand gaps in your data security initiatives by tracking files that Macie couldn’t analyze due to encryption or permission issues. To further expand your knowledge of Macie capabilities and features, see the following resources:

If you have feedback about this post, submit comments in the Comments section below. If you have questions about this post, start a new thread on Amazon Macie re:Post.

Want more AWS Security news? Follow us on Twitter.

Author

Keith Rozario

Keith is a Sr. Solution Architect at Amazon Web Services based in Singapore, where he helps customers develop solutions for their most complex business problems. He loves road cycling, reading comics from DC, and enjoying the sweet sound of music from AC/DC.

Author

Scott Ward

Scott is a Principal Solutions Architect with AWS External Security Services (ESS) and has been with Amazon for over 20 years. Scott provides technical guidance to the ESS services, such as GuardDuty, Security Hub, Macie, Inspector and Detective, and helps customers make their applications secure. Scott has a deep background in supporting, enhancing, and building global financial solutions to meet the needs of large companies, including many years of supporting the global financial systems for Amazon.com.

Author

Koulick Ghosh

Koulick is a Senior Product Manager in AWS Security based in Seattle, WA. He loves speaking with customers on how AWS Security services can help make them more secure. In his free-time, he enjoys playing the guitar, reading, and exploring the Pacific Northwest.

Automating detection of security vulnerabilities and bugs in CI/CD pipelines using Amazon CodeGuru Reviewer CLI

Post Syndicated from Akash Verma original https://aws.amazon.com/blogs/devops/automating-detection-of-security-vulnerabilities-and-bugs-in-ci-cd-pipelines-using-amazon-codeguru-reviewer-cli/

Watts S. Humphrey, the father of Software Quality, had famously quipped, “Every business is a software business”. Software is indeed integral to any industry. The engineers who create software are also responsible for making sure that the underlying code adheres to industry and organizational standards, are performant, and are absolved of any security vulnerabilities that could make them susceptible to attack.

Traditionally, security testing has been the forte of a specialized security testing team, who would conduct their tests toward the end of the Software Development lifecycle (SDLC). The adoption of DevSecOps practices meant that security became a shared responsibility between the development and security teams. Now, development teams can, on their own or as advised by their security team, setup and configure various code scanning tools to detect security vulnerabilities much earlier in the software delivery process (aka “Shift Left”). Meanwhile, the practice of Static code analysis and security application testing (SAST) has become a standard part of the SDLC. Furthermore, it’s imperative that the development teams expect SAST tools that are easy to set-up, seamlessly fit into their DevOps infrastructure, and can be configured without requiring assistance from security or DevOps experts.

In this post, we’ll demonstrate how you can leverage Amazon CodeGuru Reviewer Command Line Interface (CLI) to integrate CodeGuru Reviewer into your Jenkins Continuous Integration & Continuous Delivery (CI/CD) pipeline. Note that the solution isn’t limited to Jenkins, and it would be equally useful with any other build automation tool. Moreover, it can be integrated at any stage of your SDLC as part of the White-box testing. For example, you can integrate the CodeGuru Reviewer CLI as part of your software development process, as well as run it on your dev machine before committing the code.

Launched in 2020, CodeGuru Reviewer utilizes machine learning (ML) and automated reasoning to identify security vulnerabilities, inefficient uses of AWS APIs and SDKs, as well as other common coding errors. CodeGuru Reviewer employs a growing set of detectors for Java and Python to provide recommendations via the AWS Console. Customers that leverage the CodeGuru Reviewer CLI within a CI/CD pipeline also receive recommendations in a machine-readable JSON format, as well as HTML.

CodeGuru Reviewer offers native integration with Source Code Management (SCM) systems, such as GitHub, BitBucket, and AWS CodeCommit. However, it can be used with any SCM via its CLI. The CodeGuru Reviewer CLI is a shim layer on top of the AWS Command Line Interface (AWS CLI) that simplifies the interaction with the tool by handling the uploading of artifacts, triggering of the analysis, and fetching of the results, all in a single command.

Many customers, including Mastercard, are benefiting from this new CodeGuru Reviewer CLI.

“During one of our technical retrospectives, we noticed the need to integrate Amazon CodeGuru recommendations in our build pipelines hosted on Jenkins. Not all our developers can run or check CodeGuru recommendations through the AWS console. Incorporating CodeGuru CLI in our build pipelines acts as an important quality gate and ensures that our developers can immediately fix critical issues.”
                                           Claudio Frattari, Lead DevOps at Mastercard

Solution overview

The application deployment workflow starts by placing the application code on a GitHub SCM. To automate the scenario, we have added GitHub to the Jenkins project under the “Source Code” section. We chose the GitHub option, which would clone the chosen GitHub repository in the Jenkins local workspace directory.

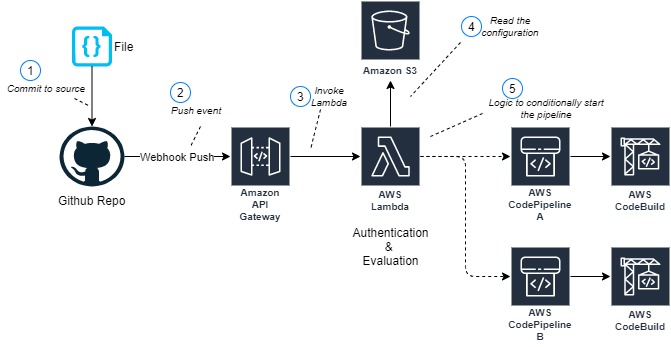
In the build stage of the pipeline (see Figure 1), we configure the appropriate build tool to perform the code build and security analysis. In this example, we will be using Maven as the build tool.

Figure 1: Jenkins pipeline with Amazon CodeGuru Reviewer

Figure 1: Jenkins pipeline with Amazon CodeGuru Reviewer

In the post-build stage, we configure the CodeGuru Reviewer CLI to generate the recommendations based on the review.

Lastly, in the concluding stage of the pipeline, we’ll be analyzing the JSON results using jq – a lightweight and flexible command-line JSON processor, and then failing the Jenkins job if we encounter observations that are of a “Critical” severity.

Jenkins will trigger the “CodeGuru Reviewer” (see Figure 1) based review process in the post-build stage, i.e., after the build finishes. Furthermore, you can configure other stages, such as automated testing or deployment, after this stage. Additionally, passing the location of the build artifacts to the CLI lets CodeGuru Reviewer perform a more in-depth security analysis. Build artifacts are either directories containing jar files (e.g., build/lib for Gradle or /target for Maven) or directories containing class hierarchies (e.g., build/classes/java/main for Gradle).

Walkthrough

Now that we have an overview of the workflow, let’s dive deep and walk you through the following steps in detail:

  1. Installing the CodeGuru Reviewer CLI
  2. Creating a Jenkins pipeline job
  3. Reviewing the CodeGuru Reviewer recommendations
  4. Configuring CodeGuru Reviewer CLI’s additional options

1. Installing the CodeGuru CLI Wrapper

a. Prerequisites

To run the CLI, we must have Git, Java, Maven, and the AWS CLI installed. Verify that they’re installed on our machine by running the following commands:

java -version 
mvn --version 
aws --version 
git –-version

If they aren’t installed, then download and install Java here (Amazon Corretto is a no-cost, multiplatform, production-ready distribution of the Open Java Development Kit), Maven from here, and Git from here. Instructions for installing AWS CLI are available here.

We would need to create an Amazon Simple Storage Service (Amazon S3) bucket with the prefix codeguru-reviewer-. Note that the bucket name must begin with the mentioned prefix, since we have used the name pattern in the following AWS Identity and Access Management (IAM) permissions, and CodeGuru Reviewer expects buckets to begin with this prefix. Refer to the following section 4(a) “Specifying S3 bucket name” for more details.

Furthermore, we’ll need working credentials on our machine to interact with our AWS account. Learn more about setting up credentials for AWS here. You can find the minimal permissions to run the CodeGuru Reviewer CLI as follows.

b. Required Permissions

To use the CodeGuru Reviewer CLI, we need at least the following AWS IAM permissions, attached to an AWS IAM User or an AWS IAM role:

{
    "Version": "2012-10-17",
    "Statement": [
        {
            "Action": [
                "codeguru-reviewer:ListRepositoryAssociations",
                "codeguru-reviewer:AssociateRepository",
                "codeguru-reviewer:DescribeRepositoryAssociation",
                "codeguru-reviewer:CreateCodeReview",
                "codeguru-reviewer:DescribeCodeReview",
                "codeguru-reviewer:ListRecommendations",
                "iam:CreateServiceLinkedRole"
            ],
            "Resource": "*",
            "Effect": "Allow"
        },
        {
            "Action": [
                "s3:CreateBucket",
                "s3:GetBucket*",
                "s3:List*",
                "s3:GetObject",
                "s3:PutObject",
                "s3:DeleteObject"
            ],
            "Resource": [
                "arn:aws:s3:::codeguru-reviewer-*",
                "arn:aws:s3:::codeguru-reviewer-*/*"
            ],
            "Effect": "Allow"
        }
    ]
}

c.  CLI installation

Please download the latest version of the CodeGuru Reviewer CLI available at GitHub. Then, run the following commands in sequence:

curl -OL https://github.com/aws/aws-codeguru-cli/releases/download/0.0.1/aws-codeguru-cli.zip
unzip aws-codeguru-cli.zip
export PATH=$PATH:./aws-codeguru-cli/bin

d. Using the CLI

The CodeGuru Reviewer CLI only has one required parameter –root-dir (or just -r) to specify to the local directory that should be analyzed. Furthermore, the –src option can be used to specify one or more files in this directory that contain the source code that should be analyzed. In turn, for Java applications, the –build option can be used to specify one or more build directories.

For a demonstration, we’ll analyze the demo application. This will make sure that we’re all set for when we leverage the CLI in Jenkins. To proceed, first we download and install the sample application, as follows:

git clone https://github.com/aws-samples/amazon-codeguru-reviewer-sample-app
cd amazon-codeguru-reviewer-sample-app
mvn clean compile

Now that we have built our demo application, we can use the aws-codeguru-cli CLI command that we added to the path to trigger the code scan:

aws-codeguru-cli --root-dir ./ --build target/classes --src src --output ./output

For additional assistance on the CLI command, reference the readme here.

2.  Creating a Jenkins Pipeline job

CodeGuru Reviewer can be integrated in a Jenkins Pipeline as well as a Freestyle project. In this example, we’re leveraging a Pipeline.

a. Pipeline Job Configuration

  1.  Log in to Jenkins, choose “New Item”, then select “Pipeline” option.
  2. Enter a name for the project (for example, “CodeGuruPipeline”), and choose OK.
Figure 2: Creating a new Jenkins pipeline

Figure 2: Creating a new Jenkins pipeline

  1. On the “Project configuration” page, scroll down to the bottom and find your pipeline. In the pipeline script, paste the following script (or use your own Jenkinsfile). The following example is a valid Jenkinsfile to integrate CodeGuru Reviewer with a project built using Maven.
pipeline {
    agent any
    stages {
        stage('Build') {
            steps {
                // Get code from a GitHub repository
                git clone https://github.com/aws-samples/amazon-codeguru-reviewer-java-detectors.git

                // Run Maven on a Unix agent
                sh "mvn clean compile"

                // To run Maven on a Windows agent, use following
                // bat "mvn -Dmaven.test.failure.ignore=true clean package"
            }
        }
        stage('CodeGuru Reviewer') {
            steps{
                sh 'ls -lsa *'
                sh 'pwd'
                // Here we’re setting an absolute path, but we can 
                // also use JENKINS environment variables
                sh '''
                    export BASE=/var/jenkins_home/workspace/CodeGuruPipeline/amazon-codeguru-reviewer-java-detectors
                    export SRC=${BASE}/src
                    export OUTPUT = ./output
                    /home/codeguru/aws-codeguru-cli/bin/aws-codeguru-cli --root-dir $BASE --build $BASE/target/classes --src $SRC --output $OUTPUT -c $GIT_PREVIOUS_COMMIT:$GIT_COMMIT --no-prompt
                    '''
            }
        }    
        stage('Checking findings'){
            steps{
                // In this example we are stopping our pipline on  
                // detecting Critical findings. We are using jq 
                // to count occurrences of Critical severity 
                sh '''
                CNT = $(cat ./output/recommendations.json |jq '.[] | select(.severity=="Critical")|.severity' | wc -l)'
                if (( $CNT > 0 )); then
                  echo "Critical findings discovered. Failing."
                  exit 1
                fi
                '''
            }
        }
    }
}
  1. Save the configuration and select “Build now” on the side bar to trigger the build process (see Figure 3).
Figure 3: Jenkins pipeline in triggered state

Figure 3: Jenkins pipeline in triggered state

3. Reviewing the CodeGuru Reviewer recommendations

Once the build process is finished, you can view the review results from CodeGuru Reviewer by selecting the Jenkins build history for the most recent build job. Then, browse to Workspace output. The output is available in JSON and HTML formats (Figure 4).

Figure 4: CodeGuru CLI Output

Figure 4: CodeGuru CLI Output

Snippets from the HTML and JSON reports are displayed in Figure 5 and 6 respectively.

In this example, our pipeline analyzes the JSON results with jq based on severity equal to critical and failing the job if there are any critical findings. Note that this output path is set with the –output option. For instance, the pipeline will fail on noticing the “critical” finding at Line 67 of the EventHandler.java class (Figure 5), flagged due to use of an insecure code. Till the time the code is remediated, the pipeline would prevent the code deployment. The vulnerability could have gone to production undetected, in absence of the tool.

Figure 5: CodeGuru HTML Report

Figure 5: CodeGuru HTML Report

Figure 6: CodeGuru JSON recommendations

Figure 6: CodeGuru JSON recommendations

4.  Configuring CodeGuru Reviewer CLI’s additional options

a.  Specifying Amazon S3 bucket name and policy

CodeGuru Reviewer needs one Amazon S3 bucket for the CLI to store the artifacts while the analysis is running. The artifacts are deleted after the analysis is completed. The same bucket will be reused for all the repositories that are analyzed in the same account and region (unless specified otherwise by the user). Note that CodeGuru Reviewer expects the S3 bucket name to begin with codeguru-reviewer-. At this time, you can’t use a different naming pattern. However, if you want to use a different bucket name, then you can use the –bucket-name option.

Select the Permissions tab of your S3 bucket. Update the Block public access and add the following S3 bucket policy.

Figure 7: S3 bucket settings

Figure 7: S3 bucket settings

S3 bucket policy:

{
   "Version":"2012-10-17",
   "Statement":[
      {
         "Sid":"PublicRead",
         "Effect":"Allow",
         "Principal":"*",
         "Action":"s3:GetObject",
         "Resource":"[Change to ARN for your S3 bucket]/*"
      }
   ]
}

Note that if you must change the bucket’s name, then you can remove the associated S3 bucket in the AWS console under CodeGuru → CI workflows and select Disassociate Workflow.

b.  Analyzing a single commit

The CLI also lets us specify a specific commit range to analyze. This can lead to faster and more cost-effective scans for the incremental code changes, instead of a full repository scan. For example, if we just want to analyze the last commit, we can run:

aws-codeguru-cli -r ./ -s src/main/java -b build/libs -c HEAD^:HEAD --no-prompt

Here, we use the -c option to specify that we only want to analyze the commits between HEAD^ (the previous commit) and HEAD (the current commit). Moreover, we add the –no-prompt option to automatically answer questions by the CLI with yes. This option is useful if we plan to use the CLI in an automated way, such as in our CI/CD workflow.

c.  Encrypting artifacts

CodeGuru Reviewer lets us use a customer managed key to encrypt the content of the S3 bucket that is used to store the source and build artifacts. To achieve this, create a customer owned key in AWS Key Management Service (AWS KMS) (see Figure 8).

Figure 8: KMS settings

Figure 8: KMS settings

We must grant CodeGuru Reviewer the permission to decrypt artifacts with this key by adding the following Statement to your Key policy:

{
   "Sid":"Allow CodeGuru to use the key to decrypt artifact",
   "Effect":"Allow",
   "Principal":{
      "AWS":"*"
   },
   "Action":[
      "kms:Decrypt",
      "kms:DescribeKey"
   ],
   "Resource":"*",
   "Condition":{
      "StringEquals":{
         "kms:ViaService":"codeguru-reviewer.amazonaws.com",
         "kms:CallerAccount":[
            "YOUR AWS ACCOUNT ID"
         ]
      }
   }
}

Then, enable server-side encryption for the S3 bucket that we’re using with CodeGuru Reviewer (Figure 9).

S3 bucket settings:

Figure 9: S3 bucket encryption settings

Figure 9: S3 bucket encryption settings

After we enable encryption on the bucket, we must delete all the CodeGuru repository associations that use this bucket, and then recreate them by analyzing the repositories while providing the key (as in the following example, Figure 10):

Figure10: CodeGuru CI Workflow

Figure 10: CodeGuru CI Workflow

Note that the first time you check out your repository, it will always trigger a full repository scan. Consider setting the -c option, as this will allow a commit range.

Cleaning Up

At this stage, you may choose to delete the resources created while following this blog, to avoid incurring any unwanted costs.

  1. Delete Amazon S3 bucket.
  2. Delete AWS KMS key.
  3. Delete the Jenkins installation, if not required further.

Conclusion

In this post, we outlined how you can integrate Amazon CodeGuru Reviewer CLI with the Jenkins open-source build automation tool to perform code analysis as part of your code build pipeline and act as a quality gate. We showed you how to create a Jenkins pipeline job and integrate the CodeGuru Reviewer CLI to detect issues in your Java and Python code, as well as access the recommendations for remediating these issues. We presented an example where you can stop the build upon finding critical violations. Furthermore, we discussed how you can specify a commit range to avoid a full repo scan, and how the S3 bucket used by CodeGuru Reviewer to store artifacts can be encrypted using customer managed keys.

The CodeGuru Reviewer CLI offers you a one-line command to scan any code on your machine and retrieve recommendations. You can run the CLI anywhere where you can run AWS commands. In other words, you can use the CLI to integrate CodeGuru Reviewer into your favourite CI tool, as a pre-commit hook, or anywhere else in your workflow. In turn, you can combine CodeGuru Reviewer with Dynamic Application Security Testing (DAST) and Software Composition Analysis (SCA) tools to achieve a hybrid application security testing method that helps you combine the inside-out and outside-in testing approaches, cross-reference results, and detect vulnerabilities that both exist and are exploitable.

Hopefully, you have found this post informative, and the proposed solution useful. If you need helping hands, then AWS Professional Services can help implement this solution in your enterprise, as well as introduce you to our AWS DevOps services and offerings.

About the Authors

Akash Verma

Akash Verma

Akash is a Software Development Engineer 2 at Amazon India. He is passionate about writing clean code and building maintainable software. He also enjoys learning modern technologies. Outside of work, Akash loves to travel, interact with new people, and try different cuisines. He also relishes gardening and watching Stand-up comedy.

Debashish Chakrabarty

Debashish Chakrabarty

Debashish is a Sr. Engagement Manager at AWS Professional Services, India with over 21+ years of experience in various IT roles. At ProServe he leads engagements on Security, App Modernization and Migrations to help ProServe customers accelerate their cloud journey and achieve their business goals. Off work, Debashish has been a Hindi Blogger & Podcaster. He loves binge-watching OTT shows and spending time with family.

David Ernst

David Ernst

David is a Sr. Specialist Solution Architect – DevOps, with 20+ years of experience in designing and implementing software solutions for various industries. David is an automation enthusiast and works with AWS customers to design, deploy, and manage their AWS workloads/architectures.

Законопроектите като git pull request

Post Syndicated from original https://yurukov.net/blog/2022/lawbrew/

Вчера министър Божанов обяви законопроектът за промяна на Закона за движение по пътищата и описа нещата, които спадат в сферата на електронното управление. Целият текст на проекта ще намерите на страницата на МВР заедно с мотивите и оценката за въздействие.

Исках да разбера в какво се изразяват промените и да разделя тези, които идват от електронното управление и са за облекчаване от бюрокрацията както и за автоматизация, и тези идващи от МВР. Законопроектът има доста точки, а и самият закон не е лесен за четене с всички препратки, отменени текстове и прочие.

Затова седнах и въведох публикуваната от институциите последна версия на Закона за движение по пътищата в Github, след това от основната версия направих branch и добавих промените предвидени в проекта. Това е нещо основно, което се използва за разработването на софтуер и позволява да се правят паралелни промени, да се следят множество версии на един и същи документ и накрая да се решава какво следва да се слее в основната версия.

Пътят на един български законопроект всъщност далеч не е по-различен чисто административно, просто е до оглупяване муден, ръчен, непрозрачен, пълен с грешки и възможности за манипулация. Причините за това са както традиция и закостенялост, така и фрапираща липса на компютърна грамотност в администрацията, но най-вече сред законотворците и взимащите решения за процесите в НС, които ние избираме.

Това, което направих в Github не е решение само по себе си, но е пример как може да бъде с минимални усилия. Учудващо бързо успях да дигитализирам толкова сух закон и да прехвърля законопроекта. Така може да се види нагледно направо в закона какво се променя. Тук, например, виждате промяната на Божанов премахваща изискването за талон и стикер.

Чисто технически, система като Git може да се използва за тази цел, но има проблеми, които трябва да се решат. Като процес вече споменах, че съвпада в огромна степен до този вече използван в повечето софтуерни компании. Може би като изключим нападките от подиума на пленарна зала по адрес на нечия сестра или сексуална принадлежност… може би.

Markup езикът на github конкретно е подходящ, но не пасва изцяло на практиката за форматиране на законите ни. Списъците там не поддържат буквите в номерата на точките и подточките на алинеите ни, а не може да слагаме 7 нива на подзаглавия. Отделно адресирането на препратките следва да става по йерархичен ред, за да не се чупи при промени в закона. Сега при еднакви имена на алинеите, линковете към тях в github md са по пореден ред на заглавието с еднакъв текст. Има начин да се заобиколи, но не е удобно. За целта следва да се направи вариант с тези добавки, включително автоматично адресиране директно до точка и подточка в редакторите. Това ще позволи по-бързо въвеждане и по-малко грешки.

Трудни ще бъдат първите стъпки, защото говорим за огромно количество нормативни актове, трупани с промени десетилетия. Докато дори толкова сложен закон ми отне 30-тина минути да прехвърля без да имам опит, всъщност много следва да се внимава, когато това се прави за официален източник, защото тогава ефектите ще са значителни.

По-важен проблем обаче е сигурността. Докато тази информация следва да е публична, трябва да сме сигурни, че няма да се променя. Колкото и да е станало клише вече, именно blockchain технологията е подходяща тук – публикуването на хеша след всяка промяна ще даде възможност на всеки да провери, че дори една буква не е била подменена в цялата дигитална нормативна база или история на България.

Всичко това не е самоцелно, за използване на overhype-нати техно термини в нещо закостеняло или да се модернизира работата на една от основните институции в страната ни. Прозрачността тук е сериозно засегната. Независимо, че законопроектите се публикуват отдавна, те остават недостъпни за голяма част от населението. Дори за активно търсещите и интересуващите се е нужно часове, а понякога дни заедно с консултации с адвокати да разберат какво се случва. Често промени нарочно се описват в законопроектите по начин, които прави разкодирането им изключително трудно. Всичко това цели единствено и само да се укрие истинската цел на авторите.

Друг важен аспект тук е, че България като държава всъщност не притежава законите си. Не съществува в нито една институция, включително в Народното събрание, едно място, на което да се пазят законите. Ако днес някой попита какво казва даден член на даден закон, няма институция, която може да ви до каже. Да, всеки нов закон и стотиците промени по тях се публикуват надлежно в Държавен вестник и това се пази от НС чинно. Но крайната версия на законите – не. Тази функция държавата без решение, закон или заповед е изнесла като отговорност на няколко частни компании, на които те, както и всички български компании плащат ежемесечно за правото да знаят покрай много други неща и какви са българските закони. Дори администрацията на Народното събрание когато подготвя промени, всъщност не ги прилага в някакво тяхно копие, които пазят тайно от нас, а сверява с последното от съответната частна софтуерна система.

Има публични безплатни източници, разбира се, но информацията там е собственост на въпросните компании. От гледна точка на прозрачност и сигурност на толкова критична за държавата ни информация като текстовете на съвкупността от нормативните ни актове, това е най-малкото стряскащо.

В никакъв случай не казвам, че е лошо фирмите да предлагат такива услуги. Не следва обаче държавата и особено първоизточникът на законите да разчитат на тях, за да достигат до крайния резултат от законодателния процес. Това, което показах горе не е непременно решение, а показва, че такова далеч не е трудно и не изисква особено сложни технологии или време.

Не на последно място, допълнителна полза от подобна система е, че лесно може да се правят предложения и да се осмислят далеч по-бързо. Ето, тук съм показал моите предложения към законопроекта, с който започнахме. Включил съм аргументи за предложенията ми и тук може да се видят конкретните промени. Пратих ги отделно по мейл. Ако имате и вие предложения или обратна връзка, консултациите текат до 13-ти май.

Това тук е един закон дигитализиран за половин час от един човек. С аналогична на описаната от мен, но по-стройна и сигурна система може да се проследява от всеки кой кога какво е променял, от къде е започнал, какво е прието, как е било изменено, слято или омаскарено. Цинизмът у нас ни дава още доводи, защо няма да се случи скоро. Иначе, ако искате да разберете как се приемат тези закони и най-вече какви машинации се правят, за да не се свърши никаква работа, ви съветвам да обърнете внимание на Стража.

The post Законопроектите като git pull request first appeared on Блогът на Юруков.

Integrate GitHub monorepo with AWS CodePipeline to run project-specific CI/CD pipelines

Post Syndicated from Vivek Kumar original https://aws.amazon.com/blogs/devops/integrate-github-monorepo-with-aws-codepipeline-to-run-project-specific-ci-cd-pipelines/

AWS CodePipeline is a continuous delivery service that enables you to model, visualize, and automate the steps required to release your software. With CodePipeline, you model the full release process for building your code, deploying to pre-production environments, testing your application, and releasing it to production. CodePipeline then builds, tests, and deploys your application according to the defined workflow either in manual mode or automatically every time a code change occurs. A lot of organizations use GitHub as their source code repository. Some organizations choose to embed multiple applications or services in a single GitHub repository separated by folders. This method of organizing your source code in a repository is called a monorepo.

This post demonstrates how to customize GitHub events that invoke a monorepo service-specific pipeline by reading the GitHub event payload using AWS Lambda.


Solution overview

With the default setup in CodePipeline, a release pipeline is invoked whenever a change in the source code repository is detected. When using GitHub as the source for a pipeline, CodePipeline uses a webhook to detect changes in a remote branch and starts the pipeline. When using a monorepo style project with GitHub, it doesn’t matter which folder in the repository you change the code, CodePipeline gets an event at the repository level. If you have a continuous integration and continuous deployment (CI/CD) pipeline for each of the applications and services in a repository, all pipelines detect the change in any of the folders every time. The following diagram illustrates this scenario.


GitHub monorepo folder structure


This post demonstrates how to customize GitHub events that invoke a monorepo service-specific pipeline by reading the GitHub event payload using Lambda. This solution has the following benefits:

  • Add customizations to start pipelines based on external factors – You can use custom code to evaluate whether a pipeline should be triggered. This allows for further customization beyond polling a source repository or relying on a push event. For example, you can create custom logic to automatically reschedule deployments on holidays to the next available workday.
  • Have multiple pipelines with a single source – You can trigger selected pipelines when multiple pipelines are listening to a single GitHub repository. This lets you group small and highly related but independently shipped artifacts such as small microservices without creating thousands of GitHub repos.
  • Avoid reacting to unimportant files – You can avoid triggering a pipeline when changing files that don’t affect the application functionality (such as documentation, readme, PDF, and .gitignore files).

In this post, we’re not debating the advantages or disadvantages of a monorepo versus a single repo, or when to create monorepos or single repos for each application or project.


Sample architecture

This post focuses on controlling running pipelines in CodePipeline. CodePipeline can have multiple stages like test, approval, and deploy. Our sample architecture considers a simple pipeline with two stages: source and build.


Github monorepo - CodePipeline Sample Architecture

This solution is made up of following parts:

  • An Amazon API Gateway endpoint (3) is backed by a Lambda function (5) to receive and authenticate GitHub webhook push events (2)
  • The same function evaluates incoming GitHub push events and starts the pipeline on a match
  • An Amazon Simple Storage Service (Amazon S3) bucket (4) stores the CodePipeline-specific configuration files
  • The pipeline contains a build stage with AWS CodeBuild


Normally, after you create a CI/CD pipeline, it automatically triggers a pipeline to release the latest version of your source code. From then on, every time you make a change in your source code, the pipeline is triggered. You can also manually run the last revision through a pipeline by choosing Release change on the CodePipeline console. This architecture uses the manual mode to run the pipeline. GitHub push events and branch changes are evaluated by the Lambda function to avoid commits that change unimportant files from starting the pipeline.


Creating an API Gateway endpoint

We need a single API Gateway endpoint backed by a Lambda function with the responsibility of authenticating and validating incoming requests from GitHub. You can authenticate requests using HMAC security or GitHub Apps. API Gateway only needs one POST method to consume GitHub push events, as shown in the following screenshot.


Creating an API Gateway endpoint


Creating the Lambda function

This Lambda function is responsible for authenticating and evaluating the GitHub events. As part of the evaluation process, the function can parse through the GitHub events payload, determine which files are changed, added, or deleted, and perform the appropriate action:

  • Start a single pipeline, depending on which folder is changed in GitHub
  • Start multiple pipelines
  • Ignore the changes if non-relevant files are changed

You can store the project configuration details in Amazon S3. Lambda can read this configuration to decide what needs to be done when a particular folder is matched from a GitHub event. The following code is an example configuration:

{

    "GitHubRepo": "SampleRepo",

    "GitHubBranch": "main",

    "ChangeMatchExpressions": "ProjectA/.*",

    "IgnoreFiles": "*.pdf;*.md",

    "CodePipelineName": "ProjectA - CodePipeline"

}

For more complex use cases, you can store the configuration file in Amazon DynamoDB.

The following is the sample Lambda function code in Python 3.7 using Boto3:

def lambda_handler(event, context):

    import json
    modifiedFiles = event["commits"][0]["modified"]
    #full path
    for filePath in modifiedFiles:
        # Extract folder name
        folderName = (filePath[:filePath.find("/")])
        break

    #start the pipeline
    if len(folderName)>0:
        # Codepipeline name is foldername-job. 
        # We can read the configuration from S3 as well. 
        returnCode = start_code_pipeline(folderName + '-job')

    return {
        'statusCode': 200,
        'body': json.dumps('Modified project in repo:' + folderName)
    }
    

def start_code_pipeline(pipelineName):
    client = codepipeline_client()
    response = client.start_pipeline_execution(name=pipelineName)
    return True

cpclient = None
def codepipeline_client():
    import boto3
    global cpclient
    if not cpclient:
        cpclient = boto3.client('codepipeline')
    return cpclient
   

Creating a GitHub webhook

GitHub provides webhooks to allow external services to be notified on certain events. For this use case, we create a webhook for a push event. This generates a POST request to the URL (API Gateway URL) specified for any files committed and pushed to the repository. The following screenshot shows our webhook configuration.

Creating a GitHub webhook2

Conclusion

In our sample architecture, two pipelines monitor the same GitHub source code repository. A Lambda function decides which pipeline to run based on the GitHub events. The same function can have logic to ignore unimportant files, for example any readme or PDF files.

Using API Gateway, Lambda, and Amazon S3 in combination serves as a general example to introduce custom logic to invoke pipelines. You can expand this solution for increasingly complex processing logic.


About the Author

Vivek Kumar

Vivek is a Solutions Architect at AWS based out of New York. He works with customers providing technical assistance and architectural guidance on various AWS services. He brings more than 23 years of experience in software engineering and architecture roles for various large-scale enterprises.


Gaurav-Sharma

Gaurav is a Solutions Architect at AWS. He works with digital native business customers providing architectural guidance on AWS services.


Nitin-Aggarwal

Nitin is a Solutions Architect at AWS. He works with digital native business customers providing architectural guidance on AWS services.


Pumpkin Pi Build Monitor

Post Syndicated from Ashley Whittaker original https://www.raspberrypi.org/blog/pumpkin-pi-build-monitor/

Following on from Rob Zwetsloot’s Haunted House Hacks in the latest issue of The MagPi magazine, GitHub’s Martin Woodward has created a spooky pumpkin that warns you about the thing programmers find scariest of all — broken builds. Here’s his guest post describing the project:

“When you are browsing code looking for open source projects, seeing a nice green passing build badge in the ReadMe file lets you know everything is working with the latest version of that project. As a programmer you really don’t want to accidentally commit bad code, which is why we often set up continuous integration builds that constantly check the latest code in our project.”

“I decided to create a 3D-printed pumpkin that would hold a Raspberry Pi Zero with an RGB LED pHat on top to show me the status of my build for Halloween. All the code is available on GitHub alongside the 3D printing models which are also available on Thingiverse.”

Components

  • Raspberry Pi Zero (I went for the WH version to save me soldering on the header pins)
  • Unicorn pHat from Pimoroni
  • Panel mount micro-USB extension
  • M2.5 hardware for mounting (screws, male PCB standoffs, and threaded inserts)

“For the 3D prints, I used a glow-in-the-dark PLA filament for the main body and Pi holder, along with a dark green PLA filament for the top plug.”

“I’ve been using M2.5 threaded inserts quite a bit when printing parts to fit a Raspberry Pi, as it allows you to simply design a small hole in your model and then you push the brass thread into the gap with your soldering iron to melt it securely into place ready for screwing in your device.”

Threaded insert

“Once the inserts are in, you can screw the Raspberry Pi Zero into place using some brass PCB stand-offs, place the Unicorn pHAT onto the GPIO ports, and then screw that down.”

pHAT install

“Then you screw in the panel-mounted USB extension into the back of the pumpkin, connect it to the Raspberry Pi, and snap the Raspberry Pi holder into place in the bottom of your pumpkin.”

Inserting the base

Code along with Martin

“Now you are ready to install the software.  You can get the latest version from my PumpkinPi project on GitHub. “

“Format the micro SD Card and install Raspberry Pi OS Lite. Rather than plugging in a keyboard and monitor, you probably want to do a headless install, configuring SSH and WiFi by dropping an ssh file and a wpa_supplicant.conf file onto the root of the SD card after copying over the Raspbian files.”

“You’ll need to install the Unicorn HAT software, but they have a cool one-line installer that takes care of all the dependencies including Python and Git.”

\curl -sS https://get.pimoroni.com/unicornhat | bash

“In addition, we’ll be using the requests module in Python which you can install with the following command:”

sudo pip install requests

“Next you want to clone the git repo.”

git clone https://github.com/martinwoodward/PumpkinPi.git

“You then need to modify the settings to point at your build badge. First of all copy the sample settings provided in the repo:”

cp ~/PumpkinPi/src/local_settings.sample ~/PumpkinPi/src/local_settings.py

“Then edit the BADGE_LINK variable and point at the URL of your build badge.”

# Build Badge for the build you want to monitor

BADGE_LINK = "https://github.com/martinwoodward/calculator/workflows/CI/badge.svg?branch=main"

# How often to check (in seconds). Remember - be nice to the server. Once every 5 minutes is plenty.

REFRESH_INTERVAL = 300

“Finally you can run the script as root:”

sudo python ~/PumpkinPi/src/pumpkinpi.py &

“Once you are happy everything is running how you want, don’t forget you can run the script at boot time. The easiest way to do this is to use crontab. See this cool video from Estefannie to learn more. But basically you do sudo crontab -e then add the following:”

@reboot /bin/sleep 10 ; /usr/bin/python /home/pi/PumpkinPi/src/pumpkinpi.py &

“Note that we are pausing for 10 seconds before running the Python script. This is to allow the WiFi network to connect before we check on the state of our build.”

“The current version of the pumpkinpi script works with all the SVG files produced by the major hosted build providers, including GitHub Actions, which is free for open source projects. But if you want to improve the code in any way, I’m definitely accepting pull requests on it.”

“Using the same hardware you could monitor lots of different things, such as when someone posts on Twitter, what the weather will be tomorrow, or maybe just code your own unique multi-coloured display that you can leave flickering in your window.”

“If you build this project or create your own pumpkin display, I’d love to see pictures. You can find me on Twitter @martinwoodward and on GitHub.”

The post Pumpkin Pi Build Monitor appeared first on Raspberry Pi.

Cross-account and cross-region deployment using GitHub actions and AWS CDK

Post Syndicated from DAMODAR SHENVI WAGLE original https://aws.amazon.com/blogs/devops/cross-account-and-cross-region-deployment-using-github-actions-and-aws-cdk/

GitHub Actions is a feature on GitHub’s popular development platform that helps you automate your software development workflows in the same place you store code and collaborate on pull requests and issues. You can write individual tasks called actions, and combine them to create a custom workflow. Workflows are custom automated processes that you can set up in your repository to build, test, package, release, or deploy any code project on GitHub.

A cross-account deployment strategy is a CI/CD pattern or model in AWS. In this pattern, you have a designated AWS account called tools, where all CI/CD pipelines reside. Deployment is carried out by these pipelines across other AWS accounts, which may correspond to dev, staging, or prod. For more information about a cross-account strategy in reference to CI/CD pipelines on AWS, see Building a Secure Cross-Account Continuous Delivery Pipeline.

In this post, we show you how to use GitHub Actions to deploy an AWS Lambda-based API to an AWS account and Region using the cross-account deployment strategy.

Using GitHub Actions may have associated costs in addition to the cost associated with the AWS resources you create. For more information, see About billing for GitHub Actions.

Prerequisites

Before proceeding any further, you need to identify and designate two AWS accounts required for the solution to work:

  • Tools – Where you create an AWS Identity and Access Management (IAM) user for GitHub Actions to use to carry out deployment.
  • Target – Where deployment occurs. You can call this as your dev/stage/prod environment.

You also need to create two AWS account profiles in ~/.aws/credentials for the tools and target accounts, if you don’t already have them. These profiles need to have sufficient permissions to run an AWS Cloud Development Kit (AWS CDK) stack. They should be your private profiles and only be used during the course of this use case. So, it should be fine if you want to use admin privileges. Don’t share the profile details, especially if it has admin privileges. I recommend removing the profile when you’re finished with this walkthrough. For more information about creating an AWS account profile, see Configuring the AWS CLI.

Solution overview

You start by building the necessary resources in the tools account (an IAM user with permissions to assume a specific IAM role from the target account to carry out deployment). For simplicity, we refer to this IAM role as the cross-account role, as specified in the architecture diagram.

You also create the cross-account role in the target account that trusts the IAM user in the tools account and provides the required permissions for AWS CDK to bootstrap and initiate creating an AWS CloudFormation deployment stack in the target account. GitHub Actions uses the tools account IAM user credentials to the assume the cross-account role to carry out deployment.

In addition, you create an AWS CloudFormation execution role in the target account, which AWS CloudFormation service assumes in the target account. This role has permissions to create your API resources, such as a Lambda function and Amazon API Gateway, in the target account. This role is passed to AWS CloudFormation service via AWS CDK.

You then configure your tools account IAM user credentials in your Git secrets and define the GitHub Actions workflow, which triggers upon pushing code to a specific branch of the repo. The workflow then assumes the cross-account role and initiates deployment.

The following diagram illustrates the solution architecture and shows AWS resources across the tools and target accounts.

Architecture diagram

Creating an IAM user

You start by creating an IAM user called git-action-deployment-user in the tools account. The user needs to have only programmatic access.

  1. Clone the GitHub repo aws-cross-account-cicd-git-actions-prereq and navigate to folder tools-account. Here you find the JSON parameter file src/cdk-stack-param.json, which contains the parameter CROSS_ACCOUNT_ROLE_ARN, which represents the ARN for the cross-account role we create in the next step in the target account. In the ARN, replace <target-account-id> with the actual account ID for your designated AWS target account.                                             Replace <target-account-id> with designated AWS account id
  2. Run deploy.sh by passing the name of the tools AWS account profile you created earlier. The script compiles the code, builds a package, and uses the AWS CDK CLI to bootstrap and deploy the stack. See the following code:
cd aws-cross-account-cicd-git-actions-prereq/tools-account/
./deploy.sh "<AWS-TOOLS-ACCOUNT-PROFILE-NAME>"

You should now see two stacks in the tools account: CDKToolkit and cf-GitActionDeploymentUserStack. AWS CDK creates the CDKToolkit stack when we bootstrap the AWS CDK app. This creates an Amazon Simple Storage Service (Amazon S3) bucket needed to hold deployment assets such as a CloudFormation template and Lambda code package. cf-GitActionDeploymentUserStack creates the IAM user with permission to assume git-action-cross-account-role (which you create in the next step). On the Outputs tab of the stack, you can find the user access key and the AWS Secrets Manager ARN that holds the user secret. To retrieve the secret, you need to go to Secrets Manager. Record the secret to use later.

Stack that creates IAM user with its secret stored in secrets manager

Creating a cross-account IAM role

In this step, you create two IAM roles in the target account: git-action-cross-account-role and git-action-cf-execution-role.

git-action-cross-account-role provides required deployment-specific permissions to the IAM user you created in the last step. The IAM user in the tools account can assume this role and perform the following tasks:

  • Upload deployment assets such as the CloudFormation template and Lambda code package to a designated S3 bucket via AWS CDK
  • Create a CloudFormation stack that deploys API Gateway and Lambda using AWS CDK

AWS CDK passes git-action-cf-execution-role to AWS CloudFormation to create, update, and delete the CloudFormation stack. It has permissions to create API Gateway and Lambda resources in the target account.

To deploy these two roles using AWS CDK, complete the following steps:

  1. In the already cloned repo from the previous step, navigate to the folder target-account. This folder contains the JSON parameter file cdk-stack-param.json, which contains the parameter TOOLS_ACCOUNT_USER_ARN, which represents the ARN for the IAM user you previously created in the tools account. In the ARN, replace <tools-account-id> with the actual account ID for your designated AWS tools account.                                             Replace <tools-account-id> with designated AWS account id
  2. Run deploy.sh by passing the name of the target AWS account profile you created earlier. The script compiles the code, builds the package, and uses the AWS CDK CLI to bootstrap and deploy the stack. See the following code:
cd ../target-account/
./deploy.sh "<AWS-TARGET-ACCOUNT-PROFILE-NAME>"

You should now see two stacks in your target account: CDKToolkit and cf-CrossAccountRolesStack. AWS CDK creates the CDKToolkit stack when we bootstrap the AWS CDK app. This creates an S3 bucket to hold deployment assets such as the CloudFormation template and Lambda code package. The cf-CrossAccountRolesStack creates the two IAM roles we discussed at the beginning of this step. The IAM role git-action-cross-account-role now has the IAM user added to its trust policy. On the Outputs tab of the stack, you can find these roles’ ARNs. Record these ARNs as you conclude this step.

Stack that creates IAM roles to carry out cross account deployment

Configuring secrets

One of the GitHub actions we use is aws-actions/configure-aws-credentials@v1. This action configures AWS credentials and Region environment variables for use in the GitHub Actions workflow. The AWS CDK CLI detects the environment variables to determine the credentials and Region to use for deployment.

For our cross-account deployment use case, aws-actions/configure-aws-credentials@v1 takes three pieces of sensitive information besides the Region: AWS_ACCESS_KEY_ID, AWS_ACCESS_KEY_SECRET, and CROSS_ACCOUNT_ROLE_TO_ASSUME. Secrets are recommended for storing sensitive pieces of information in the GitHub repo. It keeps the information in an encrypted format. For more information about referencing secrets in the workflow, see Creating and storing encrypted secrets.

Before we continue, you need your own empty GitHub repo to complete this step. Use an existing repo if you have one, or create a new repo. You configure secrets in this repo. In the next section, you check in the code provided by the post to deploy a Lambda-based API CDK stack into this repo.

  1. On the GitHub console, navigate to your repo settings and choose the Secrets tab.
  2. Add a new secret with name as TOOLS_ACCOUNT_ACCESS_KEY_ID.
  3. Copy the access key ID from the output OutGitActionDeploymentUserAccessKey of the stack GitActionDeploymentUserStack in tools account.
  4. Enter the ID in the Value field.                                                                                                                                                                Create secret
  5. Repeat this step to add two more secrets:
    • TOOLS_ACCOUNT_SECRET_ACCESS_KEY (value retrieved from the AWS Secrets Manager in tools account)
    • CROSS_ACCOUNT_ROLE (value copied from the output OutCrossAccountRoleArn of the stack cf-CrossAccountRolesStack in target account)

You should now have three secrets as shown below.

All required git secrets

Deploying with GitHub Actions

As the final step, first clone your empty repo where you set up your secrets. Download and copy the code from the GitHub repo into your empty repo. The folder structure of your repo should mimic the folder structure of source repo. See the following screenshot.

Folder structure of the Lambda API code

We can take a detailed look at the code base. First and foremost, we use Typescript to deploy our Lambda API, so we need an AWS CDK app and AWS CDK stack. The app is defined in app.ts under the repo root folder location. The stack definition is located under the stack-specific folder src/git-action-demo-api-stack. The Lambda code is located under the Lambda-specific folder src/git-action-demo-api-stack/lambda/ git-action-demo-lambda.

We also have a deployment script deploy.sh, which compiles the app and Lambda code, packages the Lambda code into a .zip file, bootstraps the app by copying the assets to an S3 bucket, and deploys the stack. To deploy the stack, AWS CDK has to pass CFN_EXECUTION_ROLE to AWS CloudFormation; this role is configured in src/params/cdk-stack-param.json. Replace <target-account-id> with your own designated AWS target account ID.

Update cdk-stack-param.json in git-actions-cross-account-cicd repo with TARGET account id

Finally, we define the Git Actions workflow under the .github/workflows/ folder per the specifications defined by GitHub Actions. GitHub Actions automatically identifies the workflow in this location and triggers it if conditions match. Our workflow .yml file is named in the format cicd-workflow-<region>.yml, where <region> in the file name identifies the deployment Region in the target account. In our use case, we use us-east-1 and us-west-2, which is also defined as an environment variable in the workflow.

The GitHub Actions workflow has a standard hierarchy. The workflow is a collection of jobs, which are collections of one or more steps. Each job runs on a virtual machine called a runner, which can either be GitHub-hosted or self-hosted. We use the GitHub-hosted runner ubuntu-latest because it works well for our use case. For more information about GitHub-hosted runners, see Virtual environments for GitHub-hosted runners. For more information about the software preinstalled on GitHub-hosted runners, see Software installed on GitHub-hosted runners.

The workflow also has a trigger condition specified at the top. You can schedule the trigger based on the cron settings or trigger it upon code pushed to a specific branch in the repo. See the following code:

name: Lambda API CICD Workflow
# This workflow is triggered on pushes to the repository branch master.
on:
  push:
    branches:
      - master

# Initializes environment variables for the workflow
env:
  REGION: us-east-1 # Deployment Region

jobs:
  deploy:
    name: Build And Deploy
    # This job runs on Linux
    runs-on: ubuntu-latest
    steps:
      # Checkout code from git repo branch configured above, under folder $GITHUB_WORKSPACE.
      - name: Checkout
        uses: actions/checkout@v2
      # Sets up AWS profile.
      - name: Configure AWS credentials
        uses: aws-actions/configure-aws-credentials@v1
        with:
          aws-access-key-id: ${{ secrets.TOOLS_ACCOUNT_ACCESS_KEY_ID }}
          aws-secret-access-key: ${{ secrets.TOOLS_ACCOUNT_SECRET_ACCESS_KEY }}
          aws-region: ${{ env.REGION }}
          role-to-assume: ${{ secrets.CROSS_ACCOUNT_ROLE }}
          role-duration-seconds: 1200
          role-session-name: GitActionDeploymentSession
      # Installs CDK and other prerequisites
      - name: Prerequisite Installation
        run: |
          sudo npm install -g [email protected]
          cdk --version
          aws s3 ls
      # Build and Deploy CDK application
      - name: Build & Deploy
        run: |
          cd $GITHUB_WORKSPACE
          ls -a
          chmod 700 deploy.sh
          ./deploy.sh

For more information about triggering workflows, see Triggering a workflow with events.

We have configured a single job workflow for our use case that runs on ubuntu-latest and is triggered upon a code push to the master branch. When you create an empty repo, master branch becomes the default branch. The workflow has four steps:

  1. Check out the code from the repo, for which we use a standard Git action actions/checkout@v2. The code is checked out into a folder defined by the variable $GITHUB_WORKSPACE, so it becomes the root location of our code.
  2. Configure AWS credentials using aws-actions/configure-aws-credentials@v1. This action is configured as explained in the previous section.
  3. Install your prerequisites. In our use case, the only prerequisite we need is AWS CDK. Upon installing AWS CDK, we can do a quick test using the AWS Command Line Interface (AWS CLI) command aws s3 ls. If cross-account access was successfully established in the previous step of the workflow, this command should return a list of buckets in the target account.
  4. Navigate to root location of the code $GITHUB_WORKSPACE and run the deploy.sh script.

You can check in the code into the master branch of your repo. This should trigger the workflow, which you can monitor on the Actions tab of your repo. The commit message you provide is displayed for the respective run of the workflow.

Workflow for region us-east-1 Workflow for region us-west-2

You can choose the workflow link and monitor the log for each individual step of the workflow.

Git action workflow steps

In the target account, you should now see the CloudFormation stack cf-GitActionDemoApiStack in us-east-1 and us-west-2.

Lambda API stack in us-east-1 Lambda API stack in us-west-2

The API resource URL DocUploadRestApiResourceUrl is located on the Outputs tab of the stack. You can invoke your API by choosing this URL on the browser.

API Invocation Output

Clean up

To remove all the resources from the target and tools accounts, complete the following steps in their given order:

  1. Delete the CloudFormation stack cf-GitActionDemoApiStack from the target account. This step removes the Lambda and API Gateway resources and their associated IAM roles.
  2. Delete the CloudFormation stack cf-CrossAccountRolesStack from the target account. This removes the cross-account role and CloudFormation execution role you created.
  3. Go to the CDKToolkit stack in the target account and note the BucketName on the Output tab. Empty that bucket and then delete the stack.
  4. Delete the CloudFormation stack cf-GitActionDeploymentUserStack from tools account. This removes cross-account-deploy-user IAM user.
  5. Go to the CDKToolkit stack in the tools account and note the BucketName on the Output tab. Empty that bucket and then delete the stack.

Security considerations

Cross-account IAM roles are very powerful and need to be handled carefully. For this post, we strictly limited the cross-account IAM role to specific Amazon S3 and CloudFormation permissions. This makes sure that the cross-account role can only do those things. The actual creation of Lambda, API Gateway, and Amazon DynamoDB resources happens via the AWS CloudFormation IAM role, which AWS  CloudFormation assumes in the target AWS account.

Make sure that you use secrets to store your sensitive workflow configurations, as specified in the section Configuring secrets.

Conclusion

In this post we showed how you can leverage GitHub’s popular software development platform to securely deploy to AWS accounts and Regions using GitHub actions and AWS CDK.

Build your own GitHub Actions CI/CD workflow as shown in this post.

About the author


Damodar Shenvi Wagle is a Cloud Application Architect at AWS Professional Services. His areas of expertise include architecting serverless solutions, ci/cd and automation.