Post Syndicated from Explosm.net original https://explosm.net/comics/long-face
New Cyanide and Happiness Comic
Post Syndicated from Explosm.net original https://explosm.net/comics/long-face
New Cyanide and Happiness Comic
Post Syndicated from Eric Smith original https://www.servethehome.com/samsung-t7-2tb-usb-type-c-ssd-review/
In our Samsung T7 review, we see how this 2TB external USB Type-C SSD performs compared to its 10Gbps competition
The post Samsung T7 2TB USB Type-C SSD Review appeared first on ServeTheHome.
Post Syndicated from The History Guy: History Deserves to Be Remembered original https://www.youtube.com/watch?v=KJeVWtGekDY
Post Syndicated from Oglaf! -- Comics. Often dirty. original https://www.oglaf.com/foundering/


Post Syndicated from BeardedTinker original https://www.youtube.com/watch?v=d411Yry9TBg
Post Syndicated from Techmoan original https://www.youtube.com/watch?v=d38vzTbevAg
Post Syndicated from Светла Енчева original https://www.toest.bg/siedmitsata-5-10-may/

Католическият свят си има нов папа – Лъв XIV. И всички се радват. Тръмпистите – че той е американец, един вид, техен човек. Останалите – че макар и американец, доскорошният кардинал Робърт Превост никак не прилича на Тръмп, а възгледите му го сродяват по-скоро с предшественика му – папа Франциск.
И докато във Ватикана се показва дим само при избора на нов предводител на Католическата църква, в България димките за отвличане на вниманието са обичайна практика. Една от актуалните е заявката на МОН, че няма всички ученици задължително да учат православие, а ще могат да избират между него, ислям и светски добродетели.
На практика обаче, за да се изучава един задължителноизбираем предмет, за него трябва да се съберат повече от 10 ученици. Силно вероятно е върху училищата да се упражнява натиск да се предлага приоритетно православието – и защото такава е политическата воля, и защото повечето учители членуват в синдиката на Янка Такева, която много държи на задължителното въвеждане на религията в училище. И родителите ще са карани да подписват, че искат религия, с аргументи като например, че няма достатъчно учители, за да се предлагат алтернативни варианти.
Чудя се обаче: ако в един клас има 20 мюсюлманчета и 2 православни християнчета, християнчетата ислям ли ще трябва да учат? Или не е политкоректно да си задавам такива въпроси?
За политкоректността по български е и новата статия на Александър Драганов. Той повдига въпроса за привилегиите в България, които свързва с бившата социалистическа номенклатура – със зъби и нокти тя се опитва да се консервира, тоест да запази позициите си и да облагодетелства наследниците си. Александър смята, че този проблем трябва да се реши, преди да стигнем до въпросите за расата и пола.
Проблемите с расата и пола в България обаче не стоят на пауза, докато останките от номенклатурата не се изпарят в небитието на някое хипотетично бъдеще. Затова в „Тоест“ ги държим под око. След събарянето на къщите в „Захарна фабрика“ и оставянето на около 200 души на улицата обръщаме специално внимание на ромските гета и тази седмица имаме две публикации по темата.
„Изоставеното наследство. Защо България не може да продължи да пренебрегва правото на дом“ е статията на Сара Перин, изпълнителна директорка на „Тръст за социална алтернатива“. Тя анализира историческия генезис на сегрегацията на ромите още от 50-те години на XX в. и дава предложения за адекватна жилищна политика, която не дискриминира и не създава бездомници.
Ина Иванова пък разговаря с живеещия във Франция Абдулсамед Вели, който е главен редактор на „Филибелии“ – онлайн медията на пловдивския квартал „Столипиново“. Може би и вие като мен тепърва научавате, че има такъв уебсайт. А него не само го има, ами е достъпен на цели осем езика – български, английски, френски, немски, италиански, руски, испански и турски. Не се сещам за друга българска онлайн медия, която може да се похвали с такова нещо.
Междувременно на първия тур на президентските избори в съседна Румъния пропутинският кандидат Джордже Симион излезе начело с убедителна преднина. Емилия Милчева разсъждава по темата какво ще стане, ако български Симион се яви на бял кон на президентските избори догодина. Докато националната ни сигурност се занимава с частни поръчки, няма причина това да не се случи.
Или чакайте – ние български Симион нямаме ли си вече? Или по-скоро Симион е румънски Радев? Ами ето – българският президент реши да отбележи Деня на Европа, като… инициира референдум срещу еврото. Подходящо, а?
Но да си проветрим душите с малко култура. В рубриката „На второ четене“ Стефан Иванов ни припомня три книги на български автори – „Дървета за прегръщане“ от Цветелина Александрова, „Това е краят на света и се чувствам добре“ от Стефан Касев и „Инструкции за направа на тигър“ от Георги Анев. Не бих могла да резюмирам статията на Стефан по-добре от самия него:
„Три начина да се сглоби фигурата на отчуждения, влюбен, вътрешно разкъсан човек. Александрова пише, сякаш гледа през прозореца с мокра чаша в ръка. Касев пише с кал по обувките и с вътрешен глас, който се пита: „Защо?“ Анев по-скоро реже месо от съвременността с хирургическа насмешка.“
Като стана дума за хирургическа насмешка, веднага се сещам за Елена Телбис. „Ние отдавна сме хвърлени в бездната, следователно не можем да бъдем хвърлени някъде, където вече сме“, казва тя в епизод 13 на „Т.Е. от Е.Т.“:
Дойде време за препоръката ми. Този път тя е за изложба.
Мартин Атанасов е много интересен визуален артист, който умее да пресъздава смисъл чрез детайли от изображения. Такава е и новата му изложба, която може да срещнете под имената „Чупливи очертания“ или „Крехки очертания“ (Fragile Outlines на английски). В нея той изследва телата на куиър хората, които се чувстват не на място в света, защото той сякаш не е предназначен за тях.
Изложбата е в галерия „Октопод“ в подлеза на „Сердика“. В нея се влиза през една малка врата при изхода към бул. „Дондуков“, която е много лесно да не се забележи.
Приятно четене и гледане! А ние сме горди, че съществуваме благодарение на вашата подкрепа.
Post Syndicated from Will Taillac original https://www.servethehome.com/supermicro-h13sae-mf-amd-epyc-4000-motherboard-review/
In our Supermicro H13SAE-MF review, we see how this AMD EPYC 4000 series motherboard performs, covering both server and workstation use cases
The post Supermicro H13SAE-MF AMD EPYC 4000 Motherboard Review appeared first on ServeTheHome.
Post Syndicated from Explosm.net original https://explosm.net/comics/pour-one-out
New Cyanide and Happiness Comic
Post Syndicated from The History Guy: History Deserves to Be Remembered original https://www.youtube.com/watch?v=Tup3UZq8hhc
Post Syndicated from Bruce Schneier original https://www.schneier.com/blog/archives/2025/05/friday-squid-blogging-japanese-divers-video-giant-squid.html
The video is really amazing.
As usual, you can also use this squid post to talk about the security stories in the news that I haven’t covered.
Post Syndicated from Netflix Technology Blog original https://netflixtechblog.com/behind-the-scenes-building-a-robust-ads-event-processing-pipeline-e4e86caf9249
In a digital advertising platform, a robust feedback system is essential for the lifecycle and success of an ad campaign. This system comprises of diverse sub-systems designed to monitor, measure, and optimize ad campaigns. At Netflix, we embarked on a journey to build a robust event processing platform that not only meets the current demands but also scales for future needs. This blog post delves into the architectural evolution and technical decisions that underpin our Ads event processing pipeline.
Ad serving acts like the “brain” — making decisions, optimizing delivery and ensuring right Ad is shown to the right member at the right time. Meanwhile, ad events, after an Ad is rendered, function like “heartbeats”, continuously providing real-time feedback (oxygen/nutrients) that fuels better decision-making, optimizations, reporting, measurement, and billing. Expanding on this analogy:
Let’s dive into the journey of building this pipeline.
In November 2022, we launched a brand new basic ads plan, in partnership with Microsoft. The software systems extended the existing Netflix playback systems to play ads. Initially, the system was designed to be simple, secure, and efficient, with an underlying ethos of device-originated and server-proxied operations. The system consisted of three main components: the Microsoft Ad Server, Netflix Ads Manager, and Ad Event Handler. Each ad served required tracking to ensure the feedback loop functioned effectively, providing the external ad server with insights on impressions, frequency capping (advertiser policy that limits the number of times a user sees a specific ad), and monetization processes.
Key features of this system include:
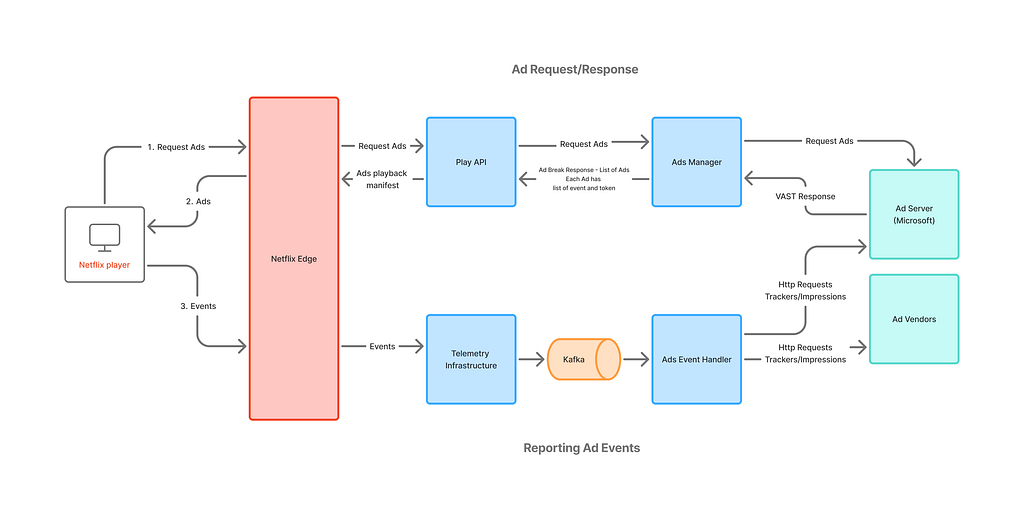
There is an excellent prior blog post that explains how this systems was tested end-to-end at scale. This system design allowed us to quickly add new integrations for verification with vendors like DV, IAS and Nielsen for measurement.
As we continued to expand our third-party (3P) advertising vendors for measurement, tracking and verification, we identified a critical trend: growth in the volume of data encapsulated within opaque tokens. These tokens, which are cached on client devices, present a risk of elevated memory usage, potentially impacting device performance. We also anticipated increase in third-party tracking URLs, metadata needs, and more event types as our business added new capabilities.
To strategically address these challenges, we introduced a new persistence layer using Key-Value abstraction, between ad serving and event handling system: Ads Metadata Registry. This transient storage service stores metadata for each Ad served, and upon callback, event handler would read the tracking information to relay information to the vendors. The contract between the client device and Ads systems continues to use the opaque token per event, but now, instead of tracking information, it contains reference identifiers — Ad ID, the corresponding metadata record ID in the registry and the event name. This approach future proofed our systems to handle any growth in data that needs to pass from ad serving to event handling systems.

In January of 2024, we decided to invest in in-house advertising technology platform. This implied that the event processing pipeline had to evolve significantly — attain parity with existing offerings and continue to support new product launches with rapid iterations using in-house Netflix Ad Server. This required re-evaluation of the entire architecture across all of Ads engineering teams.
First, we made an inventory of the use-cases that would need to be supported through ad events.
Next, we examined upcoming launches, such as Pause/Display ads, to gain deeper insights into our strategic initiatives. We recognized that Display Ads would utilize a distinct logging framework, suggesting that different upstream pipelines might deliver ad telemetry. However, the downstream use-cases were expected to remain largely consistent. Additionally, by reviewing the goals of our telemetry teams, we saw large initiatives aimed at upgrading the platform, indicating potential future migrations.
Keeping the above insights & challenges in mind,
Putting together all the components in our vision –
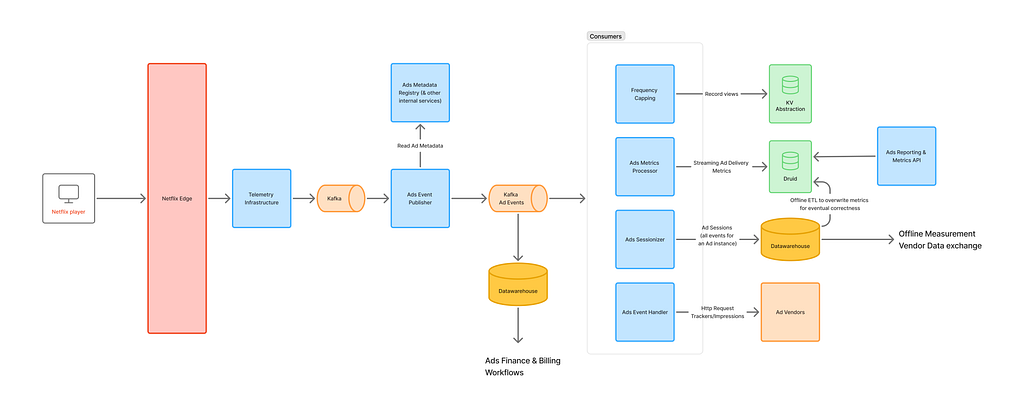
Key components on event processing pipeline –
Ads Event Publisher: This centralized system is responsible for collecting ads telemetry and providing unified ad events to the ads engineering teams. It supports various functions such as measurement, finance/billing, reporting, frequency capping, and maintaining an essential feedback loop back to the ad server.
Realtime Consumers
Billing/Revenue: These are offline workflows designed to curate impressions, supporting billing and revenue recognition processes.
Ads Reporting & Metrics: This service powers reporting module for our account managers and provides a centralized metrics API that help assess the delivery of a campaign.
This was a massive multi-quarter effort across different engineering teams. With extensive planning (kudos to our TPM team!) and coordination, we were able to iterate fast, build several services and execute the vision above, to power our in-house ads technology platform.
These systems have significantly accelerated our ability to launch new capabilities for the business.
Key Takeways
We have an exciting list of projects on the horizon. These include managing ad events from ads on Netflix live streams, de-duplication processes, and enriching data signals to deliver enhanced reporting and insights. Additionally, we are advancing our Native Ads strategy, integrating Conversion API for improved conversion tracking, among many others.
This is definitely not a season finale; it’s just the beginning of our journey to create a best-in-class ads technology platform. We warmly invite you to share your thoughts and comments with us. If you’re interested in learning more or becoming a part of this innovative journey, Ads Engineering is hiring!
A special thanks to our amazing colleagues and teams who helped build our foundational post-impression system: Simon Spencer, Priyankaa Vijayakumar, Indrajit Roy Choudhury; Ads TPM team — Sonya Bellamy; the Ad Serving Team — Andrew Sweeney, Tim Zheng, Haidong Tang and Ed Barker; the Ads Data Engineering Team — Sonali Sharma, Harsha Arepalli, and Wini Tran; Product Data Systems — David Klosowski; and the entire Ads Reporting and Measurement team!

Behind the Scenes: Building a Robust Ads Event Processing Pipeline was originally published in Netflix TechBlog on Medium, where people are continuing the conversation by highlighting and responding to this story.
Post Syndicated from Aarthi Srinivasan original https://aws.amazon.com/blogs/big-data/configure-cross-account-access-of-amazon-sagemaker-lakehouse-multi-catalog-tables-using-aws-glue-5-0-spark/
Many organizations build and operate enterprise-wide data mesh architectures using the AWS Glue Data Catalog and AWS Lake Formation for their Amazon Simple Storage Service (Amazon S3) based data lakes. Now, with Amazon SageMaker Lakehouse, these organizations can unify their data analytics and AI/ML workflows while maintaining secure cross-account access without data replication. By centralizing access to a single copy of data and using the secure fine-grained permissions of Lake Formation, enterprises can accelerate their analytics initiatives while reducing operational complexity across business units.
SageMaker Lakehouse organizes data using logical containers called catalogs, enabling teams to seamlessly query and analyze data across their entire ecosystem—from S3 data lakes to Amazon Redshift warehouses—using familiar Apache Iceberg compatible tools. Organizations can either mount their existing data warehouse to the lakehouse or create new catalogs using Amazon Redshift managed storage. Built-in zero-ETL connectors reduce data silos by integrating various data sources, enabling unified analytics across teams. This seamless integration particularly benefits existing AWS customers who already use the Data Catalog and Lake Formation, because they can immediately take advantage of SageMaker Lakehouse capabilities.
AWS Glue is a serverless service that makes data integration simpler, faster, and cheaper. We launched AWS Glue 5.0 with upgraded Apache Spark 3.5.4 and Python 3.11. AWS Glue 5.0 adds support for SageMaker Lakehouse to unify your data across S3 data lakes and Redshift data warehouses.
In our previous blog post, we demonstrated the process of creating tables in both the Amazon Redshift managed catalog and Amazon Redshift federated catalog within a single AWS account. In this post, we show you how to share a Redshift table and Amazon S3 based Iceberg table from the account that owns the data to another account that consumes the data. In the recipient account, we run a join query on the shared data lake and data warehouse tables using Spark in AWS Glue 5.0. We walk you through the complete cross-account setup and provide the Spark configuration in a Python notebook.
To demonstrate the functionality of SageMaker Lakehouse multi-catalog tables using AWS Glue 5.0 Spark, let’s assume the retail company Example Retail Corp launches a campaign to understand their market and drive growth by country of operation. Their infrastructure consists of a Redshift data warehouse for structured data and an S3 data lake for structured and semi-structured data. The marketing team realizes that customer data is spread across those two systems and wants to use the support of their data engineering and analysts to analyze and provide insights. As a company, they prefer unified governance for managing data access while enabling a secure sharing mechanism for business and engineering teams.
Let’s see how they can achieve the goal using SageMaker Lakehouse. The solution is represented in the following diagram.

The setup could be extended to enterprise data meshes where a data producer account will own the Redshift clusters, catalog the tables in a central governance account, and share with any number of consumer accounts from the central account. Multiple consumer accounts could analyze the shared Redshift tables using the SageMaker Lakehouse integrated analytics engines.
The solution also works for cross-Region table access. You would create a resource link for the catalog tables in an AWS Region where you want to run your analyses and create dashboards. For cross-Region resource link setup, refer to Setting up cross-Region table access.
To implement this solution, you need the following prerequisites:
LakeFormationS3Registration_custom, in the producer account to register your Iceberg table’s Amazon S3 location with Lake Formation. For details, refer to Registering an Amazon S3 location and Requirements for roles used to register locations.customerdb.returnstbl_iceberg in your default catalog and ordersdb.orderstbl in your Redshift Serverless application default namespace.Glue-execution-role, in the consumer account, with the following policies:
AWSGlueServiceRole and AmazonRedshiftDataFullAccess.Glue-execution-role, allowing AWS Glue to assume this role:
For the producer account setup, you can either use your IAM administrator role added as Lake Formation administrator or use a Lake Formation administrator role with permissions added as discussed in the prerequisites. For illustration purposes, we use the IAM admin role Admin added as Lake Formation administrator.

Complete the following steps to set up your catalog:
Admin.
redshiftserverless1-uswest2).
Admin user Super user permissions for Catalog permissions and Grantable permissions.


Wait a few seconds for the catalog to show up.
redshiftserverless1-uswest2 catalog is created.
ordersdb.public database.
orderstbl table shows up.
As the Admin role, you can also query the orderstbl in Amazon Athena and confirm the data is available.

In this step, we share the Amazon Redshift federated catalog database redshiftserverless1-uswest2:ordersdb.public and table orderstbl as well as the Amazon S3 based Iceberg table returnstbl_iceberg and its database customerdb from the default catalog to the consumer account. We can’t share the entire catalog to external accounts as a catalog-level permission; we just share the database and table.

customerdb.

returnstbl_iceberg.ordertbl table of the federated catalog database redshiftserverless1-uswest2/ordersdb.The following screenshots show the configuration for database-level permissions.


The following screenshots show the configuration for table-level permissions.


orderstbl from the federated catalog and returnstbl_iceberg from the default catalog.
In this step, we register the Amazon S3 based Iceberg table returnstbl_iceberg data location with Lake Formation to be managed by Lake Formation permissions. Complete the following steps:

returnstbl_iceberg.LakeFormationS3Registration_custom that you created as a prerequisite.

With this step, the producer account setup is complete.
For the consumer account setup, we use the IAM admin role Admin, added as a Lake Formation administrator.
The steps in the consumer account are quite involved. In the consumer account, a Lake Formation administrator will accept the AWS Resource Access Manager (AWS RAM) shares and create the required resource links that point to the shared catalog, database, and tables. The Lake Formation admin verifies that the shared resources are accessible by running test queries in Athena. The admin further grants permissions to the role Glue-execution-role on the resource links, database, and tables. The admin then runs a join query in AWS Glue 5.0 Spark using Glue-execution-role.
Lake Formation uses AWS RAM shares to enable cross-account sharing with Data Catalog resource policies in the AWS RAM policies. To view and verify the shared resources from producer account, complete the following steps:
us-west-2.
redshiftserverless1-uswest2, the default catalog database customerdb, the table returnstbl_iceberg, and the producer account ID under Owner ID column display correctly.
customerdb and public databases. You can further select each database and choose View tables on the Actions dropdown menu and verify the table names
You will not see an AWS RAM share invite for the catalog level on the Lake Formation console, because catalog-level sharing isn’t possible. You can review the shared federated catalog and Amazon Redshift managed catalog names on the AWS RAM console, or using the AWS Command Line Interface (AWS CLI) or SDK.
A catalog link container is a Data Catalog object that references a local or cross-account federated database-level catalog from other AWS accounts. For more details, refer to Accessing a shared federated catalog. Catalog link containers are essentially Lake Formation resource links at the catalog level that reference or point to a Redshift cluster federated catalog or Amazon Redshift managed catalog object from other accounts.
In the following steps, we create a catalog link container that points to the producer shared federated catalog redshiftserverless1-uswest2. Inside the catalog link container, we create a database. Inside the database, we create a resource link for the table that points to the shared federated catalog table <<producer account id>>:redshiftserverless1-uswest2/ordersdb.public.orderstbl.

rl_link_container_ordersdb).arn:aws:glue:us-west-2:<<producer account id>>:catalog/redshiftserverless1-uswest2/ordersdb).
Admin user Super user permissions for Catalog permissions and Grantable permissions.
Wait a few seconds for the catalog to show up.

rl_link_container_ordersdb is created.
Complete the following steps:
rl_link_container_ordersdb.Alternatively, you can choose the Create dropdown menu and then choose Database.
public_db).rl_link_container_ordersdb.
public_db is created under rl_link_container_ordersdb.
A resource link to a shared federated catalog table can reside only inside the database of a catalog link container. A resource link for such tables will not work if created inside the default catalog. For more details on resource links, refer to Creating a resource link to a shared Data Catalog table.
Complete the following steps to create a table resource link:

rl_orderstbl).rl_link_container_ordersdb.public_db.orderstbl.
rl_orderstbl is created under public_db, inside rl_link_container_ordersdb.

Now we create a database resource link in the default catalog to query the Amazon S3 based Iceberg table shared from the producer. For details on database resource links, refer Creating a resource link to a shared Data Catalog database.
Though we are able to see the shared database in the default catalog of the consumer, a resource link is required to query from analytics engines, such as Athena, Amazon EMR, and AWS Glue. When using AWS Glue with Lake Formation tables, the resource link needs to be named identically to the source account’s resource. For additional details on using AWS Glue with Lake Formation, refer to Considerations and limitations.
Complete the following steps to create a database resource link:
customerdb.You should see the shared database name customerdb with the Owner account ID as that of your producer account ID.
customerdb, and on the Create dropdown menu, choose Resource link.customerdb).customerdb is created under the default catalog. Resource link names will show in italicized font.
Now you can verify your access using Athena. Complete the following steps:

This verifies the new capability of SageMaker Lakehouse, which enables accessing Redshift cluster tables and Amazon S3 based Iceberg tables in the same query, across AWS accounts, through the Data Catalog, using Lake Formation permissions.
Now we will share the resources from the producer account with additional IAM principals in the consumer account. Usually, the data lake admin grants permissions to data analysts, data scientists, and data engineers in the consumer account to do their job functions, such as processing and analyzing the data.
We set up Lake Formation permissions on the catalog link container, databases, tables, and resource links to the AWS Glue job execution role Glue-execution-role that we created in the prerequisites.
Resource links allow only Describe and Drop permissions. You need to use the Grant on target configuration to provide database Describe and table Select permissions.
Complete the following steps:
Glue-execution-role.rl_link_container_ordersdb and the consumer account ID, which indicates the default catalog.

rl_link_container_ordersdb:
public_db.rl_link_container_ordersdb and public_db, on the Tables dropdown menu, choose rl_orderstbl.
Glue-execution-role.
public and customerdb.customerdb.returnstbl_iceberg and orderstbl.The following screenshots show the configuration for database public and customerdb permissions.


The following screenshots show the configuration for resource link customerdb permissions.


The following screenshots show the configuration for table returnstbl_iceberg permissions.


The following screenshots show the configuration for table orderstbl permissions.


Glue-execution-role.
Download the PySpark script LakeHouseGlueSparkJob.py. This AWS Glue PySpark script runs Spark SQL by joining the producer shared federated orderstbl table and Amazon S3 based returns table in the consumer account to analyze the data and identify the total orders placed per market.
Replace <<consumer_account_id>> in the script with your consumer account ID. Complete the following steps to create and run an AWS Glue job:

LakeHouseGlueSparkJob).Glue-execution-role. --datalake-formats = iceberg and --enable-lakeformation-fine-grained-access = true.

To avoid incurring costs on your AWS accounts, clean up the resources you created:
In this post, we illustrated how to bring your existing Redshift tables to SageMaker Lakehouse and share them securely with external AWS accounts. We also showed how to query the shared data warehouse and data lakehouse tables in the same Spark session, from a recipient account, using Spark in AWS Glue 5.0.
We hope you find this useful to integrate your Redshift tables with an existing data mesh and access the tables using AWS Glue Spark. Test this solution in your accounts and share feedback in the comments section. Stay tuned for more updates and feel free to explore the features of SageMaker Lakehouse and AWS Glue versions.
Complete the following steps to create a returns table in the Amazon S3 based default catalog and an orders table in Amazon Redshift:


ordersdb and table orderstbl in it. Copy the data from your S3 location of the orders data to the orderstbl: Aarthi Srinivasan is a Senior Big Data Architect with Amazon SageMaker Lakehouse. She collaborates with the service team to enhance product features, works with AWS customers and partners to architect lakehouse solutions, and establishes best practices for data governance.
 Subhasis Sarkar is a Senior Data Engineer with Amazon. Subhasis thrives on solving complex technological challenges with innovative solutions. He specializes in AWS data architectures, particularly data mesh implementations using AWS CDK components.
Post Syndicated from Brendan Watters original https://blog.rapid7.com/2025/05/09/metasploit-wrap-up-05-09-2025/

This release features a new OPNSense login scanner, a module targeting the Sante PACS path traversal vulnerability, an additional method for stealing Network Access Account credentials via SMB to HTTP relay, and the Erlang/OTP SSH exploit everyone was excited about.
Authors: Michael Heinzl and Tenable
Type: Auxiliary
Pull request: #20124 contributed by h4x-x0r
Path: gather/pacsserver_traversal
AttackerKB reference: CVE-2025-2264
Description: This adds an auxiliary module for CVE-2025-2264. The vulnerability is present in Sante PACS Server and allows an attacker to perform path traversal to read arbitrary files.
Author: sjanusz-r7
Type: Auxiliary
Pull request: #19992 contributed by sjanusz-r7
Path: scanner/http/opnsense_login
Description: This adds a login scanner module for OPNSense.
Authors: jheysel-r7, skelsec, smashery, and xpn
Type: Auxiliary
Pull request: #19952 contributed by jheysel-r7
Path: server/relay/relay_get_naa_credentials
Description: This adds a new module for obtaining NAA credentials from SCCM by authenticating through a relayed SMB connection.
Authors: Horizon3 Attack Team, Martin Kristiansen, Matt Keeley, and mekhalleh (RAMELLA Sebastien)
Type: Exploit
Pull request: #20060 contributed by mekhalleh
Path: linux/ssh/ssh_erlangotp_rce
AttackerKB reference: CVE-2025-32433
Description: This adds a module which exploits CVE-2025-32433, a pre-authentication vulnerability in Erlang-based SSH servers
that allows for remote command execution as the root user. By sending crafted SSH packets, it executes a Metasploit payload to establish a session on the target system.
SSLKeyLogFile option, which facilitates decrypting messages exchanged by TLS. This can be used in diagnostic and logging tools that use this file – such as Wireshark.msfconsole when run with the default options by not sorting module options at load time.You can find the latest Metasploit documentation on our docsite at docs.metasploit.com.
Post Syndicated from Jan Maarten original https://github.blog/engineering/user-experience/design-system-annotations-part-2-advanced-methods-of-annotating-components/
In part one of our design system annotation series, we discussed the ways in which accessibility can get left out of design system components from one instance to another. Our solution? Using a set of “Preset annotations” for each component with Primer. This allows designers to include specific pre-set details that aren’t already built into the component and visually communicated in the design itself.
That being said, Preset annotations are unique to each design system — and while ours may be a helpful reference for how to build them — they’re not something other organizations can utilize if you’re not also using the Primer design system.
Luckily, you can build your own. Here’s how.
Start by assessing components to understand which ones would need Preset annotations—not all of them will. Prioritize components that would benefit most from having a Preset annotation, and build that key information into each one. Next, determine what properties should be included. Only include key information that isn’t conveyed visually, isn’t in the component properties, and isn’t already baked into a coded component.

When a design system has 60+ components, knowing where to start can be a challenge. Which components need these annotations the most? Which ones would have the highest impact for both design teams and our users?
When we set out to create a new set of Preset annotations based on our proof of concept, we decided to use ten Primer components that would benefit the most. To help pick them, we used an internal tool called Primer Query that tracks all component implementations across the GitHub codebase as well as any audit issues connected to them. Here is a video breakdown of how it works, if you’re curious.
We then prioritized new Preset annotations based on the following criteria:
For each component, we cross-referenced multiple sources to figure out what component properties and attributes would need to be added in each Preset annotation. The things we were looking for may only exist in one or two of those places, and thus are less likely to be accounted for all the way through the design and development lifecycle. The sources include:
Design system docs should contain usage guidance for designers and developers, and accessibility requirements should be a part of this guidance as well. Some of the guidance and requirements get built into the component’s Figma asset, while some only end up in the coded component.
Look for any accessibility requirements that are not built into either Figma or code. If it’s built in, putting the same info in the Preset annotation may be redundant or irrelevant.
Our component sandbox helped us see how each component is built in React or Rails, as well as what the HTML output is. We looked for any code structure or accessibility attributes that are not included in the component documentation or the Figma asset itself—especially when they may vary from one implementation to another.
Library assets provide a lot of flexibility through text layers, image fills, variants, and elaborate sets of component properties. We paid close attention to these options to understand what designers can and can’t change. Worthwhile additions to a Preset Annotation are accessibility attributes, requirements, and usage guidance in other sources that aren’t built into the Figma component.
Preset annotations may not be for every team or organization. However, they are especially well suited for younger design systems and those that aren’t well adopted.
Mature design systems like Primer have frequent updates. This means that without close monitoring, the design system components themselves may fall out of sync with how a Preset annotation is built. This can end up causing confusion and rework after development starts, so it may be wise to make sure there’s some capacity to maintain these annotations after they’ve been created.
For newer teams at GitHub, new members of existing teams, and team members who were less familiar with the design system, the built-in guidance and links to documentation and component demos proved very useful. Those who are more experienced are also able to fine-tune the Presets and how they’re used.
If you don’t already have extensive experience with the design system components (or peers to help build them), it can take a lot of time to assess and map out the properties needed to build a Preset. It can also be challenging to name a component property succinctly enough that it doesn’t get truncated in Figma’s properties panel. If the context is not self-evident, some training or additional documentation may help.
There may be enough overlap between the Preset annotation for a component and types of annotations that aren’t specific to the design system.
For example, the GitHub Annotation Toolkit has components to annotate basic <textarea> form elements in addition to a Preset annotation for our <TextArea> Primer component:
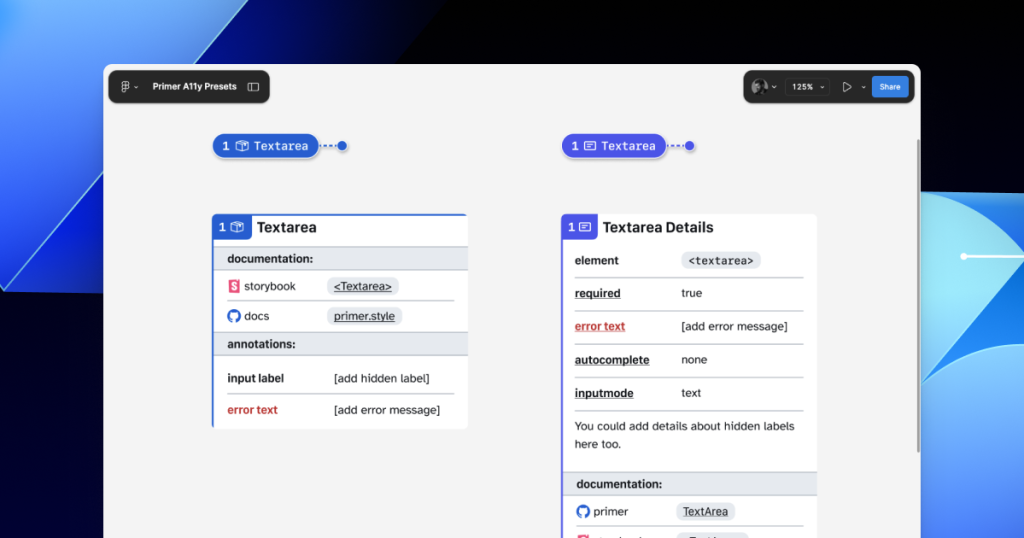
In many instances, this flexibility may be confusing because you could use either annotation. For example, the Primer <TextArea> Preset has built-in links to specific Primer docs, and while the non-Preset version doesn’t, you could always add the links manually. While there’s some overlap between the two, using either one is better than none.
One way around this confusion is to add Primer-specific properties to the default set of annotations. This would allow you to do things like toggle a boolean property on a normal Button annotation and have it show links and properties specific to your design system’s button component.
There are currently a number of existing Figma plugins that advertise the ability to scan a design file to help with annotations. That being said, the results are often mixed and contain an unmanageable amount of noise and false positives. One of the reasons these issues happen is that these public plugins are design system agnostic.
Current automated annotation tools aren’t able to understand that any design system components are being used without bespoke programming or thorough training of AI models. For plugins like this to be able to label design elements accurately, they first need to understand how to identify the components on the canvas, the variants used, and the set properties.
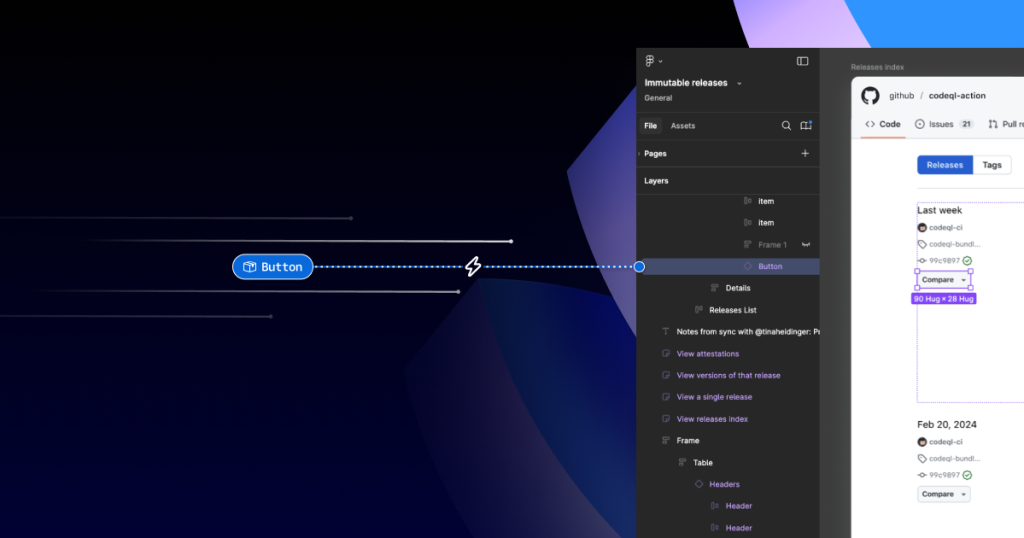
With that in mind, perhaps the most exciting insight is that the process of mapping out component properties for a Preset annotation—the things that don’t get conveyed in the visual design or in the code—is also something that would need to be done in any attempt to automate more usable annotations.
In other words, if a team uses a design system and wants to automate adding annotations, the tool they use would need to understand their components. In order for it to understand their components well enough to automate accurately, these hidden component properties would need to be mapped out. The task of creating a set of Preset annotations may be a vital stepping stone to something even more streamlined.
While building our new set of Preset annotations, we experimented with other ways to enhance Primer with annotations. Though not all of those experiments worked out, one of them did: adding accessibility attributes through Code Connect.
Primer was one of the early adopters of Figma’s new Code Connect feature in Dev Mode. Says Lukas Oppermann, our staff systems designer, “With Code Connect, we can actually move the design and the code a little bit further apart again. We can concentrate on creating the best UX for the designers working in Figma with design libraries and, on the code side, we can have the best developer experience.”
To that end, Code Connect allows us to bypass much of our Preset annotations, as well as the downsides of some of our other experiments. It does this by adding key accessibility details directly into the code that developers can export from Figma.
GitHub’s Octicons are used in many of our Primer components. They are decorative by default, but they sometimes need alt text or aria-label attributes depending on how they’re used. In the IconButton component, that button uses an Octicon and needs an accessible name to describe its function.
When using a basic annotation kit, this may mean adding stamps for a Button and Decorative Image as well as a note in the margins that specifies what the aria-label should be. When using Preset annotations, there are fewer things to add to the canvas and the annotation process takes less time.
With Code Connect set up, Lukas added a hidden layer in the IconButton Figma component. It has a text property for aria-label which lets designers add the value directly from the component properties panel. No annotations needed. The hidden layer doesn’t disrupt any of the visuals, and the aria-label property gets exported directly with the rest of the component’s code.
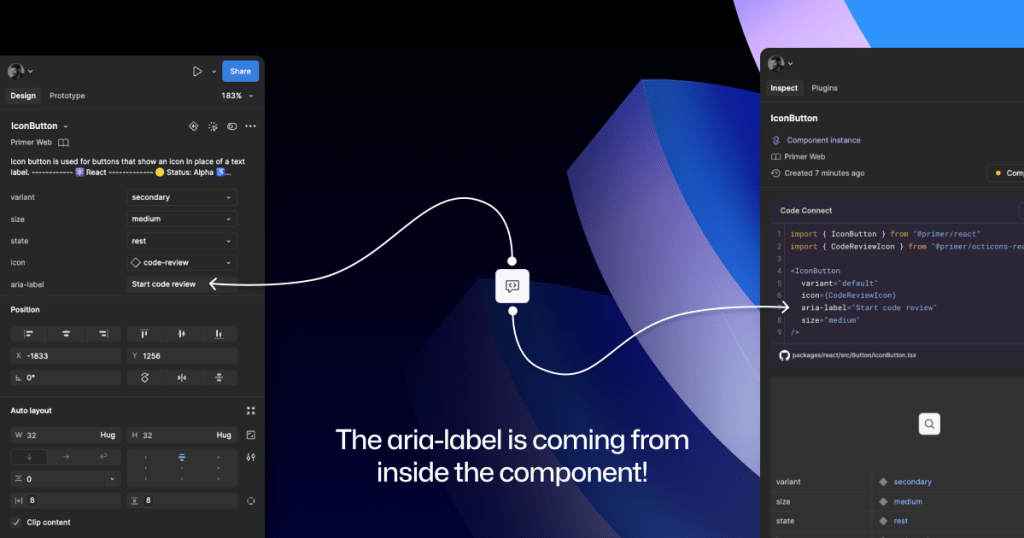
It takes time to set up Code Connect with each of your design system components. Here are a few tips to help:
We’ve made the GitHub Annotation Toolkit open source, so you can see first-hand how we’ve implemented our Primer A11y Preset annotations and visual regression tests. Check it out and start annotating today!
Accessibility annotation kits are a great resource, provided they’re used responsibly. Eric Bailey, one of the contributors to our forthcoming GitHub Annotation Toolkit, has written extensively about how annotations can highlight and amplify deeply structural issues when you’re building digital products.
The post Design system annotations, part 2: Advanced methods of annotating components appeared first on The GitHub Blog.
Post Syndicated from Jan Maarten original https://github.blog/engineering/user-experience/design-system-annotations-part-1-how-accessibility-gets-left-out-of-components/
When it comes to design systems, every organization tends to be at a different place in their accessibility journey. Some have put a great deal of work into making their design system accessible while others have a long way to go before getting there. To help on this journey, many organizations rely on accessibility annotations to make sure there are no access barriers when a design is ready to be built.
However, it’s a common misconception (especially for organizations with mature design systems) that accessible components will result in accessible designs. While design systems are fantastic for scaling standards and consistency, they can’t prevent every issue with our designs or how we build them. Access barriers can still slip through the cracks and make it into production.
This is the root of the problem our Accessibility Design team set out to solve.
In this two-part series, we’ll show you exactly how accessible design system components can produce inaccessible designs. Then we’ll demonstrate our solution: integrating annotations with our Primer components. This allows us to spend less time annotating, increases design system adoption, and reaches teams who may not have accessibility support. And in our next post, we’ll walk you through how you can do the same for your own components.
Let’s dig in.
Annotations are notes included in design projects that help make the unseen explicit by conveying design intent that isn’t shown visually. They improve the usability of digital experiences by providing a holistic picture for developers of how an experience should function. Integrating annotations into our design process helps our teams work better together by closing communication gaps and preventing quality issues, accessibility audit issues, and expensive re-work.
Some of the questions annotations help us answer include:
Our answers to questions like this—or the lack thereof—can make or break the experience of the web for a lot of people, especially users with disabilities. Some annotation tools are built specifically to help with this by guiding designers to include key details about web standards, platform functionality, and accessibility (a11y).
Most public annotation kits are well suited for teams who are creating new design system components, teams who aren’t already using a design system, or teams who don’t have specialized accessibility knowledge. They usually help annotate things like:
One of our top priorities is to meet our colleagues where they’re at. We wanted all our designers to be able to use annotations out of the box because we believe they shouldn’t need to be a certified accessibility specialist in order to get things built in an accessible way.
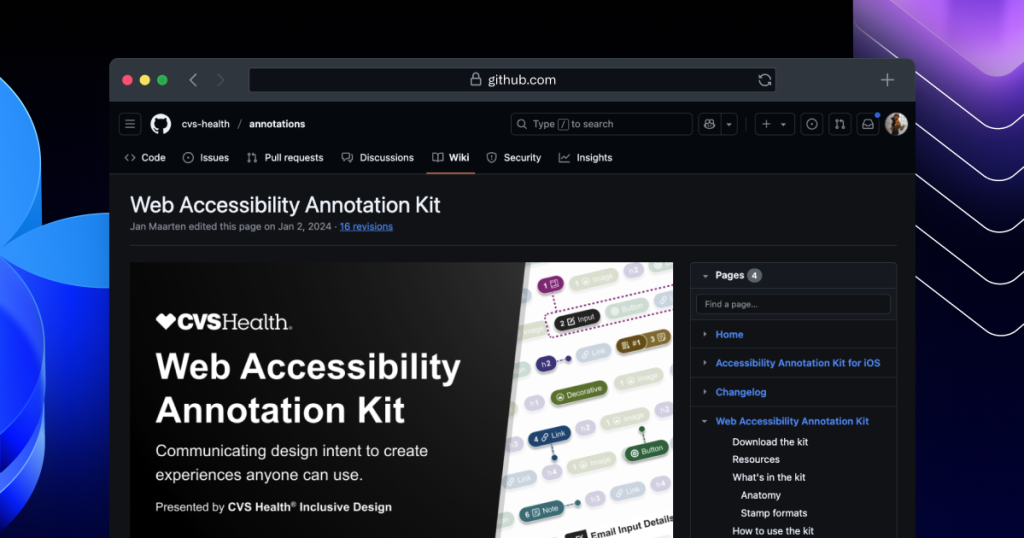
To this end, last year we began creating an internal Figma library—the GitHub Annotation Toolkit—which is now open source! Our toolkit builds on the legacy of the former Inclusive Design team at CVS Health. Their two open source annotation kits help make documentation that’s easy to create and consume, and are among the most widely used annotation libraries in the Figma Community.
While they add clarity, annotations can also add overhead. If teams are only relying on specialists to interpret designs and technical specifications for developers, the hand-off process can take longer than it needs to. To create our annotation toolkit, we rebuilt its predecessor from the ground up to avoid that overhead, making extensive improvements and adding inline documentation to make it more intuitive and helpful for all of our designers—not just accessibility specialists.
Design systems can also help reduce that overhead. When you audit your design systems for accessibility, there’s less need for specialist attention on every product feature, since you’re using annotations to add technical semantics and specialist knowledge into every component. This means that designers and developers only need to adhere to the usage guidelines consistently, right?
Unfortunately, it’s not that simple.
While design systems can help drive more accessible design at scale, they are constantly evolving and the work on them is never done. The accessibility of any component isn’t binary. Some may have a few severe issues that create access barriers, such as being inoperable with a keyboard or missing alt text. Others may have a few trivial issues, such as generic control labels.
Most of the time, it will be a misnomer to claim that your design system is “fully accessible.” There’s always more work to do—it’s just a question of how much. The Web Content Accessibility Guidelines (WCAG) are a great starting point, but their “Success Criteria” isn’t tailored for the unique context that is your website or product or audience.
While the WCAG should be used as a foundation to build from, it’s important to understand that it can’t capture every nuance of disabled users’ needs because your users’ needs are not every user’s needs. It would be very easy to believe that your design system is “fully accessible” if you never look past WCAG to talk to your users. If Primer has accessible components, it’s because we feel that direct participation and input from daily assistive technology users is the most important aspect of our work. Testing plans with real users—with and without disabilities—is where you really find what matters most.
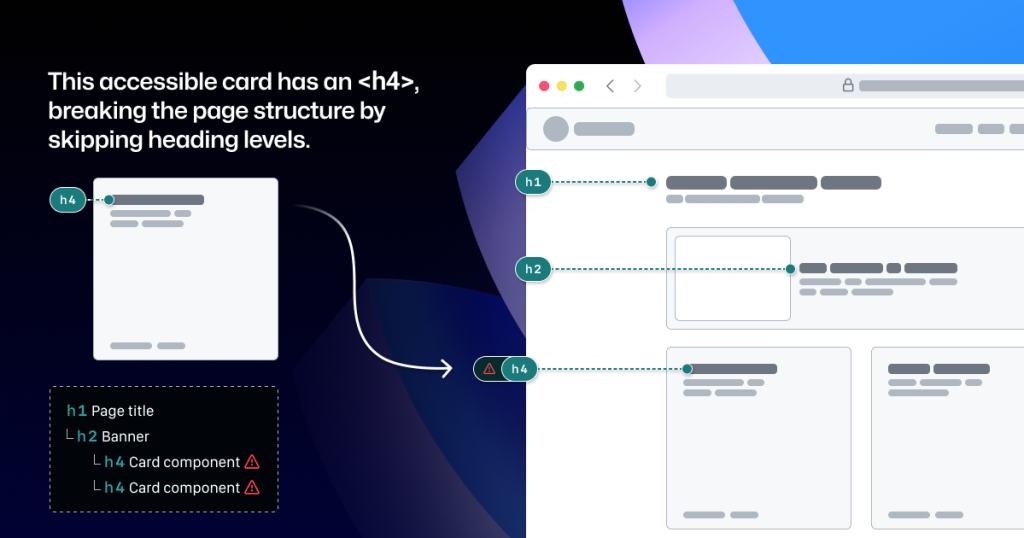
Arranging a series of accessible components on a page does not automatically create an accurate and informative heading hierarchy. There’s a good chance that without additional documentation, the heading structure won’t make sense visually—nor as a medium for navigating with assistive technology.
It’s great when accessible components are flexible and responsive, but what about when they’re placed in a layout that the component guidance doesn’t account for? Do they adapt to different zoom levels, viewport sizes, and screen orientations? Do they lose any functionality or context when any of those things change?
Component usage is contextual. You can add an image or icon to your design, but the design system docs can’t write descriptive text for you. You can use the same image in multiple places, but the image description may need to change depending on context.
Similarly, forms built using the same input components may do different things and require different error validation messages. It’s no wonder that adopting design system components doesn’t get rid of all audit issues.
Annotation kits don’t include components for specific design systems because almost every organization is using their own. When annotation kits are adopted, teams often add ways to label their design system components.
This labeling lets developers know they can use something that’s already been built, and that they don’t need to build something from scratch. It also helps identify any design system components that get ‘detached’ in Figma. And it reduces the number of things that need to be annotated.
Let’s look at an example:
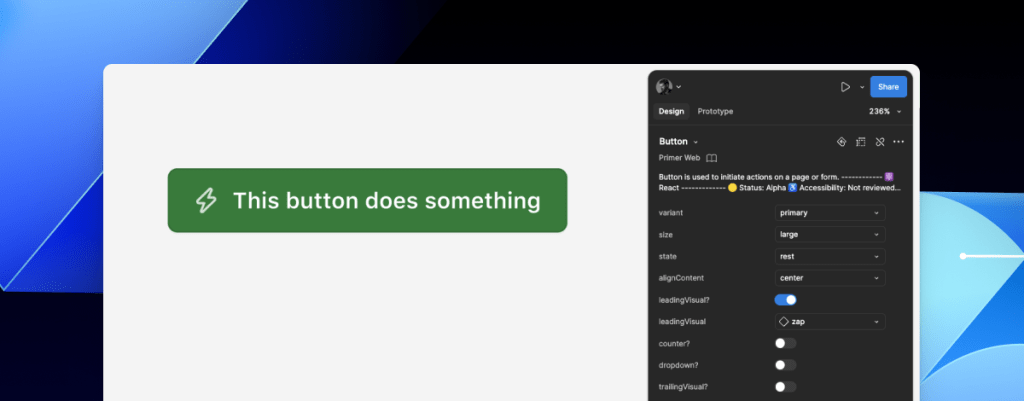
If we’re using this Primer Button component from the Primer Web Figma library, there are a few important things that we won’t know just by looking at the design or the component properties:
<LinkButton> React component instead of <Button>.It’s risky to leave questions like this unanswered, hoping someone notices and guesses the correct answer.
When creating new components, a set of detailed annotations can be a huge factor in how robust and accessible they are. Once the component is built, design teams can start to add instances of that component in their designs. When those designs are ready to be annotated, those new components shouldn’t need to be annotated again. In most cases, it would be redundant and unnecessary—but not in every case.
There are some important details in many Primer components that may change from one instance to another. If we use the CVS Health annotation kit out of the box, we should be able to capture those variations, but we wouldn’t be able to avoid those redundant and unnecessary annotations. As we built our own annotation toolkit, we built a set of annotations for each Primer component to do both of those things at once.
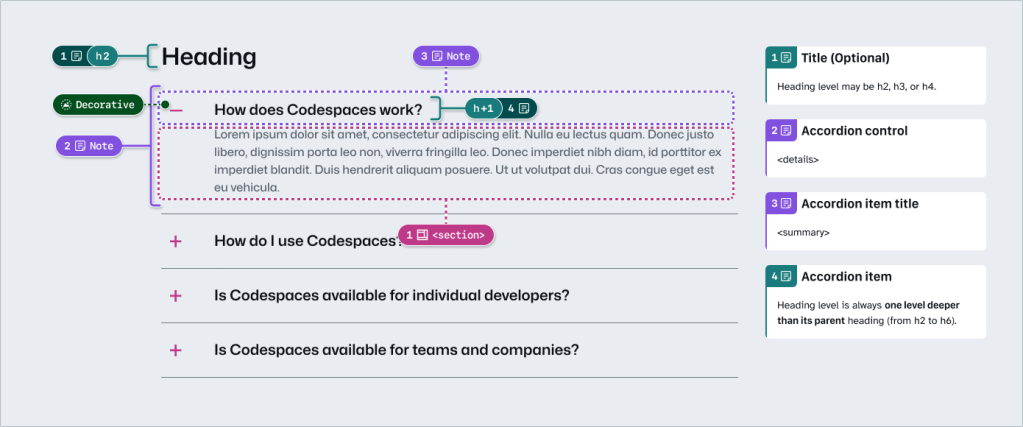
This accordion component has been thoroughly annotated so that an engineer has everything they need to build it the first time. These include heading levels, semantics for <detail> and <summary> elements, landmarks, and decorative icons. All of this is built into the component so we don’t need to annotate most of this when adding the accordion to our new designs.
However, there are two important things we need to annotate, as they can change from one instance to another:
If we don’t specify these things, we’re leaving it to chance that the page’s heading structure will break or that the experience will be confusing for people to understand and navigate the page. The risks may be low for a single button or basic accordion, but they grow with pattern complexity, component nesting, interaction states, duplicated instances, and so on.
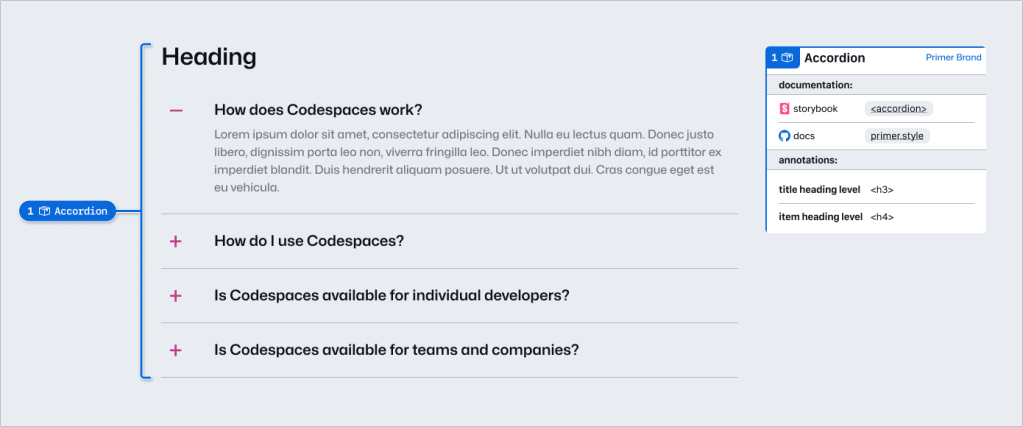
Instead of annotating what’s already built into the component or leaving these details to chance, we can add two quick annotations. One Stamp to point to the component, and one Details annotation where we fill in some blanks to make the heading levels clear.
Because the prompts for specific component details are pre-set in the annotation, we call them Preset annotations.
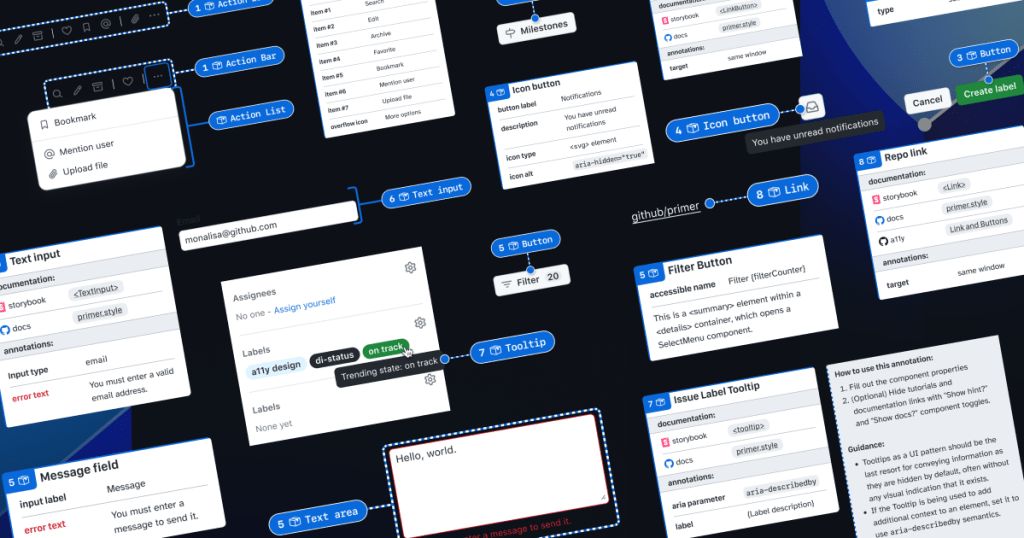
With this proof of concept, we selected ten frequently used Primer components for the same treatment and built a new set of Preset annotations to document these easily missed accessibility details—our Primer A11y Presets.
Those Primer components tend to contribute to more accessibility audit issues when key details are missing on implementation. Issues for these components relate to things like lack of proper labels, error validation messages, or missing HTML or ARIA attributes.
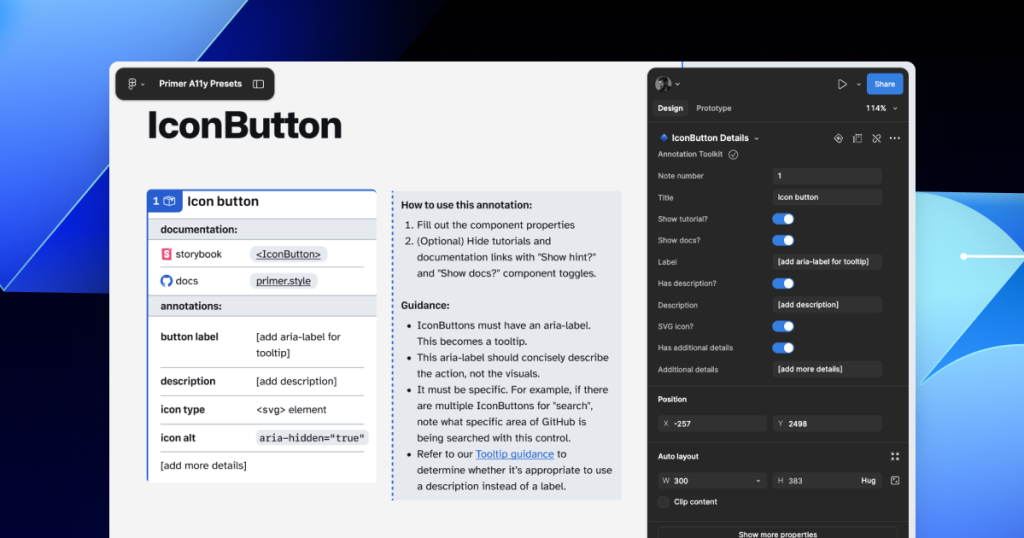
Each of our Preset annotations is linked to component docs and Storybook demos. This will hopefully help developers get straight to the technical info they need without designers having to find and add links manually. We also included guidance for how to fill out each Preset, as well as how to use the component in an accessible way. This helps designers get support inline without leaving their Figma canvas.
Button components in Google’s Material Design and Shopify’s Polaris, IBM’s Carbon, or our Primer design system are all very different from one another. Because Preset annotations are based on specific components, they only work if you’re also using the design system they’re made for.
In part 2 of this series, we’ll walk you through how you can build your own set of Preset annotations for your design system, as well as some different ways to document important accessibility details before development starts.
If you’re more of a visual learner, you can watch Alexis Lucio explore Preset annotations during GitHub’s Dev Community Event to kick off Figma’s Config 2024.
Get the guide to GitHub’s Annotation Toolkit >
The post Design system annotations, part 1: How accessibility gets left out of components appeared first on The GitHub Blog.
Post Syndicated from corbet original https://lwn.net/Articles/1017720/
Those of us who have spent our lives playing with computers naturally see
the appeal of deploying them though the home for both data acquisition and
automation. But many of us who have watched the evolution of the
technology industry are increasingly unwilling to entrust critical
household functions to cloud-based servers run by companies that may not
have our best interests at heart. The Apache-licensed Home Assistant project offers a
welcome alternative: locally controlled automation with free software.
This two-part series covers roughly a year of Home Assistant use, starting
with a set of overall observations about the project.
Post Syndicated from Muthu Pitchaimani original https://aws.amazon.com/blogs/big-data/introducing-amazon-q-developer-in-amazon-opensearch-service/
Customers use Amazon OpenSearch Service to store their operational and telemetry signal data. They use this data to monitor the health of their applications and infrastructure, so that when a production issue happens, they can identify the cause quickly. The sheer volume and variety in data often makes this process complex and time-consuming, leading to high mean time to repair (MTTR).
To expedite this process and transform how developers interact with their operational data, today we introduced Amazon Q Developer support in OpenSearch Service. With this AI-assisted analysis, both new and experienced users can navigate complex operational data without training, analyze issues, and gain insights in a fraction of the time. Amazon Q Developer in OpenSearch Service reduces MTTR by integrating generative AI capabilities directly into OpenSearch workflows so you can improve your operational capabilities without scaling your specialist teams. You can now investigate issues, analyze patterns, and create visualizations using in-context assistance and natural language interactions.
In this post, we share how to get started using Amazon Q Developer in OpenSearch Service and explore some of its key capabilities.
Setting up observability signal data for analysis involves many steps, including instrumenting application code, creating complex queries, creating visualizations and dashboards, configuring appropriate alerts, and often machine learning-based anomaly detectors. This requires significant upfront investment in time, resources, and expertise. Amazon Q Developer in OpenSearch Service introduces natural language exploration and generative AI-based tooling throughout OpenSearch, simplifying both initial setup and ongoing operations. Customers already use natural language based query generation to aid constructing OpenSearch queries; Amazon Q in OpenSearch Service brings in the following additional capabilities:
Let’s explore each of these capabilities in detail to understand how they help transform traditional observability workflows and streamline the process of data analysis in the centralized OpenSearch UI.
Natural language-based visualizations with Amazon Q for OpenSearch Service fundamentally transform how users create and interact with data visualizations. You don’t need to know specialized query languages currently used in OpenSearch Service dashboards to create complex visualizations. For example, you can input requests like “show me a chart of error rates over the last 24 hours broken down by region” or “create a chart showing the distribution of HTTP response codes,” and Amazon Q will automatically generate the appropriate visualization.
To get started with this feature, choose Visualizations in the navigation pane and choose Create New Visualization. The OpenSearch UI has many built-in visualization types. To use the new natural language-based visualization, choose Natural language previewer.

This will bring will bring a new visualization page with a text field where you can enter a query in natural language.

Choose an index pattern on the dropdown menu (openSearch_dashabords_sample_data_logs in this case). Amazon Q interprets your intent, identifies relevant fields, automatically selects the most appropriate visualization type, and applies proper formatting and styling. Amazon Q can also understand multiple dimensions in the data, various aggregation methods, and different time ranges.
Now you’re ready to build your visualization in natural language. For example, for the query “Show me number of distinct IP addresses per day in logs,” we see the following visualization.

Amazon Q generates the visualization as per the instruction. The UI also gives the option to update any component of data, transformations, marks and encoding for the visualization. This window also shows the generated query for the data in PPL. For this example Amazon Q generated this query
source=opensearch_dashboards_sample_data_logs*| stats DISTINCT_COUNT(`ip`) as unique_ips by span(`timestamp`, 1d)
Using this interactive UI, you can customize different aspects of the visualization if needed. For example, if you prefer to use a bar type instead of what Amazon Q generated, you can change the mark type to bar and choose Update, or choose Edit visual and specify new set of instructions for this visualization (for example, “change to bar chart”).


After you have adjusted the visualization to your satisfaction, you can save it to retrieve later. What makes this feature particularly powerful is its ability to understand context and suggest refinements by updating your prompts—if the initial visualization doesn’t quite meet your needs, you can describe the desired changes using the Edit visual option.
Amazon Q acts as an interpretation layer that processes query results into a condensed, structured summary. It can also identify patterns and other significant trends in the data by observing both the qualitative and quantitative characteristics of the results. The system’s effectiveness largely depends on the quality of the underlying data, the specificity of the initial query, and the characteristics of query generation, among other things. Amazon Q also samples the result set for generating this result summarization. These summaries are a good starting point for analysis. For example, for the same query we used last time (“Show me number of distinct IP addresses per day in logs”), Amazon Q will analyze the result set in the Amazon Q Summary section.

As it responds to your query, Amazon Q can make suggestions for creating an anomaly detector based upon your data source selected. It does that by recommending relevant fields of your operational data patterns with a one-click confirmation to create the detector.

Features are aggregation of fields or scripts that determines what constitutes an anomaly. Identifying features and creating a detector to use those features typically requires deep technical understanding of spikes, dips, thresholds and inter-relationship between multiple features. Amazon Q helps reduce this traditional complexity when creating a detector by automatically identifying these features as shown below. You can also make changes to the suggested detector to fine-tune to your needs.

Choosing the Amazon Q icon next to alerts generates a concise summary that includes alert definitions, the specific conditions that led to its activation, and an overview of the current state of the monitored system or service.

The insights component provides a higher-level insight into the alerts by highlighting the significance of these alerts, typical conditions that results in these alerts, along with recommendations to help mitigate the conditions of these alerts. To get an insight for an alert, you need to provide additional information about your environment with a knowledge base. For instructions on generating insights, see View alert summaries and insights.
By choosing View in Discover, you can dive deeper into the data behind the alert with a single click, facilitating a seamless transition from alert notification to detailed investigation in Discover. The insights and summarization feature helps accelerate your investigations; care must be taken to identify the root cause of the problem because it will likely require human intervention.
Amazon Q Developer in OpenSearch Service not only simplifies operations, but also serves as an intelligent assistant for implementing OpenSearch Service best practices. Amazon Q for OpenSearch Service has been trained on the developer and product documentation, so that it can suggest best practices for operating OpenSearch Service domains, Amazon OpenSearch Serverless collections, and configurations based on your needs for capacity and compliance. To get started, choose the Amazon Q icon on the top right. The assistant maintains the history of the conversations. For the guidance it provides, the assistant cites its sources, providing a helpful link to the documentation. It also provides suggestions to continue the conversation. You can ask questions regarding data access policies, index state managements, sizing leader nodes, or other best practices or operational questions about OpenSearch.

OpenSearch UI is available for use without other associated costs. Amazon Q Developer for OpenSearch Service is available within OpenSearch UI in the following AWS Regions: US East (N. Virginia), US West (Oregon), Asia Pacific (Mumbai), Asia Pacific (Sydney), Asia Pacific (Tokyo), Canada (Central), Europe (Frankfurt), Europe (London), Europe (Paris), and South America (São Paulo). Because it’s included at the Free Tier, there is no associated cost.
Amazon Q Developer support in OpenSearch Service brings in AI-powered capabilities to help alleviate the traditional barriers that teams face when setting up, monitoring, and troubleshooting their applications. This allows teams of all experience levels to harness the full power of OpenSearch.
We’re excited to see how you will use these new capabilities to transform your observability workflows and drive better operational outcomes. To get started with Amazon Q Developer in OpenSearch Service, refer to Amazon Q Developer is now generally available in Amazon OpenSearch Service
 Muthu Pitchaimani is a Search Specialist with Amazon OpenSearch Service. He builds large-scale search applications and solutions. Muthu is interested in the topics of networking and security, and is based out of Austin, Texas.
 Dagney Braun is a Senior Manager of Product on the Amazon Web Services OpenSearch team. She is passionate about improving the ease of use of OpenSearch and expanding the tools available to better support all customer use cases.
Post Syndicated from Sotaro Hikita original https://aws.amazon.com/blogs/big-data/accelerate-lightweight-analytics-using-pyiceberg-with-aws-lambda-and-an-aws-glue-iceberg-rest-endpoint/
For modern organizations built on data insights, effective data management is crucial for powering advanced analytics and machine learning (ML) activities. As data use cases become more complex, data engineering teams require sophisticated tooling to handle versioning, increasing data volumes, and schema changes across multiple data sources and applications.
Apache Iceberg has emerged as a popular choice for data lakes, offering ACID (Atomicity, Consistency, Isolation, Durability) transactions, schema evolution, and time travel capabilities. Iceberg tables can be accessed from various distributed data processing frameworks like Apache Spark and Trino, making it a flexible solution for diverse data processing needs. Among the available tools for working with Iceberg, PyIceberg stands out as a Python implementation that enables table access and management without requiring distributed compute resources.
In this post, we demonstrate how PyIceberg, integrated with the AWS Glue Data Catalog and AWS Lambda, provides a lightweight approach to harness Iceberg’s powerful features through intuitive Python interfaces. We show how this integration enables teams to start working with Iceberg tables with minimal setup and infrastructure dependencies.
One of PyIceberg’s primary advantages is its lightweight nature. Without requiring distributed computing frameworks, teams can perform table operations directly from Python applications, making it suitable for small to medium-scale data exploration and analysis with minimal learning curve. In addition, PyIceberg is integrated with Python data analysis libraries like Pandas and Polars, so data users can use their existing skills and workflows.
When using PyIceberg with the Data Catalog and Amazon Simple Storage Service (Amazon S3), data teams can store and manage their tables in a completely serverless environment. This means data teams can focus on analysis and insights rather than infrastructure management.
Furthermore, Iceberg tables managed through PyIceberg are compatible with AWS data analytics services. Although PyIceberg operates on a single node and has performance limitations with large data volumes, the same tables can be efficiently processed at scale using services such as Amazon Athena and AWS Glue. This enables teams to use PyIceberg for rapid development and testing, then transition to production workloads with larger-scale processing engines—while maintaining consistency in their data management approach.
The following are common scenarios where PyIceberg can be particularly useful:
In this section, we explore a practical example of using PyIceberg for data processing and analysis using NYC yellow taxi trip data. To simulate an event-driven data processing scenario, we use Lambda to insert sample data into an Iceberg table, representing how real-time taxi trip records might be processed. This example will demonstrate how PyIceberg can streamline workflows by combining efficient data ingestion with flexible analysis capabilities.
Imagine your team faces several requirements:
To address these requirements, we implement a solution that combines Lambda for data processing with Jupyter notebooks for analysis, both powered by PyIceberg. This approach provides a lightweight yet robust architecture that maintains data consistency while enabling flexible analysis workflows. At the end of the walkthrough, we also query this data using Athena to demonstrate compatibility with multiple Iceberg-supporting tools and show how the architecture can scale.
We walk through the following high-level steps:
The following diagram illustrates the architecture.

When implementing this architecture, it’s important to note that Lambda functions can have multiple concurrent invocations when triggered by events. This concurrent invocation might lead to transaction conflicts when writing to Iceberg tables. To handle this, you should implement an appropriate retry mechanism and carefully manage concurrency levels. If you’re using Amazon SQS as an event source, you can control concurrent invocations through the SQS event source’s maximum concurrency setting.
The following prerequisites are necessary for this use case:
You can use the provided CloudFormation template to set up the following resources:
Complete the following steps to deploy the resources:

pyiceberg_lambda_blog_database is set by default. You can also change the default value. If you change the database name, remember to replace pyiceberg_lambda_blog_database with your chosen name in all subsequent steps. Then, choose Next.Let’s build a Lambda function to process incoming records using PyIceberg. This function creates an Iceberg table called nyc_yellow_table in the database pyiceberg_lambda_blog_database in the Data Catalog if it doesn’t exist. It then generates sample NYC taxi trip data to simulate incoming records and inserts it into nyc_yellow_table.
Although we invoke this function manually in this example, in real-world scenarios, this Lambda function would be triggered by actual events, such as messages from Amazon SQS. When implementing real-world use cases, the function code must be modified to receive the event data and process it based on the requirements.
We deploy the function using container images as the deployment package. To create a Lambda function from a container image, build your image on CloudShell and push it to an ECR repository. Complete the following steps:
lambda_function.py.This script performs the following tasks:
Let’s break down the essential parts of this Lambda function:
Schemavendorid and tpep_pickup_datetime using PartitionSpectpep_pickup_datetime for daily record managementtpep_pickup_datetime and tpep_dropoff_datetimeWhen applying the day transform to timestamp columns, Iceberg automatically handles date-based partitioning hierarchically. This means a single day transform enables partition pruning at the year, month, and day levels without requiring explicit transforms for each level. For more details about Iceberg partitioning, see Partitioning.
Dockerfile. It defines the container image for your function code.requirements.txt. It defines the Python packages required for your function code.At this point, your working directory should contain the following three files:
<account_id> with your AWS account ID:At this point, you have deployed and run the Lambda function. The function creates the nyc_yellow_table Iceberg table in the pyiceberg_lambda_blog_database database. It also generates and inserts sample data into this table. We will explore the records in the table in later steps.
For more detailed information about building Lambda functions with containers, see Create a Lambda function using a container image.
In this section, we demonstrate how to access and analyze the data stored in Iceberg tables registered in the Data Catalog. Using a Jupyter notebook with PyIceberg, we access the taxi trip data created by our Lambda function and examine different snapshots as new records arrive. We also tag specific snapshots to retain important ones, and create new tables for further analysis.
Complete the following steps to open the notebook with Jupyter on the SageMaker AI notebook instance:


pyiceberg_notebook.ipynb.
From this point forward, you will work through the notebook by running cells in order.
You can access the Iceberg table using PyIceberg. The following code connects to the AWS Glue Iceberg REST endpoint and loads the nyc_yellow_table table on the pyiceberg_lambda_blog_database database:
You can query full data from the Iceberg table as an Apache Arrow table and convert it to a Pandas DataFrame.

One of the important features of Iceberg is snapshot-based version control. Snapshots are automatically created whenever data changes occur in the table. You can retrieve data from a specific snapshot, as shown in the following example.

You can compare the current data with historical data from any point in time based on snapshots. In this case, you are comparing the differences in data distribution between the latest table and a snapshot table:

You can tag specific snapshots with an arbitrary name and query specific snapshots with that name later. This is useful when managing snapshots of important events.

In this example, you query a snapshot specifying the tag checkpointTag. Here, you are using the polars to create a new DataFrame by adding a new column called trip_duration based on existing columns tpep_dropoff_datetime and tpep_pickup_datetime columns:

Create a new table from the processed DataFrame with the trip_duration column. This step illustrates how to prepare data for potential future analysis. You can explicitly specify the snapshot of the data that the processed data is referring to by using a tag, even if the underlying table has been changed.
Let’s query this new table made from processed data with Athena to demonstrate the Iceberg table’s interoperability.
pyiceberg_lambda_blog_database.processed_nyc_yellow_table created from the notebook in the previous section:
By completing these steps, you’ve built a serverless data processing solution using PyIceberg with Lambda and an AWS Glue Iceberg REST endpoint. You’ve worked with PyIceberg to manage and analyze data using Python, including snapshot management and table operations. In addition, you ran the query using another engine, Athena, which shows the compatibility of the Iceberg table.
To clean up the resources used in this post, complete the following steps:
pyiceberg-lambda-repository and delete all images contained in the repository.pyiceberg_blog.pyiceberg-lambda-blog-<ACCOUNT_ID>-<REGION>, which you created using the CloudFormation template, and empty the bucket.pyiceberg-lambda-blog-stack.pyiceberg-lambda-function that you created using the Docker image.In this post, we demonstrated how using PyIceberg with the AWS Glue Data Catalog enables efficient, lightweight data workflows while maintaining robust data management capabilities. We showcased how teams can use Iceberg’s powerful features with minimal setup and infrastructure dependencies. This approach allows organizations to start working with Iceberg tables quickly, without the complexity of setting up and managing distributed computing resources.
This is particularly valuable for organizations looking to adopt Iceberg’s capabilities with a low barrier to entry. The lightweight nature of PyIceberg allows teams to begin working with Iceberg tables immediately, using familiar tools and requiring minimal additional learning. As data needs grow, the same Iceberg tables can be seamlessly accessed by AWS analytics services like Athena and AWS Glue, providing a clear path for future scalability.
To learn more about PyIceberg and AWS analytics services, we encourage you to explore the PyIceberg documentation and What is Apache Iceberg?
 Sotaro Hikita is a Specialist Solutions Architect focused on analytics with AWS, working with big data technologies and open source software. Outside of work, he always seeks out good food and has recently become passionate about pizza.
 Shuhei Fukami is a Specialist Solutions Architect focused on Analytics with AWS. He likes cooking in his spare time and has become obsessed with making pizza these days.
Post Syndicated from jzb original https://lwn.net/Articles/1020668/
Lance Albertson writes that the
Oregon State University Open Source Lab has been funded for the next
year, following his announcement in April
that the future of OSL was in jeopardy. OSL is now focusing on
becoming self-sustainable long term.
The recent support was amazing for our immediate team needs. But
for the OSL to thrive long-term, we need a sustainable financial
foundation. This is crucial, as the university expects units like ours
to become self-sufficient beyond this current year.So, our big focus this next year is locking in ongoing support –
think annualized pledges, different kinds of regular income, and other
recurring help. This is vital, especially with potential new data
center costs and hardware needs. Getting this right means we can stop
worrying about short-term funding and plan for the future: investing
in our tech and people, growing our awesome student programs, and
serving the FOSS community. We’re looking for partners, big and small,
who get why foundational open source infrastructure matters and want
to help us build this sustainable future together.